RESEARCH ARTICLE Cardiorespiratory dynamics measured from continuous ECG monitoring improves detection of deterioration in acute care patients: A retrospective cohort study Travis J. Moss 1,2 *, Matthew T. Clark 2,3 , James Forrest Calland 2,4 , Kyle B. Enfield 2,5 , John D. Voss 6 , Douglas E. Lake 1,2,7 , J. Randall Moorman 1,2,8,9 1 Department of Medicine, Division of Cardiovascular Medicine, University of Virginia School of Medicine, Charlottesville, Virginia, United States of America, 2 Center for Advanced Medical Analytics, University of Virginia, Charlottesville, Virginia, United States of America, 3 Advanced Medical Predictive Devices, Diagnostics, and Displays, Inc., Charlottesville, Virginia, United States of America, 4 Department of Surgery, Division of Acute Care and Trauma Surgery, University of Virginia School of Medicine, Charlottesville, Virginia, United States of America, 5 Department of Medicine, Division of Pulmonary and Critical Care, University of Virginia School of Medicine, Charlottesville, Virginia, United States of America, 6 Department of Medicine, University of Virginia, Charlottesville, Virginia, United States of America, 7 Department of Statistics, University of Virginia, Charlottesville, Virginia, United States of America, 8 Department of Biomedical Engineering, University of Virginia, Charlottesville, Virginia, United States of America, 9 Department of Molecular Physiology, University of Virginia, Charlottesville, Virginia, United States of America * [email protected] Abstract Background Charted vital signs and laboratory results represent intermittent samples of a patient’s dynamic physiologic state and have been used to calculate early warning scores to identify patients at risk of clinical deterioration. We hypothesized that the addition of cardiorespira- tory dynamics measured from continuous electrocardiography (ECG) monitoring to inter- mittently sampled data improves the predictive validity of models trained to detect clinical deterioration prior to intensive care unit (ICU) transfer or unanticipated death. Methods and findings We analyzed 63 patient-years of ECG data from 8,105 acute care patient admissions at a tertiary care academic medical center. We developed models to predict deterioration result- ing in ICU transfer or unanticipated death within the next 24 hours using either vital signs, laboratory results, or cardiorespiratory dynamics from continuous ECG monitoring and also evaluated models using all available data sources. We calculated the predictive validity (C- statistic), the net reclassification improvement, and the probability of achieving the differ- ence in likelihood ratio χ 2 for the additional degrees of freedom. The primary outcome occurred 755 times in 586 admissions (7%). We analyzed 395 clinical deteriorations with continuous ECG data in the 24 hours prior to an event. Using only continuous ECG mea- sures resulted in a C-statistic of 0.65, similar to models using only laboratory results and vital signs (0.63 and 0.69 respectively). Addition of continuous ECG measures to models PLOS ONE | https://doi.org/10.1371/journal.pone.0181448 August 3, 2017 1 / 16 a1111111111 a1111111111 a1111111111 a1111111111 a1111111111 OPEN ACCESS Citation: Moss TJ, Clark MT, Calland JF, Enfield KB, Voss JD, Lake DE, et al. (2017) Cardiorespiratory dynamics measured from continuous ECG monitoring improves detection of deterioration in acute care patients: A retrospective cohort study. PLoS ONE 12(8): e0181448. https:// doi.org/10.1371/journal.pone.0181448 Editor: Chiara Lazzeri, Azienda Ospedaliero Universitaria Careggi, ITALY Received: March 30, 2017 Accepted: July 1, 2017 Published: August 3, 2017 Copyright: © 2017 Moss et al. This is an open access article distributed under the terms of the Creative Commons Attribution License, which permits unrestricted use, distribution, and reproduction in any medium, provided the original author and source are credited. Data Availability Statement: Data are available from the University of Virginia Dataverse (https:// dataverse.lib.virginia.edu/dataset.xhtml? persistentId=doi:10.18130/V3/MKY17T). Funding: The study was sponsored by the University of Virginia Health System, NIH GO Grant 1RC2HD064488, and the Wallace H. Coulter Foundation. The sponsors had no role in the design and conduct of the study; collection, management, analysis, and interpretation of the data; preparation,

Welcome message from author
This document is posted to help you gain knowledge. Please leave a comment to let me know what you think about it! Share it to your friends and learn new things together.
Transcript
RESEARCH ARTICLE
Cardiorespiratory dynamics measured from
continuous ECG monitoring improves
detection of deterioration in acute care
patients: A retrospective cohort study
Travis J. Moss1,2*, Matthew T. Clark2,3, James Forrest Calland2,4, Kyle B. Enfield2,5, John
D. Voss6, Douglas E. Lake1,2,7, J. Randall Moorman1,2,8,9
1 Department of Medicine, Division of Cardiovascular Medicine, University of Virginia School of Medicine,
Charlottesville, Virginia, United States of America, 2 Center for Advanced Medical Analytics, University of
Virginia, Charlottesville, Virginia, United States of America, 3 Advanced Medical Predictive Devices,
Diagnostics, and Displays, Inc., Charlottesville, Virginia, United States of America, 4 Department of Surgery,
Division of Acute Care and Trauma Surgery, University of Virginia School of Medicine, Charlottesville,
Virginia, United States of America, 5 Department of Medicine, Division of Pulmonary and Critical Care,
University of Virginia School of Medicine, Charlottesville, Virginia, United States of America, 6 Department of
Medicine, University of Virginia, Charlottesville, Virginia, United States of America, 7 Department of Statistics,
University of Virginia, Charlottesville, Virginia, United States of America, 8 Department of Biomedical
Engineering, University of Virginia, Charlottesville, Virginia, United States of America, 9 Department of
Molecular Physiology, University of Virginia, Charlottesville, Virginia, United States of America
Abstract
Background
Charted vital signs and laboratory results represent intermittent samples of a patient’s
dynamic physiologic state and have been used to calculate early warning scores to identify
patients at risk of clinical deterioration. We hypothesized that the addition of cardiorespira-
tory dynamics measured from continuous electrocardiography (ECG) monitoring to inter-
mittently sampled data improves the predictive validity of models trained to detect clinical
deterioration prior to intensive care unit (ICU) transfer or unanticipated death.
Methods and findings
We analyzed 63 patient-years of ECG data from 8,105 acute care patient admissions at a
tertiary care academic medical center. We developed models to predict deterioration result-
ing in ICU transfer or unanticipated death within the next 24 hours using either vital signs,
laboratory results, or cardiorespiratory dynamics from continuous ECG monitoring and also
evaluated models using all available data sources. We calculated the predictive validity (C-
statistic), the net reclassification improvement, and the probability of achieving the differ-
ence in likelihood ratio χ2 for the additional degrees of freedom. The primary outcome
occurred 755 times in 586 admissions (7%). We analyzed 395 clinical deteriorations with
continuous ECG data in the 24 hours prior to an event. Using only continuous ECG mea-
sures resulted in a C-statistic of 0.65, similar to models using only laboratory results and
vital signs (0.63 and 0.69 respectively). Addition of continuous ECG measures to models
PLOS ONE | https://doi.org/10.1371/journal.pone.0181448 August 3, 2017 1 / 16
a1111111111
a1111111111
a1111111111
a1111111111
a1111111111
OPENACCESS
Citation: Moss TJ, Clark MT, Calland JF, Enfield
KB, Voss JD, Lake DE, et al. (2017)
Cardiorespiratory dynamics measured from
continuous ECG monitoring improves detection of
deterioration in acute care patients: A retrospective
cohort study. PLoS ONE 12(8): e0181448. https://
doi.org/10.1371/journal.pone.0181448
Editor: Chiara Lazzeri, Azienda Ospedaliero
Universitaria Careggi, ITALY
Received: March 30, 2017
Accepted: July 1, 2017
Published: August 3, 2017
Copyright: © 2017 Moss et al. This is an open
access article distributed under the terms of the
Creative Commons Attribution License, which
permits unrestricted use, distribution, and
reproduction in any medium, provided the original
author and source are credited.
Data Availability Statement: Data are available
from the University of Virginia Dataverse (https://
dataverse.lib.virginia.edu/dataset.xhtml?
persistentId=doi:10.18130/V3/MKY17T).
Funding: The study was sponsored by the
University of Virginia Health System, NIH GO Grant
1RC2HD064488, and the Wallace H. Coulter
Foundation. The sponsors had no role in the design
and conduct of the study; collection, management,
analysis, and interpretation of the data; preparation,

using conventional measurements improved the C-statistic by 0.01 and 0.07; a model
integrating all data sources had a C-statistic of 0.73 with categorical net reclassification
improvement of 0.09 for a change of 1 decile in risk. The difference in likelihood ratio χ2
between integrated models with and without cardiorespiratory dynamics was 2158
(p value: <0.001).
Conclusions
Cardiorespiratory dynamics from continuous ECG monitoring detect clinical deterioration in
acute care patients and improve performance of conventional models that use only labora-
tory results and vital signs.
Introduction
When we admit acutely ill patients to the hospital, we make diagnoses and initiate therapies
with an aim to restore or improve health. We do not intend for patients to deteriorate and
thereby require transfer to an intensive care unit (ICU). Despite our intentions, escalation of
care requiring transfer to an ICU occurs at a rate of 4 to 5 for every 100 acute care admissions.
[1,2] Since mortality increases with every hour of delay in transferring critically ill patients to
the ICU[3,4] the acute care community has focused on identifying patients at risk of poten-
tially catastrophic conditions by developing and implementing Early Warning Scores (EWS)
from data contained in electronic medical records (EMR).[1,2,5–9] These EWS come in a vari-
ety of flavors, yet each comprises the same ingredients—intermittently measured vital signs
(VS) and laboratory results (LABS) stored in the EMR.
A fundamental feature of current EWS is that they are updated only as new laboratory test
results or vital sign measurements become available–this intermittent sampling may miss diag-
nostic patterns that would be revealed by sampling more often. Continuous physiological
monitoring is often available as electrocardiographic (ECG) telemetry, but in current practice
is only transiently displayed and then discarded. Analysis of continuous ECG reveals not only
heart rates (HR) and dynamics such as variability, but can also extract respiratory rates (RR).
[10,11] Thus, continuous ECG offers a window into cardiorespiratory dynamics, long known
to hold information about the physiological status of the patient.
Here, we tested the hypothesis that the addition of cardiorespiratory dynamics measured
from continuous ECG monitoring to conventional, intermittently sampled, data improves the
predictive validity of models trained to detect clinical deterioration prior to ICU transfer or
unanticipated death.
Methods
Study population
We studied consecutive adult (age > 18 years) patients admitted to acute care beds for whom
continuous ECG data was available at the University of Virginia Health System, from October
11, 2013 to September 1, 2015. The 71 beds are arranged in 3 units and are under the care of a
variety of hospital services, principally Cardiovascular Medicine and Cardiothoracic Surgery.
An institutional electronic data warehouse archived the EMR including admission, discharge,
and transfer information and a log of medical emergency team (MET) activations.
Cardiorespiratory dynamics improves detection of deterioration
PLOS ONE | https://doi.org/10.1371/journal.pone.0181448 August 3, 2017 2 / 16
review, or approval of the manuscript; and decision
to submit the manuscript for publication.
Competing interests: Dr. Clark is employed by and
holds equity in Advanced Medical Predictive
Devices, Diagnostics, and Displays in
Charlottesville, VA, which has licensed
technologies from the University of Virginia
Licensing and Ventures Group. Dr. Moorman holds
equity and is the chief medical officer of Advanced
Medical Predictive Devices, Diagnostics, and
Displays in Charlottesville, VA, which has licensed
technologies from the University of Virginia
Licensing and Ventures Group. No other
disclosures were reported. This does not alter our
adherence to PLOS ONE policies on sharing data
and materials.
Electronic medical record vital signs and laboratory results
At 15-minute increments, we recorded the most recent charted VS measurements—tempera-
ture, HR, blood pressures, RR, oxygen saturation (SpO2), oxygen flow rate, Glasgow Coma
Scale—and LABS—comprehensive metabolic panel, complete blood counts, coagulation stud-
ies, arterial blood gases, lactic acid, troponin I. We excluded observations occurring after “Do
Not Resuscitate” (DNR) or “Do Not Intubate” (DNI) orders or after transition to comfort
measures-only (CMO).
Cardiorespiratory dynamics measured from continuous ECG monitoring
Heart rate dynamics and atrial fibrillation detection. We processed the continuous ECG
with three QRS detection algorithms–based on wavelet, Hilbert, and length transforms–on the
ECG lead with the highest signal to noise ratio. The three resulting heartbeat time series were
combined to determine the probability density of each detected heartbeat. Low confidence beats
were excluded from the analysis. The QRS detection scheme used here has 97.5% sensitivity and
99.5% positive predictive value on the MIT BIH arrhythmia database hosted by PhysioNet.[12,13]
We made observations every 15 minutes of the preceding 30 minutes and calculated the
mean interbeat interval, the standard deviation or HR variability, and nonlinear dynamics of
HR.[14–16] From these measurements, we used a previously validated algorithm to detect the
presence of atrial fibrillation (AF).[17–19]
Electrocardiography-derived respiratory rate and respiratory sinus arrhythmia. We
estimated RR from (1) the cyclic variation in ECG waveform characteristics that result from
respiratory movements and, when present, from (2) the respiratory sinus arrhythmia.[20] We
analyzed 60-second interbeat interval time series windows containing 20 or more heartbeats.
Windows overlapped by 75%. To analyze cyclic variation in ECG waveform characteristics, we
calculated the R-S amplitude[21] and the QRS area of each detected heartbeat in every lead.
[12] We defined the R-S amplitude to be the range of the ECG voltage within ±80 ms of each
detected beat–maximum and minimum values were based on a quadratic fit at the extreme
point. We calculated the QRS area by integrating the ECG voltage in each lead within ±80 ms
of each detected beat after subtracting the median value. We then estimated the mean cardiac
electrical axis between each pair of QRS area time series.[10] The unevenly sampled ECG
interbeat interval time series were resampled at 4 Hz. For each time series (i.e. R-S amplitude
and QRS axis), we calculated power spectra using a fast Fourier transform and selected the
lowest RR between 4 and 55 breaths per minute that had power of at least 95% of the maxi-
mum. As a measure of the degree of respiratory sinus arrhythmia, we recorded the amplitude
of the RR peak.
We combined the multiple measures of ECG RR following the methods of Nemati, Li, Clif-
ford and co-workers.[11,22] Briefly, each RR estimate was processed in a Kalman filter using
the spectral purity to estimate the observation noise. A fused ECG RR was calculated by averag-
ing the multiple estimates weighted by their innovation. We averaged the ECG RR and respira-
tory sinus arrhythmia amplitude measurements in 30-minute windows with 50% overlap.
Outcomes
The primary composite outcome was clinical deterioration leading to any of the following
events: (1) unanticipated direct transfer to the ICU, (2) MET activation with subsequent trans-
fer to the ICU within 12 hours, (3) emergent or urgent (within 1 hour) operating room proce-
dure with subsequent transfer to the ICU, or (4) unexpected death within 24 hours of last time
recorded in a telemetered bed. In cases without unexpected death, we did not classify events
with ICU dwell times of shorter than 4 hours. We defined the time of the event as the time of
Cardiorespiratory dynamics improves detection of deterioration
PLOS ONE | https://doi.org/10.1371/journal.pone.0181448 August 3, 2017 3 / 16
ICU transfer, urgent surgery, death, or MET activation that preceded death. Two investigators
reviewed unexpected deaths and transfers to the ICU for clinical deterioration. A third
reviewer adjudicated cases in which there was disagreement.
Statistical analysis
We calculated the median values and interquartile ranges (IQR) for continuous variables and
reported the counts and percentages of categorical measurements. During periods of continu-
ous ECG monitoring, we developed multivariable prediction models to predict the risk of the
primary composite outcome in the next 24 hours. We labeled observations during the time
window prior to the event as cases, and observations outside this timeframe as controls.
In model development we adhered to the Transparent Reporting of a multivariable predic-
tion model for Individual Prognosis Or Diagnosis (TRIPOD) statement recommendations.
[23] To minimize the inclusion of redundant measurements and to avoid overfitting, we elimi-
nated highly correlated predictors. We evaluated 48 candidate predictors derived from 39
component measurements (7 vital sign measurements, 25 lab results, 7 ECG calculations),
including the slope or change of HR and ECG RR over windows of up to 24 hours. As new AF
with rapid ventricular response commonly occurs and complicates critical illness, we also
tested the interaction between current AF status and that of the initial rhythm detected. To
impute missing values, we carried the last value forward for up to 24 hours for charted VS and
for up to 48 hours for LABS; thereafter we imputed median values. We allowed our pre-speci-
fied candidate predictors to have non-monotonic and non-linear associations by modeling
them with restricted cubic spline transformations.[24] We retained all significant higher-order
factors. We adjusted for the repeated and correlated observations within individual patients
with procedures that modify the variance-covariance matrix, and we quantified predictive
accuracy using a concordance index (C-statistic).[24]
We developed a first set of models from each independent data source (i.e. VS, LABS, ECG
monitoring data). We conducted a second round of model development by modeling from all
the pairwise combinations of independent data sources. Finally, we developed a combined
model that integrated all available data sources. At each round to quantify the impact of adding
the additional data source to the preceding model, we calculated the C-statistic and a categori-
cal NRI for a change of 1 decile in risk. To test the hypothesis that the addition of cardiorespi-
ratory dynamics to a model comprised of charted vital signs and laboratory results improves
predictive validity, we calculated the probability of achieving the difference in the likelihood
ratio χ2 of the two models accounting for the difference in degrees of freedom between the two
models and report this as a p-value. In sensitivity analysis we stratified the evaluation of model
discrimination by the admitting hospital service. We also calculated several well-known EWS
and compared their performance to that of our univariate and multivariate models.
We validated these models internally using bootstrap resampling (TRIPOD Type 1b model
study) to estimate the performance on a new sample of observations from the same patient pop-
ulation, and report the bias-corrected C-statistics.[23] We justify bootstrapping methodology
over split-sample or cross-validation techniques by noting that the estimates generated by these
alternative strategies are less stable (different splits lead to different results) and exhibit greater
bias (samples that vary only by chance will probably show similar performance).[23,25]
Results
Characteristics of admissions
We studied 8,105 consecutive admissions with available continuous ECG data. After exclusion
of observations occurring after DNR, DNI, or CMO orders, we analyzed the remaining 2.2
Cardiorespiratory dynamics improves detection of deterioration
PLOS ONE | https://doi.org/10.1371/journal.pone.0181448 August 3, 2017 4 / 16
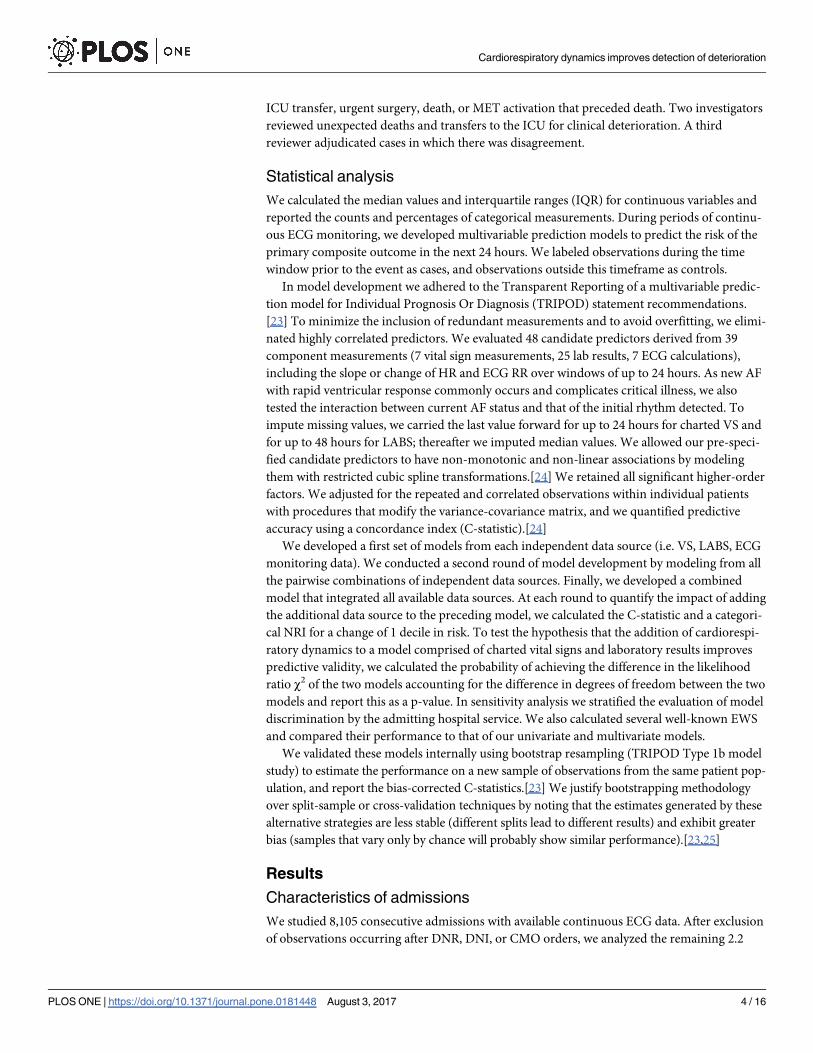
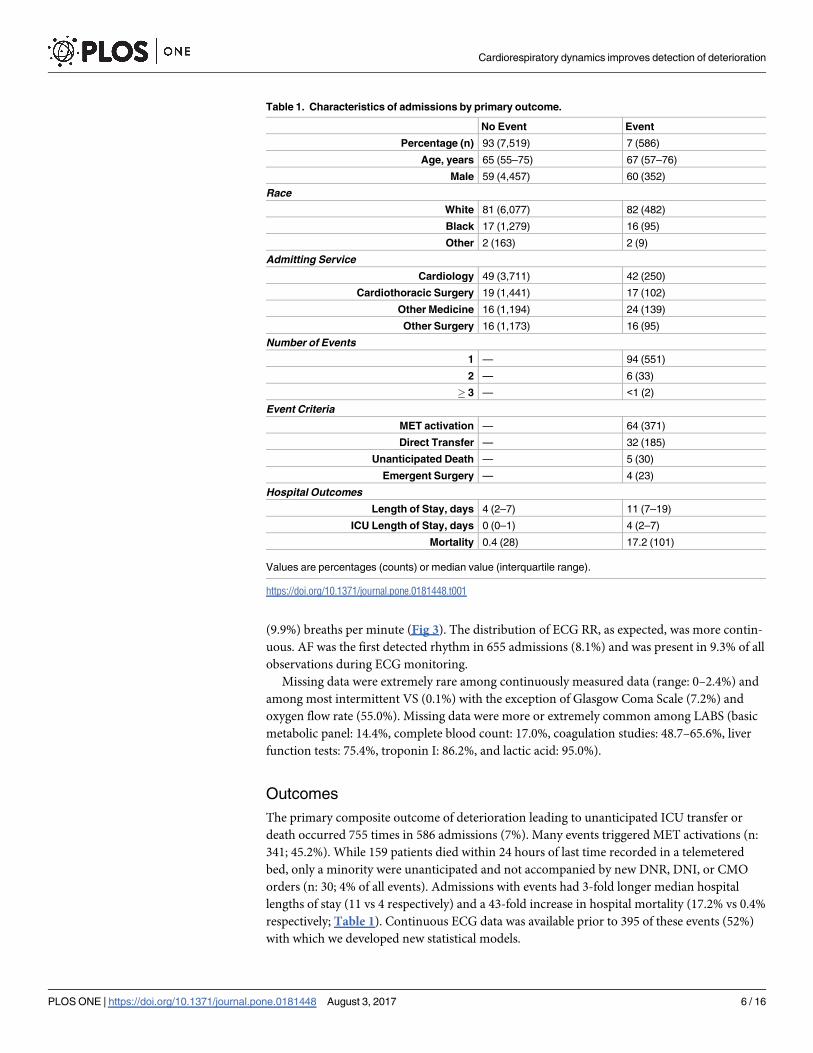
million observations (63.3 patient-years; Fig 1). Table 1 provides descriptive statistics of the
cohort. The majority of patients were admitted to either Cardiovascular Medicine or Cardio-
thoracic Surgery services (5,504 admissions [68%], 81% of all patient-days). The median age
was 65 (IQR: 55–75; range: 18–99) years and the median hospital length of stay was 4 (2–7)
days.
Laboratory tests, vital signs, continuous ECG measurements
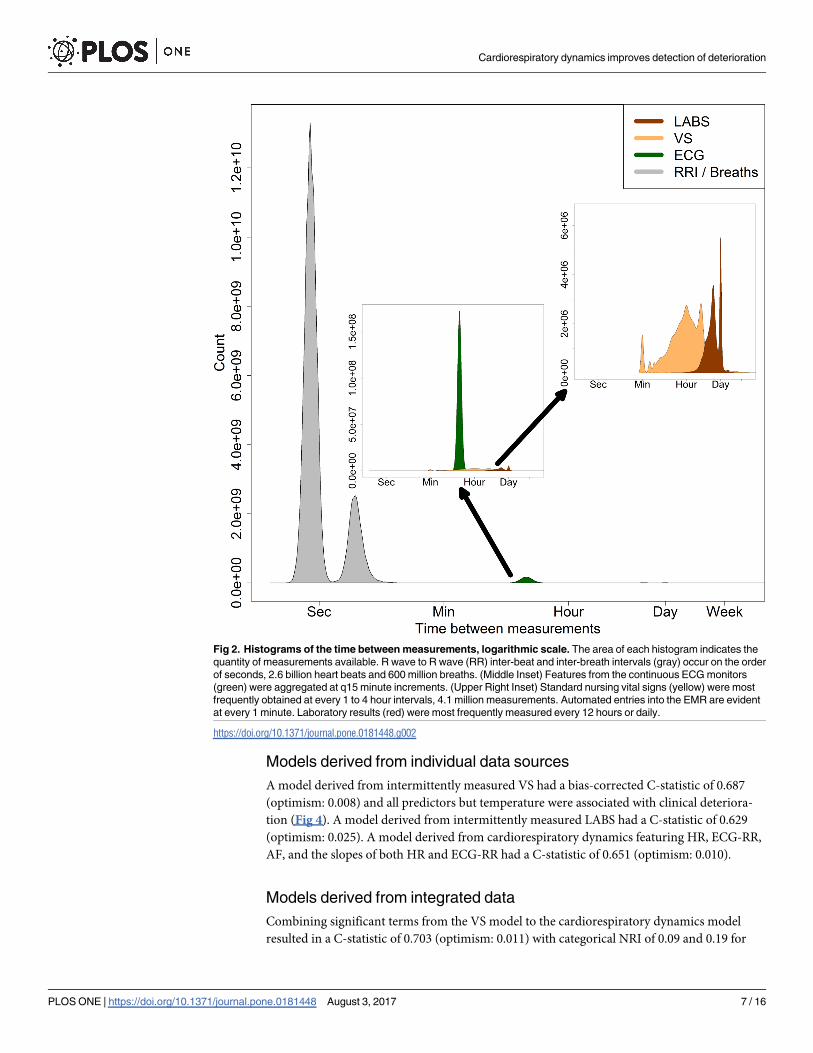
Fig 2 shows that the numbers of measurements varied widely, from 1.8M LABS (right inset,
brown) to 4.1M VS (right inset, beige) to 600M breaths (left, gray) and 2600M heartbeats (left,
gray). The green distribution in the middle inset represents 35M every-15-minute calculations
from continuous physiologic measures used for the ECG monitoring statistical models.
There was good agreement of HR and RR from the charted VS and the ECG analysis. RR
from charted VS was most frequently one of three values: 18 (15.0%), 20 (11.7%), and 16
Fig 1. Flowsheet of analysis.
https://doi.org/10.1371/journal.pone.0181448.g001
Cardiorespiratory dynamics improves detection of deterioration
PLOS ONE | https://doi.org/10.1371/journal.pone.0181448 August 3, 2017 5 / 16
(9.9%) breaths per minute (Fig 3). The distribution of ECG RR, as expected, was more contin-
uous. AF was the first detected rhythm in 655 admissions (8.1%) and was present in 9.3% of all
observations during ECG monitoring.
Missing data were extremely rare among continuously measured data (range: 0–2.4%) and
among most intermittent VS (0.1%) with the exception of Glasgow Coma Scale (7.2%) and
oxygen flow rate (55.0%). Missing data were more or extremely common among LABS (basic
metabolic panel: 14.4%, complete blood count: 17.0%, coagulation studies: 48.7–65.6%, liver
function tests: 75.4%, troponin I: 86.2%, and lactic acid: 95.0%).
Outcomes
The primary composite outcome of deterioration leading to unanticipated ICU transfer or
death occurred 755 times in 586 admissions (7%). Many events triggered MET activations (n:
341; 45.2%). While 159 patients died within 24 hours of last time recorded in a telemetered
bed, only a minority were unanticipated and not accompanied by new DNR, DNI, or CMO
orders (n: 30; 4% of all events). Admissions with events had 3-fold longer median hospital
lengths of stay (11 vs 4 respectively) and a 43-fold increase in hospital mortality (17.2% vs 0.4%
respectively; Table 1). Continuous ECG data was available prior to 395 of these events (52%)
with which we developed new statistical models.
Table 1. Characteristics of admissions by primary outcome.
No Event Event
Percentage (n) 93 (7,519) 7 (586)
Age, years 65 (55–75) 67 (57–76)
Male 59 (4,457) 60 (352)
Race
White 81 (6,077) 82 (482)
Black 17 (1,279) 16 (95)
Other 2 (163) 2 (9)
Admitting Service
Cardiology 49 (3,711) 42 (250)
Cardiothoracic Surgery 19 (1,441) 17 (102)
Other Medicine 16 (1,194) 24 (139)
Other Surgery 16 (1,173) 16 (95)
Number of Events
1 — 94 (551)
2 — 6 (33)
� 3 — <1 (2)
Event Criteria
MET activation — 64 (371)
Direct Transfer — 32 (185)
Unanticipated Death — 5 (30)
Emergent Surgery — 4 (23)
Hospital Outcomes
Length of Stay, days 4 (2–7) 11 (7–19)
ICU Length of Stay, days 0 (0–1) 4 (2–7)
Mortality 0.4 (28) 17.2 (101)
Values are percentages (counts) or median value (interquartile range).
https://doi.org/10.1371/journal.pone.0181448.t001
Cardiorespiratory dynamics improves detection of deterioration
PLOS ONE | https://doi.org/10.1371/journal.pone.0181448 August 3, 2017 6 / 16
Models derived from individual data sources
A model derived from intermittently measured VS had a bias-corrected C-statistic of 0.687
(optimism: 0.008) and all predictors but temperature were associated with clinical deteriora-
tion (Fig 4). A model derived from intermittently measured LABS had a C-statistic of 0.629
(optimism: 0.025). A model derived from cardiorespiratory dynamics featuring HR, ECG-RR,
AF, and the slopes of both HR and ECG-RR had a C-statistic of 0.651 (optimism: 0.010).
Models derived from integrated data
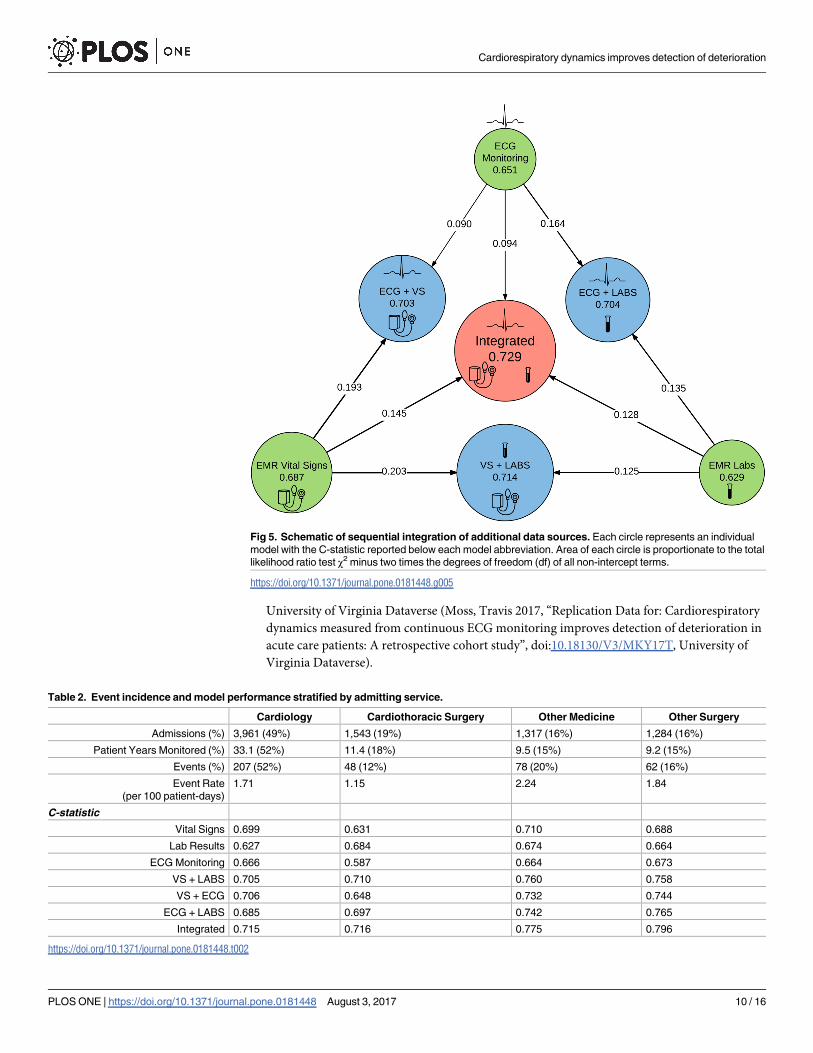
Combining significant terms from the VS model to the cardiorespiratory dynamics model
resulted in a C-statistic of 0.703 (optimism: 0.011) with categorical NRI of 0.09 and 0.19 for
Fig 2. Histograms of the time between measurements, logarithmic scale. The area of each histogram indicates the
quantity of measurements available. R wave to R wave (RR) inter-beat and inter-breath intervals (gray) occur on the order
of seconds, 2.6 billion heart beats and 600 million breaths. (Middle Inset) Features from the continuous ECG monitors
(green) were aggregated at q15 minute increments. (Upper Right Inset) Standard nursing vital signs (yellow) were most
frequently obtained at every 1 to 4 hour intervals, 4.1 million measurements. Automated entries into the EMR are evident
at every 1 minute. Laboratory results (red) were most frequently measured every 12 hours or daily.
https://doi.org/10.1371/journal.pone.0181448.g002
Cardiorespiratory dynamics improves detection of deterioration
PLOS ONE | https://doi.org/10.1371/journal.pone.0181448 August 3, 2017 7 / 16

cardiorespiratory dynamics and VS respectively (Fig 5). Adding cardiorespiratory dynamics to
the LABS model resulted in a C-statistic of 0.704 (optimism: 0.011) with NRI of 0.14 and 0.16
for LABS and cardiorespiratory dynamics respectively. Combining VS with LABS resulted in a
C-statistic of 0.714 (optimism: 0.014) with NRI of 0.20 and 0.13 for VS and LABS respectively.
A fully integrated model using all available data sources had the best C-statistic: 0.729 (opti-
mism: 0.014) with NRI of 0.15, 0.13, and 0.09 for the addition of VS, LABS and cardiorespira-
tory dynamics respectively. The difference in likelihood ratio χ2 between integrated models
with and without cardiorespiratory dynamics was 2158 with a difference of 13 degrees of free-
dom (p value:<0.001). The most important predictors were RR, supplemental oxygen use,
SpO2, and ECG signal to noise ratio (ECG-SNR).
Effect of admitting hospital service
The incidence of clinical deterioration ranged from 1.15 to 2.24 per 100 monitored patient-
days (Table 2). While there were differences in model discrimination amongst various hospital
services, as additional data sources were integrated into the model, and consistent with our
more general analysis, the predictive validity incrementally improved. The fully integrated
model had C-statistics of 0.715, 0.716, 0.775, and 0.796 for Cardiovascular Medicine, Cardio-
thoracic Surgery, Other Medicine, and Other Surgery respectively. The minimal anonymized
data set necessary to replicate regression model analysis above is publicly available on the
Fig 3. Distributions of measured heart rate and respiratory rate. Heart rate (left) and respiratory rate (right) measurement distributions according to
source, charted vital signs (VS; blue) vs electrocardiography (ECG; red) where each source had equal numbers of measurements.
https://doi.org/10.1371/journal.pone.0181448.g003
Cardiorespiratory dynamics improves detection of deterioration
PLOS ONE | https://doi.org/10.1371/journal.pone.0181448 August 3, 2017 8 / 16
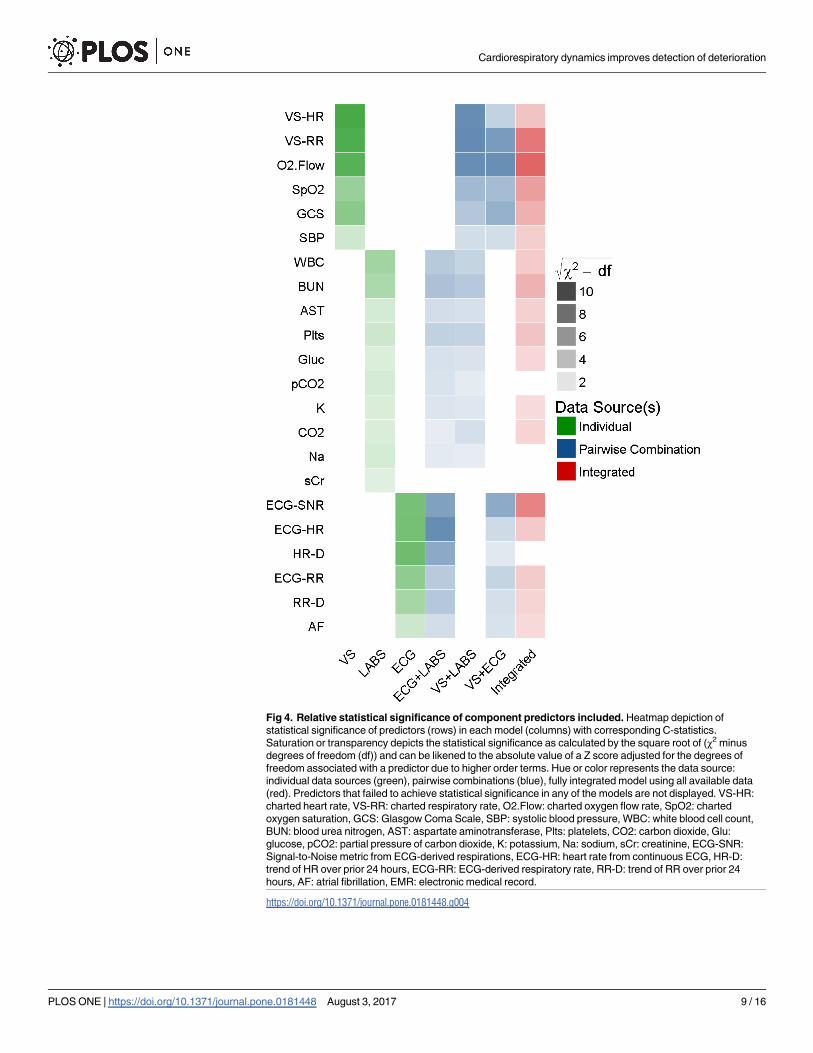
Fig 4. Relative statistical significance of component predictors included. Heatmap depiction of
statistical significance of predictors (rows) in each model (columns) with corresponding C-statistics.
Saturation or transparency depicts the statistical significance as calculated by the square root of (χ2 minus
degrees of freedom (df)) and can be likened to the absolute value of a Z score adjusted for the degrees of
freedom associated with a predictor due to higher order terms. Hue or color represents the data source:
individual data sources (green), pairwise combinations (blue), fully integrated model using all available data
(red). Predictors that failed to achieve statistical significance in any of the models are not displayed. VS-HR:
charted heart rate, VS-RR: charted respiratory rate, O2.Flow: charted oxygen flow rate, SpO2: charted
oxygen saturation, GCS: Glasgow Coma Scale, SBP: systolic blood pressure, WBC: white blood cell count,
BUN: blood urea nitrogen, AST: aspartate aminotransferase, Plts: platelets, CO2: carbon dioxide, Glu:
glucose, pCO2: partial pressure of carbon dioxide, K: potassium, Na: sodium, sCr: creatinine, ECG-SNR:
Signal-to-Noise metric from ECG-derived respirations, ECG-HR: heart rate from continuous ECG, HR-D:
trend of HR over prior 24 hours, ECG-RR: ECG-derived respiratory rate, RR-D: trend of RR over prior 24
hours, AF: atrial fibrillation, EMR: electronic medical record.
https://doi.org/10.1371/journal.pone.0181448.g004
Cardiorespiratory dynamics improves detection of deterioration
PLOS ONE | https://doi.org/10.1371/journal.pone.0181448 August 3, 2017 9 / 16
University of Virginia Dataverse (Moss, Travis 2017, “Replication Data for: Cardiorespiratory
dynamics measured from continuous ECG monitoring improves detection of deterioration in
acute care patients: A retrospective cohort study”, doi:10.18130/V3/MKY17T, University of
Virginia Dataverse).
Fig 5. Schematic of sequential integration of additional data sources. Each circle represents an individual
model with the C-statistic reported below each model abbreviation. Area of each circle is proportionate to the total
likelihood ratio test χ2 minus two times the degrees of freedom (df) of all non-intercept terms.
https://doi.org/10.1371/journal.pone.0181448.g005
Table 2. Event incidence and model performance stratified by admitting service.
Cardiology Cardiothoracic Surgery Other Medicine Other Surgery
Admissions (%) 3,961 (49%) 1,543 (19%) 1,317 (16%) 1,284 (16%)
Patient Years Monitored (%) 33.1 (52%) 11.4 (18%) 9.5 (15%) 9.2 (15%)
Events (%) 207 (52%) 48 (12%) 78 (20%) 62 (16%)
Event Rate
(per 100 patient-days)
1.71 1.15 2.24 1.84
C-statistic
Vital Signs 0.699 0.631 0.710 0.688
Lab Results 0.627 0.684 0.674 0.664
ECG Monitoring 0.666 0.587 0.664 0.673
VS + LABS 0.705 0.710 0.760 0.758
VS + ECG 0.706 0.648 0.732 0.744
ECG + LABS 0.685 0.697 0.742 0.765
Integrated 0.715 0.716 0.775 0.796
https://doi.org/10.1371/journal.pone.0181448.t002
Cardiorespiratory dynamics improves detection of deterioration
PLOS ONE | https://doi.org/10.1371/journal.pone.0181448 August 3, 2017 10 / 16

Comparison to other early warning scores
In evaluating all univariate predictors, our newly derived models, and common EWS, we
found that the top 5 performing models for the composite outcome were those newly devel-
oped and presented in this paper with the exception that the electronic Cardiac Arrest Risk
Triage (eCART) score[8] outperformed our model derived from only continuous ECG met-
rics, and both the National Early Warning Score (NEWS)[7] and the VitalPac Early Warning
Score (ViEWS)[6] outperformed our model derived only from LABS (Table 3). Systemic
Inflammatory Response Syndrome (SIRS)[26] came next as the 11th best model evaluated
while qSOFA[9] and Acute Physiology and Chronic Health Evaluation (APACHE) II[27] both
performed more poorly than the univariate predictor of mean HR taken from either the con-
tinuous ECG monitor or from the EMR charted VS.
Table 3. Ranking of model/predictor performance for primary outcome.
Predictor or Model Rank C-statistic d.f. Χ2 –d.f.
Integrated 1 0.742 38 441.9
VS + LABS 2 0.726 25 378.2
ECG + LABS 3 0.713 26 285.2
VS + ECG 4 0.712 25 382.3
VS 5 0.692 16 335.7
eCART 6 0.674 15 235.8
ECG 7 0.660 19 201.6
ViEWS 8 0.652 6 193.8
NEWS 9 0.652 6 193.0
LABS 10 0.649 29 153.7
SIRS 11 0.641 3 162.3
ECG HR 12 0.627 1 93.3
MEWS 13 0.622 6 162.5
EMR HR 14 0.621 1 96.9
qSOFA 15 0.593 2 94.6
O2 Flow 16 0.589 1 100.7
ECG RR 17 0.589 1 49.2
BUN 18 0.575 1 39.2
NEWS component >3 19 0.569 1 69.9
APACHE II 20 0.568 25 -8.9
All univariate predictors, models, and Early Warning Scores were evaluated in identical fashion where
observations within 24-hours of the primary outcome were labeled as cases and all other at-risk
observations were labeled as controls. Ranking is from best discrimination to worst as quantified by C-
statistic (non bias-corrected). We also report the degrees of freedom and the total statistical significance or
χ2 penalized by added complexity by subtracting two times the degrees of freedom of the model. VS: model
derived from electronic medical record vital signs; LABS: model derived from electronic medical record
laboratory results; eCART: electronic Cardiac Arrest Risk Triage score; MEWS: Modified Early Warning
Score; qSOFA: quick Sequential [Sepsis-related] Organ Failure Assessment; ViEWS: VitalPac Early
Warning Score; NEWS: National Early Warning Score; BUN: blood urea nitrogen; NEWS component > 3:
any single NEWS component score >3; APACHE II: Acute Physiology and Chronic Health Evaluation; SIRS:
Systemic Inflammatory Response Syndrome; ECG: electrocardiography; HR: heart rate; d.f.: degrees of
freedom.
https://doi.org/10.1371/journal.pone.0181448.t003
Cardiorespiratory dynamics improves detection of deterioration
PLOS ONE | https://doi.org/10.1371/journal.pone.0181448 August 3, 2017 11 / 16
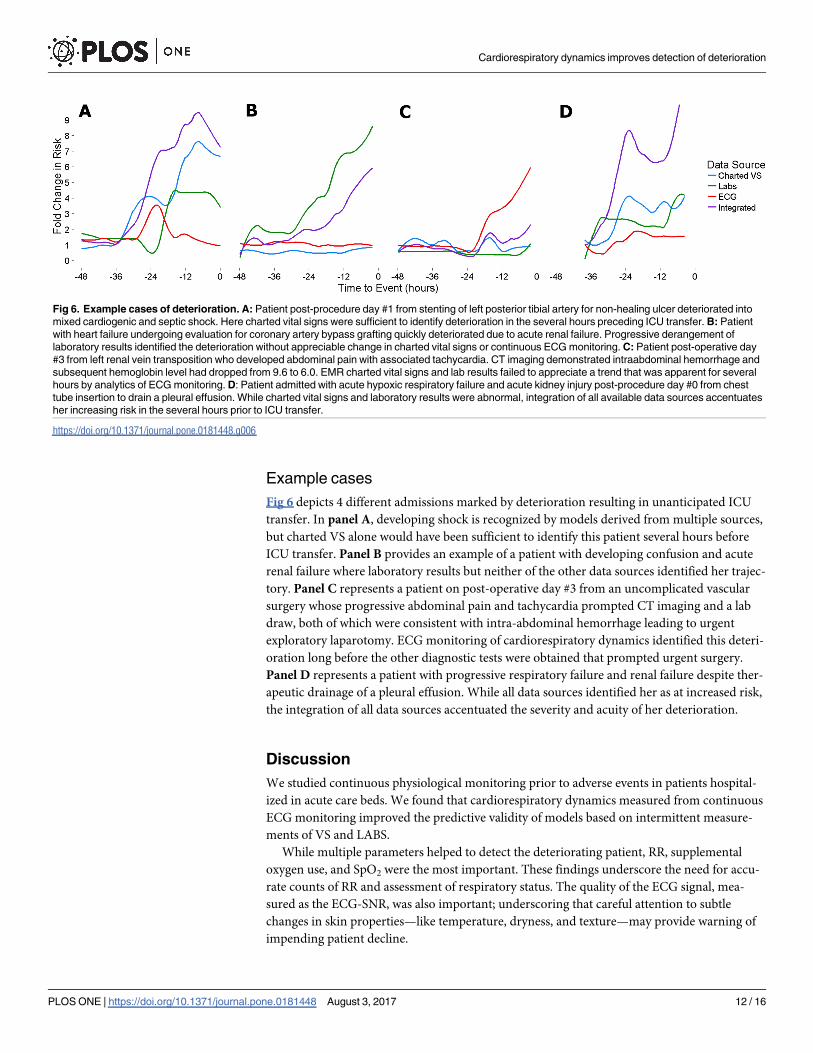
Example cases
Fig 6 depicts 4 different admissions marked by deterioration resulting in unanticipated ICU
transfer. In panel A, developing shock is recognized by models derived from multiple sources,
but charted VS alone would have been sufficient to identify this patient several hours before
ICU transfer. Panel B provides an example of a patient with developing confusion and acute
renal failure where laboratory results but neither of the other data sources identified her trajec-
tory. Panel C represents a patient on post-operative day #3 from an uncomplicated vascular
surgery whose progressive abdominal pain and tachycardia prompted CT imaging and a lab
draw, both of which were consistent with intra-abdominal hemorrhage leading to urgent
exploratory laparotomy. ECG monitoring of cardiorespiratory dynamics identified this deteri-
oration long before the other diagnostic tests were obtained that prompted urgent surgery.
Panel D represents a patient with progressive respiratory failure and renal failure despite ther-
apeutic drainage of a pleural effusion. While all data sources identified her as at increased risk,
the integration of all data sources accentuated the severity and acuity of her deterioration.
Discussion
We studied continuous physiological monitoring prior to adverse events in patients hospital-
ized in acute care beds. We found that cardiorespiratory dynamics measured from continuous
ECG monitoring improved the predictive validity of models based on intermittent measure-
ments of VS and LABS.
While multiple parameters helped to detect the deteriorating patient, RR, supplemental
oxygen use, and SpO2 were the most important. These findings underscore the need for accu-
rate counts of RR and assessment of respiratory status. The quality of the ECG signal, mea-
sured as the ECG-SNR, was also important; underscoring that careful attention to subtle
changes in skin properties—like temperature, dryness, and texture—may provide warning of
impending patient decline.
Fig 6. Example cases of deterioration. A: Patient post-procedure day #1 from stenting of left posterior tibial artery for non-healing ulcer deteriorated into
mixed cardiogenic and septic shock. Here charted vital signs were sufficient to identify deterioration in the several hours preceding ICU transfer. B: Patient
with heart failure undergoing evaluation for coronary artery bypass grafting quickly deteriorated due to acute renal failure. Progressive derangement of
laboratory results identified the deterioration without appreciable change in charted vital signs or continuous ECG monitoring. C: Patient post-operative day
#3 from left renal vein transposition who developed abdominal pain with associated tachycardia. CT imaging demonstrated intraabdominal hemorrhage and
subsequent hemoglobin level had dropped from 9.6 to 6.0. EMR charted vital signs and lab results failed to appreciate a trend that was apparent for several
hours by analytics of ECG monitoring. D: Patient admitted with acute hypoxic respiratory failure and acute kidney injury post-procedure day #0 from chest
tube insertion to drain a pleural effusion. While charted vital signs and laboratory results were abnormal, integration of all available data sources accentuates
her increasing risk in the several hours prior to ICU transfer.
https://doi.org/10.1371/journal.pone.0181448.g006
Cardiorespiratory dynamics improves detection of deterioration
PLOS ONE | https://doi.org/10.1371/journal.pone.0181448 August 3, 2017 12 / 16
Detecting the deteriorating patient on the hospital ward is a major goal. The causes are var-
ied, and range from underestimation of the admission diagnosis to the development of new
and unrelated illnesses. The consequences range from altered management plans on the ward
to ICU transfer and in some cases even to cardiac arrest and death. Physicians and nurses
agree that early warning signs are often present, but are sometimes recognized only in retro-
spect. Beginning with APACHE for ICU patients in 1981[28] and EWS for acute care patients
in 1997[29], many systems have been developed using charted elements–VS, level of con-
sciousness, laboratory test results. In 2008, Smith and coworkers reviewed more than 60 such
systems using single or multiple predictive parameters.[30,31] These systems benefit from sys-
tematically examining all the available data, and from the clinical wisdom of their developers.
They lack, however, information from continuous physiological monitoring that is available
for many hospitalized patients.
We hypothesized that the cardiorespiratory dynamics held information about the changing
state of the hospital patient vulnerable to deterioration leading to ICU transfer, and we tested
this hypothesis using advanced ECG signal processing techniques and a large, well-annotated
database. From the ECG waveform signals, we determined linear and non-linear dynamical
properties, identified AF, and detected respiration. From individual review of charts, we
selected only patients whose ICU transfer was prompted by clinical deterioration, as opposed
to elective transfer such as after cardiac surgery. The robustness of these approaches enhances,
in our view, the validity of the results.
Our findings may be viewed in light of a paradigm shift in approaches to early detection of
the deteriorating patient. This work began in intensive care units. In the neonatal ICU,
advanced signal processing and HR time series analysis are used for early detection of neonatal
sepsis, where it saves lives[32–34], as well as for other adverse outcomes.[35] In adult ICUs,
signatures of illness have been identified in sepsis, respiratory failure leading to urgent intuba-
tion and hemorrhage leading to multi-unit transfusion of red blood cells.[36,37] In adult ICU
patients already known to be septic, shock may be predicted.[38]
The idea is spreading to the problem of early detection of the deteriorating floor patient.
Zimlichman and coworkers have introduced contactless motion detection to derive HR and
RR.[39–41] Tarassenko and coworkers developed a probability-based model of patient status
from distributions of VS.[42] Hu and coworkers have used advanced data mining to analyze
monitor alarms to produce SuperAlarms.[43] Churpek, Edelson and coworkers have devised
EMR-based alerts of increasing risk of in-hospital cardiac arrest.[2]
In this work, we introduce advanced time series analysis of continuous ECG telemetric
monitoring to capture physiological dynamics in acute care patients. We captured these
dynamics in the time, frequency, and non-linear dynamical domains.[14,15,17,18,44] We see
many opportunities to apply these and other mathematical approaches to large, well-annotated
clinical data sets to develop sophisticated and useful monitoring that use all available data.
Limitations
This is a single-center observational study in which Cardiovascular Medicine and Cardiotho-
racic Surgery were the predominant provider teams and thus our results may not generalize to
other environments. MET or Rapid Response teams are varied in their composition and
implementation across institutions. Because MET activation at our institution is not restricted
to objective criteria, we included only MET activations that were followed by ICU transfer. We
employed advanced logistic regression models, but note that ensemble methods in machine
learning are well-suited for classification of heterogeneous groups.
Cardiorespiratory dynamics improves detection of deterioration
PLOS ONE | https://doi.org/10.1371/journal.pone.0181448 August 3, 2017 13 / 16

Conclusions
Integration of cardiorespiratory dynamics measured from continuous ECG monitoring with
intermittent vitals and LABS improves the predictive validity of models to detect clinical dete-
rioration in acute care patients. We look forward to improved care through earlier detection of
patient deterioration that incorporates advanced medical analytics of continuous physiologic
monitoring.
Acknowledgments
We thank G. Kim, M.I. Blatt, and M.A. Lynch for chart review; M. Monroe, R. Clarke, P. Yani-
glos, G. Huband and J.M. Huband for design and operation of infrastructure to collect, pro-
cess, and archive physiologic monitoring data; T.B. Hope and J. Ainsworth for assistance with
data warehouse queries. The University of Virginia Institutional Review Board approved this
study with a waiver of informed consent.
Author Contributions
Conceptualization: Travis J. Moss, Matthew T. Clark, James Forrest Calland, Kyle B. Enfield,
John D. Voss, Douglas E. Lake, J. Randall Moorman.
Data curation: Travis J. Moss, Matthew T. Clark, Douglas E. Lake, J. Randall Moorman.
Formal analysis: Travis J. Moss, Matthew T. Clark, J. Randall Moorman.
Funding acquisition: J. Randall Moorman.
Investigation: Travis J. Moss, Matthew T. Clark, Douglas E. Lake, J. Randall Moorman.
Methodology: Travis J. Moss, Matthew T. Clark, John D. Voss, Douglas E. Lake, J. Randall
Moorman.
Project administration: Travis J. Moss, James Forrest Calland, Kyle B. Enfield, Douglas E.
Lake, J. Randall Moorman.
Resources: James Forrest Calland, Douglas E. Lake, J. Randall Moorman.
Software: Travis J. Moss, Matthew T. Clark, Douglas E. Lake, J. Randall Moorman.
Supervision: Travis J. Moss, James Forrest Calland, Douglas E. Lake, J. Randall Moorman.
Validation: Travis J. Moss, Matthew T. Clark, J. Randall Moorman.
Visualization: Travis J. Moss, Matthew T. Clark, Douglas E. Lake, J. Randall Moorman.
Writing – original draft: Travis J. Moss, Matthew T. Clark, J. Randall Moorman.
Writing – review & editing: Travis J. Moss, Matthew T. Clark, James Forrest Calland, Kyle B.
Enfield, John D. Voss, Douglas E. Lake, J. Randall Moorman.
References1. Bailey TC, Chen Y, Mao Y, Lu C, Hackmann G, Micek ST, et al. A trial of a real-time alert for clinical
deterioration in patients hospitalized on general medical wards. J Hosp Med. 2013; 8: 236–242. https://
doi.org/10.1002/jhm.2009 PMID: 23440923
2. Churpek MM, Yuen TC, Park SY, Gibbons R, Edelson DP. Using electronic health record data to
develop and validate a prediction model for adverse outcomes in the wards*. Crit Care Med. 2014; 42:
841–848. https://doi.org/10.1097/CCM.0000000000000038 PMID: 24247472
3. Young MP, Gooder VJ, McBride K, James B, Fisher ES. Inpatient transfers to the intensive care unit:
delays are associated with increased mortality and morbidity. J Gen Intern Med. 2003; 18: 77–83.
https://doi.org/10.1046/j.1525-1497.2003.20441.x PMID: 12542581
Cardiorespiratory dynamics improves detection of deterioration
PLOS ONE | https://doi.org/10.1371/journal.pone.0181448 August 3, 2017 14 / 16

4. Cardoso LT, Grion CM, Matsuo T, Anami EH, Kauss IA, Seko L, et al. Impact of delayed admission to
intensive care units on mortality of critically ill patients: a cohort study. Crit Care. 2011; 15: R28. https://
doi.org/10.1186/cc9975 PMID: 21244671
5. Gardner-Thorpe J, Love N, Wrightson J, Walsh S, Keeling N. The value of Modified Early Warning
Score (MEWS) in surgical in-patients: a prospective observational study. Ann R Coll Surg Engl. 2006;
88: 571–575. https://doi.org/10.1308/003588406X130615 PMID: 17059720
6. Prytherch DR, Smith GB, Schmidt PE, Featherstone PI. ViEWS—Towards a national early warning
score for detecting adult inpatient deterioration. Resuscitation. 2010; 81: 932–937. https://doi.org/10.
1016/j.resuscitation.2010.04.014 PMID: 20637974
7. Royal College of Physicians. National Early Warning Score (NEWS): Standardising the assessment of
acute-illness severity in the NHS. Report of a working party. 2012.
8. Churpek MM, Yuen TC, Winslow C, Robicsek AA, Meltzer DO, Gibbons RD, et al. Multicenter develop-
ment and validation of a risk stratification tool for ward patients. Am J Respir Crit Care Med. 2014; 190:
649–655. https://doi.org/10.1164/rccm.201406-1022OC PMID: 25089847
9. Seymour CW, Liu VX, Iwashyna TJ, Brunkhorst FM, Rea TD, Scherag A, et al. Assessment of Clinical
Criteria for Sepsis: For the Third International Consensus Definitions for Sepsis and Septic Shock (Sep-
sis-3). JAMA. 2016; 315: 762–774. https://doi.org/10.1001/jama.2016.0288 PMID: 26903335
10. Moody GB, Mark RG, Zoccola A, Mantero S. Derivation of respiratory signals from multi-lead ECGs.
Comput Cardiol. 1985; 12: 113–116.
11. Nemati S, Malhotra A, Clifford GD. Data fusion for improved respiration rate estimation. EURASIP jour-
nal on advances in signal processing. 2010; 2010: 10.
12. Moody GB, Mark RG. The impact of the MIT-BIH arrhythmia database. IEEE Eng Med Biol Mag. 2001;
20: 45–50. PMID: 11446209
13. Goldberger AL, Amaral LA, Glass L, Hausdorff JM, Ivanov PC, Mark RG, et al. PhysioBank, Physio-
Toolkit, and PhysioNet: components of a new research resource for complex physiologic signals. Circu-
lation. 2000; 101: E215–20. PMID: 10851218
14. Lake DE, Moorman JR. Accurate estimation of entropy in very short physiological time series: the prob-
lem of atrial fibrillation detection in implanted ventricular devices. Am J Physiol Heart Circ Physiol. 2011;
300: H319–25. https://doi.org/10.1152/ajpheart.00561.2010 PMID: 21037227
15. Moss TJ, Lake DE, Moorman JR. Local dynamics of heart rate: detection and prognostic implications.
Physiol Meas. 2014; 35: 1929–1942. https://doi.org/10.1088/0967-3334/35/10/1929 PMID: 25229393
16. Pena MA, Echeverria JC, Garcia MT, Gonzalez-Camarena R. Applying fractal analysis to short sets of
heart rate variability data. Med Biol Eng Comput. 2009; 47: 709–717. https://doi.org/10.1007/s11517-
009-0436-1 PMID: 19184157
17. Carrara M, Carozzi L, Moss TJ, de Pasquale M, Cerutti S, Ferrario M, et al. Heart rate dynamics distin-
guish among atrial fibrillation, normal sinus rhythm and sinus rhythm with frequent ectopy. Physiol
Meas. 2015; 36: 1873–1888. https://doi.org/10.1088/0967-3334/36/9/1873 PMID: 26246162
18. Carrara M, Carozzi L, Moss TJ, de Pasquale M, Cerutti S, Lake DE, et al. Classification of cardiac
rhythm using heart rate dynamical measures: validation in MIT-BIH databases. J Electrocardiol. 2015;
48: 943–946. https://doi.org/10.1016/j.jelectrocard.2015.08.002 PMID: 26320371
19. Moss TJ, Calland JF, Enfield KB, Gomez-Manjarres DC, Ruminski C, DiMarco JP, et al. New-Onset
Atrial Fibrillation in the Critically Ill. Crit Care Med. 2017. https://doi.org/10.1097/CCM.
0000000000002325 PMID: 28296811
20. ANGELONE A, COULTER NA Jr. Respiratory Sinus Arrhythemia: a Frequency Dependent Phenome-
non. J Appl Physiol. 1964; 19: 479–482. PMID: 14173545
21. Clark MT, Rusin CG, Hudson JL, Lee H, Delos JB, Guin LE, et al. Breath-by-breath analysis of cardiore-
spiratory interaction for quantifying developmental maturity in premature infants. J Appl Physiol (1985).
2012; 112: 859–867. https://doi.org/10.1152/japplphysiol.01152.2011 PMID: 22174403
22. Li Q, Mark RG, Clifford GD. Robust heart rate estimation from multiple asynchronous noisy sources
using signal quality indices and a Kalman filter. Physiol Meas. 2007; 29: 15. https://doi.org/10.1088/
0967-3334/29/1/002 PMID: 18175857
23. Moons KG, Altman DG, Reitsma JB, Ioannidis JP, Macaskill P, Steyerberg EW, et al. Transparent
Reporting of a multivariable prediction model for Individual Prognosis or Diagnosis (TRIPOD): explana-
tion and elaboration. Ann Intern Med. 2015; 162: W1–73. https://doi.org/10.7326/M14-0698 PMID:
25560730
24. Harrell FE Jr. Regression modeling strategies with applications to linear models, logistic and ordinal
regression and survival analysis. 2nd ed. New York: Springer-Verlag; 2015. ISBN 978-3-319-19424-0.
Cardiorespiratory dynamics improves detection of deterioration
PLOS ONE | https://doi.org/10.1371/journal.pone.0181448 August 3, 2017 15 / 16

25. Steyerberg EW, Harrell FE Jr, Borsboom GJ, Eijkemans MJ, Vergouwe Y, Habbema JD. Internal valida-
tion of predictive models: efficiency of some procedures for logistic regression analysis. J Clin Epide-
miol. 2001; 54: 774–781. PMID: 11470385
26. ACCP/SCCM Consensus Conference Committee. American College of Chest Physicians/Society of
Critical Care Medicine Consensus Conference. Definitions for sepsis and organ failure and guidelines
for the use of innovative therapies in sepsis. Crit Care Med. 1992; 20: 864–874. PMID: 1597042
27. Knaus WA, Draper EA, Wagner DP, Zimmerman JE. APACHE II: a severity of disease classification
system. Crit Care Med. 1985; 13: 818–829. PMID: 3928249
28. Knaus WA, Zimmerman JE, Wagner DP, Draper EA, Lawrence DE. APACHE-acute physiology and
chronic health evaluation: a physiologically based classification system. Crit Care Med. 1981; 9: 591–
597. PMID: 7261642
29. Morgan RJ, Williams F, Wright MM. An early warning scoring system for detecting developing critical ill-
ness. Clin Intens Care. 1997; 8: 100.
30. Smith GB, Prytherch DR, Schmidt PE, Featherstone PI. Review and performance evaluation of aggre-
gate weighted ‘track and trigger’systems. Resuscitation. 2008; 77: 170–179. https://doi.org/10.1016/j.
resuscitation.2007.12.004 PMID: 18249483
31. Smith GB, Prytherch DR, Schmidt PE, Featherstone PI, Higgins B. A review, and performance evalua-
tion, of single-parameter “track and trigger” systems. Resuscitation. 2008; 79: 11–21. https://doi.org/10.
1016/j.resuscitation.2008.05.004 PMID: 18620794
32. Moorman JR, Carlo WA, Kattwinkel J, Schelonka RL, Porcelli PJ, Navarrete CT, et al. Mortality reduc-
tion by heart rate characteristic monitoring in very low birth weight neonates: a randomized trial. J
Pediatr. 2011; 159: 900–6.e1. https://doi.org/10.1016/j.jpeds.2011.06.044 PMID: 21864846
33. Lake DE, Fairchild KD, Moorman JR. Complex signals bioinformatics: evaluation of heart rate charac-
teristics monitoring as a novel risk marker for neonatal sepsis. J Clin Monit Comput. 2014; 28: 329–339.
https://doi.org/10.1007/s10877-013-9530-x PMID: 24248424
34. Fairchild KD, Schelonka RL, Kaufman DA, Carlo WA, Kattwinkel J, Porcelli PJ, et al. Septicemia mortal-
ity reduction in neonates in a heart rate characteristics monitoring trial. Pediatr Res. 2013; 74: 570–575.
https://doi.org/10.1038/pr.2013.136 PMID: 23942558
35. Saria S, Rajani AK, Gould J, Koller D, Penn AA. Integration of early physiological responses predicts
later illness severity in preterm infants. Sci Transl Med. 2010; 2: 48ra65. https://doi.org/10.1126/
scitranslmed.3001304 PMID: 20826840
36. Moss TJ, Clark MT, Lake DE, Moorman JR, Calland JF. Heart rate dynamics preceding hemorrhage in
the intensive care unit. J Electrocardiol. 2015; 48: 1075–1080. https://doi.org/10.1016/j.jelectrocard.
2015.08.007 PMID: 26342251
37. Moss TJ, Lake DE, Calland JF, Enfield KB, Delos JB, Fairchild KD, et al. Signatures of Subacute Poten-
tially Catastrophic Illness in the ICU: Model Development and Validation. Crit Care Med. 2016; 44:
1639–1648. https://doi.org/10.1097/CCM.0000000000001738 PMID: 27452809
38. Henry KE, Hager DN, Pronovost PJ, Saria S. A targeted real-time early warning score (TREWScore)
for septic shock. Sci Transl Med. 2015; 7: 299ra122. https://doi.org/10.1126/scitranslmed.aab3719
PMID: 26246167
39. Brown H, Terrence J, Vasquez P, Bates DW, Zimlichman E. Continuous monitoring in an inpatient med-
ical-surgical unit: a controlled clinical trial. Am J Med. 2014; 127: 226–232. https://doi.org/10.1016/j.
amjmed.2013.12.004 PMID: 24342543
40. Zimlichman E, Szyper-Kravitz M, Shinar Z, Klap T, Levkovich S, Unterman A, et al. Early recognition of
acutely deteriorating patients in non-intensive care units: Assessment of an innovative monitoring tech-
nology. Journal of hospital medicine. 2012; 7: 628–633. https://doi.org/10.1002/jhm.1963 PMID:
22865462
41. Ben-Ari J, Zimlichman E, Adi N, Sorkine P. Contactless respiratory and heart rate monitoring: validation
of an innovative tool. J Med Eng Technol. 2010; 34: 393–398. https://doi.org/10.3109/03091902.2010.
503308 PMID: 20698739
42. Tarassenko L, Hann A, Young D. Integrated monitoring and analysis for early warning of patient deterio-
ration. Br J Anaesth. 2006; 97: 64–68. https://doi.org/10.1093/bja/ael113 PMID: 16707529
43. Hu X, Sapo M, Nenov V, Barry T, Kim S, Do DH, et al. Predictive combinations of monitor alarms pre-
ceding in-hospital code blue events. J Biomed Inform. 2012; 45: 913–921. https://doi.org/10.1016/j.jbi.
2012.03.001 PMID: 22465785
44. DeMazumder D, Lake DE, Cheng A, Moss TJ, Guallar E, Weiss RG, et al. Dynamic analysis of cardiac
rhythms for discriminating atrial fibrillation from lethal ventricular arrhythmias. Circ Arrhythm Electrophy-
siol. 2013; 6: 555–561. https://doi.org/10.1161/CIRCEP.113.000034 PMID: 23685539
Cardiorespiratory dynamics improves detection of deterioration
PLOS ONE | https://doi.org/10.1371/journal.pone.0181448 August 3, 2017 16 / 16
Related Documents