CardiaC ConduCtivity disturbanCes & the eCG ChanGes Presented by Omar AL-Rawajfah, RN, PhD

Welcome message from author
This document is posted to help you gain knowledge. Please leave a comment to let me know what you think about it! Share it to your friends and learn new things together.
Transcript

CardiaC ConduCtivity
disturbanCes & the eCG ChanGes
Presented by Omar AL-Rawajfah, RN, PhD

Lecture Outlines
• Describe the cardiac conductive system. • Describe characteristics of cardiac muscle. • Discuss 12-lead ECG • Discuss the normal ECG • Discuss conductive system disturbances and
possible treatment • Questions and answers

Cardiac Cells
• The electrical cardiac cells: – Automaticity: spontaneous generation of
electrical impulse – Excitability: respond to an electrical impulse – Conductivity: transmit an electrical impulse
• The mechanical cells: – Contractility: shorten and lengthen its muscle
fibers – Extensibility: ability to stretch


Electrophysiology
SA Node
Internodal Pathways
AV Node
Bundle of His
Bundle Branches
Purkinje Fibers

History of ECG • 1872: Alexander Muirhead attached wires to a feverish
patient's wrist to obtain a record of the patient's heartbeat while studying for his Doctor of Science (in electricity) in France
• This activity was directly recorded and visualized using a Lippmann capillary electrometer by the British physiologist John Burdon Sanderson.
• The first to systematically approach the heart from an electrical point-of-view was Augustus Waller in London.
• Willem Einthoven, working in Leiden, The Netherlands, used the string galvanometer which he invented in 1901, which was much more sensitive than the capillary electrometer that Waller used.
• Einthoven assigned the letters P, Q, R, S and T to the various deflections, and described the electrocardiographic features of a number of cardiovascular disorders.
• In 1924, he was awarded the Nobel Prize in Medicine for his discovery

A "Method" of ECG Interpretation
• Measurements • Rhythm analysis • Conduction analysis • Waveform description • ECG interpretation • Comparison with previous ECG (if any) • In the interpretation answer the following
questions: What is the rate? Is it regular or irregular? Are P waves present? Are QRS complexes present? Is there a 1:1 ratio between P waves and QRS complexes? Is the PR interval constant?
• http://ecg.utah.edu/ • http://www.practicalclinicalskills.com/


12-Lead ECG - Standard limb Leads • Bipolar limb leads
– Lead I: Rt and Lt Arms (used to obtain a rhythm strip)
– Lead II: Rt Arm and Lt Leg – Lead III: Lt Arm and Lt Leg
Einthoven's Triangle

12-Lead ECG - Augmented Limb Leads (unipolar leads)
1. aVR: always QRS will have a negative deflection 2. aVL : Lateral portion of the heart
3. aVF : inferior portion of the heart

12-Lead ECG - Augmented Limb Leads (unipolar leads)
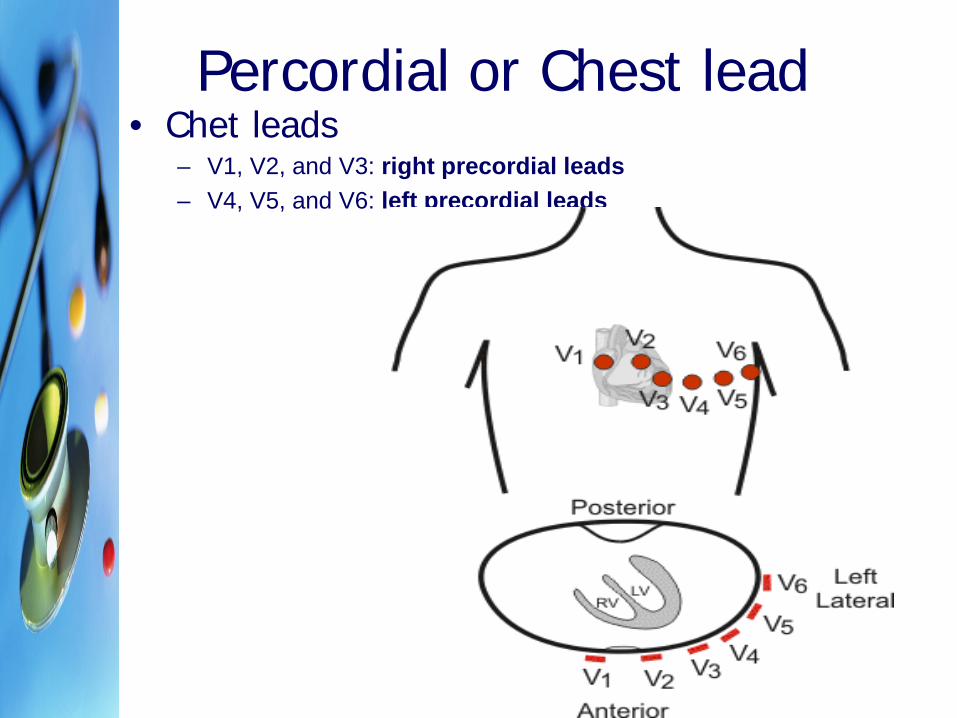
Percordial or Chest lead • Chet leads
– V1, V2, and V3: right precordial leads – V4, V5, and V6: left precordial leads

15 or 18 leads ECG

15 or 18 leads ECG • Placement: • Right Precordial Leads (V4R, V5R, V6R)
– V4R: right midclavicular line, fifth intercostal space (use V3 lead)
– V5R: right anterior axillary line, straight line from V4R (use V2 lead)
– V6R: right midaxillary line, straight line from V5R (use V1 lead)
• Posterior leads (V7, V8, V9) – V7: left posterior axillary line, straight line from V6 (use
V4 lead) – V8: left midscapular line, straight line from V7 (use V5
lead – V9: left paraspinal line, straight line from V8 (use V6
lead). • Indications
– Suspected Right ventricle MI – Posterior left ventricle

Clinical Lead Groups

Electrical Axis • Represent the general direction of the wave
excitation • The axis is normal when the wave moves from
SA node down to AV node down to the ventricles • Axis is easily assessed in lead I and aVF by the
direction of the QRQ – Normal axis: up right in both leads – Lt axis deviation: positive I & aVF negative – Rt axis deviation: negative I & aVF positive – Extreme Rt axis deviation: both negative

Normal Axis

Lt Axis Deviation
• Caused by – LBBB, – Lt Ventricular enlargement – Inferior MI

Right Axis Deviation
• Caused by – RBBB, and anterior MI – Rt Ventricular enlargement – COPD, pulmonary arterial hypertension or
large pulmonary embolism.

Quiz???

Components of ECG 1 mm = 0.1 mV, 5 mm = 0.2 Sec

What do they mean? • P wave: the sequential activation (depolarization) of the
right and left atria • QRS complex: right and left ventricular depolarization
(normally the ventricles are activated simultaneously) • ST-T wave: ventricular repolarization • U wave: origin for this wave is not clear - but probably
represents "afterdepolarizations" in the ventricles • PR interval: time interval from onset of atrial
depolarization (P wave) to onset of ventricular depolarization (QRS complex)
• QRS duration: duration of ventricular muscle depolarization
• QT interval: duration of ventricular depolarization and repolarization
• RR interval: duration of ventricular cardiac cycle (an indicator of ventricular rate)
• PP interval: duration of atrial cycle (an indicator of atrial rate)

P Wave
• Associated with atrial depolarization • Duration less than 0.12 sec • Amplitude is normally less than 0.25 mV • Positive in I, II, aVL, V4 – V6 • Can be negative in V1 • A negative P-wave can indicate depolarization arising
from the AV node
Lead II

PR Interval
• Represent the time of impulse to leave the SA node the travel through the atria, AV node, bundle branch and Purkinje fibers.
• The flat line between P wave and the QRS represent the delay in the AV node.
• Duration less than 0.12 – 0.20 sec • Long PR interval is seen in heart block disorders

QRS complex
• Associated with ventricular depolarization • Duration range: 0.04 – 0.12 sec • Represent the time of impulse to travel
through Rt & Lt ventricles • The 1st negative deflection is Q, 1st positive
deflection is R and the negative deflection after R is S

۲٦
QRS complex

ST segment
• Represent complete depolarization of ventricles and beginning of repolarization
• Should not be elevated more then 1mm or depressed more than 0.5 mm of the baseline
• Elevation of depression of ST segment usually indicate CAD

ST Depression & Elevation
Measure: 2 mm beyond QRS Significant: 1 mm limb leads or 2 mm chest
Infarction Vasospastic angina Pericarditis
Measure: 2 mm beyond QRS Significant: 1 mm Ischemia Hypothermia Hypokalemia Tachycardia Subendocardial infarct Reciprocal ST elevation Ventricular Hypertrophy Bundle branch block Digitalis
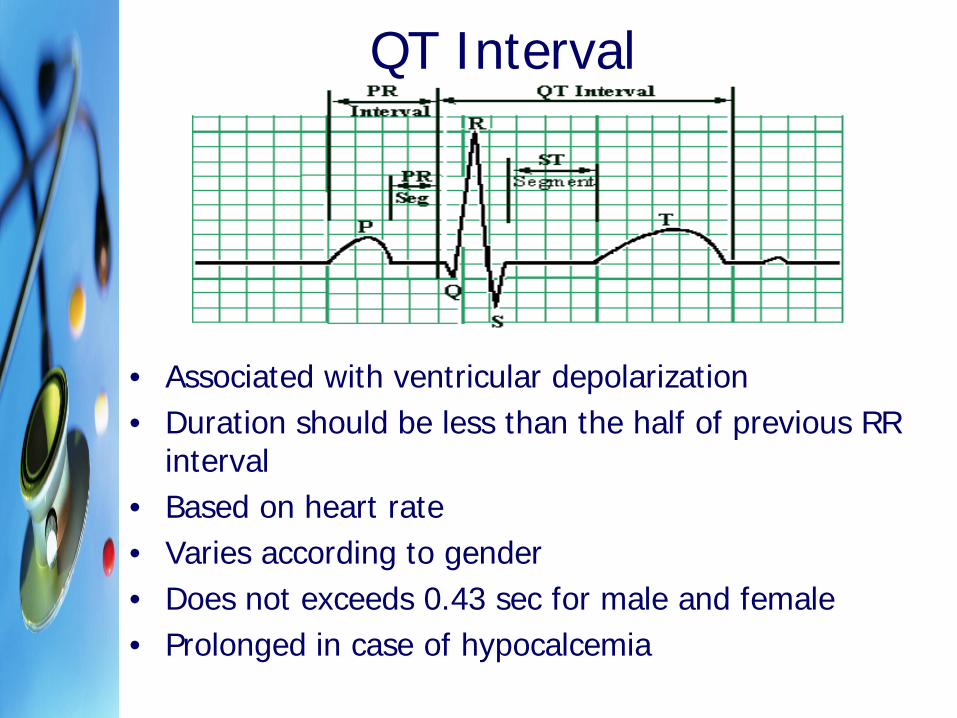
QT Interval
• Associated with ventricular depolarization • Duration should be less than the half of previous RR
interval • Based on heart rate • Varies according to gender • Does not exceeds 0.43 sec for male and female • Prolonged in case of hypocalcemia

QT Interval
• The duration of the QT interval is 0.56 second. This prolongation is due to hypocalcemia
• The tent-shaped T waves are the result of hyperkalemia (6.7 mEq/L).

T wave
• Associated with ventricular repolarization • Positive in leads I, II, aVL, aVF, V3, V6 and
negative in aVR • May be positive or inverted in V1 • Inverted T wave in the positive leads indicate
ischemic changes

U wave
• Associated with ventricular repolarization • Many times it is not seen because of low
electrical voltage • May be elevated in hypokalemia or
inverted CAD and hypertension


What do you see???
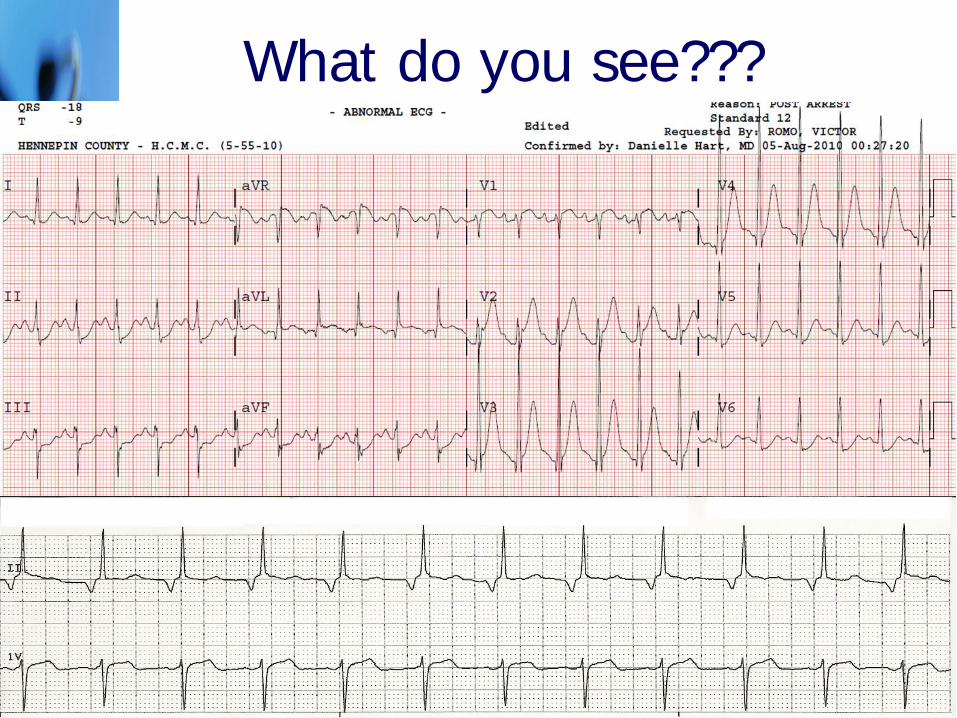
What do you see???
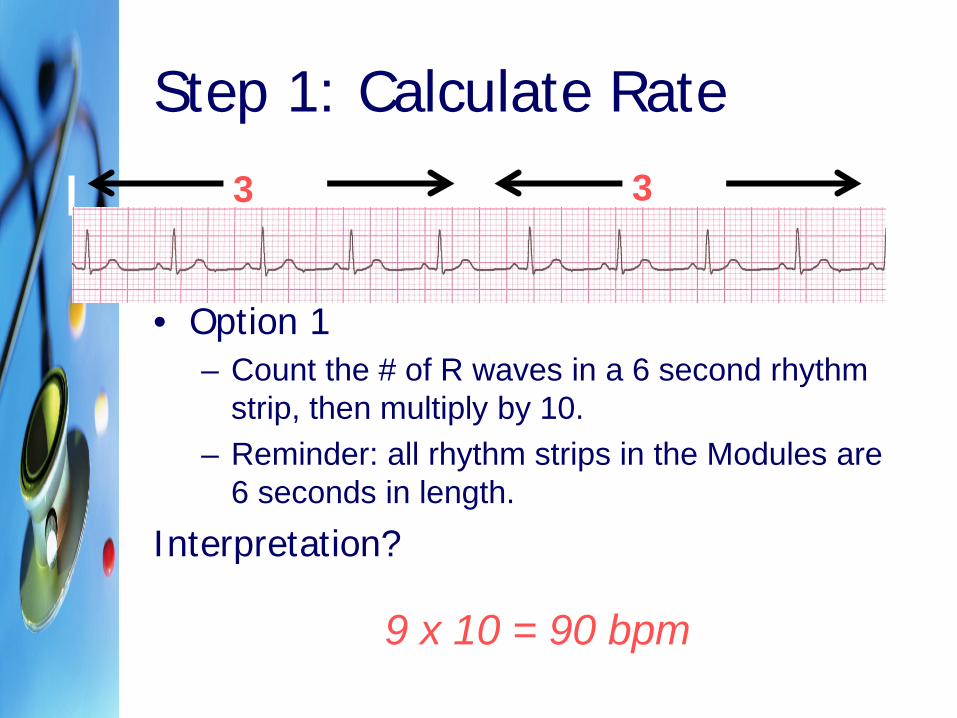
Step 1: Calculate Rate
• Option 1 – Count the # of R waves in a 6 second rhythm
strip, then multiply by 10. – Reminder: all rhythm strips in the Modules are
6 seconds in length.
Interpretation?
9 x 10 = 90 bpm
3 sec
3 sec

Step 1: Calculate Rate
• Option 2 – Find a R wave that lands on a bold line. – Count the # of large boxes to the next R wave.
If the second R wave is 1 large box away the rate is 300, 2 boxes - 150, 3 boxes - 100, 4 boxes - 75, etc. (cont)
R wave

Hear Rate
• Remember the sequence: 300, 150, 100, 75, 60, 50 (for regular rhythm)
• Count QRS in 6 sec and multiply by 10 (i.e., 30 large squares)

Quiz

Determine regularity
• Look at the R-R distances (using a caliper or markings on a pen or paper).
• Regular (are they equidistant apart)? Occasionally irregular? Regularly irregular? Irregularly irregular?
Interpretation? Regular
R R
Related Documents