SSSAJ: Volume 71: Number 3 • May–June 2007 1003 Support for this project was provided by USDA-CSREES (2004-51130- 02248), South Dakota Corn Utilization Council, and USDA-ARS. Soil Sci. Soc. Am. J. 71:1003–1009 doi:10.2136/sssaj2006.0193 Received 19 May 2006. *Corresponding author ([email protected]). © Soil Science Society of America 677 S. Segoe Rd. Madison WI 53711 USA All rights reserved. No part of this periodical may be reproduced or transmitted in any form or by any means, electronic or mechanical, including photocopying, recording, or any information storage and retrieval system, without permission in writing from the publisher. Permission for printing and for reprinting the material contained herein has been obtained by the publisher. T o minimize erosion and improve long-term sustainability, SOC must be maintained. Soil organic C maintenance experiments typically rely on measuring nonisotopic changes in SOC with time and using differences in 13 C isotopic dis- crimination in C 3 and C 4 plants to quantify C transfers across trophic levels. The nonisotopic approach to estimate SOC maintenance requirements is based on the equation ( ) NHC e a SOC e NHC 1 SOC NHC SOC dSOC d k k t k = + [1] where NHC a is unharvested biomass C returned to the soil, SOC e is soil organic C at the equilibrium point, k SOC is the mineralization rate of soil organic C, and k NHC is the mineral- ization rate of unharvested C (Clay et al., 2006). Maintenance rates using Eq. [1] are calculated by: (i) defining NHC/(SOC at the beginning of the experiment) as y and (dSOC/dt) as x; (ii) fitting the data to a zero-order rate equation; and (iii) mul- tiplying SOC times the y intercept. Sensitivity analysis of the nonisotopic approach showed that to accurately determine C budgets and maintenance rates, accurate estimates of below- ground biomass were needed (Clay et al., 2006). The 13 C natural abundance method for estimating C budgets has been used in systems where plants growing in the soil have different δ 13 C values than the soil. This approach is based on several premises. First, plants with different pho- tosynthetic pathways have different 13 C/ 12 C isotopic ratios. Second, biological discrimination during the mineralization process is insignificant when compared with the amount of SOIL & WATER MANAGEMENT & CONSERVATION Carbon-13 Fractionation of Relic Soil Organic Carbon during Mineralization Effects Calculated Half-Lives D. E. Clay* Plant Science Dep. South Dakota State Univ. Brookings, SD 57007 C. E. Clapp USDA-ARS Dep. of Soil, Water, and Climate Univ. of Minnesota St. Paul, MN 55108 C. Reese Plant Science Dep. South Dakota State Univ. Brookings, SD 57007 Z. Liu Former Research Associate at South Dakota State Univ. C. G. Carlson H. Woodard A. Bly Plant Science Dep. South Dakota State Univ. Brookings, SD 57007 The 13 C natural abundance approach for determining soil organic C (SOC) stability and turn- over has been used to determine SOC mineralization kinetics. These calculations generally assume that 13 C fractionation during relic SOC and unharvested biomass mineralization is insignificant. The objective of this study was to determine the impact of this assumption on calculated relic SOC half-lives. Study sites were located in Minnesota and South Dakota. At the Minnesota site, SOC contained in the surface 30 cm of soil in a fallowed area decreased from 90.8 to 73.2 Mg ha −1 during a 22-yr period. Associated with this decrease was a 0.72‰ increase in the soil δ 13 C values (from −18.97 to −18.25‰). Based on these values, the Rayleigh fractionation constant (ε) of relic SOC was −3.45‰. At the South Dakota site, SOC decreased 10% (2.8 ± 1.8 g kg −1 ) and δ 13 C increased 3.2% (0.548 ± 0.332‰) during a 5-yr period. The Rayleigh fractionation constant for this experiment was −6.94‰ (±4.74‰). In a separate experiment, the δ 13 C value of corn (Zea mays L.) and soybean [Glycine max (L.) Merr.] residue remained unchanged after 4 mo. The impact of 13 C enrichment during relic C mineralization on calculated C budgets depends on the type of residue returned to the soil. A simulation study showed that for systems where C 4 residues are returned to soil derived from C 3 and C 4 plants, not considering 13 C enrichment during relic SOC mineralization will result in underestimating relic SOC half-lives and overestimating the contribution of fresh C 4 bio- mass in the SOC. The effect of 13 C enrichment during relic SOC and unharvested biomass mineralization had cumulative impacts on C budgets and did not cancel each other out. The reverse was true for C 3 biomass. To minimize these errors, SOC maintenance rate experiments should measure 13 C enrichment during relic SOC and unharvested biomass mineralization. Abbreviations: NHC a , the amount of non-harvested C applied; PCR, plant biomass C returned to soil; PCR incorp , new biomass C incorporated into SOC; SOC, soil organic carbon; SOC retained , the amount of soil organic carbon retained in soil after mineralization; SOC final , soil organic carbon contained in soil at the end of the experiment; SOC initial , soil organic carbon at the beginning of the experiment; SOC lost , the amount of organic C lost; δ 13 C soil final , δ 13 C value of soil at the end of the experiment; δ 13 C PCR , δ 13 C value of plant material remaining in soil after mineralization; δ 13 C SOC retained , δ 13 C of soil organic carbon at the beginning of the experiment that is retained in the soil after mineralization; ε, Rayleigh fractionation coefficient. Published online May 16, 2007

Welcome message from author
This document is posted to help you gain knowledge. Please leave a comment to let me know what you think about it! Share it to your friends and learn new things together.
Transcript
SSSAJ: Volume 71: Number 3 • May –June 2007 1003
Support for this project was provided by USDA-CSREES (2004-51130-02248), South Dakota Corn Utilization Council, and USDA-ARS.
Soil Sci. Soc. Am. J. 71:1003–1009doi:10.2136/sssaj2006.0193Received 19 May 2006.*Corresponding author ([email protected]).© Soil Science Society of America677 S. Segoe Rd. Madison WI 53711 USAAll rights reserved. No part of this periodical may be reproduced or transmitted in any form or by any means, electronic or mechanical, including photocopying, recording, or any information storage and retrieval system, without permission in writing from the publisher. Permission for printing and for reprinting the material contained herein has been obtained by the publisher.
To minimize erosion and improve long-term sustainability, SOC must be maintained. Soil organic C maintenance
experiments typically rely on measuring nonisotopic changes in SOC with time and using differences in 13C isotopic dis-crimination in C3 and C4 plants to quantify C transfers across trophic levels. The nonisotopic approach to estimate SOC maintenance requirements is based on the equation
( )NHC ea SOC
e NHC
1 SOCNHCSOC dSOC d
k kt k
= + [1]
where NHCa is unharvested biomass C returned to the soil, SOCe is soil organic C at the equilibrium point, kSOC is the mineralization rate of soil organic C, and kNHC is the mineral-ization rate of unharvested C (Clay et al., 2006). Maintenance rates using Eq. [1] are calculated by: (i) defi ning NHC/(SOC at the beginning of the experiment) as y and (dSOC/dt) as x; (ii) fi tting the data to a zero-order rate equation; and (iii) mul-tiplying SOC times the y intercept. Sensitivity analysis of the nonisotopic approach showed that to accurately determine C budgets and maintenance rates, accurate estimates of below-ground biomass were needed (Clay et al., 2006).
The 13C natural abundance method for estimating C budgets has been used in systems where plants growing in the soil have different δ13C values than the soil. This approach is based on several premises. First, plants with different pho-tosynthetic pathways have different 13C/12C isotopic ratios. Second, biological discrimination during the mineralization process is insignifi cant when compared with the amount of
SOIL &
WA
TER M
AN
AG
EMEN
T & C
ON
SERV
ATIO
N
Carbon-13 Fractionation of Relic Soil Organic Carbon during Mineralization Effects Calculated Half-LivesD. E. Clay* Plant Science Dep.South Dakota State Univ. Brookings, SD 57007
C. E. Clapp USDA-ARS Dep. of Soil, Water, and Climate Univ. of Minnesota St. Paul, MN 55108
C. ReesePlant Science Dep.South Dakota State Univ. Brookings, SD 57007
Z. Liu Former Research Associate at South Dakota State Univ.
C. G. Carlson H. WoodardA. BlyPlant Science Dep. South Dakota State Univ. Brookings, SD 57007
The 13C natural abundance approach for determining soil organic C (SOC) stability and turn-over has been used to determine SOC mineralization kinetics. These calculations generally assume that 13C fractionation during relic SOC and unharvested biomass mineralization is insignifi cant. The objective of this study was to determine the impact of this assumption on calculated relic SOC half-lives. Study sites were located in Minnesota and South Dakota. At the Minnesota site, SOC contained in the surface 30 cm of soil in a fallowed area decreased from 90.8 to 73.2 Mg ha−1 during a 22-yr period. Associated with this decrease was a 0.72‰ increase in the soil δ13C values (from −18.97 to −18.25‰). Based on these values, the Rayleigh fractionation constant (ε) of relic SOC was −3.45‰. At the South Dakota site, SOC decreased 10% (2.8 ± 1.8 g kg−1) and δ13C increased 3.2% (0.548 ± 0.332‰) during a 5-yr period. The Rayleigh fractionation constant for this experiment was −6.94‰ (±4.74‰). In a separate experiment, the δ13C value of corn (Zea mays L.) and soybean [Glycine max (L.) Merr.] residue remained unchanged after 4 mo. The impact of 13C enrichment during relic C mineralization on calculated C budgets depends on the type of residue returned to the soil. A simulation study showed that for systems where C4 residues are returned to soil derived from C3 and C4 plants, not considering 13C enrichment during relic SOC mineralization will result in underestimating relic SOC half-lives and overestimating the contribution of fresh C4 bio-mass in the SOC. The effect of 13C enrichment during relic SOC and unharvested biomass mineralization had cumulative impacts on C budgets and did not cancel each other out. The reverse was true for C3 biomass. To minimize these errors, SOC maintenance rate experiments should measure 13C enrichment during relic SOC and unharvested biomass mineralization.
Abbreviations: NHCa, the amount of non-harvested C applied; PCR, plant biomass C returned to soil; PCRincorp, new biomass C incorporated into SOC; SOC, soil organic carbon; SOCretained, the amount of soil organic carbon retained in soil after mineralization; SOCfi nal, soil organic carbon contained in soil at the end of the experiment; SOCinitial, soil organic carbon at the beginning of the experiment; SOClost, the amount of organic C lost; δ13Csoil fi nal, δ
13C value of soil at the end of the experiment; δ13CPCR, δ13C value of plant material remaining in soil after mineralization; δ13CSOC retained, δ13C of soil organic carbon at the beginning of the experiment that is retained in the soil after mineralization; ε, Rayleigh fractionation coeffi cient.
Published online May 16, 2007
1004 SSSAJ: Volume 71: Number 3 • May –June 2007
discrimination that occurs during photosynthesis (Balesdent et al., 1988). This study investigated the ramifi cations associ-ated with the second assumption. The objectives of this study were to: (i) quantify the amount of 13C isotopic discrimina-tion that occurs during relic SOC and fresh biomass mineral-ization; (ii) propose a technique for considering 13C isotopic discrimination during relic and fresh biomass mineralization on C budgets and calculated half-lives; and (iii) determine the potential impacts of 13C fractionation during relic SOC and unharvested biomass mineralization on calculated soil C bud-gets and SOC half-lives.
MATERIALS AND METHODSField Experiment
Carbon-13 Isotopic Fractionation during MineralizationResearch sites were located in Minnesota and South Dakota.
These sites were routinely cultivated to prevent plant growth. The Minnesota data were previously reported in Clapp et al. (2000) and Dolan et al. (2006). The soil was a Waukegan silt loam (fi ne-silty over sandy or sandy-skeletal, mixed, superactive, mesic Typic Hapludoll), and the parent materials were a silt loam loess cap (50–80 cm thick) over neutral to calcareous glacial outwash sand and gravel. Initial soil samples (0–15- and 15–30-cm depths) were collected in 1980 (Clay et al., 1989). Duirng the 22 yr of the study, clean tillage was used to prevent plant growth in the alleyways that were approximately 6 m wide. The north and south end of the alleyways were sampled in 1993 (Clapp et al., 2000) and 2002 (Dolan et al., 2006). Bulk densities were determined as reported by Clapp et al. (2000) and Dolan et al. (2006) when soil samples were collected. Composite soil samples were passed through a 2-mm sieve, stones were removed, and roots and residue returned to the soil samples. Ground samples were ball-milled and duplicate samples analyzed on an elemental analyzer (Carlo Erba, Model NA 1500, Milan, Italy) and stable isotope ratio mass spec-trometer (Fisons Optima Model, Fisons Middlewich, UK). The δ13C values of soil samples were determined using the equation
sample reference13
reference
C 1000R R
R
−δ =
[2]
where R is the ratio of the heavy to light isotopes in the sample and stan-dard (PDB, R = 0.0112372) (Clapp et al., 2000). The working standards were urea (δ13C value of −18.2‰) and soil (−17.6‰). The CV for the δ13C values was 2.8%. Soil organic C on a volume basis was calculated with the measured mass fraction of C and measured bulk density.
Soil at the South Dakota site was a Divide loam (fi ne-loamy over sandy or sandy-skeletal, mixed, superactive, mesic, Pachic Calciaquoll). The site is located at 44°21′ N, 96°49′ W. The soil pH (1:1 water) was ?7.5. Soil samples from the 0- to 7.5- and 7.5- to 15-m depths were collected from six different sites in 2000 and 2005. Each sample consisted of 10 individual cores. Samples did not visibly react with 0.5 M HCl. Samples were dried, ground (2 mm), and ana-lyzed for total C and δ13C on a Europa 20–20 ratio mass spectrometer (SerCon, Crewe, UK). Each sample was analyzed in duplicate. The working standard was wheat (Triticum aestivum L.) fl ower, which had a δ13C of −24.64‰. The standard deviation of the working stan-dards were generally <1‰. Means and 90% confi dence intervals for samples collected in 2000 and 2005 were determined. To determine changes in total C and δ13C during the 5-yr period, a paired t-test (P = 0.05) was used. In this analysis, the values of the samples col-lected from the same area at the two dates were subtracted from each
other and the mean difference was tested to determine if it was dif-ferent from zero. The 95% confi dence intervals for individual means were determined.
To assess 13C discrimination during corn and soybean residue mineralization, 50 g of dry material, contained in residue bags, was placed on the soil surface. Ten bags of each residue type were used in the study. The δ13C value of the initial corn and soybean residue was −11.80 and −27.20‰, respectively. The C/N ratio for the initial corn and soybean residue was approximately 42:1 and 48:1, respectively. Bags were placed in the fi eld on 17 June 2005 and removed on 25 Oct. 2005. After removing any soil sticking to the residue bag sur-face, the bags were dried and weighed, gently rinsed with water over a 0.152-mm (100 mesh) screen, dried, ground, and analyzed for δ13C, total C, and total N. Means and 95% confi dence intervals for total biomass, total C, C/N ratio, and δ13C were determined. A paired t-test (P = 0.05) was used to assess changes in δ13C with time.
Determining Carbon BudgetsThe relic C half-life calculations were based on the following
mass balance equations:
( ) ( )13 13incorp PCR retained SOCretained13
soil finalincorp retained
PCR C SOC CC
PCR SOC
δ + δδ =
+ [3]
final incorp retainedSOC PCR SOC= + [4]
initial retained lostSOC SOC SOC= + [5]
where SOCinitial is the SOC in the soil at the beginning of the experi-ment, SOClost is the amount of SOC mineralized, SOCfi nal is SOC at the end of the study, δ13Csoil fi nal is the δ13C value of SOC when the experiment was completed, PCRincorp is the plant C retained in the soil that was incorporated into SOC, δ13CPCR is the δ13C value of the plant material retained in the soil after mineralization, SOCretained is the amount of relic C (SOCinitial) retained in the soil at the end of the study, and δ13CSOC retained is the associated δ13C value. By simultane-ously solving Eq. [3] and [4], the equations
( )13 13final soil final PCR
retained 13 13SOCretained PCR
SOC C CSOC
C C
δ −δ=
δ −δ [6]
( )13 13final soil final SOCretained
incorp 13 13PCR SOCretained
SOC C CPCR
C C
δ −δ=
δ −δ [7]
were derived. If it is assumed that 13C fractionation during SOC and PCR mineralization is minimal, i.e., δ13CSOC retained = δ13Csoil initial and δ13CPCR = δ13Cplant, then Eq. [7] can be simplifi ed into the expression
( )13 13final soil final soil initial
incorp 13 13plant soil initial
SOC C CPCR
C C
δ −δ=
δ −δ [8]
This equation can be solved if soil and plant material collected at time zero (δ13Csoil initial and δ13Cplant) and soil collected at the end of the
SSSAJ: Volume 71: Number 3 • May –June 2007 1005
experiment are analyzed for total C and δ13C (SOCfi nal and δ13Csoil fi nal). Equation [8] can be reorganized into
13 13soil final soil initialincorp
13 13final plant soil initial
C CPCRSOC C C
δ −δ=
δ −δ [9]
where the ratio between PCRincorp and SOCfi nal was the relative propor-tion (p) of new C incorporated in SOC (p = PCRincorp/SOCfi nal). By replacing δ13Csoil initial with δC3, δ13Cplant with δC4, and δ13Csoil fi nal with δ, the equations
C3
C4 C3
p δ−δ=
δ −δ [10]
( )C4 C31p pδ= δ − − δ [11]
reported in Wolf et al. (1994) were derived. This derivation shows that Eq. [8, 9, 10, 11] are based on the assumption that 13C discrimina-tion during SOC and unharvested biomass mineralization is minimal. Equations [8, 9, 10, 11] have been used in numerous studies (Balesdent et al.,1988; Follett et al., 1997; Huggins et al., 1998; Collins et al., 1999; Clapp et al., 2000; Allmaras et al., 2004; Clay et al., 2005; Zach et al., 2006). Equation [6] contains three values (SOCretained, δ13CPCR, and δ13CSOC retained) that are unknown and therefore to derive a solution for Eq. [6], three independent equations must be solved simultaneously. The fi rst two are Eq. [5] and [6]. The third is the Rayleigh equation:
( )13 13SOCretained soil initial SOC retained initialC C ln SOC SOCδ = δ + ε [12]
where ε is the Rayleigh fractionation constant (Balesdent and Mariotti, 1996). This equation can also be used to calculate the δ13C value of the unharvested biomass after mineralization (δ13CPCR). The Rayleigh equation has been used to explain isotopic fractionation in a variety of biological systems (Balesdent and Mariotti, 1996; Accoe et al., 2002; Fukada et al., 2003; Spence et al., 2005).
To solve Eq. [5, 6, 12], an iterative approach was used. After stabil-ity in the individual C pool sizes, fi rst-order mineralization rate constant (k), half-lives of SOC, and residence times were determined using
( )remaining initialln SOC SOC
number of yearsk=− [13]
( )half-life
ln 0.5t
k= [14]
residence time 1 k= [15]
Potential Impacts of Carbon-13 Discrimination on Half-Life Calculations
Three different systems were used in this analysis. For Model System 1, corn (a C4 plant) was grown in soil derived from C3 and C4 plants. For this system, the values for SOCsoil initial, SOC soil fi nal, δ
13Csoil initial, δ13Csoil fi nal, and δ13Cplant were 96.25 Mg ha–1, 91.4 Mg ha–1, −19.06‰, −18.754‰, and −12.0‰, respectively. For Model System 2, soybean (a C3 plant) plants were sown into soil derived from C3 and C4 plants. In this sys-tem, the values for SOCsoil initial, SOCsoil fi nal, δ
13Csoil initial, δ13Csoil fi nal,
and δ13Cplant were 96.25 Mg ha–1, 91.4 Mg ha–1, −19.06‰, −19.4‰, and −28.0‰, respectively. For Systems 1 and 2, the impact on C bud-gets and half-lives of 13C isotopic discrimination (six hypothetical Rayleigh fractionation constants, −3.52, −2.14, −1.24, 0, 1.24, and 2.40‰) during fresh organic matter and relic SOC mineralization was determined for a 13-yr period. For these calculations, it was assumed that 65% of the unhar-vested fresh biomass was mineralized.
In Model System 3, the potential impact on half-lives of land-scape position and 13C fractionation during mineralization was deter-mined. Data previously reported by Clay et al. (2006) were used in this assessment. Soil organic C budgets were developed for SOC relic ε values of 0 and −2.52‰. Clay et al. (2006) reported C budgets for this fi eld when the Rayleigh fractionation constant was assumed to be 0‰. This scenario investigates the ramifi cation of 13C fractionation (ε = −2.52‰) on these half-lives. As discussed in Clay et al. (2006), >600 soil samples from the 0- to 15-cm soil depth were collected from a 65-ha fi eld located at 44°10′ N and 96°37′ W. The samples were collected from a 30- by 30-m offset grid in May 1995 and between May and June in 2003. Each sample was a composite that contained 15 individual 1.7-cm-diameter cores collected every 11.4 cm along a transect. Soil samples were air dried (35°C), ground, sieved (2-mm sieve), and analyzed for total N, total C, δ15N, and 13C discrimina-tion (Δ) on a ratio mass spectrometer (Clay et al., 2003). Total C was corrected for inorganic C (Loeppert and Suarez, 1996). The soil samples from each year were aggregated to a common 40- by 40-m grid cell. The value of a grid cell was calculated as the average value of all the samples contained within a cell. A grid cell SOC value was the difference between inorganic (measured on the 1995 data set) and total C. As discussed in Clay et al. (2006), the grid cells were separated into the elevation zones <523.4, 523.4 to 527.3, 527.3 to 529.74, 529.74 to 532.2, and 532.2 to 534.30 m, which were approximately footslopes, toeslopes, backslopes, shoulder, and summit areas.
RESULTS AND DISCUSSIONCarbon-13 Discrimination during Relic Carbon Mineralization
At the Minnesota site, relic SOC values in the surface 30 cm were 90.8, 77.9, and 73.2 Mg ha–1 in 1980, 1993, and 2002, respectively. These values show that in areas where plant growth was prevented, SOC decreased 19.4% during 22 yr. Based on changes in total C during 22 yr, the relic SOC mineraliza-tion k value was 0.0098 and the half-life was 70.7 yr. The relic δ13C SOC values at 0, 13, and 22 yr were −18.97, −18.37, and −18.25‰. The Rayleigh fraction coeffi cients (ε) from 1980 to 1993 and from 1993 to 2002 were −3.91 and −1.92‰, respec-tively. During the 22 yr of the experiment, ε averaged −3.45‰. The value from 1993 to 2002 was similar to the long-term ε value of −1.71‰ reported for the Versailles experiment (Balesdent and Mariotti, 1996).
At the South Dakota research site, total soil C in the 0- to 15-cm depth averaged 26.8 g kg–1 (±0.53) in 2000 and 24.0 g kg–1 (±0.62) in 2005. Net loss of SOC was 2.8 g kg–1 (±1.8) or 10.4% during 5 yr. Based on these values, the half-life was 31.4 yr. At this site, soil δ13C averaged −17.19‰ (±0.95) in 2000 and −16.64 ‰ (±1.14) in 2005. The Rayleigh fractionation constant for this soil was −6.94‰ (±4.74). Findings from South Dakota and Minnesota suggest that 13C enrichment during relic SOC mineralization occurred and that the Rayleigh equation could be used to describe this enrichment process. Nedelhoffer and Fry (1988) had similar
1006 SSSAJ: Volume 71: Number 3 • May –June 2007
results and reported that the δ13C value of bulk soil organic mat-ter from forest mineral soils increased up to 0.5‰ during a 600-d period. Balesdent and Mariotti (1996) reported that, during a 60-yr period in an experiment initiated in 1928 at Versailles, France, relic SOC decreased 60% and δ13C increased 1.6‰ at sites kept free of vegetation. Ueda et al. (2005) reported that δ13C values increased with depth. The enrichment of relic C with depth and time has been attributed to respired CO2 from soil microorganisms being depleted in 13C (DeNiro and Epstein, 1978; Šantrůčková et al., 2000).
Carbon-13 Fractionation during Fresh Plant Biomass Mineralization
A 4-mo in-fi eld incubation of corn and soybean residues was conducted to determine the fraction constant associated with fresh biomass. During the 4 mo, 31.5 (±1.94) and 22.8 (±0.44)% of 50 g of corn (C4) and soybean (C3) residues placed on the soil surface were mineralized, respectively. The mineral-ization of this material did not result in a measurable change in the δ13C values of the corn and soybean residues. During the 4 mo, the corn residue C/N ratio increased from 42 to 57 and the C/N ratio in the soybean residue increased from 48 to 62. This increase was attributed to preferential mineralization of com-pounds with low C/N ratios. Others have also reported that 13C enrichment during fresh plant biomass mineralization is insig-
nifi cant. Balesdent and Mariotti (1996) summarized the unpub-lished work of M. Linères (1996, INRA, Unite Agronomie, Laon, France), in which the δ13C value of the initial corn bio-mass did not change after 85% of the biomass had been mineral-ized. Cleveland et al. (2004) reported that the δ13C signatures of dissolved organic matter did not change during decomposi-tion. Griebler et al. (2004) reported that 13C fractionation of trichlorobenzene during mineralization was not observed under aerobic conditions but was observed under anaerobic condi-tions. Boutton (1996), in a review of isotopic ratios of SOC as indicators of change, stated that, “Direct measurements indicate that the δ13CPDB of plant tissue remains relatively constant dur-ing the early stages of decomposition (1–7 yr).” Fernandez and Cadisch (2003) reported that, with time, fractionation may even out, with microbes discriminating against 13C (relative to the initial label) during early stages followed by a period of time when microbes discriminate against 12C (relative to the initial label). The apparent lack of 13C enrichment during the early stages of unharvested biomass mineralization may result from two independent processes cancelling each other out. The fi rst factor is that many consumers of SOC tend to accumulate 13C. The second factor is that materials that are resistant to micro-bial degradation (waxes and lignin) tend to be depleted in 13C (Boutton, 1996; Huang et al., 1999; Conte et al., 2003).
Potential Impacts of Carbon-13 Discrimination Impacts on Half-LivesEffects of C3 and C4 Residue
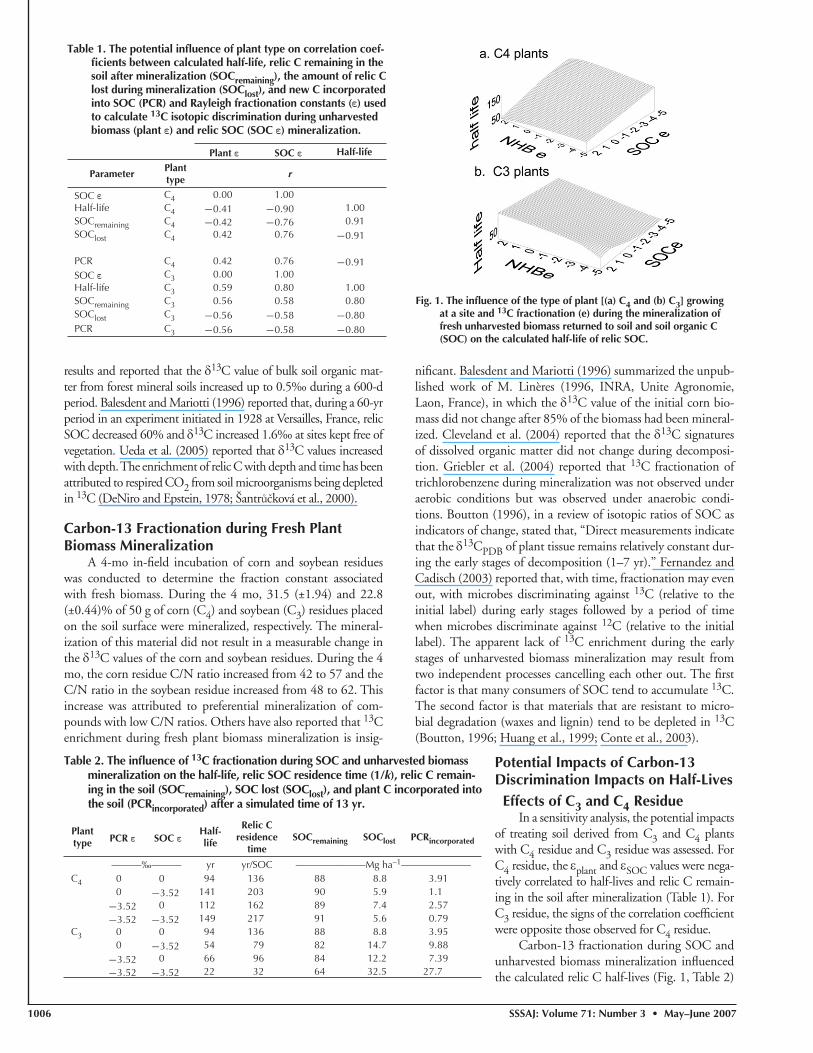
In a sensitivity analysis, the potential impacts of treating soil derived from C3 and C4 plants with C4 residue and C3 residue was assessed. For C4 residue, the εplant and εSOC values were nega-tively correlated to half-lives and relic C remain-ing in the soil after mineralization (Table 1). For C3 residue, the signs of the correlation coeffi cient were opposite those observed for C4 residue.
Carbon-13 fractionation during SOC and unharvested biomass mineralization infl uenced the calculated relic C half-lives (Fig. 1, Table 2)
Table 2. The infl uence of 13C fractionation during SOC and unharvested biomass mineralization on the half-life, relic SOC residence time (1/k), relic C remain-ing in the soil (SOCremaining), SOC lost (SOClost), and plant C incorporated into the soil (PCRincorporated) after a simulated time of 13 yr.
Planttype PCR ε SOC ε
Half-life
Relic Cresidence
timeSOCremaining SOClost PCRincorporated
———‰——— yr yr/SOC ———————Mg ha–1———————C4 0 0 94 136 88 8.8 3.91
0 −3.52 141 203 90 5.9 1.1−3.52 0 112 162 89 7.4 2.57−3.52 −3.52 149 217 91 5.6 0.79
C3 0 0 94 136 88 8.8 3.950 −3.52 54 79 82 14.7 9.88
−3.52 0 66 96 84 12.2 7.39−3.52 −3.52 22 32 64 32.5 27.7
Table 1. The potential infl uence of plant type on correlation coef-fi cients between calculated half-life, relic C remaining in the soil after mineralization (SOCremaining), the amount of relic C lost during mineralization (SOClost), and new C incorporated into SOC (PCR) and Rayleigh fractionation constants (ε) used to calculate 13C isotopic discrimination during unharvested biomass (plant ε) and relic SOC (SOC ε) mineralization.
Plant ε SOC ε Half-life
ParameterPlant type r
SOC ε C4 0.00 1.00Half-life C4 −0.41 −0.90 1.00SOCremaining C4 −0.42 −0.76 0.91SOClost C4 0.42 0.76 −0.91
PCR C4 0.42 0.76 −0.91SOC ε C3 0.00 1.00Half-life C3 0.59 0.80 1.00SOCremaining C3 0.56 0.58 0.80SOClost C3 −0.56 −0.58 −0.80PCR C3 −0.56 −0.58 −0.80
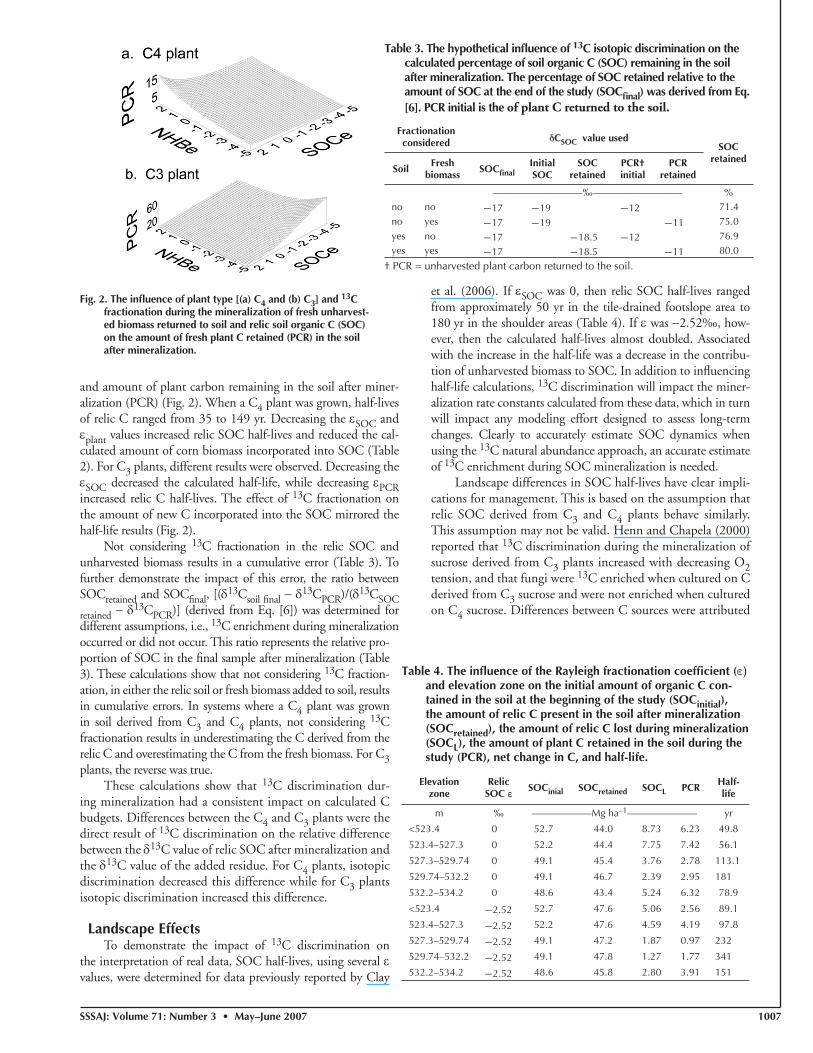
Fig. 1. The infl uence of the type of plant [(a) C4 and (b) C3] growing at a site and 13C fractionation (e) during the mineralization of fresh unharvested biomass returned to soil and soil organic C (SOC) on the calculated half-life of relic SOC.
SSSAJ: Volume 71: Number 3 • May –June 2007 1007
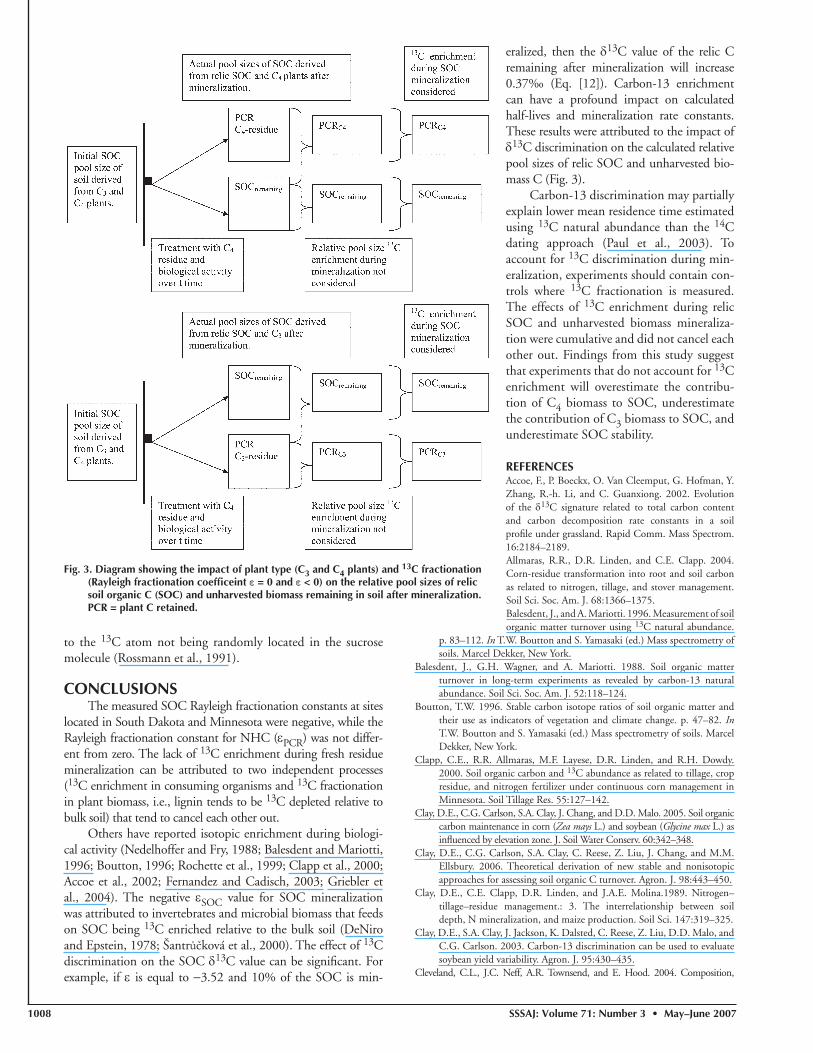
and amount of plant carbon remaining in the soil after miner-alization (PCR) (Fig. 2). When a C4 plant was grown, half-lives of relic C ranged from 35 to 149 yr. Decreasing the εSOC and εplant values increased relic SOC half-lives and reduced the cal-culated amount of corn biomass incorporated into SOC (Table 2). For C3 plants, different results were observed. Decreasing the εSOC decreased the calculated half-life, while decreasing εPCR increased relic C half-lives. The effect of 13C fractionation on the amount of new C incorporated into the SOC mirrored the half-life results (Fig. 2).
Not considering 13C fractionation in the relic SOC and unharvested biomass results in a cumulative error (Table 3). To further demonstrate the impact of this error, the ratio between SOCretained and SOCfi nal, [(δ
13Csoil fi nal − δ13CPCR)/(δ13CSOC
retained − δ13CPCR)] (derived from Eq. [6]) was determined for different assumptions, i.e., 13C enrichment during mineralization occurred or did not occur. This ratio represents the relative pro-portion of SOC in the fi nal sample after mineralization (Table 3). These calculations show that not considering 13C fraction-ation, in either the relic soil or fresh biomass added to soil, results in cumulative errors. In systems where a C4 plant was grown in soil derived from C3 and C4 plants, not considering 13C fractionation results in underestimating the C derived from the relic C and overestimating the C from the fresh biomass. For C3 plants, the reverse was true.
These calculations show that 13C discrimination dur-ing mineralization had a consistent impact on calculated C budgets. Differences between the C4 and C3 plants were the direct result of 13C discrimination on the relative difference between the δ13C value of relic SOC after mineralization and the δ13C value of the added residue. For C4 plants, isotopic discrimination decreased this difference while for C3 plants isotopic discrimination increased this difference.
Landscape EffectsTo demonstrate the impact of 13C discrimination on
the interpretation of real data, SOC half-lives, using several ε values, were determined for data previously reported by Clay
et al. (2006). If εSOC was 0, then relic SOC half-lives ranged from approximately 50 yr in the tile-drained footslope area to 180 yr in the shoulder areas (Table 4). If ε was −2.52‰, how-ever, then the calculated half-lives almost doubled. Associated with the increase in the half-life was a decrease in the contribu-tion of unharvested biomass to SOC. In addition to infl uencing half-life calculations, 13C discrimination will impact the miner-alization rate constants calculated from these data, which in turn will impact any modeling effort designed to assess long-term changes. Clearly to accurately estimate SOC dynamics when using the 13C natural abundance approach, an accurate estimate of 13C enrichment during SOC mineralization is needed.
Landscape differences in SOC half-lives have clear impli-cations for management. This is based on the assumption that relic SOC derived from C3 and C4 plants behave similarly. This assumption may not be valid. Henn and Chapela (2000) reported that 13C discrimination during the mineralization of sucrose derived from C3 plants increased with decreasing O2 tension, and that fungi were 13C enriched when cultured on C derived from C3 sucrose and were not enriched when cultured on C4 sucrose. Differences between C sources were attributed
Table 3. The hypothetical infl uence of 13C isotopic discrimination on the calculated percentage of soil organic C (SOC) remaining in the soil after mineralization. The percentage of SOC retained relative to the amount of SOC at the end of the study (SOCfi nal) was derived from Eq. [6]. PCR initial is the of plant C returned to the soil.
Fractionation considered δCSOC value used
SOC retained
SoilFresh
biomassSOCfi nal
Initial SOC
SOC retained
PCR†initial
PCR retained
—————————‰————————— %no no −17 −19 −12 71.4no yes −17 −19 −11 75.0yes no −17 −18.5 −12 76.9yes yes −17 −18.5 −11 80.0
† PCR = unharvested plant carbon returned to the soil.
Fig. 2. The infl uence of plant type [(a) C4 and (b) C3] and 13C fractionation during the mineralization of fresh unharvest-ed biomass returned to soil and relic soil organic C (SOC) on the amount of fresh plant C retained (PCR) in the soil after mineralization.
Table 4. The infl uence of the Rayleigh fractionation coeffi cient (ε) and elevation zone on the initial amount of organic C con-tained in the soil at the beginning of the study (SOCinitial), the amount of relic C present in the soil after mineralization (SOCretained), the amount of relic C lost during mineralization (SOCL), the amount of plant C retained in the soil during the study (PCR), net change in C, and half-life.
Elevation zone
Relic SOC ε SOCinial SOCretained SOCL PCR
Half-life
m ‰ ——————Mg ha–1——————— yr
<523.4 0 52.7 44.0 8.73 6.23 49.8
523.4–527.3 0 52.2 44.4 7.75 7.42 56.1
527.3–529.74 0 49.1 45.4 3.76 2.78 113.1
529.74–532.2 0 49.1 46.7 2.39 2.95 181
532.2–534.2 0 48.6 43.4 5.24 6.32 78.9
<523.4 −2.52 52.7 47.6 5.06 2.56 89.1
523.4–527.3 −2.52 52.2 47.6 4.59 4.19 97.8
527.3–529.74 −2.52 49.1 47.2 1.87 0.97 232
529.74–532.2 −2.52 49.1 47.8 1.27 1.77 341
532.2–534.2 −2.52 48.6 45.8 2.80 3.91 151
1008 SSSAJ: Volume 71: Number 3 • May –June 2007
to the 13C atom not being randomly located in the sucrose molecule (Rossmann et al., 1991).
CONCLUSIONSThe measured SOC Rayleigh fractionation constants at sites
located in South Dakota and Minnesota were negative, while the Rayleigh fractionation constant for NHC (εPCR) was not differ-ent from zero. The lack of 13C enrichment during fresh residue mineralization can be attributed to two independent processes (13C enrichment in consuming organisms and 13C fractionation in plant biomass, i.e., lignin tends to be 13C depleted relative to bulk soil) that tend to cancel each other out.
Others have reported isotopic enrichment during biologi-cal activity (Nedelhoffer and Fry, 1988; Balesdent and Mariotti, 1996; Boutton, 1996; Rochette et al., 1999; Clapp et al., 2000; Accoe et al., 2002; Fernandez and Cadisch, 2003; Griebler et al., 2004). The negative εSOC value for SOC mineralization was attributed to invertebrates and microbial biomass that feeds on SOC being 13C enriched relative to the bulk soil (DeNiro and Epstein, 1978; Šantrůčková et al., 2000). The effect of 13C discrimination on the SOC δ13C value can be signifi cant. For example, if ε is equal to −3.52 and 10% of the SOC is min-
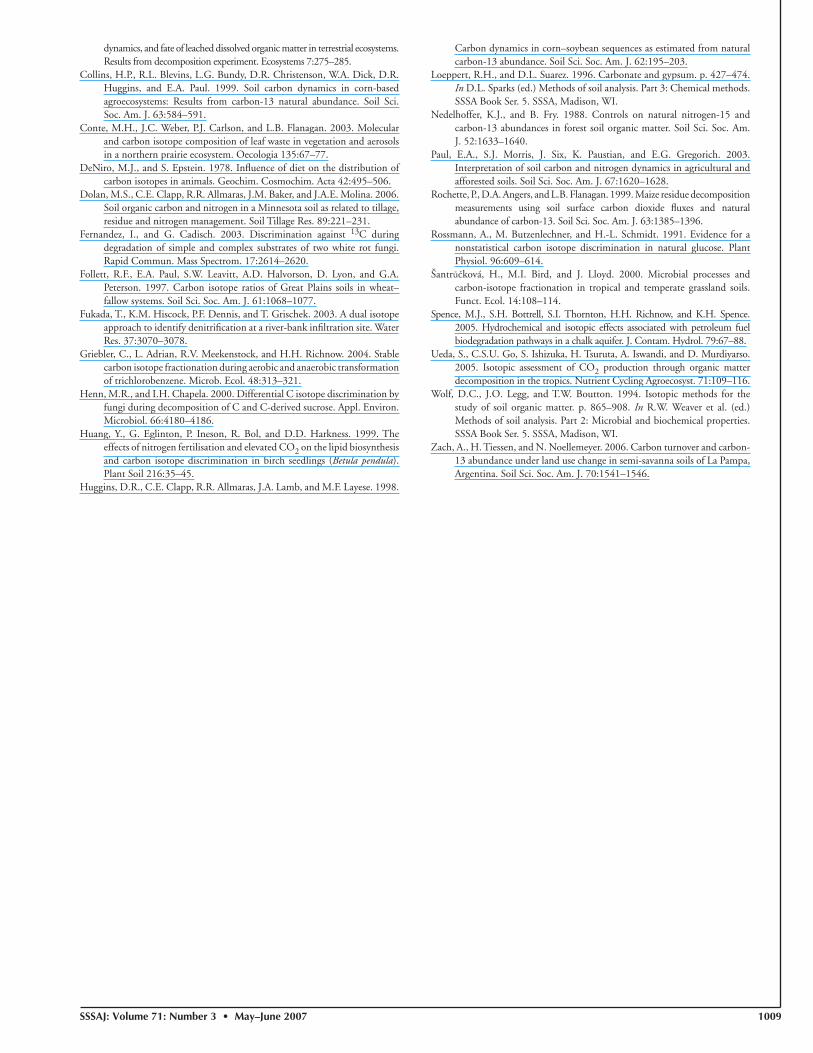
eralized, then the δ13C value of the relic C remaining after mineralization will increase 0.37‰ (Eq. [12]). Carbon-13 enrichment can have a profound impact on calculated half-lives and mineralization rate constants. These results were attributed to the impact of δ13C discrimination on the calculated relative pool sizes of relic SOC and unharvested bio-mass C (Fig. 3).
Carbon-13 discrimination may partially explain lower mean residence time estimated using 13C natural abundance than the 14C dating approach (Paul et al., 2003). To account for 13C discrimination during min-eralization, experiments should contain con-trols where 13C fractionation is measured. The effects of 13C enrichment during relic SOC and unharvested biomass mineraliza-tion were cumulative and did not cancel each other out. Findings from this study suggest that experiments that do not account for 13C enrichment will overestimate the contribu-tion of C4 biomass to SOC, underestimate the contribution of C3 biomass to SOC, and underestimate SOC stability.
REFERENCESAccoe, F., P. Boeckx, O. Van Cleemput, G. Hofman, Y. Zhang, R.-h. Li, and C. Guanxiong. 2002. Evolution of the δ13C signature related to total carbon content and carbon decomposition rate constants in a soil profi le under grassland. Rapid Comm. Mass Spectrom. 16:2184–2189.Allmaras, R.R., D.R. Linden, and C.E. Clapp. 2004. Corn-residue transformation into root and soil carbon as related to nitrogen, tillage, and stover management. Soil Sci. Soc. Am. J. 68:1366–1375.Balesdent, J., and A. Mariotti. 1996. Measurement of soil organic matter turnover using 13C natural abundance.
p. 83–112. In T.W. Boutton and S. Yamasaki (ed.) Mass spectrometry of soils. Marcel Dekker, New York.
Balesdent, J., G.H. Wagner, and A. Mariotti. 1988. Soil organic matter turnover in long-term experiments as revealed by carbon-13 natural abundance. Soil Sci. Soc. Am. J. 52:118–124.
Boutton, T.W. 1996. Stable carbon isotope ratios of soil organic matter and their use as indicators of vegetation and climate change. p. 47–82. In T.W. Boutton and S. Yamasaki (ed.) Mass spectrometry of soils. Marcel Dekker, New York.
Clapp, C.E., R.R. Allmaras, M.F. Layese, D.R. Linden, and R.H. Dowdy. 2000. Soil organic carbon and 13C abundance as related to tillage, crop residue, and nitrogen fertilizer under continuous corn management in Minnesota. Soil Tillage Res. 55:127–142.
Clay, D.E., C.G. Carlson, S.A. Clay, J. Chang, and D.D. Malo. 2005. Soil organic carbon maintenance in corn (Zea mays L.) and soybean (Glycine max L.) as infl uenced by elevation zone. J. Soil Water Conserv. 60:342–348.
Clay, D.E., C.G. Carlson, S.A. Clay, C. Reese, Z. Liu, J. Chang, and M.M. Ellsbury. 2006. Theoretical derivation of new stable and nonisotopic approaches for assessing soil organic C turnover. Agron. J. 98:443–450.
Clay, D.E., C.E. Clapp, D.R. Linden, and J.A.E. Molina.1989. Nitrogen–tillage–residue management.: 3. The interrelationship between soil depth, N mineralization, and maize production. Soil Sci. 147:319–325.
Clay, D.E., S.A. Clay, J. Jackson, K. Dalsted, C. Reese, Z. Liu, D.D. Malo, and C.G. Carlson. 2003. Carbon-13 discrimination can be used to evaluate soybean yield variability. Agron. J. 95:430–435.
Cleveland, C.L., J.C. Neff, A.R. Townsend, and E. Hood. 2004. Composition,
Fig. 3. Diagram showing the impact of plant type (C3 and C4 plants) and 13C fractionation (Rayleigh fractionation coeffi ceint ε = 0 and ε < 0) on the relative pool sizes of relic soil organic C (SOC) and unharvested biomass remaining in soil after mineralization. PCR = plant C retained.
SSSAJ: Volume 71: Number 3 • May –June 2007 1009
dynamics, and fate of leached dissolved organic matter in terrestrial ecosystems. Results from decomposition experiment. Ecosystems 7:275–285.
Collins, H.P., R.L. Blevins, L.G. Bundy, D.R. Christenson, W.A. Dick, D.R. Huggins, and E.A. Paul. 1999. Soil carbon dynamics in corn-based agroecosystems: Results from carbon-13 natural abundance. Soil Sci. Soc. Am. J. 63:584–591.
Conte, M.H., J.C. Weber, P.J. Carlson, and L.B. Flanagan. 2003. Molecular and carbon isotope composition of leaf waste in vegetation and aerosols in a northern prairie ecosystem. Oecologia 135:67–77.
DeNiro, M.J., and S. Epstein. 1978. Infl uence of diet on the distribution of carbon isotopes in animals. Geochim. Cosmochim. Acta 42:495–506.
Dolan, M.S., C.E. Clapp, R.R. Allmaras, J.M. Baker, and J.A.E. Molina. 2006. Soil organic carbon and nitrogen in a Minnesota soil as related to tillage, residue and nitrogen management. Soil Tillage Res. 89:221–231.
Fernandez, I., and G. Cadisch. 2003. Discrimination against 13C during degradation of simple and complex substrates of two white rot fungi. Rapid Commun. Mass Spectrom. 17:2614–2620.
Follett, R.F., E.A. Paul, S.W. Leavitt, A.D. Halvorson, D. Lyon, and G.A. Peterson. 1997. Carbon isotope ratios of Great Plains soils in wheat–fallow systems. Soil Sci. Soc. Am. J. 61:1068–1077.
Fukada, T., K.M. Hiscock, P.F. Dennis, and T. Grischek. 2003. A dual isotope approach to identify denitrifi cation at a river-bank infi ltration site. Water Res. 37:3070–3078.
Griebler, C., L. Adrian, R.V. Meekenstock, and H.H. Richnow. 2004. Stable carbon isotope fractionation during aerobic and anaerobic transformation of trichlorobenzene. Microb. Ecol. 48:313–321.
Henn, M.R., and I.H. Chapela. 2000. Differential C isotope discrimination by fungi during decomposition of C and C-derived sucrose. Appl. Environ. Microbiol. 66:4180–4186.
Huang, Y., G. Eglinton, P. Ineson, R. Bol, and D.D. Harkness. 1999. The effects of nitrogen fertilisation and elevated CO2 on the lipid biosynthesis and carbon isotope discrimination in birch seedlings (Betula pendula). Plant Soil 216:35–45.
Huggins, D.R., C.E. Clapp, R.R. Allmaras, J.A. Lamb, and M.F. Layese. 1998.
Carbon dynamics in corn–soybean sequences as estimated from natural carbon-13 abundance. Soil Sci. Soc. Am. J. 62:195–203.
Loeppert, R.H., and D.L. Suarez. 1996. Carbonate and gypsum. p. 427–474. In D.L. Sparks (ed.) Methods of soil analysis. Part 3: Chemical methods. SSSA Book Ser. 5. SSSA, Madison, WI.
Nedelhoffer, K.J., and B. Fry. 1988. Controls on natural nitrogen-15 and carbon-13 abundances in forest soil organic matter. Soil Sci. Soc. Am. J. 52:1633–1640.
Paul, E.A., S.J. Morris, J. Six, K. Paustian, and E.G. Gregorich. 2003. Interpretation of soil carbon and nitrogen dynamics in agricultural and afforested soils. Soil Sci. Soc. Am. J. 67:1620–1628.
Rochette, P., D.A. Angers, and L.B. Flanagan. 1999. Maize residue decomposition measurements using soil surface carbon dioxide fl uxes and natural abundance of carbon-13. Soil Sci. Soc. Am. J. 63:1385–1396.
Rossmann, A., M. Butzenlechner, and H.-L. Schmidt. 1991. Evidence for a nonstatistical carbon isotope discrimination in natural glucose. Plant Physiol. 96:609–614.
Šantrůčková, H., M.I. Bird, and J. Lloyd. 2000. Microbial processes and carbon-isotope fractionation in tropical and temperate grassland soils. Funct. Ecol. 14:108–114.
Spence, M.J., S.H. Bottrell, S.I. Thornton, H.H. Richnow, and K.H. Spence. 2005. Hydrochemical and isotopic effects associated with petroleum fuel biodegradation pathways in a chalk aquifer. J. Contam. Hydrol. 79:67–88.
Ueda, S., C.S.U. Go, S. Ishizuka, H. Tsuruta, A. Iswandi, and D. Murdiyarso. 2005. Isotopic assessment of CO2 production through organic matter decomposition in the tropics. Nutrient Cycling Agroecosyst. 71:109–116.
Wolf, D.C., J.O. Legg, and T.W. Boutton. 1994. Isotopic methods for the study of soil organic matter. p. 865–908. In R.W. Weaver et al. (ed.) Methods of soil analysis. Part 2: Microbial and biochemical properties. SSSA Book Ser. 5. SSSA, Madison, WI.
Zach, A., H. Tiessen, and N. Noellemeyer. 2006. Carbon turnover and carbon-13 abundance under land use change in semi-savanna soils of La Pampa, Argentina. Soil Sci. Soc. Am. J. 70:1541–1546.
Related Documents