Carbon lock-in toolkit February 2015 Submitted to the Department for International Development by Economic Consulting Associates C:\Dropbox (ECA)\A1Files\Projects\Worldwide Carbon Lock-in - DFID 513\WORK\Final report- toolkit\Carbon lock in final report v4.docx Economic Consulting Associates Limited 41 Lonsdale Road, London NW6 6RA, UK tel: +44 20 7604 4546, fax: +44 20 7604 4547 www.eca-uk.com

Welcome message from author
This document is posted to help you gain knowledge. Please leave a comment to let me know what you think about it! Share it to your friends and learn new things together.
Transcript

Carbon lock-in toolkit
February 2015
Submitted to the Department for
International Development by
Economic Consulting Associates
C:\Dropbox (ECA)\A1Files\Projects\Worldwide Carbon Lock-in - DFID
513\WORK\Final report- toolkit\Carbon lock in final report v4.docx
Economic Consulting Associates Limited
41 Lonsdale Road, London NW6 6RA, UK
tel: +44 20 7604 4546, fax: +44 20 7604 4547
www.eca-uk.com

ECA - Carbon lock-in toolkit
Quick-start guide to carbon lock-in assessments
i
Quick-start guide to carbon lock-in assessments
What is carbon lock-in?
Carbon lock-in occurs when:
a carbon intensive pathway is chosen, and
once the pathway is taken, it is costly to change direction, and
the chosen pathway has net negative consequences for national economic development/economic competitiveness in the future.
All of the above must be present for carbon lock-in to exist. But at the time a decision is made it cannot be known with certainty that carbon lock-in will occur.
Carbon lock-in is described more fully in Section 2 of the Toolkit.
Who should you use this guidance note, and when?
This guide is aimed at decision makers in national or local governments who are considering policy options1 that may result, directly or indirectly, in carbon-intensive pathways. It is also useful for advisors, donors involved in developing interventions, and stakeholders affected by government decisions.
The focus is on making policy choices that are in the developing country’s national self-interest but taking account of (see Section 3.3 of the Toolkit):
the financial opportunities available to developing countries from, and threats posed by, the future international framework relating to climate change (see Annex A1 of the Toolkit),
future trends in international energy prices (Annex A3.1) for forecasts of international prices for oil, natural gas and coal), and
future trends in the costs of low carbon technologies (Annex A3.3).
What to look out for?
High carbon-intensity does not necessarily imply carbon lock-in. Bearing in mind that lock-
in occurs when it is costly to change course at some future date, the costliness of changing course depends on a range of factors. Factors that may lower the cost of switching might include (see Sections 3.3 and 3.4 of the Toolkit): Is there a relatively low-cost conversion
1 Including do-nothing or wait-and-see options. For example, an option might be to introduce concentrated solar power now, or to wait for a few years to see if the costs come down and in the meantime to develop gas-fired power plants using gas-turbine technology with relatively low capital costs.

ECA - Carbon lock-in toolkit
Quick-start guide to carbon lock-in assessments
ii
option (such as a switch to biomass)? Will it be cheap in the future to switch to alternative low carbon technology (e.g., will solar PV prices continue to fall)? Can old carbon-intensive assets be re-used for something economically productive (diesel generators used for back-up power)?
Lock-in also arises when a pathway creates strong interest groups that, once established, will be harmed in some way by a move away from the carbon intensive path. This is institutional lock-in (see Section 3.5 of the Toolkit). The ‘harm’ will not always be economic harm, but may simply be the disruption of an established and comfortable pattern of life or the creation of uncertainties.
Some of the factors that tend to increase the likelihood of lock-in are shown in the diagram below. These are the factors to watch out for when screening to see whether there is a risk
of lock-in, but a ‘yes’ answer to all of these questions does not necessarily mean that there will be lock-in, nor does the answer ‘no’ to all questions guarantee that there will be no lock-in.
Note: border adjustment measures have been discussed as a way to protect domestic firms that are subject to climate change regulation from competition from foreign firms that are not.
If several of these factors exist in one of the pathways under serious consideration, then a more careful assessment of carbon lock-in should be undertaken, as described below.
Deeper questions to ask
Policy decisions must be made in situations of considerable uncertainty. Good forecasts of international energy prices and technology costs help to lower uncertainty but, however good the forecasts, the future will always be uncertain and the best option cannot be identified with certainty.
Does the option have high capital costs and thereafter relatively low operating costs?
Are there no alternative uses for the assets created by the policy? e.g., energy inefficient cement kilns.
Is subsequent conversion/retrofitting relatively high cost? e.g., mass public transport systems in cities that have grown around the car.
Does the option create strong vested interests? e.g., supply chains created to provide petroleum products and repair cars.
Does the policy option create a large number of similar jobs concentrated in a few locations, risking large scale unemployment?
=High
risk of carbon lock- inIs this sector particularly at risk from the international climate change
framework? e.g., a target for border adjustment measures.

ECA - Carbon lock-in toolkit
Quick-start guide to carbon lock-in assessments
iii
The first question to ask is whether a low, or high, carbon pathway is the obviously economically correct choice under all likely future scenarios. In this case, the decision is clear. However, if the choice depends on how the future plays out (international energy prices, the climate change framework and technology costs), then further questions need to be posed.
The next set of questions to ask when assessing policy options from a carbon lock-in perspective are:
1) Once a carbon intensive pathway is chosen, will it be costly to switch to a low carbon one (and will it be worthwhile)?
2) What are the economic consequences if we are locked-in to a high carbon pathway and future world energy prices/the international climate change framework/ low-carbon technology costs are unsympathetic2 to our policy choice? (Equally, what are the economic consequences if we choose a low carbon pathway and the future is unsympathetic to that choice?)
3) How likely is it that world energy prices/the international climate change framework/low-carbon technology costs will be unfavourable/favourable to our chosen pathway?
When asking the first question, we should bear in mind that there may, to varying degrees, be flexibility to adapt to changed circumstances3.
A rigorous analysis would then combine the economic consequences derived from question (2) and the likelihood derived from question (3). In practice, few policy decisions will be based on a fully quantified assessment of the risks and consequences of multiple future scenarios. But, as a minimum decision makers should consider some ‘what if’ analyses involving various policy decisions and the subsequent consequences of various scenarios for world energy prices/international climate change frameworks/future low-carbon technology costs. For example:
What if we choose policy option A and world energy prices are high, what will be the economic consequences? What if we choose policy option A and, instead, world energy prices are low, what then will be the economic consequences? What if we choose policy option B and world energy prices are high, what are the economic consequences? etc., etc.
Further guidance and some suggested sources of data to help make such assessments are provided in Section 3 and in Annexes to the Toolkit.
A 4th question that should also be asked is whether there are additional policies that
should be adopted to increase flexibility (e.g., by designing coal-fired power plants to be
2 e.g., high fossil fuel prices and a strict international climate change framework that penalises countries with high carbon intensity through border adjustment measures or similar measures. 3 If, for example, we build coal-fired power stations, we may be able to retrofit the plants with carbon-capture and storage, or convert the plants to burn natural gas or biomass. If these are not feasible, then our only feasible option would be to close down the coal-fired power plants and build new low-carbon power plants. If the cost of doing this is high, then we risk carbon lock-in if we choose to build coal-fired power plants.

ECA - Carbon lock-in toolkit
Quick-start guide to carbon lock-in assessments
iv
capable of accepting carbon-capture and storage if the future international climate change framework makes high carbon emissions unattractive).
A simple illustration
Case studies are provided that illustrate carbon lock-in assessments (Section 4 of the
Toolkit). Simplifying one of these, a typical assessment goes as follows4:
Consider the policy option: Either: a) build coal-fired power plants, or b) build gas-fired power plants. Let us assume that it is not obvious that one decision is economically better than the other under all reasonable future scenarios.
Screening: The checklist (in the diagram above) suggests that coal-fired power plants are likely to lead to carbon lock-in5 both because of high capital cost and because of the creation of a large labour force concentrated in mining areas.
Question 1: Will it be costly to change pathway? Converting a coal-fired power plant to biomass or gas is found to be infeasible6. Analysis shows that once the coal-fired option is implemented, it will be very costly to switch to a lower carbon pathway7. This satisfies two of the three conditions for carbon lock-in – it is carbon intensive and once the path is chosen, it will be costly to switch. But it does not prove that this pathway will have negative consequences for our economy.
Question 2: What will be the consequences? Suppose we choose the coal-fired option and the future international climate change framework tightens such that the CO2 ‘cost’ rises over time to US$50/tonne8, and this means that we are losing, say, US$ 1 billion per year9. Carbon lock-in would then be proven. On the other hand, suppose the future climate framework becomes very relaxed such that the CO2 cost is close to zero, then we will be, say, US$1 billion per year better off. At the time the decision is made, we are therefore uncertain whether there will be carbon lock-in, but we know there is a risk.
Question 3: How likely is it that policies will lead to CO2 ‘costs’ equivalent to
US$50/tonne or more? If we believe that there is a relatively high10 probability
4 For simplicity, this does not use the same assumptions as those in the case study. 5 Because conventional coal-fired power generation produces large quantities of CO2 per unit of electricity generated. In this illustration, we assume that gas-fired power generation has a more acceptable level of CO2 emissions. 6 This is assumed for illustrative purposes and cannot be assumed to be true generally. 7 The capital cost is sunk and the variable fuel and O&M cost in this example is low. 8 This is the high end of the scenarios considered in the case studies. The figures of US$50/tonne and US$0/tonne are used to illustrate policy paths over time that represent the costs or lost opportunities for developing countries that are associated with international climate change policies. 9 Either by comparison with the alternative policy or compared with similar competing countries who followed a low carbon pathway. This is purely illustrative. 10 In this example, if the probability of CO2 emissions costing US$50/tonne is 50% and there is a 50% probability that the value will be zero, then the expected outturn is 50% x US$1 billion + 50% x (-) US$1 billion = zero. If we believe that there is a greater than 50% probability that CO2 costs will exceed US$50/tonne, then the expected (mathematical expectation) outturn from a low carbon

ECA - Carbon lock-in toolkit
Quick-start guide to carbon lock-in assessments
v
that CO2 costs will be US$50/tonne or more in the future then, in order to avoid carbon lock-in, our optimum choice would be gas-fired power plants to avoid the risk of carbon lock-in.
Finally, if we are still tempted to follow a high carbon strategy, we should ask whether there is anything that can be done to increase the flexibility of a high carbon pathway to allow us to switch to a low carbon one if world energy prices/international climate change frameworks/ low-carbon technology costs favour a switch. In this simple example, adapting the design of the coal-fired power plants to make them ready for retrofitting carbon-capture and storage, would increase flexibility and lower the risk of carbon lock-in.
pathway will be above zero dollars and the expected outturn from a high carbon pathway will be negative dollars.

ECA - Carbon lock-in toolkit
Contents
vi
Contents
Abbreviations and acronyms ix
1 Introduction 1
2 What is carbon lock-in and why does it matter? 2
2.1 Why might a country wish to change path? 3
2.2 What makes it difficult or expensive to change paths? 3
2.3 Who is most at risk? 5
3 Guidelines for carbon- lock in assessment 7
3.1 Steps to be followed 7
3.2 Set out the decision to be made 9
3.3 Define future (external) scenarios 9
3.4 Look for asset lock-in 10
3.5 Look for institutional lock-in 12
3.6 Gather evidence and data 14
3.7 Assess the cost and CO2 implications 14
3.8 Make a decision 17
4 Case studies 18
4.1 Kenya 21
4.2 Nigeria 35
4.3 South Africa 46
A1 The international framework for climate change 58
A1.1 The current framework 58
A1.2 The possible future framework 59
A1.3 How does this affect decision making? 62
A1.4 Carbon price scenarios relevant to developing countries 64
A2 Lock-in literature 66
A2.1 Some general lock-in literature 66
A2.2 Technology and R&D policy 69
A2.3 Specific carbon lock-in literature 70
A2.4 Green-growth literature 72

ECA - Carbon lock-in toolkit
Tables and figures
vii
A2.5 Energy price vulnerability literature 73
A3 International trends 75
A3.1 IEA’s three international energy price scenarios 75
A3.2 IEA’s international carbon price scenarios 77
A3.3 Trends in the costs of renewable energy 78
A4 Sources of other data 78
A4.1 CO2 emission factors 78
A4.2 Power generation data 79
A4.3 Urban and transport 80
A4.4 Other data 80
A5 Discount rates 81
A5.1 DFID advice 81
A5.2 Choice of discount rate depends on the purpose 81
A6 Input data assumptions for the case studies 82
A6.1 Discount rates for the three countries 82
A6.2 Kenya - MRTS 83
A6.3 Nigeria – fuel mix 86
A6.4 South Africa – CCS 87
A6.5 South Africa – cement industry 88
A7 Nigeria – alternative gas price scenarios 90
Tables and figures
Tables
Table 1 Illustration of decisions and outturn costs under alternative CO2 price scenarios 16
Table 2 Levelised costs – Diesel vs. solar-diesel hybrids (US$/kWh) 32
Table 3 Levelised costs – Diesel and solar-diesel hybrids – various scenarios (US$/kWh) 33
Table 4 Levelised cost of electricity for alternative generation - Nigeria 39
Table 5 Levelised costs – Diesel vs. solar-diesel hybrids (US$/kWh) 44

ECA - Carbon lock-in toolkit
Tables and figures
viii
Table 6 Levelised costs – Diesel and solar-diesel hybrids – various scenarios (US$/kWh) 44
Table 7 Net benefits of energy efficient clinker production – South Africa 57
Table 8 Benefit and Cost flows of the Kenya MRTS 83
Table 9 Costs and benefits of making a plant CCS ready 87
Table 10 Levelised cost of electricity for alternative generation - Nigeria 90
Table 11 Coal-fired versus gas-fired power generation - Nigeria 91
Figures
Figure 1 Step by step carbon lock in assessment guidelines 8
Figure 2 Lifetimes of major greenhouse gas related capital stock 12
Figure 3 Risk of asset lock-in 12
Figure 4 Institutional lock-in risk factors 13
Figure 5 Transport, all purpose (number of trips) in Nairobi excluding motorcycles 22
Figure 6 Total vehicle population in baseline emissions reference case 23
Figure 7 Emissions reduction as a result of the MRTS 26
Figure 8 NPV under different carbon price scenarios (IEA New Policies energy scenario) 26
Figure 9 Nairobi Urban sprawl between the year 2000 and 2013 28
Figure 10 Estimated costs of electricity diesel versus PV minigrids in Africa 31
Figure 11 IEA oil price scenarios 32
Figure 12 IEA’s estimated potential for mini-grids 41
Figure 13 CCS roadmap for South Africa 48
Figure 14 Levelised costs of electricity – CCS retrofit vs. new build 49
Figure 15 Cost –effectiveness of CCS 51
Figure 16 Energy efficiency of various kiln technologies 55
Figure 17 Approach to developing international climate framework scenarios 60
Figure 18 Crude oil import prices –IEA 2013 76
Figure 19 IEA’s coal price scenarios 76
Figure 20 IEA’s regional gas price scenarios 77
Figure 21 IEA’s carbon price projections in selected regions by scenario (US$/tonne) 78
Figure 22 Number of registered vehicles 2008-2011 84
ECA - Carbon lock-in toolkit
Abbreviations and acronyms
ix
Abbreviations and acronyms
CDM Clean Development Mechanism
CER Carbon Emission Certificate
CCS Carbon Capture and Storage
CCR Carbon Capture Ready
DFID Department for International Development
ECA Economic Consulting Associates
EIA US Energy Information Administration
ETS Emissions Trading Scheme
GDP Gross Domestic Product
GHG Greenhouse gas
ICF International Climate Fund
IEA International Energy Agency
IPCC Intergovernmental Panel on Climate Change
LIC Low income country
MIC Middle income country
NAMA Nationally appropriate mitigation actions
UNFCCC United Nations Framework Convention on Climate Change
ECA - Carbon lock-in toolkit
Introduction
1
1 Introduction
This Toolkit has been prepared by Economic Consulting Associates Ltd (ECA) on behalf of the Department for International Development (DFID). The Toolkit provides a framework for assessing the risk of carbon lock-in among developing countries. The Toolkit is aimed at decision makers in national or local governments who are considering policy options11 that may result, directly or indirectly, in carbon-intensive pathways. It is also useful for advisors, donors involved in developing interventions, and stakeholders affected by government decisions.
The Toolkit is structured as follows:
An introduction to carbon lock-in and an explanation of why it is relevant to decision makers in developing countries (Section 2).
Guidelines for carbon lock-in assessment (Section 3). This expands on the Quick-start guide at the start of this document. This describes a conceptual framework for analysing carbon lock-in and should be useful for decision makers whether they are undertaking a full cost-benefit analysis that formally includes carbon lock-in risk or just assessing carbon lock-in risk qualitatively.
Case studies of carbon lock-in in three countries (Section 4).
A Quick-start guide to carbon lock-in was also provided at the start of this document.
We collectively describe this Report including the Quick-start guide as a “Toolkit”.
Annex A1 provides an overview of the existing international climate change framework, how this may evolve in future, and how these may impact developing countries directly or indirectly and could contribute to carbon lock-in.
Annex A2 summarises of some of the literature on carbon lock-in and lock-in more generally. Annexes A3 to A5 provide additional information including information that can be used in qualitative and quantitative assessments. Finally, Annex A6 describes the input data and assumptions used in the case studies.
11 Including do-nothing or wait-and-see options. For example, an option might be to introduce concentrated solar power now, or to wait for a few years to see if the costs come down and in the meantime to develop gas-fired power plants using gas-turbine technology with relatively low capital costs.

ECA - Carbon lock-in toolkit
What is carbon lock-in and why does it matter?
2
2 What is carbon lock-in and why does it matter?
The terms “carbon lock-in” and “high-carbon path dependency” have been used loosely in literature and generally suggest high carbon practices that once established become entrenched. We define carbon lock-in to occur when:
a carbon intensive pathway is chosen, and
the chosen pathway has net negative consequences for national economic development/economic competitiveness in the future, and
once the pathway is taken, it is very costly to change direction.
All three of the above must be present for carbon lock-in to exist. A high carbon-dependent path is not necessarily an economically sub-optimal path. A policy or investment that is carbon intensive but appears to be economically efficient over a reasonably period of time into the future would not, according to this definition, be characterised as carbon lock-in. Similarly, a high carbon pathway that is economically sub-optimal does not lead to lock-in unless it is very difficult to change track after that pathway has been chosen.
But at the time the decision is taken, it will not be known for certain that lock-in exists. Lock-in will only be confirmed at some point in the future, probably long after the decision has been made. Hence, the concern is about the risk of carbon lock-in and what to do about that risk.
Carbon lock- in risk arises for instance when a Government decides to invest in the development of urban roads, which acts as an incentive for people to move outside the city and drive to work. As the city grows, this creates demand for more roads. The use of road transport then becomes extremely difficult to reverse because of the high cost of overlaying mass transport systems on top of existing road and housing developments. If the price of petroleum products rise beyond original expectations or the framework for climate change tightens beyond expectations, then the use of private cars by commuters, combined with the costs of congestion, would become economically inefficient. Full carbon lock-in would then be realised.
Clearly, carbon lock-in must involve a carbon intensive pathway. But beyond that, the definition above implies that:
there must be some future scenarios that cause the chosen pathway to be sub-optimal make the country wish to change course, and
it must be very difficult or expensive for the country to change the path once it is chosen.
These two are explored briefly in sub-sections 2.1 and 2.2 below.
Section 2.3 then explores who is most at risk (which sectors and which countries).

ECA - Carbon lock-in toolkit
What is carbon lock-in and why does it matter?
3
2.1 Why might a country wish to change path?
Having embarked on a particular carbon-intensive path, the country may find that this path is sub-optimal. The pathway may be suboptimal for various reasons:
Energy prices: A decision may have been taken in the expectation that future international energy prices would follow a particular course – upwards, downwards, constant – and that turns out to have been wrong. For example, an energy intensive manufacturing sector might have based their technology decisions on the expectation that petroleum product prices would remain reasonably constant over time, but in reality energy prices become very high.
International climate change framework: A decision may be made in the expectation that the international framework designed to encourage or enforce carbon emission reduction will remain relatively weak, but in practice it tightens. This would mean that developing countries could miss out on financial opportunities resulting from that framework, or they could be penalised through schemes such as import duties imposed on carbon intensive products that are designed to level the playing field between countries that have implemented carbon mitigation measures and those countries that have not. Section A1 discusses this in more detail.
Technological developments: Trends in technology may mean that delays in making long-lived capital investments could be advantageous. A country that has made investments when the technology was not well developed or when the technology costs were high would be at a competitive disadvantage to those countries that wait. This can work both ways. On the one hand it could make it attractive to delay investment in carbon intensive coal-fired power generation in the expectation that carbon-capture and storage technology will improve. On the other hand, it may make it attractive to delay investment in renewable energy technologies in the expectation that the technology will improve and costs will fall (further).
Altruistic motives: If countries wish to reduce emissions as part of their contribution to tackle international climate change problems, and if they believe that they will continue to wish to contribute to these efforts in the future, they should avoid investment or policy decisions that cannot be reversed and that will lock them into high carbon pathways.
2.2 What makes it difficult or expensive to change paths?
The more general lock-in and path dependency literature identifies several categories together with the associated causes:
Asset lock-in arises when investments are made in relatively long-lived capital-intensive technologies, infrastructure and processes, with little flexibility to switch to alternatives at an acceptable cost. A nuclear power plant, for example, is extremely expensive to build and, once built, its operating costs are very low. To abandon nuclear technology once it has already been implemented and to switch to another technology to generate electricity would be very expensive12.
12 Though not impossible, as Japan and Germany have shown.

ECA - Carbon lock-in toolkit
What is carbon lock-in and why does it matter?
4
This is not an example of carbon lock-in but is an example of asset lock-in in general.
Institutional lock-in arises when a pathway creates strong interest groups that, once established, will be harmed in some way by a move away from a given sub-optimal path. The ‘harm’ will not always be economic harm, but may simply be the disruption of an established and comfortable pattern of life or the creation of uncertainties.
Technological lock-in includes the phenomenon that a sub-optimal technology or standard that is adopted first and becomes widespread and may then be economically difficult or impossible to reverse. The QWERTY keyboard is often cited as an example of this13. Other examples sometimes cited include the VHS video recorder and the Microsoft operating system14. Widespread adoption of one technology and the need for standardisation of associated products (videos and software, or skilled typists and standard typewriters) makes it very expensive to switch.
Using this characterisation of lock-in, in developing countries there are likely to be carbon intensive asset lock-in risks resulting from policies or absence of policies that result in investments by the public or private sectors in long-lived infrastructure assets that depend on fossil fuels (roads, power plants burning fossil fuels, energy intensive manufacturing industry (cement, steel, glass, paper, petrochemicals), and energy conversion processes (refineries, fertiliser plants).
Possibly one of the biggest risks of institutional lock-in in a number of developing countries arises from the job creation opportunities in coal mining. This is a labour intensive activity and, depending on the type of mining and technology employed, creates employment for substantial numbers, often concentrated in towns and communities such that local economies come to depend on this sector for jobs. Closing mines can mean widespread unemployment for periods of time. Other types of institutional lock-in may arise where middle and upper management become skilled in the use of particular technologies and their jobs are threatened by new technologies. Supply chains may also be created to serve a particular industry – the petroleum industry for example – that creates resistance to alternatives.
The third category – technological lock-in – is perhaps less likely to be a major risk in developing countries in relation to climate change:
Since technological developments are typically made by developed countries, it is less likely that technologies will be established first in developing countries. That is not to say that technological breakthroughs15 are not made in developing countries but it is harder to identify examples of a QWERTY type pathway that is trodden first in a developing country that would cause lock-in for that technology (or lock-out of other low carbon technologies).
13 Though it is not accepted universally that the QWERTY keyboard is sub-optimal. 14 When, it is argued, the Apple-Mac operating system was much superior. 15 There are, for example, a number of interesting technologies and business models that are being implemented in Africa and India relating to distributed solar energy products and metering.

ECA - Carbon lock-in toolkit
What is carbon lock-in and why does it matter?
5
Technological lock-in could occur where a developing country introduces one new technology rather than another, and this becomes the standard for that country. Most carbon intensive technologies are well established internationally and are already familiar to developing countries so they are already ‘locked-in’ to some extent – this is not the problem that this Toolkit is addressing16.
There are some carbon intensive technologies that might be new to some developing countries and that could, in theory, establish a standard that would create technological lock-in, but it is difficult to find compelling examples17.
There are various cost barriers-to-entry for any relatively complex new technology into a country. These barriers relate to the development of supply chains, financial products (leasing, credit), installation, maintenance and servicing, and so on. All new technologies, whether low carbon or high carbon, are therefore inevitably locked-out of markets to some extent compared with established rivals. Policy makers have various mechanisms18 that can be deployed to help overcome barriers-to-entry for targeted low-carbon technologies either at the household level such as solar water heaters, solar PV and CFLs19 or larger scale technologies such as wind farms.
In general, the factors that are likely to make it difficult for developing countries to change from a carbon intensive pathway to a low-carbon pathway are therefore most likely to be:
asset lock-in,
institutional lock-in, and
technological lock-in to the extent that any new technology must overcome inevitable barriers to entry into a new market.
2.3 Who is most at risk?
A carbon lock-in risk turns into actual carbon lock-in when the future (international energy prices, climate change framework, etc.) turn out to be unfavourable to a prior investment decision and it proves too costly to change course. The circumstances that lead to lock-in were described above. Which countries and which sectors are most at risk? All countries and all sectors are at risk to some extent, but some sectors may be more at risk than others.
16 The problem the Toolkit is addressing is how to identify the risk of carbon lock-in and how to reach decisions on low or high carbon pathways. The toolkit is not designed to assess how to responding to an existing carbon lock-in situation. 17 Coal-fired power generation technology, for example, could be new to a number of African countries but these countries are also very familiar with hydropower and are increasingly familiar with renewable energy, so it would be difficult to regard this as creating technological lock-in. 18 Subsidies, low-cost credit, guarantees, information dissemination, etc. 19 Compact fluorescent lightbulbs.

ECA - Carbon lock-in toolkit
What is carbon lock-in and why does it matter?
6
2.3.1 Energy intensive industries are most at risk
Sectors that directly and indirectly use fossil fuels are at risk of escalation in international energy prices and could be affected by the international framework for climate change. Energy intensive industries are at greatest risk. Energy intensive industries include electricity generation, mining, glass, paper, ceramics, iron & steel, cement, fertiliser, aluminium, petrochemicals and road transport, among others. Countries that are heavily dependent on imports of energy and also have energy intensive manufacturing are therefore vulnerable to increases in international energy prices and the international framework for climate change. Even countries without heavy manufacturing industry will be vulnerable in the transport sector and, potentially, in the electricity sector unless hydropower or other renewable energy forms a major part of their energy mix.
2.3.2 Are hydrocarbon-rich countries insulated from carbon lock-in?
Clearly, countries that are rich in hydrocarbon resources will be affected in various ways by future changes international energy prices and the international climate change framework. This is not the concern of the carbon lock-in toolkit. However, the toolkit is concerned with domestic policies introduced by all developing countries whether they are rich in hydrocarbon resources or not. The question here is whether countries that are relatively rich in hydrocarbon resources can be considered to be insulated from the effects of changes in international energy prices or the impacts of a tightening framework for international climate change and therefore whether their domestic energy and environment policies can ignore the risk of carbon lock-in?
There are a number of developing countries that are rich in hydrocarbon resources and may be either net exporters of hydrocarbon energy or may produce a substantial proportion of their own hydrocarbon needs (e.g., South Africa, Nigeria, Egypt, Indonesia, India). The exporting countries will benefit when international energy prices rise but the economic cost of using hydrocarbon resources for domestic consumption also rises when international energy prices rise. When natural gas can be sold internationally at a profit to the country of US$ 10 per mmbtu20 and it is sold domestically at US$ 1 per mmbtu, this is in effect a subsidy to domestic users. Domestic prices for hydrocarbon energy ought to reflect the international opportunity cost, but often do not. Whether priced to reflect international market prices or subsidised, the economic cost is still the international opportunity cost. This means that resource rich countries are not insulated from international energy price movements. All countries that have energy intensive sectors are therefore at risk of carbon
lock-in whether the country is rich in hydrocarbon resources or not.
20 mmbtu = one million British thermal units, which is approximately equal to one Gigajoule of energy.

ECA - Carbon lock-in toolkit
Guidelines for carbon- lock in assessment
7
3 Guidelines for carbon- lock in assessment
This Section expands on the Quick-start guide provided at the start of this Toolkit. The Quick-start guide and the guidelines are both designed to help assess how the problem of carbon lock-in should be recognised and taken into account when making policy and investment decisions in developing countries. The guidelines are designed to be used by anyone involved in making policy or investment decisions or seeking to influence such decisions. It is aimed at decision makers within national governments, those engaged in advising policy makers and donors involved in developing interventions. The guidelines are concerned with making decisions that are in the best interests of the developing country (i.e., the economically optimal policies or investments from that country’s perspective).
These guidelines expand on the ‘Deeper questions to ask’ section of the Quick-start guide.
Policy and investment decisions should normally be based on cost-benefit analysis but an assessment of a policy or investment does not necessarily depend on the use of a full cost-benefit analysis. The guidelines can be used:
to assess whether carbon lock-in should be considered in a full cost-benefit analysis
even where a cost-benefit analysis is not undertaken, to help understand carbon lock-in issues and to help make informed judgements on the relevance of carbon lock-in to a particular decision (possibly complemented with some partial quantitative analysis)
If a cost-benefit analysis is to be undertaken, the guidelines show how lock-in can be analysed. If a full cost-benefit analysis is not to be undertaken, the guidelines provide a conceptual framework that allows an informed qualitative assessment to be undertaken.
The guidelines can be read in conjunction with the case studies described in Section 4. The case studies describe simplified real-life decisions and how the concept in the guidance note/tool can be applied to those real-life decisions. The case studies cover a range of countries and a range of sectors.
The guidelines are independent of the sector chosen. Annexes describe some sources of information that can be used to help provide quantitative analysis for some sectors if users decide to undertake quantitative analyses.
3.1 Steps to be followed
The steps to be followed in making an assessment of carbon lock-in are summarised in the figure below.

ECA - Carbon lock-in toolkit
Guidelines for carbon- lock in assessment
8
Figure 1 Step by step carbon lock in assessment guidelines
The steps comprise:
Identify the decision(s) to be made and the potential problem(s) and issues affected by the decision(s). Decisions involve choices between one or more alternatives. Identify sources of evidence and data to help in the decision-making.
Consider alternative future (uncertain) scenarios for energy prices, the international framework for climate change, and other factors that are external to the decision makers and that create the conditions that might make the country wish to change pathways in the future.
Screen the investment/policy options and assess qualitatively, if possible, whether the country would be able to switch to a low carbon pathway at a future date without excessive cost. Assess the risk of asset lock-in.
Map key decision makers, actors and stakeholders and understand stakeholder interests and any potential future misalignment of stakeholder interests with national interest. Assess the risk of institutional lock-in.
Decisions to be made- What is the policy or investment?
- What are the alternatives?
International scenarios-International energy prices
-International framework for climate change, etc.
Look for asset lock-in risk- Checklist of risk factors
- Is there a substantial risk of asset lock-in?
Look for institutional lock-in-Will stakeholders’ interests be aligned with national interests?-Will institutional lock-in occur?
Sources of evidence and data
Economic and CO2 impacts of alternative scenarios
(indicative or detailed)
Conclusion-How big is the carbon lock-in risk?
- Is the risk worth taking?

ECA - Carbon lock-in toolkit
Guidelines for carbon- lock in assessment
9
Assess, qualitatively or quantitatively the economic impacts and CO2 impacts
under alternative scenarios. Present the results in terms of a matrix of choices and outcomes, whether quantitative or qualitative.
Conclusions. Is carbon lock-in risk significant? Is the risk unacceptable? Is there anything that can be done now to protect against that risk being realised.
These steps are each elaborated in the following sections.
3.2 Set out the decision to be made
The first step is perhaps obvious – to lay out clearly the decision to be made. By its nature, carbon lock-in typically involves capital intensive investments. It is the large scale investment that creates the lock-in and makes it costly to deviate from that path in the future. So the decision to be made often concerns a decision concerning a large scale investment. Generally, it will already have been decided that certain services (electricity, transport, water) or goods (cement, steel, paper) need to be provided and the decision concerns the choice between one or more ways to deliver those goods or services. In the case studies the choices were concerned with issues such as whether to produce electricity using coal or natural gas, whether to produce electricity with or without carbon capture and storage, or whether to adopt more or less energy intensive technologies for cement production.
A policy option can also be to do nothing. This can be a legitimate policy option (though it can also be the result of policy inertia).
There may also be circumstances when the decision does not involve an investment by the government. Long-term contracts, for example, may have lock-in consequences that are costly to reverse (for example, a long-term contract with private firms to develop independent power plants with minimum take-or-pay terms). Policies that encourage or require investment by the private sector will also have lock-in consequences, at least for the private sector (policies that provide subsidies for energy to help promote industry may have long-term lock-in consequences if the firms invest in the expectation that prices will remain subsidised for a long time). Even policies that encourage individuals to invest in training will have lock-in consequences.
3.3 Define future (external) scenarios
This next step is concerned with identifying the circumstances in the future that would make the country wish to change pathway.
There are external factors that are outside of the control of decision makers that cannot be forecast with accuracy and impact on the future success or failure of those decisions. International energy prices are a good example of such an external driver. A decision may be made to invest in renewable energy in the expectation that world energy prices will rise or that the international framework for climate change will penalise carbon intensive countries, and if international energy prices do not rise then developing countries that have

ECA - Carbon lock-in toolkit
Guidelines for carbon- lock in assessment
10
financed those investments from their own resources will be worse off than countries that have followed carbon intensive pathways.
We have identified three key external international scenarios that are key to carbon lock-in assessments:
international energy prices,
the international framework for climate change,
trends in the costs of low carbon technologies.
Several sources exist which provide forecasts of international energy prices. One of the more comprehensive is produced by the International Energy Agency (IEA) in its World Energy Outlook. This has several advantages including coverage of all the major forms of energy (oil, coal, and natural gas by region) on a consistent basis21 and is updated every year. This is a useful default source of forecasts of international fuel prices – see Annex A3.1 below.
As described in Section A1.4, we have chosen to represent the international framework for climate change in terms of US$ per tonne of CO2 equivalent (tCO2e). In reality, the framework will impinge on decision-making in developing countries through a variety of routes as summarised in Section A1.1 and A1.2, but representing this in terms of a US$/tCO2e value is a useful simplification that helps decision makers. In the case studies we have chosen to use our own forecasts of the CO2 value but IEA also produces forecasts in their World Energy Outlook and these are again updated annually. The IEA therefore provides a good source for realistic scenarios for the international climate change framework. Information on how to obtain this is provided in Annex A4.1.
The costs of some low-carbon technologies have fallen significantly over recent years – particularly solar PV. There are a number of sources that project future costs but consistent source is likely to be the International Renewable Energy Agency (IRENA) – see Annex A3.3.
3.4 Look for asset lock-in
Asset lock-in occurs when it is difficult to change direction once a given pathway – typically a large investment – has been made. It is possible to change course if sufficient money or resources are available, but cost will be a constraint. The question that needs to be asked is: if this decision is taken, and an investment is made (whether by the public or private sector), what will be the cost of changing direction? If the cost is relatively low, then this is not a lock-in situation and there is no need to consider lock-in further.
In two of the case studies, two situations are identified, providing quantitative analyses that confirm the existence or otherwise of asset lock-in.
In one situation, investment in coal-fired power generation will create asset lock-in. Once the decision is taken and the investment is made, the consequence of
21 Some forecasts focus on one or two of these fuel types and could potentially be combined to cover the full set of fuel types – but the forecasts will have been prepared using different assumptions. A single source with internally consistent assumptions is preferable.

ECA - Carbon lock-in toolkit
Guidelines for carbon- lock in assessment
11
abandoning the coal-fired power plant and switching to a lower carbon gas-fired plant will result in a major increase in wholesale electricity costs. This policy/investment involves high capital costs, subsequently relatively low fuel and operating costs, long-lived assets, and no opportunities to re-use the plant.
In another situation, investment in carbon-intensive diesel generation to supply mini-grids does not create lock-in. This is because diesel generators have relatively low capital costs and renewable energy technologies can replace them in the future and supply the same mini-grids. Additionally, most mini-grids that use renewable energy have diesel generators for back-up and even if diesel generators are not needed for back-up they are often sufficiently mobile that they can be transported to another site and re-used. They also have relatively short economic lives (of around 10 years).
Asset lock-in can be confirmed quantitatively but it may be possible to rule out asset lock-in by considering some of the circumstances that cause this type of lock-in, including:
a large financial investment in capital assets (possibly also including human capital in the form of training)
the plant, infrastructure or facilities or the skills given to a workforce will last for a considerable number of years (e.g., more than 15 years)
the plant, facilities or skills of a trained workforce cannot be re-used for something else (inefficient cement kilns have no other productive use)
the plant, facilities or skills of a trained workforce cannot easily or cheaply be reconfigured (e.g., a coal-fired power plant cannot easily switch to burn biomass or natural gas)
the alternative solutions to replace the original investment also involve large financial investments (e.g., superimposing mass transit systems in built-up urban areas)
Even assets that have a relatively short lifetime can still exert a long term systematic impact, through their influence on societal development plans. For instance, the design life span of road infrastructure may be only 20 years, but the development of communities and commercial activities following the construction of a road is likely to have a very long systemic impact22.
The table below, taken from the Fourth Assessment Report from the Intergovernmental Panel on Climate Change (IPCC), highlights the longevity of capital stock associated with selected GHG-emitting activities23.
22www.dnaeconomics.com/assets/Usematthew/Infrastructure_Lock_In_Paper_June_2012_final2.pdf 23 Barker, T., Bashmakov, I, Alharthi, A., Amann, M., Cifuentes, L., Drexhage, J., Duan, M., Edenhofer, O., Flannery, B., Grubb, M., Hoogwijk,M., Ibitoye, F.I., Jepma, C.J., Pizer, W.A., Yamaji, K. (2007a) Mitigation from a cross-sectoral perspective. Available [online]: www.ipcc.ch/publications_and_data/ar4/wg3/en/contents.html

ECA - Carbon lock-in toolkit
Guidelines for carbon- lock in assessment
12
Figure 2 Lifetimes of major greenhouse gas related capital stock
Source: Barker et. al. Mitigation from a cross-sectoral perspective24
The asset lock-in factors noted above are summarised in the figure below. This provides a check-list to be used qualitatively and judgementally when considering whether there is a need to investigate carbon lock-in quantitatively. It is not an exhaustive list, and even if these characteristics are all present it does not necessarily follow that carbon lock-in risk exists and the absence of these factors does not necessarily mean that lock-in is not a risk.
Figure 3 Risk of asset lock-in
It will not always be possible to identify whether there is a risk of carbon lock-in based purely on a qualitative analysis, and some form of quantitative assessment will be required – even if it is not a full cost-benefit analysis.
3.5 Look for institutional lock-in
Lock-in arises not only because of the high cost of switching paths once a particular carbon intensive pathway has been chosen, it also arises when a pathway creates interest groups that, once established, will be harmed in some way by a move away from the carbon intensive path. This is institutional lock-in. The ‘harm’ will not always be economic harm,
24 Barker, T., Bashmakov, I, Alharthi, A., Amann, M., Cifuentes, L., Drexhage, J., Duan, M., Edenhofer, O., Flannery, B., Grubb, M., Hoogwijk,M., Ibitoye, F.I., Jepma, C.J., Pizer, W.A., Yamaji, K. (2007a) Mitigation from a cross-sectoral perspective. Available [online]: www.ipcc.ch/publications_and_data/ar4/wg3/en/contents.html
Does the option have high capital costs and thereafter relatively low operating costs?
Are there no alternative uses for the assets created by the policy? e.g., energy inefficient cement kilns.
Is subsequent conversion/retrofitting relatively high cost? e.g., mass public transport systems in cities that have grown around the car.
=High
risk of carbon lock- in

ECA - Carbon lock-in toolkit
Guidelines for carbon- lock in assessment
13
but may simply result from disruption of an established and comfortable pattern and the creation of uncertainties.
Figure 4 Institutional lock-in risk factors
Examples of the circumstances under which institutional lock-in arise include:
Jobs will be threatened (this particularly applies to coal mining industry jobs in developing countries). Even though new employment will be created by the new technologies, there will be disruption and job losses until the new industries are established.
Supply chains will have been established based on supply to certain types of industry or technology (e.g., supply chains to provide petroleum products or coal). The owners of these firms will be unhappy if there is a move to a new technology or new practices.
Staff at management level in public or private sector companies have been trained in a particular group of technologies (e.g., road transport) and their skills may become redundant if new technologies are introduced or they will be threatened by younger staff with new knowledge (e.g., rapid mass transit transport systems).
New technologies create commercial risks and uncertainties (e.g., carbon capture and storage) – management of private sector firms will be threatened if the new technologies are unsuccessful whereas they are less likely to be criticised if they follow conventional industry practices.
When making policy or investment choices, even though a future change of path may not give rise to a change in costs, institutional lock-in may occur if interest groups are created. Consideration should therefore be given to whether a policy decision creates institutional lock-in. Decision-makers should be on the look-out for institutional lock-in and take account of the risks it poses.

ECA - Carbon lock-in toolkit
Guidelines for carbon- lock in assessment
14
3.6 Gather evidence and data
Having decided that some of the conditions for lock-in may exist, the next step is to identify sources of data or evidence that can be used to substantiate whether the risk is material to the decision. The types of data required to assess the risks include (for both the option under consideration and the alternative(s)):
capital costs
operating and maintenance costs
fuel consumption
outputs of goods or services (MWh, person trips, tonnes of cement, etc)
emissions of CO2e
Typically these types of assessment will be undertaken in real prices (no general inflation).
Typical sources of data for this will include:
feasibility studies or pre-feasibility studies for the specific investment
project design documents (PDDs) for similar projects (these are submitted to UNFCCC when registering projects for the certified emission reductions)
studies undertaken to benchmark the costs of these types of technologies in other countries
case studies, pilot studies, etc. describing similar investment or policy decisions
Specific sources of generic data are provided in Annex A4.
A discount rate should be chosen for discounting the costs and benefits (see Annex A5).
3.7 Assess the cost and CO2 implications
If it is not clear qualitatively that lock-in poses an unacceptable risk, next attempt to answer the questions:
If we follow pathway C (carbon intensive), what are the risks to our economy if this turns out to be the wrong choice?
What would be the cost consequences of subsequently switching from pathway C to pathway G (low carbon intensity?
A more complex assessment would also quantify the probability of the different outcomes and the probability-weighted optimal decision.

ECA - Carbon lock-in toolkit
Guidelines for carbon- lock in assessment
15
A quantitative assessment, if undertaken, would involve some “time-travelling what-if
analyses” based on alternative outturns for international scenarios (international climate change framework or international energy prices). For example:
a) We are facing a decision today (call it 2015) – whether to put in place policies that will result in coal-fired power generation or gas-fired power generation to be commissioned in 2018.
b) Suppose we make the policy decision that results, directly or indirectly (for example by not intervening), in the development of coal-fired power plants that are then commissioned in 2018. We may make this policy decision in the expectation that the international framework for climate change will remain relatively weak and there will be no costs or benefits from adopting low carbon policies in the future.
c) Imagine that it is now five years after commissioning (2023), and the international framework for climate change has tightened since 2015 such that it is costing our economy the equivalent of US$50 per tonne of CO2 emitted. This is making some of our manufacturing industry uncompetitive compared with neighbouring countries who adopted low carbon policies and some of our industries are being forced to close. The cost to our economy can be represented as US$50 per tonne of CO2 emitted using the default emission factors in Annex A4.1 (or using specific emission factors if these are available).
d) Still imagining that it is 2023 and five years after commissioning of the coal-fired power plant, next consider the net cost implications if we now attempt to switch to a lower carbon technology such as a combined-cycle gas turbine (CCGT) plant burning natural gas, and compare this with the net cost of continuing to burn coal in the coal-fired power plant. The capital costs of the coal-fired power plant are now sunk (zero capital costs) and the economic costs of continuing to generate electricity using coal are now the fuel and O&M costs plus the costs of CO2 emissions at US$50 per tonne. This is then compared with the cost (capital, fuel and O&M costs and the costs of CO2 emissions also valued at US$50 per tonne) of building a new CCGT plant to generate electricity using natural gas. Comparing the costs of these two options, we can see the extra costs of abandoning the coal-fired power plants and switching to natural gas. Suppose the cost difference is substantial and, despite the harm being done to the country’s economy by the international carbon framework, the switch of pathways will be even more costly for our economy and would not be economically justified. This would mean that carbon lock-in is realised in this scenario.
e) We are now back to today (2014). How do we use the above information when
considering which pathway to take? The above is just one of the possible outturns for the international climate change framework. We can repeat the exercise for other outturns (and other dates in the future) using various scenarios for CO2 prices from sources such as those described in Annex A4. In our case studies, we considered three scenarios with values of US$0, US$25 and US$50 per tonne of CO2e. Combinations of outturn CO2 values and the two policy choices are shown in matrix form below (these

ECA - Carbon lock-in toolkit
Guidelines for carbon- lock in assessment
16
are purely illustrative and represent the net costs – capital, fuel, operating costs, CO2 costs and any other costs and benefits attributable to the option25).
If the outturn (e.g., in 2023) is a weak climate change framework equivalent to a zero value for reductions in CO2 emissions, then a decision to build a coal-fired power plant will perhaps have been vindicated – the high carbon path (costing US$700 million) has a lower net cost than the low carbon path (US$900 million). Similarly, with a CO2 value of US$25 per tonne, the choice of the high carbon path would have been vindicated. But with a CO2 value of US$50 per tonne, a high carbon decision would result in our economy facing high net costs and competitive disadvantage compared with other countries (costing US$2 billion per year compared with US$1.1 billion for the low carbon decision).
Table 1 Illustration of decisions and outturn costs under alternative CO2 price scenarios
Value of CO2 reductions Net economic cost of policy decisions, US$ million
(US$/tonne CO2e) Low carbon High carbon
0 900 700
25 1,000 900
50 1,100 2,000
If the future international climate change framework were certain to remain weak (US$0 per tonne) or moderately weak (US$25 per tonne), then the self-interested economically-rational policy is high carbon. If the framework is expected to tighten to the equivalent of US$50 per tonne, then the rational policy is low carbon.
Unfortunately, the future is uncertain and the international agencies provide ‘scenarios’ rather than forecasts of future energy prices or climate change frameworks.
If we could place a probability on each of the outcomes then we could make a decision analytically. For example, if there is an equal probability (i.e., 33.3%)of each scenario, then the probability weighted net cost of each decision would be:
Low carbon decision: US$1,000 million26
High carbon decision: US$1,200 million
In this case, the self-interested economically optimal decision is a low carbon policy because there is a high cost of getting it wrong (i.e., if the carbon value is the equivalent of US$50/tonne of CO2e). Although the incentives to switch to low carbon route is weak today, the low carbon approach provides a form of insurance against a strict international climate change framework that may impact retrospectively on a high carbon investment strategy.
25 This would not include the value of the output – electricity for example – unless the output differs between the options. This can potentially be part of a full cost-benefit analysis but for the purpose of the flow chart tool and deciding whether to consider carbon lock-in in a full cost-benefit analysis, only the major costs could be included. 26 0.333x900+0.333x1,000+0.333x1,100 = 1,000

ECA - Carbon lock-in toolkit
Guidelines for carbon- lock in assessment
17
However, if, for example, the weighting is 40%, 50% and 10% for each of the three climate change framework scenarios, then the probability-weighted cost of each decision would be:
Low carbon decision: US$970 million
High carbon decision: US$930 million
In this case, the self-interested economically correct decision is to choose the high carbon policy.
The IEA and others do not often place a quantitative probability on the likelihood of their scenarios for the climate change framework or for international energy prices and it will not often be possible to undertake a full probability weighted analysis of decisions versus outturns, but it is useful to understand how such an analysis should be undertaken in order to make informed judgements on policy choices.
The above represents a simplified representation of the decision analysis. There may be a range of policy options available (which may include an option to delay by five years, ten years, etc., or options to build-in flexibility by making a plant carbon-capture ready, etc.). There are a range of scenarios to be considered (climate change framework, energy prices, technology costs). And there may be flexibility to adapt to changed circumstances (e.g., retrofitting carbon capture and storage to a coal-fired power plant in response to a tighter international framework for climate change). A full analysis could be complex but the above describes in principle how the analysis should be undertaken and a conceptual framework for analysis that should be helpful to guide decision making even if a full cost-benefit analysis is not undertaken.
3.8 Make a decision
The final step is to take a decision. However, carbon lock-in risk is only one factor to consider in any investment or policy decision. The carbon lock-in guidelines provides help with just part of the analysis needed.

ECA - Carbon lock-in toolkit
Case studies
18
4 Case studies
The case studies described in this paper are designed to illustrate the potential problem of carbon lock-in. They demonstrate the circumstances under which carbon lock-in exists, how this can be analysed, and the implications for national policy makers and for donors when designing interventions.
As a reminder, carbon lock-in is realised when:
a carbon intensive pathway has been chosen, and,
once the pathway has been taken, it is very costly or institutionally difficult to change direction, and
the chosen pathway has negative economic consequences because of unfavourable circumstances for international energy prices, climate change framework, etc.
At the time a policy or investment decision is being taken, carbon lock-in is only a risk, not a certainty.
The focus of the Toolkit and the case studies is on national self-interest of developing countries but taking account of the opportunities and threats posed by future changes in the international framework affecting climate change and future trends in international energy prices.
The case studies identify some situations where the risk of carbon lock-in does exist, but equally it also describes some decisions that involve high carbon intensity, where the pathway can be reasonably easily reversed and where carbon lock-in does not exist.
Case studies have been drawn from three African countries and from a range of sectors including power generation, electrification, transport and industry. The case studies include low income, low-middle and upper-middle income countries and include countries that are rich in energy resources as well as countries that are largely dependent on imports of fossil fuels. Although drawn from specific countries and sectors, the analysis and conclusions in the case studies provide insights that are relevant to any developing country, in any region of the world, and in any sector.
The case studies attempt to be reasonably realistic but are designed to illustrate the issue of carbon lock-in and for that reason have been simplified to avoid mention of real-world complexities that confuse rather than illuminate the issue of carbon lock-in.
There are common inputs to all of these case studies. Sections A1 and 3 above described the common input scenarios and parameters that were incorporated in the case studies including:
possible future international agreements on climate change (Section A1 and specifically Section A1.4)
international energy prices (Section 3.3 and Annex A3)

ECA - Carbon lock-in toolkit
Case studies
19
Other input assumptions were largely specific to the countries concerned (Annex A6).
Summary of case studies
The six case studies are summarised below.
Urban transport in Kenya is interesting from a carbon lock-in perspective because irrespective of the problem of carbon intensity, urban development has a strong tendency toward lock-in that is difficult to reverse. Carbon intensity adds a further dimension to the more general problem of lock-in. In this case study, it would not be economically rationale to adopt mass-rapid transport systems for Nairobi if it is expected that the current international framework for climate change will remain in force, with a carbon price that is close to zero. This takes account of both the CO2 benefits and the other economic benefits from shorter travel times and lower expenditures on fuel. But if it is expected that the international framework will tighten to some extent and incentives will be introduced for developing countries such as Kenya to implement low carbon policies, then Kenya might be marginally or strongly encouraged to adopt mass rapid transport systems depending on the international framework (eg., after Kenya developd the Transport NAMA27 it received a development credit from World Bank and the African Development Bank for the mass-rapid transport system (MRTS)).
The problem in this case is that if Kenya chooses to follow a pathway that depends on private transport, Nairobi will be subject to the urban sprawl that is common to many cities worldwide and will then be locked in to transport infrastructure that depends on the use of private cars and a carbon intensive transport system. There are strong benefits to public transport systems that avoid congestion as well as the benefits from reduced CO2 emissions. In this example, there is a reasonably strong argument for investing in mass-rapid transport in order to protect against the risk of carbon (and ordinary) lock-in. If there is an equal probability of each of the three climate change scenarios occurring, then investment in mass-rapid transport would result in positive outcomes for the country in two out of three future scenarios.
Electrification based on mini-grids using renewable energy generation technology to supply remote communities is popular among the donor community and recipient countries. The Kenyan Government has decided to widen access and, in remote areas, to develop mini-grids. The main alternatives, if grid extension is not feasible, are carbon intensive diesel generators or renewable energy sources to supply these isolated grids. From the self-interested perspective of Kenya, if grants are not available, the analysis suggests that the cheapest way to provide these mini-grids would be based on diesel generators. If Kenya does choose diesel mini-grids, from a carbon lock-in perspective this will not prevent the country from switching to green mini-grids in the future. Should a diesel generator be installed today and it is later found that fuel costs rise and make renewable technologies the cheaper option or if the international climate change framework tightens and makes renewable energy more attractive, or if
27 Nationally appropriate mitigation actions.

ECA - Carbon lock-in toolkit
Case studies
20
renewable technology costs continue to fall, then Kenya could switch to green mini-grids in the future in a relatively short timeframe without major sacrifice of its diesel assets. Carbon lock-in appears not to be a strong factor supporting the decision to choose low carbon technologies for isolated mini-grids.
Nigeria is one of a number of developing countries in Africa and elsewhere that are considering whether to build new coal-fired power generation. Fuel mix examined through the lens of carbon lock-in is therefore interesting. The case study shows that even ignoring the risk of carbon lock-in, the lowest cost and optimal option for Nigeria is to build gas-fired power plants and utilise gas. However, there are various constraints to utilising gas and these are encouraging the use of coal. These constraints can only be overcome by policy makers. If these constraints to reliable gas supplies are not overcome urgently and the electricity industry builds coal-fired power plants, it will be very costly for Nigeria to switch to lower carbon technologies and it will be even harder to shift jobs created in the coal mining sector to other parts of the economy.
In Nigeria the topic of electrification based on mini-grids using renewable energy generation technology to supply remote communities is being considered in the same way that it is being considered in Kenya. In Nigeria’s case, the country has its own sources of fossil fuels and the case study considers how this impacts on the economic costs and benefits of renewable energy for supplying isolated mini-grids. Despite its status as a major oil exporter, Nigeria is a net importer of refined petroleum products and even though the country’s wealth may enable it to ‘afford’ the luxury of artificially low prices for petroleum products, the economic value is still the international market price plus import costs. Overall, Nigeria’s situation is similar to Kenya’s – a policy of allowing diesel generation to supply isolated mini-grids does not lock the country into this technology. Carbon lock-in appears not to be a strong factor supporting the decision to choose low carbon technologies for isolated mini-grids.
With carbon-capture and storage (CCS) the CO2 is captured at the point of combustion and stored rather than released into the atmosphere. It can be applied to power generation or to any large combustion process and in South Africa it has been proposed for both energy production and industrial energy consuming applications. It is not generally adopted in commercial applications but many coal-fired power plants worldwide are being developed to be CCS-ready. In this case study in South Africa we consider CCS applied to coal-fired power generation and we ask whether economic self-interest would suggest that power plants be made CCS-ready as a form of insurance in order to lower the cost of subsequent refit and help avoid the risk of carbon lock-in. The analysis suggests that only if there is a high probability that CCS will be required in the future (greater than 68%) would it be economically rationale to make a coal-fired plant CCS-ready. The calculations imply that even with a CO2 value of US$50/tonne, which is the top end of our range of scenarios, it would not be economically rationale to invest in CCS – whether a new build plant with CCS or a retrofit – because the value of the CO2 reductions would not outweigh the extra costs of CCS. (The case study also cautions that the evidence on which this calculation is based is weak and that it is not possible to draw firm conclusions using these data).

ECA - Carbon lock-in toolkit
Case studies
21
Energy efficiency measures are often retrofitted to industrial manufacturing processes in order to lower energy costs to the owners. The feasibility of retrofits implies that these industries have some opportunities to choose a less carbon intensive pathway and are not fully locked-in to a single pathway. Lock-in tends to involve major capital expenditures that, once the investment has taken place, involve substantial losses to reverse - even if the international energy market or climate change framework tightens. The energy efficiency case study in South Africa focuses on the cement industry - a sub-sector that is energy intensive and for which some major capital expenditures are required that have implications for energy consumption for many years to come. The finding from this case study is that the incentive for investing in energy efficient technology in new cement plants is currently reasonably weak, but despite this, if there is a reasonably good probability that the climate change framework will tighten in the future, then the best strategy would be to build new cement plants that are very energy efficient today rather than hope to retrofit in the future by which time the manufacturers will be locked-in and uncompetitive with firms in other countries who invest in the most efficient processes. If government believes that private firms will pursue short-term profit maximisation over medium-term and long-term profit optimisation, then policies that encourage or require private firms to adopt energy efficient technologies would make economic sense.
4.1 Kenya
Kenya is a low-income country with few fossil fuel resources of its own. It is both a DFID Tier 1 country and a priority country for the International Climate Fund. DFID is active in several sectors in Kenya.
Two topics have been chosen to illustrate the problem of carbon lock-in – urban transport and electrification (green mini-grids).
Urban transport is interesting from a carbon lock-in perspective because irrespective of the problem of carbon intensity, urban development has a strong tendency toward lock-in that has long-lasting implications that are difficult to reverse. Carbon intensity adds a further dimension to the more general problem of lock-in.
Electrification based on mini-grids using renewable energy generation technology to supply remote communities is popular among the donor community and recipient countries. This is a situation where an alternative carbon intensive path using diesel generation does not result in lock-in.
4.1.1 Transport
Transport sector emissions are growing rapidly, with emissions from the sector expected to triple between 2010 and 2030, from six million tonnes of CO2e in 201028. Much of this increase is due to the increase in the number of vehicles, estimated to have doubled from 600,000 in 2000 to 1.2 million in 2010. That said, the majority of individual trips in cities are still done
28 National Climate Change Action Plan.

ECA - Carbon lock-in toolkit
Case studies
22
on foot because public transport services are comparatively expensive and private cars are beyond the reach of most Kenyans. Public transport is relatively underdeveloped and dominated by privately owned mini-buses, known locally as Matatus29.
Kenya had roughly 1.4 million registered vehicles and 400,000 motorcycles in 2011, with approximately 60% of these vehicles used in and around Nairobi. New registrations of vehicles were approximately 200,000 in 2010, an increase of more than 20% over 200930.
Figure 5 Transport, all purpose (number of trips) in Nairobi excluding motorcycles
Source: 31
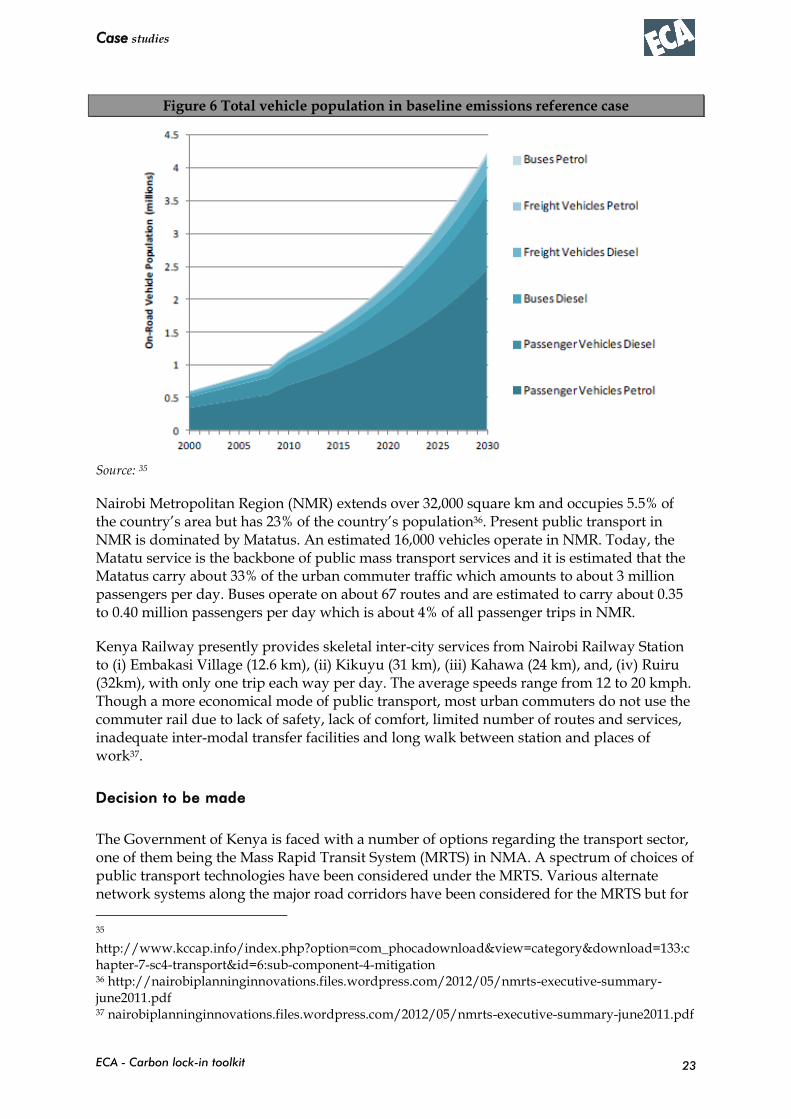
The projected number of vehicles is indicated in Figure 6, which are the major driver of transport emissions. Passenger vehicles show the largest increases over time32.
The Transport Plan quotes growth of 6.76 million in 2005 (Metropolitan area) to 20.6 million in 2030. Vehicle congestion is already severe and transport systems are being used at levels significantly exceeding capacity. Of particular concern is that 22% of passengers are in private vehicles accounting for 64% of traffic volume. The private car use is also increasing by 6.4% per annum33.
Transport currently accounts for 10% of total GHG emissions in Kenya. The focus of this low-carbon scenario analysis is the road sector, which is estimated to account for 99% of non-aviation transport GHG emissions in Kenya34.
29www.kenyacic.org/sites/all/themes/dawn/docs/Green%20Economy%20Assesment%20Report.pdf 30www.kccap.info/index.php?option=com_phocadownload&view=category&id=6&Itemid=41 31 www.kccap.info/index.php?option=com_phocadownload&view=category&id=6&Itemid=41 32 www.kccap.info/index.php?option=com_phocadownload&view=category&id=6&Itemid=41 33 https://static.weadapt.org/knowledge-base/files/758/4e25a3357a7dc5B-FINAL-kenya-low-carbon-growth-assessment-April.pdf 34 Kenya Climate Change Action Plan (KCCAP) – www.kccap.info. Chapter 20.
ECA - Carbon lock-in toolkit
Case studies
23
Figure 6 Total vehicle population in baseline emissions reference case
Source: 35
Nairobi Metropolitan Region (NMR) extends over 32,000 square km and occupies 5.5% of the country’s area but has 23% of the country’s population36. Present public transport in NMR is dominated by Matatus. An estimated 16,000 vehicles operate in NMR. Today, the Matatu service is the backbone of public mass transport services and it is estimated that the Matatus carry about 33% of the urban commuter traffic which amounts to about 3 million passengers per day. Buses operate on about 67 routes and are estimated to carry about 0.35 to 0.40 million passengers per day which is about 4% of all passenger trips in NMR.
Kenya Railway presently provides skeletal inter-city services from Nairobi Railway Station to (i) Embakasi Village (12.6 km), (ii) Kikuyu (31 km), (iii) Kahawa (24 km), and, (iv) Ruiru (32km), with only one trip each way per day. The average speeds range from 12 to 20 kmph. Though a more economical mode of public transport, most urban commuters do not use the commuter rail due to lack of safety, lack of comfort, limited number of routes and services, inadequate inter-modal transfer facilities and long walk between station and places of work37.
Decision to be made
The Government of Kenya is faced with a number of options regarding the transport sector, one of them being the Mass Rapid Transit System (MRTS) in NMA. A spectrum of choices of public transport technologies have been considered under the MRTS. Various alternate network systems along the major road corridors have been considered for the MRTS but for
35 http://www.kccap.info/index.php?option=com_phocadownload&view=category&download=133:chapter-7-sc4-transport&id=6:sub-component-4-mitigation 36 http://nairobiplanninginnovations.files.wordpress.com/2012/05/nmrts-executive-summary-june2011.pdf 37 nairobiplanninginnovations.files.wordpress.com/2012/05/nmrts-executive-summary-june2011.pdf

ECA - Carbon lock-in toolkit
Case studies
24
the purpose of this case study, we assume that the MRTS will include a combination of a bus rapid transit system (BRT)38 and a light rail transit system (LRTS). The exact nature of interaction between the two systems is not critical to the case study but it can be assumed that BRT will be the dominant mode of public transport complemented by some minimal use of LRT services.
Potential benefits of the MRTS include congestion reduction, time and economic savings, improved air quality and improved road safety as well as CO2 emission reductions.
The counterfactual situation could be based on a ‘do-nothing situation’, but in order to make our analysis more realistic we compare the costs and benefits of implementing the MRTS with those of investment in road improvements to accommodate the expected increase in passenger vehicles.
The decision to be made by the Government of Kenya is whether to implement policies that promote the use of public transport systems, such as the MRTS, with high capital costs, or whether to maintain the existing road infrastructure network.
When evaluating the cost- effectiveness of the MRTS versus the alternative, a number of factors are taken into account, including capital costs, operating costs, time savings, benefits to unskilled labour and the benefits to Kenya of averting CO2 emissions. From a carbon lock-in perspective, the question is whether the ‘conventional’ road transport option would set Kenya on a carbon intensive path that would be costly to divert from in the future, whether MRTS is more expensive in the long-run than the ‘conventional’ solution, and whether the insurance that MRTS provides against lock-in is worthwhile.
The costs to Kenya associated with a high carbon pathway would occur if Kenya could not benefit from support mechanisms offered by western countries (for example CDM credits, NAMAs, etc.). It is less likely that the country will be penalised through the international framework with BAM-type policies because of its urban planning decisions. Kenya would also suffer a loss of foreign direct investments in its economy because of the lack of modern road infrastructure which might discourage investors.
Institutional lock-in
There are no strong vested interests in Kenya that would seek to block moves toward MRTS now or in the future. The petroleum marketing and distribution companies would lose from policies that support MRTS, but though this group has strong industry representative bodies, we do not believe39 that these companies have the levers that could block the development of MRTS even if they wished to.
If Kenya does decide to follow a pathway that allows urban sprawl and private passenger transport, the automobile distribution companies and the petroleum marketing companies would have an increased interest in maintaining the status quo, and potentially increasing the risk of lock-in.
38 A BRT system usually has a dedicated right-of-way down the centre of the street to avoid delays with vehicles parked by the curb, priority at intersections, and various other characteristics that make journey times fast. 39 We have undertaken studies for the Ministry of Energy relating to the downstream petroleum sector in Kenya.

ECA - Carbon lock-in toolkit
Case studies
25
In the public sector there are institutional barriers because responsibilities and powers between local and central governments are not clearly defined. The ministries have a national focus. Local authorities, who have direct responsibility, lack the resources and capacity. The private operators, though rendering a service in enabling mobility of people, are constrained with their limited objectives, limited resources and capacity 40.
Vested interests are present, with the matatu owners being one example. However, those with vested interest are not politically active and usually they are not part of an organised union, so they are unlikely to influence public sector institutions to favour private road transport over public mass- transit systems.
Costs and benefits
As discussed above, we take the business-as-usual case to be a situation in which the Government makes some, relatively small, investments to improve the existing road network. A simple cost-benefit analysis is undertaken from a national perspective in order to calculate the net present value (NPV) of the MRTS project compared to the business as usual scenario.
A good public transport system not only changes the ownership patterns of private vehicles, but also the usage of private vehicles. A large reduction in traffic within the Nairobi metropolitan area will also have fuel efficiency benefits for the remaining vehicles due to reductions in congestion.
The MRTS contributes to the diversion of a very high proportion of private cars from road to buses and rail and serves part of the growing passenger traffic demand in Nairobi. As a result, there will be a reduction in the number of passenger cars on Nairobi roads compared with the business-as-usual case. There will be savings in travel time for passengers still traveling on roads due to reduced congestion and obviously also for those traveling by public transport. As a result there will be a reduction in air pollution in Nairobi because of the reduction in petrol and diesel consumption and reduced congestion on the roads41.
There will also be a reduction in the number of accidents on the roads. Investment in the MRTS could result in the reduction in private sector investment on passenger cars. Vehicles’ operation and maintenance charges, especially to the private sector, will be reduced. There could be cost savings to passenger car owners in terms of capital cost and operation and maintenance costs of cars if they switch over from road to MRTS for travel in Nairobi.
The Climate Change Action Plan provided estimates of the potential reductions of CO2 emissions as a result of the MRTS in Nairobi. According to that study, emissions reduction from the BRT and LRT systems will be in the order to 4,560 ktCO2e per year.
40 nairobiplanninginnovations.files.wordpress.com/2012/05/nmrts-executive-summary-june2011.pdf 41 http://mpra.ub.uni-muenchen.de/1658/1/MPRA_paper_1658.pdf

ECA - Carbon lock-in toolkit
Case studies
26
Figure 7 Emissions reduction as a result of the MRTS
Source:
42
The net economic benefits of the MRTS project compared to the business as usual scenario is estimated to be negative at around US$ 1.4 billion over a 25 year period without allowance for benefits of CO2 emission reductions43. When account is taken of emission reduction benefits equivalent to US$25 or US$50 per tonne of CO2, the net benefits increase to US$0.23 billion and US$1.9 billion respectively, as shown in Figure 8.
Alternative scenarios for international fuel prices have little impact on these results. Even with IEA’s 450 Scenario, in which international policies toward fossil fuels drive down the international market price of energy, the net benefits barely register any change.
Figure 8 NPV under different carbon price scenarios (IEA New Policies energy scenario)
42 ECN, 2012, Kenya’s Climate Change Action Plan: Mitigation, Chapter 7: Transportation, 43 Using IEA’s New Policies Scenario for international oil prices with local prices of petroleum products indexed to this.
-2,000
-1,500
-1,000
-500
-
500
1,000
1,500
2,000
2,500
No carbon price 25$ carbon price 50$ carbon price
NP
V (
USD
mill
ion
)

ECA - Carbon lock-in toolkit
Case studies
27
In this case study, it would not be economically rationale to adopt MRTS or to put in place policies that encourage or mandate MRTS if it is expected that the current international framework for climate change will remain in force with a carbon value that is close to zero. This conclusion takes account of both the CO2 benefits and the other economic benefits from shorter travel times and lower expenditures on fuel.
If it is expected that the international framework will tighten and incentives will be introduced for developing countries such as Kenya to implement low carbon policies, then Kenya might be marginally encouraged to adopt MRTS if the value of CO2 emission reduction is above US$25 per tonne and would be strongly incentivised if the value of CO2 emission reductions is guaranteed to reach US$50 per tonne.
If there is believed to be a high probability of a US$50/tonne international incentive framework, then it would be economically rationale for Kenya to invest in MRTS.
The problem in this case is that if Kenya chooses to follow a pathway that depends on private transport, Nairobi and other cities in Kenya will be subject to the urban sprawl that is common to many cities worldwide. A network of urban roads will be developed to allow urban commuters to drive to work.
Figure 9 shows how urban areas in Nairobi have been outwardly spreading from 2000 until 2013. During the past decade, Nairobi’s boundaries have been repeatedly extended to accommodate the spatial sprawl of human settlements. Improvement in road infrastructure provides an incentive for more people to spread into areas adjoining the edge of the city and use private transportation to commute to the city centre, which will call for further expansion of road infrastructure, which in turn will further aggravate the causes of urban sprawl. Once urban sprawl has taken place, it is much harder to superimpose public transport systems. Kenya’s cities will then be locked in to transport infrastructure that depends on the use of private cars and to a carbon intensive transport system.
In this example, there is a reasonably strong argument for investing in MRTS both because of the consequences of international energy prices and the climate change framework and, equally or more importantly, because of the benefits in terms of avoided congestion. If there is an equal probability of each of the three scenarios, then policies that promote MRTS would result in positive economic outcomes for Kenya in two out of three future scenarios.

ECA - Carbon lock-in toolkit
Case studies
28
Figure 9 Nairobi Urban sprawl between the year 2000 and 2013
Source: 44 Note: Brown areas show bare land, red areas shows roads, yellow areas show urban areas and green areas represent vegetation
4.1.2 Green mini-grids
As part of Kenya Vision 2030, the Rural Electrification Authority (REA) was established in 2007 with a mandate to achieve universal electrification by 2030 from only 18% in 2010.
International donors have targeted Kenya for low carbon development and climate change mitigation projects. One such example is the Scaling-Up Renewable Energy Program (SREP). SREP has selected Kenya as one of eight countries targeted to implement isolated renewable energy mini-grids and DFID has earmarked £30 million for Kenya from the Green Mini-Grids Africa programme45.
There are currently 21 existing mini-grids in Kenya46. A SREP investment plan identifies 68 projects that can either retrofit existing mini-grids with solar or wind capacity, are under construction, or are greenfield projects47.
44 esri-ea.maps.arcgis.com/apps/StorytellingSwipe/index.html?appid=71df40862b2046f1ab491acd32931078&webmap=bb54de6bab514de6b4540ee629a23ff9 45 DFID Climate Change Brief, September 2014. 46 13 are solely diesel-powered, 6 have solar-diesel hybrid systems, 1 is a diesel-wind hybrid, and 1 has all three methods. Another 10 are currently under construction, 7 of which will have solar or wind capacity (ECA, Trama Tecno Ambiental, Access Energy, 2014, ‘Project Design Study on the Renewable Energy Development of Off-Grid Power Supply in Rural Regions of Kenta’, Project no. 30979, KfW Development Bank). Note, DFID’s GMG Option study indicated that “..currently 18 diesel mini-grids in Kenya, expected to be 32 by end of 2013. Costs range from Kshs 40-60/kWh, with 75% of this for diesel fuels”. 47 Republic of Kenya, 2013, ‘Scaling-Up Renewable Energy Program (SREP)’, Project Document for Mini-Grid Development in Kenya, April.

ECA - Carbon lock-in toolkit
Case studies
29
In terms of the overall potential of GMGs, Innovation Energie Developpment (IED) calculates that as much as 23% of Kenya’s population would be most economically electrified via either isolated or grid-linked GMGs.48
Below we discuss the case for renewable mini-grids in Kenya from a carbon lock-in perspective and consider whether lock-in should be a factor in decision making by the Kenyan Government when considering measures to promote or encourage GMGs.
Decisions to be made
The goal of low emissions through GMGs is a worthwhile international goal, but is it optimal from Kenya’s national perspective?
Taking the government’s goal of universal electricity access as given, there are a range of options available to supply consumers in more remote parts of the country:
build local distribution networks and extend the main grid to connect these local grids,
build local distribution networks and supply from one or more small power plants connected to these networks,
supply electricity from distributed sources such as solar home systems (SHS) or solar photovoltaic providing electricity to individual households, shops, clinics, schools and public buildings,
supply battery operated products – typically charged by solar PV – such as pico-lamps which can also charge mobile phones and some can run small radios.
The economic optimality of these options depends on a range of factors including distance to the main grid and plans to extend the main grid, density of potential electricity load in a given village (small villages with scattered buildings tend to favour pico-lighting products), availability of energy resources (hydropower resources, solar or wind potential) and willingness to pay for electricity.
For the purpose of this study, we only consider communities for whom a mini-grid is assumed to be economically justified and the only feasible choices are a mini-grid supplied from diesel generators or one supplied from renewable energy or hybrid systems (i.e, a GMG).
From an economic and financial perspective, there are a number of factors to consider when evaluating GMGs versus diesel mini-grids. These include investment and operating costs, the efficiency and reliability of the energy provided, and the benefits to Kenya of averting CO2 emissions. From a carbon lock-in perspective, the question is whether either choice would set Kenyan energy infrastructure on a path that would be costly to divert from in the future.
48 IED, 2013, ‘Low Carbon Mini Grids – “Identifying the gaps; building the evidence base”, Support study for DfID, November.

ECA - Carbon lock-in toolkit
Case studies
30
Institutional lock-in
There do not appear to be institutional or political-economy barriers to the adoption of GMGs now or in the future. The diesel mini-grids currently owned by KPLC are loss making. Ultimately, Kenya’s Government or the customers served by the main grid provide subsidies to KPLC’s isolated-grids that use diesel and would prefer them to be closer to cost recovery. All parties would like the costs of electricity supplied by mini-grids to fall. There is also considerable interest by the electricity supply industry in renewable energy technologies, so there are unlikely to be future attempts to block a switch to renewable energy.
Petroleum marketing companies might have an interest in the status quo, but the margins are low and the supply of diesel to KPLC’s isolated grids will represent a relatively small component of their business.
We have not identified any obvious institutional or political-economy barriers to the adoption of GMGs in Kenya in the future.
Costs and benefits
We take the base case to be that the Government will seek to electrify the rural sector regardless as it believes that the economic benefits of electrification are clear. The economic question is then whether this policy can be implemented most cost-efficiently through GMGs or through diesel mini-grids.
IED’s feasibility studies found that with diesel costs of US$ 0.6/litre, the levelised economic cost of electricity (LCOE) of a diesel-solar hybrid system without battery storage to be US$0.255/kWh, rising to US$0.270-0.287/kWh with a storage system. This compares to US$0.218/kWh for a diesel-only system49. The report stresses this result cannot be taken as definitive proof that diesel-only mini-grids are the better economic solution. Solar capacity could be gradually expanded to lower initial capital costs. Applying any sort of cost to the CO2 emissions of the diesel generator, whether it be social, environmental, or expectations of future carbon prices, may make the diesel-solar hybrid system more attractive. Future declines in the cost of solar installations or rises in the price of diesel fuel would also make solar systems more attractive but there would also be benefits in delaying investment in solar PV if it is expected that prices will continue to fall in the future provided that there is flexibility to switch in the future.
The map of Africa below provides an example of areas where the diesel option and the solar PV option are the least cost options.
49 IED, 2013, ‘Low Carbon Mini Grids – “Identifying the gaps; building the evidence base”, Support study for DfID, November.

ECA - Carbon lock-in toolkit
Case studies
31
Figure 10 Estimated costs of electricity diesel versus PV minigrids in Africa
Source: IEA, 2013, Rural Electrification with PV Hybrid Systems
According to the above figure, in Kenya and Nigeria, diesel seems to be more economically attractive than solar-hybrid mini-grids at the present time.
Comparison of the levelised cost of mini-grids supplied by diesel generators versus mini-grids supplied by solar-diesel hybrids is provided in Table 2 below.
The fuel price scenarios are based on IEA forecasts and are differentiated primarily by their underlying assumptions about government policies:
The ‘new policies scenario’ – this is their central scenario which includes assumptions about the cautious implementation of policies that have been announced by governments but are yet to be given effect.
The ‘current policies scenario’ takes account only of policies already enacted as of mid-2013.
The ‘450 scenario’ shows what is required to set the energy system on track to have a 50% chance of keeping the long-term increase in average global temperatures to 2 degrees Centigrade.
The international oil prices associated with these scenarios are shown in Figure 11 below.

ECA - Carbon lock-in toolkit
Case studies
32
Figure 11 IEA oil price scenarios
Source: IEA World Energy Outlook, 2013. Crude oil import prices. Real 2012 price levels.
The ‘New Policies’ (or central) scenario leads to a gradual increase in world energy prices, with international crude oil import prices rising to an average of just under US$130 per bbl by 2035 (in real prices of 2012) compared with US$109 per bbl in 2012. The ‘Current Policies’ scenario leads to higher use of fossil fuels and therefore a higher demand, which pushes up prices in this scenario to US$145 per bbl by 2023. Perversely, a substantial effort to limit emissions in the 450 scenario would lower demand for oil and would therefore cause energy prices to fall. In the 450 scenario IEA forecasts indicate oil prices falling to US$100 per bbl by 2035.
A more detailed analysis of the underlying assumptions of each scenario is presented in Annex A3.1.
Table 2 Levelised costs – Diesel vs. solar-diesel hybrids (US$/kWh)
Fuel price scenario Diesel only Solar-diesel hybrid
New Policies 0.50 0.61
Current Policies 0.55 0.62
450 Scenario 0.46 0.61
The above shows that without accounting for the benefit of CO2 emission reduction, mini-grids supplied by diesel-only plants have lower levelised costs than solar-diesel hybrids. These calculations exclude the value of CO2 credits that may be available.
It is interesting to note:
The IEA scenario which is the most aggressive at encouraging emission reduction, leads to lower energy prices that ultimately would make it cheaper to burn fossil fuels in mini-grids (US$ 0.46/kWh) compared with US$0.55/kWh in the business-as-usual scenario).
0
20
40
60
80
100
120
140
160
2012 2020 2025 2030 2035
US
$ p
er
bb
l
New policies Current policies 450 scenario

ECA - Carbon lock-in toolkit
Case studies
33
International fossil fuel prices have virtually no impact on costs when solar hybrid systems are installed. These remain in the range US$0.61 to US$0.62/kWh whatever happens on the international market.
Table 3 below shows the range of cost outcomes for different combinations of scenarios for fuel prices and the value of CO2 emission reduction.
Table 3 Levelised costs – Diesel and solar-diesel hybrids – various scenarios (US$/kWh)
Fuel price scenario Carbon price scenario (US$/tonne)
0 25 50
Diesel only
New Policies 0.508 0.538 0.568
Current Policies 0.547 0.577 0.607
450 Scenario 0.456 0.486 0.516
Solar-diesel hybrid
New Policies 0.614 0.616 0.618
Current Policies 0.617 0.619 0.621
450 Scenario 0.609 0.612 0.614
This shows that mini-grids served by diesel generators remain the lowest cost option under all scenarios examined.
The breakeven value for CO2 that would make GMGs more attractive than diesel mini-grids – when combined with the New Policies fuel price scenario – is US$95/tonne.
If the price of fuel were constant (instead of varying with IEA’s forecast of international fuel prices), the breakeven price of fuel would need to be 22.5% above the base price of US$ 1 per litre. This may not appear to be an unlikely scenario but the analysis is in economic terms and taxes – which make up a very large part of delivered prices in most countries – should be excluded.
The key question for the purposes of this study was “what happens if Kenya chooses diesel mini-grids based on one forecast of diesel prices, but that forecast proves to be optimistic and fuel costs turn out to be much higher, or equivalently what happens if the international framework for climate change tightens and Kenya faces competitive disadvantage because of its choice of carbon intensive technology?”. The above analysis suggests that even in the worst case, with high implied penalties for emitting CO2 and high international energy prices, a diesel-only mini-grid remains lower cost (at US$0.607/kWh) than a solar-diesel hybrid mini-grid.
A related question is whether investment in diesel mini-grids rather than GMGs would force Kenya down a carbon intensive path that would be difficult to reverse. If it is not costly to switch to low carbon technology at a future date, then the economically most efficient strategy might be to choose diesel today and then switch in the future. If a diesel mini-grid is

ECA - Carbon lock-in toolkit
Case studies
34
installed in a rural Kenyan community, the cost of switching to solar- or wind-based power at a future date rather than today is relatively low because diesel generators have relatively low capital costs and relatively short economic lives. Diesel generators can also be used in combination with wind/solar plants to provide energy when the intermittent resource is not available (most wind/solar systems incorporate a diesel generator as backup - SREP’s current investment plan includes retrofitting current diesel-powered mini-grids into wind or solar hybrids). Lastly, diesel generators that are in good condition can generally be re-used.
Downward trends in the cost of renewable energy technologies would also favour a policy of delaying the introduction of GMGs and, instead, introduce diesel generation.
Without subsidies from the international community to adopt GMGs, economic self-interest may actually favour a policy of implementing diesel mini-grids and waiting for the international climate framework to tighten.
Of course, the attraction of GMGs to Kenya is that the international community offers substantial capital subsidies. In the above examples, grants of 85% of the capital costs were to be provided which lowered the LCOE of GMGs to between US$0.12 and US$0.13/kWh (generation only). In the past, donors have provided capital subsidies to diesel mini-grids but they are generally unwilling to provide fuel subsidies and many of the subsidised diesel mini-grids in other countries fell into disuse because local communities could not afford the fuel costs (of around US$0.45/kWh. GMGs therefore become attractive to developing countries compared with diesel mini-grids because GMGs have low fuel/operating costs and allow more substantial subsidies to be provided up-front.
From Kenya’s perspective, the self-interested economic justification for choosing GMGs rather than diesel mini-grids is based on the current availability of capital subsidies. Without those subsidies, the analysis suggests that the least-cost option would be to choose diesel mini-grids. From a carbon lock-in perspective, if energy prices rise further than predicted or the international climate change framework tightens, then Kenya could switch to lower carbon technologies.
4.1.3 Conclusions
The Kenyan Government has decided to widen access and, in some areas, to develop mini-grids. There are both economic and environmental considerations when choosing between installing diesel generators or renewable energy for these grids. From the self-interested perspective of Kenya, if grants are not available, the analysis suggests that the cheapest way to provide these mini-grids would be based on diesel generators. If Kenya does choose diesel mini-grids, from a carbon lock-in perspective, the choice of a carbon intensive path will not prevent Kenya from switching to GMGs in the future. Should a diesel generator be installed today and it is later found that fuel costs rise and make renewable technologies the cheaper option or if the international climate change framework tightens and makes GMGs more attractive, or if renewable technology costs continue to fall, then Kenya could switch to GMG in the future in a relatively short timeframe without major sacrifice of its diesel assets.
Kenya’s self-interested economic justification for adopting GMGs is based on the availability of capital subsidies from the international community for GMGs that lowers the levelised cost of electricity from GMGs compared with diesel mini-grids. This is a surrogate carbon price.

ECA - Carbon lock-in toolkit
Case studies
35
Carbon lock-in appears not to be a strong factor supporting the decision to choose low carbon technologies for mini-grids.
4.2 Nigeria
Nigeria is a low-middle income country with abundant fossil fuel resources (oil, natural gas and coal) and considerable hydropower resources. It is both a DFID Tier 1 country and a priority country for the International Climate Fund. DFID is active in infrastructure in Nigeria, with a particular focus on the power sector.
Two topics have been chosen to illustrate the problem of carbon lock-in – the fuel mix used for power generation and electrification (mini-grids).
Western countries are increasingly strict in issuing licences for new coal-fired power plants and environmental constraints are forcing plants to close. However, many developing countries have found that increasing prices of natural gas make gas-fired power generation expensive, practical problems often exist in developing hydropower plants, and renewable energy is expensive and its availability when it is needed is not guaranteed. Many African countries also have substantial coal resources. Nigeria is one of a number of countries that are seriously planning to build new coal-fired power generation. Fuel mix examined through the lens of carbon lock-in is therefore interesting.
In Nigeria the topic of electrification based on mini-grids using renewable energy generation technology to supply remote communities is being considered in the same way that it is being considered in Kenya. In Nigeria’s case, the country has its own sources of fossil fuels and the case study considers how this impacts on the economic costs and benefits of renewable energy for supplying isolated mini-grids.
4.2.1 Fuel mix
Context
Poor access to electric power is a key issue for Nigeria, restricting economic growth and efforts to overcome poverty; around 60% of the population have no access to electricity (Nigeria Vision 20: 2020). Nigeria has one of the lowest net electricity generation per capita rates in the world. Electricity generation falls short of demand, resulting in load shedding, blackouts, and a reliance on private generators. As a result, more than 30% of electricity is produced by polluting and inefficient private diesel generators - businesses often purchase costly generators to use as back-up during outages. These generators run on diesel and, in the case of small generator sets, gasoline. This increases the reliance of businesses on oil products and, in turn, increases the cost of electricity (Bazilian & Onyeji, 2012). There is estimated to be some 3,600 MW of non-residential diesel generation capacity and 900 MW of residential diesel generation capacity.50 Although the cost of operating these units is higher than the grid tariff, they provide a reliable supply when it is needed, which is essential for business operation. According to a national report (the “Roadmap”) “self-generation of
50 See: J. Ikeme and Ebohon J. O (2005) Nigeria’s electric power sector reform: what should form the key objectives? Energy Policy, Vol. 33 (9) pp. 1213-1221.

ECA - Carbon lock-in toolkit
Case studies
36
electricity (from diesel and petrol generators) is conservatively estimated at a minimum of 6,000 MW, i.e. more than twice the average output from the grid during 2009”51.
Installed generating capacity at the end of 2013 was estimated at 10,400 MW but available capacity was only 6,000 MW52. The Federal Government of Nigeria (FGN) had plans to increase capacity to 40,000 MW by 202053. FGN policy favours the private sector for investment and operation of power generation, but according to the Roadmap FGN “acknowledges that there is a case for some limited involvement by the FGN in the financing of renewable forms of power generation e.g. hydro (or other renewables) and in stimulating production of power from coal”.
83% of available capacity is currently thermal (natural gas) and the balance is hydropower54. The Roadmap states that FGN will “focus on electricity generation in three areas, namely: Hydro, Coal and Natural Gas, of which the latter represents the largest resource for fuel-to-power”.
Coal and natural gas are abundant in Nigeria. Coal reserves are estimated at 2.7 billion tonnes55. Nigeria’s natural gas reserves are more than 5 trillion cubic meters, which ranks it as the 9th largest worldwide56.
Following the major reforms in the power sector over the past two years, there has been a growing interest in coal-fired power generation. One coal-fired plant is said to be under construction57 in Kogi State with a capacity of 1,200 MW with the first phase of 600 MW to be completed between 2015 and 2018. Press reports suggest several other private developers are also interested in developing coal-fired power generation.
Investment in coal-fired power generation implies major capital costs both in the power plant and in the coal mine, and coal is the most carbon intensive forms of power generation. Once the investment in coal-fired power generation is made, there is limited scope for switching to alternative fuels. It is possible, for example, to convert the (coal-fired) steam plants to run on natural gas. The capital cost of conversion to natural gas is not a major deterrent by itself, but the power plants will typically be located close to coal mines (to minimise transport costs) and the cost of developing gas pipelines to supply the plants may be excessive. Additionally, the efficiency of a coal-fired power plant that is converted to run on natural gas will be much lower than the efficiency of a combined-cycle power plant designed specifically to run on natural gas. Depending on the location of the coal mine, it may also be difficult to find alternative uses for the coal. For these reasons, a subsequent conversion of coal-fired power plants to burn natural gas is likely to be economically unjustified unless the value to Nigeria of CO2 emission reduction is high.
Conversion of a coal-fired power plant to burn biomass is also technically feasible. The 3,700 MW coal-fired power plant at Drax in the UK was, for example, converted to burn biomass (various types) but this is only feasible where the constraints on burning coal are
51 Roadmap for Power Sector Reform, Presidential Action Committee on Power & Presidential Task Force on Power, 2010. 52 A Guide to the Nigerian Power Sector, KPMG, December 2013. Other figures are also quoted. 53 Roadmap, 2010. 54 KPMG,2013. 55 Economic Viability of Coal based Power Generation for Nigeria, Ujam, A. J., and Diyoke C., American Journal of Engineering Research, 2013. 56 KPMG, 2013. 57 Wikipedia: List of power stations in Nigeria.

ECA - Carbon lock-in toolkit
Case studies
37
very restrictive or the framework for promoting low carbon provides very large financial incentives. This would not be the case in Nigeria if Nigeria policies are driven by self-interest and it bases its investment decisions on the incentives or penalties currently offered by the international framework for climate change.
Decision to be made
The decision to be made relates to the introduction of policies relating to the fuel mix used for power generation, and specifically to policies that discourage carbon intensive coal-fired power generation. The exact nature of those policies is not critical to the case study but it could include, for example, any or all of an enabling framework that makes it easier to develop gas-fired power generation, policies that encourage the development of power transmission lines that bring power from areas with hydropower potential, taxes that penalise carbon intensive coal-fired power plants, or regulations that limit the number of coal-fired power plants.
As described in Annex A6.3, there will be costs to Nigeria associated with a high carbon pathway either because Nigeria will not be able to benefit from support mechanisms offered by western countries (CDM credits, NAMAs, etc. or their equivalents) or because Nigeria will suffer a loss of competitiveness in its exports because western countries impose trade barriers on countries with high carbon intensity.
A key issue is whether Nigeria will become locked-in to a carbon intensive future if it does not implement policies that are supportive of low carbon technologies or conversely whether Nigeria will avoid becoming locked-in if it implements such policies in the near future.
National scenarios
It can legitimately be argued that the counterfactual to Nigeria encouraging, or at least not discouraging, coal-fired power generation is that there will be continued power shortages and continued use of small diesel generators to meet the supply shortfalls. The carbon intensity of this counterfactual is likely to be equal to or greater than that of coal-fired power generation. However, shortages should not last indefinitely. For this reason, and to simplify the case study, we assume that the counterfactual for coal-fired power plants will be gas-fired power plants.
One of the key parameters affecting the decision of whether to adopt policies favourable to gas utilisation in power generation relates to the economic value of natural gas and coal. The economic value is the opportunity cost of these fuels to Nigeria. Normally, for a country such as Nigeria where oil, gas and coal can be exported58, the opportunity cost is the international market price less the cost of transportation to the market.
58 Gas can be exported and is exported as liquefied natural gas (LNG) and through the West Africa Gas Pipeline. Oil is exported, though oil products are imported because Nigeria does not have sufficient refining capacity to produce oil products to meet its own demand. Coal can, in principle, be exported though in practice the comparatively high production costs combined with the cost of transportation to international markets is likely to make this unviable.

ECA - Carbon lock-in toolkit
Case studies
38
In some instances, gas used in power generation would otherwise be flared and the opportunity cost would therefore be just the cost of collecting and processing the gas, which has been estimated at US$0.5 per mmbtu59. Alternative scenarios should be considered including the possibility that the gas would otherwise be exported as LNG, in which case the opportunity cost would be considerably higher and would be linked to international energy prices. As shown in Annex A3, there is no single international price for natural gas but there are three main regional gas trading zones – the US, Europe and the Far East. Prices are highest in the Far East and lowest in the US where abundant shale gas has depressed the market price and restrictions on gas exports have prevented the lower price from dampening prices in other parts of the world. The relevant international benchmark price for Nigerian gas is likely to be the European market and the cost of liquefaction and shipping of LNG will bring the netback price to Nigeria down to a level above US$ 8 per mmbtu.
The economic value of coal used in power generation is more difficult to link to international market prices because it depends on the (considerable) costs of transport to the market. Other studies have indicated a cost of US$ 42/tonne at the mine-mouth in 2010 price levels. Given international price projections (Annex A3), this seems relatively low and may reflect the cost of production rather than the opportunity cost. We have conservatively assumed a delivered price of US$50 per tonne which, for simplicity, we assume remains constant in real terms.
Institutional lock-in risk
The energy sector is dominated by oil. Much of the available gas in Nigeria is associated with oil production and the value of oil production is substantially greater than the value of gas production. There are techno-economic constraints to providing a guaranteed flow of natural gas required for power generation when gas production is secondary to the production of oil. The state-owned petroleum industry faces capital constraints and earns higher returns from investment in oil than it does from gas, and therefore prioritises oil investment over gas.
Coordinating gas collection, processing and transmission systems (which are owned and operated by different parties, including international oil companies in joint venture with the national petroleum company) and electricity generation and transmission (also now separately owned), all of which require substantial capital investment, is complex. Private independent power producers are reluctant to invest in the development of gas-fired power plants which may be stranded without natural gas, and the oil companies are reluctant to develop gas collection and processing facilities that may become stranded without a gas transmission system to transport the gas to the power plants. Against this background, coal-fired power plants are much safer for a private investor.
Coal mining creates substantial numbers of jobs and experience from other countries suggests that once a coal industry becomes established and communities come to depend on coal mining as a source of income, it becomes politically very difficult to move away from coal toward other fuels in the future. This is the case in all countries from developed countries such as Germany today and the UK in the 1980s and 1990s through to developing countries such as South Africa. Once a coal mining industry is established, even if the cost of 59 This is based on the analysis of the long-term marginal cost of natural gas in Nigeria as presented in the back-up information for the 2008 Natural Gas Pricing Policy.

ECA - Carbon lock-in toolkit
Case studies
39
switching to other fuels is low, there will be strong vested interests in keeping the coal industry alive.
Costs and benefits
We have undertaken a simple cost-benefit analysis from a national perspective in order to calculate the net costs of electricity generation from coal-fired power plants versus gas-fired plants under alternative scenarios for the economic value of fuels and the international framework for climate change.
The analysis shows that gas supportive policies win over coal supportive or neutral policies if gas is assumed to have a low economic value (because gas would otherwise be flared). This would imply that the risk of carbon lock-in does not need to be invoked to support gas utilisation policies. Avoiding the risk of carbon lock-in would simply strengthen the argument in favour of natural gas. If it could be asserted with certainty that the economic value of gas is only US$0.5 per mmbtu, then there would be no need to consider carbon lock-in further because the arguments for the low carbon policy is sufficiently strong already.
However, if the economic value of gas is higher, for example if the alternative is assumed to be to export the gas as LNG rather than flaring, and the value of gas is, say US$8 per mmbtu (the implications of other scenarios for gas prices are presented in Annex A7, then there could be an economic benefit to Nigeria in developing coal-fired power generation unless the carbon abatement value is above US$25 per tonne of CO2. The levelised costs of power generation under different scenarios for carbon abatement values are shown in Table 4 below.
Table 4 Levelised cost of electricity for alternative generation - Nigeria
Natural gas Coal
Levelised cost (US$/kWh)
Value of CO2 emission reduction – US$0/tonne 0.096 0.087
Value of CO2 emission reduction – US$25/tonne 0.107 0.105
Value of CO2 emission reduction – US$50/tonne 0.117 0.123
If the value of carbon abatement is US$25/tonne, then coal-fired power generation is slightly more attractive than gas utilisation. But at US$50/tonne natural gas becomes substantially more attractive (nearly 5% cheaper).
Suppose that on the basis of the current messages from the international climate change framework, Nigeria rejects policies favourable to gas utilisation and chooses instead to implement policies that, whether deliberately or not, lead to the development of coal-fired power generation.
Now suppose further that circumstances change in the future, say in ten years’ time, and it becomes clear in 2025 that Nigeria’s economy is suffering because of the carbon intensive path that it took in 2015 – equivalent to, say, US$50/tonne of CO2e. Will Nigeria then be locked into this carbon intensive path or will the carbon value make it worthwhile to change path?

ECA - Carbon lock-in toolkit
Case studies
40
In this case, it would not be economically justified to mothball the relatively new (10-year old) coal-fired power plants and to build a new gas-fired plant in their place and benefit from the relatively attractive CO2 emission reduction incentives. Even with CO2 emission reductions worth the equivalent of US$50/tonne it would not now be economically justified because the capital costs of the coal-fired plant are now sunk.
In general, once a coal-fired pathway is taken, it would be economically irrational for Nigeria to scrap/mothball its coal-fired power plants in the future unless the value to Nigeria of CO2 emission reduction moves above US$105/tonne when gas is valued at US$8 per mmbtu).
In summary, the results show that if the value of gas is below relatively low (below US$9 per mmbtu) then faced with the choice today, the economically rational option for Nigeria is to build gas-fired power plants and utilise gas even if there is no financial value to Nigeria in carbon abatement. But, once coal-fired power plants are built, the incentive for Nigeria to adopt low carbon policies becomes hugely weaker unless the international community introduces much higher financial incentives than it offers today or much stronger implicit financial penalties on countries with high carbon intensity equivalent to over US$105 per tonne of CO2.
The implications of this are relevant for both Nigeria and the international community. For Nigeria, the case study shows there is a strong case for using gas even if the value of gas is reasonably high. But it suggests that if, for whatever reason, coal-fired plants are developed, then once commissioned, the incentives required to make it attractive for Nigeria to switch to gas-fired power generation become much higher. The key message of this case study is that abatement in the future may be much more expensive than today due to carbon lock-in.
4.2.2 Electrification
Nigeria had an electrification rate of 52% in 2011, which is relatively high compared to the Sub-Saharan African average of 32%. However, the 84 million Nigerians who do not have access to electricity make up 14% of all Sub-Saharan Africans without electricity. The scale of the problem is massive.
One facet of Electric Power Sector Reform Act (EPSRA) in 2005 was the establishment of the Rural Electrification Agency (REA), which supports rural electrification programmes via the Rural Electrification Fund. Both public and private sector participation is encouraged for developing mini-grids to increase rural electrification. The government has previously sought to extend existing grids to rural areas, but this has not been accompanied by expanded generation capacity. Developing mini-grids could be a more economical way to achieve the country’s electrification goals.
Decision to be made
The decision to be made in Nigeria is identical to the decision described for Kenya. To allow this case-study to be capable of being stand-alone, this decision is repeated below. However, an important difference between Kenya and Nigeria is that Nigeria is a major world oil producer whereas Kenya is an importer of all of its petroleum products. The economic opportunity cost of consuming petroleum products in Nigeria ought therefore to be lower than in Kenya. This is discussed in the following sub-section (describing national scenarios).

ECA - Carbon lock-in toolkit
Case studies
41
Taking the Federal Government’s goal of 76% electrification by 2025 as given, there are a range of options available to supply consumers in more remote parts of Nigeria:
build local distribution networks and extend the main grid to connect these local grids,
build local distribution networks and supply from one or more small power plants connected to these networks,
supply electricity from distributed sources such as solar home systems (SHS) or solar photovoltaic providing electricity to individual households, shops, clinics, schools and public buildings,
supply battery operated products – typically charged by solar PV – such as pico-lamps which can also charge mobile phones and some can run small radios.
The economic optimality of these options depends on a range of factors including distance to the main grid and plans to extend the main grid, density of potential electricity load in a given village (small villages with scattered buildings tend to favour pico-lighting products), availability of energy resources (hydropower resources, solar or wind potential) and willingness to pay for electricity.
Figure 12 below shows the locations where higher population density and the coverage of the transmission grid in Nigeria tend to favour on-grid electricity supply (blue dots) and the areas where grid extensions are not cost- effective and where mini-grids (green dots) provide the preferred solution60.
Figure 12 IEA’s estimated potential for mini-grids
Source: IEA, 2014, World Energy Outlook, p. 541
60 IEA, 2014, World Energy Outlook

ECA - Carbon lock-in toolkit
Case studies
42
Here we assume that economic analysis undertaken by the Government shows that a given village/area is too remote to be supplied from the main grid in the immediate future but has a sufficiently concentrated potential electricity load and willingness-to-pay such that it is economically optimal to develop a mini-grid for that village/area (i.e., it is one of the blue dots in IEA’s Figure 12 above). The choice is then between supplying that mini-grid with diesel generators or supplying it with renewable energy or hybrid renewable energy/diesel systems.
From an economic and financial perspective, there are a number of factors to consider when evaluating these options of generating electricity for mini-grids. These include investment and operating costs, the efficiency and reliability of the energy provided, and the benefits to Nigeria of averting CO2 emissions. From a carbon lock-in perspective, the question is whether either choice would set Nigeria on a path that would be costly to divert from in the future.
National scenarios
One of the key scenarios affecting the investment choice is the economic value or opportunity cost of diesel consumed in Nigeria. Because Nigeria is an oil exporter, the economic cost of using petroleum products in, for example, electricity generation, is the foregone value of exports less the cost of transportation to the international market. The economic value of diesel consumed in Nigeria is therefore linked to the international market price as described in Annex A3.
Although Nigeria is Africa’s largest exporter of crude oil, it imports more than 70% of its demand for refined petroleum products61 including diesel. Some of the imports of petroleum products are based on crude-for-product swaps with the Ivory Coast and the Netherlands.
At the margin, because crude oil is exported and refined products imported, the opportunity cost of diesel consumed in Nigeria is effectively the internationally market price, and the economic evaluation of mini-grid options is therefore the same as that of Kenya. While it is true that if the international market price of oil increases, Nigeria’s oil revenues will increase, perversely, at the same there will be a higher economic (opportunity) cost incurred for every litre of diesel consumed and a stronger case for switching to renewable technologies. Nigeria is no different in this respect than Kenya.
Nigeria has plans to expand its refining capacity and to become an exporter of refined petroleum products. When this takes place, the opportunity cost of diesel consumed in Nigeria will be lower than in countries such as Kenya. The opportunity cost will then be the international market price less the cost of transportation62. When this happens, the economic cost of diesel will be lower than in Kenya to some extent. This will make diesel based mini-grids in Nigeria cheaper than in Kenya, and will make generation from renewable energy slightly less attractive than in Kenya.
61 Bloomberg, 18 November 2013. 62 Refineries in Nigeria will either be located at ports, giving them easy access to international markets, or close to the centres of demand such as Lagos. Two of the existing refineries at Lagos have access to both ports and demand. Warri refinery is close to ports, and only Kaduna refinery is inland but is strategically located in the north of the country. The transportation costs to take crude or products to the international market include transport to ports, port costs, and shipping costs.

ECA - Carbon lock-in toolkit
Case studies
43
Institutional lock-in risk
As with Kenya, there do not appear to be institutional or political-economy barriers that would prevent mini-grids switching to renewable energy in the future.
Petroleum marketing companies might have an interest in supplying diesel to mini-grids, but these will be a very small share of their overall sales and it is unlikely to warrant efforts to deter renewable-based mini-grids.
Diesel based mini-grids may be provided with subsidised fuel. There is a risk that the subsidy will become ‘locked-in’, but this is likely to give encouragement to a future switch to low carbon technology in the future – it would not entrench the use of high carbon technology. There does not appear to be a risk of institutional lock-in if Nigeria chooses to adopt diesel based mini-grids.
Costs and benefits
The costs and benefits of diesel versus renewable generation for generic isolated mini-grids will be more-or-less the same for Nigeria as they are for Kenya. As discussed above, fuel prices in economic terms may be different in Nigeria, but if anything they will be lower. On the whole, costs tend to be higher in Nigeria than in other countries because the cost of doing business is generally higher. Additionally, the petroleum industry tends to distort the economy, leading to higher costs in the non-traded sector (i.e., engineering design, construction and finance costs will tend to be higher in Nigeria than in Kenya) – this will tend to push up the costs of less conventional technologies compared with Kenya. In general, the cost-benefit analysis would tend to favour diesel generation options in Nigeria more strongly than they do in Kenya. For completeness, to provide a stand-alone case study, we reproduce below the analysis for mini-grids in Nigeria.
Note, the three international fuel price scenarios are based on IEA projections as described in greater detail for the Kenya case study (Section 4.1.2) and in Annex A3.1. The ‘New Policies’ scenario represents IEA’s central projection with oil prices rising from US$109 per bbl in 2012 to US$128 per bbl in 2035 (in real prices). The ‘Current Policies’ scenario results in continued growth in the use of fossil fuels leading to upward pressure on prices, bringing international oil prices to US$145 per bbl by 2035. The ‘450 scenario’ is a concerted effort to tackle climate change but perversely results in a fall in international oil prices to US$100 per bbl by 2035.
We take the base case to be that the Federal Government will seek to electrify the rural sector to increase access. It may not achieve the target of 76% by 2025 but we assume it will move forward with its electrification strategy including supply of electricity to some remote communities. The economic question is then whether this policy can be implemented most cost-efficiently through mini-grids supplied by renewable energy or through diesel mini-grids.
Comparison of the levelised cost of mini-grids supplied by diesel generators versus mini-grids supplied by solar-diesel hybrids is provided in Table 2 below.

ECA - Carbon lock-in toolkit
Case studies
44
Table 5 Levelised costs – Diesel vs. solar-diesel hybrids (US$/kWh)
Fuel price scenario Diesel only Solar-diesel hybrid
New Policies 0.50 0.61
Current Policies 0.55 0.62
450 Scenario 0.46 0.61
The above shows that without accounting for the benefit of CO2 emission reduction, mini-grids supplied by diesel-only plants have lower levelised costs that solar-diesel hybrids. These calculations exclude the value of CO2 credits that may be available.
It is interesting to note:
The IEA scenario which is the most aggressive at encouraging emission reduction, leads to lower energy prices that ultimately would make it cheaper to burn fossil fuels in mini-grids (US$ 0.46/kWh) compared with US$0.55/kWh in the business-as-usual scenario).
International fossil fuel prices have virtually no impact on costs when solar hybrid systems are installed. These remain in the range US$0.61 to US$0.62/kWh whatever happens on the international market.
Table 3 below shows the range of cost outcomes for different combinations of scenarios for fuel prices and the value of CO2 emission reduction.
Table 6 Levelised costs – Diesel and solar-diesel hybrids – various scenarios (US$/kWh)
Fuel price scenario Carbon price scenario (US$/tonne)
0 25 50
Diesel only
New Policies 0.508 0.538 0.568
Current Policies 0.547 0.577 0.607
450 Scenario 0.456 0.486 0.516
Solar-diesel hybrid
New Policies 0.614 0.616 0.618
Current Policies 0.617 0.619 0.621
450 Scenario 0.609 0.612 0.614
This shows that mini-grids served by diesel generators remain the lowest cost option under all scenarios examined.
The breakeven value for CO2 that would make renewable energy generation more attractive than diesel mini-grids – when combined with the New Policies fuel price scenario – is US$95/tonne.

ECA - Carbon lock-in toolkit
Case studies
45
If the price of fuel were constant (instead of varying with IEA’s forecast of international market prices for energy), the breakeven price of fuel would need to be 22.5% above the base price (of US$ 1 per litre). This may not seem an unlikely scenario, but it should be noted that this is an economic analysis and therefore excludes taxes which make up the larger share of delivered fuel prices in most countries.
The key question for the purposes of this study was “what happens if Nigeria chooses diesel mini-grids based on one forecast of diesel prices, but that forecast proves to be optimistic and fuel costs turn out to be much higher, or equivalently what happens if the international framework for climate change tightens and Nigeria faces competitive disadvantage because of its choice of carbon intensive technology?”. The above analysis suggests that even in the worst case, with high implied penalties for emitting CO2 and high international energy prices, a diesel-only mini-grid remains lower cost (at US$0.607/kWh) than a solar-diesel hybrid mini-grid.
A related question is whether investment in diesel mini-grids rather than mini-grids using renewable energy would force Nigeria down a carbon intensive path that would be difficult to reverse. If it is not costly to switch to low carbon technology at a future date, then the economically most efficient strategy might be to choose diesel today and then switch in the future. If a diesel mini-grid is installed in a rural Nigerian community, the cost of switching to solar- or wind-based power at a future date rather than today is relatively low because diesel generators have relatively low capital costs and relatively short economic lives. Diesel generators can also be used in combination with wind/solar plants to provide energy when the intermittent resource is not available (most wind/solar systems incorporate a diesel generator as backup. Lastly, diesel generators that are in good condition can generally be re-used.
Downward trends in the cost of renewable energy technologies would also favour a policy of delaying the introduction of renewable energy generation for isolated mini-grids and, instead, introduce diesel generation until the price of renewable energy technologies fall.
Without subsidies from the international community to adopt renewable energy for mini-grids, economic self-interest would favour a policy of implementing diesel mini-grids and waiting for the international climate framework to tighten.
Of course, the attraction of renewable energy mini-grids to Nigeria is that the international community offers substantial capital subsidies. In the above examples, grants of 85% of the capital costs might be provided which would lower the levelised cost of electricity (LCOE) from renewable energy generation to between US$0.12 and US$0.13/kWh (generation only). In the past, donors have provided capital subsidies to diesel mini-grids but they are generally unwilling to provide fuel subsidies and many of the subsidised diesel mini-grids in other countries fell into disuse because local communities could not afford the fuel costs (of around US$0.45/kWh). Renewable energy based mini-grids may therefore become attractive to developing countries compared with diesel mini-grids because they have low fuel/operating costs and allow more substantial subsidies to be provided up-front.
From Nigeria’s perspective, the self-interested economic justification for choosing renewable energy to supply its mini-grids rather than diesel grids is based on the current availability of capital subsidies. Without those subsidies, the analysis suggests that the least-cost option would be to choose diesel mini-grids. From a carbon lock-in perspective, if energy prices rise

ECA - Carbon lock-in toolkit
Case studies
46
further than predicted or the international climate change framework tightens, then Nigeria could switch to lower carbon technologies.
4.3 South Africa
South Africa is an upper-middle income country with abundant fossil fuel resources (particularly coal). It is a priority country for the International Climate Fund. DFID is not greatly active in infrastructure in South Africa. One current intervention is focusing on energy efficiency support measures for industry.
Two topics have been chosen to illustrate the problem of carbon lock-in – the carbon-capture and storage and energy efficiency in industry.
Carbon-capture and storage (CCS) is regarded by some as the way to reconcile the conflicting requirements of a growing demand for fossil fuels to satisfy increasing global demand for energy, the abundance of cheap coal, and the need to stabilise global temperature rise. With CCS, the CO2 is captured at the point of combustion and stored rather than released into the atmosphere. It can be applied to power generation or to any large combustion process and in South Africa it has been proposed for both energy production and industrial energy consuming applications. It is not generally adopted in commercial applications but many coal-fired power plants worldwide are being developed to be CCS-ready. In this case study in South Africa we consider CCS applied to coal-fired power generation and we ask whether economic self-interest would suggest that power plants be made CCS-ready in order to avoid carbon lock-in.
Energy efficiency measures are often retrofitted to industrial manufacturing processes in order to lower energy costs to the owners. The feasibility of retrofits implies that these industries have some opportunities to choose a less carbon intensive pathway and are not fully locked-in to a single pathway. Lock-in tends to involve major capital expenditures that, once the investment has taken place, involve substantial losses to reverse even if the international energy market or climate change framework tightens. The energy efficiency case study in South Africa focuses on the cement industry - a sub-sector that is energy intensive and for which some major capital expenditures are required that have implications for energy consumption for many years to come.
4.3.1 Carbon capture and storage
CCS involves the “capture, transportation, and long-term storage of CO2 in subterranean geological structures”63. CCS is normally associated with large point sources of CO2 emissions such as coal-fired power generation and with storage of the resulting CO2 in underground saline aquifers or depleted oil or gas reservoirs. In South Africa, the main storage options additionally include un-mineable coal seams. In addition to CCS associated with coal-fired power generation, in South Africa there is also discussion of CCS associated with coal-to-liquids plant at Sasolburg which produces synthetic fuels and chemicals64.
63 As defined by the Global CCS Institute, 2011. 64 http://www.sasol.com/about-sasol/company-profile/overview
ECA - Carbon lock-in toolkit
Case studies
47
Currently there are no CCS plants in operation in South Africa. There are 22 CCS projects operating or under construction worldwide, of which 16 are in North America65.
South Africa has developed an Integrated Resource Plan (IRP) for the electricity sector66 which describes the expected generation investment by fuel type over the period 2010 to 2030. The IRP is updated every two years and was last updated by the Department for Energy Affairs in 2013. The plan expects that 48% of South Africa’s power generation capacity, or 36,000 MW, will be provided by coal-fired power plants in 2030. This includes 45% of the capacity provided by coal-fired power plants that exist today, and 3% (2,500 MW) provided by new coal-fired plants that are to be constructed. The balance of the capacity comprises a mix of gas-fired plants, nuclear, solar PV, concentrated solar power, wind and other technologies. Though coal-fired power plants will provide only 48% of capacity, they will typically operate in base load and their contribution to energy and national CO2 emissions will be substantially greater than 48%. Eskom, South Africa’s state-owned power utility, states that 93% of its electricity is currently generated by coal-fired power plants67.
The government has developed a peak-plateau-decline (PPD) strategy for CO2 emissions68, with the peak targeted to occur around 2025. The IRP shows a peak in CO2 emissions from the power sector of a little over 300 million tonnes CO2e. Much of this is produced by coal-fired power plants. The government expects that the main reductions in CO2 emissions will come in the period after 2030, which is the horizon for the IRP. By 2050, the government expects CO2 emissions from power to have fallen to between 100 and 200 million tonnes per year.
One of the elements of the Government’s strategy to reduce emissions is the establishment of the South African Centre for Carbon Capture and storage (SACCCS) whose mission is to investigate the feasibility of CCS in South Africa. SACCCS has developed a roadmap for the development of CCS in South Africa which is summarised below. The first and second steps of the roadmap – the assessment of the CCS potential and the development of a CO2 storage atlas have been completed. SACCCS is currently experimenting with CO2 storage to test the suitability of local geological structures as a medium for safe storage of CO2.
65 Global CCS Institute. 66 IRP 2010-2030 Update Report. 67www.eskom.co.za/OurCompany/SustainableDevelopment/ClimateChangeCOP17/Documents/Kusile_and_Medupi_coal-fired_power_stations_under_construction.pdf 68 In August 2011 the Department of Environmental Affairs published an explanatory note “Defining South Africa’s Peak, Plateau and Decline Greenhouse Gas Emission Trajectory”.

ECA - Carbon lock-in toolkit
Case studies
48
Figure 13 CCS roadmap for South Africa
The roadmap indicates that a small pilot plant will be developed in 2017, a demonstration plant by 2020 and that commercial scale CCS will be introduced by 2025.
Decision to be made
Currently, the capital costs of coal-fired power plants with CCS in South Africa are estimated to be 85% more than conventional coal-fired power plants. Additionally, their running costs are substantially more expensive with fixed and variable O&M costs approximately 66% above those of conventional coal-fired plants, and they consume 43% more fuel per kWh produced than conventional plants. Overall, the levelised cost of electricity from a coal-fired plant with CCS is estimated be over 70% higher than a conventional coal-fired plant69.
If the international climate framework tightens such that carbon emission mitigation has economic benefits to South Africa equivalent to US$25/tonne of CO2 and/or the framework tightens and carbon emissions have economic costs to South Africa equivalent to US$25/tonne of CO2, then the net cost of coal-fired power plants with CCS would come down to around 50% above the cost of conventional coal-fired power plants. With an even tighter international framework equivalent to US$50/tonne of CO2, then the net levelised cost of electricity from a coal-fired plant with CCS would fall further but would still be 28% above the cost of a conventional plant.
Even if research into CCS in South Africa were complete, the above calculations show that currently CCS is not commercially attractive for South Africa. The decision is not therefore whether to implement full commercial-scale CCS projects today.
69 Based on figures provided in Section 7 of the 2013 Power Generation Technology Data for Integrated Resource Plan of South Africa, a supporting document to the South African IRP, prepared by the US Electric Power Research Institute, which has extensive access to plant cost data provided anonymously by utilities.

ECA - Carbon lock-in toolkit
Case studies
49
We assume that the government will continue to support research and development (R&D) activities relating to CCS and that until the R&D activities have confirmed the feasibility of CCS, in particular the feasibility of storage, no decision will be made concerning investment in full commercial scale CCS plants in South Africa.
The decision to be made today is whether to prepare new coal-fired power plants to be ready to become CCS projects when it becomes feasible70. Retrofitting coal-fired power plants with CCS that are not “CCS-ready” will be more expensive than fitting CCS to power plants that are “CCS-ready”. However, even retrofitting existing coal-fired power plants is expected to be more cost effective than scrapping existing power plants and building new ones with CCS. This is shown in Figure 14 below.
Figure 14 Levelised costs of electricity – CCS retrofit vs. new build
Source: IEAGHG, Retrofitting CO2 Capture to Existing Power Plants, 2011/02, May 2011, Fig. 4.
The purple part of the bars in Figure 14 can be ignored initially. The first bar of Figure 14 is provided for context and shows the cost of electricity from an existing coal-fired power plant (sunk capital costs) without CCS. The second bar of Figure 14 shows the cost of retrofitting an existing plant – this more than doubles the costs of electricity from a plant compared with an existing plant without CCS (i.e., compared with the first bar if the value of CO2 emissions is ignored). The third bar shows the cost of building a completely new plant with CCS. This shows that it is approximately 20% more expensive to build a completely new plant with CCS than to retrofit an existing plant. In general, if the choice is between retrofitting and building a completely new plant, retrofitting would be the more economically cost effective solution. However, even if retrofitting is cheaper than new build, retrofitting an existing plant will still increase the cost of electricity enormously (the wholesale cost will more than double), and will make a decision to retrofit CCS difficult for any developing country in the future, thereby effectively locking-in the high carbon pathway.
The above shows that:
building a coal-fired plant with CCS today would be very expensive, and
70 According to the World Bank, who funded South Africa’s the Medupi coal-fired plant, South Africa already has a policy of making new coal-fired power plants CCS-ready (Project Appraisal Document - 53425-ZA - for the Eskom Investment Support Project, March 2010, para. 87). However, according to Eskom’s COP17 Fact Sheet, Kusile power plant is CCS-ready, but Medupi is not.

ECA - Carbon lock-in toolkit
Case studies
50
future retrofitting of a coal-fired power plant would be even more expensive, particularly if it has not been designed to be capable of retrofitting CCS.
The issue in South Africa and elsewhere is therefore whether making coal-fired power plants CCS-ready will help avoid lock-in and will make a decision to retrofit easier in the future if and when the international climate change framework provides appropriate signals (incentives or penalties) or if South Africa wishes to follow a low-carbon pathway.
Institutional lock-in risk
Because of the importance of the coal mining industry for employment and the large numbers of mining jobs, there will be strong political support for keeping coal-fired power plants running even if the international climate change framework moves against South Africa’s interests. Retrofitting CCS may be resisted by labour unions and other groups if there are concerns that it will increase costs and threaten the role of coal-fired power generation. Retrofitting CCS to plants that are CCS-ready will help lower the costs and make retrofitting less worrying for the employees. Conversely, building coal-fired power plants that are not CCS-ready will make it harder to justify retrofitting. Institutional lock-in will then reinforce the cost argument against CCS retrofits.
The electricity industry is dominated by the state-owned Eskom which has developed and operates a range of power generation technologies including coal, nuclear, gas, hydropower and renewables. We can only speculate, but as far as we are aware, it’s engineers have no strong vested interest in discouraging CCS. As a state-owned company, they are less likely to be concerned about the financial consequences of CCS and may therefore be more willing to consider it than would private companies.
Costs and benefits
We now consider the costs and benefits of making coal-fired power plants CCS-ready.
By making a plant CCS-ready71:
the capital costs of retrofitting CCS to an existing coal-fired plant are reduced, and
the loss in net output (MW and MWh) from a plant with CCS is lessened compared with a retrofit.
On the other hand, there are costs associated with making a plant CCS-ready compared with a conventional design. Recommendations on CCS readiness were prepared by the IEA72 and included:
“A clearly identified strategy by which a credible capture technology can be fitted to the plant
Space available both within and around the plant to permit the capture technology to be fitted
71 Retrofitting CO2 Capture to Existing Power Plants, 2011/02, May 2011, IEAGHG. 72 CO2 Capture Ready Plants, Technical Study, Report no. 2007/04, May 2007, IEAGHG.

ECA - Carbon lock-in toolkit
Case studies
51
A credible route for captured CO2 to be removed from site and sent to storage”
There generally appears to be a lack of hard data on the costs of making a plant CCS-ready, but the data described in Annex A6.4 suggests that although the cost of making a plant CCS-ready adds only 2.1% to the levelised cost of a coal-fired power plant, the benefits in terms of reduced costs or retrofitting the plant mean a saving in the overall levelised costs of only 0.5%.
This suggests that only if there is a high probability that CCS will be required in the future (greater than 68%) then it would it be economically rationale to make the plant CCS-ready. If the probability were, say, 50/50 that CCS would be needed then investing in CCS-readiness would mean an overall expected increase in costs of 0.4% (if the benefits of delay are present valued into the calculation, then the decision to invest in CCS-readiness would mean that a decision to make the plant CCS-ready would increase the expected levelised costs still further).This is illustrated graphically in the figure below.
Figure 15 Cost –effectiveness of CCS
The calculations shown in Figure 14 above imply that even with a CO2 value of US$50/tonne (the purple part of the bars), which is the top end of our range of scenarios, it would not be economically rationale to invest in CCS – whether a new build plant with CCS or a retrofit – because the value of the CO2 reductions would not outweigh the extra costs of CCS. If US$50/tonne were the maximum conceivable carbon value then the probability of needing CCS on economic grounds would be low, suggesting no logic in investing in CCS readiness in South Africa.
However, these calculations need to be interpreted with care:
First, the data available on the costs and benefit of making a plant CCS-ready are scarce and the numbers used should be refined when something more definitive is available.

ECA - Carbon lock-in toolkit
Case studies
52
Secondly, the calculations ignore the potential for the costs of CCS to come down in future as international R&D activities and technological innovations help lower these costs.
The latter is double-edged. On the one hand, technological improvements that lower CCS costs will make CCS more attractive and make it more likely to be economically attractive in the future. On the other hand, attempts at making a plant CCS-ready may prove to be wasted if the CCS-ready designs are not suited to the advanced CCS techniques.
The above case-study suggests that further work is required in this space. It is also worth noting that other lower-cost CCS candidates (other than coal power) exist for South Africa. For example, coal-to-liquids could be more cost-effective application of CCS as a step toward CCS for coal-fired power generation.
4.3.2 Energy efficiency
DFID has implemented an intervention in South Africa to support the private sector improve their energy efficiency. The business case for the intervention notes that South Africa ranks 4th and 7th as the most carbon and energy intensive countries out of the top 50 economies in the world. The two-year intervention is offering remote advice, support for medium-sized companies (based around 2-3 day audits, with follow up) and longer term support developing energy strategies for larger companies.
The results from the intervention after one year of implementation suggest that the targeted firms are implementing retrofit investments to existing facilities and improved operating practices including energy management systems, designed to lower energy consumption. This has the additional benefit of lower CO2 emissions. These types of intervention are not designed to target the problem of carbon lock-in. Typically they involve relatively modest investments or costs but may often achieve relatively substantial improvement in energy consumption, fuel costs and CO2 emissions. But the absence of such measures does not imply lock-in because the same measures could be implemented for the same costs at a future date. The fundamental problem of lock-in is the existence of two or more pathways and once one of those pathways has been chosen, it is then difficult to reverse and follow a different pathway.
For this case study we take the example of South Africa’s cement industry. Worldwide, in 2005, cement manufacture alone accounted for 8% of global man-made CO2 emissions73. South Africa was the leading producer of cement in Africa, though now overtaken by Nigeria, and one of the leading producers worldwide. Consistent with South Africa’s relative abundance of energy resources, cement is also an energy and carbon intensive activity.
Cement manufacture is also a capital intensive activity with long-lived assets. Historical investments by the producers have major impacts on energy intensity long into the future. A
73 IEA Clean Coal Centre, CO2 abatement in the cement industry, Profiles no. 11/6, July 2011.

ECA - Carbon lock-in toolkit
Case studies
53
number of South Africa’s cement plants in operation today were first commissioned more than 30 years ago74.
The production of cement in South Africa has grown at the rate of approximately 5% per year over the past decade75 and the output is exported to Africa and beyond. Although Sub-Saharan Africa probably has surplus cement production capacity at present as a number of countries, particularly Nigeria, have protected their domestic industries and encouraged investment in new production capacity. In South Africa, new cement plants have been developed to meet the growing demand, including a major new 3.3 million tonnes per year plant developed by Dangote. Although there may be a suspension in construction of new plants, with growing populations, increased urbanisation and growing middle classes in Africa, the demand for cement is likely to continue to grow and new plants will be developed in South Africa and elsewhere in Africa. Decisions made concerning these plants could therefore lock South African firms into carbon intensive pathway for some considerable period into the future.
CO2 emissions from cement production are the result of two processes. 50% of emissions in cement production result from the calcination of limestone to produce clinker. Another 40% result from burning fossil fuels to supply the energy for calcination. The emissions from power generation used to produce electricity used in crushing and other processes accounts for another 5% of emissions76.
There are a large number of ways in which energy consumption per tonne of clinker and per tonne of cement can be lowered and CO2 emissions lowered. IEA has developed a roadmap for the cement industry that identifies four key pathways to lower CO2 emissions including: energy efficiency, alternative fuels, clinker substitution and carbon capture and storage (CCS). CCS was discussed in the previous case study above in relation to the electricity industry. Here we focus on one aspect of the manufacturing process that has a major impact on the energy efficiency of the process used to produce clinker – the kiln.
Modern cement manufacturers prefer a dry kiln process with multistage cyclone preheaters with an integral pre-calciner. This is the most energy efficient process for producing clinker – the energy consumption is half that of some of the wet kiln processes77 – and has been one of the main ways in which manufacturers have reduced energy consumption and lowered CO2 emissions.
Energy accounted for between 20% and 40% of the cost of cement production in South Africa in 200678 and this proportion will have risen following increases in energy costs since then79. For this reason the manufacturers have a strong self-interest in anticipating future trends in energy prices and if they believe energy prices are heading upward or if they wish to insure against future energy price hikes, investing in a low carbon pathway makes economic sense.
74 The South African Cement Industry: A review of its energy efficiency and environmental performance since 1980, Chinedu Innocent Ohanyere, M Phil. thesis, University of Cape Town, 2012. Figure 4.1. 75 Middle Africa Insight Series | Commodities | Cement, Ecobank, 24 July 2014 76 IEA Clean Coal Centre, CO2 abatement in the cement industry, Profiles no. 11/6, July 2011. 77 IEA Clean Coal Centre, CO2 abatement in the cement industry, Profiles no. 11/6, July 2011. 78 The South African Cement Industry, Chinedu Innocent Ohanyere, op. cit. 79 In the European Union it is reported to be above 40% according to CEMBUREAU, the European Cement Association.

ECA - Carbon lock-in toolkit
Case studies
54
Annex A1 of this Toolkit suggests the industrial sectors that are most at risk from international climate change measures that might be introduced and aimed at curbing carbon “leakage” (whereby a low carbon policy is introduced in one country which raises production costs and allows other countries without such policies to undercut prices). Cement manufacturing was identified as potentially being at risk because of its high carbon intensity. Annex A1 also notes that in general cement is less traded internationally than many other carbon-intensive products but cement is more likely to be exported from South Africa than, for example, EU countries, and South Africa’s cement industry could potentially be damaged by measures introduced by western countries.
Decision to be made
The investment decisions to be made by cement manufacturers in South Africa and elsewhere concerning expanded cement production will be complex. These decisions will take account of forecasts of cement demand, expectations of production capacity of competitors, trade barriers by national governments, the potential to improve existing plants, the cost of energy in South Africa and the climate change framework. It will take account of the opportunities and threats posed by the international climate change framework including the potential to obtain certified emission reductions (or their equivalent) and the possibility that international trade in cement could potentially have carbon certification practices that could be a barrier to the trade in cement that is produced using carbon intensive practices. The international framework for climate change may impact on cement manufacturers in South Africa through policy introduced by the South African government to lower national carbon emissions, or it may impact directly on the companies as opportunities (certified emission reductions) or threats (barriers to trade in carbon-intensive cement).
Because energy is such a substantial share of the cost of cement production, energy cost is clearly also a factor in any investment decision.
To illustrate the issue of carbon lock-in and how this can be factored into government policy on climate change or how it can be analysed by a private investor, we simplify the decision enormously. We assume that a decision has been taken to develop additional cement manufacturing capacity and various other decisions have been taken concerning the design of the plant including appropriate measures to minimise energy consumption. However, a major decision concerns the kiln design. The various kiln types and their energy consumptions are shown in Figure 16.

ECA - Carbon lock-in toolkit
Case studies
55
Figure 16 Energy efficiency of various kiln technologies
Source: IEA Clean Coal Centre, CO2 abatement in the cement industry, Profiles no. 11/6, July 2011
The choice depends partly on the availability of raw material so that very dry processes cannot always be used. For the sake of illustration, we assume that the choice is between a relatively inefficient semi-wet design and one that lowers energy consumption by approximately 40%.
National scenarios
South Africa has introduced policies toward climate change and may introduce new or amended policies in future. However, because the carbon lock-in tool is designed to provide support in making policy and intervention decisions (by Government, donors, etc.), national climate change policy will ultimately be an outcome of the analysis rather than an input to it.
The important national scenario affecting the case study concerns the economic value of coal used in South Africa. This impacts on the decisions by the national Government and donors on whether they should support policy that affects investment decisions by private firms in energy efficiency in general, and in the cement industry in particular.
The coal industry is an important one in South Africa, partly because it employs 58,00080 people directly, and partly because it provides energy at relatively low costs to industry and thereby also supports jobs and economic output. But coal is a tradable commodity, it is exported, and it has a value in the international market. At the margin, the economic value of coal consumed in South Africa (in the cement industry as well as other industries) should therefore reflect the opportunity cost of coal that is not exported. A key difference between coal and oil products (see the discussion on diesel prices in Nigeria) is that coal is bulkier to
80 The True Cost of Coal in South Africa, Greenpeace, 2010. The figure is for 2006.

ECA - Carbon lock-in toolkit
Case studies
56
transport and cannot (easily) be transported by pipeline. The cost of transportation per GJ of energy is therefore higher for coal than it is for oil or oil products. So, although the international price of coal may be predicted to be US$106/tonne in IEA’s New Policies scenario (see Annex A3), after netting off the transport costs to take the coal from the mine to ports and to transport it by ship to the international markets, the value to South Africa will be considerably lower. For this case study we assume a value of US$90/tonne (netted back to the mine-mouth then with the addition of transport costs to the cement plants).
Although IEA’s three scenarios show international coal prices that change over time (both up and down, depending on the scenario) and that differ depending on the scenario as described in Annex A3, these prices do not change substantially over time. Apart from the 450 Scenario, prices are expected to range between US$106 and US$120 in the two scenarios between 2020 and 2035 (in constant 2012 price levels). To simplicity, we assume that the economic value of coal remains constant in real price terms through time (i.e., no fuel price scenarios considered).
Institutional lock-in
Because of the large contribution that the cement industry makes to greenhouse gas emissions, the sector is generally very conscious of its public image and has teams that focus on corporate social responsibility (CSR). It is also very commercially minded and competitive; cement manufacturers will therefore naturally avoid investments that do not contribute to their current or future profitability.
Some cement firms are owned by private investors who are concerned with medium and long-term returns and who will tend to be more concerned with trends in energy prices and the international climate change framework over the medium and long-term. The shares of other cement firms are traded on stock markets where the concerns tend to be shorter-term. Short-termism acts as a barrier to investments – particularly energy efficiency - whose benefits are long-term and speculative but this affects the cost of switching and technically these are not institutional lock-in risks.
If the cement firms invest in technology that is not energy efficient, these firms will then lobby against the introduction of carbon policies such as carbon taxes that impact on them. They may also lobby against moves by the national Government to sign up to international commitments on climate change. These are not the types of concerns normally associated with institutional lock-in.
Costs and benefits
Up-to-date data on the additional cost associated with more efficient kiln designs are not readily available81 and therefore, for the sake of illustrating the issue of carbon lock-in, we have assumed some values as described in Annex A6.5. Some of the costs are taken loosely,
81 Some data are available in Energy Efficiency Improvement Opportunities for Cement Making, Ernst Worrell and Christina Galitsky, Berkeley National Laboratory, 2004. But the data are dated.

ECA - Carbon lock-in toolkit
Case studies
57
or adapted, from a paper prepared for the World Bank82 on the potential for Clean Development Mechanism (CDM) credits available to the cement industry in Africa.
Based on coal price assumptions described above and the other assumptions described in Annex A6.5, for a plant producing 1 million tonnes of clinker per year, we estimate the following net benefits depending on the tightness of the climate change framework (implicitly measured in terms of US$ per tonne of CO2).
Table 7 Net benefits of energy efficient clinker production – South Africa
Fuel price scenario Net benefit (US$/tonne of clinker)
Carbon price (US$/tonne)
0 25 50
New build -0.26 4.62 9.50
Retrofit -4.86 0.02 4.90
The above (illustrative) calculations show that the benefits to developing a new plant to be energy efficient are greater than retrofitting a plant later. In this example, the international climate change framework would need to tighten substantially to the equivalent of US$25/tonne of CO2 in order to just make a retrofit economically viable. A cement manufacturer that has followed the more carbon intensive route but finds in the future that the carbon value is equivalent to, say, US$ 24 per tonne of CO2, would not be justified in investing in retrofit. Equally that manufacturer would be uncompetitive with other manufacturers that have followed a path which is less carbon intensive. Conversely, the manufacturers who invest in energy efficient technology in the expectation of a future high carbon price will have committed the investment unnecessarily and may struggle to repay the loans if the high carbon price does not materialise.
The lesson from this exercise is that if the assumptions are correct, and if there is a reasonably good probability that the climate change framework will tighten to the equivalent of US$25/tonne of CO2, then the best strategy would be to build new cement plants that are very energy efficient today rather than hope to retrofit in the future by which time they will be locked-in and could be uncompetitive. If government believes that private firms will pursue short-term profit maximisation over medium-term and long-term profit optimisation, then policies that encourage or require private firms to adopt energy efficient technologies would make economic sense.
82 Cement Sector Program in Sub-Saharan Africa: Barriers to CDM and Solutions, the World Bank, Carbon Finance Assist, 2009.

ECA - Carbon lock-in toolkit
The international framework for climate change
58
A1 The international framework for climate change
One of the factors that give rise to the risk of carbon lock-in is the international framework for climate change. Annex A1 discusses the current framework (Annex A1.1) and how that framework may change in the future (Annex A1.2) and how this framework could affect developing countries (Annex A1.3). Finally, it also considers how this international framework can be represented quantitatively, or semi-quantitatively, in decision making by developing countries (Annex A1.4).
A1.1 The current framework
The 1992 United Nations Framework Convention on Climate Change (UNFCCC) is the principal instrument governing actions by countries to limit CO2 emissions. The UNFCCC encourages actions from signatory Parties – of which there are 194 plus the European Commission – to stabilise greenhouse gas (GHG) concentrations in the atmosphere. The Convention was enhanced in 1997 through the Kyoto Protocol, which entered into force in 2005 and set down quantified emission limits and reduction obligations for a first
commitment period running 2008-2012 for the 37 developed country (so called Annex I) Parties to the Convention, obliging them collectively to an aggregate greenhouse gas emission reduction of -5% compared to a 1990 base year.
Kyoto also introduced the concept of ‘flexible mechanisms’ – or emissions trading – as a means for Parties to meet their obligations. In terms of supporting low carbon technology in developing countries, the Clean Development Mechanism (CDM) has been by far the most important of the flexible mechanisms. CDM allows Annex I Parties to invest in emission reduction projects in developing countries, and generate certified emission reductions (CERs) which may be counted towards compliance.
To date, it is estimated that somewhere around 2-3 billion CERs will be issued to more than 7,000 projects by 2015, with each CER representing a one tonne reduction in emission compared to that which might have occurred in the absence of the CDM (UNFCCC, 2014).
The Kyoto Protocol, by way of an agreement reached at the Doha Climate Conference in 2012, has now been extended into a second commitment period running 2013-2020, albeit without USA, Canada, Japan, Russia and New Zealand.
Subsequent climate conferences and agreements have taken place including the Cancun Agreements in 2010 which included a commitment that developed country Parties shall jointly mobilise up to US$ 100 billion per year by 2020 to address the needs of developing countries (potentially covering the costs of addressing both adaptation and mitigation). Much of this money is envisaged to be mobilised through the Green Climate Fund, the Secretariat for which has been established in Songdo, Incheon, South Korea. The Secretariat – supported by the 24 man Board under the auspices of the Conference of the Parties, is working on establishing modalities for disbursement of the fund, although it has yet to achieve much capitalisation.

ECA - Carbon lock-in toolkit
The international framework for climate change
59
A1.2 The possible future framework
There is at present considerable uncertainty concerning the outlook for an international climate change agreement.
A major barrier to establishing a robust international climate change agreement continues to be that of bringing together the world’s two largest greenhouse gas emitters: the USA and China. Whilst both the US and China made pledges under the Cancun Agreements, the US continues to desire an agreement whereby China will be obliged to take measureable, reported and verifiable actions to also reduce emissions. Any future meaningful progress on emission reductions is contingent on having something which is mutually agreeable to both USA and China.
The international climate change negotiations within the UNFCC are now heading towards the adoption of a new global climate agreement to be adopted at the Paris Climate Conference (COP21) due to take place in December 2015, and to go into effect in 2020. Despite the various complexities involved, the most important element of those negotiations will concern the level of ambition agreed i.e. the goals the international community sets to reduce emissions, but also the form that the resulting international framework may take.
There is an extensive body of literature, online discussion and ongoing analysis concerning the potential shape and form of future international agreements to address climate change83. Ongoing developments within the UNFCCC are reported on the UNFCCC Secretariat’s website84, and several organisations track and comment upon ongoing negotiations and meetings within the UNFCCC process, including for example the International Institute for Sustainable Development (IISD) Reporting Services, and the Climate and Finance Policy Centre.85, 86 Other organisations and networks track national and regional climate policy development, including UNFCCC Parties’ pledges, most notably the Climate Action Tracker87, whilst others model outcomes according to possible international climate policy regimes e.g. regional carbon prices and/or linkages between regional trading schemes.
The figure below, based on Zakkour et al (2011), presents a simplified schematic of how the international climate change policy framework could develop over the next 5-10 years from the current position. The schematic was developed in the specific context of how international climate policy can help drive low-carbon technology investment in developing countries. The scenarios developed are based around two key sensitivities (based on ibid):
1. Level of ambition – this component captures the political uncertainty surrounding targets adopted by countries in 2020 and the associated amounts of climate finance flowing from developed countries to developing countries. The level of public and private money made available clearly has effects on the abilities of developing country governments to mobilise investment into low-carbon technologies. The current status is a patchwork of some developed countries having adopted
83 See for example: Michaelowa, 2012; WRI, 2013; Norden, 3013; Bodansky et al, 2014; Bodansky and Diringer, 2014; FIELD, 2014; CDM Policy Dialogue, 2012, OECD/IEA, 2014. 84 Available at : http://unfccc.int 85 Available at: http://www.iisd.ca 86 Available at: http://www.ghub.org/cfc_en 87 Available at: http://climateactiontracker.org/

ECA - Carbon lock-in toolkit
The international framework for climate change
60
quantified targets under the Kyoto Protocol with others, including most developing countries, having adopted no targets and having no significant climate change policies and measures. One end of the range represents a weak level of ambition with no countries adopting meaningful targets; the other end represents an ambitious policy framework in which all countries adopt quantified targets negotiated in support of a globally agreed emission reduction agreement e.g. under a global protocol or instrument as a successor to the Kyoto Protocol.
2. Use of market versus non-market mechanisms – this component seeks to capture the range of political views regarding the use of market and non-market mechanisms internationally to channel finance to low-carbon technology projects in developing countries. One end of the range represents a growth in regional emission trading schemes (ETS) with an increased use of international offsets through e.g. an expanded and reformed CDM and/or new market-based mechanisms such as credited NAMAs88, sectoral crediting or trading, etc.; the other end represents a prevalence of non-market based schemes such as the use of bilateral, multilateral and UNFCCC funds to drive carbon finance into developing countries. Under this scenario, developed country emissions trading schemes may increase the linkage of their schemes to enhance cost-effectiveness rather than through project- or programmatic-based offsets.
The schematic is illustrative only. However, it allows for a useful discussion of four broad ‘pathways’ - or outcomes - concerning how the international climate policy architecture could develop over the coming 5-10 years, and beyond. Each of these will have different implications - at least in broad terms - for carbon lock-in, arising from opportunities from low-carbon technology investments, and threats from high-carbon technology investments, in developing countries.
Figure 17 Approach to developing international climate framework scenarios
Source: based on Zakkour et al (2011), drawing on other sources e.g. CDM Policy Dialogue (2012)
88 Nationally appropriate mitigation actions.
CURRENT SITUATION
LOW USE OF MARKET MECHANISMS
HIGH USE OF MARKET MECHANISMS
HIGH AMBITIONLOW AMBITION
global targets no targets
CDM expansion
credited NAMAs
other mechanisms e.g. sectoral crediting
regional ETS offsets
voluntary carbon market offsets
Grants and concessional finance
Technology transfer
Increased role of international offsets
funds mobilised through GCF
other (e.g. un-credited NAMAs; Technology Mechanism)
centralised climate finance / technology funds
domestic offsets
CDM reform and POA
smaller niche role for CDM
bilateral climate finance / technology funds
Increased use of ETS
Results-based finance
fragmented system “pledge-and-review” approach
fragmented system“pledge-and-review” approach

ECA - Carbon lock-in toolkit
The international framework for climate change
61
Based on the pathways shown in the schematic, four outcomes for international climate change policy can be described:
1. Low ambition; low use of market mechanisms. This outcome represents a fragmented system of country-specific approaches to climate policy; likely based on a “pledge and review” type approach. The current demand for international Kyoto offsets including the CDM would be reduced to an even smaller niche role for compliance within a small number of regional ETS such as the EU ETS. Any climate finance provided to developing countries for low-carbon technology and other mitigation efforts would be provided bilaterally on a country-by-country basis. These might be used to target carbon lock-in effectively in some cases, but overall climate finance and technology transfer levels would be low in absolute terms. Certain regions/countries which adopt carbon policies may seek to protect domestic industry through use of response measures including e.g. border adjustment measures (BAM) (see below).
2. Low ambition; high use of market mechanisms. This outcome would also result in a fragmented international system, but with a higher use of market mechanisms. These would not be coordinated within an overall agreement, but might include a wide range of regional ETS, domestic international offset schemes and voluntary carbon credits. A lack of stringent targets in developed countries (if any) and low levels of offset demand would result in low carbon prices and these would be insufficient to create significant investments in abatement technologies (as per existing criticisms of the CDM). A wide range of uncoordinated schemes and credit mechanisms would create difficulties in terms of measurement, reporting and verification and environmental effectiveness, creating further challenges to financing low-carbon technology projects and avoiding carbon lock-in. Certain regions/countries which adopt carbon policies may seek to protect domestic industry through use of response measures including e.g. border adjustment measures (BAM) (see below).
3. High ambition; low use of market mechanisms. This outcome represents a formal global agreement on climate change with a significant portion of global emissions covered by deep ambitious national targets, which may include some developing countries such as emerging economies (e.g., China, India, Brazil, South Africa). Developed countries make only limited use of international offsets. Climate finance for low carbon technology, which rises to US$ 100 billion per year of additional finance by 2020, is therefore focused on non-market approaches such as grants and concessional finance, and is mobilised to developed countries through the Green Climate Fund and other sources such as (un-credited) NAMAs and the UNFCCC Technology Mechanism. Climate finance targeted at low-carbon technology pathways in developing countries could result in significant avoidance of carbon lock-in across different regions and sectors.
4. High ambition; high use of market mechanisms. This outcome also represents an ambitious formal global agreement on climate change being reached, but with a higher use of market mechanisms including regional ETS and international offsets. These might include a reformed and expanded CDM as well as credited NAMAs and potentially other mechanisms such as sectoral crediting and trading. Depending upon the host country circumstances, credited NAMAs could be based around a range of the policies and measures. Stringent targets in developed countries combined with the use of offsets would results in carbon prices sufficient to incentivise step-change low carbon technology deployment in developing countries

ECA - Carbon lock-in toolkit
The international framework for climate change
62
additional to existing technologies. A global carbon market with extensive linkages would help create a clear long-term view of investment opportunities, aiding significant and stable finance flows to avoid carbon lock-in in developing countries.
Parties are currently preparing Intended Nationally Determined Contributions (INDCs) which outline the measures they intend to take to reduce national GHG emissions. Collectively, these will determine the level of ambition. Ongoing discussions within the UNFCCC process will help determine the role of market mechanisms. The results of negotiations during the Paris Climate Conference in December 2015 could feasibly result in a pathway towards any one of the four outcomes outlined above.
A1.3 How does this affect decision making?
We now consider how the above scenarios for international frameworks affect decision-making by developing countries when choosing between low and high carbon policies and measures.
The mechanisms adopted by the international community to mitigate GHG emissions will impact on developing countries in different ways:
Border adjustment measures or similar measures could impact negatively on developing countries that have adopted high carbon pathways by lowering the value of exports. Such measures would address domestic concerns in developed countries that unequal carbon policies can give rise to ‘carbon leakage’ and/or competitiveness loss. To the extent that such measures can be applied to exports of carbon-intensive goods and services from countries without carbon policies or with weak policies, they may present a carbon cost to some developing countries without GHG targets. In this case, countries that have invested in low carbon policies could be protected from a future tightening of the international climate change framework.
‘Market mechanisms’ such as CDM can provide direct financial incentives to developing countries to introduce low carbon technologies, but these do not benefit past decisions. The CDM has relied on the principle of additionality – that certified emission reductions should be assigned if it can be shown that without the CDM credits a higher carbon pathway would be followed. Once low carbon investments have been made, the principle of additionality precludes the claiming of carbon credits retrospectively89. When the value of carbon credits is low, as it is at present, there can therefore be a benefit to developing countries in delaying the introduction of low carbon technologies until such time as the price of carbon emission credits rises and they can gain financially from flexible mechanisms. Countries that choose low carbon technologies when carbon prices are low may not benefit from future increases in carbon prices. This does not imply that decision makers in developing countries should necessarily wait for the carbon incentives to improve – see below.
89 A project that registers for CDM credits may, depending on the contract terms agreed between the buyer of the credits and the seller, benefit from future increases in the price of carbon credits if the price agreed in the contract is linked to an international benchmark.
ECA - Carbon lock-in toolkit
The international framework for climate change
63
Carbon funds and other support measures (concessionary loans, grants, etc.) are available from the international community to support low carbon policies and programmes implemented by developing countries. These make low carbon investments more attractive. This source of funding will be greater in the high ambition scenarios but will also exist in the low ambition scenarios. Concessionary funding is unlikely to provide retrospective compensation for past low carbon investments but the availability of carbon Funds suggests that developing country governments should make use of these opportunities while they are available.
NAMAs, and other ‘market mechanisms’ which could be adopted under the UNFCCC to replace the CDM) are more flexible than the CDM but are also based on the principle of additionality. Again, timing will be important because developed countries are unlikely to compensate developing countries for low carbon technology investments made in the past. This implies that investments that are made unilaterally by developing countries today would not benefit from an increased level of ambition in the future by the international community, and would not benefit from the corresponding increases in carbon prices. Again, this is just one factor to be considered in decision-making and other factors such as the risk of institutional lock-in or the availability of funding for low carbon solutions, pull in the direction of low carbon pathways.
National GHG targets and policies adopted as part of developing country Parties’ INDCs may impact certain sectors through adding an additional cost to production (‘carbon cost’) by the private sector. Policies introduced may include economy-wide targets and/or sector-specific policies. These may include for example direct carbon taxes, emissions trading schemes or the introduction of product and performance standards. Cost impacts may be direct (covering emissions produced on site) or indirect (covering emissions produced from bought-in electricity). Ambitious INDCs imposing carbon costs across industrial sectors are likely to arise only under ‘high ambition’ scenarios for an international climate framework. Investments made in carbon intensive sectors and projects by private investors in developing countries could face high carbon costs under future INDCs introduced by their Governments, depending on the exact nature of the targets and policies adopted.
The above highlights the importance of timing when evaluating the benefits of low carbon policies and measures. If it is expected that the international community will be offering strong incentives for undertaking emission reductions equivalent to, say, US$100 per tonne of CO2 by 2030, these will not necessarily be available for low carbon investments made today. Except in the case of border adjustment measures and carbon funds, increased incentives in high ambition scenarios will not necessarily be beneficial for the developing countries that have made prior investments in low carbon policies and technologies. On the other hand, carbon lock in and the development of good enabling environments (avoiding institutional lock-in) suggests that delay in following low carbon pathways may not be optimal because early investment in low carbon technologies is likely to improve the capacity of firms and the workforce to implement such technologies in the future and thus be in a better place to take advantage of any future increase in the demand or price of carbon credits.

ECA - Carbon lock-in toolkit
The international framework for climate change
64
A1.4 Carbon price scenarios relevant to developing countries
Against the background in the above three sub-sections, a simplified set of scenarios can be developed to reflect how the level of ambition agreed (i.e., the goals the international community sets to reduce emissions), the form that the resulting international framework may take (e.g., the use of market mechanisms), and the response to carbon leakage. These scenarios can be used as inputs to quantitative analysis or it can provide order-of-magnitude numbers to guide qualitative analysis.
A future international climate change framework may give rise to both carbon costs and/or carbon benefits to developing countries. The level of these costs and/or benefits will vary primarily according to the level of ambition agreed by the international community. Within the wide range of potential outcomes for an international climate change agreement, it is possible to define a simplistic set of scenarios based on different carbon prices (giving rise to carbon costs and/or benefits). Based upon a range of carbon prices assumed by the UN90, the following three scenarios can be described:
Weak action (no carbon price). No international agreement is reached, and there are no commitments made within the UNFCCC process by Parties beyond the Kyoto Protocol second commitment period (2013-2020). Some developed countries may continue to adopt domestic policies and measures on a voluntary basis, but there will be no trade in international carbon market offsets other than a small volume of non-compliance voluntary offsets.
Moderate action (carbon price = USD 25 per tCO2). An international agreement is reached within the UNFCCC process with moderate commitments made. Developed countries implement a range of market and non-market climate policies and measures, including the use of ETS with international linkages and use of offsets. A reformed CDM provides significant carbon finance to developing countries along with new market-based instruments and finance through UN fund mechanisms and bilateral and multilateral channels. Some developing countries implement domestic carbon policies and measures; potentially supported by developed country finance through UNFCCC mechanisms e.g. credited NAMAs.
Strong action (carbon price = USD 50 per tCO2). An international agreement is reached within the UNFCCC process with stringent commitments. Strong targets in developed countries create significant demand for international offsets resulting in significant growth in the international carbon markets, based on a reformed CDM and new sector- and project-based market instruments. Some developing countries may adopt targets and implement meaningful domestic carbon policies and measures in support of them. In the event of significant
90 Report of the UN Secretary-General’s High-level Advisory Group on Climate Change Financing (5 November 2010); Scenarios were created around three carbon prices: a low carbon price (USD 15 per tCO2); a medium carbon price (USD 25 per t CO2); and a higher price scenario (USD 50 per t CO2). The scenarios were built around a simple set of illustrative quantities and related prices, informed by a literature review of a broad range of models provided in an annex to the Report. See http://www.un.org/wcm/webdav/site/climatechange/shared/Documents/AGF_reports/AGF_Final_Report.pdf

ECA - Carbon lock-in toolkit
The international framework for climate change
65
carbon price inequalities and rising concerns over ‘carbon leakage’ and competitiveness loss, some countries with targets may seek to impose border adjustment mechanisms on carbon-intensive goods and services produced by those countries with little or no carbon constraints.
By way of benchmarking against other carbon price projections:
For internal guidance, DFID has an estimate of the CO2 prices necessary to hold global warming at 2 degrees C. In constant 2012 price levels in £ per tonne, these show:
Low Central High
2030 38 76 113
2040 73 146 219
2050 108 216 324
2076 166 333 499
DECC has published short-term traded sector carbon values through 2030 based on a specific set of assumptions with respect to the move from the end of Phase III of the EU ETS (ending in 2020) to a fully functioning and comprehensive global carbon market in 2030.91 These forecast ‘low’, ‘medium’ and ‘high’ prices for the year 2020 of around £ 0, £5 and £26 per tCO2 respectively, and for the year 2025 of around £19, £40 and £70 per tCO2, respectively. The carbon price scenarios used in the case studies and described previously are therefore expected by DECC to lie between the 2020 and 2025 (albeit closer towards the year 2020 values).
The European Commission’s projections of carbon prices under the EU ETS, the world’s main carbon pricing scheme and source of demand for international offsets, foresee a more modest carbon price increase under their reference (medium) scenario of EUR 10 per tCO2 in 2020, rising to around EUR 14 per tCO2 in 2025 and EUR 35 per tCO2 in 2030.92 Carbon prices within the EU ETS to date have ranged from around EUR 30 per tCO2 to less than EUR 1 per tCO2 (the latter price collapse occurring at the end of Phase I of the scheme 2005-2008).
91 (DECC, 2013) Updated short-term traded carbon values used for UK public policy appraisal; see
https://www.gov.uk/government/uploads/system/uploads/attachment_data/file/240095/short-term_traded_carbon_values_used_for_UK_policy_appraisal_2013_FINAL_URN.pdf 92 (EC, 2013) EU Energy, transport and GHG emissions - trends to 2050; reference scenario; see:
http://ec.europa.eu/energy/observatory/trends_2030/doc/trends_to_2050_update_2013.pdf

ECA - Carbon lock-in toolkit
Lock-in literature
66
A2 Lock-in literature
The literature that specifically addresses carbon lock-in is limited. There is no formal or generally accepted definition of carbon lock-in and we therefore provided our own definition in Section 2 of the Toolkit. There is, however, a more substantial literature on lock-in more generally. Carbon lock-in can be regarded as a special case of lock-in applied to carbon intensive technologies. Below we discuss some of the general lock-in literature in Annex A2.1 and in Annex A2.2 we review literature that considers R&D policies from a carbon lock-in perspective. These both relate to technological lock-in (QWERTY-type lock-in), which, as noted in Section 2, is not the primary driver of carbon lock-in in developing countries.
Some of the specific carbon lock-in literature is summarised in Annex A2.3.
There is a large literature on green growth, some of which is objective and attempts to quantify the potential trade-offs between green policies and growth. Some of this literature is noted in Annex A2.4.
There is also a group of literature that considers the vulnerability of countries to energy price shocks. This literature does not address the issue of carbon lock-in but it is relevant to the discussion of lock-in because energy price rises give rise to economic inefficiency in countries that are dependent on fossil fuels and are locked-in to the use of those fossil fuels. A brief summary of this literature is provided in Annex A2.5.
A2.1 Some general lock-in literature
A dictionary description of path dependence
The New Palgrave's Dictionary of Economics and the Law provides a taxonomy of conventional path dependency/lock-in93. This describes three degrees of path dependency:
First degree: this occurs whenever there is an element of persistence in a decision such as the purchase of a car. A decision may be imperfect given the durability of the purchase, but not necessarily economically inefficient.
Second degree: This occurs when there is a failure to predict the future perfectly so that in retrospect decisions turn out not to be efficient. This leads to outcomes that are regrettable and costly to change. However, the author notes that this is not necessarily inefficient given the assumed limitations on knowledge at the time the decision was taken.
Third degree: This occurs when the inefficient outcome was predictable and avoidable.
93 Margolis, S. E. and Liebowitz, S. J., (1998). Path Dependence, entry in The New Palgrave's Dictionary of Economics and the Law, MacMillan.

ECA - Carbon lock-in toolkit
Lock-in literature
67
Factors driving path dependency
Page (2006) conducted an extensive review of path dependency94 and developed an analytic framework to identify the factors that can create path dependency95 including:
increasing returns
self-reinforcement
positive feedbacks
and lock-in
Increasing returns, in Page’s lexicon, refers to the phenomenon whereby the benefits of an action or choice depend on how many people make that choice over a period of time. Using QWERTY keyboards as an example96, as the market for machines that produce this type of keyboards grew, producers’ unit costs fall and profits rise97.
Self-reinforcement, occurs when an initial action ‘puts in place a set of forces or complementary institutions that encourage that choice to be sustained’ 98. Related investments reinforce the initial choice and make the costs of reversal rise. Continuing with the QWERTY keyboard as an example, the creation of schools devoted to teaching typing using QWERTY keyboard and employers seeking skills in using such keyboards would reinforce and sustain the initial choice made to opt for the QWERTY keyboard.
In the context of positive feedback, an action or a choice creates positive externalities when more people make the same choice or take the same actions99. Positive feedbacks act as bonuses to people who already support the intervention, and thereby encourages others to make the same choice. In the QWERTY example, those that have already learned this keyboard system when it was first invented, they face a very low risk that they will have to compete with another group learning the DVORAK method.
Finally, lock in occurs, according to Page, when early adopters benefit and would be harmed if it is replaced by something else, even if the something else is better100.
A number of other papers have attempted to isolate the causes for lock-in effects and they came up with a number of explanations which can be grouped into two categories, namely technological paradigms and increasing returns to adoption.
94 Page, Scott E. 2006. Path Dependence. Quarterly Journal of Political Science 1:87- 115 95 http://environment.research.yale.edu/documents/downloads/0-9/2010_super_wicked_levin_cashore_bernstein_auld.pdf 96 This is often cited as a good example of path dependency leading to an outcome that is economically inefficient, though this has been debated and is not conclusive. 97 http://environment.research.yale.edu/documents/downloads/0-9/2010_super_wicked_levin_cashore_bernstein_auld.pdf 98 Page, Scott E. 2006. Path Dependence. Quarterly Journal of Political Science 1:87- 115, p 88 99 http://environment.research.yale.edu/documents/downloads/0-9/2010_super_wicked_levin_cashore_bernstein_auld.pdf 100 http://environment.research.yale.edu/documents/downloads/0-9/2010_super_wicked_levin_cashore_bernstein_auld.pdf

ECA - Carbon lock-in toolkit
Lock-in literature
68
Technological paradigms relate to the idea that the direction of technological interventions is largely based on users’ “cognition”. Nelson & Winter (1977)101 describes this as technological regimes, while Dosi (1982)102 refers to them as technological paradigms. Both refer to the existence of certain ‘principles’ that frame the actions by members of the technological community, including engineering ideas about the nature of the technological problem103.
These principles are often focused in specific directions that build on past achievements and knowledge and for that reason they exclude technological possibilities that lie outside the dominant technological paradigm104.
The second explanation for the existence of technology lock-in is the notion of increasing returns to adoption, which is closely linked to the positive feedback mechanism that was described above by Page.
Arthur's (1989)105 model of competing technologies is a simple model that has been extensively cited in the economics literature to illustrate the concept of increasing returns to adoption that lead to technology lock in phenomena.
In the model, two competing technologies, A and B, compete in a market of indecisive adopters. The process of technology adoption is modelled as a random sequential appearance of agents at the market. Upon arrival, each agent must decide which technology to adopt. The agent’s decision is determined by two factors, the agent’s natural preference and also the number of adopters of each technology. In the presence of increasing returns to adoption, the more adopters a technology has the more attractive this technology is. Thus, an agent may, in principle, have a preference for technology A, but decide to adopt technology B because the number of adopters of B is much greater than the number of adopters of A106.
In the presence of increasing returns, Arthur (1989) proves that sooner or later the system locks in one of the two competing technologies. After a certain point every newcomer arriving at the market will choose the same technology regardless of their own preference. Arthur's model is a useful contribution in the understanding of the mechanisms that lead to some lock-ins in the real world107.
As pointed by Arthur (1989)108, when two or more technologies are competing for market dominance, the presence of increasing returns implies that the technology that would be adopted first is more likely to dominate the market. This is because early adoption can
101 Nelson, R. R. and S. G. Winter (1977), 'In search of useful theory of innovation', Research Policy, 6, 35-76 102 Dosi, G. (1982), 'Technological paradigms and technological trajectories: a suggested interpretation of the determinants and directions of technical change', Research Policy, 11, 147-162 103 http://isecoeco.org/pdf/techlkin.pdf 104 Dosi, G. (1982), 'Technological paradigms and technological trajectories: a suggested interpretation of the determinants and directions of technical change', Research Policy, 11, 147-162 105 Arthur, W. B. (1989), 'Competing technologies, increasing returns and lock-in by historical events', Economic Journal, 99, 116-131 106 Arthur WB. Competing technologies, increasing returns, and lock-in by historical events The economic journal 1989;99 116-131 107 Arthur WB. Competing technologies, increasing returns, and lock-in by historical events The economic journal 1989;99 116-131 108 Arthur, W. B. (1989), 'Competing technologies, increasing returns and lock-in by historical events', Economic Journal, 99, 116-131

ECA - Carbon lock-in toolkit
Lock-in literature
69
generate a snowballing effect whereby the preferred technology attracts the attention of investors that seek to make improvements to the existing technology and provide complementary technologies that stimulate further adoption. In fact, under this mechanism, technologies that fail to attract the interest of consumers in the early adoption stage, they might eventually find themselves locked-out from the market109.
Four classes of increasing return that are commonly implicated in technology lock-in type outcomes are found in the literature. The first one refers to scale economies which relates to the notion that rising output is correlated with a reduction in marginal costs.
The second one relates to learning economies; the more individuals and firms operate a certain technology, the better their understating of this technology is and the more efficient their use of that technology becomes. The above two types of increasing returns can be illustrated together with the use of learning curves, which show a reduction in unit costs when output rises110.
A third type of increasing returns is that of adaptive expectations, whereby increased adoption reduces the risk of performance, reliability and durability of a technology111.
The final type of increasing returns that is associated with technology lock in is that of network externalities. Network externalities, as discussed in the previous section, are the benefits accrued by users of a technology when this technology is used by others. The main feature of this type of technological interdependence is that the attractiveness of a certain technology depends on its network size. The value of a telephone, for instance, relates to the number of people that can be reached through its network112.
In the presence of such technological interdependencies, any attempt to introduce a new technology that is not compatible with existing technologies and infrastructures will most probability be deemed to failure113. This is because switching costs are very large, and relate not only to the replacement of the physical aspects of the technological system but also people’s skills that are linked to the incumbent technology.
A2.2 Technology and R&D policy
Technology systems may create path dependencies in the innovation process. The current dominance of the carbon-based system creates incentives to improve carbon technology rather than non-carbon (IPCC, 2014; Foxon, 2002). This has been observed in private (Aghion et al., 2012) as well as public institutions (Unruh, 2000), as exemplified by fossil fuel subsidies (OECD, 2013). Escaping carbon lock-in is essentially a problem of co-ordination (Rodrik, 2007; Kretschmer, 2008), which can be facilitated by public policy that addresses technology-push, demand-pull, and framework conditions in a complementary fashion (Nemet, 2013). Technology and R&D policy can therefore help to address carbon lock-in, in
109 http://isecoeco.org/pdf/techlkin.pdf 110 http://isecoeco.org/pdf/techlkin.pdf 111 http://isecoeco.org/pdf/techlkin.pdf 112 http://isecoeco.org/pdf/techlkin.pdf 113 Metcalfe, J. S. (1997), ‘On diffusion and the process of technological change’, in: Economics of structural and technological change (G. Antonelli and N. De Liso, eds.), Routledge: London
ECA - Carbon lock-in toolkit
Lock-in literature
70
support of other more systematic carbon policies and measures to incentivise emissions reduction.
The IPCC (2014) provides an extensive review of technology policy instruments implemented worldwide according to three overarching categories:
the patent system and other forms of intellectual property (IP)
public funding of research, tax subsidies for firms engaging in R&D; and
various policies designed to foster deployment of new technologies.
They conclude that technology and R&D policy plays an important complementary role to those policies aimed directly at reducing GHG emissions. They note that technology policy will be most effective when all aspects of the innovation/deployment chain are addressed in a complementary fashion, and that investment depends on the willingness of a variety of actors to manage the balance between the risks and rewards in each step of the chain, and government decisions are crucial to this balance (ibid).
This is particularly relevant to the design of R&D policies by developed countries. It is relevant to some extent to the design of R&D policies in developing countries if it can be shown that carbon intensive policies create carbon lock-in (which, by definition, is detrimental to developing countries). The concern of the Toolkit is to identify the circumstances under which carbon intensive policies will lead to detrimental carbon lock-in.
A2.3 Specific carbon lock-in literature
The literature on carbon lock-in is relatively sparse. There is some good literature suggesting how carbon lock-in should be evaluated but not much literature that applies a consistent framework to the evaluation of carbon lock-in in developing countries and, particularly to the issue of whether a carbon intensive path is likely to be economically inefficient and therefore one to be avoided from a national perspective.
The following provides a brief summary of some examples of the literature addressing carbon lock-in.
Carbon lock-in in motor cars and electricity generation
Using the general technological path dependence/lock-in frameworks, Shackely and Green114 provide an explanation of how the initial design of the car and the establishment of factories, commercial activities and infrastructure around this design led to carbon entrenchment. Another example of carbon lock-in accompanied by negative environmental consequences can be found in electricity generation and distribution systems115. It is less clear whether these paths can be identified as economically inefficient given the policies and
114 Shackley, S. & Green, K., 2007. A conceptual framework for exploring transitions to decarbonised energy systems in the United Kingdom. Energy, 32(3), pp.221–236 115 Unruh, G., 2000. Understanding carbon lock-in. Energy policy, 28

ECA - Carbon lock-in toolkit
Lock-in literature
71
knowledge at the time policy decisions could have been made that would have led to alternative paths (or, indeed, whether they were inefficient in retrospect given the knowledge of today).
Low carbon transport
A paper by Kopp116 addresses carbon lock-in in the transport sector. It recommends that developing countries need to transition to a low-carbon transport sector now to avoid locking themselves into an unsustainable and costly future and discusses how to reconcile economic development with the need to curb emissions. It also considers international support for low carbon policies in developing countries. But it does not address directly or analytically whether low carbon policies would maximise growth and economic development and welfare or whether such policies would lower the rate of economic growth and development.
Carbon lock-in in South Africa
A 2012 Report117 considers carbon lock-in in South Africa. It considers that carbon lock-in relates to unmet demand expectations:
The longevity and bulky nature of infrastructure investments mean that expectations of future demand for infrastructure is a more important determinant of infrastructure investments than current demand of infrastructure. If the future demand for a type of infrastructure is overestimated, the value provided by investments will be reduced and the capital invested could have been deployed more efficiently elsewhere in the economy. This outcome is referred to as carbon lock-in. (page i)
This prioritises stranded costs (or asset lock-in) over carbon intensity. Asset lock-in is a risk that occurs with any major infrastructure investment. The authors go on to describe three types of “carbon” lock-in: emissions lock-in, asset lock-in and institutional lock-in. The first occurs when emissions cannot be reversed because the investments are irreversible (this is the carbon component of carbon lock-in). The second refers to stranded assets. The third – institutional lock-in – refers to entrenched interests that encourage inertia and discourage innovations toward energy efficiency. The authors note that the avoidance of asset lock-in is most important consideration for private investors.
The authors do not attempt to analyse whether low carbon strategies in South Africa are likely to be least-cost over a future planning horizon or whether high carbon strategies will lead to asset lock-in. The paper notes that in terms of investment decision making by private investors “on the policy front, a fluid climate change policy framework increases the possibility that carbon costs may affect project viability sooner and/or more severely than anticipated. To reduce the risk of policy uncertainty and stranded assets, it is paramount that infrastructure be developed in a way that is compatible with current climate change policies and strategies”. It does not make recommendations on what investors should consider in terms of possible future climate policy in South Africa. It also states that “Given the complexities of determining whether or not
116 Kopp, A., Block, R. I., and Iimi, A. (2013). Turning the Right Corner: Ensuring Development through a Low-Carbon Transport Sector. World Bank. 117 DNA Economics (2012), Carbon lock-in: Infrastructure Investment Research Piece NPC low carbon economy work programme.

ECA - Carbon lock-in toolkit
Lock-in literature
72
infrastructure investments are vulnerable to lock-in effects and the lack of detailed data on investment in South Africa, it is not possible to provide a definitive conclusion on the current risk to South Africa‟s infrastructure portfolio” (page 19).
Lock-in effects of road expansion on CO2 emissions, China
A paper118 produced by the World Bank examines carbon lock-in in the road sector in Beijing, China. This concerns urban sprawl and decentralisation that leads to extensive road investments that, in turn, locks in the urban sprawl making subsequent investments in public transport less effective in reducing car usage, use of petroleum products, and CO2 emissions. The paper quantifies this using a “core-periphery” model and shows that a focus on investment in Beijing’s core would reduce the city’s CO2 emissions.
Interestingly, the paper suggests that there is a trade-off between lower emissions and welfare. Suburban road expansion would induce higher suburbanisation and higher welfare gains but more fuel consumption and CO2 emissions. The low-carbon alternative of investment in the city’s core, by drawing the population to the core and reducing suburbanisation, would achieve lower emissions but at the expense of lower welfare gains. The paper describes the policy of focusing on improvements in the city centre as a “good” policy but does not explain how it judges the trade-off between welfare loss and the benefit of emission reductions.
The analysis did not consider how future energy price movements would impact on the costs of the two alternative policies and the corresponding welfare gains nor the benefit to be gained by China from CO2 emission reduction. Unusually, because it has nearly 20% of the world’s population, China benefits more directly from the impacts of its own carbon policies on global warming than do other countries119 but will also be affected by the financial incentives available through the international climate change framework. These considerations appear to us to be major factors that ought to be considered in policy decisions.
A2.4 Green-growth literature
Some of the green-growth literature recognises that green policies can push the economy in a direction that leads to faster growth (for example, by making economies be more energy efficient or by making them more resilient to energy price shocks) and that a better environment has welfare benefits that may not be measured by GDP statistics but which nevertheless can be considered as contributing to economic development. But some of the literature also acknowledges that green policies may impact negatively on economic growth and therefore on poverty, and these seek to assess the extent to which there is a trade-off between the two and how the negative impacts on growth can be mitigated. One of the key
118 Anas, A., Timilsina, G. R. (2009). Lock-in Effects of Road Expansion on CO2 Emissions Results from a Core-Periphery Model of Beijing. World Bank Policy Research Working Paper 5017. 119 If, for the sake of argument, the benefit of avoiding climate change are proportional to population then China’s direct benefit from each tonne of CO2 not emitted to the atmosphere will be 20% whereas, Kenya will benefit directly by only 0.65% from a tonne of CO2 not emitted.

ECA - Carbon lock-in toolkit
Lock-in literature
73
papers on this topic is by Hallegatte et al. (2011) and published by the World Bank120. This paper seeks to develop a framework that identifies channels through which green policies can potentially contribute to economic growth but acknowledges that “only detailed country- and context-specific analyses for each of these channels could reach firm conclusion regarding their actual impact on growth”. This appears to be at the core of the discussion over carbon lock-in – a policy that results in high carbon may have locked-in the high carbon emissions but may, from the country perspective, be optimal for economic development. To our knowledge, the ‘Hallegatte’ framework has not been applied to any specific countries.
A paper in the same vein examines the methods used to assess the economic costs and benefits (and therefore indirectly and potentially the impact on economic growth) of environmental policies for Mexico (and the US)121 and notes that Mexico does have a functioning, though imperfect, systems for assessing environmental policies. It does not, however, consider the type of dynamic benefit implied by the Hallegatte framework or the more general carbon lock-in literature.
Another World Bank study (2012)122 believes that the obstacles to green growth are mainly political and behavioural inertia and a lack of financing instruments, and not the cost of green policies. It believes however, that there is no single green growth model and green growth strategies have to be tailored to local contexts and preferences123.
A later paper by Hallegatte et al. in 2013124 continues to consider the need for policies to encourage a green economy and minimise the impact on economic development. This paper considers green industrial policies. It proposes that in order to ‘green’ the industrial sector there needs to be industrial policies that encourage an economic shift, and that market forces by themselves will be slow. This is not specific to any particular group of countries.
A2.5 Energy price vulnerability literature
There is a group of literature that considers the vulnerability of countries to energy price shocks. Indeed, one of the IEA’s missions is to promote resilience to energy supply shortages and energy price shocks among IEA member states including obligations to maintain oil stockpiles. This literature does not address the issue of carbon lock-in but, as noted above, it is nevertheless relevant to the discussion of lock-in because avoiding carbon lock-in simultaneously provides protection against energy price vulnerability.
120 Hallegatte, S., Heal, G., Fay, M. and Treguer, D. (2011). From Growth to Green Growth: A Framework. World Bank Policy Research Working Paper no. 5872 121 : Harrington, W., Morgenstern, R., and Velez-Lopez, D. (2012). Tools for Assessing the Costs and Benefits of Green Growth: The U.S. and Mexico. World Bank Policy Research Working Paper no. 6242. 122 The World Bank (2012) Inclusive Green Growth: the Pathway to Sustainable Development. The World Bank 123 The World Bank (2012) Inclusive Green Growth: the Pathway to Sustainable Development. The World Bank 124 Hallegatte, S., Fay, M., and Vogt-Schilb, A. (2013). Green Industrial Policies: When and How. World Bank Policy Research Working Paper no. 6677.

ECA - Carbon lock-in toolkit
Lock-in literature
74
One example of the literature addressing oil price vulnerability was undertaken for DFID by the Sustainability Institute and School of Public Leadership in South Africa125. This work included a series of country case studies assessing oil price vulnerability in Africa and India in qualitative terms.
Another work programme with the same theme was funded by the World Bank and covers Latin America and the Caribbean126. This identifies various strategies to mitigate the effects of higher oil prices and of volatility in the oil prices. It focuses on the effects on the energy sector and mitigation possibilities in that sector ranging from financial instruments, energy efficiency in electricity production and use, regional integration to reduce the need for oil-based generation. It also assesses the potential impact of some of these strategies GDP. This is an example of policies that avoid carbon intensity and improve GDP and therefore avoid carbon lock-in as we have defined it in Section 2.
125 Sustainability Institute and School of Public Leadership (2013), Oil Shock Mitigation Strategies. Stellenbosch University, South Africa. 126 Yépez-García, R. A., Dana, J. (2012). Mitigating Vulnerability to High and Volatile Oil Prices Power Sector Experience in Latin America and the Caribbean. World Bank.

ECA - Carbon lock-in toolkit
International trends
75
A3 International trends
Future energy prices are a key consideration in the assessment of the potential economic consequences of following particular energy intensive or non-energy intensive pathways.
For the purposes of this Toolkit we have used the projections for oil, gas and coal prices from IEA’s 2013 World Energy Outlook.
IEA provides yearly updates of three recurrent scenarios, namely the Current Policies Scenario, the New Policies Scenario and the 450 Scenarios, to depict the possible evolution of energy markets through to 2035. The scenarios are differentiated primarily by their underlying assumptions about government policies:
The ‘new policies scenario’ – this is their central scenario which includes assumptions about the cautious implementation of policies that have been announced by governments but are yet to be given effect.
The ‘current policies scenario’ takes account only of policies already enacted as of mid-2013.
The ‘450 scenario’ shows what is required to set the energy system on track to have a 50% chance of keeping to 20C the long-term increase in average global temperature.
The international energy prices under each of the scenarios reflect analysis of the price levels that are necessary to stimulate sufficient investment in supply in order to meet demand over the period.
In the following section we briefly describe the key assumptions behind each of the scenarios and in the subsequent sections we describe the IEA projections for oil, gas and coal prices.
A3.1 IEA’s three international energy price scenarios
The New Policies Scenario is the central scenario of IEA’s outlook and it also serves as the reference scenario in the case study analysis.
This takes into account broad policy commitments and plans that have already been implemented to address energy-related challenges as well as those that have been announced, even where the specific measures to implement these commitments have yet to be introduced. The commitments include programmes to support renewable energy and improve energy efficiency, initiatives to promote alternative fuels and vehicles, carbon pricing and policies related to the expansion or phase- out of nuclear energy and initiatives taken by G-20 and Asia-Pacific Economic Cooperation economies to reform fossil fuel subsidies. The scenario, however, assumes only cautious implementation of current commitments and plans, as there are institutional, political and economic circumstances in all regions that could stand in the way.

ECA - Carbon lock-in toolkit
International trends
76
Under the this scenario, Average IEA crude oil import price reaches US$128/barrel (in year-2012 dollars) in 2035. A degree of convergence in natural gas prices occurs between the three major regional markets of North America, Asia-Pacific and Europe. Coal prices remain much lower than oil and gas prices on an energy-equivalent basis.
The Current Policies Scenario is based on the perpetuation of government policies and measures that were formally enacted as of mid-2013. The scenario assumes that governments do not implement any recent commitments that have yet to be backed up by legislation or introduce other new policies bearing on the energy sector. This leads to higher demand and, consequently, higher prices of fossil fuels. Prices, however, are not high enough to trigger significant substitution of fossil fuels by renewable energy sources.
The 450 scenario sets out an energy pathway that is compatible with a near 50% chance of meeting the goal of limiting the increase in average global temperature to 2°C compared with pre-industrial levels. This scenario assumes that for the period to 2020, policy action aiming at fully implementing the commitments under the Cancun Agreements, which were made at the 2010 United Nations Climate Change Conference in Mexico, is assumed to be undertaken (in the New Policies Scenario these commitments are only partly implemented). After 2020, OECD countries and other major economies are assumed to implement emissions reduction measures that, collectively, ensure a trajectory consistent with the target.
The 450 Scenario assumes lower energy demand which means that there is no need to make use of more costly fossil fuel resources. As a result, international fossil fuel prices are lower than in the other two scenarios.
The resulting international oil, coal and natural gas prices are shown below.
Figure 18 Crude oil import prices –IEA 2013
Source: IEA, 2013, World Energy Outlook
Figure 19 IEA’s coal price scenarios
Source: IEA, 2013, World Energy Outlook

ECA - Carbon lock-in toolkit
International trends
77
Figure 20 IEA’s regional gas price scenarios
Source: IEA World Energy Outlook, 2013, Figure 3.11, real 2012 price levels Note: MBtu is identical to mmbtu
A3.2 IEA’s international carbon price scenarios
The International Energy Agency provides scenarios for CO2 prices that are a useful default source for the carbon lock-in tool. These can be found in the World Energy Outlook published annually: www.worldenergyoutlook.org. The energy price forecasts are in Part A - Section 1 (specifically in the 2013 version in Table 1.5). These scenarios are consistent with the international energy price scenarios.
The level of CO2 prices depends on the degree of policy intervention to reduce CO2 emissions. IEA assumes, under all scenarios, that all existing carbon trading schemes and taxes will be retained. The price of carbon is projected to increase throughout the period under all scenarios.
In the New Policies Scenario, IEA has also assumed that from 2015 all investment decisions in the power sector in the US, Canada and Japan will include a ‘shadow’ carbon price that is expected to rise from US$13/tonne to US$40/tonne in 2040.
In its 450 Scenario, IEA assumes that all OECD countries, together with some major non- OECD countries, will eventually adopt carbon pricing and it projects that international CO2 prices will increase to US$140/tonne in 2040.
The figure below shows IEA’s carbon price projections to 2040.

ECA - Carbon lock-in toolkit
Sources of other data
78
Figure 21 IEA’s carbon price projections in selected regions by scenario (US$/tonne)127
A3.3 Trends in the costs of renewable energy
The International Renewable Energy Agency (IRENA) will, we hope, periodically publish projections of trends in the costs of various renewable power generation technologies. The latest is: Renewable Power Generation Costs in 2012, published in January 2013, and available from the publications pages128 of: www.irena.org.
A4 Sources of other data
A4.1 CO2 emission factors
Default emission factors by fuel type can be found in UNFCCC’s 2006 IPCC Guidelines for National Greenhouse Gas Inventories. Volume 2, chapters 2 and 3 are relevant to this flowchart tool. Volume 2 covers stationary combustion processes (power generation, industrial processes, etc.,) while volume 3 covers mobile technology (cars, trains, etc.). This is available at: www.ipcc-nggip.iges.or.jp/public/2006gl/ The relevant default values are provided in Table 2.2 of chapter 2 and Table 3.2.1 of chapter 3.
127 2013 price levels. 128 “Reports and Papers” tag, and then the “IRENA Insights” tag.

ECA - Carbon lock-in toolkit
Sources of other data
79
The default values are provided as kg of CO2e per TJ of energy. This requires some manipulation to provide an estimate of CO2e emissions. Conversion factors are provided at the start of this document.
A4.2 Power generation data
Various sources of generic data are available on power plant capital, fuel and operating costs and other parameters. Some of the more regular publishers of data or information include:
Electricity generation cost reports are published by the Department of Energy and Climate Change (DECC) available from:
www.gov.uk/government/publications?departments%5B%5D=department-of-energy-climate-change
For example the publication: Electricity Generation Costs, 2013.
The Projected Costs of Generating Electricity, is published by IEA and available at:
www.iea.org/publications
However, this was last published in 2010.
Cost and performance data for power generation technologies, February 2012. Prepared for the US National Renewable Energy Laboratory by Black & Veatch.
The US Energy Information Administration (EIA) publishes an Annual Energy Outlook, which contains information on power generation costs but these are presented as levelised costs. Available from:
www.eia.gov/forecasts/aeo/electricity_generation.cfm
Model for Electricity Technology Assessment (META) is a tool that is downloadable from ESMAP129 and contains a database of costs for different generation technologies. It also calculates the levelised costs. It is available from:
www.esmap.org/node/3051
Some electricity regulators’ websites provide studies that show the best-new entrant technology costs – typically combined-cycle gas turbine plants.
The International Renewable Energy Agency (IRENA) produces reports that provide forecasts of technological developments and of future costs of renewable energy technologies. These are available from:
www.irena.org/Publications/index.aspx?mnu=cat&PriMenuID=36&CatID=141
129 Energy Sector Management Assistance Programme, part of the World Bank group. META was developed in part by Economic Consulting Associates.

ECA - Carbon lock-in toolkit
Sources of other data
80
A4.3 Urban and transport
The international organisation for public transport authorities (UITP) publishes reports, benchmarking studies, statistics, best practices, guidelines and recommendations on the latest public transport policies and solutions.
http://www.uitp.org/knowledge
The ‘CAPSUT - Capacity Building on Sustainable Urban Transport’ webpage is an international platform for training activities in the field of urban mobility, providing the latest trends and developments in the urban transport sectors worldwide, with a focus the concepts of Sustainable Transport.
http://www.sutp.org/index.php/capsut
The Nationally Appropriate Mitigation Actions in the Transport Sector (t-NAME) international database is an interactive wiki-based portal that provides access to transport NAMAs that are at all stages from initial concept to implementation. The database gives users an in-depth insight into the main characteristics and processes behind the featured transport NAMAs, including the policy identification process, mitigation actions, co-benefits, financing and the registration process, including lessons learned and good practices.
http://www.transport-namadatabase.org/index.php/Main_Page
A4.4 Other data
IEA’s Clean Coal Centre publishes reports on the costs of clean coal technologies in industry and power generation:
www.iea-coal.org.uk/site/2010/publications-section/our-publications?LanguageId=0
The IEA Greenhouse Gas R&D Programme (IEAGHG) evaluates technologies that can reduce greenhouse gas emissions derived from the use of fossil fuels. It produces reports on new technologies including, for example, carbon capture and storage. See:
http://ieaghg.org/publications

ECA - Carbon lock-in toolkit
Discount rates
81
A5 Discount rates
A5.1 DFID advice
DFID provides advice to its staff on the calculation of economic discount rates appropriate to the economic evaluation of projects in beneficiary countries. These discount rates are derived from the countries’ economic growth rates, poverty distribution and credit constraints and vary over time.
A5.2 Choice of discount rate depends on the purpose
This Toolkit is available to be used by national decision makers in developing countries as well as DFID staff, other international finance institutions and donors, and NGOs or stakeholders.
The focus of the Toolkit is on national economic self-interest and the appropriate discount rate is therefore normally the national social discount rate. However, different discount rates may be used for different purposes. There are arguments for applying different discount rates to investments relating to climate change and such discount rates may be used by donors when deciding whether an intervention is justified from the donor’s perspective. These may differ from discount rates appropriate to national decision making.
Discount rates used by national decision makers should generally be the national government’s social discount rate in real terms (without inflation). These discount rates are often advised to ministries and state-owned enterprises by the Treasury, Ministry of Finance, Ministry of Economy, etc.
Donors, NGOs and stakeholders may have different views on what the national social discount rate should be. Each may apply a different methodology for calculating economic discount rates to be used when deciding whether an intervention or policy is in the national self-interest.
The discount rates used in the case studies are described in Annex A6.

ECA - Carbon lock-in toolkit
Input data assumptions for the case studies
82
A6 Input data assumptions for the case studies
A6.1 Discount rates for the three countries
For the purpose of the case studies, we have used discount rates that we believe are those most likely to be used by policy makers in national governments and reflect national circumstances. The economic discount rates in real terms used in the three countries are as follows:
Kenya: The National Treasury does not make its advice on appropriate social discount rates available to the public. Kenya’s Climate Change Action Plan, August 2012, used a social discount rate of 12% (for the transport sector). A similar economic discount rate was used in the Feasibility Study & Technical Assistance for Mass Rapid Transit System for the Nairobi Metropolitan Region130. ECA’s own study for KfW131 on green mini-grids in Kenya adopted an economic discount rate of 10%. A study by Innovation Energie Developpment on low carbon mini-grids in Kenya, prepared for DFID, used a 10% discount rate. For simplicity, we have also used a real economic discount rate of 10% in the case studies.
Nigeria: We are not aware of guidance issued by Nigeria’s Federal Ministry of Finance or by the equivalent state-level Ministries relating to appropriate economic discount rates to use for the appraisal of projects. DFID has provided advice on the prioritisation and appraisal of Federal level public investment projects but proposals on appropriate discount rates was not available. A study132 for the World Bank on solar PV for off-grid electrification used an economic discount rate of 8%.A study133 on low carbon development opportunities in Nigeria by the World Bank used a discount rate of 10%. For simplicity, we have also used a real economic discount rate of 10% in the case studies.
South Africa: South African Treasury provides guidance134 to Ministries and state-owned enterprises on the discount rates to be used for the appraisal of capital projects but the Treasury’s only guidance on economic discount rates is that they should be the “social discount rate”. The World Bank’s project appraisal document135 for its latest loan to Eskom (the state-owned electricity company) used a real economic discount rate of 10% and they cited the South African Government’s Long Term Mitigation Scenario as the source for this 10% figure. The Department of Energy’s Integrated Resource Plan (2013 Update) used an 8% real discount rate. For simplicity, we have used a real economic discount rate of 10% in the case studies.
130 Ministry of Transport, Republic of Kenya, 2009. 131 German development bank. 132 Sustainability, Policy, and Innovative Development Research Solutions, Electricity Access in Nigeria: Is off-grid electrification using solar photovoltaic panels economically viable? 2012. 133 Cervigni, Raffaello, John Allen Rogers, and Max Henrion, eds. 2013. Low-Carbon Development: Opportunities for Nigeria. Directions in Development. World Bank. 134 National Treasury, Capital Planning Guidelines. 135 World Bank, Eskom Investment Support Project, Project Appraisal Document, March 2010.

ECA - Carbon lock-in toolkit
Input data assumptions for the case studies
83
A6.2 Kenya - MRTS
Table 8 describes the benefit and cost flows due to the MRTS136.
Table 8 Benefit and Cost flows of the Kenya MRTS
Cost/benefit category Type of cost/benefit
Investment
Investment in BRT
Investment in LRT
Investment reduced due to MRTS
Savings in Investment Cost of Road Infrastructure in the 'business as usual scenario'
Personal vehicles (cars and two-wheelers)
Operation and Maintenance (O&M) charges
O&M charges of BRT
O&M charges of LRT
O&M charges reduced due to MRTS, fewer vehicles on road and decongestion
Personal vehicles (cars and two wheelers)
Fuel savings
Benefits
Greenhouse gas abatement (due to reduction in number of vehicles on road and due to reduction of congestion on road)
Savings in travel time (due to reduction on congestion on roads and reduction in travel time for MRTS passengers)
Reductions in accidents
Unskilled labour wage
Economic benefits are calculated as the difference in the ‘without’ and ‘with’ project cases. The ‘without project’ situation is defined as the ‘base’ case or the ‘do-nothing’ case, where the projected development scenario is imposed on the existing transport network. The ‘with project’ case represents the future development scenario on the integrated multi-modal transport network after the MRTS project is implemented. The benefits of the MRTS project
136 http://mpra.ub.uni-muenchen.de/1658/1/MPRA_paper_1658.pdf

ECA - Carbon lock-in toolkit
Input data assumptions for the case studies
84
would be in terms of savings in travel time cost and vehicle operating cost, and reduction in carbon emissions137.
A brief description of the cost and benefit components is provided below.
Investment costs
Preliminary feasibility studies have put the cost for the bus system at around $US 926 million and that of the light rail system at around $US 3,650 million.
However, investing in the MRTS project implies that the Government will no longer need to invest in road infrastructure that was planned in the ‘business as usual scenario’. We assume that savings in investment cost in road infrastructure amount to $US 300 million and require maintenance equal to 5% of the initial investment per year.
Operation and maintenance
We assume that operation and maintenance costs of the MRTS are 5% of capital costs per year.
Investment in MRTS will result in a reduction in the purchase of private vehicles in the Nairobi area. Based on the historic increase in the number of registered vehicles and assuming that one third of the new cars are purchased within the Nairobi Metropolitan Area we assume that 5,000 people that intend to buy a car every year will not do so as a result of the MRT system. Given an average cost for a car of US$ 7,000, this implies annual savings of US$ 3.5 million.
Figure 22 Number of registered vehicles 2008-2011
Source: 138
There are also savings in fuel consumption due to the diversion of a part of the Nairobi road traffic to MRTS and reduced congestion to vehicles still operating on the roads and also there is a reduction in the purchase of private vehicles, since a number of potential car
137 http://nairobiplanninginnovations.files.wordpress.com/2012/05/nmrts-executive-summary-june2011.pdf 138 http://www.mfa.go.ke/downloads/9-Kenya-facts-and-figures-2012.pdf

ECA - Carbon lock-in toolkit
Input data assumptions for the case studies
85
owners will choose to use the MRTS instead. The fuel saved is estimate at 25 million litres of petrol per year139. When these fuel savings are valued at 2014 prices (US$ 1.13/litre for petrol) the corresponding fuel savings amount to US$ 28 million per year140. The savings depend on the fuel costs which are assumed to be linked to international prices according to IEA’s three global scenarios described in Annex A3.1. In the absence of MRTS, we assume that the number of passenger car journeys would increase at the rate of 7.5% per year.
Passengers benefitting
An estimate of how many commuters this scheme will cater for is not included in the Transport Plan. However, according to the feasibility study of the MRT system, total passengers served by the combined BRT and LRT systems will be between 3.2 and 4.2 million depending on population growth rates and city planning. For simplicity, we assumed that the users of the two systems will be 3.2 million in the first 10 years, 3.5 million in the following 10 years and 4 million in the following 5 years.
Value of time
Another important parameter that plays a crucial role in the decision to invest in low carbon intensity transport infrastructure is the value of time (VOT). A large scale investment in public transport, such as the MRTS, is likely to cause significant travel time savings for those that substitute the use of car to the MRTS. Besides user travel time savings, a transport project can also indirectly impact travel times of other travellers through reduced congestion resulting from a modal shift from car to public transit.
Normally, in a full cost-benefit analysis, alternative scenarios should be considered including the different VOT depending on each income group. However, we have simplified the discussion as much as possible to allow us to focus on the impact of carbon intensity on the decision. For the purposes of illustration we assume that the VOT is the same across income groups and increases with the growth in average incomes in real terms. Estimation of VOT for passengers is based on the wage rate approach.
Travel time savings includes all changes in travel time from origin to destination, including access, egress, transfer and in-vehicle time141.
Users shifting from other public transport modes are considered existing users, while users shifting from other modes are considered substituted users. The travel time savings are monetized using a value of time of US$ 2.84 per hour, based on 50% of the average income of the wage earners in a family in Nairobi142. The VOT in real terms is assumed to grow at 2% per year as the economy and income levels in real terms grow. Given the VOT, travel time savings are estimated to be in the order of US$ 350 million per year initially.
139 Assumed to be 25,000 vehicles, 30 km per day, 9 litres of fuel per 100 km. 140 http://www.unep.org/transport/gfei/autotool/nextsteps/Kenya%20Baseline%20Example.pdf 141 http://essay.utwente.nl/65036/1/TeunissenT_0165204_openbaar.pdf 142 http://data.worldbank.org/indicator/NY.GDP.PCAP.CD

ECA - Carbon lock-in toolkit
Input data assumptions for the case studies
86
Unskilled labour
The Unskilled labour employed on the construction and maintenance of the MRTS gain to the extent of the difference between the project wage rate and the wage rate in an alternative employment in the Nairobi area. Assuming that the unskilled labour cost constitutes 10% of investment cost and 5 percent of operation and maintenance cost of the MRTS, the benefit to unskilled labour is estimated at US$ 229 million during the first two years of construction and US$ 11.4 million afterwards.
Fewer accidents
Kenya, and specifically Nairobi, has a poor road accidents and safety record. Road transport is responsible for approximately 68 deaths per 1,000 registered vehicles, which is 30-40 times greater than in highly motorized countries. Road traffic accidents are the third leading cause of death after malaria and HIV/AIDS and present a major public health problem in terms of morbidity, disability and associated health care costs. The resulting cost of accidents is very high, estimated at between two and five percent of GNP143.
The MRTS will improve safety for all road users. Unsafe driving behaviours and unacceptable road conditions have increased the level of accident rates. It is estimated that only about 18% of the classified road are in excellent or good condition, 49% of the road are in fair condition and 33% are in poor or very poor condition. Accident data from the past five years also reveals that more than 700 accidents occurred on the road in Nairobi and about 30% (or 227) were fatal. Therefore, with the upgrading of the public transportation accident rates will decrease considerably and many lives will be saved.
However, fewer road accidents as a result of people using the mass rapid transport system instead of a private vehicle are not including in the calculations in order to keep the calculations as simple as possible.
A6.3 Nigeria – fuel mix
The project costs and other characteristics assumed for the case study gas-fired plant are derived from the Pan Ocean IPP project as follows:
Capital costs: US$ 301.9 million (including the gas treatment, compression and national gas liquids fractionation; connections to the gas transmission line).
Capital costs for the power plant: US$ 1,512 million, based on 809 MW of installed capacity for a combined-cycle gas turbine (CCGT) plant and, for simplicity, ignoring the potential grid extension costs that may be required. The cost per kW is US$1,875 which is high but reflects costs in Nigeria.
Fuel costs are calculated as the economic value of natural gas price (which is assumed to be US$0.5 per mmbtu delivered to the plant via Nigeria Gas Company’s transmission network). This is very controversial and is therefore subject to considerable sensitivity analysis.
143 file:///C:/Users/transfer/Downloads/Chapter%207%20SC4_%20Transport_FINAL%20(5).pdf

ECA - Carbon lock-in toolkit
Input data assumptions for the case studies
87
Non-fuel O&M costs: US$ 90.7 million per year (5% of capex assumed)
Annual project emissions (mainly energy CO2 and fugitive CH4 leaks) are estimated to be 435,028 tCO2. The project is estimated to result in annual GHG reductions of 2,699,146 tCO2, arising from elimination of wet gas flaring at the oil field (estimated at 3,134,174 tCO2 per year) minus project emissions (mainly energy CO2 and fugitive CH4 leaks).
The equivalent supercritical coal-fired pulverised fuel power plant is assumed to have a capital cost of US$4,400 per kW compared with the capital cost of the gas fired plant of US$1,875 per kW. These are both high by international standards but reflect the reality of Nigeria where costs are substantially higher than in western countries. The coal plant costs have been estimated as the ratio of the capital costs of a coal-fired power plant to a CCGT plant as provided by the US National Renewable Energy Laboratory144. O&M costs are again assumed to be equivalent to 5% of capital costs. This means that O&M costs for coal-fired plants are substantially higher than those of the equivalent CCGT and reflects the higher maintenance cost of coal handling equipment. Net efficiency is assumed to be 36%. Both CCGT and the coal fired plant are assumed to have a 90% capacity factor; normally a CCGT plant would have an availability that is higher than a coal-fired plant though in Nigeria this may not be true. The emission factor for a coal-fired plant is taken from the UNFCCC145 at 0.0946 tCO2e per GJ of coal (compared with 0.0561 tCO2e per mmbtu for natural gas.
A6.4 South Africa – CCS
Data on the costs of making power plants CCS-ready are limited.
IEA developed a spreadsheet tool for analysing costs of making plants CCS ready (the spreadsheet was associated with its report on CCS ready power plants146) but the spreadsheet is not now available.
A paper147 at about the same time as the IEA report above described the costs and benefits of CCS readiness for US power plants (see Table 9).
Table 9 Costs and benefits of making a plant CCS ready
Conventional IGCC Capture ready IGCC
Before retrofit
Investment (US$ million) 665 715 745
O&M (US$ million/year) 26.3 31.5 31.5
Fuel (US$ million/year) 46.6 46.7 46.7
144 Cost and performance data for power generation technologies, February 2012. Prepared for the National Renewable Energy Laboratory by Black & Veatch. 145 IPCC (Intergovernmental Panel on Climate Change) Guidelines for National Greenhouse Gas Inventories, 2006, Chapter 2 – Stationary Combustion. 146 CO2 Capture Ready Plants, Technical Study, Report no. 2007/04, May 2007, IEAGHG. 147 Capture-ready coal plants—Options, technologies and economics, Mark C. Bohm et al., International Journal of Greenhouse Gas Control, 2007.

ECA - Carbon lock-in toolkit
Input data assumptions for the case studies
88
Conventional IGCC Capture ready IGCC
CO2 emissions (million tonnes) 2.9 2.9 2.9
Levelised cost US$/kWh 0.0385 0.0414 0.04222
After retrofit
Retrofit investment (US$ million) 602 309 265
O&M (US$ million/year) 56.1 36.8 36.8
Fuel (US$ million/year) 65.2 57.5 57.5
CO2 emissions (million tonnes) 0.41 0.36 0.36
CO2 abated (million tonnes) 3.7 3.2 3.2
Levelised cost US$/kWh incl. costs before retrofit
0.0883 0.0755 0.0751
This showed a relatively modest increase in the capital cost to make the plant CCS ready of just over 4% (US$745 million for CCS-ready plant compared with US$715 million for a plant that is not CCS-ready). The payoff, in terms of lower future costs, were estimated in the paper as a saving in the cost of CCS of US$44 million (US$265 million versus US$309 million).
Unfortunately, the analysis focused on the cost of CCS retrofit for an IGCC plant that is CCS-ready versus one that is not CCS-ready where the cost of a CCS retrofit would be lower. Nevertheless, it indicates the order-of-magnitude costs of CCS-readiness of 0.1 US cent per kWh or 2.1%. On the benefit side, making the plant CCS-ready means that the overall costs drop by only 0.04 of a US cent or 0.5%.
A6.5 South Africa – cement industry
A World Bank paper148 estimated the potential reductions in energy consumption used in clinker production from the use of more efficient kilns from a typical level of 3,970 MJ/tonne of clinker to 3,135 MJ/tonne, a reduction of 21%. This was based on averages. For the purposes of illustration, we assume that the inefficient option uses 5,200 MJ/tonne while the ‘efficient’ process uses 3,135 MJ/tonne, a saving of 40%. The ‘efficient’ level would place the plants among the more efficient worldwide149, but is not unrealistic for a well designed plant.
Coal is assumed to have an energy content of 28 GJ per tonne and the emission factor for coal burnt in cement kilns is taken from the UNFCCC default values as 0.0946 tCO2/GJ.
The assumed economic cost of coal is described in the main text (National Scenarios).
148 Cement Sector Program in Sub-Saharan Africa: Barriers to CDM and Solutions, the World Bank, Carbon Finance Assist, 2009. 149 See Cement Industry Energy and CO2 Performance “Getting the Numbers Right”, World Business Council for Sustainable Development, 2009. Figure 6.1.

ECA - Carbon lock-in toolkit
Input data assumptions for the case studies
89
The additional investment and operating costs needed to achieve the above energy efficiency levels in South Africa are unknown (to us). The World Bank paper150 identifies the retrofit costs to achieve energy consumption savings of 21% for India. These costs are estimated to be equivalent to US$11.5/tonne of clinker. We assume that similar costs would be incurred in South Africa.
The additional investment and operating costs needed to achieve the above energy efficiency levels in a new plant in South Africa are assumed to be 60% of the costs of retrofit, at approximately US$ 6.9 per tonne of clinker.
150 World Bank, 2009, op cit.

ECA - Carbon lock-in toolkit
Nigeria – alternative gas price scenarios
90
A7 Nigeria – alternative gas price scenarios
The analysis of Nigeria’s energy mix analysis described in Section 4.2 of the Toolkit showed that gas supportive policies win over coal supportive or neutral policies if gas is assumed to have a low economic value of US$0.5/mmbtu (the value of gas is assumed to be low if the gas would otherwise be flared). This would be true whatever the assumptions for the value of lowering CO2 emissions. Even if there is no value to Nigeria in lowering CO2 emissions by promoting gas utilisation rather than coal, Nigeria should in any case utilise the gas because the economic costs are lower than the costs of coal-fired power generation (nearly 35% lower at US$0.057/kWh compared with US$0.087/kWh for coal-fired power generation). Higher values for carbon emission reductions would simply strengthen economic argument in favour of gas utilisation and against coal-fired power generation.
The levelised costs are summarised in Table 10 assuming a gas value of only US$0.5/mmbtu.
Table 10 Levelised cost of electricity for alternative generation - Nigeria
Natural gas Coal
Levelised cost (US$/kWh)
Value of CO2 emission reduction – US$0/tonne 0.057 0.087
Value of CO2 emission reduction – US$25/tonne 0.067 0.105
Value of CO2 emission reduction – US$50/tonne 0.077 0.123
However, if the economic value of gas is higher, for example if the alternative is assumed to be to export the gas as LNG rather than flaring, then there would be a benefit to Nigeria in developing coal-fired power generation if the economic value of gas exceeds US$6.2/mmbtu and the value to Nigeria of carbon abatement is zero.
It is certainly not unrealistic to assume the value of natural gas to Nigeria exceeds US$6.2/mmbtu. At values above US$6.2/mmbtu and when given no financial benefits from CO2 emission reduction, economic self-interest would then suggest a policy of exporting gas and building coal-fired power plants.
If the value of carbon abatement is US$25/tonne, then the breakeven economic value of natural gas increases to US$7.7/mmbtu before coal-fired power generation becomes attractive relative to gas utilisation. And at US$50/tonne for the benefit of carbon abatement, the breakeven value of natural gas would be US$9.1/mmbtu; above this level coal-fired generation becomes attractive.
The breakeven values of gas at different values for CO2 emission reductions are summarised in Table 11 below.

ECA - Carbon lock-in toolkit
Nigeria – alternative gas price scenarios
91
Table 11 Coal-fired versus gas-fired power generation - Nigeria
Value of CO2 reductions (US$/tonne CO2e) 0 25 50
Breakeven value of gas (US$/mmbtu) 6.2 7.7 9.1
In general, self-interested economic policy would support investment in coal-fired power generation if the value of coal delivered to the power plant is only US$50/tonne and the economic value of natural gas exceeds US$6.2/mmbtu.
Related Documents


