6 - 7 May 2010 Quality Matters! CCA Annual General Meeting, Berlin Wild Ingenieurbüro GmbH Dr.-Ing. Yves Carbon Footprint of Refrigerated Carbon Footprint of Refrigerated Goods Goods ’ ’ Transportation Transportation Comparison Comparison of Air, Land and Sea transport under Design of Air, Land and Sea transport under Design Conditions and in Real Operation Conditions and in Real Operation Quality Quality Matters Matters ! ! CCA CCA Annual Annual General Meeting, Berlin General Meeting, Berlin 6 6 - 7 May 2010 7 May 2010 Dr.-Ing. Yves Wild

Welcome message from author
This document is posted to help you gain knowledge. Please leave a comment to let me know what you think about it! Share it to your friends and learn new things together.
Transcript

6 - 7 May 2010Quality Matters! CCA Annual General Meeting, Berlin
Wild Ingenieurbüro GmbH
Dr.-Ing. Yves
Carbon Footprint of Refrigerated Carbon Footprint of Refrigerated
GoodsGoods’’ TransportationTransportation
ComparisonComparison of Air, Land and Sea transport under Design of Air, Land and Sea transport under Design
Conditions and in Real OperationConditions and in Real Operation
QualityQuality MattersMatters!!CCA CCA AnnualAnnual General Meeting, Berlin General Meeting, Berlin 6 6 -- 7 May 20107 May 2010
Dr.-Ing. Yves Wild

6 - 7 May 2010Quality Matters! CCA Annual General Meeting, Berlin
Wild Ingenieurbüro GmbH
Dr.-Ing. Yves
The solution is already there …

6 - 7 May 2010Quality Matters! CCA Annual General Meeting, Berlin
Wild Ingenieurbüro GmbH
Dr.-Ing. Yves
Content
• Introduction: CO2 Emissions through Transportation Activities– Basics of the Conversion Fuel Consumption - CO2 Emission
– Transportation Activities as a Contributor to Global GHG Emissions
– Different Emission Measurement Parameters
• Environmental Indexing: Example IMO Indices (Sea Transportation)– Design and Operational Indices: Pros and Cons
– Relevance for Evaluation of Reefer Transports
• Methodologies of CO2 Emission Calculation – The Influence of Refrigeration
– Example: A Comparison of Nominal and Actual Approach (Sea Transportation)
• Comparison of Different Transportation Modes– Aircraft, Ship, Truck and Railway Transportation
– Example: Optimization Possibilities during Air and Sea Transportation

6 - 7 May 2010Quality Matters! CCA Annual General Meeting, Berlin
Wild Ingenieurbüro GmbH
Dr.-Ing. Yves
COCO22 Emissions through Emissions through
Transportation ActivitiesTransportation Activities......

6 - 7 May 2010Quality Matters! CCA Annual General Meeting, Berlin
Wild Ingenieurbüro GmbH
Dr.-Ing. Yves
Fuel Combustion / CO2 Emission: Stoichiometrical conversions
Relevant for fuel consumption of ships
and trucks
Kerosene is a mixture of several Alkane series, Cycloalkanes and Aromatics,
whereas the exact composition varies. Assuming that kerosene was pure C15H32
(pentadecane), the combustion of 1 mole kerosene leads to 15 moles CO2.
Chemical formula CO2
Molar mass of CO2 44 g/mol
Chemical formula C
Molar mass 12 g/mol
CO2 emission 3.667 kg CO2/kg
Chemical formula H-(CH2)n-H
Molar mass 14 g/mol
CO2 emission 3.143 kg CO2/kg
Chemical formula C15H32*)
Molar mass 212 g/mol*)
CO2 emission 3.113 kg CO2/kg*)
Chemical formula CH4
Molar mass 16 g/mol
CO2 emission 2.750 kg CO2/kg
Carbon dioxide
Combustion of pure coal
Combustion of hydrocarbons
Combustion of methane (natural gas)
Combustion of kerosene (Jet A-1) Relevant for fuel consumption of aircrafts

6 - 7 May 2010Quality Matters! CCA Annual General Meeting, Berlin
Wild Ingenieurbüro GmbH
Dr.-Ing. Yves
CO2 Emission from Combustionhas doubled since 1970
Source: Greenhouse Gas Reduction Strategies in the Transportation Sector: Preliminary Report, © OECD/ITF, 2008

6 - 7 May 2010Quality Matters! CCA Annual General Meeting, Berlin
Wild Ingenieurbüro GmbH
Dr.-Ing. Yves
Transportation Activities as a Contributor to Global Emissions
13,1 %
23,4 %
CO2 from combustion by sector (2005)GHG emissions by sector (2004)
Source: Greenhouse Gas Reduction Strategies in the Transportation Sector:
Preliminary Report, © OECD/ITF, 2008
6 - 7 May 2010Quality Matters! CCA Annual General Meeting, Berlin
Wild Ingenieurbüro GmbH
Dr.-Ing. Yves
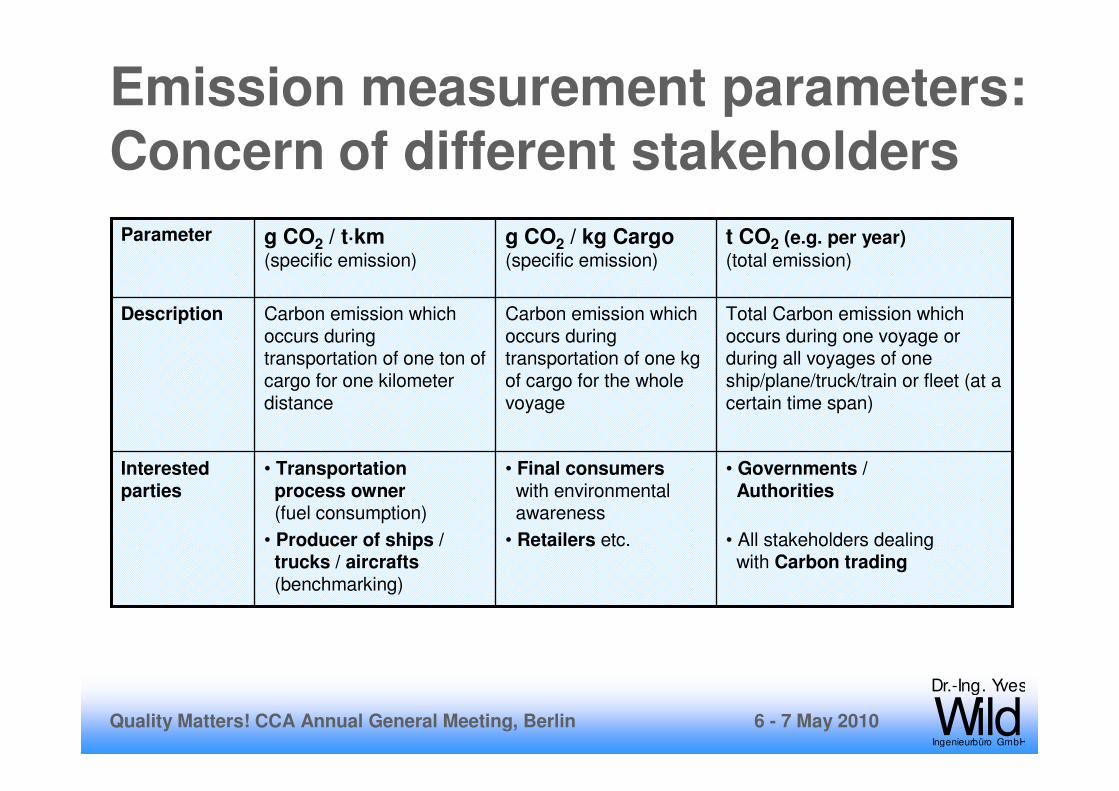
Emission measurement parameters:Concern of different stakeholders
Total Carbon emission whichoccurs during one voyage orduring all voyages of oneship/plane/truck/train or fleet (at a certain time span)
Carbon emission whichoccurs duringtransportation of one kg of cargo for the wholevoyage
Carbon emission whichoccurs duringtransportation of one ton of cargo for one kilometerdistance
Description
• Governments / Authorities
• All stakeholders dealingwith Carbon trading
• Final consumerswith environmentalawareness
• Retailers etc.
• Transportationprocess owner(fuel consumption)
• Producer of ships /trucks / aircrafts(benchmarking)
Interestedparties
t CO2 (e.g. per year)
(total emission)
g CO2 / kg Cargo(specific emission)
g CO2 / t·km(specific emission)
Parameter
6 - 7 May 2010Quality Matters! CCA Annual General Meeting, Berlin
Wild Ingenieurbüro GmbH
Dr.-Ing. Yves
EnvironmentalEnvironmental IndexingIndexing: :
ExampleExample IMO Indices IMO Indices
((SeaSea TransportationTransportation))……
6 - 7 May 2010Quality Matters! CCA Annual General Meeting, Berlin
Wild Ingenieurbüro GmbH
Dr.-Ing. Yves
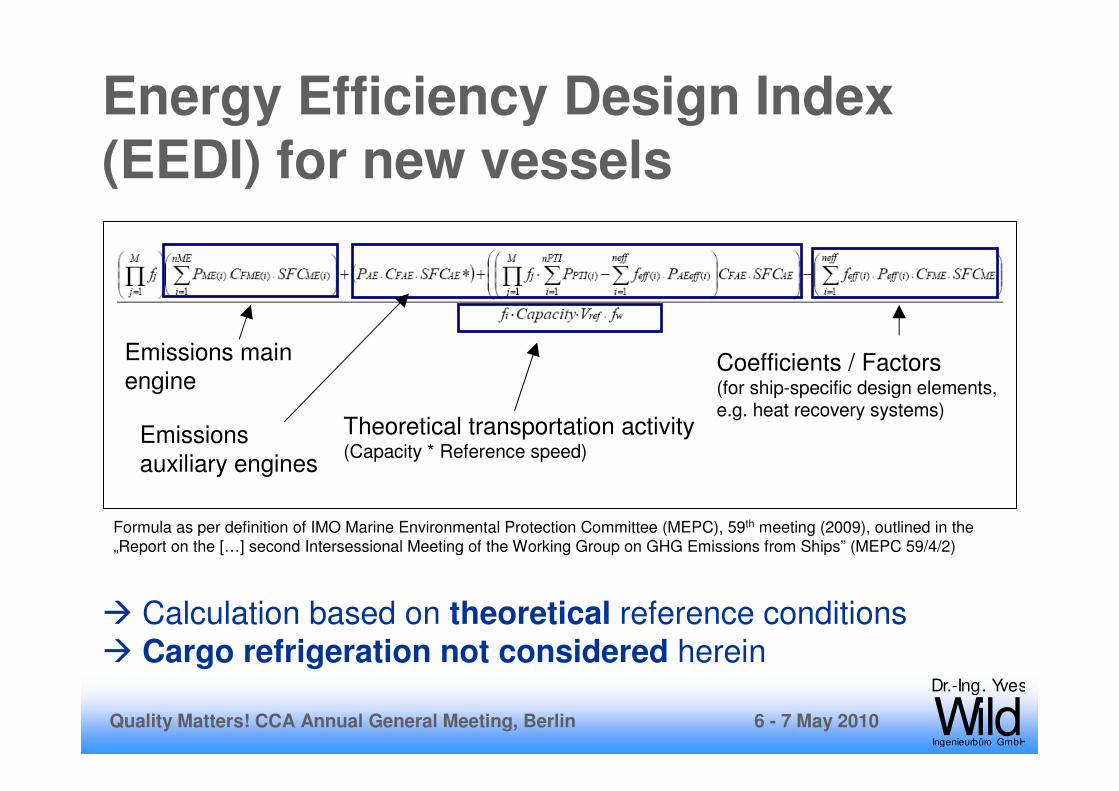
Energy Efficiency Design Index (EEDI) for new vessels
� Calculation based on theoretical reference conditions
� Cargo refrigeration not considered herein
Emissions main
engine
Emissions
auxiliary engines
Theoretical transportation activity(Capacity * Reference speed)
Formula as per definition of IMO Marine Environmental Protection Committee (MEPC), 59th meeting (2009), outlined in the
„Report on the […] second Intersessional Meeting of the Working Group on GHG Emissions from Ships” (MEPC 59/4/2)
Coefficients / Factors(for ship-specific design elements, e.g. heat recovery systems)
6 - 7 May 2010Quality Matters! CCA Annual General Meeting, Berlin
Wild Ingenieurbüro GmbH
Dr.-Ing. Yves
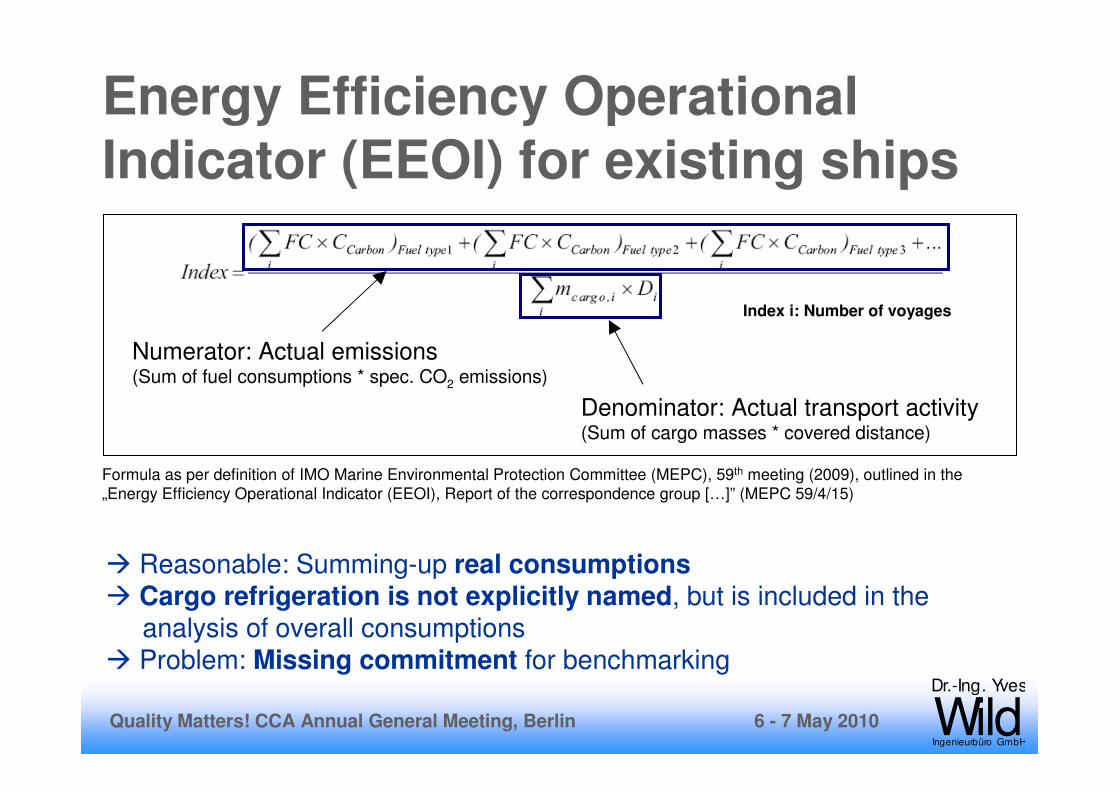
Energy Efficiency Operational Indicator (EEOI) for existing ships
� Reasonable: Summing-up real consumptions� Cargo refrigeration is not explicitly named, but is included in the
analysis of overall consumptions� Problem: Missing commitment for benchmarking
Denominator: Actual transport activity(Sum of cargo masses * covered distance)
Numerator: Actual emissions(Sum of fuel consumptions * spec. CO2 emissions)
Formula as per definition of IMO Marine Environmental Protection Committee (MEPC), 59th meeting (2009), outlined in the
„Energy Efficiency Operational Indicator (EEOI), Report of the correspondence group […]” (MEPC 59/4/15)
Index i: Number of voyages

6 - 7 May 2010Quality Matters! CCA Annual General Meeting, Berlin
Wild Ingenieurbüro GmbH
Dr.-Ing. Yves
IMO-Indices: Pros and Cons
� EEDI is not adequate for analysing actual CO2 emissions� EEOI calculation approach is reasonable, but won‘t be enforceable as a
common standard
- Confidential data: Reservations against
publication- Needs provision of big amounts of data and
execution of a complex analysis
- Not aplicable for existing ships, thus not adequate for Status Quo analysis
- Index is based on theoretical design data only- Optimizing efficiency by improving ship‘s
operation (e.g. actual speed) not considered- Cargo refrigeration not considered- Finds low acceptance at ship yards
Contras
+ Very meaningful, since it is based on an
analysis of empirical (actual) data
+ Considering all energy consumer on board(e.g. refrigeration system)
+ Influence of operational data is considered
+ Comparable
+ New ships can be classified
+ Incentive for designing measures to increase the
efficiency of energy+ Agreement on final formula definition is likely
Pros
EEOI (operation of existing ships)EEDI (based on design parameters)
6 - 7 May 2010Quality Matters! CCA Annual General Meeting, Berlin
Wild Ingenieurbüro GmbH
Dr.-Ing. Yves
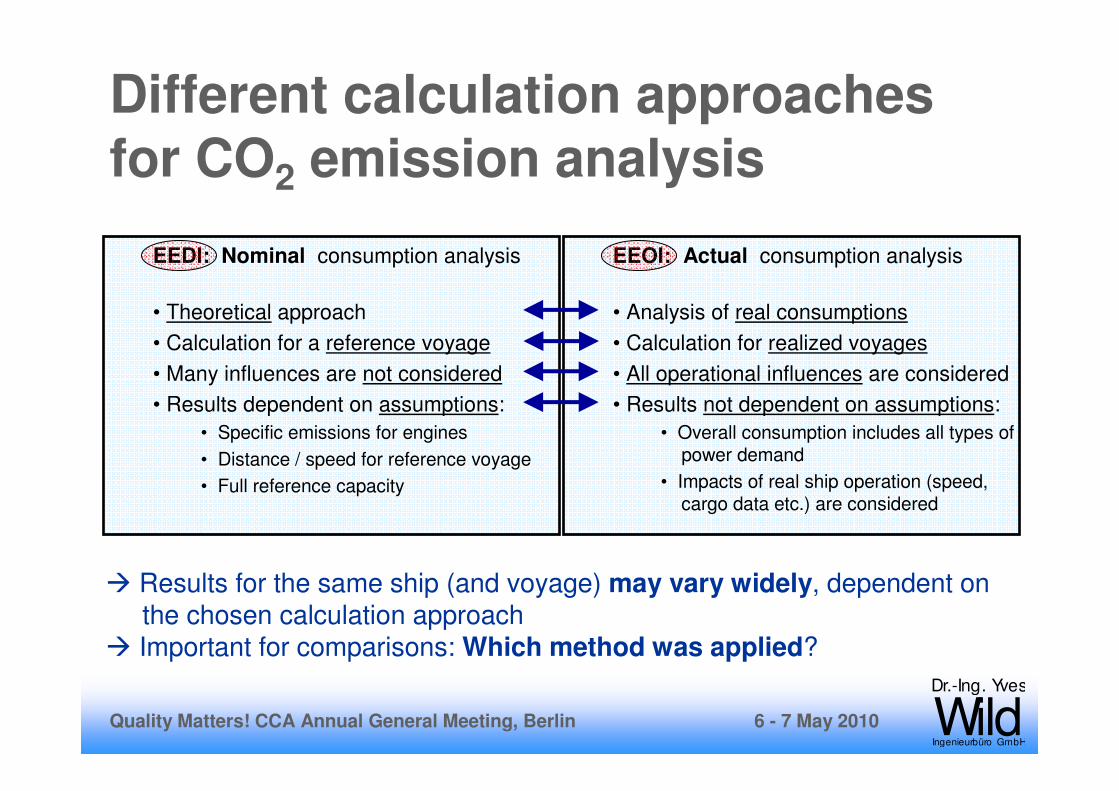
Different calculation approachesfor CO2 emission analysis
EEDI: Nominal consumption analysis
• Theoretical approach
• Calculation for a reference voyage
• Many influences are not considered
• Results dependent on assumptions:
• Specific emissions for engines
• Distance / speed for reference voyage
• Full reference capacity
EEOI: Actual consumption analysis
• Analysis of real consumptions
• Calculation for realized voyages
• All operational influences are considered
• Results not dependent on assumptions:
• Overall consumption includes all types ofpower demand
• Impacts of real ship operation (speed,cargo data etc.) are considered
� Results for the same ship (and voyage) may vary widely, dependent onthe chosen calculation approach
� Important for comparisons: Which method was applied?

6 - 7 May 2010Quality Matters! CCA Annual General Meeting, Berlin
Wild Ingenieurbüro GmbH
Dr.-Ing. Yves
Example: Calculation differences of IMO indices at a reefer ship study
EEDI: Nominal consumption analysis
• Assumption: Ship is always fully laden
(100% cargo capacity is used)
• No consideration of emissions during
nearly empty backhaul voyages
• No consideration of power demand
for refrigeration1)
• No consideration of emissions
during harbour times
• Consumption of engines is calculated
as per their reference/design operation
EEOI: Actual consumption analysis
• Northbound: Parts of cargo are loaded
in one of three loading ports only:
< 100% cargo capacity is used
• Southbound: Ships are mainly empty
but fuel consumption is registered
(<< 100% cargo capacity is used)
• Fuel consumption due to power demand
of refrigeration is included
• Emissions during harbour times are included
• Real consumption of engines (non-
optimal operation) is considered
� EEOI results may be up to 300-400% higher than EEDI figures
6 - 7 May 2010Quality Matters! CCA Annual General Meeting, Berlin
Wild Ingenieurbüro GmbH
Dr.-Ing. Yves
MethodologiesMethodologies of COof CO22
Emission Emission CalculationCalculation……

6 - 7 May 2010Quality Matters! CCA Annual General Meeting, Berlin
Wild Ingenieurbüro GmbH
Dr.-Ing. Yves
Main fuel consumers of transportShips:• Main engine propulsion (pure “transport”)
• Base Load, e.g.:– Navigation, On-board electronics– Provisions refrigeration machine, galley– Air conditioning– Crew‘s electrical power consumption
Aircrafts:• Turbines of Jet engine (pure “transport”)
• Base Load, e.g.:– Hydraulic and pneumatic systems– Navigation– Air conditioning– Other electrical power consumptions
� Consumption is varying dependent on ship / aircraft / truck size, speed,distance and cargo mass
Base Load mainly powered by separate auxiliary engines
Trucks:• Engine (pure “transport”)
• Base Load, e.g.:– On-board electronics– Air conditioning
Base Load directly powered by engine
Base Load powered by jet engine turbineor by separate auxiliary power unit (APU)

6 - 7 May 2010Quality Matters! CCA Annual General Meeting, Berlin
Wild Ingenieurbüro GmbH
Dr.-Ing. Yves
� Consumption is dependent on refrigeration system, type and totalmass of cargo as well as climatic conditions
Reefer ships:• Power consumption for refrigeration system
• Cooling water and refrigerant pumps
• Recirculation fans
• CA system (if any)
Container ships and trucks:• Power consumption of reefer containers includes refrigeration system + heat
removal (cargo hold ventilation, cooling water pumps etc.)
Aircrafts:• Cargo Refrigeration (if there is any) is powered by turbines
• Related fuel consumption is included in main kerosene consumption
Additional fuel consumers duringreefer cargo transportation

6 - 7 May 2010Quality Matters! CCA Annual General Meeting, Berlin
Wild Ingenieurbüro GmbH
Dr.-Ing. Yves
Nominal consumption – Assumtionstaken at a study for reefer ships
Assumptions:• Power demand of one reefer container: 6.6 kW / FEU
• Specific power demand of reefer cargo holds: 150 W / t cargo
• Distance for reference voyage: 5,000 nm
• Reference speed: 20 kn
• Consumption at different speeds calculated as per the „Third power law“
• Base Load: Estimated according to the ship size
Not considered:• Harbour times
• Cooling down of reefer cargo
• Unloaded voyages (backhaul); assumption: ships are always fully laden
� Many assumptions needed
� Some real circumstances cannot be considered in the calculation

6 - 7 May 2010Quality Matters! CCA Annual General Meeting, Berlin
Wild Ingenieurbüro GmbH
Dr.-Ing. Yves
Nominal consumption – Results of a study for reefer ships
� Average related CO2 emission is 62.1 g/tkm
� Based on many assumptions; many issues no considered all
16.50 g/tkm
17.00 g/tkm
17.50 g/tkm
18.00 g/tkm
18.50 g/tkm
19.00 g/tkm
19.50 g/tkm
20.00 g/tkm
20.50 g/tkm
21.00 g/tkm
21.50 g/tkm
Nominal specific fuel consumption for reefer cargotransport of examined ships at equal speed incl. backhaul
Ship
1
Ship
2
Ship
3
Ship
4
Ship
5
Ship
6
Ship
7

6 - 7 May 2010Quality Matters! CCA Annual General Meeting, Berlin
Wild Ingenieurbüro GmbH
Dr.-Ing. Yves
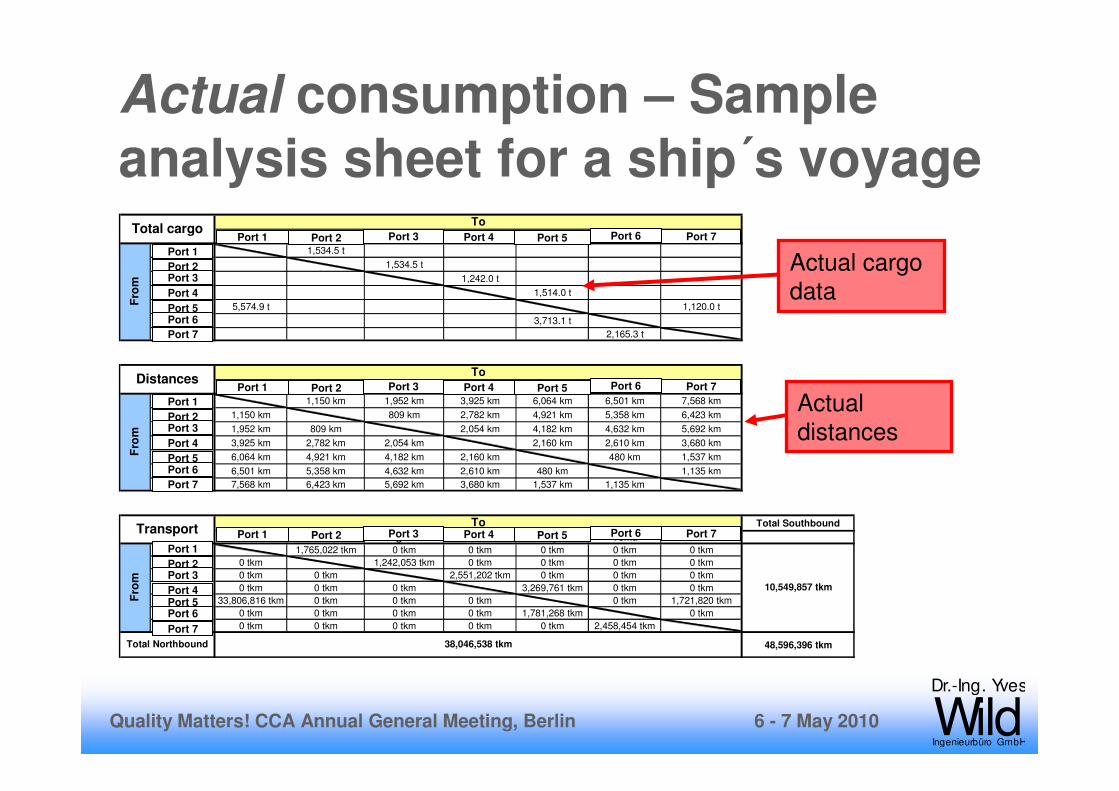
Actual consumption – Calculationbasics (same study for reefer ships)
Calculation details:• Analysis of empirical consumption data
• Actual consumptions, cargo loads and distances covered were taken
Considered issues:• Partly loaded voyages (backhaul)
• Cargo cooling down during transportation
• GHG emissions due to refrigerant leakages at ports
� Considering all energy consumption needed for cargo transport
� Considering all cargo which is transported
6 - 7 May 2010Quality Matters! CCA Annual General Meeting, Berlin
Wild Ingenieurbüro GmbH
Dr.-Ing. Yves
Vendres Gibraltar Agadir Dakar Abijan Tema Douala
Vendres 1,534.5 t
Gibraltar 1,534.5 t
Agadir 1,242.0 t
Dakar 1,514.0 t
Abijan 5,574.9 t 1,120.0 t
Tema 3,713.1 t
Douala 2,165.3 t
Vendres Gibraltar Agadir Dakar Abijan Tema Douala
Vendres 1,150 km 1,952 km 3,925 km 6,064 km 6,501 km 7,568 km
Gibraltar 1,150 km 809 km 2,782 km 4,921 km 5,358 km 6,423 km
Agadir 1,952 km 809 km 2,054 km 4,182 km 4,632 km 5,692 km
Dakar 3,925 km 2,782 km 2,054 km 2,160 km 2,610 km 3,680 km
Abijan 6,064 km 4,921 km 4,182 km 2,160 km 480 km 1,537 km
Tema 6,501 km 5,358 km 4,632 km 2,610 km 480 km 1,135 km
Douala 7,568 km 6,423 km 5,692 km 3,680 km 1,537 km 1,135 km
Total Southbound
Vendres Gibraltar Agadir Dakar Abijan Tema Douala
Vendres 1,765,022 tkm 0 tkm 0 tkm 0 tkm 0 tkm 0 tkm
Gibraltar 0 tkm 1,242,053 tkm 0 tkm 0 tkm 0 tkm 0 tkm
Agadir 0 tkm 0 tkm 2,551,202 tkm 0 tkm 0 tkm 0 tkm
Dakar 0 tkm 0 tkm 0 tkm 3,269,761 tkm 0 tkm 0 tkm
Abijan 33,806,816 tkm 0 tkm 0 tkm 0 tkm 0 tkm 1,721,820 tkm
Tema 0 tkm 0 tkm 0 tkm 0 tkm 1,781,268 tkm 0 tkm
Douala 0 tkm 0 tkm 0 tkm 0 tkm 0 tkm 2,458,454 tkm
48,596,396 tkm
DistancesTo
Fro
mF
rom
10,549,857 tkm
Transport
Fro
m
To
Total Northbound 38,046,538 tkm
Total cargoTo
Actual consumption – Sample analysis sheet for a ship´s voyage
Actual cargo
data
Actual
distances
Port 1 Port 2 Port 3 Port 4 Port 5 Port 6 Port 7
Port 1
Port 2Port 3
Port 4
Port 5Port 6
Port 7
Port 1 Port 2 Port 3 Port 4 Port 5 Port 6 Port 7
Port 1
Port 2Port 3
Port 4
Port 5Port 6
Port 7
Port 1 Port 2 Port 3 Port 4 Port 5 Port 6 Port 7
Port 1
Port 2Port 3
Port 4Port 5Port 6
Port 7

6 - 7 May 2010Quality Matters! CCA Annual General Meeting, Berlin
Wild Ingenieurbüro GmbH
Dr.-Ing. Yves
Lady Rosemary Atlantic Iris Colombian Star Costa Rican Star TOTAL / Average
6 9 1 10 26
Northbound 201,498,218 tkm 256,543,742 tkm 27,441,175 tkm 312,150,462 tkm 797,633,596 tkm
Southbound 51,746,137 tkm 15,669,621 tkm 1,292,002 tkm 23,810,404 tkm 92,518,163 tkm
Total 253,244,354 tkm 272,213,362 tkm 28,733,177 tkm 335,960,866 tkm 890,151,760 tkm
168.79 days 258.60 days 29.92 days 282.92 days 740.22 days
Low sulfur fuel (LSF) 0.00 t 0.00 t 0.00 t 0.00 t 0.00 t
Diesel Oil (DO) 21.11 t 70.68 t 3.10 t 23.60 t 118.49 t
Fuel Oil (FO) 4,915.81 t 6,299.91 t 706.05 t 7,703.18 t 19,624.95 t
Cylinder Oil ME (CO) 33.25 t 44.59 t 4.96 t 54.09 t 136.90 t
4,970.17 t 6,415.18 t 714.11 t 7,780.87 t 19,880.33 t
29.45 t/day 24.81 t/day 23.87 t/day 27.50 t/day 26.86 t/day
24.7 g/tkm 25.0 g/tkm 26.0 g/tkm 24.9 g/tkm 24.9 g/tkm
19.6 g/tkm 23.6 g/tkm 24.9 g/tkm 23.2 g/tkm 22.3 g/tkm
15,621.2 t 20,162.9 t 2,244.5 t 24,455.3 t 62,483.9 t
77.5 g/tkm 78.6 g/tkm 81.8 g/tkm 78.3 g/tkm 78.3 g/tkm
61.7 g/tkm 74.1 g/tkm 78.1 g/tkm 72.8 g/tkm 70.2 g/tkm
Fu
el
co
nsu
mp
tio
n
Vessel name
Total
No. of analyzed voyages
Specific Carbon emmission SB+NB
Specific fuel consumption NB only
Specific fuel consumption SB+NB
Total Carbon emission
Specific Carbon emission NB only
Tra
nsp
ort
Duration
Actual consumption – Results(same study for reefer ships)
Ship 1 Ship 2 Ship 3 Ship 4
� Average CO2 emission is 70.2 g/tkm
� Calculation based on analysis of real figures leads to different resultsthan calculation based on nominal approach
6 - 7 May 2010Quality Matters! CCA Annual General Meeting, Berlin
Wild Ingenieurbüro GmbH
Dr.-Ing. Yves
ComparisonComparison of Different of Different
TransportationTransportation ModesModes……

6 - 7 May 2010Quality Matters! CCA Annual General Meeting, Berlin
Wild Ingenieurbüro GmbH
Dr.-Ing. Yves
Fuel Consumption of Sea TransportTotal related fuel consumption for dry cargo at different ship
sizes (container ships and reefer ships)
0.00 g/tkm
1.00 g/tkm
2.00 g/tkm
3.00 g/tkm
4.00 g/tkm
5.00 g/tkm
6.00 g/tkm
7.00 g/tkm
8.00 g/tkm
9.00 g/tkm
0 tdw 10,000 tdw 20,000 tdw 30,000 tdw 40,000 tdw 50,000 tdw 60,000 tdw 70,000 tdw
Ship size
Fu
el co
nsu
mp
tio
n
Calculation basis:
• Empirical study about reefership data
• Consumption at design conditions (theoretical approach)
• No Consideration of refrigeration
� Fuel consumption ranges from 3-9 g/tkm� BUT: Calculation based on theoretical approach at design conditions� Analysis of real data has shown higher values� No consideration of refrigeration

6 - 7 May 2010Quality Matters! CCA Annual General Meeting, Berlin
Wild Ingenieurbüro GmbH
Dr.-Ing. Yves
Worldwide Air Transport
� Perishable products are mainly transported intercontinentally fromSouth to North
� Main routes are: Latin america to North america, North america to Asia/Pacific, Europe to Asia/Pacific
Estimated total air cargo of perishableproducts in 2005:
2 mio. t

6 - 7 May 2010Quality Matters! CCA Annual General Meeting, Berlin
Wild Ingenieurbüro GmbH
Dr.-Ing. Yves
Payload Speed Range Fuel mass Total massSpec. fuel
consumption
[t] [km/h] [km] [t] [t] [g/tkm]
Boeing B777 104 895 9.000 181 347 193,4
Boeing B747 120 5.200 83 384 133,0
Type
Fuel Consumption of Air Transport
� Fuel consumption ranges from 130-200 g/tkm� BUT: Calculation based on theoretical approach at design conditions� An analysis of real data might lead to higher values (?)� No consideration of refrigeration
Calculation basis:
• Consumption at design conditions (theoretical approach)
• No Consideration of refrigeration

6 - 7 May 2010Quality Matters! CCA Annual General Meeting, Berlin
Wild Ingenieurbüro GmbH
Dr.-Ing. Yves
CO2 NOx CHx Particles
[g/tkm] [mg/tkm] [mg/tkm] [mg/tkm]
EURO 1 72 673 59 21
EURO 2 69 746 39 10
EURO 3 71 542 38 12
EURO 4 69 343 44 2
Emission standard
Fuel Consumption of Road Transport (Trucks)
� CO2 consumption as per EURO norms ranges from 69-72 g/tkm� This corresponds to a fuel consumption of approx. 22-24 g/tkm� BUT: Calculation based on theoretical approach at design conditions� No consideration of refrigeration
Calculation basis:
• Consumption at design conditions (theoretical approach)
• No Consideration of refrigeration
6 - 7 May 2010Quality Matters! CCA Annual General Meeting, Berlin
Wild Ingenieurbüro GmbH
Dr.-Ing. Yves
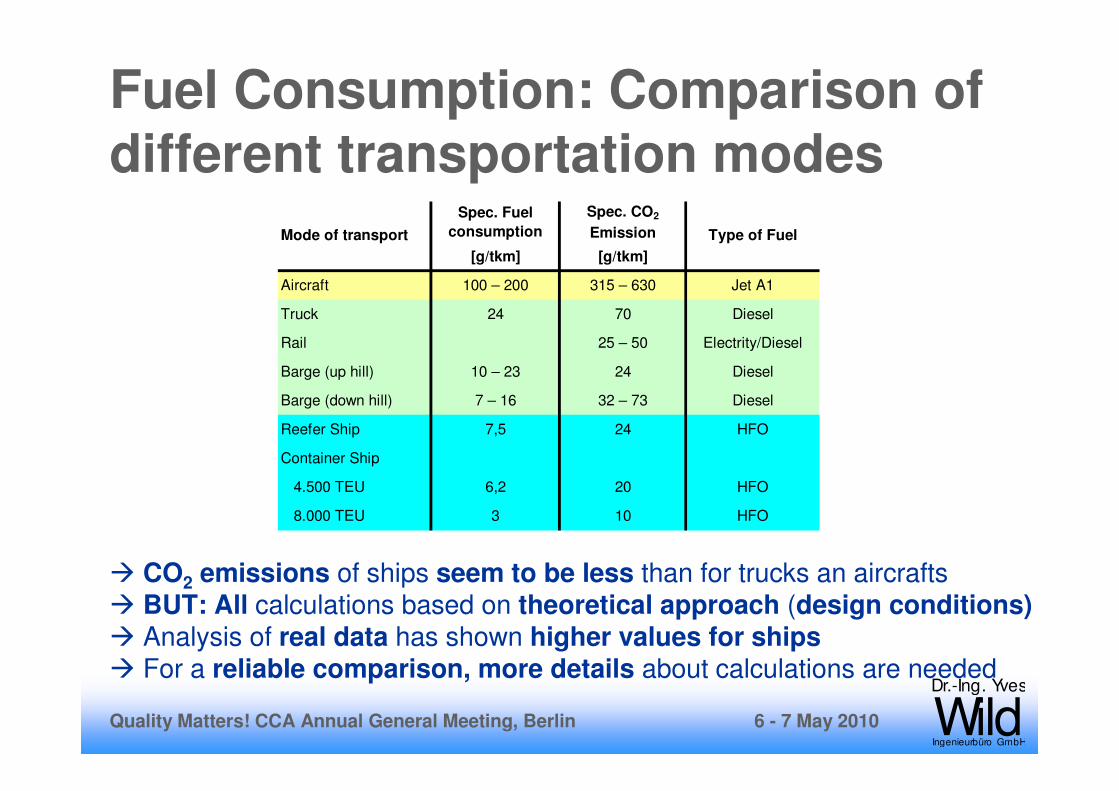
Spec. Fuel
consumption
Spec. CO2
Emission
[g/tkm] [g/tkm]
Aircraft 100 – 200 315 – 630 Jet A1
Truck 24 70 Diesel
Rail 25 – 50 Electrity/Diesel
Barge (up hill) 10 – 23 24 Diesel
Barge (down hill) 7 – 16 32 – 73 Diesel
Reefer Ship 7,5 24 HFO
Container Ship
4.500 TEU 6,2 20 HFO
8.000 TEU 3 10 HFO
Mode of transport Type of Fuel
Fuel Consumption: Comparison of different transportation modes
� CO2 emissions of ships seem to be less than for trucks an aircrafts� BUT: All calculations based on theoretical approach (design conditions)� Analysis of real data has shown higher values for ships� For a reliable comparison, more details about calculations are needed

6 - 7 May 2010Quality Matters! CCA Annual General Meeting, Berlin
Wild Ingenieurbüro GmbH
Dr.-Ing. Yves
Reefer Cargo Transport (Air): FuelConsumption / Distance Relation
Deadweight: 148,2 t
Max. Payload: 103,9 t
Max. fuel mass (start): 145,0 t
Max. total mass: 347,5 t
Speed: 862 km/h
Maximum range: 9.750 km
Boeing 777-F technical data
Sourc
e for
aircra
ft d
ata
:
http://w
ww
.flie
gerw
eb.c
om
/airlin
er/
flug
zeuge/lexik
on.p
hp?show
=le
xik
on-5
52
Range PayloadFuel mass
(start)
Specific fuel
consumption
Spec. CO2
emission9.750 km 54,2 t 145,0 t 274 g/tkm 854 g/tkm
9.500 km 57,7 t 141,6 t 258 g/tkm 804 g/tkm
9.250 km 61,2 t 138,1 t 244 g/tkm 760 g/tkm
9.000 km 64,6 t 134,6 t 231 g/tkm 721 g/tkm
8.750 km 68,1 t 131,2 t 220 g/tkm 685 g/tkm
8.500 km 71,6 t 127,7 t 210 g/tkm 654 g/tkm
8.250 km 75,0 t 124,3 t 201 g/tkm 625 g/tkm
8.000 km 78,5 t 120,8 t 192 g/tkm 599 g/tkm
7.750 km 81,9 t 117,3 t 185 g/tkm 575 g/tkm
7.500 km 85,4 t 113,9 t 178 g/tkm 553 g/tkm
7.250 km 88,9 t 110,4 t 171 g/tkm 533 g/tkm
7.000 km 92,3 t 106,9 t 165 g/tkm 515 g/tkm
6.750 km 95,8 t 103,5 t 160 g/tkm 498 g/tkm
6.500 km 99,3 t 100,0 t 155 g/tkm 483 g/tkm
6.250 km 102,7 t 96,6 t 150 g/tkm 468 g/tkm
6.165 km 103,9 t 95,4 t 149 g/tkm 464 g/tkm
13,85 kg/kmFuel consumption:
Ra
ng
e m
ax
ima
tio
n
Sp
ec
ific
em
iss
ion
min
imio
za
tio
n
Assumptions:
• 10 t fuel remaining (reserve) at landing
• Average fuel consumption (kg/km) is constant
• CO2 emission kerosene combustion: 3.113 kg CO2/kg

6 - 7 May 2010Quality Matters! CCA Annual General Meeting, Berlin
Wild Ingenieurbüro GmbH
Dr.-Ing. Yves
400 g/tkm
450 g/tkm
500 g/tkm
550 g/tkm
600 g/tkm
650 g/tkm
700 g/tkm
750 g/tkm
800 g/tkm
850 g/tkm
900 g/tkm
6.000 km 6.500 km 7.000 km 7.500 km 8.000 km 8.500 km 9.000 km 9.500 km 10.000 km
Range
Sp
ecif
ic c
arb
on
em
iss
ion
Reefer Cargo Transport (Air): FuelConsumption / Distance Relation
Boeing 777-F
� The higher the range of an aircraft, the higher are the specific CO2
emissions for the cargo transportation
6 - 7 May 2010Quality Matters! CCA Annual General Meeting, Berlin
Wild Ingenieurbüro GmbH
Dr.-Ing. Yves
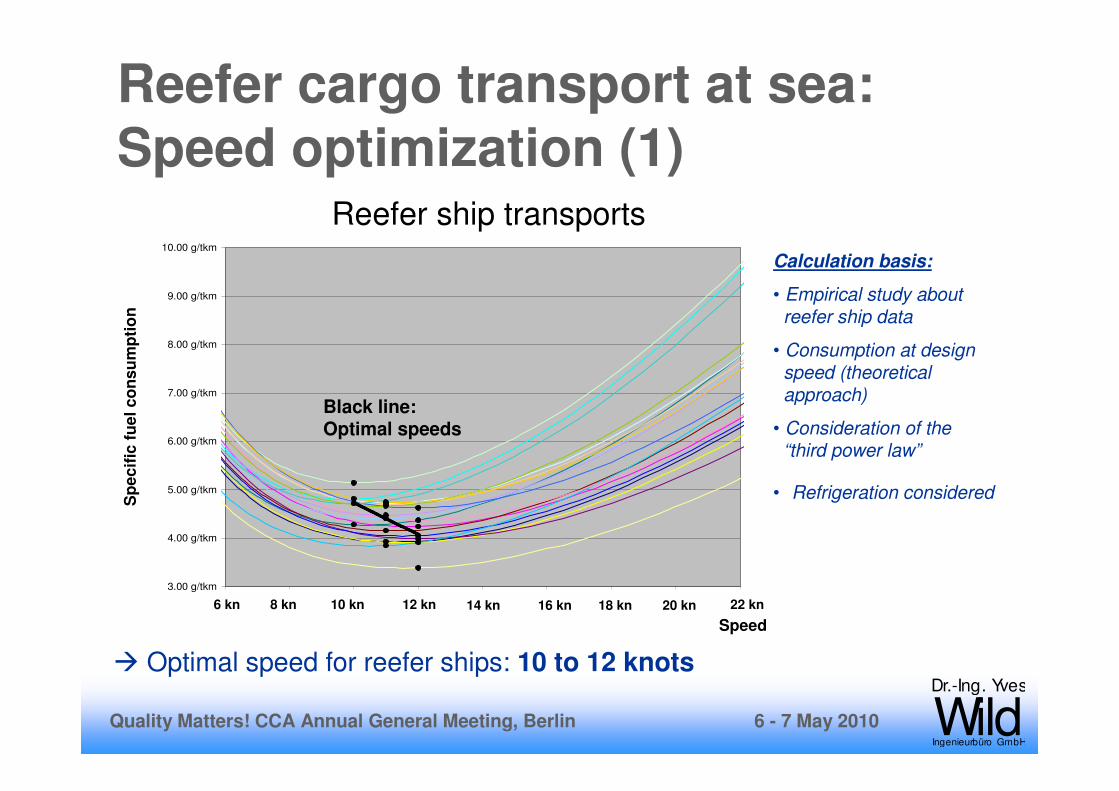
Reefer cargo transport at sea: Speed optimization (1)
Reefer ship transports
3.00 g/tkm
4.00 g/tkm
5.00 g/tkm
6.00 g/tkm
7.00 g/tkm
8.00 g/tkm
9.00 g/tkm
10.00 g/tkm
� Optimal speed for reefer ships: 10 to 12 knots
Black line: Optimal speeds
Sp
ec
ific
fue
lc
on
su
mp
tio
n
6 kn 10 kn8 kn 12 kn 14 kn 16 kn 18 kn 20 kn 22 kn
Speed
Calculation basis:
• Empirical study about reefer ship data
• Consumption at design speed (theoretical approach)
• Consideration of the “third power law”
• Refrigeration considered
6 - 7 May 2010Quality Matters! CCA Annual General Meeting, Berlin
Wild Ingenieurbüro GmbH
Dr.-Ing. Yves
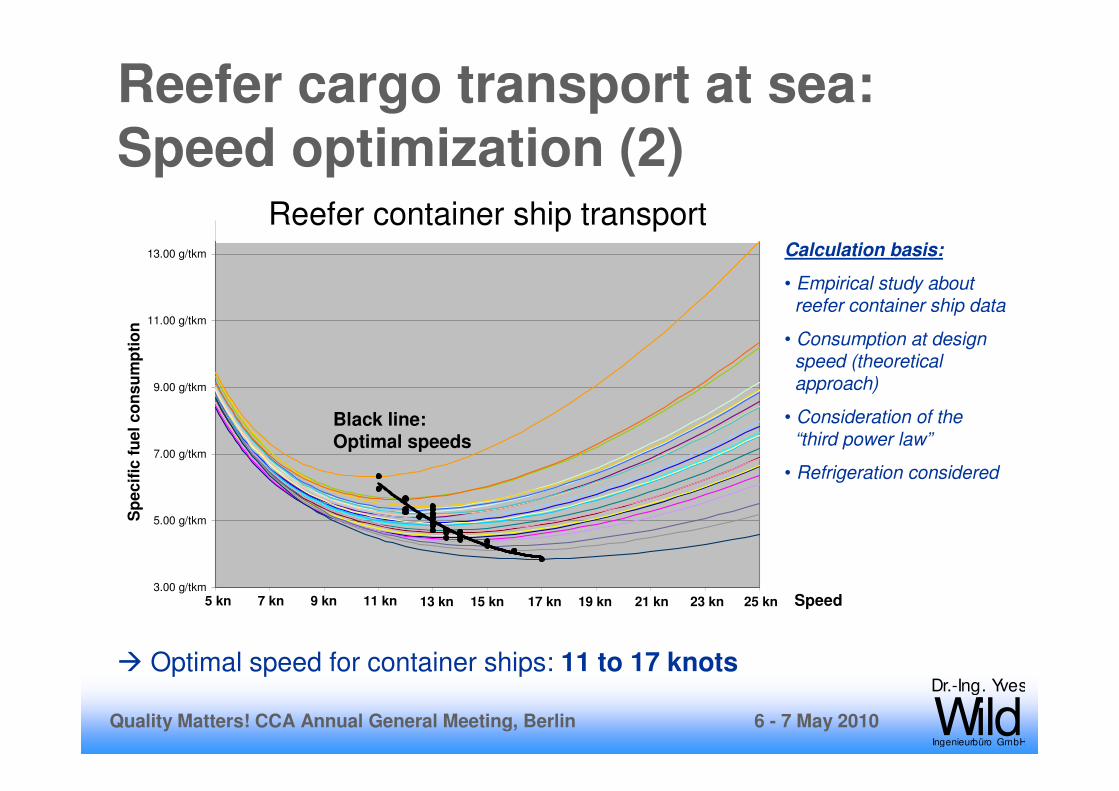
Reefer container ship transport
� Optimal speed for container ships: 11 to 17 knots
3.00 g/tkm
5.00 g/tkm
7.00 g/tkm
9.00 g/tkm
11.00 g/tkm
13.00 g/tkm
Reefer cargo transport at sea: Speed optimization (2)
Sp
ec
ific
fue
lc
on
su
mp
tio
n
Black line: Optimal speeds
5 kn 9 kn7 kn 11 kn 13 kn 15 kn 17 kn 19 kn 21 kn 23 kn 25 kn Speed
Calculation basis:
• Empirical study about reefer container ship data
• Consumption at design speed (theoretical approach)
• Consideration of the “third power law”
• Refrigeration considered
6 - 7 May 2010Quality Matters! CCA Annual General Meeting, Berlin
Wild Ingenieurbüro GmbH
Dr.-Ing. Yves
SummarySummary......

6 - 7 May 2010Quality Matters! CCA Annual General Meeting, Berlin
Wild Ingenieurbüro GmbH
Dr.-Ing. Yves
Key Conclusions (1)1. Design indices
� are not adequate for an analysis of actual CO2 emissions
� base on many assumptions
2. Indices based on real operational data
� lead to more reasonable results, but
� there might be missing commitment for benchmarking
3. Emissions caused by cargo refrigeration generally consist of two parts:
� A pure transport related part (Main engines / turbines)
� A refrigeration related part
4. Results given for specific carbon emissions may vary widely, dependent on
� The chosen calculation approach
� Taken assumptions and boundary settings
5. Carbon emission calculation depends on many conditions, e.g.
� Calculation methodology (nominal approach or Analysis or actual data)
� Ship / aircraft / truck size and Speed
� Type and mass of cargo
� Distance and Trade route (e.g. climate conditions)
6. CO2 emissions of ships seem to be less than for trucks an aircrafts.
7. Optimization potentials for minimized fuel consumption / carbon emission:
� Optimal speeds: 10-12 kn (reefer ships) and 11-17 kn (container ships)
� The higher the range of an aircraft, the higher are the specific carbon emissions

6 - 7 May 2010Quality Matters! CCA Annual General Meeting, Berlin
Wild Ingenieurbüro GmbH
Dr.-Ing. Yves
Key Conclusions (2)
Pure results of carbon footprint studies are nearly worthless without looking into the underlying calculation methodologies!

6 - 7 May 2010Quality Matters! CCA Annual General Meeting, Berlin
Wild Ingenieurbüro GmbH
Dr.-Ing. Yves
for further information:
www.DrWild.de
Related Documents