Carbon fixation and productivity index in relation to chlorophyll and light in the equatorial Atlantic Ocean Aubert LE BOUTEILLER (1) and Alain HERBLAND (1) AiXTRACT During a 14 day siudy af a fixed position ut the Equator (40 W) in .E’ebruary, 1979 (SOP cruise), concentrations of chlorophyll a measured in samples taken between 25 and 50 m depfh showed marked changes from day io day. Similarly, the amounts of carbon fixed during in situ incubations also varied. Hence, highly significant regression lines cari be calculated between production and chlorophyll for each sampling depth. These equations make ii possible to calculate easily fhe primary production from the sole chlorophyll data, provided that ihe available light intensifies are of ihe same order of magnitude. They are used to predict the production for 17 stations carried out during three other cruises ut Ihe same place (0 Q, 40 W): CIPREA 2 (3 sfations, Apr., 1979), CIPREA 4 (13 sfations, Oct., 1979) and CIPRER 5 (1 station, Jan., 1980). 72 values of production are SO calculated: they are net slaiisfically different from Ihe measured values of in situ carbon fmation. Lf the profile of chlorophyll is mainly regulated by Ihe nitrate availability, in contrast the nitrale concentralion has no direct effect upon fhe patlern of ihe vertical profile of the productivity index (mg C.mg Chla-l.h-‘) which presenis always a maximum between 5 and 15 m, and decreases regularly downwards. Consequenlly for an incident radiaiion close to the average, the verlical distribution of produclion, and in pariicular the depih of production maximum, are entirely defined by the chlorophyll profile. The productiviiy index varies approximately twofold ut a given value of available radialion. Our observalions support the hypothesis that these variations would be relaied to the concentration of chlorophyll. The mean ce11size would also vary as a function of the chlorophyll content: in a chlorophyll poor water, cells would be very small and the productivity index is then ver!! high. A good adaptation to the envlronment, added to a specially high phoiosynthetic efficiency, characterize 2he natural assemblages of phytoplankforl in the deep-sea tropical Atlantic Ocean. Effertively, a single relalionship between productivity index and depth or available light allows to describe the primary produciion of the four cruises, even when two opposite sifuations are compared : the mixed layer is niirale depleted in one case, noi in ihe other, due to the input of nutrient rich waters by the equatorial divergence. KEY WORD~ : Prirnary production - Chlorophyll - Light - Equatorial ht.lantic Oman. FIXATION DE CARBONE ET INDICE DE FRODUCTIVITI? EN FONCTION DE: LA CHLOROPHYLLE ET DE LA ~urn~tim DANS L'ATLANTIQUE ÉQuAT~RIAI. Lors d’une étude de 14~jours en position fixe a l’Equateur (40 ni) en février 1979 (Campagne SOI~), les concen- trations de chlorophylle a mesurees dans les échantillons prélevés enfre 25 et 50 m de profondeur ont présenté des changements importants d’un jour à l’autre. De même, les quantifés de carbone fixé pendant les incubations in situ ont varié également, de sorte que des droites de régression hautemenl significatives peuvent être calculées entre production et chlorophylle pour chaque profondeur d’tichantillonnaye. (1) O.R.S.T.O.M., B.P. 158f, IJalrar, Sénigal. Océanogr. hop. 19 (2): 161-179 (1984).

Welcome message from author
This document is posted to help you gain knowledge. Please leave a comment to let me know what you think about it! Share it to your friends and learn new things together.
Transcript

Carbon fixation and productivity index
in relation to chlorophyll and light
in the equatorial Atlantic Ocean
Aubert LE BOUTEILLER (1) and Alain HERBLAND (1)
AiXTRACT
During a 14 day siudy af a fixed position ut the Equator (40 W) in .E’ebruary, 1979 (SOP cruise), concentrations of chlorophyll a measured in samples taken between 25 and 50 m depfh showed marked changes from day io day. Similarly, the amounts of carbon fixed during in situ incubations also varied. Hence, highly significant regression lines cari be calculated between production and chlorophyll for each sampling depth.
These equations make ii possible to calculate easily fhe primary production from the sole chlorophyll data, provided that ihe available light intensifies are of ihe same order of magnitude. They are used to predict the production for 17 stations carried out during three other cruises ut Ihe same place (0 Q, 40 W): CIPREA 2 (3 sfations, Apr., 1979), CIPREA 4 (13 sfations, Oct., 1979) and CIPRER 5 (1 station, Jan., 1980). 72 values of production are SO calculated: they are net slaiisfically different from Ihe measured values of in situ carbon fmation.
Lf the profile of chlorophyll is mainly regulated by Ihe nitrate availability, in contrast the nitrale concentralion has no direct effect upon fhe patlern of ihe vertical profile of the productivity index (mg C.mg Chla-l.h-‘) which presenis always a maximum between 5 and 15 m, and decreases regularly downwards. Consequenlly for an incident radiaiion close to the average, the verlical distribution of produclion, and in pariicular the depih of production maximum, are entirely defined by the chlorophyll profile.
The productiviiy index varies approximately twofold ut a given value of available radialion. Our observalions support the hypothesis that these variations would be relaied to the concentration of chlorophyll. The mean ce11 size would also vary as a function of the chlorophyll content: in a chlorophyll poor water, cells would be very small and the productivity index is then ver!! high.
A good adaptation to the envlronment, added to a specially high phoiosynthetic efficiency, characterize 2he natural assemblages of phytoplankforl in the deep-sea tropical Atlantic Ocean. Effertively, a single relalionship between productivity index and depth or available light allows to describe the primary produciion of the four cruises, even when two opposite sifuations are compared : the mixed layer is niirale depleted in one case, noi in ihe other, due to the input of nutrient rich waters by the equatorial divergence.
KEY WORD~ : Prirnary production - Chlorophyll - Light - Equatorial ht.lantic Oman.
FIXATION DE CARBONE ET INDICE DE FRODUCTIVITI? EN FONCTION DE: LA CHLOROPHYLLE ET DE LA ~urn~tim DANS L'ATLANTIQUE ÉQuAT~RIAI.
Lors d’une étude de 14~jours en position fixe a l’Equateur (40 ni) en février 1979 (Campagne SOI~), les concen- trations de chlorophylle a mesurees dans les échantillons prélevés enfre 25 et 50 m de profondeur ont présenté des changements importants d’un jour à l’autre. De même, les quantifés de carbone fixé pendant les incubations in situ ont varié également, de sorte que des droites de régression hautemenl significatives peuvent être calculées entre
production et chlorophylle pour chaque profondeur d’tichantillonnaye.
(1) O.R.S.T.O.M., B.P. 158f, IJalrar, Sénigal.
Océanogr. hop. 19 (2): 161-179 (1984).

162 A. LE ROUTEILLER, A. HERBLAND
Ces équations permettent de calculer aisément la produciion primaire à partir des seules données de chlorophylle, dans la mesure où les quanlités de lumière disponible sont du même ordre de grandeur. Elles sont utilisées pout prévoir la production de 17 stations réalisées lors de frois autres campagnes au même endroit (OO; 40 W) : CIPREA 2 (3 stations, avr. 1979), CIPREA 4 (13 stations, oct. 1979) et CIPREA 5 (1 station, jan. 1980). 72 valeurs de production sont ainsi calculées : elles ne sont pus statistiquement différenfes des quantités de carbone fixé mesurées in situ.
Si le profil de chlorophylle est principalement contrôlé par la disponibilité en nitrate, en revanche la concentration de nitrate dans l’eau n’a aucun effet direct sur la forme du profil vertical de l’indice de productivité (mg C.mg Chla-l.h-l) qui présente toujours un maximum entre 5 et 15 m, et décroît régulièrement vers le bas. En conséquence, pour une radiation incidente proche de la moyenne, la distribution verticale de la produciion, et en particulier la profondeur du maximum de production, sonf entièrement définis par le profil de chlorophylle.
L’indice de produciivité varie approximativement du simple au double pour une valeur donnée de lumit?re disponible. Nos observations supportent l’hypothèse que ces variations seraient reliées à la concenlration de chloro- phylle. La taille moyenne des cellules varierait également en fonction du contenu chlorophyllien : dans une eau pauvre en chlorophylle, les cellules seraient en moyenne très peiifes et l’indice de produciivité est alors très élevé.
Une bonne adaptation au milieu, ajoutée à une efficacité photosynthétique particulièrement élevée, sont caracté- ristiques des peuplements phytoplanctoniques de l’océan Atlantique tropical du large. En effet, une seule relation entre indice de productivité et profondeur ou lumière disponible est sufisante pour décrire la production primaire des quatre campagnes, même lorsque deux situations opposées sont comparées: la couche homogène est épuisée en nitrate dans un cas, et pas dans l’autre, grâce à l’apport d’eaux riches en sels nutritifs par la divergence équatoriaie.
MOTS-CLÉS : Production primaire - Chlorophylle - Lumière - Océan Atlantique équatorial.
INTRODUCTION
In every ecological study of primary production in the sea, the major factor to be considered is the phytoplankton biomass. Production is of course proportional to the biomass if variations of the latter are only quantitative, and not qualitative. One measurement of production for one given biomass would be theorically suffrcient for knowing the production for any other biomass of the same nature in the same environmental conditions.
As a matter of fact, reality is much more complex, particularly because of the numerous possible physiological changes of the plankton, and because of imperfect production and biomass measurements. The two classical methods are indeed remarkably sentitive and precise (chlorophyll a by fluorimetry on acetone extracts, 14C method with liquid scintillation counting), but, their actual significance is still poorly known (GIESKES et al., 1978, LORENZEN and JEFFREY, 1980, JEFFREY and HALLEGRAEFF, 1980, for chlorophyll, EPPLEY, 1980, and the PETERSON'S revue, 1980, for the 14C method).
Phytoplankton chlorophyll a represents only about 1 o/. of the ce11 dry weight (SHUTER, 1979) and the chlorophyll ce11 content is known to change with species, their physiological state, the measure- ment time (SOURNIA, 1974; OWENS et al., 1980; HITCHCOCK, 1980; HUNTER and LAWS, 1981) and the light level or depth (ANDERSON, 1969; EPPLEY et al., 1973; BANNISTER and LAWS, 1980).
Then, if the significance of the chlorophyll as a biomass index is SO variable, the production by
Oeèanogr. trop. 19 [2): 161-179 (1984).
chlorophyll unit is expected to change in a wide range when the environmental factors fluctuate. Effectively, from in situ measurements in the eastern equatorial Pacifie, the Sargasso sea and the Mauritanian upwelling area, M.OREL (1978) reported that, from one station to another, the production by chlorophyll unit varied approximately in a ratio lO/l at a given value of available light. How- ever, in many cases, a certain correlation is never- theless found in plankton between the light saturated rate of photosynthesis and the concentration of chlorophyll (STEELE and BAIRD, 1961; STEEMANN NIELSEN and HANSEN, 1961), or between the daily gross production and the euphotic zone content of chlorophyll (LEMOALLE, 1981). Necessarily, the environmental conditions must be similar (STEEMANN NIELSEN and JORGENSEN, 1962):
In order to get a good description of the primary production in a given area and above a11 an accurate estimate of this production, it is of prime importance to establish such relationships between carbon fixation and concentration of chlorophyll. This means that the collected set of data is then coherent and homogeneous enough to be considered as representative of a single plankton community for certain conditions of environment. ‘It is then possible to study the problem of the actual significance of the biomass and production index on a statistically satisfying basis. In addition, measurements of chlorophyll concentration and available light allow a simple calculation of the carbon production (RYTHER and YENTSCH, 1957). PLATT et al. (1977) have shown that pigment concentration and light

comprise the minimum data set which cari be used for the prediction of primary production. TO achieve this, a great number of measurements are needed.
The main difficulty is data collection: a complete day is necessary to get a single value of primary production at a given place. Approximately 12 days are required to calculate a significant. mean, provided that the environmental properties did not vary excessively during sampling.
The distinguishing feature of the present work lies on the data used: 31 stations of in situ primary production, a11 of them carried out with the sarne methodology at the same position in the Equatorial Atlantic Ocean during four different cruises of the RV “Capricorne” in 1979.
METHODS
Four studies at a fixed position at the Equator (40 W) were performed with t,he RV “Capricorne”:
- 14 days (from 5 to 18 Feb., 1979) during SOP cruise which formed a part of t,he First G.A.R.P. Global Exp”riment (F.G.G.E.).
- 3 days (from 22 to 24 Apr., 1979) during CIPREA 2 cruise.
- 13 days (from 20 Oct. to 1 Nov., 1979) during CIPREA 4 cruise.
- 1 day (18 Jan., 1980) during CIPREA 5 cruise.
Water sampling for measurements of nutrients, chlorophyll, particulate matter and prirnary pro- duction was performed at 8 levels, before sunrise, using a 30 1 Niskin PVC bottle.
Nutrients (NO-,, NO-2, NH+,, PO--,) were irnme- diately analyzed with a Technicon Autoanalyzer (STRICKLAND and PAMONS, 1972). For chlorophyll a measurement, each 180 ml sample was irnmediat~ely filtered through a Whatman GF/C filter, ground and extracted in 90 o/. acetone for at least 2 h in a refrigerator. Samples were then analyzed on a fluorometer TURXER mode1 111 (YENTSCH ami NENZEL, 1963) calibrated with pure chlorophyll a (Sigma) by spect,rophotometric measurement.
Particulate matter was collected hy llltration of 2 1 samples through Gelman Type A filters. For carbon and nitrogen, a C H N anaIyzer (Hewlett Packard) was used, and the method of MENZEL and CORWIN (1965) was applied for phosphorus assess- ment. Seawater for production measurement (r4C method: STEEMANN NIELSEN, 1952) was filtered through a 200 E”m mesh net, poured in 300 ml bottles previously sterilized, and inc.ubated in situ from sunrise to sunset (mean duration: Il 11). The radioactivity inlroduced (from 5 10 10 pCi per flask) was counted by liquid scintillation technique
Océcmoqr. hop. 19 (2): 161-179 [19Sd).
according to recommandations of HERBLAND (1977). After incubation, samples were collected on Sartorius fllters, rinsed with filtered seawater and dried at 60 OC. At each station, two samples were flltered just after addition of 14C02. Their radioactivity was substracted from that of the samples.
The downwelling quantum irradiante was measured every day at about 13 h 00 (U.T.) with a Lambda quantameter. Data are given in percent of available light having passed through the sea surface (JITTS et al., 1976). Total incident radiation was recorded from a pyranometer (KIPP and ZONEN). Light received by samples during incubation (PAR: Photo- synthetically Available Radiation} was computed according to JITTS et al. (1976).
RESULTS AND DISCUSSION
Relationship between production ml chlorophyll
During the ILL-day study of the SOP cruise, the vertical distribution of physical and chemical properties has shown important variations in the euphotic zone, due to the south-north fluctuation of the equatorial current system (HERBLAND and LE: BOUTEILLER, 1982). SO, depth of thermocline and nitracline varied from about 25 t,o 40 meters (Fig. 1). Presently abundance and distribution of phytoplankton are known to be strongly related to hydrological and c,hemical structure in that region (HERBLA~D and VOITURIEZ, 1979). As a matter of fact, vertical profiles of chlorophyll and carbon luxation effectively changed much from day to day, SO that a wide range of values were obtained at aeveral depths. Because of the relatively small variations of PAR received by the samples at each incubation level during t,he same time (Table 1), pairs of chlorophyll and carbon fixation dat,a cari be gathered for eac.h sampling depth (Fig. 2). Then the rzlationship between these two variables cari be studied by depth for only small ranges of iight. From 25 to 50 meters, computation of the least square linear regressions (Table II) shows that the relation between amount of fixed carbon and concentration of chlorophyll measured at the beginning of the incubation, is very good: coefficients of correlat.ion range between 0.92 and 0.97 for the best described levels, ie those with numerous data and a wide range of chlorophyll concentrations. Station 12 data are not used in computation: the corresponding points evidently do not belong to the regression lines (Fig. 2, c, d, e), which cari be inter- preted as due to light detlciency (Table T). Above 25 m depth, a11 samples belonged to the nitrate depleted mixed layer, and below 50 III, only some data are available.

164 A. LE BOUTEILLER, A. HERBLAND
O- Depth
60- CIPREA 2 SOP.Feb.1979 Apr.1979 CIPREA 4 - Oct.1979 Jan.,980
I I II, 1, I I 1 , , 1 I 1 2 3 4 5 6 7 8 9 19 II 12 13 14 134 TP !38. ““““““’ , 2 3 4 6 6 7 8 9 10 II 12 13 :
FIG. 1. - Depths of the chlorophyll maximum and of the top of the nitracline, for 31 stations at (00; 4O W). Open circle: iower level. where NO, < 0.05 mM.m-3. Filled circle: uppcr level where NO, > 0.05 mM.m 3. Cross: depth of the maximum of Chlorophyll a
Profondeurs du maximum de chlorophylle et du sommet de la nitracline pour les 31 stations à (0 0, 4O W). Point clair : niveau inférieur où NO, i 0.05 mM.m-a. Point sombre : niveau supérieur où NO, > 0.05 mM.m+. Croix : profondeur du maximum de chlorophylle a.
TABLE 1
PAH (Mean value of the photosynthetically available radiation, 1022q.m-z.h-1) received by each sample during in sifu incubation. SOP cruise
PAR (Valeur moyenne du rayonnement disponible pour Ca photosynthèse, 10a2q.m-2.kl) reçu par chaque échanfillon au cours de l’incuba- tion in situ. Campagne SOP
-1 Station numbcr Depth- --
Cm) 1 12 -
--
-
5 -
.-
-
-
. -
-
-
_-
-
-
--
-
13
-
_-
-
-
.-
-
--
-
-
. -
-
-
--
-
3 4 6 7 9 10 11 14 2 8
172.3
44.8 35.9
28.4 22.4 14.9 9.3 6.6
24.4 15.1
7.9
3.9
3.4
2.0 1.3
161.5
61.5
42.3 32.3 22.3 12.3
7.4 4.9
0 . . . . . 189.8 5.....
10.. . . . 61.9 15.. . . 20..... 2.1 25..... 30..... 25.3 35..... 21.1 40..... 16.8 45..... 50..... 7.7 55..... 60..... 70.....
255.6
97.4
67.0
34.1 11.5
5.0
96.8 67.0 49.1 38.7 31.3 23.8 14.9 8.3
115.7
57.8 46.3 34.7 29.7 16.5 9.6
106.1 65.8 50.9 40.3 31.8 20.2 11.5 5.9
90.6
52.8
34.7 26.4 17.4 10.0
6.0 4.2
92.0
46.0
27.6 22.6 12.7 11.0 8.1
2.1
8.1
4.7
2.4 1.7 1.1 0.6 0.3 0.1
S1.6 102.0
45.0 52.0
27.8
18.0 14.0
6.7 3.4
32.5 26.0 21.3 13.5 10.8 8.3
17.1
12.8
10.5 8.7 7.0 4.9 2.4
1.5
The least square regression (mode1 1) provides a The slopes of regression lines decrease from 25 to predictive model, whereas the geometric mean 50 m depth, excepted at 45 m with only 5 data method (mode1 II) would be theorically more (Fig. 2, f, Table II). Nevertheless, not a11 slopes are suitable to describe observations in the case of significantly different from each other (Table III), interdependant variables (LAWS and ARCH~E, 1981). whereas the relative radiation at each depth on one Nevertheless, since a11 correlation coefficients calcul- hand, amounts of light effectively received by ated in the present work are particularly high, the samples on the other hand, decrease regularly from two types of linear regression equations do not 25 to 50 m and are statistically different from one differ very much. This is why only the least square sampling depth to another (Table TV). The y-inter- regression Will be used below. cepts are positive (45 m excepted) but are statisti-
Océanogr. trop. 19 (2): 161-179 (1984).

TAI3I.E 11
Regression lines equalions computcd bctween carbon fixation (mg.m-3.h-1) and chlorophyll a (mg.m-8) for the SDP cruise (stat. 12 excepted). Number OC data (nj, slope (a), y-intercept
(b), coeLlicient of correlation (r) and level of significancc [pi
T?quations des droites de régression calculées enire ficalion de cnrbone (mg.m-3.h-1) et chtorophytte a (mg.m3) pour la cam- pagne SOP (sauf staf. 12). Nombre de données (n), penfe (a), ordonnée à l’origine [b), coe//tcient de corrfilation (r) ef son degrE
de signification (p)
TABLE 1V
Tests Cor answcring t.hc following questions: is the light (cx- prcssed in percentage of surface irradiancr, and in ï%?j at depth z1 significantly different. from light at zZ7 SDP cruisc
dala. XANN-WHITNEY U test at levcl of significance 1 %
Tests destin& à répondre aux quesiions suivantes: In lumitke (ex- primée en pourcentage de radiation incidente et en PAR) à ta profondeur z1 &-elle signipcntivemenf dif-férente de ta lumière en r,? Données dc lu campagne SOP. Test 11 de MANN-WIIITNEY
nu risque 1 y0
TABLE II 1
Regression lincs of Figure 2. Tests for answering Lhe following questions: is the y-intcrccpt (h) signifkantly differcnt from zero? 1s the slope (a) OC thc rcarcssion line for zl, dcplh differcnt. from thc slope for zZ. 9 (Tests from DAGNISLIE, 1969, for lcvcl of
significancc 5 OA)
Droites de régression de lu Figure 2. Te.& desfinés 6 répondre uuz questions suivantes: t’ordonnée à t’origine (b) es&elle signi/ka- tiuemenf difîérenfe de zéro? La penie de la droite pour le niveau z, est-elle di@Yenfe de celle pour le niveau z2? (Te~ls d’nprks
DAwe~rr5, 1969, nu risque 5 %)
Depth ! (mj
l
25. ....... 30. ....... 35 ........ 40 ........ 30. .......
l l ’ h + 0 z1 / z2 a(q) # a(z,,
n.s. 25 YOS 30 n.s. , 35 ns. 25 r1.s.
l l r5 30 1 ’ .,5 30
33 i 40 ,
1 50
ns. ri.??.
ns. n.s. ll.S.
ycs yes yes yes yes
cally different from 0 only at 30 m (TabIe III). Since the regression lines calc.ulated for 6 sampling depths, those occupied by the major part of the biomass (HERBLAND and 1,~ I~OGTEILLICI~, 1982, fig. 7), are not statistically differenl from each other (Table III), it is not possible to demonstrate
rigorously that one given datum point belongs to one or the other of these regressions. Nevertheless, values obtained at Ihe same place (00, 40 W) during CIPREA 2, CtPREA 4 and CIPREA 5 cruises are plotted on figures 2. I>istributions of these dots are very close to those of the SOP cruise, SO Lhat they cari be considered, at first approximation, as being part of the same relationships. Therefore, equations from the SOP cruise (Table II) were used for computing the photosynthetic production of a11 tbe stations performed at the equator (40 W) during the CIPREA program from only chlorophyll data according Lo their sampling depth. Results show clear evidenc,e that calculation provides a very good estimate of the production (Table V) since no statistical difference appears between computed and measured values. Accordingly, from the SOP cruise data, the primary production of the CIPREA 2, 4 and 5 c,ruises is accurately predic.ted. Conversely, data of the CIPREX 4 cruise would not allow acc.urate prediction of the production of the SOP cruise because the regresaion line bet,ween product,ion and chlorophyll is not well defined by CIPFIEA 4 data.
Now, four groups of chlorophyll and production data (Fig. 2), collec.ted during four different cruises at the same position between February, 1979 and January, 1980, are gat,hered into a remarkably homogeneous set. Regressions between photosyn- thet.ic production and chlorophyll biomass cari then be computed with a11 available data for each incubation depth (Table VI). For the 3 best described levels, 30, 33, 40 rn, from 82 to 87 o/. of the variante of the production cari be explained by changes of the chlorophyll content, for 23 or 24 degrees of freedom.
As a direct consequence of these regression equations computed for each sampling depth, the
Océanogr. trop. 19 (2) : 161-179 (198d).

e r Fixed carbon
Chlorophyll ofmg.m-3)
0
T Flxed carbon
(mg.m-3. h-I.1
0 SOP 5-X CIPREA 2
. CIPREA 4
Fixed carbon
(mo.m-Kh-1)’
0 SOP X CIPREA 2
5 . CIPAEA 4 + CIPREA 5 /
‘..
,A ,’ / O/
+ ’ /’ / /’ / / x/ /
,~~~~~ ’ 0 30m
“Y /
Chlorophyll o ,
0.5 (mg.m-3)
(b)
c Fixed carbon
(mg.m-3.h-‘1 / /
carbon
0 50m
0 SOP _ X CIPREA 2
. CIPREA 4
Chlorophyll a 0
0 0.5 (mg.m-3 1
(d)
0 35m
I 0.5
Chlorophyll a (mg.m-3 1
(f)
FlG . 2. - Fixed carbon from sunrisc to sunset plottad versus concentration of chlorophyll a a1 lhe beginning of the incubation. Each point represents one in sifu incubation.
CU) ‘l’he regression line and the confidence limits (level of significance 5 %, according to DAGNELIE, 1969) were computed with SOP data, Stat. 12 excepted
at 25 m. CIPREA 4: means and standard deviations for 5 pairs of values. (b) at 30 m. CIPREA 4: 11 pairs of values. (c) at 35 m. CIPREA 4 : 11 pairs of values. (d) at 40 m. CIPREA 4: 12 pairs of values. (e) at 50 m. CIPREA 4: 12 pairs of values. (f) tbe same from 25 to 50 m
Carbone ffx6 en fonction de la concenlrnfion de chlorophylle a en début d’incdbafion. Chuque point reprbenfe une journée d’incubafion in situ. La droite de rdgression et ses infer- oalles de confiance (au risque S”/o, selon DAGNELIE, 1%9) sont calcuk% auec les données de la campagne SOP, sauf la station 12
(a) à 25 m. CIPREA 4: moyennes et déviafions standard pour 5 couples de valeurs. (b) à 30 m. CIPREA 4: 11 couples de valeurs. (c) à 35 m. CIPREA 4: 11 couples de valeurs. (d) à 40 m. CIPREA 4: 12 couples de oafeurs. (e) à 50 m. CIPREA 4: 12 couples de valeurs. (f) les memes droites de 25 à 50 m

167 I’RIMARY PRODUCTIO;N IX THE EQUATORIAL ATLAXTIC:
TABLh v
Comparison of values of primai-y production measured during CIPREA 2, 4 and 5 cruises with values calculated from chlorophyll data and rclationships computed with SOI’ cruise data (table 2)
Comparaison des valeurs de production primaire mesurées lors des campagnes CIPREA 2, 4 ei 2 avec celles calculées à partir des donnees
Depth (ml
25 ...... 30 ...... 35 ...... 40 ...... 45 ...... 50 ......
de chlorophylle ef des relafions obtenues avec les donnies de la campagne SOP (tabl. 2)
CIPREA 2 cruisc CIPREA 4 cruisc CIPREA 5 cruise ----.-. --.
mean production (mgC.m-3.h-1) mean production (mgC.m-3.h-1j mean production (mgC.m-3.h-1) .
n n
measured calculated diffcr.
mcasurcd calculalctl ! differ. nl mcasurcd calculatrd
1 differ. in oh in oh in 0h
- -1 -i
1 2.20 2.16 - 2 5 3.43 2.78 -19 1 1.64 1.69 + 3 3 2.36 2.31 - 2 11 2.97 2.79
/
-. 6 1 ! 2.61 1.57 -2
2 1.87 2.37 +. 27 Il 2.75 2.68 -3 1 2.62 3.31 + 26 3 2.99 2.95 - 1 12 2.52 2.72 + 8
1 3.87 2.62 -32 4 2.15 1.97 -8 1 1.67 1.69 + 1 3 2.30 1.77 - 23 12
I 1.53 1.61 1 + 5
/ /
Mean.......................... - 4.5 - 1.3 +7 Diffcrence (n 5 13j (n = 53) (n = 4)
I
Rcgression lincs equations betwcen carbon hxalion (rr~g.rn-3.1~ l) and chlorophyll a !mg.m3( for ah available datü (stat. 12, SOP, excepted). Number of data (n), slope {a), y-intarcept (bj, correlation c»eKicienL (r) and levcl of significance ‘p,, range of chlorophyll
values, mean percentage of surface irradiante and mcan m. L)ata from SOp, CLI’REA 2, 4 and 5 cruises
É’quaiions des droites de régression entre fixation de carbone (mg.m-3.11-L) et chlorophglle a (mg.m3) pour foutes les donnt;es disponibles (sauf stnt. 12, SOP). Nombre de données (n), pente (a), ordonnee à l’origine (b), coeflcient de corrPlation (r) ef niveau de signification, gamme de valeurs de chlorophylle, pourcentage moyen de lumière incidente et I>nll moyen. Donn&es des campagnes SOP, CIPREA Y,
4 ef S
Depth n (ml
--
o...... 9 5...... 17
10 ...... 8 15 ...... 14 20 ...... 14 25 ...... 15 30 ...... 26 35 ...... 25 40 ...... 26 45 ...... 11 50 ...... x? 60 ...... 17 70 ...... 8
a
10.61 11.27 12.13 10.34 Il.88 10.80
7.06 6.51 5.73 7.26 3.21 1.90 3.59
-
--
-
0.39 0.60 0.53 0.67 0.26 O.P.? 1.02, 0.70 0.3ti
- 0.76 0.05 0.10
- 0.42
-
- -
-
r P
-,
0.80 < 0.02 0.82 < 0.001 0.92 < 0.01 0.79 < 0.001 0.93 < 0.001 0.80 0.91 !
< 0.001 i n.ooi
0.93 0.9..? I
< 0.001 < 0.001
(3.85 0.64 l
< 0.001 < 0.01
0.61 0.83 I
< 0.01 < 0.02
- / II A_
!
-
?angc of chia values Ycan prrcrntagc (mg.m “j of incident. radialior
0.08 - 0.29 100 0.08 ' - 0.27 CifI
0.07 - 0.27 33.6 0.09 - 0.29 26.2 0.07 - 0.29
l "1.1
u.09 - 0.34 , 16.4 0.w - 0.70 12.3 0.17 -- 1.07 8.3 O.26 - 0.98 5.86 0.34 - 0.77 4.77 0.27 - 0.7-i 3.00 0.25 - 0.50 1.68 0.18 - O.'L6 0.85
-
I . - 1
l
-
186.9 88.9 62.5 46.1 3x.5 '23.9 22.7 14.7 10.0 8.3 5.S 3.2 1.6
Oceanogr. frop. 19 (2): 161-179 (1984).

168 A. LE BOUTEILLER, A. HERBLAND
IOC
5(
C
l- /
,- ‘0
d2 0 SOP
X CIPREA 2
0 CIPREA 4
+ CIPREA 5
xi” Chlorophyll 0 (mg.m-2)
5 10 15
FIG. 3. - Fixed carbon as a function of chlorophyll Q. Values integrated by linear interpolation from CI to 40 m. The regres- sion line was computed with SOP cruiso data, sta. 12 excepted. CIPREA 4: means and standard dcviations for 13 pairs of values. Station numbers identify some of the representativc
points (see text)
Carbone fixé en fonction de la chlorophylle a. Valeurs intégrées par interpolation IinJaire de 0 à 40 m. La droite de régression est calculée avec les données de la campagne SOP (stat. 12 ex- ceptée). CIPREA 4: mogennes et déviations standard calculées avec 13 couples de valeurs. Quelques numéros de station sont
reportés près des points représentatifs (voir texte)
integrated values of production and chlorophyll are also strongly correlated, ‘whatever layer may be considered. For instance, for the most often and well described layer, O-40 m, the following correlation is obtained for the SOP cruise (Fig. 3):
XcO” (fixed carbon) = 5.76 ÇO” Chla + 43.8
(fixed carbon in mg.m-2.h-l and chlorophyll a in mg.m+ n = 12, r = 0.975). The experimental points which represent measure- ments of the CIPREA 2 and 5 cruises may be also considered to belong to the regression line, whereas those of CIPREA 4 cruise are slighily different because of the special vertical distribution of the chlorophyll during this cruise (LE BOUTEILLER and
HERBLAND, 1982a). As could be expected from the results reported above, the y-intercept is positive and high.
LIGHT CONDITIONS AT EA~H DEPTH
We have shown that io study the relationship between production and chlorophyll for each incuba- tion level, the data could be divided into classes very conveniently def’med by depth. Since light is the major factor acting on the process of photo- synthesis, it would be meaningless to rank production data by sampling depth if PAR varies much from day to day and from one cruise to another. During the SOP cruise, only PAR of the station 12 is very different, from the mean PAR [Table 1). For the other cruises, the amounts of PAR are of the same order of magnitude (Table VII), even if slight differences occur at 25 and 30 m between data of SOP cruise and CIPKEA 4 cruise.
THE NITRATE EFFE~T
Abundance of nitrate in sea-water is one of the main factors which act on the primary productivity. Rowever, comparison of Figure 2, c and Figure 4 evidences that, for one light level, production as a function of chlorophyll is not influenced by the nitrate concentration: higher values of production are obtained for higher concentrations of chlorophyll (SOP stations), not for nitrate richer Wat>ers. This result also appears on Figure 3: points which represent stations 10 and 11 (SOP), 134 and 136 (CIPREA 2) without nitrate in the O-40 m layer, belong to the same linear regression as the other stations which contain more or less nitrate in the integration layer (Fig. 1). For a given value of PAR, carbon fixation is strongly correlated with chlorophyll concentration, at any nitrate concentration. This conclusion is also supported by analysis of Figure 5. The vertical profiles of chlorophyll, production, productivity and nitrate are outlined for three typical stations from three different cruises. The productivity index is defined as the amount of carhon fixed during the incubation in situ from sunrise to sunset, thereafter averaged per hour and referred to chlorophyll unit (initial value). 11 should be noted that the vertical profiles of the productivity index present a maximum always between 5 and 15 m depth. In addition, the profiles are never deformed significantly at the depth where nitrate appears (Fig. 5): surface (station 9), 30 m (station 14) and 50 m (station 1.34). Furthermore, these profiles of productivity index seem to be typical not only of the equatorial area near 40 W, but also of a11 the central part of Gulf of Guinea. Among 54 stations with in situ incubations of primary production
r
Océanogr. trop. 19 (2): 161-179 (1984).
hmounl of radiation received by samples durin, 0 tht: in situ incubation. Al1 availablr. data, stal. 1 ‘2 !SOI> csccplcd. 3lran value (m) and standard deviation (St. d.). I)iff?rencc of PAR from ont: cruisc to another leslcd xilh thc MANS-I%v~~~~~~:~ U test. jlrvel of signi-
ficancc 5 %j
Quantilé de lrzmiére reçue par les échantillons au cours de l’incubafion in situ. T’ouies données disponibles, sauf slot. 13 (SOP). .loyenne (m) et déviaiion standard (si. d.). Difftrence dem entre les campagnes leslke à l’aide du lest C de MASS-WIIITNEY (nu risque 5 %)
Uepth Cm)
I->,zn i102”q.m-~.11-~) IJiffcrencc --.--._~.~ --.------ __._ -.-- ~- .---.- - -I--.~ - --- _--__ --- ----
l SOI’ cruisc (1icb.j ClPHE‘\ 2 (.\pr.j 1 ClPHEh 4 (ocl.; sor’-cIr’. 2 ( SOI’-(:II’. 4
i -<
Chlorophyll a 0
(mg.m-3)
1.0 t
0 SOP
X CIPREA 2
A CIPREA 4 Cl + CIPREA 5
AA A A
0 35m
A A
A
NO;
’ “’ ” ” ” ” “’ 0 1.0 2.0 (mM.me3) 3.0
FIG. 4. - Conconlralions of chloropl~yll (I and nilralc :IL thc beginning of each incubation at 3.5 III. .A similar ligurc Wou!d be obtaincd from cdrbon fixalion dala, becausc of thr rela- tionship betwcen carbon fixation and chlorophyll (1 <Fig. 2, c:
Concentrations de c/zlorop/zylle :I rl de nilrafe en drbzzl d’incu baiion à 35 m. L’IZC fiyure sanzblahle serai1 ohlenu~ à prrrfir de la fixation de carbone grûce R la relation direclr enlre ~ralion de
carbone el chlorophylle a (Fig. 2, c)
performed at 40 W front 50 S Lo 100 S (CIPREA programm, RV Capricorne), 50 stations bave com- plet,e data showinp a maximum productivity index hetween 0 and 20 m, and most. oft;en between 5 and 15 m. For tllese stations, depth of the nitrate depleted mixed layer ranges from 0 to 70 m. There- fore, productivity as we bave measured it, is not directly relaf;ed to nitrate concentration and not Ggnificantly higher in the presence of nitrate (HERBLAND and LE B~UTEILLER, 1983). With respec.t to productivity, Lhere is no reason to divide the euphotic zone into two laycrs, one with and the other without niL.rate.
This is in opposition with observaiions reporkd by THOMAS (1970) and by CUIH, and SMALL (1965) in the Pacifie ocean, but in agreement wit,h the results of a multivariatc analysk applied to a great nuni- ber of data from a coastal slation (PLATT and Suunxk RAO. 1970; II~~~rsor*r and PLATT, 1980). They bave shown Lhat nut,rients cari cxplain only a miner part of variations of the relative production of phytoplankton. ‘2s sugpested by HARRISON and PLATT (1980), ambient nutrient concentralions parameters may be inappropriak indices of nutrient availability due Lo rapid recycling (AICCARTHY and GOLDMAX: 1979). This assumption~ is also supported b-y experiments which show that thc productivity of samples enrichcld with nitrogen compounds is not cnhanced significantly after one daytime irî sih
incubation (1,~ ~~OUTEILLER and ~IERBLANI), l%%!a). In such an environment,, the presrnce of nitrate is a sine qufl non condition of abundance of phyto- plankton, but seems t.o bave no influence on the productivity index.
The shape of vertical profiles of production, nnd
Océanogr. hop. 19 (2): 161-179 (1964).

170 IIERBLAND
Chlorophyll (I (mg.m-‘1
* 9 EIPREA
A. LE BOUTEILLER, A.
Fixed carbon 1 m9.m-‘. h-1 ) NOS (mM.m‘J] and Productivity index (m,,C.mChl:.h-l)
0
0 14 SOP Ci 134 CIPREA 2 d. 9 CIPREA 4
l r (0)
FIG. 5. - Depth distributions for 3 typical stations: (a) chlorophyll a. (b) fixed carbon. (c) nitrate ancl productivity index
Distributions verticales pour 3 stations fgpiques: (a) chlorophylle a. (b) carbone fixé. (c) nitrate et indice de productivité
especially the depth of the peak is a direct conse- quence of the above statement. Two stations characteristic of the “Typical Tropical Structure” (HERBLAND and VOITURIEZ, 1977), defined by the presence of a nitrate depleted mixed layer, are outlined on Figure 5: stations 14 and 134. Station 14 is very typical, since depths of chlorophyll and production maxima are equal (30 m), whereas the maximum of production of station 134 is well above the peak of chlorophyll. Station 9 represents an “atypical” situation: no nitrate depleted layer, and depth of the production maximum occurs 30 m above the chlorophyll maximum. These three stations are representative of the different situations observed during the 31 stations. In each case, production cari be computed from çhlorophyll and depth data by means of equations in table VI, without having to consider nitrate concentration. Finally, for an incident radiation close to the average, the vertical profile of production is entirely defined by the profile of chlorophyll. The presence of a Sharp peak of chlorophyll, relatively well lighted, is the necessary and sufficient condition for that peaks of production and chlorophyll to appear both at the same depth. This is the case of station 14. Therefore, the peak of production is located at the top of the nitracline because of a great chlorophyll biomass at this depth, not because of a special productivity (see discussions of DANDONNEAU, 1979; CULLEN and EPPLEY, 1981; CULLEN, 1982; HERBLANI), 1983).
For less sharp peaks of chlorophyll, the production maximum is above Lhe chlorophyll maximum. Since the productivity index increases from the bottom of
Océanogr. trop. 19 (2): 161-179 (1984).
the euphotic zone to about 5 or 10 m, a sample taken and incubated above the chlorophyll maxi- mum, though less rich in chlorophyll, cari fix more carbon than the sample taken within the chlorophyll maximum (Fig. 5, stations 134 and 9).
Another example cari be taken from two stations during CIPREA 2 cruise at (20 00 N; 40 00 W). Nitrate and chlorophyll maximum both appeared at 60 m (Table VIII). Maximum of flxed carbon was measured at 40 and 35 m respectively. PAR data are very close to the mean values of table VI, SO production cari be computed from equations of table VI. Results are entirely consistent with measured values (Table VIII). These stations show evidence that a deep chlorophyll maximum is not a production maximum only because of the vertical gradient in the productivity index.
Relationship between productivity and chlorophyll
The empirical equations between carbon fixation and chlorophyll (Table VI) provide a good description of the production in the equatorial area. For this purpose, it is of minor importance that the y-inter- cepts of the regression lines are positive (Fig. 2 and 3, tables VI and X). But this observation could be very important from an ecological point of view: it means that the productivity index would depend on the amount of chlorophyll present in the water. Among the numerous causes likely to induce a variation of productivity according to the chlorophyll content, four of the most important factors Will be discussed:

PRIMARY PRODUCTION IN TKE EQUATORIAL ATLANTIÇ 171
TAIILE VIII
Comparison of values of primary production measured during CIPREA 2 cruise at. (2” 00 N; 40 00 TV) with values calculatetl from chlorophyll data and relalionships computed wilh data of SOP, CIPREA 2, 4 and 5 cruises at (00 00; 40 00 W) (Table VI;
Comparaison des valeurs de producfion primaire mesurées lors de la campagne CIPREA 2 à (20 00 N; 40 00 W) avec les valeurs calcult?es à partir des données de chlorophylle et des relulions établies avec les données des campagnes SOP, CIPREA 2, 4 et
5 à (0~ 00; 40 00 W) (Tabl. VI)
Depth Chla NO, ‘PAI-C Fixed carbon (mg.m-û.h-lj
(m) (mg.m-“) (mM.m-3) 1022q.m-2.h-1 measured calculated
Station 140 (Apr. 25, 1979)
o... 0.10 0.01 163 1.2s 1.35 20.. . 0.11 0.00 37 1.59 1.87 40... 0.22 0.00 15 1.72 1.64 45... 0.22 0.00 11.6 1.31 0.84 50.. 0.22 0.00 7.6 0.79 0.97 55.. . 0.25 0.00 5.2 0.67 - 60... 0.49 8.94 3.5 0.69 1.03 70... 0.23 15.98 1.9 0.15 0.40
Station 14.2 (hpr. 26, 1979)
0.. 0.10 10.. . 0.09 35... 0.15 50... 0.27 60.. 0.46 65.. 0.36 70... 0.21 80... 0.19
-
-
0.00 177 1.55 1.35 0.00 63 1.39 1.62 0.00 18 1.91 1.68 0.00 7.0 0.98 1.10
11.22 2.8 0.77 0.97 14.80 2.0 0.41 - 17.05 1.4 0.17 0.33 18.21 0.8 0.06 -
1 - A methodological artifact: the lower the chloro- phyll concentration, the more under-estimakd is chlorophyll content or the mort over-eslimated is thc carbon fixation.
Chlorophyll a and l*C methods werc always used with the same rigour. However, bath methods are imperfect, producing estimates that cari be shifted as a function of chlorophyll concent,ration. This hypo- thesis may not be neglected, especially nowadays, when processes of the oligotrophic syaliem appear SO questionable (MCCARTHY and GOLDMAN, 1979; C*OI.DMAN et a/., 1979; EPPLEY, 1980).
2 - SynLhesis and accumulation of chlorophyll within the bottles during incubation: measuremente of carbon fixation require several hours of incuhat,ion. If carbon fixation is related not only to the concentration of chlorophyll measured before incuba-
tion, hut also to the amount of chlorophyll synthe- sized during incubation, a better production efflciency in chlorophyll poor waters could be due to a higher rate of chlorophyll synthesis during incubation. In reality, the rate of chlorophyll synthesis for one given irradiation seems not to depend on the chloro- phyll concentration, at least for the area studied here (LE BOUTEILLER and HERBLAND, 1982a).
3 - The amount of PAR: if samples poorer in chlorophyll receive a more intensive radiation during incubation, then the amount of fixed carbon cari be relatively greater. Extinction of light in the water is known to be related to the amount of phytoplankton (LOKENZEN, 1972; ~'[OHEL and SMITH, 1974). Hence, chlorophyll poor waters are potentially best lighted. For the SOP cruise, however, the percentage of incident light received by chlorophyll- poor samples is not significantly higher lhan light received by rich waters (Table IX). The same holds truc with respect t,o PAR (Table IX).
?‘ARLI< IX
Correlation coefficients and levels of significancc computed bctween chlorophyll n and percentage of surface irradiante, and bctwccn chlorophyll CI and PAR. Data from the SOP cruise,
stat. 12 exceptcd
Coeflfcients de corrélation et niveaux de significafivifé calculés enfre chlorophylle a et pourcentage de lumière incidente, et entre
chlorophylle a ef PAR. Données de SOP, sauf sint. 12
Lkpth Bctween Chia and Retween Chla (mj surface irradiante ( %) and PAR
r P P 9 - ,n...... 0.58 Fl.S. or47 n.s. 30 ...... - 0.08 n.s. 0.31 n.s. 33 ...... - 0.48 n.s. 0.11 n.s. 40 ...... - 0.68 0.02 0.39 ns. 50 ...... - 0.47 n.s. - 0.48 n.s.
Pairs of production and chlorophyll data cari be associated by sampling depth as done before, but also by using somc classes of percentage of incident radiation, or according to PAR (Table X). Regression lines computed for sampies taken above 43 m depth a11 exhibit an y-intercept, notably above 0. Therefore, aclual light availability may not be considered as the origin of the phenomenon.
4 - Nitrate and t,emperature: the nitrate influence has been studied earlier. As far as temperature is concerned, if chlorophyll poor waters are system- at,ically warmer than rich waters, their productivity could be higher, because of the temperature effect
Océanogr. irop. 19 (2): ZGZ-Zi9 (Z.964).

172 A. LE BOUTEILLER, A. HERBLAND
TABLE X Fixed carbon
Equations of the regression lincs between carbon fixation (mg. m.“.h-l) and chlorophyll a (mg.m-“) for thc SOP cruise (stat. 12 excepted) for different rangcs of available radiation. Slope (a), y-intcrcept (b). The y-intercept is tested after DAGNELIE
Chl a (mgC.mgChld.h-1)
(1969)
Équations des droites de régression reliant pxation de carbone (mg.m-3.h-~) et chlorophylle a (mg.m-=) pour la campagne SOP (sutif stat. 12) pour difftrentes gammes de lumière disponible. Pente (a), ordonnke à l’origine (b). L’ordonnée à l’origine esf
x
xx 15-
Ox 0
8
tesfée selon DAGNELIJ~ (1969)
Percentage Lcvel of surface n a b r b f- 0 of si- irradiante gnificance
----
]19-24]........... 9 10.03 0.45 0.97 ]15-19]...... . . . 7 ~ 8.02 0.93 0.97
yes 5 % yes 5 %
]11.5-151.. . . . . . 10 7.19 0.79 0.98 yes 2 % ]8.5-11.5]......... 8 6.77 0.65 0.96 yes 5 % ]6.0-8.5].......... 8 6.42 0.20 0.91 r1.s. ]4.0-S.O].......... 9 5.74 0.38 ~ 0.89 n.s. ]2.5-4.0]......... . 7 5.20 - 0.51 0.86 n.s. ]1.5-2.5]....... 6 3.40 - 0.19 0.89 n.s.
log,, PAn ( 10a2q.m-e.h-1)
]1.6-1.3].......... 22 7.47 0.80 0.97 yes 10/,,~ ]1.3-l.O].......... 17 6.01 0.82 0.94 yes 5 %
on productivity (EPPLEY, ‘972). In the Gulf of Guinea, temperature is related to the nitrate concentration. Thus, for the CIPREA 4 cruise, we have the relationship:
(NO-,] = - 1.349 T -+ 33.59 (computed for [.NO-,] > 0.5 m124.m-3; T in OC; n = 184; r = - 0.977).
The lack of clear relationship between chlorophyll and nitrate (Fig. 4) as between productivity index and nitrate (Fig. 5, c) suggests that temperature is not the explaining factor.
Accordingly, the positive y-intercepts of the regression lines between production and chlorophyll would not be directly due to better environmental conditions when chlorophyll concentration is lower.
As a direct consequence, for a given irradiante, the productivity index varies as an inverse function of the chlorophyll concentration (Fig. 6). The same figure has already been obtained by TCHMIR (1971) in the Gulf of Guinea from experiments restricted to surface water. The integrated values for the water column by surface unit show the same trend (Fig. 7): the productivity index is maximal when the chlorophyll concentration is minimal, which has not
x 25m 0 30m
. 35m
A 40m
FIG. 6. - Productivity index plotted versus chlorophyll a, for 4 incubation depths. SOP cruise data, stat. 12 excepted
Indice de productivité en fonction de la chlorophylle a porzr 4 niveaux d’incubaiion. Données de la campagne SOP, sauf
&-faf. 12
been observed by STEELE and BAIRD (1961) in the North Sea, or LEMOALLE (1981) in Lake Tchad.
In the future, it Will be essential to consider such a result when interpreting production data from chlorophyll rich or poor waters. If chlorophyll photosynthetic efflciency increases when chlorophyll concentration decreases, the production of oligo- trophic waters would be relatively greater and the production of rich waters relatively lower. This would tend to reduce the seasonal and geographical differences of production, which are effectively rather small in the equatorial Atlantic Ocean (VOITURIEZ et al., 1982).
Now, the experimental points of figure 2 cari also fit on curves passing through the origin. The mode1 is mathematically more complex but better from an ecological point of view, since production is non existing when chlorophyll is totaly absent. Calculation (Table XI) shows that, for SOP data, fitting on a power function curve is as good as fitting on a straight line (Table II). Therefore, our data reported here support the hypothesis that carbon fixation would vary as a power function of
Océanogr. Irop. 19 (2): 101-179 (1984).

E'RIMAKY PKODUCTION IN THE EQUATORIAL ATLAXTIC 173
~~Fixed carbon (mgC.mgChl<I!h-1)
\ 0 SOP
CII2
Chi a ( mg.m-2 1
5 10 15 a
(a)
, -
,-
I-
. . l
.
. * .* .
% .
15 20
(b)
c: Chl o
25 (mg.m-“1
I>IG. 7. - 1’roduclivit.y index plotl.ed versus chlorophyll a (n) Values integrated from 0 lo 40 m for SOP, CtPREA 2 : ind 3 cruiscs. /b) Values intcgrated frorn 0 1.0 80 m fol CIPREh 4 cruise
Indice de producfiuit& en fonction de la chlorophylle a (a) Valeurs intégrées de 0 ù 40 m pour les campagnes SOP, CIPRB.4 2 et 5. (Lt) Valeurs inli{qrkes de 0 d 80 m pour CIPRE.4 4
Equalions of the regression lincs I~ctwecn carl)ort fixalion :rntl chloroplryl1 (I, bolh oxprcssed in Iog;lrilhm. Symhols and dala
as in Table II
&wntions des droites de ré,qression relianl fixalion de carbone et chlorophylle :L, toutes deux etrprimies en logarithmes. Symboles cl
données comme dans le lal)lcau 11
i I>rpth i
(mi n l ll. a 1)
-----
23..... 8
! 1
7.84 0.72 0.93 30..... II 7.76 ; 0.73 0.90 33..... II / 7.03 0.78 0.98 40.. . 12 50.....
( 5.97 ;.y; y;
7 I 3.Lo .
the amount of chlorophyli a preaent in c.he waLer at the beginning of t,he Incubat>ion.
CHL~R~PHYLL ANU PH~T~PLANI~TOX
Since fluctuations of the environmental factors do not seem to be directly at the origin of the
Océanoyr. irop. 19 (2): 161-179 (1984).
inverse relationship between productivity index and chlorophyll concentration, then the hypothesis arises of changes in properties of the phytoplanliton itself. I3y means of size fractioning, it is effectively possible to show evidence of a marked c,hange in the size distribution of phytoplanklon cells from chloro- phyll rich to poor waters (Fig. 8). For 1 mp.m-3 of total chlorophyll a, about 50 y0 of the chlorophyll helongs 1.0 organisms passing Ihrouph a 3 ~1~1 filtpr: and the percentage approximates 75 o/O when wat,er contains 0.2 rng.m3 of total chlorophyll a. Comparing figures G and 8 suggesls that cac,h concentration of chlorophyll a would correspond t.o a part,icular community of phytoplankton. The photosynthetic efficiency of Lhe chlorophyll would he higher in chlorophyll-poor walers with dominant. picoplankt,on, and lower in chlorophyll-rirh waters. Production measurements showed that the productivity index of nanoplankLon ( < 35 p.mi is syst-,ematically greater than t,he pr0ductivit.y of the total fraction ( < 200 pm) (IIERBLASI) and 1,~ BOUTEILLE~~, 1981). This is very consistent witSh results reported by MALONE
11971) and 7r~~~~C~~ (1980) in Lhe Pacifie Ocean. The efticiency of liqht-ulilizalion is inversely related noi, only to the cellular pigment concentration J~IORISL and HHICACD, 1981), but also to the ce11

174 A. LE BOUTEILLER, A. HERBLAND
0 SOP
X CIPREA 2
$ CIPREA 3
Chlorophyll a <200ym (mg.m-3) ,
0.5 1.0
FIG. 8. - Rmount of chlorophyll a passing through a 3 prn fIlter plotted versus total chlorophyll concentration. Data from and LE BOUTEILLFJC (1981). Sampling depths arc reported for each station
Quantitt de chlorophylle a passant à travers un pllre de 3 pm en fonction de la concenfration de chlorophglle fatale. Données de et LE BOUTEILLER (1981). Les profondeurs de prélèvement sont indiquées pour chaque station
HERDLAND
HERBLAND
size: the small ce&, which have a higher surface/ volume ratio, show a better productivity (TAGUCHI, 1976; CHRETIENNOT-DINET, 1981). Nevertheless, the < 3 prn fraction appeared to be vcry poorly productive (HERBLAND and LE BOUTEILLER, 1981). Accordingly, it is difflcult to explain then how a water containing for example 0.2 mg.m-3 of chloro- phyll a, of which nearly 75 yo belongs to < 3 prn ce&, could be SO productive (Fig. 6). In fact, measurements of the chlorophyll content in flasks at the end of incubation suggest that the autotroph organisms (< 3 p+m) would be inhibed or damaged by screening before incubation (LE BOUTEILLER and HERBLAND, 1982a), and consequently our direct measurements of productivity of the < 3 prn fraction may be suspected. Recently, LI et al. (1983) reported that, in the tropical Pacifîc Ocean, 20 to 80 yo of the carbon fixation is attributable to < 1 km autotrophic cells. PLATT et al. (1983), at the west of the Azores, found that picoplankton (< 1 prn) contributes about 60 yo of the total primary production.
Finally, the higher productivity index plotted on figure 6 might well be due to the activity of very small phytoplanktonic celIs. According to the chlorophyll concentration, which reflects changes of the size structure of the phytoplankton community, the productivity index varies approximately two- fold for one given light level (Fig. 6). In the same way, the productivity index of the whole photic layer increases from 5 to 10 when chlorophyll content. decreases from 27 to 18 mg.m-2 during CTPREA 4 cruise (Fig. 7, b).
Océanogr. trop. 19 (2): 161-179 (1984).
In nutrient rich or poor waters, phytoplankton activity as estimated by the productivity index appears in both cases to be very high, near maximal if compared to calculations of EPPLEY (1972). ‘In the equatorial divergence, spatial and temporal variations of the environment properties exhibit a relatively small magnitude, characteristic of unperturbed regions (WALSH, 1976), SO that biomass rather than growth rate would be controlled by nutrients ( GOLDMAN et al., 1979). The influence of the environ- mental conditions would be reflected not only in the chlorophyll concentration in sea-water, but also in some major properties of the phytoplankton, among which the mean ce11 size and the mean chlorophyll ce11 content, as pointed out by PLATT and SUBBA RAO (1973) and PLATT et ul. (1977).
Relationship between production ana light
In order to state precisely the effect of light on the photosynthetic fixation of carbon, three variables should be considered together: carbon fixation, chlorophyll and PAR.
Carbon fixation referred to unit light, both variables expressed in calories, corresponds to the Kb index proposed by PLATT (1969) for measuring the contribution of photosynthetic processes to the total optical attenuation coefficient of visible radiation in seawater. Kb was found to depend linearly on the chlorophyll concentration at each depth (PLATT, 1969; LE BOUTEILLER, 1982).
Carbon fixation per unit of chlorophyll a, which is

PRIRIARY PRODUCTION IN THE EQUATORIAL ATLANTIC 175
the classical productivity index, Will be considerrd beIow as a function of light.
Upon a11 available data of productivity index and PAR from the euphotic zone, a bilogarit.hmic transformation is applied SO as to homogenize bath variantes, as &IOREL (1978) did, and to minimize the influence of the chlorophyll concent,raLion on the productivity index. Excluding surface and 5 m samples where photosynthesis was markedly inhibited by light excess, a linear regression equntion is computed between productivity index and PAR (Table XII, fig. 9). It is noteworthy that this relation- ship is very similar for the SOP and CIPREA cruises, with highly signifkant correlation coefficients.
TABLE XII
Equations of Lhc regrcssion linos computcd between produc- tivity index (mgC.mgChla-~.l~-lj and PAR (10’2q.m-~.h-1j, bath expressed in logarithm from a11 availablc data, excepled 0 and 5 m data and slat. 12 and 11 (SOPj. Slope (a) and y-intercept, Ib;
Efquafions des droites de rkgression calculées enlre indice de productivité (mgC.mgChla-1.h ‘) el Px (lO~~q.m-‘.h-l), tous deux en logarithme, à partir de toutes données disponibles, sauf donnéesde 0 et 5 m etslat. 11 et 12 (SOP). Penie (a) ef ordonnées
d l’origine (b)
Cruises
SOP................ 11 CIPREA 2 and 4.. . SOP + CIP. 2 and 4.
The alope of Lhe regression linc, positive but less than one, means Lhat, the productiviky index varies as a power function of PAR. Consequently, Lhe quantum yield, as defined by plant physiologista, classically increases from surface to Lhe bottom of Lhe cuphotic zone. Optimal radiative conditions for photosynthesis are observed near 10 m depth, witlr values of PAR ranging from 6 to 8 x IOz4 q. rn-“.kl, which is very consistent. with values reported by MOREL (1978). Then thc maximal values of the productivity index lie near 150 g C. g Chla-‘.d-‘, an estimate close to the maximal value expecl-ed by EPPLEY (1972) for temperatures ranging from 25 to 30 Oc, and also approximated bp PLATT et al. (1980) off Peru. Data from stations 11 and 12 (SOP) were not used in the calculation because of their very high productivity index when referred to PAR (Fig. 9). This latter important result provides evidence that the relationships between productivity
,og fixed torbon 10
(hlo (mgC.mgChla.h-‘)
0 0.5 1.0 II,, , , , 1 1 , , , ,
I ’
/ / // 1,
,’ /’
l
a a
X
X
0 stot.11 x stat.12
FIG. 9. - Productivity index as a funclion of PAR, bot.11 rspressed in logarithm. Equation of the regression line is in table 12. Confidence limits computed according to DAGNELIE, 1969 (level of significance 1 O/u). BoLh scales are set by analogy with Lhe depth distribution of the produclivily index (Table XIII;. Wean surface irradiancr = 2 240 J.cm-2.d.1 for a mean incubation timc of 11 h 00. Productivity indexes of stat. 11 and 12 :snrface irradiante = 970 and 250 J.cm ?.d-* rcspec-
tively) are plotkd for comparison
Indice de productiuilé en fonction de m, tous les deux en logarithme. I?quafion de la droite dans le tabl. 12. Intervalles de confiance calculPs selon I)AO~EL~E~, 1969 (au risque 1 %). Les deux fichelles sont disposées par analogie avec la distribution de l’indicede producfiuit~Tenfonctinndelaprofondeur (Tabl. XIII). Rayonnement ylobal incidenf moyen = 2 810 .J.cm-2.j 1 pour une incubalion moyenne de 11 h 00. Les indices de productiuité des slat. 11 el If (rayonnemenf global incident = 970 et 250 J.cma j l;
respfrliuement) sont reprksentés pour comparaison
and PAR (Table XII) are applicable only for amounts of radiation availablc at eac,h depth close to the mean values (Table VI).
Furthermore, at a fi&. approximation, PAR may be considered to decrease as an exponential function of depth. Effectively, for t,he SOP cruise (stations Il and 12 excepted), the following equation has been computed:
log,ll m = - 0.030 z + 2.195
Oeéanogr. lrop. 19 (2): Ilil-Ii9 (19Sg).
176 A. LE ROUTEILLER, A. HEIG3LAND
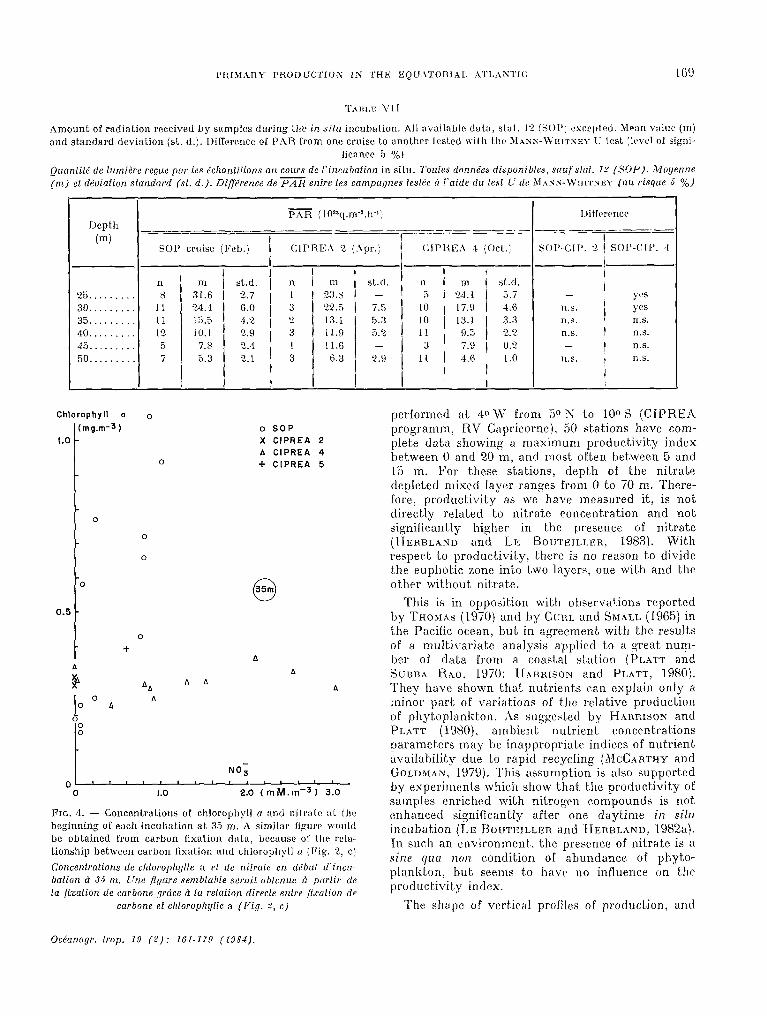
(m expressed as 10z2 q.m-2.h-1, using 11 stations with 142 data - r = - 0.977). Accordingly, the productivity index is also well correlated to depth (Table XIII). Thus, an extremely simple description of the mean primary production as a function of chlorophyll biomass and depth is supplied by equations of table XIII. Obviously, such relation- ships are true only for incident radiation and depth of the euphotic layer rather close to the mean values calculated with our data. The variability of PAR, either due to day-to-day fluctuations of the incident radiation, or resulting from depth changes of the cells due to vertical stirring or mixing, is essential with respect to the capacity of adaptation of the phytoplankton, especially by changing the chlorophyll ce11 content.
is nitrate-depleted. ‘In other words, with respect to light, the in situ carbon fixation is never maximal.
On the other hand, below 25 m, the productivity index of a sample taken at depth “z” and incubated above, at depth “z - 10 m”, is always lower than the productivity index of the sample taken and incubated at depth “z - 10 m” (Fig. 10). The contrary is observed above 25 m (Fig. 10). There- fore, two samples incubated at the same depth but taken at different depths, exhibit two different productivity indexes. These observations would result from the adaptation of phytoplankton by changing chlorophyll ce11 content, rates of photo- synthesis and chlorophyll synthesis according to depth and PAR (LE ROUTEILLER, 1982).
TABLE XIII
\ 1 f 1 l I
Number Number Cruises of of a b r
stations data -- --
SOP.. . . . . . . . . . 12 81 - 0.0189 1.549 0.924 CIP.2, 4 and 5.. 16 112 - 0.0189 1.548 0.915 SOP + CIP. 2,4!
and 5.. . . . . . . 2.8 193 - 0.0189 1.547 0.925
Equations of the regression lines computcd between produc- tivity index (mgC.mgChla-l.h-l, in logarithm) and depth (m), from a11 available data, excepted 0 and 5 m data and stat. 12
(SOP). Slope (a) and y-intercept (b)
Équations des droifes de régression calculées entre indice de productiviié (mgC.mgChla-l.h-l, en logarifhme) et profondeur (m), à partir de foutes données disponibles, sauf données de 0 et
5 m et stat. 12 (SOP). Pente [a) et ordonnée ù l’origine (b)
In order to determine more precisely how the phytoplanlrton is adapted to PAR, some experiments of “light enrichment” were performed ‘in situ at 21 of the 31 stations considered here: 117 samples for measuring carbon fixation, of which 90 were during CIPREA 4 cruise, were taken in duplicate: the ones incubated in siiu at the sampling depth, the others 10 meters above (at times 5 or 20 m). The main advantage of this type of experiment is to allow comparison between samples for which errors and artifacts are very similar. Of the 117 samples taken from different depths and put upward for incubat.ion on the incubation line, 112 fixed a greater amount of carbon than samples incubated at sampling depth. We may conclude that, in the experimental conditions, available light, surface excepted, always limits the amount of carbon fixed during the in situ incubation time, even if sea-water
0
Depth
20
40
FIG. 10. - Depth distribution of the productivity index for a typical station (9, CIPREA 4, see Fig. 5). Each sample talren in duplicate: one incubated at sampling depth (solid circles),
the other incubated above sampling depth (open circles)
Indice de producfivifé en foncfion de fa profondeur pour une sfa- fion fypique (9, CIPREA 4, voir Fig. 5). Points : flacons incubés à la profondeur de prélèvement. Cercles : flacons incubés
au-dessus du niveau de prklèvemenf
Furthermore, figure 10 shows that between 25 and 60 m, the productivity index of “light enriched” samples increases only slightly. Thus putting a sample for incubation at 10 m above sampling depth Will nearly equivalate to double PAR (Table VI). Stations 11 and 12 (SOP) have shown that conversely a decrease of the total incident radiation was partly balanced by a better quantum yield (Fig. 9). Schematically, there is a sort of damped reaction of the phytoplankton to variations of irradiante by
Océanogr. frop. 19 (2): 101-179 (1984).

which phytoplankton adapted to a light level, increases its efflciency for lower light and decreases it for higher one. Consequently, stations receiving half the light of the average (Stat. Il, SOP) or nearly 50 o/O more (Stat. 7 and 14, SOP) present,ed productions by chlorophyll unit close to the average (Fig. 2 and 3). A very significant decrease was observed only for one single station on a very cloudy day (Stat. 12, SOP. Fig. 2 and 3). Then, below the mixed layer, the phytoplankton is adapted at least to some extent, to the mean light level (FALKOWSKI, 1981).
CONCI,USION
In the eastern equatorial Atlantic ocean, a single determination of the chlorophyll a concentration provides an excellent description of the potential primary production of that sea-water. For an incident light intensity close to the average, the amount of carbon fîxed during daytime cari be precisely predicted from the chlorophyll content by means of very simple empirical relationships.
[Jndoubtedly, great homogeneity characterizes the structure and functioning of the tropical oceanic. system. The amplitude of seasonal climatic variations is relatively small (HASTENRATH, 1978), most often sea-water temperature lies between 15 and 250, and in addition the variability of the equatorial current system is of a low enough amplitude and frequency for primary production just to
balanc,e losses, mainly from herbivorous consumption (WALSH, 1976; LE BORGNE, 1981; VOITURIEZ et nl., 1982).
Because both depth of the euphotic layer and total incident radiation varied only within a small range from day to day and from one cruise to another, relationships between carbon fixation, chlorophyll and depth show very significant correl- ation coeffkcients, and are very similar for each cruise, in spite of differences in the hydrological and chemical structures (VOITURIEZ, 1981, and OuDoT, 1983, respectively).
How far such equations are applicable to predict the production in other areas is indeed to be determined. Because water masses move under the research vessel, the observations made at a fixed location during several days are obviously similar in the surrounding area. It was shown that these relationships were also true at the position (20 N; 40 W). They are probably applicable in the whole oceanic part of the Gulf of Guinea, provided that the incident radiation and the chlorophyll concentration are within the ranges of values used for establishing the relationships.
Since equations were calculated with data including numerous values pertaining to nitrate-depleted waters, there is hope that an extrapolation to the wide oligotrophic areas may be conceivable, which furthermore would constitute a possible approach for elucidating a part. of the mystery of the oligo- trophic system.
PRIMARY PRODUCTION IN THE EQUATORIAL ATLANTIC 177
A~VDERSON (G. C.), 1969. - Subsurfacc chlorophyll rnaximum in the north east Pacifie Ocean. Limnol. Oce«nogr., 14 : 386-391.
BANNISTER (T. T.) and LA~S (E. A.!, 1980. - Modeling phytoplankton carbon metabolism. In P. G. PAL-
KOWSKI [ed.]. - Primary productivity in the Sea- Plenum Press, New York, pp. 246-256.
CBRETIENNOT-DINET (M. J.), 1981. -.- Le r8lo du nanoplancton dans les phénoménes d’aulotrophic et d’hétfirotrophic en mer. Thèse d’État (Science), Lniversité d’Aix- .Marseille II, 141 p., ann.
CULLEN (J. J.) and EPPLEY (H. W.), 1981. - Chlorophyll maximum Iayers of the Southern California Bight and possible mechanisms of their formation and maintenance. Oceanol. Acta., 4 : 23-32.
CULLEN (J. J.), 198-2. - The deep chlorophyll maximum: comparing vertical profiles of chlorophyll a. Can. J. Fish. Aquat. Sci., 39 : 791-803.
Océanogr. irop. 19 (2): 161-179 (1984).
C~RI. [I-I.) and SMALL CL. F.), 1965. - Variations in photo- synthetic assimilation ratios in natural, marine phyto- planklon communities. Limnol. Oreanogr., R 67-R 73.
DAON~H.IIC (P.), 1969. - Tl leoric et methodes statistiques. L)uculoi. (Ed.), Gcmbloux (Belgique). Vol. 1, 451 p.; Vol. 2, 378 p.
»ANLIONNEAU (Y.), 1979. - Concentrations en chlorophylle dans le Pacifique tropical sud-ouest: comparaison avec d’aut.res aires oc&aniques tropicales. Oceanol. Acta., 2 : 133-142.
EPPLEY (R. W.), 1972. - Temperature and phytoplankton growth in the sea. CJ.S. Fish. Wildl. Seru. Fish. Bull., 70 : 1063-1085.
EPPLEY (R. W.), RENOER (E. H.), VENRI~K (E. L.) and MULLIN (M. N.), 1973. - A study of plankton dynamics and nutrient cycling in the central gyre of the North Pacilîc Ocean. Limnol. Oceanogr., 18 : 534-551.
EPPLEY (R. W.), 1980. .- Estimating phytoplankton growth rates in the central oligotrophic oceans. in “Primary

178 A. LE BOUTEILLER, A. HERBLAND
productivity in the sea”. P. G. Falkowski (Ed.) : 231-242.
FALKOWSKI (P. G.), 1981. - Light.-shade adaptation and assimilation numhers. ,T. Plankton Res., 3 : 203-216.
GIESKES (W. W. C.), KHAAY (G. W.) and TIJSSEN (S. B.), 1978. - Chlorophylls and their degradation products in the deep pigment maximum layer of the tropical North Atlantic. Nefh J. Sea Res., 12 : 195204.
GOLDMAN (J. C.), MCCARTHY (J. J.) and PEAVEY (D. G.), 1979. - Growth rate influence on thc chemical compos- ition of phytoplankton in oceanic waters. Nature, 279 : 210-215.
HARRISON (W. G.) and PLATT (T.), 1980. - Variations in assimilation numher of coastal marine phytoplankton: effects of environmental co-variates. .J. Plankfon Res., 2 : 249-260.
HASTENRATH (S.), 1978. - Heat budget Atlas of the Tropical Atlantic and Eastern Paciflc Oceans. Ed. : The Univer- sity of Wisconsin Press.
HERBLAND (A.), 1977. - The prevention of radiocarbon loss in liquid scintillation counting of solutions containing 14C-NAHCO,. Int. J. appl. Radiat. Isotopes. 28 : 795-796.
HERBLAND (A.) et VOITURIEZ (B.), 1977. - Production primaire, nitrate et nitrite dans l’Atlantique tropical. 1 - Distribution du nitrate et production primaire. Cah. ORSTOM, sér. OcEanogr., vol. XV, no 1 : 47-55.
HRHBLAND (A.) and VOITURIEZ (B.), 1979. - Hydrological structure analysis for estimating the primary production in the tropical Atlantic Ocean. J. Mar. Res., 37 : 87-101.
HERBLAND (A.) and LE BOUTEILLER (A.), 1981. - The size distribution of phytoplankton and particulate organic matter in the Equatorial Atlantic Ocean: import,ance of ultraseston and consequences. J. Plankfon Res., 3 : 659-673.
HERBLAND (A.) and LE BOUTEILLER (A.), 1982. - The meanders of equatorial currents in tho At,hîntic Ocean: influence on thc biological processes. Octanogr. trop., 17 (1) : 15-25.
HERBLAND (A.) et LE BOUTEILLER (A.), 1983. - Dynamique du phytoplancton et matière organique particulaire dans la zone euphotique de l’Atlantique Équatorial. Mar. Biol., 72 : 265-278.
HERBLAND (A.), 1983. - Le maximum de chlorophylle dans l’Atlantique tropical oriental. Description, écologie, interprétation. Océanogr. frop., 18 (2) : 295-318.
HITCHCOCK (0. L.), 1980. - Diel variation in chlorophyll a, carbohydrate and protein content of the marine diatom Skelelonema costatum. Mar. Biol., 57 : 271-278.
HUNTER (B. L.) and LAWS (E. A.), 1981. - ATP and chloro- phyll a as estimators of phytoplankton carbon biomass. Limnol. Oceanogr., 26 : 944-956.
JEFFREY (S. W.) and HALLEGRAEFF (G. M.), 1980. - Studies of phytoplankton species and photosynthetic pigments in a warm tore eddy of the East Australia Current. II.
Ocèanogr. lrop. 19 (2): 161-179 (1984).
A note on pigment methodology. Mar. Ecol. Prog. Ser., 3 : 295-301.
JITTS (H. R.), MOREL (A.) and SAIJO (Y.), 1976. - The relat,ion of oceanic production to available photosynthctic irradiante. Aust. J. Mar. Freshwater Res., 27 : 441-454.
LAWS (E. A.) and ARCAIE (J. W.), 1981. - Appropriate use of regression analysis in marine biology. iMar. Biol., 65 : 13-16.
LE BORGNE (R.), 1981. - Relationships bctween the hydrolo- gical structure, chlorophyll, and zooplankton biomasscs in the Gulf of Guinea. J. Plankton Res., 3 : 577-592.
LE BOUTEILLE~ (A.) et HERBLAND (A.), 1982a. - Synthese de Chlorophylle et production primaire : 13 jours de mesures “in situ” en un point fixe de l’Atlantique Equatorial. Indices biochimiques et milieux marins- Journées du GABIM, Brest, 18-20 nov. 1981 - Publi. CNEXO. Vol. 5. No 14 : 97-121.
LE BOUTEILL~R (A.) and HERBLAND (A.), 1982b. - Diel variation of chlorophyll a as evidenced from a 13 day station in the equaforial Atlantic Ocean. Oceanol. Acta., 5 : 433-441.
LE BOUTEILI.ER (A.), 1982. - La production primaire à l’Equateur dans l’Atlantique Oriental. Relations avec la biomasse phytoplanctonique et la lumiere. These 3~ cycle. Univ. P. et M. Curie Paris 6e. 81 p., ann.
LEMOALLE (J.), 1981. - Photosynthetic product.ion and phytoplankton in the euphotic zone of some african and temperate lakcs. Reu. Hgdrobiol. trop., 14 (1) : 31-37.
LI (W. K. W.), SUBBA RAO (D. Y.), HARRISON (W. G.), SMITH (J. C.), CULLEN (J. J.), IRWIN (B.) and PI.ATT (T.), 1983. - Autotrophic picoplankton in the Tropical Ocean. Science, 219 : 292-295.
LORENZEN (C. J.), 1972. - Ext.inction of light in the ocean by phytoplankton. J. Cons. perm. int. ezp. mer., 34 : 262-267.
LORENZEN (C. J.) and JEFFREY (S. W.), 1980. - Dctermin- ation of chlorophyll in seawater. Report of intcr- calibration tests sponsored by SCOR and carried out in September-October 1978 - UNESCO, Paris (France). 20 p. Unesco tech. Pap. Mer. Sci.
MALONIS (T. Ç.), 1971. - The relative importance of nano- plankton and netplankton as primary producers in tropical and neritic phytoplankton communities. Limnol. Oceanogr., 16 : 633-639.
MCCAHTBY (J. J.) and GOLDMAN (J. C.), 1979. - Nitrogenous nutrition of marine phytoplankton in nutrient-depleted wat.ers. Science, 203 : 670.67%
MENZEL [D. W.) and CORWIN (N.), 1965. - The measurement of total phosphorus in seawater based on the liberation of organically bound fractions by persulfate oxydation. Limnol. Oceanogr., 10 : 280-282.
MOREL (A.) and SMITH (R. C.), 1974. - Relation between total quanta and total energy for aquatic photosynthesis. Limnol. Oceanogr., 19 : 591-600.

MOREL (A.) and Bmçauo (A.), 1981. - Theoretical results concerning light absorption in a discrete medium, and application to specilic absorpLion of phytoplankton. Deep-Sea Res., 28 A : 13751393.
ST~BMANX NIELSEN (E.), 1952. - The use of radioactive carbon (‘“Ci for measuring orpanic production in the sea. J. Cons. perm. infern. Explor. Mer., IS : 117-140.
MORDL (A.), 1978. - Available, usable, and stored radiant energy in relation to marine photosynthesis. Dcep-Sca I-les., 25 : 673-688.
STEEMANN XIELSEN (E.j and HAXSEN (V. K.), 1961. - The primary production in the waters west. of Greenland during Jnly 1958. Rapp. Proc. Verb. Réun., CIEM, 149 : 158-159.
OUDOT (C.), 1983. - Distribution des sels nutritifs (NO, NO, NH, PO&iO,) dans l’Océan Atlantique inter- tropical oriental (région du Golfe de Guinée). Océanogr. trop., 18 (2) : 223-248.
OWENS (T. G.), FALKOWSKI (P. G.) and WHITLEDGE (T. E.;, 1980. - Diel periodicity in cellular chlorophyll content in marine diatoms. Mar. Biol., 59 : 71-77.
YTEEMAKH NIELSEN (E.) and JOR~ENSEN (E. G.), 1962. - The physiological background for using chlorophyll measurements in hydrobiologie and a theory explaining daily variations in chlorophyll concentration. Arc/~. Ilydrobiol., 58 : 349-357.
PETERSON (B. J.), 1980. - Aquatic primary produclivity and the 14C-C0, method: a history of Lhe productivity problem. rlnn. Reu. Ecol. Sysiem., 11 : 359-385.
STRICKLASD (J. 1). 11.) and PARSOXS {T. R.), 1972. - A practical handbook of seawater analysis. RU~. Fish. Res. Hb Can., 167. 311 p.
TA~L!C~~ (S.j, 1976. - Relationship between photosynthesis and ce11 size of marine diatoms. J. Phycol., 12 : 185-189.
PLATT (T.), 1969. - The concept of energy cfficiency in primary production. Limnol. Oceanogr., 14 : 653-659.
PLATT (T.) and Sunua RAO (D. V.), 1970. -.- Primary production measurements on a natural plankton bloom. J. Fish. Res. Bd Can., 27 : 887-899.
TA(:CCHI (S.j, 1980. - Phytoplankton photosynthesis in the subsurface chlorophyll maximum layer of the tropical North Pacillc Ocean. ,J. E:cp. Mar. Biol. Ecol., 43 : 07-98.
PLATT (T.) and SUBKA Rno (D. V.), 1973. - Somc current problems in marine phytoplankton productivity. Fish. Res. Bd Can., Tech. rep., no 370.
PLATT (T.), DENMAN (K. L.) and JARSBY (A. D.j, 1977. - Modeling the productivit,y of phytoplankton in the sea. Thc sea. Vol. 6 : 807~d56.
TCHXIR (V. D.), 1971. - Teneur en chlorophylle a du plancton de la partie orientale de l’Atlantique tropical. in: B les zones productives de l’océan Atlantique Equatorial et les conditions de leur formation 11. Trav. de 1’Atlant NIRO, Kaliningrad. 37 : 191-200. Trad. par 11. ROTSCHI.
PI,ATT (T.), GALLE~~S (C. L.) and HARRISON (W, G.), 1980. - Photoinhibition of photosynthcsis in natural assembl- ages of marine phytoplankton. J. Mar. Res., 38 . 687- 701.
THOMAS (W. H.), 1970. - On nitrogen deficiency in tropica pacifie oceanic phytoplankton: photosynthetic para- meters in poor and rich watcr. Limnol. Oceanogr., 15 : 380-385.
PLATT (T.), SUU~A RAO (D. V.) ami TR~I~ (B.j, 1983. - Photosynthesis of picoplankt.on in the oligotrophic ocean. Nature, 301 : 709.
VO~T~~IEZ (B.), 1981. - Equatorial upwelling in the eastern Atlantic: problems and paradoxes. In: Coastal Upwell- ing. F. A. RICHARDS [cd.], Amer. Geophysical Union 95-106.
RYTHEH (J. H.) and YENTSCII (C. S.), 1957. - The est.imalion of phyloplankton production in the occan from chlor- ophyll and lipht data. Limnol. Oceanogr., 2 : 281-286.
SAIITER (B.), 1979. - A mode1 of physiological adaptation in unicellular algae. J. Theor. Biol., 78 : 519-352.
VOIT[-KItiZ (B.), 11ERnLASo (A.) et LE BORGNE (Ii.;, 1982. -
L’upwelling équatorial dc l’hl.lanliquc Est. pendant 1’Expéricnce Météorologique Mondiale (I’EMG). Oceanol. d4ctn., 5 : 301-314.
SOUHNIA (A.), 1974. Circadian periodicities in natural populations of marine phytoplankton. Rdo. Mar. Biol., 12 : 325-389.
WALSII (J. J.), 1976. -- Herbivory as a factor in pattcrns of nutrient utilization in the sea. Limnol. Oceanogr., 21 : I-13.
STEELE (J. 1.1.) and BAIKD (f. E.j, 1961. - Relations between primary production, chlorophyll and particulate carbon. Limnol. Oceanogr. 6 : M-78.
YENTSCH (C. S.) and MENZRL (D. W.), 1963. - A method for Lhe det,ermination of phytoplankton chlorophyll and phaeophytin fluorescence. Deep Sea Res., 10 : 221-231.
Océanogr. trop. 19 (:Z): 161-179 (1981).
Related Documents