Carbon Finance Schemes in Indonesia - Empirical Evidence of their Impact and Institutional Requirements Dissertation zur Erlangung des Doktorgrades der Fakultät für Agrarwissenschaften der Georg-August-Universität Göttingen vorgelegt von Christina Seeberg-Elverfeldt geboren in Hamburg Göttingen, November 2008

Welcome message from author
This document is posted to help you gain knowledge. Please leave a comment to let me know what you think about it! Share it to your friends and learn new things together.
Transcript
Carbon Finance Schemes in Indonesia - Empirical Evidence of their
Impact and Institutional Requirements
Dissertation
zur Erlangung des Doktorgrades
der Fakultät für Agrarwissenschaften
der Georg-August-Universität Göttingen
vorgelegt von
Christina Seeberg-Elverfeldt
geboren in Hamburg
Göttingen, November 2008

D 7
1. Referent: Prof. Dr. Manfred Zeller 2. Korreferent: PD Dr. Heiko Faust Tag der mündlichen Prüfung: 30. Oktober 2008

To my great friend Silke

Abstract i
ABSTRACT
Solutions are sought throughout the world to counter land and forest conversion processes, as
well as strategies for climate change mitigation. Payments for Environmental Service (PES)
schemes, which are market-based incentives, are promoted as a possibility to enforce or
support sustainable forest management and conservation activities. Using empirical evidence
from the island of Sulawesi in Indonesia, this study provides a contribution to ongoing
research to determine strategies to actively sequester and conserve remaining stocks of
carbon. Farming households in the vicinity of the Lore Lindu National Park contribute to
conversion processes at the forest margin as a result of their agricultural practices and
specifically the expansion of their cacao plantations. The objective is to investigate the impact
of payments for carbon sequestration on the households and their land-use systems, as well as
the institutional framework of such a PES scheme. A comparative static linear programming
model was used to analyse the household behaviour and changes observed due to the
introduction of the policy option of carbon payments. In addition, we discussed and evaluated
the impact of the institutional arrangement of the existing natural resource management
schemes in focus groups in four villages, using participatory rural appraisal tools. If the
carbon credits are specifically targeted towards more sustainable agroforestry systems,
increased environmental benefits in terms of higher carbon sequestration rates, as well as
higher income benefits for the poorer households can be obtained. A PES scheme could build
upon the community conservation agreements, which are in place already, as they provide an
initial basis to reduce transaction costs and integrate the local communities. However, the
participation structures for the villagers, as well as monitoring and enforcement need to be
improved to safeguard the stability of the rainforest margin in the Lore Lindu region.

ii

Summary iii
SUMMARY
On the global scale the forest cover is constantly decreasing and developing countries,
especially those in tropical areas, continue to experience high rates of deforestation. A variety
of contributing factors exist, one of which is agricultural expansion. In turn, deforestation
causes about a quarter of human induced carbon dioxide emissions. Thus, solutions are sought
to counter these land and forest conversion processes, as well as strategies to actively
sequester and conserve the remaining stocks of carbon. Payments for Environmental Service
(PES) schemes are regarded as a possibility to promote the conservation of natural resources,
and are used as market-based incentives to enforce or support sustainable forest management
and conservation activities.
Using empirical evidence from the island of Sulawesi, Indonesia, this study provides a
contribution to ongoing research to determine strategies for climate change mitigation.
Farming households in the vicinity of the Lore Lindu National Park contribute to conversion
processes at the forest margin as a result of their agricultural practices. In this region the area
dedicated to cacao plantations has increased from zero to nearly 18,000 hectares between
1979 and 2001. A reasonable share of these plots has been established inside the 220,000
hectares of the National Park. The objective is therefore, to investigate the impact of
payments for carbon sequestration on the households and their land-use systems, as well as
the institutional framework of such a scheme. At the household level, we explore the potential
of payments as an incentive for the adoption of more environmentally beneficial land-use
systems, and their ability to offer a mechanism for the protection of the rainforest. At the
institutional level, we investigate the structures of the existing community conservation

iv Summary
agreements, and whether they can be used as a platform for a potential payment for carbon
sequestration scheme.
We selected a quantitative and qualitative research design for the analysis. In combining the
different methods, we were able to concentrate on the two levels associated with the PES
schemes and allow for their complementation. We adopted a comparative static linear
programming model to analyse the household behaviour and changes observed due to the
introduction of the policy option of carbon payments. Four cacao agroforestry systems (AFS)
can be distinguished whereby AFS D exhibits a high degree of shading and a low
management intensity, while at the other hand of the spectrum AFS G involves intensive
management and fully sun grown cacao. Cacao gross margins increase when moving along
the cacao AFS intensification gradient from D towards G. An intensification process is
observed with a consequent reduction of the shade tree density. The input data for the model
was obtained in a household survey using a sample of 46 households in six villages. The
households were categorised according to the dominant AFS among their cacao plots into four
classes (HHD – HHG). At the institutional level, we discuss and evaluate the impact of the
institutional arrangement of the community conservation agreements in focus groups in four
villages, using participatory rural appraisal tools. These tools allow for an in-depth insight
into the participation processes and the institutional framework for the agreements, as
perceived by two different social groups, farmers and decision makers.
Results indicate that at the plot level, payments for carbon sequestration are the largest for the
full shade cacao agroforestry system as it has the highest total carbon sequestration potential.
Focusing on the household level, with the introduction of the payments, household D
experiences the most pronounced relative impact on its TGM, ranging from 4 percent with a
low (€5 per tCO2e) to 18 percent with a high (€25 pro tCO2e) carbon credit price. The
corresponding impacts for household G are extremely small. At this range of carbon prices,
none of the households realises any shift in their land-use practices. Economic incentives,
such as price premiums offered through carbon certificates for shade intensive cacao could be
a solution to slow down the intensification process. With differentiated carbon prices of up to
€32 per tCO2e, an incentive is provided for the first three household types to grow the more
shaded cacao AFS. If the current deforestation rate is reduced and prices paid for every ton of
CO2e avoided are €23, the incentive is sufficiently high enough for the household types D, E
and F to stop forest conversion activities. A win-win situation seems to appear, whereby,
when targeting only the shade intensive agroforestry systems with carbon payments, the
poorest households economically benefit the most, the vicious circle of deforestation can be
Summary v
interrupted and land-use systems with high environmental benefits are promoted. If one would
want to implement such a payment scheme for carbon sequestration in the region, the present
institutional arrangement of the community conservation agreements could be used as a
starting point. The agreements provide a regulatory framework and an entity has been
established with the aim of monitoring activities. It addresses illegal activities and the rules
enforcement. Extractive activities have declined and environmental awareness has increased
since the establishment of the institution. Yet, this newly formed institution is not very strong,
due to financial limitations and unclear definitions of responsibilities. Additionally, the
participation of the villagers in the agreement negotiation and formation was restricted,
making the acceptance and compliance with the regulations difficult. Thus, for a potential
PES project the institutional framework needs to be strengthened and community participation
in the conservation activities fostered.
The policy implications derived from this study focus on the applicability of PES schemes as
a strategy for climate change mitigation, their strength and limitations, and institutional
arrangements for their implementation. Depending on the local context, these programmes
provide an improved environmental service with higher carbon sequestration rates. At the
same time they offer stable income sources for the local population and can break the vicious
cycle of poverty and deforestation. Avoided deforestation, among agricultural practices, also
provides a cost-efficient solution for the abatement of greenhouse gases. Local institutional
frameworks used for natural resource management processes should be used as a starting
point for such schemes, as they provide a good basis to reduce transaction costs and integrate
the local communities. However, for PES schemes to be implemented, their applicability to a
specific region needs to be assessed on a case-by-case basis.

vi

Zusammenfassung vii
ZUSAMMENFASSUNG
Auf globaler Ebene gehen jährlich 0,2 Prozent der Waldfläche verloren und in
Entwicklungsländern, insbesondere in den Tropen, sind Entwaldungsraten von bis zu 3
Prozent im Jahr vorzufinden. Die Erweiterung landwirtschaftlicher Nutzflächen gehört zu den
wichtigsten Auslösern für die Umwandlung von Naturwaldflächen zusammen mit
kommerziellem Holzeinschlag und der Ausdehnung der Infrastruktur. Die globale
Entwaldung trägt 25 Prozent zu den menschlich verursachten Kohlenstoffemissionen bei.
Dementsprechend werden Lösungen gesucht, um großflächige Entwaldungen gerade in
tropischen Regionen zu stoppen, und um Maßnahmen zu entwickeln, durch die Kohlenstoff
festgelegt werden kann. So genannte „Zahlungen für Umweltdienstleistungen“ (PES) bieten
die Möglichkeit, Anreizstrukturen für den Schutz natürlicher Ressourcen zu schaffen und
werden als ein marktbasierter Ansatz für Ausgleichszahlungen zur Unterstützung von
nachhaltigem Forstmanagement sowie Naturschutzaktivitäten eingesetzt.
Die vorliegende Studie trägt mit Hilfe einer empirischen Datenerhebung auf der
indonesischen Insel Sulawesi zur Forschung für Klimaschutzstrategien bei. In der Umgebung
des Lore Lindu Nationalparks in Zentral-Sulawesi wird die Abholzung von Regenwald in
erster Linie von ländlichen Haushalten vorangetrieben. Eine besonders expansive Form der
Landnutzung ist in dieser Region der Anbau von Kakao in Agroforstsystemen. Die
Anbaufläche wurde in den letzten 20 Jahren von 0 auf 18.000 Hektar ausgedehnt und neue
Plantagen wurden im Randzonengebiet und teilweise auch innerhalb des 220.000 Hektar
großen Nationalparks angelegt. Das Hauptanliegen dieser Studie ist es, die Auswirkungen
von Ausgleichszahlungen für Kohlenstofffestlegung, so genannte Emissionszertifikate, auf
die lokalen Haushalte und ihre Landnutzungssysteme zu beschreiben und die institutionellen
Rahmenbedingungen für die mögliche Ausführung eines PES Programms zu prüfen. Zum

viii Zusammenfassung
einen wurde auf der Haushaltsebene wurde untersucht, ob Emissionszertifikate als
Anreizmechanismus für a) eine nachhaltige Bewirtschaftung von Agroforstsystemen und b)
einen wirksamen Schutz noch bestehender Regenwaldflächen eingesetzt werden können. Zum
anderen wurden auf der Institutionen-Ebene Naturschutzabkommen (Kesepakatan Konservasi
Masyarakat - KKM), die bereits auf Gemeindeebene bestehen, auf ihr Potential als
Ausgangsbasis für ein PES-Programm für Zahlungen für Kohlenstofffestlegung geprüft.
Die Analysen setzen sich aus einer quantitativen und eine qualitativen Studie zusammen.
Durch die Kombination und Ergänzung der unterschiedlichen Methoden konnten die
unterschiedlichen Ebenen der Haushalte und der Institutionen in PES-Programmen untersucht
werden. Mit Hilfe eines komparativen statischen linearen Programmierungsmodels wurde das
Haushaltsverhalten hinsichtlich möglicher Veränderungen in den Landnutzungsaktivitäten
durch die Einführung der Politikoption der Emissionszertifikate analysiert. Die untersuchten
Kakao-Agroforstsysteme (AFS) wurden in vier Intensivierungskategorien eingeteilt. Dabei
weist das AFS D eine hohe Anzahl von Schattenbäumen und einen geringen Aufwand- und
Materialeinsatz auf, wohingegen das AFS G am anderen Ende des Spektrums sehr intensiv
bewirtschaftet wird und Schattenbäume weitgehend entfernt wurden. Entlang des Kakao-
Intensivierungsgradienten vom AFS D zum AFS G steigen die Deckungsbeiträge der
Kakaoproduktion, was für die Kleinbauern einen ökonomischen Anreiz zur weiteren
Schattenbaumentnahme und Intensivierung der Produktion bietet. Die Datengrundlage dieser
Studie bildet eine Haushaltsumfrage in einer Stichprobe von 46 Haushalten in 6 Dörfern.
Hierfür wurden die Haushalte anhand ihres dominanten Kakao-AFS in vier Typen unterteilt
(HHD-HHG). Zur Auswertung der institutionellen Rahmenbedingungen für PES Programme
wurden in vier Dörfern die Auswirkungen der Naturschutzabkommen in Fokusgruppen
diskutiert. Mit Hilfe partizipativer Methoden konnte die Wahrnehmung bezüglich der
Partizipationsprozesse und institutionellen Rahmenbedingungen in zwei verschiedenen
sozialen Gruppen, den Entscheidungsträgern und den Bauern, herausgearbeitet werden.
Die erforderlichen Zahlungen für Kohlenstofffestlegung sind für das AFS D mit der
dichtesten Schattenkrone am höchsten, da es das größte Kohlenstoffspeicherungspotential hat.
Auf Haushaltsebene sind die relativen Auswirkungen durch die Zahlung auf den
Gesamtdeckungsbeitrag für den Haushalt D am stärksten ausgeprägt und variieren zwischen 4
Prozent (€5 pro tCO2e) bis 18 Prozent mit Preisen von €25 pro tCO2e. Hingegen sind die
Auswirkungen für den Haushalt G sehr gering. Mit den Zertifikatspreisen, die zurzeit auf den
Märkten gehandelt werden, kann kein ausreichender finanzieller Anreiz für
Landnutzungsveränderungen sichergestellt werden. Preisaufschläge durch
Zusammenfassung ix
Kohlenstoffzertifikate für den schattenintensiven Kakao bieten Lösungsansätze, um den
Intensivierungsprozess zu reduzieren. Die Ergebnisse zeigen, dass durch differenzierte
Emissionszertifikatspreise bis €32 pro tCO2e Anreize für die Haushaltstypen D, E und F
geschaffen werden, so dass diese zu den jeweils schattenreicheren AFS wechseln. Damit die
Haushaltstypen D, E und F ihre Abholzungsaktivitäten einstellen und um die momentane
Entwaldungsrate von 0,3 Prozent zu reduzieren, müssten die Zertifikate einen Preis bis
maximal 23€ pro vermiedene Tonne CO2e aufweisen. Die dem schattenintensiven AFS D
beigeordneten Haushalte gehören gleichzeitig zu dem einkommensschwächsten Drittel der
Bevölkerung. Durch zielgerichtete kohlenstoffbasierte Ausgleichszahlungen für die
schattenreichen AFS bieten sich Lösungen an, insbesondere für diese ärmeren Haushalte den
Teufelskreis von Entwaldung und Armut unterbrechen, sowie ihr Einkommen zu verbessern
und gleichzeitig die AFS Typen, die den größten Umweltnutzen bieten, zu fördern. Wenn
man ein CO2-Speicherungsprojekt in der Region implementieren wollte, können die
institutionellen Gefüge der regional existenten Naturschutzabkommen als Ausgangspunkt
genutzt werden. Diese lokalen Institutionen bieten neben einem Regelwerk auch eine Instanz,
die Kontrollaktivitäten durchführt. Die KKM befassen sich mit der Kontrolle illegaler
Landnutzungsaktivitäten und der Einhaltung der Gesetze zum Schutz des Waldes.
Rodungsaktivitäten sind zurückgegangen und das Umweltbewusstsein der Dorfbewohner hat
zugenommen, seitdem die Abkommen etabliert wurden. Die Umsetzung der KKM ist jedoch
finanziell nicht gut abgesichert und die Verantwortlichkeiten wurden auf Dorfebene zwischen
den verschiedenen Institutionen nicht klar festgelegt. Zudem war die Beteiligung der
Dorfbewohner bei den Verhandlungen und der Etablierung der Abkommen sehr gering, was
eine schlechte Akzeptanz unter der Bevölkerung und damit auch eine unzureichende
Einhaltung der Gesetze zur Folge hatte. Für ein potentielles PES-Projekt müssen die
institutionellen Rahmenbedingungen gestärkt und die Partizipation der Bevölkerung in den
Naturschutzaktivitäten unterstützt werden.
Die Politikempfehlungen, die aus den Ergebnissen dieser Studie abzuleiten sind, beziehen
sich auf die Anwendbarkeit der PES-Programme als eine mögliche Klimaschutzstrategie, ihre
Stärken, Schwächen und ihre institutionelle Gestaltung. Abhängig vom lokalen Kontext
können erhöhte Kohlenstofffestlegungsraten durch PES-Programme gefördert werden. Zudem
werden stabile Einkommensstrukturen für die lokale Bevölkerung ermöglicht und der
Teufelskreis von Armut und Abholzung kann unterbrochen werden. Im Vergleich zu anderen
landwirtschaftlichen Aktivitäten bietet die verhinderte Abholzung eine kosteneffiziente
Möglichkeit, um den Ausstoß von Treibhausgasen zu mindern. Lokale Institutionen, die für

x Zusammenfassung
das Management von natürlichen Ressourcen genutzt werden, bieten eine gute Basis für
potentielle PES-Programme, da durch die Nutzung vorhandener Strukturen
Transaktionskosten reduziert und die lokale Bevölkerung eingebunden werden können.
Ringkasan xi
RINGKASAN
Negara-negara berkembang khususnya yang terletak di daerah tropis menghadapi tingkat
penebangan hutan (deforestasi) yang tinggi. Demikian juga di tingkat global, wilayah hutan
secara konstan semakin mengalami penurunan. Berbagai faktor melatar-belakangi hal ini,
yang salah satunya dikarenakan oleh peningkatan penggunaan lahan pertanian. Di sisi lain,
seperempat dari karbon emisi yang dihasilkan oleh manusia diakibatkan oleh kegiatan
deforestasi tersebut. Berdasarkan hal-hal di atas, diupayakan untuk mencari solusi dalam
mengatasi masalah proses peralihan lahan dan hutan dan juga dibutuhkan strategi-strategi
aktif untuk mengamankan cadangan karbon yang masih tersedia. Program atau skema
pembayaran atas jasa lingkungan adalah salah satu cara yang berpotensi untuk
mempromosikan perlindungan terhadap sumber daya alam, yang didasari atas insentif pasar
dalam mencanangkan atau mendukung kelestarian perlindungan hutan dan alam.
Penelitian ini adalah hasil dari pengamatan empirik di wilayah Sulawesi Tengah Indonesia,
yang hasil penelitiannya menyumbangkan strategi-strategi untuk mengurangi dampak dari
perubahan cuaca global pada suatu proyek penelitian yang saat ini masih berlangsung.
Keluarga-keluarga petani yang berada di sekitar wilayah taman Nasional Lore Lindu berperan
dalam proses peralihan lahan dari hasil kegiatan pertanian mereka. Dalam kurun waktu 20
tahun, wilayah yang diperuntukan bagi perkebunan cokelat bertambah dari 0 hektar menjadi
18.000 hektar. Dimana kebun-kebun cokelat yang berada di dalam wilayah taman nasional
mempunyai bagian jumlah yang cukup penting. Tujuan dari penelitian ini adalah untuk
menganalisa pengaruh dari pembayaran atas pemisahan (sequestrasi) karbon dan sistem
penggunaan lahan oleh keluarga petani, dan juga untuk meneliti kerangka kerja satu instutitusi
atau badan dari program kegiatan tersebut. Di tingkat petani kami meneliti jumlah
pembayaran potensial untuk mengadopsi sistem pengunaan lahan yang ramah lingkungan

xii Ringkasan
yang mampu menawarkan mekanisme perlindungan hutan. Di tingkat badan atau institusi,
kami meneliti struktur yang ada dalam masyarakat tentang kesepakatan konservasi atau
perlindungan alam.
Untuk tujuan penelitian, kami melaksanakan penelitian berdasarkan metode kuantitatif dan
kualitafif. Dengan mengkombinasikan berbagai metode kami dapat mengkonsentrasikan pada
dua tingkatan yang dihubungkan dengan program pembayaran jasa lingkungan, dan dapat
memungkinkan metode tersebut untuk saling melengkapi. Untuk menganalisa perilaku rumah
tangga dan perubahan yang terjadi dikarenakan oleh pengenalan akan pilihan kebijakan dari
pembayaran karbon, kami menerapkan suatu perbandingan dengan menggunakan program
linier statis. Sistem agroforestri cokelat dikelompokan atas empat tipe. Tipe D
menggambarkan tingkat tanaman peneduh yang tinggi dan intensitas manajemen yang rendah.
Sebaliknya, tipe G melibatkan intensitas manajemen yang tinggi dengan pencahayaan
matahari penuh dalam penanaman cokelat. Besar margin kotor dari cokelat akan bertambah
dengan intensitas gradien dari sistem agroforestri cokelat dari tipe D ke tipe G. Proses
intensitas tersebut dipantau dari runtutan menurunnya densitas tanaman pelindung atau
naungan. Data untuk pemodelan bersumber dari survei di tingkat rumah tangga yang
dihasilkan dari empat puluh enam keluarga yang berlokasi di enam desa. Rumahtangga
tersebut dikelompokkan berdasarkan atas sistem agroforestri yang paling dominan pada kebun
cokelat mereka yang terbagi dalam empat kelompok yaitu dari kelompok HHD sampai HHG.
Di tingkat institusi, kami membahas dan mengevaluasi dampak dari pembentukan institusi
dalam kesepakatan konsevasi masyarakat dalam satu wadah kelompok khusus yang
bersumber dari empat desa. Dengan menggunakan cara ini, memungkinkan pemahaman yang
lebih mendalam tetang proses partisipasi dan kerangka kerja dari kesepakatan-kesepakatan
yang terdiri dari dua kelompok sosial yang berbeda.
Hasil penelitian menggambarkan bahwa di tingkat area penanaman, pembayaran untuk
sequestrasi karbon lebih tinggi untuk sistem agroforestri dengan naungan penuh karena
memiliki nilai tertinggi untuk total karbon yang disequestrasi. Dengan memfokuskan pada
tingkat rumah tangga sebagai hasil pengenalan sistem pembayaran tersebut, kelompok HHD
adalah yang paling menunjukkan dampak relatif atas total margin kotor mereka, yang bernilai
empat persen saat harga yang ditawarkan rendah sampai dengan nilai margin delapan belas
persen untuk tawaran pembayaran harga karbon yang tinggi. Sedangkan dampak dari
kelompok HHG menunjukan nilai yang sangat rendah. Pada skala besaran ini, tidak satupun
dari rumah tangga menyadari adanya perubahan dalam kegiatan penggunaan lahan mereka.
Insentif ekonomi seperti pembayaran harga premium ditawarkan melalui pemberian sertifikasi

Ringkasan xiii
atas intensitas naungan dapat menjadi salah satu cara untuk menurunkan proses intensitas.
Insentif disediakan bagi tiga kelompok rumah tangga dengan membedakan harga karbon
sampai dengan nilai tiga puluh dua Euro per ton karbondioksida equivalen, agar mereka
menanam lebih banyak tanaman naungan untuk cokelat. Misalkan tingkat deforestasi yang
sekarang ada menjadi menurun dan harga yang dibayarkan untuk setiap ton karbondioksida
equivalen adalah dua puluh tiga Euro, insentif yang diberikan masih cukup tinggi untuk
kelompok rumah tangga D, E dan F untuk menghentikan kegiatan peralihan hutan. Situasi
win-win akan didapatkan dengan hanya mentargetkan intensitas naungan dalam sistem
agroforestri melalui pembayaran karbon. Rumahtangga-rumahtangga miskin adalah yang
paling memperoleh keuntungan ekonomi, sehingga lingkaran setan dari kegiatan deforestasi
dapat dihentikan dan sistem penggunaan lahan yang menguntungkan bagi lingkungan dapat
dipromosikan. Jika program pembayaran atas sequestrasi kabon hendak diimplementasikan di
suatu wilayah, maka bentuk institusi yang sudah ada seperti kelompok kesepakatan
konservasi dapat dijadikan sebagai titik awal pelaksanaan kegiatan. Kelompok ini mewadahi
kerangka kerja aturan dan kepemilikan yang sudah terbentuk didasarkan atas kesepakatan,
yang dapat digunakan sebagai landasan untuk kegiatan monitoring. Dimana telah mencakup
aktifitas kegiata-kegiatan illegal dan penegakkan aturan atas tindakan pelanggaran tersebut.
Disebabkan oleh pembentukan badan ini, kegiatan ekstrasi menjadi menurun dan kesadaran
lingkungan meningkat. Akan tetapi, pembentukan badan baru ini belum kuat dikarenakan
terbatasnya ketersediaan dana dan definisi tanggungjawab yang belum jelas. Di samping itu,
keterlibatan masyarakat desa dalam negosiasi kesepakatan dan proses pembentukan sangat
terbatas, membuat penerimaan dan pemenuhan aturan-aturan menjadi sulit. Berdasarkan hal
tersebut, untuk satu proyek pembayaran karbon yang potensial dibutuhkan kerangka kerja
institusi yang kuat dan juga penerapan partisipasi komunitas atas kegiatan konservasi.
Implikasi kebijakan yang dihasilkan dari studi ini dikhususkan pada penerapan program
pembayaran karbon sebagai strategi untuk mengurangi dampak buruk dari perubahan cuaca
global, dan juga mencakup kekuatan dan keterbatasan pembentukan institusi untuk penerapan
pelaksanaanya. Berdasarkan atas konteks daerah, program-program ini menyediakan jasa
lingkungan yang lebih baik dengan tingkat sequestrasi karbon yang tinggi. Bersamaan dengan
itu, program jasa pembayaran lingkungan menawarkan sumber pendapatan yang stabil bagi
masyarakat setempat dan dapat mematahkan lingkaran setan dari kemiskinan dan deforestasi.
Selain itu, deforestasi dalam kegiatan pertanian dapat dihindarkan dengan menyediakan solusi
dengan biaya efisien untuk mengurangi dampak efek rumah kaca. Kerangka kerja institusi
lokal digunakan untuk proses manajemen sumberdaya alam sebaiknya dimanfaatkan untuk

xiv Ringkasan
program kegiatan tersebut, didasarkan atas ketersediaan basis yang baik untuk mengurangi
biaya transaksi dan juga untuk mengintegrasikan komunitas lokal. Akan tetapi, untuk
mengimplementasikan sistem pembayaran karbon, kemampuan aplikasi program di setiap
wilayah lokal perlu dikaji berdasarkan setiap kasus.

Acknowledgements xv
ACKNOWLEDGEMENTS
There are various people and institutions in Germany and Indonesia who have helped and
accompanied me during the last three years in the process of working on this dissertation.
Each of them supported my work in a different way. First of all, I would like to thank the
DFG for funding my field research. I want to express my gratitude to my first supervisor Prof.
Dr. Manfred Zeller for making this research possible and accepting a completely new topic
for a PhD study, as well as scientific support and advice during this time. I am thankful to PD
Dr. Heiko Faust, my second supervisor, for guidance and valuable comments on my
qualitative investigation, and Prof. Dr. Hartwig de Haen for being my examiner and important
feedback on the quantitative analysis and results. Finally, I would like to acknowledge the
support of Dr. Stefan Schwarze, who always supported and encouraged me and took his time
to discuss resurfacing calculations or doubts, the results and implications, as well as titles with
me.
Many people in the villages of Sidondo II, Kapiroe, Wuasa, Berdikari, Lempelero, Sintuwu,
Bulili, Maranata, Salua and Langko have kindly responded the questionnaires or participated
in the focus group discussions; thank you very much for the answers, without which my
research would not have been possible. Furthermore, I am grateful for board and lodging
which was provided to us in the villages and has given me an insight into Indonesian culture.
My enumerators, Sumarno, Pipin and Rifai have done a great job conducting all the
interviews, my assistants Mina, Nia and Ira have assisted me with “Understanding Palu,
Indonesians and their culture better” – terima kasih to all of you for your work! Without the
help of Eka’s transcription and Mina’s, Ira’s and Anjar’s translations, the interviews would
have remained a mystery to me! I am grateful to all STORMA staff both in Göttingen and
Palu who have helped me with a smooth and fantastic investigation time.

xvi Acknowledgements
My warmest thanks are due to Prof. Dr. Matin Qaim and the Department of Agricultural
Economics and Rural Development at the University of Goettingen for generous logistic and
financial support.
Furthermore, I would like to express my gratitude to PD Dr. Roland Olschewski for giving me
the kick-off into the Carbon Finance topic.
A variety of people have helped me with comments on methodology, content, writing and
proof-reading. I am indebted to Kerstin, Klaus, Stefan, Jana, Christin, Sunny and Julia, as well
as Amy Turner, Dr. Hans-Joachim Budde, and Prof. Dr. Stephan von Cramon-Taubadel.
Alongside the research I have enjoyed the company of many friends who have been there for
mental support and encouragement, Karaoke singing, coffee sessions, office and house
sharing! Thank you for accompanying me Kerstin, Julia, Patrick, Esther, Lucía, Meike, Jana,
Isti, Stefan, Christin, Lisa, Xenia and Silke; as well as the Kaffeerunde at the “old” Institute of
Rural Development and my brothers Alexander, Johannes and Matthäus.
Finally, I want to thank my parents for their unconditional support throughout all my
endeavours in this world!
Christina Seeberg-Elverfeldt
Göttingen, September 2008

Table of Contents xvii
TABLE OF CONTENTS
Abstract ....................................................................................................................................... i
Summary...................................................................................................................................iii
Zusammenfassung................................................................................................................... vii
Ringkasan ................................................................................................................................. xi
Acknowledgements .................................................................................................................. xv
Table of Contents................................................................................................................... xvii
List of Tables ........................................................................................................................... xx
List of Figures ........................................................................................................................ xxi
List of Abbreviations ............................................................................................................xxiii
Part I Introduction & Theory
1. Introduction ........................................................................................................................... 1
1.1. Meeting Challenges posed through Climate Change ............................................ 1
1.2. Objectives of the Investigation ................................................................................ 3
1.3. Structure of the Study.............................................................................................. 4
2. Carbon Finance – Political Background and Discussion ................................................... 7
2.1. Regulatory Context and Markets ........................................................................... 7 2.1.1. Market Overview................................................................................................ 8 2.1.2. Kyoto Protocol and the Compliance Market.................................................... 10
2.2. Forestry Sector ....................................................................................................... 12 2.2.1. Main Criteria, Relevant Rules and Decisions .................................................. 13 2.2.2. Voluntary Initiatives......................................................................................... 15 2.2.3 Carbon Credit Prices ........................................................................................ 17
2.3. Situation in Indonesia ............................................................................................ 18
2.4. Outlook.................................................................................................................... 20
2.5. Summary ................................................................................................................. 21
xviii Table of Contents
3. A Theoretical Framework to Analyse Payments for Environmental Service Schemes.... 23
3.1. Introduction ............................................................................................................ 23
3.2. Externalities as a Source of Market Failure ........................................................ 24
3.3. Payments for Environmental Services as an Incentive-Based Mechanism ...... 26 3.3.1. Typology of Environmental Services............................................................... 28 3.3.2. Payments for Forest Carbon Sequestration ...................................................... 30 3.3.3. Linkages between Payments for Environmental Services and Poverty ........... 31
3.4. New Institutional Economics, Institutions and Transaction Costs.................... 33
3.5. Conceptual Framework for the Analysis ............................................................. 36
3.6. Summary ................................................................................................................. 38 Part II Methodology
4. Research Area...................................................................................................................... 39
4.1. Geographical and Biophysical Conditions.......................................................... 39
4.2. Socio-economic Background ................................................................................ 41
4.3. Land-use Dynamics in the Lore Lindu Region................................................... 42
4.4. Summary ................................................................................................................ 44
5. Quantitative Research Design............................................................................................. 45
5.1. Data Collection ....................................................................................................... 45
5.2. Carbon Accounting Methodology......................................................................... 46 5.2.1. Carbon Fixation Rates of Agroforestry Systems.............................................. 49 5.2.2. Carbon Sequestration Rates for Avoided Deforestation .................................. 56
5.3. Methodology for Data Modelling.......................................................................... 58 5.3.1 Potential Methodological Approaches and Model Types ................................ 58 5.3.2. Linear Programming Models ........................................................................... 59 5.3.3. Models of Carbon Sequestration Economics ................................................... 63 5.3.4. Present Model Specifications ........................................................................... 63
5.4. Summary ................................................................................................................. 66
6. Qualitative Research Design.............................................................................................. 67
6.1. Methodology for Analysis of Institutional Framework ...................................... 67 6.1.1. Data Collection................................................................................................. 70 6.1.2. Participatory Rural Appraisal Tools................................................................. 73
6.2. Focus Groups .......................................................................................................... 76
6.3. Content Analysis..................................................................................................... 79
6.4. Summary ................................................................................................................. 81
Table of Contents xix
Part III Results & Conclusions
7. Carbon Payments for Agroforestry Systems....................................................................... 83
7.1. Farm Household Modelling................................................................................... 83 7.1.1. Farm Households in the Lore Lindu Region.................................................... 83 7.1.2. Model Inputs .................................................................................................... 84 7.1.3. Objective Function Coefficients....................................................................... 89 7.1.4. Model Formulation........................................................................................... 91 7.1.5. Assumptions of the Linear Programming Model ............................................. 93 7.1.6. Baseline Results ............................................................................................... 95
7.2. Linear Programming Model Scenarios ................................................................ 98 7.2.1. Impact of Changing Prices of Carbon and Cacao ............................................ 99 7.2.2. Incentives for Environmentally Friendly Agroforestry Systems ................... 103 7.2.3. “Cash Crop First?” Scenario .......................................................................... 104 7.2.4. Reducing Emissions from Deforestation and Forest Degradation ................. 105
7.3. Discussion.............................................................................................................. 108
7.4. Summary ............................................................................................................... 112
8. Institutional Arrangements for Carbon Sequestration Projects...................................... 113
8.1. Analysis of Payments for Environmental Service Schemes ............................. 113 8.1.1. Community Conservation Agreements: State of the Art in 2006 .................. 116 8.1.2. Monitoring and Enforcement ......................................................................... 117 8.1.3. Participation of Villagers in the Community Conservation Agreements....... 119
8.2. Empirical Results of the Community Conservation Agreements’ Analysis ... 120 8.2.1 Self-assessment of Changes in Resource Management Processes................. 120 8.2.2. Impact of the Agreements on Natural Resource Management ...................... 124
8.3. Discussion.............................................................................................................. 130
8.4. Summary ............................................................................................................... 133
9. Conclusions ....................................................................................................................... 135
9.1. Synthesis of Results .............................................................................................. 135
9.2. Strengths and Limitations of the Study and Further Research....................... 137
9.3. Policy Implications and Recommendations ....................................................... 140
References.............................................................................................................................. 143
Appendix ................................................................................................................................ 157
xx List of Tables
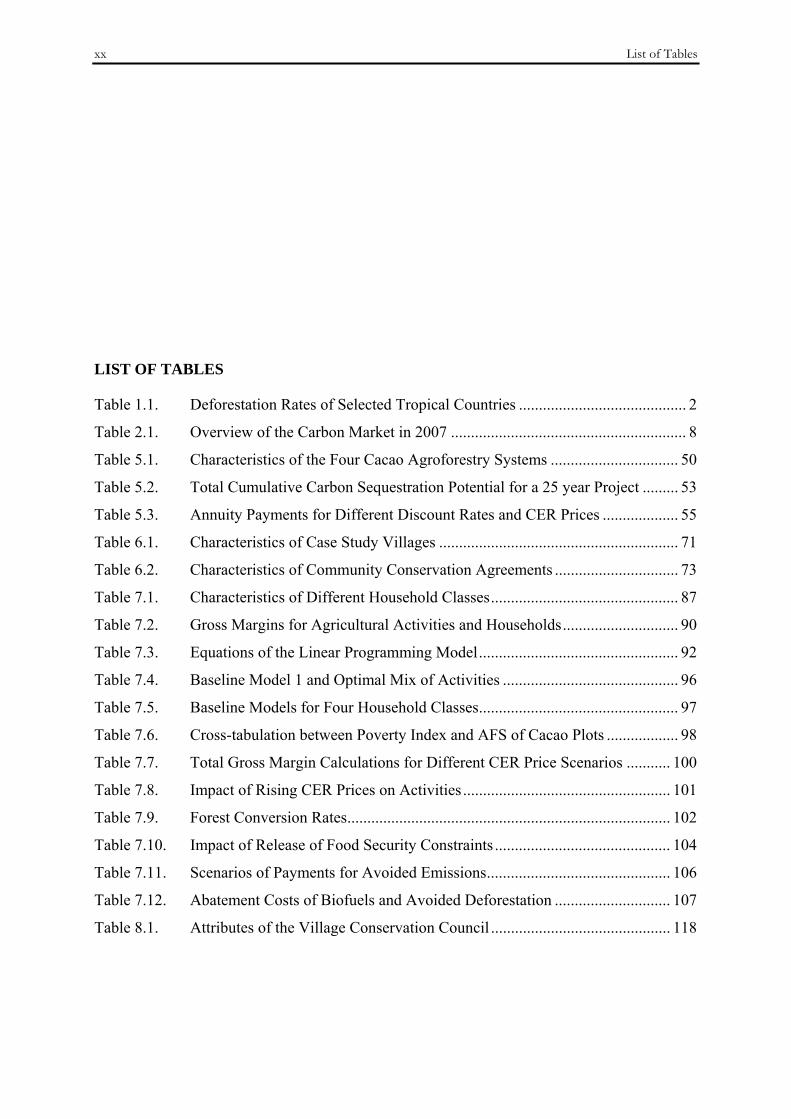
LIST OF TABLES
Table 1.1. Deforestation Rates of Selected Tropical Countries .......................................... 2
Table 2.1. Overview of the Carbon Market in 2007 ........................................................... 8
Table 5.1. Characteristics of the Four Cacao Agroforestry Systems ................................ 50
Table 5.2. Total Cumulative Carbon Sequestration Potential for a 25 year Project ......... 53
Table 5.3. Annuity Payments for Different Discount Rates and CER Prices ................... 55
Table 6.1. Characteristics of Case Study Villages ............................................................ 71
Table 6.2. Characteristics of Community Conservation Agreements ............................... 73
Table 7.1. Characteristics of Different Household Classes............................................... 87
Table 7.2. Gross Margins for Agricultural Activities and Households............................. 90
Table 7.3. Equations of the Linear Programming Model.................................................. 92
Table 7.4. Baseline Model 1 and Optimal Mix of Activities ............................................ 96
Table 7.5. Baseline Models for Four Household Classes.................................................. 97
Table 7.6. Cross-tabulation between Poverty Index and AFS of Cacao Plots .................. 98
Table 7.7. Total Gross Margin Calculations for Different CER Price Scenarios ........... 100
Table 7.8. Impact of Rising CER Prices on Activities .................................................... 101
Table 7.9. Forest Conversion Rates................................................................................. 102
Table 7.10. Impact of Release of Food Security Constraints ............................................ 104
Table 7.11. Scenarios of Payments for Avoided Emissions.............................................. 106
Table 7.12. Abatement Costs of Biofuels and Avoided Deforestation ............................. 107
Table 8.1. Attributes of the Village Conservation Council ............................................. 118

List of Figures xxi
LIST OF FIGURES
Figure 2.1. Number (%) of CDM Projects in each Category ............................................. 13
Figure 3.1. A Tax on a Negative Externality...................................................................... 25
Figure 3.2. A Pigouvian Subsidy on a Positive Externality ............................................... 27
Figure 3.3. Breakdown of PES Programmes in the Forest Sector...................................... 28
Figure 3.4. Framework for the Twofold Analysis of PES Schemes................................... 36
Figure 3.5. Framework for Analysis of the KKM Institution............................................. 37
Figure 4.1. Location of Lore Lindu National Park in Sulawesi, Indonesia ........................ 39
Figure 4.2. Research Region............................................................................................... 40
Figure 5.1. Cumulative Carbon Storage of the AFS D and Temporary CER .................... 52
Figure 7.1. The Modelling Approach ................................................................................. 86
Figure 7.2. Vicious Cycle of Poverty and Deforestation.................................................. 110
Figure 8.1. Frequency of Mentioned Topics .................................................................... 121
Figure 8.2. Evaluation of the Topic “Institution” ............................................................. 121
Figure 8.3. Evaluation of the Topic “Participation” ......................................................... 122
Figure 8.4. Evaluation of the Topic “Monitoring” ........................................................... 123
Figure 8.5. Evaluation of the Topic “Resource Extraction”............................................. 123

xxii

List of Abbreviations xxiii
LIST OF ABBREVIATIONS
A/R Afforestation and Reforestation
BPD Badan Perwakilan Desa (Village Representative Body)
BTNLL Balai Taman Nasional Lore Lindu (Lore Lindu National Park Administration)
CCX Chicago Climate Exchange
CDM Clean Development Mechanism
CER Certified Emission Reductions
CIFOR Centre for International Forestry Research
CO2 Carbon Dioxide
CO2e Carbon Dioxide Equivalents
COP Conference of the Parties
CSIADCP Central Sulawesi Integrated Area Development and Conservation Project
dbh Diameter at Breast Height
DNA Designated National Authority
EU ETS European Union Emission Trading Scheme
EUA European Emissions Allowances
FAO Food and Agricultural Organisation
GDP Gross Domestic Product
GEF Global Environmental Facility
GHG Greenhouse Gas
ha hectare
IDR Indonesian Rupiah
KKM Kesepakatan Konservasi Masyarakat (Community Conservation Agreement)
LA Lembaga Adat (Customary Village Council)

xxiv List of Abbreviations
LKD Lembaga Konservasi Desa (Village Conservation Council)
LULUCF Land-Use, Land-Use Change and Forestry
m.a.s.l. meters above sea level
MPB Marginal Private Benefit
MPC Marginal Private Cost
MSB Marginal Social Benefit
MSC Marginal Social Cost
NGO Non-Governmental Organisation
NPV Net Present Value
NSW GGAS New South Wales Greenhouse Gas Abatement Scheme
NTFP Non-Timber Forest Products
OECD Organisation for Economic Co-operation and Development
OTC Over-The Counter Market
PEI Persatuan Evergreen Indonesia (Association of Evergreen Indonesia)
REDD Reduced Emissions from Deforestation and Degradation
RUPES Rewarding the Upland Poor for Ecosystem Services
STORMA STability Of Rainforest MArgins
t ton
TGM Total Gross Margin
TNC The Nature Conservancy
TNLL Taman Nasional Lore Lindu (Lore Lindu National Park)
UNFCCC United Nations Framework Convention on Climate Change
VER Verified Emission Reductions
yr year
YTM Yayasahn Tanah Merdeka (Free Land Foundation)

Chapter 1 1
1. INTRODUCTION
1.1. Meeting Challenges posed through Climate Change
In recent years scientific evidence has been growing that climate change presents a serious
risk to humanity, and requires action to mitigate its effects. Investigations demonstrate that a
70 percent increase in atmospheric carbon dioxide (CO2) and other greenhouse gas (GHG)
emissions can be attributed to human activities between 1970 and 2004 (IPCC 2007). The
major sources of these anthropogenic CO2 emissions are fossil fuel combustion and cement
production (75 percent) and land-use changes (approximately 25 percent) (IPCC 2007). The
major factors of these land-use change emissions are deforestation, as well as changing
agricultural practices. Developing countries, especially those in tropical areas, continue to
experience high rates of deforestation, but also on a global scale the forest cover is constantly
decreasing. Between 1990 and 2005, the world lost three percent of its total forest area, an
average decrease of 0.2 percent annually (FAO 2007). Primary forests, of which a high
proportion are located in tropical countries, are lost or modified at a rate of six million
hectares per year because of selective logging or deforestation, and there is no indication that
the rate is slowing (FAO 2006). Some of the highest deforestation rates in absolute numbers
are shown in the following Table 1.1.
The drivers of deforestation are very complex, making it a difficult issue to tackle on a
national scale. Five broad categories can be determined as underlying driving forces of
deforestation. These are demographic, economic, technological, policy and institutional and
cultural factors. In general, at the proximate level, infrastructure extension, agricultural
expansion, as well as wood extraction are the main causes of tropical deforestation and land-
use change (Geist and Lambin 2002). The majority of deforestation incidences are connected
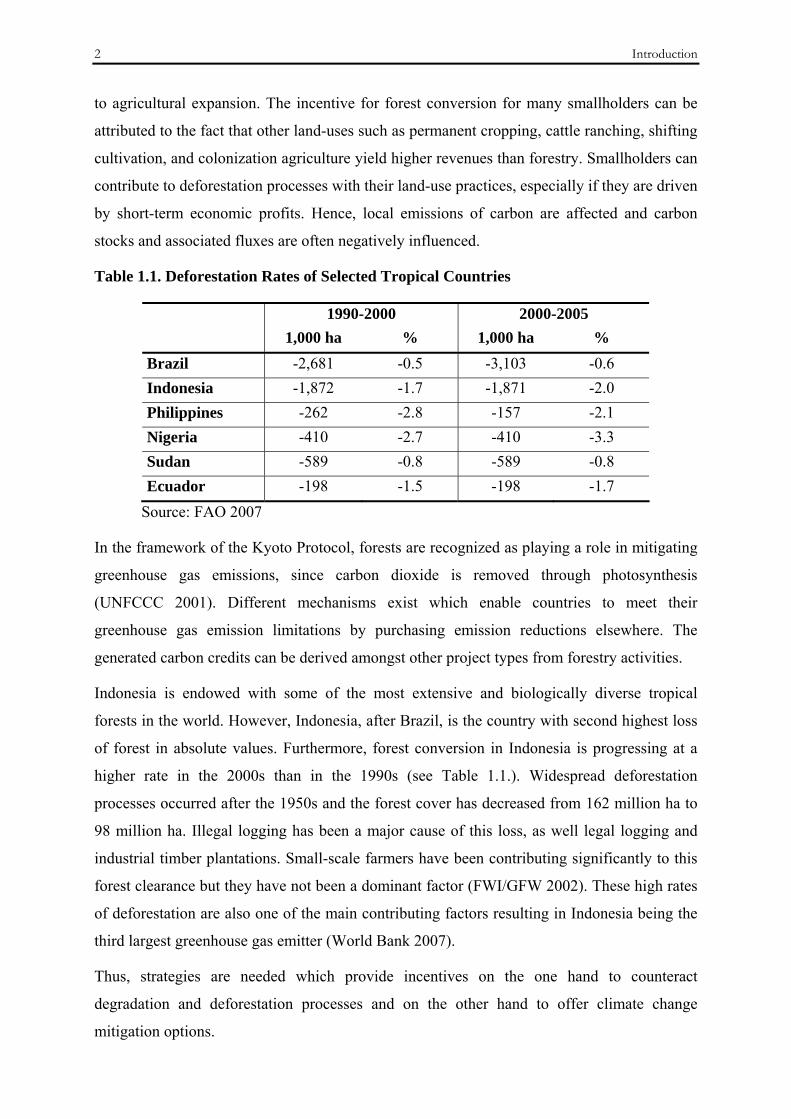
2 Introduction
to agricultural expansion. The incentive for forest conversion for many smallholders can be
attributed to the fact that other land-uses such as permanent cropping, cattle ranching, shifting
cultivation, and colonization agriculture yield higher revenues than forestry. Smallholders can
contribute to deforestation processes with their land-use practices, especially if they are driven
by short-term economic profits. Hence, local emissions of carbon are affected and carbon
stocks and associated fluxes are often negatively influenced.
Table 1.1. Deforestation Rates of Selected Tropical Countries
1990-2000 2000-2005 1,000 ha % 1,000 ha % Brazil -2,681 -0.5 -3,103 -0.6 Indonesia -1,872 -1.7 -1,871 -2.0 Philippines -262 -2.8 -157 -2.1 Nigeria -410 -2.7 -410 -3.3 Sudan -589 -0.8 -589 -0.8 Ecuador -198 -1.5 -198 -1.7
Source: FAO 2007
In the framework of the Kyoto Protocol, forests are recognized as playing a role in mitigating
greenhouse gas emissions, since carbon dioxide is removed through photosynthesis
(UNFCCC 2001). Different mechanisms exist which enable countries to meet their
greenhouse gas emission limitations by purchasing emission reductions elsewhere. The
generated carbon credits can be derived amongst other project types from forestry activities.
Indonesia is endowed with some of the most extensive and biologically diverse tropical
forests in the world. However, Indonesia, after Brazil, is the country with second highest loss
of forest in absolute values. Furthermore, forest conversion in Indonesia is progressing at a
higher rate in the 2000s than in the 1990s (see Table 1.1.). Widespread deforestation
processes occurred after the 1950s and the forest cover has decreased from 162 million ha to
98 million ha. Illegal logging has been a major cause of this loss, as well legal logging and
industrial timber plantations. Small-scale farmers have been contributing significantly to this
forest clearance but they have not been a dominant factor (FWI/GFW 2002). These high rates
of deforestation are also one of the main contributing factors resulting in Indonesia being the
third largest greenhouse gas emitter (World Bank 2007).
Thus, strategies are needed which provide incentives on the one hand to counteract
degradation and deforestation processes and on the other hand to offer climate change
mitigation options.

Chapter 1 3
1.2. Objectives of the Investigation
This study was conducted in the Lore Lindu region in Central Sulawesi, Indonesia. It is part
of the sub-project A4 of the research programme “Stability of Rainforest Margins in
Indonesia” (STORMA) carried out by two Indonesian Universities (Institut Pertanian Bogor
and Universitas Tadulako, Palu) and two German Universities (Universität Kassel and Georg-
August Universität Göttingen). The project is supported by the German Research Foundation
(DFG) as a Collaborative Research Centre (SFB 552).
The population living in the vicinity of the Lore Lindu National Park (Taman Nasional Lore
Lindu - TNLL) is predominantly engaged in agricultural activities. The most important crops
are paddy rice for subsistence, as well as cacao, the dominant cash crop in the region. A
“cacao boom” has taken place in the region, and its cultivation has risen by 230 percent over
the last two decades (Steffan-Dewenter et al. 2007). The primary and secondary forest margin
of the 220.000 hectares of the National Park forest has been encroached by smallholders in
their pursuit of agricultural land (Burkard 2002). In addition, an intensification process among
the cacao agroforestry systems, whereby farmers gradually remove the shade tree cover and
adopt more input-intensive practices, can be observed. As a measure to resolve conflicts
between peoples’ needs and conservation demands of the National Park, in several villages
community conservation agreements (Kesepakatan Konservasi Masyarakat - KKM) have
been established. These are a co-management strategy and have been negotiated between the
village community and the TNLL authority (Balai Taman Nasional Lore Lindu - BTNLL) in
co-operation with several non-governmental organisations (NGOs).
The objective of the study is twofold and assesses distinct components at two different levels.
We are evaluating the market-based instrument of payments for environmental services (PES)
and its impact at the household level, as well as the requirements for its institutional
arrangement. Specifically, we explore at the household level:
I. The impact of payments for carbon sequestration activities on the land-use systems
of smallholders in the regions bordering the TNLL in Indonesia.
II. Furthermore, we assess whether such payments can provide an incentive for the
adoption of more sustainable and shade tree covered land-use practices.
III. Finally, whether the payments for avoiding deforestation can contribute to the
conservation of the rainforest margin.
4 Introduction
At the institutional level, we aim to explore the necessary conditions and institutional settings
for a PES scheme. Therefore, using the example of the KKMs, we assess:
IV. Whether they provide the institutional arrangement and linkages for a carbon
sequestration project.
V. If they allow for the participation of the local community, as well as for
monitoring and enforcing the performance of such a project.
VI. Finally, we evaluate their impact on the status of the environment.
In order to make policy recommendations, a profound understanding is necessary of the
incentive mechanism and the impact it has on land-use changes. In this study we investigate
the payments for carbon sequestration and their adequacy and applicability for rural land-use
systems. Since most of the households in the research region are considered to be poor, our
aim is to determine whether these payments could contribute, not only to their primary goal of
improving an environmental service, but also to raise the rural poors’ income. Based on the
knowledge gained of the institutional framework of the KKMs, suggestions can be made with
respect to the negotiation and management of community natural resource projects. The
insights and results gained are specific for the Lore Lindu region but certain conclusions and
recommendations can be generalised for PES schemes in developing countries.
1.3. Structure of the Study
Chapter 2 provides background information on the politics of climate change and specifically
of carbon finance. It gives an overview of the carbon markets, the compliance and the
voluntary market and then explains in more detail the regulatory context of the Kyoto
Protocol. Consequently, it turns towards the forestry sector and the implications and
limitations of the Clean Development Mechanism for the development of carbon
sequestration projects. This leads to a review of voluntary initiatives, specifically in light of
their importance for promoting projects to reduce emissions from degradation and
deforestation. The Chapter concludes with a summary of the present situation of climate
mitigation activities in the forestry sector in Indonesia and a general outlook.
The theoretical framework for the analysis of PES schemes is introduced in Chapter 3. We
begin with an explanation of the theory and concept of externalities and their application to
PES schemes as a market-based incentive mechanism for positive externalities. The different
environmental services are described and the experience up-to-date with these types of
projects. Then we review the literature with respect to the proposed link between PES

Chapter 1 5
schemes and poverty reduction and its potential for win-win situations. The institutional
frameworks for natural resource management projects are discussed, as well as the
implications of transaction costs and barriers-to-entry in PES projects for smallholders.
Finally, we derive the conceptual framework for the empirical research.
In Chapter 4 we introduce the research region, focusing first on its geographical and
biophysical characteristics, followed by an outline of the socio-economic background and the
prevailing land-use dynamics. This allows the reader to understand the factors contributing to
the encroachment at the forest margin of the National Park and to put the subsequent analysis
into the specific context of the Lore Lindu region.
Consequently, we explain the methodologies employed in the research design in the next two
chapters. As we have used a quantitative and a qualitative approach based on the twofold
objective of the study, they have been respectively separated into Chapter 5 and 6. By means
of a household survey we collected quantitative data on the agricultural activities using a
standardised questionnaire. To calculate the carbon sequestration rates of the agroforestry
systems, as well as of the TNLL forest, we used a carbon accounting technique. The
household data, as well as the carbon sequestration rates of the (agro) forest systems provide
important inputs for the subsequent analysis. Finally, we turn to the methodology used for the
farm household modelling. Different approaches and model types are appraised, guiding
towards the choice of a linear programming model. Its structure is explained, which will be
used and adjusted in the ensuing analysis to the specific local characteristics and
requirements.
Then we continue in Chapter 6 with the qualitative research design chosen for the second part
of the investigation to evaluate an appropriate institutional arrangement for community
natural resource management projects. We start out with an introduction to qualitative
research methods and the reasons for selecting these. Then we first illustrate our procedure
and consequently underpin this with the theoretical background of the selected
methodologies. Thus, we begin by outlining the criteria for the selection of the research
villages, as well as the participatory tools employed for the data collection. Based on this
approach, we explain the methodology for focus groups, as well as the content analysis
method, which we used for the interpretation of the subject matters of the discussions.
In the next two chapters we display the results from the quantitative - Chapter 7 - and
qualitative - Chapter 8 - study. After discussing the household model, the inputs used and the
assumptions made, the baseline results of the model are presented. Subsequently, the
6 Introduction
payments for carbon sequestration are introduced and different scenarios developed. In these
scenarios we assess the impact of changing carbon credit prices and consequences for the
households and their income, as well as their potential to stimulate a change in land-use.
Additionally, a scenario of reducing deforestation in the TNLL is developed. Finally, the
discussion draws conclusions with respect to carbon payments offering solution to the vicious
cycle of deforestation and poverty.
In Chapter 8 the requirements for an institutional arrangement of carbon sequestration
projects are developed. These are the results we obtained from the analysis of the KKMs,
which were used as an example of a natural resource management project. The analysis
focused on the institutional and participation structures of the agreements, its monitoring and
enforcement arrangements and the impact on the environment due to their establishment.
Finally, conclusions are drawn with respect to the adequacy of using the agreements as a
platform for a carbon sequestration project.
Finally, in Chapter 9 we point out the answers to the research questions entailed in the
objectives and summarise the main results of the study. Some limitations of the study are
pointed out which guide towards potential fields of further research. We conclude with
relevant policy implications and recommendations for PES programmes, avoided
deforestation initiatives, as well as the institutional implementation of such schemes.
Chapter 2 7
2. CARBON FINANCE – POLITICAL BACKGROUND AND DISCUSSION
2.1. Regulatory Context and Markets
The economic impacts of climate change have been discussed among scientists for a long
time, yet they have become much more a focus of attention since the publication of the Stern
Review (Stern 2006) in October 2006. The stand out message of the report was that the
benefits of strong, early actions considerably outweigh the incurred costs. By investing one
percent of the global gross domestic product (GDP) per year in its reduction, the worst effects
of climate change can be avoided. The consequence of not taking action and investing in
climate change mitigation activities will eventually damage economic growth and could result
in a 20 percent lower global GDP than there would otherwise be.
National governments as well as intergovernmental institutions have become active in
promoting various climate change policies. Carbon finance has emerged, with the objective of
finding the lowest cost emission reduction possibilities. Carbon has become a valuable
economic commodity, resulting in carbon dioxide (CO2) and other greenhouse gases (GHG)
carrying prices and being traded on carbon markets. Over the last few years several financial
instruments and mechanisms to regulate this trade have emerged, as well as numerous
voluntary initiatives.
The present study is oriented towards the regulated market of the Kyoto Protocol (KP),
specifically the Clean Development Mechanism (CDM). The next section presents a short
overview of the carbon market in general, followed up by the regulatory context of the
compliance market.
8 Carbon Finance – Political Background and Discussion
2.1.1. Market Overview
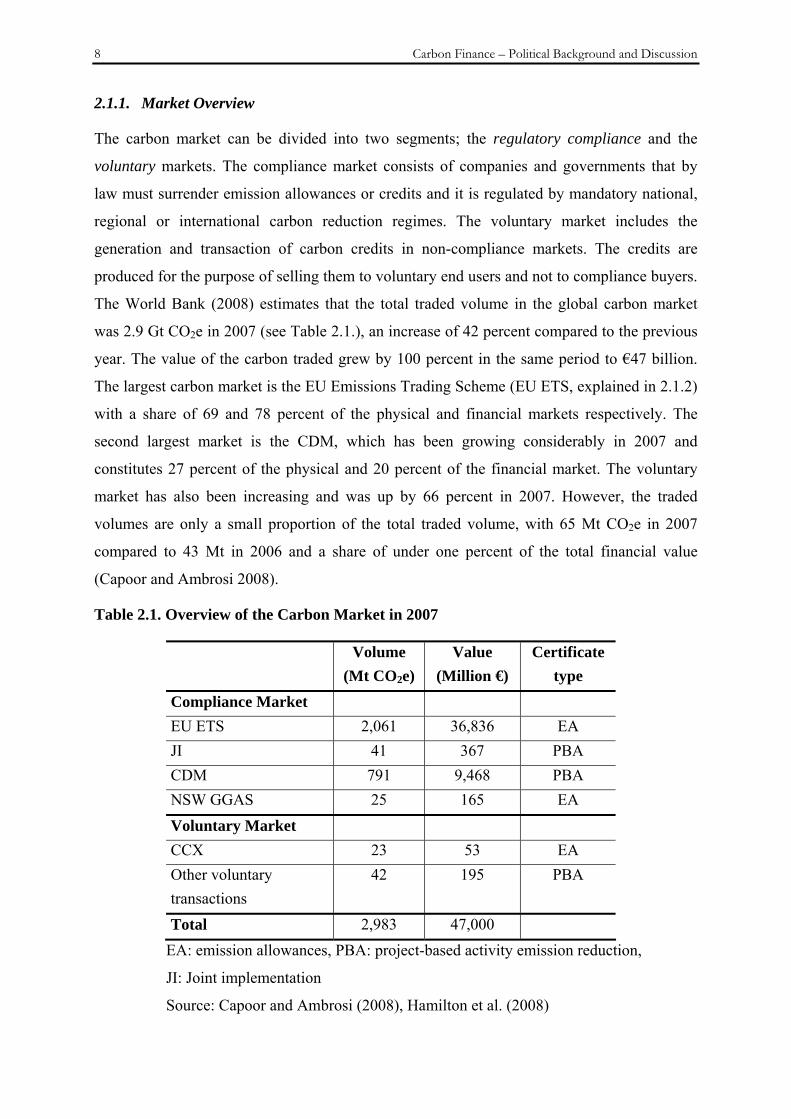
The carbon market can be divided into two segments; the regulatory compliance and the
voluntary markets. The compliance market consists of companies and governments that by
law must surrender emission allowances or credits and it is regulated by mandatory national,
regional or international carbon reduction regimes. The voluntary market includes the
generation and transaction of carbon credits in non-compliance markets. The credits are
produced for the purpose of selling them to voluntary end users and not to compliance buyers.
The World Bank (2008) estimates that the total traded volume in the global carbon market
was 2.9 Gt CO2e in 2007 (see Table 2.1.), an increase of 42 percent compared to the previous
year. The value of the carbon traded grew by 100 percent in the same period to €47 billion.
The largest carbon market is the EU Emissions Trading Scheme (EU ETS, explained in 2.1.2)
with a share of 69 and 78 percent of the physical and financial markets respectively. The
second largest market is the CDM, which has been growing considerably in 2007 and
constitutes 27 percent of the physical and 20 percent of the financial market. The voluntary
market has also been increasing and was up by 66 percent in 2007. However, the traded
volumes are only a small proportion of the total traded volume, with 65 Mt CO2e in 2007
compared to 43 Mt in 2006 and a share of under one percent of the total financial value
(Capoor and Ambrosi 2008).
Table 2.1. Overview of the Carbon Market in 2007
Volume (Mt CO2e)
Value (Million €)
Certificate type
Compliance Market EU ETS 2,061 36,836 EA JI 41 367 PBA CDM 791 9,468 PBA NSW GGAS 25 165 EA Voluntary Market CCX 23 53 EA Other voluntary transactions
42 195 PBA
Total 2,983 47,000 EA: emission allowances, PBA: project-based activity emission reduction,
JI: Joint implementation
Source: Capoor and Ambrosi (2008), Hamilton et al. (2008)
Chapter 2 9
The worldwide carbon emission market can additionally be divided according to the types of
emission reduction certificates: The first type of emission reductions are generated through
project-based activities when a buyer purchases emission reductions from a project that
produces measurable reductions in GHGs. Some project-based transactions are conducted to
meet voluntary targets, but most are ultimately intended for compliance with the KP or other
regulatory regimes. The second type of emission reduction is the trading of GHG emission
allowances, allocated under existing, or upcoming, cap-and-trade regime of different states.
Examples are the EU Allowances, the Chicago Climate Exchange (CCX) and the Australian
New South Wales Greenhouse Gas Abatement Scheme (NSW GGAS).
The voluntary market can be divided into two categories, the voluntary, but legally binding,
cap-and-trade Chicago Climate Exchange (CCX) and the “Over-the-Counter” (OTC) market,
which is characterised by bilateral deals and is not based on an exchange (Hamilton et al.
2008).
The CCX is “North America's only and the world's first global marketplace for integrating
voluntary legally binding emissions reductions with emissions trading and offsets for all six
GHGs, with offset projects worldwide” (CCX 2008). Membership is voluntarily, but is subject
to a legally binding reduction policy. It is owned by the holding company Climate Change
PLC. The OTC market is not part of a cap-and-trade system with an emission allowance
trade; the carbon offsets originate from project-based transactions and the buyers are
motivated to offset their own emissions. The traded credits are often referred to as Verified
Emission Reductions (VER), or carbon offsets. Voluntary buyers can also purchase credits
from the compliance markets or the CCX (Hamilton et al. 2008). Concerns about individual
air travel and a growing sense of corporate social responsibility have had a considerable
impact on the growth of this market as organisations and companies are increasingly trying to
become “carbon neutral” (Neff et al. 2007).
A number of government voluntary purchasing programmes also exist, such as Japan’s
Keidanren Voluntary Action Plan on the Environment, with voluntary purchases of carbon
offsets. In Australia the Greenhouse Challenge Plus Programme was created by the
government to improve the energy efficiency and reduce GHG emissions of companies.
Some of the voluntary carbon initiatives in the OTC market have an additional impact on the
forestry market - these will be addressed in more detail in 2.3.

10 Carbon Finance – Political Background and Discussion
2.1.2. Kyoto Protocol and the Compliance Market
The overall framework for intergovernmental efforts to tackle the challenge posed by climate
change was established by the United Nations Framework Convention on Climate Change
(UNFCCC) in 1992. The Kyoto Protocol, adopted in 1997 at the third Conference of the
Parties (COP), complements the UNFCCC and was eventually enacted in 2005. It was ratified
by 180 countries as of May 2008 (UNFCCC 2008). It is the first time that an enforceable
agreement with quantitative targets for climate change mitigation has been taken. All Annex I
Parties1 that are party to the Convention have committed themselves to reduce their GHG
emissions by 5.4 percent of their 1990 levels by 2012. Non-Annex I Parties (mostly
developing countries) are recognized by the Convention as being especially vulnerable to the
adverse effects of climate change, and investment, insurance and technology transfer activities
are emphasized to assist these countries in their efforts to adapt to and mitigate climate
change. The world’s largest GHG markets have evolved2 under the Kyoto regime. These
markets are based on a cap-and-trade model. For fulfilling the reduction obligations, the KP
offers three flexible mechanisms, namely Emissions Trading, Joint Implementation and the
CDM.
Emissions Trading is an allowance-based transaction system that enables Annex I countries to
purchase carbon credits from other Annex I countries to fulfil their emission reductions
commitments. The mechanism has resulted in the European Union Emission Trading Scheme
(EU ETS), which involves all EU member states and is currently the world’s largest
multinational GHG emissions trading scheme. The Scheme makes use of the credits called
European Union Allowances (EUAs). According to the World Bank, in 2007 the EU ETS
market traded 2,061 Mt CO2e, and the market was valued at €36,836 million (Capoor and
Ambrosi 2008).
Joint Implementation (JI) allows emitters in Annex I countries to purchase carbon credits via
project-based transactions implemented in another Annex I country. Emissions from these JI
projects are referred to as Emission Reduction Units (ERUs). The World Bank estimates that
in 2007 there were 41 MtCO2e of ERU credits transacted, and the market was valued at €367
million (Capoor and Ambrosi 2008).
1 Annex I or Annex B parties include 36 countries, these are mostly OECD countries and economies in transition. They are listed in http://unfccc.int/parties_and_observers/parties/annex_i/items/2774.php. Non Annex I countries are mostly developing countries, a list can be found under http://unfccc.int/parties_and_observers/parties/non_annex_i/items/2833.php 2 Six GHGs are listed under the Kyoto Protocol: carbon dioxide, methane, nitrous oxide, sulfur hexafluoride, hydrofluorocarbons, and perfluorocarbons.
Chapter 2 11
The Clean Development Mechanism (CDM), like the JI, is a project-based system. It allows
industrialised countries to obtain carbon credits by implementing projects that reduce
emissions in non-Annex I countries, essentially assisting the host Parties in achieving
sustainable development and contributing to the ultimate objective of the UNFCCC to act
against global warming and cope with temperature increases. The carbon offsets originating
from registered or approved CDM projects are called Certified Emission Reductions (CER).
Not only can the generated CERs can be used by Annex I countries to help meet their
emission targets (FAO 2004), but the accepted CDM offset projects have an important impact
on developing countries. In 2007, 551 Mt CO2e of primary CDM credits were transacted, and
the CDM market was valued at €5,460 million. Some of these credits were further sold into a
burgeoning secondary market which traded 240 Mt CO2e of secondary CDM credits, valued
at €4,008 million (Capoor and Ambrosi 2008).
In some countries which have not ratified the Kyoto Protocol additional legally binding state
and regional GHG reduction initiatives exist or are planned. The Federal government in the
USA does not currently regulate GHG emissions. However, several states have initiated
regulations on their own or in conjunction with other countries.
At the moment there are six markets operating or are in the planning stage:
- the first GHG regulation in the USA is the Oregon Standard which was enacted in
1997
- the Regional Greenhouse Gas Initiative (RGGI) is a regional strategy involving ten
states from the East coast
- California’s Global Warming Solutions Act (AB 32) is the first US state-wide
programme to reduce GHGs from industries
- the Western Climate Initiative (WCI) is a collaboration of 11 partner states in the US
and Canada developing a market-based mechanism to reduce GHG emissions
- the Midwestern Regional GHG Reduction Programme includes six US states and one
Canadian state; and the Climate Registry. The Climate Registry is not yet a cap-and-
trade system, but could be of importance for any future federal initiative, since thirty-
nine US states, six Mexican states and six Canadian provinces have signed on to it
(Hamilton et al. 2008).
In Australia the NSW GGAS is a mandatory state-level programme aiming at “reducing GHG
emissions associated with the production and use of electricity; and to develop and encourage

12 Carbon Finance – Political Background and Discussion
activities to offset the production of GHG emissions” (NSW GGAS 2008). It started in 2003
and trades the New South Wales Greenhouse Gas Abatement Certificates (NGACs). Outside
the KP this is the world’s largest, regulated cap-and-trade GHG market with about 25 Mt CO2
traded in 2007 and an estimated value of €165 million (Capoor and Ambrosi 2008).
2.2. Forestry Sector
Land-use changes, which are dominated by deforestation, with contributions from changing
agricultural practices, are responsible for about 20-25 percent of human-caused CO2
emissions (IPCC 2007). It is the second largest source globally after fossil fuel use and
contributes more than the entire global transport sector. Therefore, when deforestation and
land-use change decrease and natural systems are restored, opportunities are provided to
decrease carbon emissions. Some of these activities can have the additional benefit of
increasing the CO2 uptake, protecting biodiversity, as well as restoring and reconnecting
natural systems. Forestry activities, so-called sink projects3, are an important means of
mitigating GHG emissions because CO2 is removed through photosynthesis. Under the
agreements reached at the COP7 in Marrakesh in 2001, the rules for sink projects in the CDM
were established and in non-Annex I countries only projects implemented for afforestation
and reforestation (A/R) activities are considered. The exchange units are carbon credits or
CER, which is a measure of the amount of CO2 kept from the atmosphere either by avoiding
an emission or creating a sink4. On the Kyoto market, and under the rules of the CDM, the
forestry sector is quite restricted. Among all CDM projects the forestry sector provides
0.5 percent of all activities, as can be seen in Figure 2.1. By June 2008 only one project had
achieved registration under the CDM and eighteen projects had been submitted for validation5
(UNEP Risoe, June 2008).
Some of the reasons why so few forestry projects have been validated, according to the
experience of auditors of CDM projects, are; the lack of experience with forestry CDM, the
broad variety of project types, the characteristics and the particularly demanding data
requirements for forestry CDM such as spatial data management. Additionally, forestry
projects often entail rural development issues, which complicate the validation processes. The
3 Uptake and loss of carbon from terrestrial vegetation and soils. 4 The terms carbon credits, certificates and CER are used interchangeably. One credit is considered equivalent to one tonne of CO2 emissions. 5 www.cdmpipeline.org/cdm-projects-type.htm

Chapter 2 13
complexity of the auditing process and of the methodologies requires a considerable degree of
specialisation6 (Neff et al. 2007).
Figure 2.1. Number (%) of CDM Projects in each Category
Source: (UNEP Risoe 2008)
The voluntary markets have become the primary source of demand for forestry related
sequestration credits. A growing number of project developers, mainly in developing
countries, are implementing projects to create offset credits for the non-Kyoto markets.
Forestry has the additional comparative advantage in the OTC market of being a
“charismatic” project type as it has public appeal (Hamilton et al. 2008). Corporate
responsibility and public relations are the most common motivations behind carbon offset
purchases, together with considerations such as additionality, certification, reputation and
environmental and social benefits.
2.2.1. Main Criteria, Relevant Rules and Decisions
All CDM forestry projects have to pass certain criteria to assess whether the project activity
creates real reductions of GHG emissions compared to what would have occurred otherwise.
There are also concerns with respect to the quality of the carbon credits in the voluntary
sector. The important criteria are the same, regardless of whether projects are targeted towards
CDM or the voluntary market:
6 For example, the CDM methodology AR-AM0007 entails 134 equations on 103 pages.
HFCs, PFCs & N2O reduction
2%
Transport0,2%
Afforestation & Reforestation
0,5%
Renewables62%
CH4 reduction & Cement & Coal
mine/bed17%
Supply-side EE10%
Fuel switch3%
Demand-side EE5%

14 Carbon Finance – Political Background and Discussion
- Baseline
“The baseline for a proposed A/R project activity under the CDM is the scenario that
reasonably represents the sum of the changes in carbon stocks in the carbon pools within
the project boundary that would have occurred in the absence of the proposed project
activity” (UNFCCC 2003). The baseline is therefore a hypothetical reference case,
representing the volume of GHGs that would have been sequestered if the project activity
had not been implemented. Hence, the carbon benefits can be calculated by deducting the
baseline carbon storage and emissions from the carbon storage and emissions resulting
from the project activities.
- Additionality
“An A/R project activity under the CDM is additional if the actual net greenhouse gas
removals by sinks are increased above the sum of the changes in carbon stocks in the
carbon pools within the project boundary that would have occurred in the absence of the
registered CDM A/R project activity” (UNFCCC 2003). It is not necessary that the project
is happening solely because of the carbon credits it produces, but the anticipated benefits
of the carbon offsets have to be a decisive factor for pursuing the project. Thus, the
question which needs to be asked is whether this project would have occurred anyway or
are the project activities dependent on the sale of carbon credits?
- Leakage
“Leakage is the increase in greenhouse gas emissions by sources which occur outside the
boundary of an A/R project activity under the CDM which is measurable and attributable
to the A/R project activity” (UNFCCC 2003). Leakage can happen if activities are shifted
or changes in supply and demand take place. It is a negative external impact caused by the
project activity. In some cases the terms slippage or migration of benefits are used instead
of leakage.
- Permanence of carbon storage and accountability
Especially forest projects are subject to permanence difficulty, as the length of the carbon
storage and the risk of loss are a very important issue when accounting for the credits.
Carbon is not stored indefinitely in forest biomass, therefore, a separate temporary
crediting system was developed for A/R projects in which credits expire roughly between
five and thirty years and can be renewed and resold (see Chapter 5.2. for specifics on
carbon accounting methodology). In addition, there is an inherent risk of loss resulting

Chapter 2 15
from natural or human disturbances, such as fire, flood or pest outbreak. This can be
managed by creation of buffer reserves of emission reductions or pooling of projects to
share the risk (Kant 2007).
The quality of the CDM carbon emission reductions is determined by applying standards. An
accredited independent verification board must approve the project design before it can
generate CDM compliant emission reduction credits. Furthermore, approved methodologies
will be used in the verification process. In 2007, there were seven large-scale methodologies
available for forestry CDM which cover the above mentioned criteria. Recently two further
methodologies were approved, which also allow agricultural intercropping between the
planted trees and the use of the produced crops as livestock forage, as well as providing a tool
for dynamic baseline estimation when planting on lands with vivid land-use dynamics, rather
than restricting to abandoned and degraded land (Neff et al. 2007).
2.2.2. Voluntary Initiatives
The voluntary sector, as mentioned above, has become very important for forestry projects.
Credits from Land-use, Land-use Change and Forestry (LULUCF) projects provided
36 percent of the OTC transactions, making them the most traded credit type on the market in
2006 according to Ecosystem Marketplace & New Carbon Finance (2008). There are two
main reasons for this relatively high proportion of forestry projects: Avoided deforestation or
reduced emissions from deforestation and degradation (REDD) projects have been excluded
from CDM for the current commitment period and very few A/R projects have been
registered and validated under the CDM due to the complex procedures and methodologies of
project registration. Forest emission reduction projects are only accepted under the NSW
GGAS credits, and these must be located in Australia. Additionally, on the voluntary markets
the forest projects are often valued more highly for their social and environmental benefits.
Among the LULUCF projects the native restoration projects accounted for 42 percent,
avoided deforestation for 28 percent, agricultural soil projects for 16 percent,
plantations/monoculture for 13 percent and other biological sequestration schemes for
0.1 percent (Hamilton et al. 2008).
The debate with respect to REDD has recently gained momentum, having been one of the key
topics at the COP 13 in Bali, Indonesia in 2007. The idea behind REDD is that developing
countries that succeed in reducing emissions from deforestation should be financially
compensated, for example with emission credits (Laurance 2007). The Bali Action Plan
encouraged voluntary action and REDD was included among other mitigation activities as a
16 Carbon Finance – Political Background and Discussion
potential mechanism to reach emission reduction targets. By reducing deforestation a
significant cutback of GHG emissions can be attained which could lead to a substantial
growth on the carbon markets for REDD credits. Ebeling and Yasue (2008) calculate that if
10 percent of the deforestation rate is reduced, for a range of carbon prices of €5-30 tCO2-1
between €1.5-9.1 billion per year could be generated globally.
Nevertheless, there is a lot of discussion with respect to the implementation of the REDD
mechanism regarding a variety of issues that need to be solved. These are briefly outlined.
Realistic baselines need to be set, as carbon credits are computed on the basis of comparing
current deforestation rates and a business-as-usual (BAU) or baseline scenario. Obviously,
determining the baseline year will considerably influence the monetary incentives for
individual countries. Depending on their historical deforestation rates, countries can gain very
little or be a beneficiary of REDD credits, and hence affect their political support for REDD.
Accounting for emissions caused from degradation is a further challenge. Changes in the
forest area can be monitored quite easily with existing technology, however estimating carbon
stock changes from forest degradation is still difficult (DeFries et al. 2007). As already
mentioned, permanence is one of the controversial issues associated with emission reductions
from forestry projects. For example, a fire or drought can cause a decrease in forest cover,
which poses a risk for the protected carbon stocks. International leakage can become
problematic, especially if only some countries participated in a regime for reducing
deforestation. Impacts could be caused for global markets shifting supply and demand
patterns for timber or agricultural commodities across borders and leading to greater
deforestation rates in non-participating countries (Ebeling and Yasue 2008). Finally, the
success of REDD also depends on how well countries can actually decrease their
deforestation rates. Therefore, national governance factors, such as enforcing land-use
regulations, implementing payments for environmental service schemes and restructuring
incentives for agriculture, play a vital role. Previous research has found that countries with
lower governance scores tend to have higher deforestation rates and less success in
conservation (Smith et al. 2003). Furthermore, the economic benefits from compensation
schemes are often not passed on to rural populations if the governance structures are weak,
and corrupt government agencies may have little interest in sharing the financial retributions.
The problem for projects on the voluntary markets, therefore, is that in comparison to the
CDM with its established quality standards and methodologies, offsets on voluntary markets
are less well defined, making standards for this sector crucially important. These standards are
Chapter 2 17
important to safeguard the quality of the offset credit and the project should undergo a quality
control and audit.
A variety of standards have been developed in the forestry sector and the following are of
interest:
- the California Climate Action Registry, which provides detailed protocols for forest
carbon sequestration projects
- the CarbonFix Standard emphasizes sustainable forest management
- the Climate, Community, and Biodiversity Standards (CCB) are a set of project-design
criteria for evaluating land-based carbon mitigation projects and their community and
biodiversity co-benefits
- VER + Standard developed by TÜV SÜD, a Designated Operational Entity (DOE) for
the validation and verification of CDM projects accepts LULUCF projects, including
REDD, if they are implemented with a buffer approach to address the risk of potential
non-permanence
- the CCX standards also include uniform rules for forestry projects.
2.2.3 Carbon Credit Prices
Prices for carbon credits differ between the markets. In 2007 in the EU ETS the allowances
traded in a range between €12.25 and €25.28 tCO2e-1. During July 2005 they even reached a
peak level of $37.7 tCO2e-1 (Henders 2005). In the primary CER market prices were between
€9-11 tCO2e-1, registered projects attained prices of €12/tCO2e and issued CER between €14
and €17 tCO2e-1 (Point Carbon 2008). Secondary CER have been continually rising on the
European Climate Exchange and reached €20.30 tCO2e-1 in June 2008 (Carbon Positive
2008).
On the US voluntary markets credit prices varied between $2 and $15 tCO2e-1, depending on
the project type (Point Carbon 2008). In general on the voluntary markets a huge variation can
be observed in prices between $1.8 to $300 tCO2e-1. This high price was charged for wind
farm credits in New Zealand, an anomaly in the marketplace (Hamilton et al. 2008). The usual
range was between €3-30 tCO2e-1. However, lower prices prevail and the most frequently paid
prices by end users among retailers were between €5-10 tCO2e-1 (Neff et al. 2007). The most
expensive credits on the voluntary markets are the LULUCF ones, with prices averaging
between $6.80 for native species reforestation and $8.20 tCO2e-1 for monoculture plantations,

18 Carbon Finance – Political Background and Discussion
avoided deforestation prices averaged $4.80 tCO2e-1 (Hamilton et al. 2008). The problem with
mentioning these prices is also whether they are actually the ones which reach the project.
Kollmuss and Bowen (2007) discovered that in the air travel offset market between 25 and 93
percent (on average 70 percent) of the funds went to the respective project. On the voluntary
market, the “story” which a project has to tell is quite important and there are a considerable
number of “charismatic” projects where the credit buyers are searching for a way to remedy a
social obligation they feel and promote environmental and social responsibility. Due to this
huge variety of different forest carbon project types and motivations guiding buyers, it is
difficult to make any real predictions for the development of carbon credits for this market
segment.
2.3. Situation in Indonesia
About 88 million hectares (49 percent) of Indonesia’s land area is covered by forest, storing a
carbon stock of about 6,095 million tons. The remaining forest area, however, is under
constant threat, as Indonesia has the second highest annual net loss in forest worldwide.
Between 1990 and 2000 the annual loss of forest was 1.7 percent, which has risen to two
percent per year between 2000 and 2005 (FAO 2006). Indonesia is among the top three GHG
emitters in the world with 3 billion tCO2e annually. The main factor for this high rate is the
emissions from the LULUCF sector, especially deforestation and land conversion caused
through forest fires; this accounts for 83 percent of the annual GHG emissions in Indonesia,
and 34 percent of global LULUCF emissions (World Bank 2007). There are a variety of
reasons for the forest conversion processes, such as wood processing, but also the accelerated
demand for palm oil has been a key driving force. Approximately 27 percent of the
concessions for new palm oil plantations are on peatland tropical rainforests, covering 2.8
million hectares (Fargione et al. 2008).
Indonesia signed the Kyoto Protocol in 1998 and ratified it in 2004. The National
Commission for CDM is the Indonesian Designated National Authority (DNA) which is in
charge of issuing approval letters for CDM project proposals that fulfil Indonesia's sustainable
development criteria. The DNA was created through the Ministry of Environment in 2005 and
consists of representatives from nine government agencies, one of whom is the Ministry of
Forestry that is responsible for the A/R CDM projects. According to the World Bank (2007),
Indonesia also has a number of forestry policies and legislation that favour sustainable forest
management. However, the capacity of the government to implement and enforce laws is
weak and there is an urgent need for detailed planning, budgets, international information

Chapter 2 19
sharing agreements and standard protocols (Chomitz 2007). In June 2008 there were 14
projects registered with the CDM Executive Board, 47 had been approved by the Indonesian
DNA and 81 CDM projects were at or after the validation stage, however, none of these are in
the forestry sector (UNEP Risoe 2008). In comparison to other Asian countries, Indonesia has
a reduced number of CDM projects in general. Several reasons have been put forward, such as
the difficulty to arranging for the project finance, as well as a lack of awareness of CDM. A
variety of national and international NGOs have been critical of the fact that, apart from the
Ministry of Environment, none of the Ministries such as the Forestry or Energy and Mineral
Resources Ministry has shown much interest in the Kyoto Protocol (Sauermost and Wiekert
2008). Awareness with respect to climate change has however, been increasing since the
UNFCCC conference in Bali at the end of 2007, which has pushed climate protection on the
political agenda in Indonesia. With respect to non-existing forestry CDM projects, barriers
have been identified as the complex CDM regulations and the existing limitations in the
forestry sector only for A/R projects.
As a result of these restrictions in the CDM, several initiatives are under way in Indonesia for
forestry carbon projects in the voluntary sector. Before the Bali conference the majority of
projects focused on afforestation, reforestation or agroforestry projects, however, the interest
in REDD has increased considerably. The World Agroforestry Centre (ICRAF) has been
assisting a variety of carbon mitigation initiatives and identifying priority areas, applying
criteria for sustainable development, as well as data on land cover, fire frequency and the
human development index (Murdiyarso et al. 2008). Several projects have been supported by
ICRAF, such as the RUPES (Rewarding the Upland Poor for Ecosystem Services) project in
Singkarak, Sumatra; which focuses on bundling carbon sequestration and watershed
protection activities and aims at an involvement of the community in the global carbon
market. In two projects in Sidenreng Rappang in South Sulawesi and in Way Tenong in
Sumatra the plausible effects of the reforestation activities on farmer income and terrestrial C-
stocks were analysed (van Noordwijk et al. 2008). Another forestry project in Loksado in
South Kalimantan looked at grassland reforestation, converting these to more productive tree-
based systems (rubber, cinnamon, gmelina and mahogany), and also addressed capacity
training for the local population. A further project is located in Bomanan district, Southeast
Sulawesi, and focuses on the conversion of Imperata cylindrical grasslands to more
productive fruit trees - cashew- and timber-based - teak- systems (Iskandar et al. 2006). There
many more projects, a lot of them concentrating on peatland adaptation and management in
20 Carbon Finance – Political Background and Discussion
Kalimantan and Sumatra because peat swamp forests are an important carbon store and are
increasingly cleared and converted to other uses, mainly agriculture (Noor et al. 2005).
Furthermore, a global increase in interest in avoided deforestation projects can be observed,
e.g. US investment bank Merrill Lynch which joined a REDD project in Sumatra, expected to
generate 100 million tonnes of VERs over 30 years. The project in the 750,000 hectares Ulu
Masen forest, one of the last rainforests in this region, is implemented by the Aceh
government, the British NGO Flora and Fauna International and Carbon Conservation. It has
already been certified by the CBBA, giving the generated VERs credibility. Current funding
from the World Bank Multi-Donor Fund’s Aceh Environment and Forest project is to be
joined in future by carbon credit sales under the REDD model, as well as from the recently
established World Bank Forest Carbon Partnership Facility (Carbon Finance 2008).
2.4. Outlook
The policies and economic framework of the member countries of the Kyoto Protocol are
driving the dynamics of this compliance market. Prices are obviously an important
determinant for the demand and supply. Forestry as a project activity has a comparatively
important advantage in providing competitive credit prices on the CDM market (Capoor and
Ambrosi 2007). The CDM market is also more transparent than the emerging non-Kyoto
markets.
There seems to be an increase in the momentum of voluntary carbon mitigation projects, and
suppliers estimate that the volume of credits traded on the CCX and OTC markets in 2020
will be larger than the trade volume of the EU ETS in 2005 by 428 MtCO2e. Complex
methodologies and standards in the compliance markets, as well as the growing demand of
companies, governments and consumers to become carbon neutral and reduce their carbon
footprint has also pushed this market segment. Many forestry projects, especially REDD
projects seem to have gained more acceptance as a climate mitigation option, and have been
additionally incentivised through the UNFCCC conference in 2007. In turn, project
developers responded to the hype over numerous success stories of commercialising forestry
credits on the market. Many believe it will save costs to opt for non-Kyoto schemes and
therefore do so. However, forestry projects are also required to be certified in these voluntary
segments and the transaction costs for the high-quality voluntary schemes resemble those of
the CDM, since these schemes increasingly use the CDM as a benchmark (Neff et al. 2007).
Thus, it could potentially be better for project developers to be cautious and maintain all
commercialisation options and eligibility for various schemes. To maximise flexibility in
Chapter 2 21
selling carbon credits, the certification and registration procedures of several schemes should
be accounted for.
2.5. Summary
This Chapter provides an overview of the political background of climate change and
specifically of the carbon finance activities. The global carbon market is growing rapidly,
with an increase of nearly 50 percent was observed during the last two years. The compliance
market is very dominant and outstretches the voluntary market by far, both in value and
volume. The EU Emissions Trading Scheme has become the largest carbon market with a
share of around 70 percent of the entire market, followed by the Clean Development
Mechanism. Forest carbon projects are currently still quite restricted under this mechanism.
Yet the voluntary market offers several possibilities for forestry offset schemes, especially
since many credit buyers aim at neutralising their carbon footprint and these “charismatic”
projects will offer an opportunity to recompense their debts. Avoided deforestation projects
are increasingly implemented, also partly due to the encouragement they received during the
Climate Conference in Bali in 2007. In Indonesia, all forest carbon projects are in the
voluntary sector. Since it is one of the main greenhouse gas emitters on a global level due to
land-use change and deforestation, projects addressing the reduction of emissions from
deforestation and degradation are en vogue. The concepts of climate change regulations,
specifically in the forestry sector and in Indonesia, enable the reader to put the analysis,
results and recommendations in the subsequent chapters into its political context.

22

Chapter 3 23
3. A THEORETICAL FRAMEWORK TO ANALYSE PAYMENTS FOR
ENVIRONMENTAL SERVICE SCHEMES
3.1. Introduction
Externalities are among the most important class of market failures in the field of
environmental and resource economics (Kahn 2005). In most cases they can be attributed to
human activities, sometimes they are caused consciously, whereas other times they are
unintentional side-effects. For economic analysis values can be attached to the environmental
impacts. A variety of different policy instruments are available, such as taxation, subsidies,
tradable permits or charges, to take these environmental impacts into account and regulate
them. Among the incentive-based mechanisms are the payments for environmental services
(PES). Incentive-based mechanisms, also called market-based mechanisms, rely on price
signals, like those in private markets, to convey incentives for behavioural change. These
changes in incentives can increase or maintain the delivery of publicly valuable ecosystem
services (Jack et al. 2007). The focus of this study is the instrument of payments for carbon
sequestration, a market-based mechanism for environmental policy that has been promoted as
a tool for climate change mitigation. Frequently, institutions of society exist, which shape the
use and the regulations of environmental services. In PES schemes these institutions often
provide a framework for management and the associated regulatory parameters. The schemes
entail the participation of various stakeholders, especially those who pay for the project and
those who deliver the service. However, factors such as transaction costs might provide a
barrier to entry for some of the stakeholders. This is reflected in the theory of institutions of
which the transaction cost theory constitutes an important component, which North (1990) has
focused on. Therefore, this Chapter gives an outline of the topic of externalities, addresses the
different types of benefits of environmental services, and points towards the importance of

24 A Theoretical Framework to Analyse Payments for Environmental Service Schemes
accounting for their values in natural resource management projects. Consequently, it focuses
on PES programmes as a policy involving market-based incentives for positive externalities.
Finally, since these schemes often entail high transaction costs, the nature of institutional
arrangements will be highlighted and their implications for the management of natural
resources.
3.2. Externalities as a Source of Market Failure
When the allocation of goods and services by a free market is not efficient we talk about
market failure. It can be viewed as a scenario in which the individuals' pursuit of profit
maximisation leads to negative results for the society as a whole. Hence, market clearing
forces do not maximise social net benefits by equating marginal social benefits with marginal
social costs and a divergence between private and social costs is created. Externalities are an
example when an individual makes a decision and does not bear the consequences of his or
her action. Thus, the activity of one agent has an impact on another agent and this action is
uncompensated. A negative externality causes a loss in welfare, whereas a positive externality
implies a situation where one agent generates a positive level of welfare for a third party
(Pearce and Turner 1990). Usually externalities caused by farm households are associated
with negative effects from production. Examples are the pollution of drinking water through
the run-off from pesticides applied in agricultural activities, as well as uncontrolled forest
conversion resulting in erosion or increased flooding. Most people think of externalities as
detrimental, but it is also possible for externalities to be beneficial. There are a variety of
activities carried out by farmers which have positive spill-over effects. Carbon sequestration
is a typical positive externality, as it is an unplanned side effect of sustainable forest
management and conservation within a specific area, where the benefits are not confined
locally, but accrue to all of humanity. The beneficiaries of conservation actions designed to
sequester carbon are in general separated spatially and temporally from the costs of the
actions undertaken (Arrow et al. 1999). Furthermore, non-excludability is one of the
characteristics of positive externalities. The absence of externalities is one of the conditions
required so that competitive markets will achieve an efficient resource allocation (Carlson et
al. 1993).
Pigou (1950) was the first to identify the potential market failure due to the presence of
externalities and started the discussion of whether governments should intervene to correct
market failures when negative externalities exist. He argued that the externality cannot be
mitigated by contractual negotiation between the affected parties and recommended to either
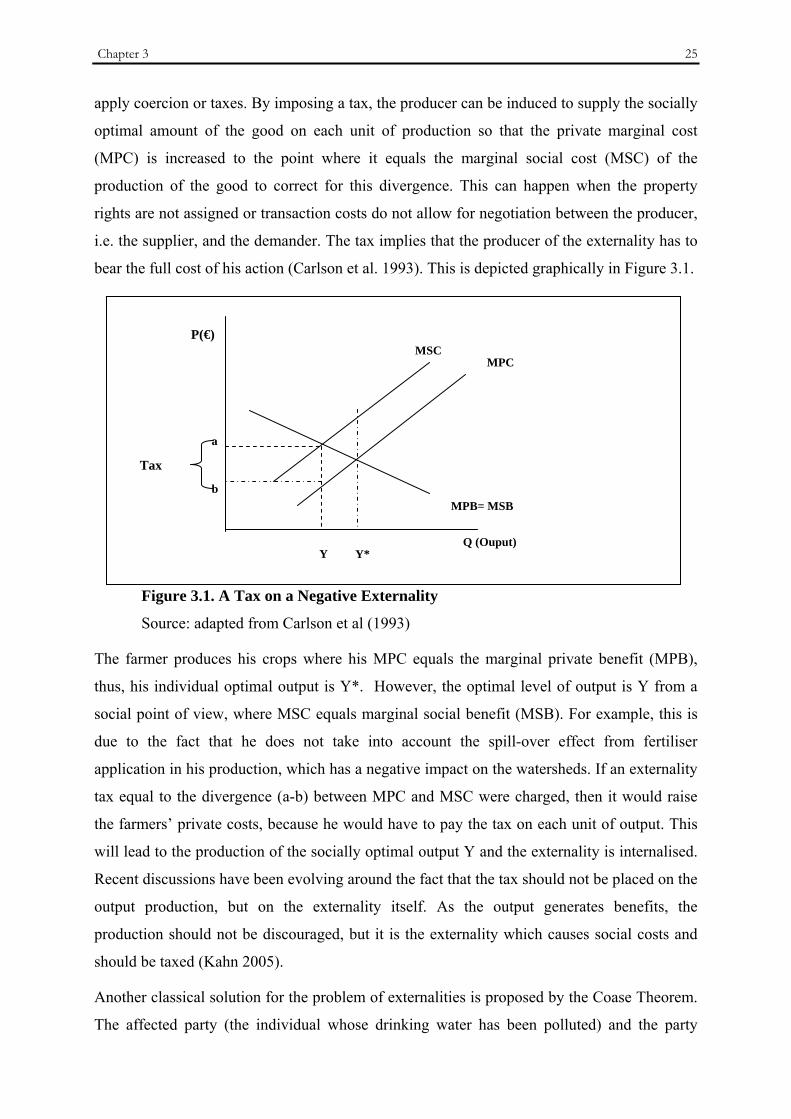
Chapter 3 25
apply coercion or taxes. By imposing a tax, the producer can be induced to supply the socially
optimal amount of the good on each unit of production so that the private marginal cost
(MPC) is increased to the point where it equals the marginal social cost (MSC) of the
production of the good to correct for this divergence. This can happen when the property
rights are not assigned or transaction costs do not allow for negotiation between the producer,
i.e. the supplier, and the demander. The tax implies that the producer of the externality has to
bear the full cost of his action (Carlson et al. 1993). This is depicted graphically in Figure 3.1.
Figure 3.1. A Tax on a Negative Externality
Source: adapted from Carlson et al (1993)
The farmer produces his crops where his MPC equals the marginal private benefit (MPB),
thus, his individual optimal output is Y*. However, the optimal level of output is Y from a
social point of view, where MSC equals marginal social benefit (MSB). For example, this is
due to the fact that he does not take into account the spill-over effect from fertiliser
application in his production, which has a negative impact on the watersheds. If an externality
tax equal to the divergence (a-b) between MPC and MSC were charged, then it would raise
the farmers’ private costs, because he would have to pay the tax on each unit of output. This
will lead to the production of the socially optimal output Y and the externality is internalised.
Recent discussions have been evolving around the fact that the tax should not be placed on the
output production, but on the externality itself. As the output generates benefits, the
production should not be discouraged, but it is the externality which causes social costs and
should be taxed (Kahn 2005).
Another classical solution for the problem of externalities is proposed by the Coase Theorem.
The affected party (the individual whose drinking water has been polluted) and the party
Q (Ouput)
MSC MPC
MPB= MSB
Y Y*
Tax
b
a
P(€)

26 A Theoretical Framework to Analyse Payments for Environmental Service Schemes
causing the external effect (the farmer whose fertiliser application from his agricultural
production pollutes the watershed) should bargain between themselves. Coase (1960) showed
that the socially efficient allocation of resources will be obtained regardless of the allocation
of property rights among the different parties with voluntary bargaining. Property rights refer
to whether the generator of the externality has the legal right to generate the externality or
whether the victim of the externality has the legal right to be free from exposure to the
externality (Kahn 2005). Thus, does the farmer have the right to discharge his fertiliser
application into the river or do the individuals using the river have the right to clean drinking
water? According to Coase, voluntary bargaining between agents will lead to an efficient
outcome, if property rights are fully specified, no transaction costs arise and distributional
aspects do not matter. If this situation occurs, there is no need for government intervention to
correct market failures due to externalities. The major insights from his paper were to show
that transaction costs are extremely important in real life situations, as for environmental
problems it is likely for a large numbers of agents to be involved and bargaining between the
parties not to be costless. Furthermore, the initial assignment of property rights is relevant for
designing efficient solutions to externality problems, as well as for distributional concerns.
The existence of high transaction costs might explain why government interventions occur, as
it is sometimes cheaper and can achieve optimality.
3.3. Payments for Environmental Services as an Incentive-Based Mechanism
Meade (1952) recommended to generalise the Pigouvian welfare theory to find a market
solution for a positive externality situation when private production results in additional social
benefits, using a subsidy. This situation is graphically indicated in Figure 3.2., where less of
the environmental service (Y) is supplied by the farmer than is socially optimal.
For example, the farmer plants trees, which generate private benefits, such as timber, but also
social benefits by reducing erosion and increasing air quality. He equates his MPC with his
MPB and plants Y amount of trees. Introducing a subsidy to the farmer equal to the vertical
distance a to b, he is willing to supply the socially optimal amount of the service (Y*), i.e. he
will plant additional trees. The subsidy can also be translated into a payment for the
environmental service, which induces a movement along the MPC curve and a change in the
price.

Chapter 3 27
Figure 3.2. A Pigouvian Subsidy on a Positive Externality
Source: adapted from Kahn (2005)
Recently, PES schemes have emerged as a potential policy for aligning private and social
benefits, serving as a type of subsidy to increase the supply of the desired environmental
service. The notion behind the PES approach is that those who provide environmental
services should be compensated for doing so. Additionally, an incentive is created for the
providers to undertake conservation measures for services which do not have a private
monetary return, but a benefit for society, and that those who receive the services should pay
for their provision (Pagiola et al. 2005; Wunder 2005; Máñez Costa 2004). The most
commonly used definition for PES, developed by the Centre for International Forestry
Research (CIFOR), is that they are a 1) voluntary transaction where 2) a well-defined
environmental service (or corresponding land-use) is 3) being bought by a (minimum one)
environmental service buyer 4) from a (minimum one) environmental service provider 5) if
and only if environmental service provision is secured (conditionality) (Wunder 2008). It is a
very restricted definition and in reality there are many PES-like schemes that satisfy only
some of the criteria but usually not all. A global review by Landell-Mills and Porras (2002)
identified a list of 287 cases, of which some were in planning stages. By now there are most
likely to be many more initiatives, as they have been widely promoted to provide a tool to
finance conservation in developing countries (Wunder 2005). Through the development of
markets for forest environmental services efficient mechanisms for promoting and financing
forest protection and sustainable forest management can be created, as values are generated
by the services and their costs and benefits can be quantified and accounted for.
Q (Service)
MPC= MSC
MSB
MPB
Y Y*
Subsidy b
a
P(€)

28 A Theoretical Framework to Analyse Payments for Environmental Service Schemes
3.3.1. Typology of Environmental Services
The main environmental services are classified into four different types – watershed
protection, preservation of landscape beauty, carbon sequestration and biodiversity protection
(Landell-Mills and Porras 2002). Forests are among the most important providers of these
environmental – sometimes also called ecosystem – services and have been claimed to be of
great economic value (Costanza et al. 1997). Environmental services are the by-product of
ecosystem functions, which are the biophysical processes taking place within the ecosystems,
and are of benefit for humanity (Nasi et al. 2002). According to the global review of forest
environmental services 27 percent are carbon sequestration projects, closely followed by
biodiversity conservation projects, constituting 25 percent (see Figure 3.3).
0 10 20 30 40 50 60 70 80
Carbon sequestration
Biodiversity conservation
Watershed protection
Landscape beauty
Bundled services
Number of cases
Figure 3.3. Breakdown of PES Programmes in the Forest Sector
Source: Landell-Mills and Porras (2002)
To distinguish the provided benefits of the environmental services, they are differentiated
according to their direct or indirect contribution to human welfare and whether they entail a
consumptive or non-consumptive use of natural resources. This framework typically includes
four categories of value: direct use, indirect use, option, and non-use values. Non-use values
in turn are divided into existence and bequest values. The total economic value of any given
land-use is defined as the sum of its component values, provided they are mutually exclusive
(Pearce and Turner 1990; Munasinghe and Schwab 1993). Apart from the direct use products
forests provide, such as timber, fuelwood and non-timber forest products (NTFP), they also
supply services, which are the less tangible benefits. Many of these environmental services
are typically classified as indirect use values, as they support and protect economic activity
and property. Examples are the protection and cleaning of watersheds, nutrient cycling

Chapter 3 29
provision and storage for carbon dioxide. Biodiversity is considered to have an option value,
as forests also contain important genetic resources which can potentially offer valuable
information for agricultural, pharmaceutical and industrial uses, but its exact use is still
unknown. In addition, some people argue that animals, habitats and ecosystems have an
intrinsic value, in that the value resides in something and can be captured by peoples’
preferences in the form of a non-use value. There is the existence value which people attach
for example to a rare bird species, a value which is unrelated to its use but to the knowledge
of its continued existence. Furthermore, people want to safeguard the use and non-use values
of the forest for future generations, which is the bequest value (Hartwick and Olewiler 1986;
Pearce et al. 1989).
Usually, environmental services entail indirect use values, such as biodiversity, that is not
sold directly, but it is specific land-uses that are protecting species, ecosystem or genetic
diversity. Yet, sometimes the services also provide direct uses, such as the protection of
landscape beauty, since it is associated with a cultural or ecological value given to that site.
Usually, protected areas benefit through this important attribute, and in various countries
spontaneous markets for private land conservation have developed.
Environmental service programmes have already existed for a considerable time, even though
they might not have been named as such. In OECD countries experience dates back to the
1980s and many schemes were a response to environmental degradation from intensive
farming practices (FAO 2007). Usually farmers were compensated for foregoing more
intensive and profitable farming practices. In developing countries the first forest
conservation activities begun in the 1990s, mainly in Latin America. By now, several
countries have implemented very elaborate programmes. In Costa Rica the National Fund for
Forest Financing (FONAFIFO) started a scheme in 1996, where land users can receive
payments for specified land-uses through multiyear contracts, such as new plantations,
sustainable logging, and conservation of natural forests (FONAFIFO 2005). Finance for these
schemes is derived from a mixture of funds from fossil fuel sales taxes, revenues from
hydroelectric companies, loans from the World Bank and a grant from the Global
Environmental Facility (GEF). In Mexico, a payment for a hydrological environmental
services programme is carried out. Other examples are to be found in Colombia, Ecuador and
El Salvador (Pagiola et al. 2005). Also, in Asia PES schemes are on the rise, one of the most
prominent programmes being RUPES coordinated by ICRAF. Projects are carried out in six
sites in the Philippines, Indonesia and Nepal. For example farmers in Indonesia are assisted to
30 A Theoretical Framework to Analyse Payments for Environmental Service Schemes
obtain conditional land tenure in exchange for adopting mixed agroforestry systems that
increase erosion control and foster biodiversity (Jack et al. 2007).
3.3.2. Payments for Forest Carbon Sequestration
Forest PES schemes aim at changing the incentives of managers and/or at generating
resources to finance conservation efforts through cash or in-kind payments, carbon credits or
tax incentives in turn for the sales of carbon sequestration services (Pagiola et al. 2002). As
graphically shown above in Figure 3.2., the discrepancy between the private marginal costs
for the provision of sustainable forest management systems and the social marginal cost of
such measures can be reduced through the introduction of payments for external benefits of
management measures. PES, being market-based mechanisms, can render forests to be a
competitive land-use and farmers and loggers might decide to change their land-use practices
to retain or replant trees if compensation is obtained.
Forestry-based carbon sequestration is based on two approaches: the active carbon absorption
in vegetation, as well as avoiding emissions by conserving existing vegetation. Planting new
trees, such as reforestation, afforestation and agroforestry, as well as increasing growth rates
of existing forest stands like improved silvicultural practices belong to the first approach. The
second approach entails activities such as the prevention or reduction of deforestation and
land-use change, or the reduction in damage to existing forests. Thus, direct forest
conservation measures, as well as indirect methods such as increasing the production
efficiency of swidden agricultural systems, or improving the end-use efficiency of fuelwood
resources can reduce the pressure on standing forests. Additionally, improved logging
practices and forest fire prevention are also activities to complement the protection of existing
carbon stocks (Bishop and Landell-Mills 2002). As mentioned in Chapter 2, the CDM of the
Kyoto Protocol includes afforestation and reforestation projects in developing countries as
emission trading schemes. Therefore, this mechanism is a type of PES aiming at active carbon
sequestration. The rationale in simple terms is that companies causing GHG emissions in
industrial countries pay farmers in developing countries to plant trees or improve the growth
stands of an existing forest. Other forest carbon sequestration activities, however, are
currently not eligible under the CDM rules, but only on the voluntary markets. As explained
in the previous Chapter, some of these activities like forest management are accepted and
financial incentives through carbon credits are rewarded. In the case of deforestation
avoidance, farmers can receive a compensation payment as an incentive not to cut down the
forest and use the timber or put the land to agricultural use. This is in line with the

Chapter 3 31
“compensated reduction proposal”, which entails that countries electing to reduce their
national emissions from deforestation would be authorized to issue carbon certificates, similar
to the CERs of the CDM. These could be sold to governments or private investors and hence
receive a compensation payment (Santilli et al. 2005).
3.3.3. Linkages between Payments for Environmental Services and Poverty
A short overview will be given with respect to the connection between PES and poverty, a
topic which recently received wide attention in the academic world (e.g. Special Editions of
the Environment and Development Economics Journal and the Ecological Economics Journal
in 2008; State of Food and Agriculture FAO 2007; as well as the Quarterly Journal of
International Agriculture in 2006). When PES schemes emerged, it was thought that they
could provide a prospective sustainable additional income for rural households. According to
a study by the World Bank (2003), very often the rural poor tend to live in areas featuring one
or more environmental susceptibilities, such as being fragile or degraded, exhibiting low soil
fertility and limited access to water. The estimation is that over one billion people in
developing countries live in fragile ecosystems covering more than 70 percent of the Earth’s
land surface. These people very often depend on the natural resources, such as forests, which
are found in their immediate surroundings.
“Some 350 million people who live within or adjacent to dense forests depend on
them to a high degree for subsistence and income. In developing countries about
1.2 billion people rely on agroforestry farming systems that help to sustain
agricultural productivity and generate income (World Bank 2004 p.16).”
Forest environmental incomes are particularly important for poor people, since these activities
are often more easily accessed and they require fewer levels of labour and purchased inputs.
Thus, forests often serve as a safety net for people who depend on the environmental
resources provided by these ecosystems (Vedeld et al. 2004). The environmental income
derived from this natural capital is threatened by environmental degradation. This can be
caused by an excessive use of the resource and results in a reduction in the natural capital
stock, in turn having a disproportional negative effect on the poor. Fragile areas which are
used for agricultural activities exhibit very low agricultural productivity, creating a constraint
for people living in these regions who need to raise their income. However, if measures are
adopted to improve soil fertility and its carbon sequestration potential, environmental and
agricultural benefits can be reaped. If forests are protected, environmental services such as
carbon sequestration or biodiversity conservation can be provided. Thus, the expectation was

32 A Theoretical Framework to Analyse Payments for Environmental Service Schemes
raised that farmers in remote areas who provide an environmental service can increase their
earnings through compensation payments by allegedly richer buyers of these services. This
results in “win-win” situations whereby environmental degradation can be constrained and
poverty reduced (Pagiola et al. 2005; Wunder 2008). However, concern has been voiced and a
considerable amount of investigation is concentrating on the issue whether the poor can
benefit from markets for environmental services, while at the same time achieving its primary
goal of an efficient environmental protection (Zbinden and Lee 2005; Engel et al. 2006;
Zilberman et al. 2008; Bulte et al. 2008). The issue at stake is that poor smallholders in
developing countries face serious constraints in accessing market opportunities in general, and
specifically markets for environmental services. Thus, the discussion evolves around the
participation possibilities for poor smallholders in PES programmes, the limiting factors, as
well as enabling ones, and furthermore on the impact of these incentive-based mechanisms on
the poor. A considerable amount of research shows that institutional factors play an important
role for the involvement of poor people and their benefit of these programmes. Rural incomes
and natural resource management can improve, however, it is of crucial importance to provide
an adequate economic and institutional environment to support the participation of poor and
marginalized farmers (Antle and Stoorvogel 2008). For example in a case study in the Sahel
in Senegal of carbon sequestration payment possibilities for smallholders, Tschakert (2007)
recommends flexible management plans and payment mechanisms, as well as supporting
institutional structures to be integrated into pro-poor market-based mechanisms to enable their
participation. A very important competitive factor are the transaction costs involved in PES
schemes (Wunder 2008). In a recent study Jack et al. (forthcoming) concluded with respect to
poverty alleviation, that when the poorest providers are also those with the lowest opportunity
costs and the highest service provision potential, PES policies are most likely to alleviate
poverty. Yet, if many smallholders are involved in PES schemes, transaction costs are higher,
which implies a trade-off between cost-effectiveness and poverty alleviation. Thus, the
experience seems to be mixed and depends very much on the local settings, the institutional
framework, as well as the number of service providers and it is difficult to draw all-
encompassing conclusions. However, one should bear in mind that the primary goal of the
PES programmes is to deliver an improved environmental service, and obviously poverty
reducing impacts are desirable, but pro-poor interventions should not be squeezed into these
schemes if the result is less efficient.
Chapter 3 33
3.4. New Institutional Economics, Institutions and Transaction Costs
The use and management of natural resources is often shaped through institutions. This is also
the case for PES schemes, as different parties are involved, some of which have a right to use
a certain resource and a transaction takes places in a market, where the rights for the resource
at hand are exchanged. Neoclassical economics has little interest in the economic processes
through which transactions are carried out. Its focus is on the end results of economic
activities. In neoclassical economics an objective of markets is to whether they ensure welfare
maximisation (Roth 1999). The aim is to achieve Pareto efficiency, such that the conditions
for perfect competition are fulfilled for market exchanges. Markets are priced for their ability
to achieve allocative and productive efficiency. New Institutional Economics builds on the
neo-classical theory and tries to challenge it by linking economic theory to reality, especially
with respect to its three main assumptions:
1. all economic actors are acting perfectly economically rationally,
2. people act independently on the basis of full and relevant information,
3. market exchanges are costless, so there are no transaction costs (North 1990).
Humans often have different motivations which are not always economically, but also
socially, culturally and personally determined. When facing complex choices, they often lack
the ability to evaluate these systematically. This is linked to the fact that the actors are not
fully informed, and thus make the best decisions based on their limited knowledge and their
capacity to analyse this information. Due to incomplete and asymmetric information, people
need to invest in obtaining adequate information, as well as protecting their property rights,
policing and enforcing decisions. These activities are pricey and result in transaction costs.
New Institutional Economists therefore reject the three assumptions mentioned above and this
has implications for markets. These are no longer the optimal solutions to allocate resources
and there are now a multitude of institutional arrangements guiding decision-making and
resource allocation. There are situations when centralised hierarchical systems, relying on
planning, rules and stratification authority can be effective. Similarly, cooperative
arrangements involving voluntary participation guided by informal rules prove to be optimal
in certain cases when hierarchies or markets fail (Thompson et al. 1991). Often markets,
cooperative arrangements and hierarchies evolve together, complementing and supporting
each other. Hence, institutions are likely to be a mix of complementary and competing
arrangements, tailored to specific historical, economic, social and environmental features.
34 A Theoretical Framework to Analyse Payments for Environmental Service Schemes
Institutions and organisations are often understood as being the same however, they have
different meanings. Organisations are material entities and include political, economic, social
and educational bodies, such as political parties, firms, churches or schools. Institutions are
the “rules of the game” and consist both of formal legal rules, as well as the informal social
norms which govern the individuals’ behaviour and also structure social interactions, and
therefore provide an institutional framework (North 1990). Usually they include any form of
constraint that human beings devise to shape human interaction. There might be formal
written rules, such as political and economic rules, as well as contracts, or informal codes of
conduct, which are often even written and underlie and supplement formal rules. Sometimes
these formal and informal rules are violated, resulting in punishment to be enacted. Therefore,
an essential part of the functioning of institutions is the costliness of ascertaining violations
and the severity of punishment (North 1990). New Institutional Economics holds that the way
institutions provide facilitation is through the reduction of transaction costs (Hubbard 1997).
As mentioned above, in order to tackle the source of market failures, Pigou proposed to
involve governments to try to “internalise” externalities by introducing taxes, thus aligning
the private costs of individual economic agents with the collective or social costs attributable
to their activities. Coase, one of the pioneers of the New Institutional Economists’, introduced
the concept of transaction costs in his seminal paper on “The Nature of the Firm” (1937) and
highlighted that exchanges in all markets are themselves costly, which was taken up and
further developed by many other authors like Williamson (1985), North (1990) and Challen
(2000). With respect to the application of transaction cost economics to environmental issues,
Coase’ paper on “The Problem of Social Cost” (1960) demonstrated, that the Pigovian logic
of associating market failure with Pareto inefficiency is inconsistent, as it assumes that all
exchanges in all markets are costless. His purpose was to persuade his colleagues to leave the
world of neoclassical economics and concentrate on a better understanding of the one we live
in:
“The reason why economists went wrong was that their theoretical system did not
take into account a factor which is essential if one wishes to analyse the effect of a
change in the law on the allocation of resources. This missing factor is the
existence of transaction costs (Coase 1988 p. 175).”
He pointed out that all market exchanges involve transaction costs and markets do not only
exist to trade goods but also to trade property rights in relation to these goods. To a large part
transaction costs are costs of relations between people and the fundamental idea is that they

Chapter 3 35
consist of “arranging a contract to exchange property rights ex ante and monitoring and
enforcing the contract ex post, as opposed to production costs, which are the costs of
executing a contract” (Matthews 1986). In natural resource management projects the major
transactions costs are with respect to gathering information, designing regulations,
coordinating participants, monitoring conditions, and enforcing regulations.
Coase (1960) proposed that interventions in markets should be assessed according to a
comparative institutions approach which would attempt to assess which alternative real
institutional arrangement seems best able to cope with the economic problem. Its objective is
to identify the institutional framework, or governance structure, that minimises the transaction
costs of resolving particular property-rights allocation problems (Williamson 1985).
Therefore, an adequate institutional framework can enable the minimisation of transaction
costs of natural resource management and specifically PES projects. Additionally, the
participation of local communities in these markets for environmental services can be
promoted. This is in line with experience from natural resource management systems, which
suggests that in order to ensure the sustainability of forest projects, all stakeholders must be
transparently involved, their customary rights need to be recognized (Ostrom 1990), and there
must be a direct linkage between the environmental service and development activities
(Asquith et al. 2002). Local communities need to have a voice in the implementation of such
natural resource management projects (Smith and Scherr 2002). Also Hanna (1995) argues
that user participation can contribute positively to the cost-effectiveness of natural resource
management processes. The participation of local communities can lead to a reduction in
transaction costs and specifically of monitoring and compliance:
“Compliance with regulations increases and, hence, management costs decline
when regulations are acceptable and considered legitimate by those whose
interests are being regulated. To be legitimate, the content of a regulation, the
process by which it is made, the way it is implemented, and the effects of its
distribution must be perceived as fair by resource users. To be equitable, a
resource management process must represent the range of user group interests
and have a clear purpose and a transparent operation. In addition, an equitable
process must address explicitly the distributional changes embedded in options
under consideration (Hanna 1995, p.61).”
Thus, an institutional arrangement for a natural resource management project, allowing for the
participation of the users, affects the cost-effectiveness of management processes. Information

36 A Theoretical Framework to Analyse Payments for Environmental Service Schemes
costs can be lowered through the provision of supplemental non-technical knowledge,
monitoring costs reduced if the compliance is increased through management legitimacy and
finally enforcement costs are lowered due to regulations that are appropriate in the specific
context.
3.5. Conceptual Framework for the Analysis
Based on the discussion presented in the previous sections, as well as the objectives outlined
in Chapter 1, we derive the following conceptual framework to guide the empirical research.
In Figure 3.4. the crucial points and linkages for the subsequent analysis are highlighted.
Figure 3.4. Framework for the Twofold Analysis of PES Schemes
Source: own elaboration
The present research focuses on the PES schemes and the impact they have on the
households, as well as the requirements for the institutional arrangement for their
implementation. On the one hand we are assessing the impact of the payments from carbon
sequestration on the land-use systems of the smallholders, and whether the cultivation of the
more sustainable land-use systems can be specifically stimulated by the financial
compensation. Additionally, we explore if the payments can provide a solution to stop
deforestation processes at the National Park margin. On the other hand we have seen that for
a natural resource management project, such as a PES scheme, the participation of the
stakeholders is essential to safeguard its accomplishment. Experience has demonstrated that
certain transaction costs can be lowered by involving local communities and institutions, and
specifically monitoring and enforcement can be easily integrated into community processes
and the costs for these activities minimised. Finally, we look at the impact these arrangements
= impact on
PES SCHEMES HOUSEHOLDS
INSTITUTIONAL ARRANGEMENT
Land-use systems
National Park
Participation structures
Transaction costs
Environment

Chapter 3 37
have on the status of the environment, whether through their introduction and its associated
rules illegal extractive activities have been affected.
The second part of the research uses as an example the community conservation agreements
in Indonesia and whether these can provide the institutional structure for a PES scheme. For
this purpose we developed an additional, more detailed analytical framework. This is based on
four focal points displayed in Figure 3.5., institution, participation, monitoring & enforcement
and status of the environment.
Figure 3.5. Framework for Analysis of the KKM Institution
Source: own elaboration
These main topics have been selected based on the literature review above and because they
are crucial elements in an analysis of a community natural resource management process. We
are interested in the institutional structure of the agreements, which role the traditional
institution plays and if the purpose of the agreements is understood by the community.
Furthermore, we assessed whether the institution represents all village households and
whether they are involved and participate in the process of designing and implementing the
agreement and its associated interventions. Educational activities are seen as a possibility to
provide the community members with information on the functions of the forest and usage
rules. The interventions are specifically assessed with respect to the monitoring and
enforcement of the forest regulations. Therefore, the structure of the monitoring entity is
explored and what impact its regulatory framework has on illegal activities in the forest.
COMMUNITY CONSERVATION
AGREEMENTS
INSTITUTION PARTICIPATION
ENVIRONMENT STATUS
MONITORING &
ENFORCEMENT
Traditional Institution
Purpose Structure Education
Structure of
Institution
Illegal Activities
Preservation Strategies
Resource Extraction
Environmental Impact
38 A Theoretical Framework to Analyse Payments for Environmental Service Schemes
Traditional forest and land zones are investigated whether they can provide preservation
strategies. A good indicator for the success of the monitoring activities is the status of the
environment and to what degree resource extraction and environmental impacts are observed.
3.6. Summary
This Chapter develops a conceptual framework, as well as the theoretical foundations for this
research. The concept of externalities is reviewed, focusing on the positive side-effects of
human actions and environmental attributes. As an example of a market-based mechanism for
environmental policy, the payments for environmental service programmes are introduced,
that rely on incentives to induce behavioural change. In due course it is demonstrated which
services exist, how payment systems can be established, what experience has been gained up
to date, their effectiveness in securing forest environmental benefits, and finally their
contribution towards reducing rural poverty. Usually, natural resource management schemes
entail a variety of stakeholders with different roles and responsibilities. The schemes are
shaped by institutions, which provide a regulatory framework, consisting of formal and
informal rules, in order to assure their performance. Yet, institutions always involve
transaction costs, an important point to consider when one wants to assess the participation of
users and providers. Typically, these are local communities and smallholders in natural
resource management projects in rural settings. The following empirical chapters proceed on
the basis of the presented conceptual framework.
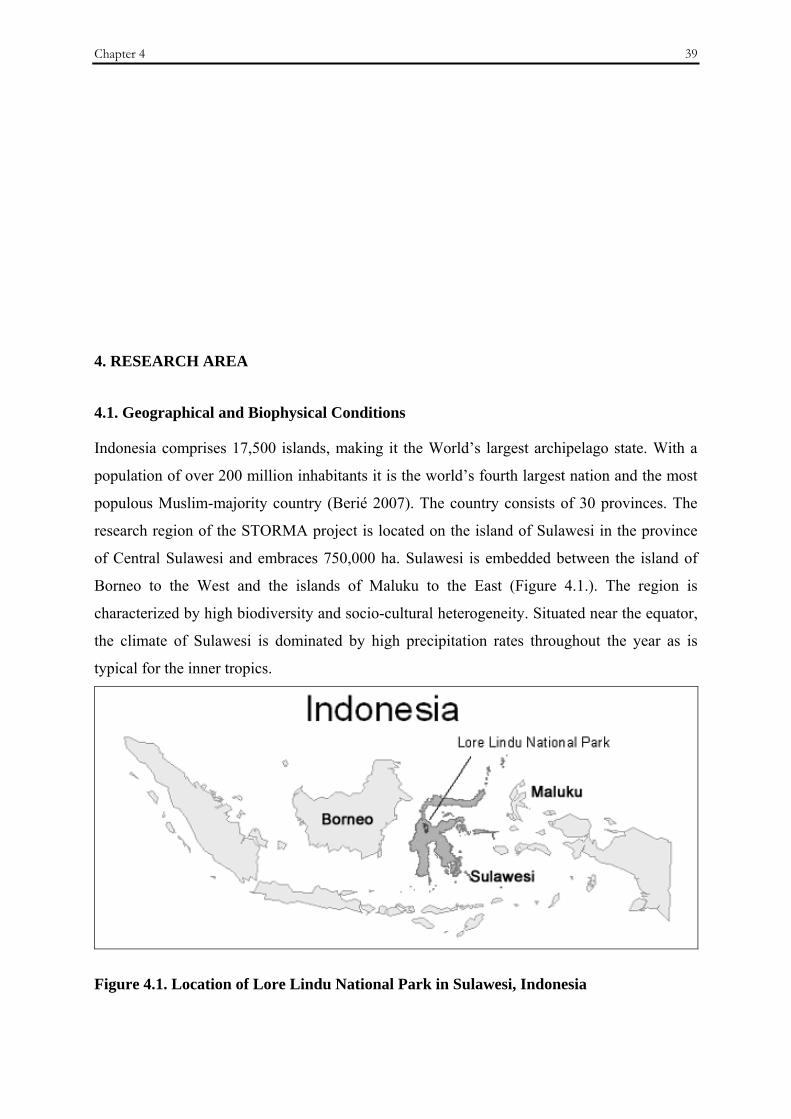
Chapter 4 39
4. RESEARCH AREA
4.1. Geographical and Biophysical Conditions
Indonesia comprises 17,500 islands, making it the World’s largest archipelago state. With a
population of over 200 million inhabitants it is the world’s fourth largest nation and the most
populous Muslim-majority country (Berié 2007). The country consists of 30 provinces. The
research region of the STORMA project is located on the island of Sulawesi in the province
of Central Sulawesi and embraces 750,000 ha. Sulawesi is embedded between the island of
Borneo to the West and the islands of Maluku to the East (Figure 4.1.). The region is
characterized by high biodiversity and socio-cultural heterogeneity. Situated near the equator,
the climate of Sulawesi is dominated by high precipitation rates throughout the year as is
typical for the inner tropics.
Figure 4.1. Location of Lore Lindu National Park in Sulawesi, Indonesia

40 Research Area
The Lore Lindu National Park (Taman Nasional Lore Lindu - TNLL) embraces 220,000 ha
and is positioned in the centre of the research region (see Figure 4.2.) towards the south of the
provincial capital Palu. It borders the sub-districts (kecamatan) Sigi Biromaru, Kulawi, Lore
Selatan, Lore Tengah, Lore Utara and Palolo. These sub-districts comprise 119 villages and
belong to the Donggala and Poso district. Lore Lindu was declared a UNESCO Man and
Biosphere Reserve in 1978 and has been nominated as a World Heritage site for its cultural
heritage of ancient stone megaliths. The National Park was founded in 1982 by the Ministry
of Agriculture and officially recognised by the Ministry of Forestry in October 1993
(ANZDEC 1997). Its formation was the result of joining three nature reserves: Lore
Kalamanta Wildlife Sanctuary, funded in 1973; Danau Lindu Recreational and Protection
Forest, established in 1978; and Sungai Sopu and Gumbasa Wildlife Sanctuary, declared in
1981 (Mappatoba 2004). The BTNLL manages the National Park from its administrative
office in Palu and directly reports to the Ministry of Forestry at the national level.
Figure 4.2. Research Region

Chapter 4 41
The TNLL is regarded as especially important because of its important ecological values and
high socio-cultural diversity in its surroundings. Ethnically, the mixture of people is diverse
due to a complex demographic history. The island of Sulawesi is located along the Wallace
line, which means it contains a mix of both Asian and Austronesian species, making it one of
the most important centres of endemism in the world. Many of the islands’ endemic mammals
are found in the National Park and it is also home to about 230 bird species (Waltert et al.
2003). With respect to its ecological value, it provides important water catchment area, of
which 16 percent are covered by the major land-use systems (Leemhuis 2005). It is a very
topographically diverse region, containing mountainous rainforest, with peaks up to
2,610 m.a.s.l. (Mount Nokilalaki), interspersed with narrow and outstretched valleys at
different elevations and expositions (Erasmi et al. 2004).
4.2. Socio-economic Background
Agriculture is an important land-use in the area, covering 15 percent of the total research area
- excluding the National Park. About half of the agricultural land is used for perennial crops,
mainly cacao and coffee, one third is allocated to paddy rice production, and annual crops and
home gardens are found on the remaining land. 87 percent of the households are farmers and
rice is the most important staple food, whereas coffee and cacao are predominantly cash crops
(Maertens et al. 2006).
About 20 percent of the households in the research region live on less than US$ 1 per capita
per day (purchasing power parity) and almost half of the population falls below the
international poverty line of US$ 2 (purchasing power parity) (van Edig 2005). Poorer
households have significantly less access to formal credit markets (Nuryartono 2005), and live
in locations with poorer markets and road infrastructure. Usually, the prices for cacao are
lower in these markets and also face a higher variability (Anggraenie 2005). The poorest
households depend more on agricultural activities and the sale of forest products, whereas the
better-off households derive a substantial proportion of their income from perennial crops and
non-agricultural activities (Schwarze et al. 2006).
The population size in the region is estimated to be 136,000 people, with a population density
of 18.7 people per km2 - excluding the TNLL area, 27.4 people per km2. The two northern
sub-districts, Sigi Biromaru and Palolo, are much more densely populated, with 86 and 43
people per km2 respectively, in comparison to the remaining sub-districts with 10 people per
km2. Because of different migration occurrences a considerable population increase has been
observed. According to a survey in 2001 conducted by Maertens (2006) the population has
42 Research Area
risen by 60 percent over the last twenty years. In Palolo and Lore Utara migrants constitute
about 21 percent of all households (Maertens 2003).
The local ethnic groups, the Kaili, Kulawi and Lore, are descendents from ancient kingdoms
and lived primarily in Kulawi, Lore Utara and Lore Selatan. It was not until the 1950s that
Palolo became inhabited through spontaneous migrants from Kulawi (Faust et al. 2003).
Through the Indonesian transmigration programmes in the 1960s and 1990s Javanese,
Sundanese and Balinese people were resettled mainly to Palolo and Lore Utara. Yet, the main
change in the cultural landscape has been caused by the Bugis from South Sulawesi in the
1990s, who settled dominantly in Palolo and Lore Utara. This influx of newcomers was
additionally encouraged through the road construction between Palu and these two sub-
districts in 1982 (Weber 2005).
4.3. Land-use Dynamics in the Lore Lindu Region
An implication of this rapid population growth has been the conflict over natural resources,
which can be observed along the borders of the TNLL forest where encroachment takes place.
The main changes to be observed are an expansion of the area dedicated to agricultural
activities by 20 percent during the last two decades, the tripling of the perennial crop
plantation area associated with an expansion of cropping land into former forest areas, as well
as selective and clear-cut logging. Maertens’ village survey revealed that 70 percent of the
villages bordering the TNLL have agricultural land inside (2003). The clearing of forested
areas causes ecological and economic problems such as erosion and a higher risk of flash
floods. For example in Dongi-Dongi, in the north-east of the research region, in 2001
extensive illegal logging took place and approximately 2200 ha of forest belonging to the
TNLL have been converted (Erasmi et al. 2004). The effect of this was higher sedimentation
load in the rivers, and the exposed logged areas in the valley probably also caused flash
floods, which consequently destroyed bridges, streets, and agricultural fields in the region
(Leemhuis 2005). These large forest clearings inside the National Park show that the forest
frontier in the research region is by no means secured (Weber 2005). Analysis of satellite
imagery detected a mean annual deforestation rate of 0.3 percent in the research region
between 1983 and 2002 (Erasmi and Priess 2007). In contrast, the annual forest loss rate for
the island of Sulawesi is estimated by the Forest Watch Institute / Global Forest Watch (2002)
to amount to 1.6 to 2.4 percent between the years 1985-1997 and for the whole Indonesian
Archipelago, 2 percent per year between 2000 and 2005 (FAO 2007). Erasmi et al. (2004)
attribute the differences in the regional deforestation estimates to the diverse data sources

Chapter 4 43
which were used as the basis for the estimates at the national level. Furthermore, cacao
plantations under shade trees cannot be detected by optical satellite instruments, thus, the
encroachment process at the forest margin is not fully reflected by the first figure. In the
vicinity of the TNLL a great spatial heterogeneity of agricultural production can be observed.
In general, human activities are much more concentrated in the northern and eastern part of
the National Park than in the south. For example in Palolo, one of the four main valleys
embracing the TNLL in the north-east, the closed forest decreased by 35 percent between
2001 and 2004 due to logging, whereas the area covered by cacao plantations increased by 11
percent (Rohwer 2006).
In the region around the TNLL four cacao agroforestry systems (AFS) can be distinguished
according to the degree of shading and shade tree species, as well as the management
intensity: AFS D exhibits a high degree of shading with natural forest trees and a low
management intensity, while at the other end of the spectrum AFS G involves intensive
management and fully sun grown cacao7. The gross margins of cacao consistently increase
along the cacao AFS gradient from D towards G (Steffan-Dewenter et al. 2007). There seems
to be a trade-off situation between an intensification of the cacao cultivation with shade free
plantations and higher economic returns and shade-grown, low intensity management cacao
with lower returns and biodiversity conservation. Even though the cacao grown in full sun has
higher mean yields and obtains substantially higher gross margin values in comparison with
shade grown cacao, in the long run the intensification is likely to be unsustainable.
Anticipated consequences are agronomic risks, such as declining soil nutrient levels (Belsky
and Siebert 2003). Experience shows that the dependency on single crops can pose serious
risks for farmers and local food security, as cacao price volatility and cacao diseases are
recurring phenomena (Neilson 2007).
The AFS D provides high biodiversity values and habitat for the native fauna, whereas the
establishment of unshaded cacao plantations reduces the landscape level diversity by
eliminating secondary forests on fallow land which may adversely affect the soil fertility and
cause biodiversity loss (Siebert 2002). It is widely accepted that biodiversity benefits are
higher for cacao grown under shade cover and more specifically under the shade of native
forest species. However, in most cacao growing regions full-sun cacao is replacing the shade
produced cacao (Franzen and Mulder 2007). In the research region the species-richness of
plants and animals and ecosystem functioning was assessed by Steffan-Dewenter et al.
(2007). This study did not discover a linear gradient of biodiversity loss in the four AFS, but 7 The differences between the systems are explained in more detail in Chapter 5.2.1.
44 Research Area
deduced that only small quantitative changes in biodiversity and ecosystem functioning
occurred when changing from AFS D to E and F. However, the complete removal of shade
trees removal is an unsustainable path due to the disproportional loss of biodiversity and
ecological functioning. Unfortunately, this process already takes place in the region. A
willingness-to-pay study, which suggests a higher preference for low shade AFS among the
local farmers, supports these results (Glenk et al. 2006).
Another important phenomenon in the region is that many of the Bugi households, who
constitute the biggest migrant group in the region, started to buy land from the local ethnic
groups, the Kailis’ and Kulawis’. In many cases the local ethnic households had originally
obtained this land by clearing primary forest on the border of the National Park (Sitorius
2002; Faust et al. 2003). They consider themselves to be the owner’s of the village territory
and do not see the necessity to buy land, but in turn realised the opportunity to generate
additional income by selling parts of their land. This money is usually used for buying status
symbols or for ceremonial purposes, which require substantial amounts of cash (Weber et al.
2007). In due course they are often in need for further land for their own cropping activities,
since the majority of them are at least to some extent subsistence farmers, leading to
additional encroachment at the forest margin of the National Park.
4.4. Summary
This Chapter presents an overview of the research region, which is the surrounding area of the
Lore Lindu National Park in Central Sulawesi, Indonesia. The households in the villages are
predominantly farmers and carry out different agricultural activities with cacao and paddy rice
being the most important crops. In such a geographically diverse region a variety of important
ecological attributes contribute towards its importance from a conservation point of view.
Additionally, the ethnic diversity is very high, both due to existing local groups, as well as
migrants. Rapid population growth has been a major factor for land-use dynamics in the
region, causing encroachment at the forest margin, an intensification process of the
agroforestry systems, as well a change in ownership of land taking place from locals to
migrants. A foundation is provided in this Chapter for a better understanding of the setting
and situation when we explain the research design and the selection of the villages
Chapter 5 45
5. QUANTITATIVE RESEARCH DESIGN
5.1. Data Collection
This Chapter focuses on the quantitative research design, and accounts first for the inputs to
the model, which is the data collected in the household survey, as well as the carbon
sequestration data from the agroforestry systems, and finally explains the methodological
approach of the model employed for the data analysis and its specifications.
The research at hand employed an explorative research design, which is based on two
household surveys in 2000 and 2004 carried out by the STORMA A4 subproject with a
random selection of 325 households in 13 villages. For the specific sampling procedure see
Zeller et al. (2002). Three criteria were used to distinguish the sampling strata and the village
selection as they are hypothesised to have a strong influence on land-use practices in the
research region:
- proximity of the villages to the TNLL
- population density of the village
- ethnic composition of the village population.
Building on the already existing sampling frame and the retrieved data, only those six villages
(out of the above mentioned 13 villages) were selected which include households of all four
AFS types or at least households of the infrequent land-use types D and G to economise on
time and costs. The following villages were identified: Sintuwu, Maranata, Lempelero, Bulili,
Wuasa, and Berdikari. A random sample of 46 households from the initial sample was taken
across the six villages.
46 Quantitative Research Design
The data was collected between March and June 2006 by means of structured interviews
using standardised, formal questionnaires (see Appendix I). Even though some data existed
from the previous surveys on the land-use practices, for each individual household all the
necessary data for the modelling was collected in this survey in order to have data from one
point in time. The survey at hand focused on general aspects of the household and farm
characteristics, availability of land resources and their use, agricultural production activities,
forest use, as well as the households’ perception of the TNLL, the forest and its functions. The
questionnaire was translated into Indonesian language and a pre-test was carried out in the
two villages Sidondo II and Kapiroe. This pre-test served on the one hand to test for the
understanding of the questions among the household respondents and help improve it, as well
as on the other hand as a training for the enumerators who carried out the interviews. Three
enumerators had been selected who had been trained previously with respect to the content of
the questionnaires, as well as interviewer techniques. A research assistant helped with the
organisation of the survey, the supervision of the enumerators, as well as the translation of the
questionnaire. The data was entered and checked by the researcher either directly in the field
or shortly afterwards in Palu which enabled the clarification of doubts, inconsistencies or
missing data. A first descriptive analysis was carried out in July 2006 in Palu and compiled in
a short report as a feedback for all those who had been helping in the design of the survey, as
well as the interviewed households. See Appendix II for some pictures taken during the
interviews.
5.2. Carbon Accounting Methodology
As a second step for the analysis, the payments for carbon sequestration are needed as an
input for the model. Therefore, this section outlines the carbon accounting methodology,
which allows for a calculation of the carbon sequestration rates of the agroforestry and forest
(eco)systems.
The Kyoto Protocol is the first agreement to commit countries with legally-binding
quantitative targets to limit or reduce their GHG emissions. As explained in Chapter 2, the
CDM allows a country with an emission-limitation commitment under the Kyoto Protocol
(Annex I Parties) to implement an emission-reduction project in developing countries (non-
Annex I Parties). These projects can earn saleable certified emission reduction (CER) credits,
which can be counted towards meeting their Kyoto targets (UNFCCC 2008).
The term carbon sinks is applied to pools or reservoirs, such as forests, oceans and soils,
which are absorbing carbon, the carbon storage exceeds the carbon release. The process of
Chapter 5 47
capturing carbon from the atmosphere and storing it in vegetation biomass is referred to as
sequestration. Therefore, forestry activities which result in additional GHGs being actively
sequestered from the atmosphere and stored in sinks can generate carbon credits or CER. On
the different types of carbon markets these credits may be used to offset GHG emissions
(Moura Costa and Wilson 2000). The amount of carbon sequestration which can be claimed
as a carbon credit is limited to the net amount of change in the total forest carbon pool from
one period to the next. For this reason for a carbon sequestration project a baseline needs to be
defined for the start of the project and a fixed project cycle period.
Two certified emissions reduction schemes are available – the temporary CER (tCER) and the
long-term CER (lCER) (UNFCCC 2003). The tCERs are limited to five years and can only be
used in the commitment period during which they were certified. After this they need to be re-
certified, therefore transaction costs will be raised. This possibly decreases their economic
attractiveness; however, if compliance is sought for only one period, they are easier to handle
on the market. On the other hand the validity of lCERs can be up to 60 years, but re-
verification is due every five years. Both types entail the deficiency of the possible carbon
loss during the certification period. Finally, if the buyer needs further emission allowances
once the tCER or lCER cannot be re-certified, he needs to bear their replacement costs in
mind (Manguiat et al. 2005).
Five main carbon pools have been identified and are used in the relevant UNFCCC decisions
for afforestation and reforestation activities. They include living biomass (above and
belowground), dead biomass (dead wood and litter), and soil carbon (soil organic matter). A
project should account for all significant changes in carbon pools and/or emissions of the
GHGs that are increased as a result of the implementation of the activities, while avoiding
double counting (UNFCCC 2003). Commonly forestry-offset projects need not attempt to
assemble the full carbon budget to accurately estimate a minimum increase or maximum
decrease in net ecosystem carbon stocks, whichever applies. It is central to the economic
viability of forestry-offset projects to distinguish between full carbon accounting and viable-
carbon accounting for carbon management. Usually the carbon pool of the living biomass can
be monitored cost-effectively. These projects should not overestimate increases in carbon
stocks, but they need not accurately reflect the changes in carbon stocks, as long as they do
not overestimate any change in carbon stocks that are reported (Hamburg 2000).
Estimates for aboveground biomass can be obtained by using biomass regression equations.
These regression equations are mathematical functions that relate oven-dry biomass per tree
48 Quantitative Research Design
as a function of a single or a combination of tree dimensions. They are applied to
measurements of a single or individual trees in stands or in a line (Brown 1997). These so-
called allometric equations exist for certain forest types in specific climates. However in
many cases the equations do not exist for specific species and need to be generated based on
data from field inventories.
Several studies exist with respect to the approximation of belowground biomass, i.e. root
biomass, however, it is quite expensive to obtain exact measurements for this carbon pool. For
tropical forests it is estimated that the percentage of root biomass contributes between 3 and
49 percent to total biomass (MacDicken 1997). To determine total above- and belowground
biomass, it is suggested that the oven-dry weight of the tree is correlated to size variables of
the trees such as height, diameter, basal area and volume (Brown 1997). According to Ortiz
and Riascos (2006) the most recommended procedure to estimate biomass in tropical forests
consists of relating theses variables in a linear regression with logarithmic scalars. This
simplifies the calculations and increases the statistical validation when homogenising the
variance over the data range.
One of the most important pools is the soil organic carbon but it is one of the least understood
aspects by scientists, particularly carbon cycling processes in soils. It has been proven
knowledge that the organic matter and litter production of forest soils is higher compared to
other ecosystems, although when it comes to organic matter recycling, grasslands have a
faster rate (Nilsson and Schopfhauser 1995). To obtain an estimation of the change in soil
carbon it is recommended to measure at least the top 1 meter of soil. The carbon pool in the
upper 1 meter of the world’s soils is assumed to be about 1.5 times higher than that in the
above-ground biomass (Hamburg 2000). The soil carbon pool is enlarged due to reforestation
and in temperate ecosystems soil carbon increased on average by 0.5 t ha-1 yr-1. For tropical
ecosystems similar results have been obtained, but more research is necessary to validate
these outcomes (Hamburg 2000).
The forest type, as well as the disturbance history can have an impact on dead biomass
quantities. However, Hamburg (2000) states that it is acceptable not to consider this
component if there has not been a recent disturbance, natural or anthropogenic. Usually, it is
the rate of change which is important and not so much the size of the dead biomass pool.
To determine the carbon quantity present in the total biomass, a conversion factor is used.
This factor it is widely assumed to be 0.5 g of carbon respectively for 1 g of biomass. In order
to create a homogenous tradable commodity, emission reductions of any GHG are traded in
Chapter 5 49
the form of tonnes of carbon dioxide equivalent (CO2e), which means that the climate change
potential of each GHG is expressed as an equivalent of the climate change potential of CO2
(UNFCCC 1997). For carbon the conversion factor to CO2e is 3.667.
The term accumulated or stored carbon refers to the carbon quantity which is present in an
ecosystem at a certain point in time before it is released in to the soil or the atmosphere. It is
usually accounted for as tonnes of carbon per hectare (t ha-1). On the other hand the term fixed
or sequestered carbon is attributed to the carbon flux of a certain area during a specific time.
This depends on the species characteristics, the growth and longevity rate, as well as the site
conditions such as location, climate and rotation. Generally it is expressed in tonnes of carbon
per hectare per year (t ha-1 yr-1).
5.2.1. Carbon Fixation Rates of Agroforestry Systems
For the comparison of the different agroforestry systems (AFS) in the research region the
carbon sequestration rates, based on the species-specific biomass growth rates, were
calculated. In the STORMA research area, four AFS have been distinguished which all
contain cacao trees (Theobroma cacao L.). They are differentiated according to the species
type of shade trees and their canopy cover proportion, as well as the management intensity:
AFS D contains a high density of remaining forest trees as shade trees, the canopy cover is
approximately above 86 percent and they are managed with very few agricultural inputs; AFS
E is shaded by a diverse spectrum of planted trees and naturally grown after clear-cutting, it
has a shade cover of approximately 66-85 percent; AFS F exhibits a low density of a shade
tree layer, which is dominated by the non-indigenous leguminous trees Gliricida sepium and
Erythrina subumbrans, with a canopy cover between 36-65 percent; finally, the AFS G has
very few to no shade trees (5-35 percent shade canopy cover) and is intensively managed (see
Annex III for a graphical presentation of the four systems. These pictures were used during
the survey for the farmers to categorise their own plot).
Observing the standing biomass rates for the four different cacao AFS (Table 5.1), there is a
decline in biomass and respectively in the carbon and CO2e content from the AFS D to the
AFS G, which contains on average only 21 percent biomass of the D plot.
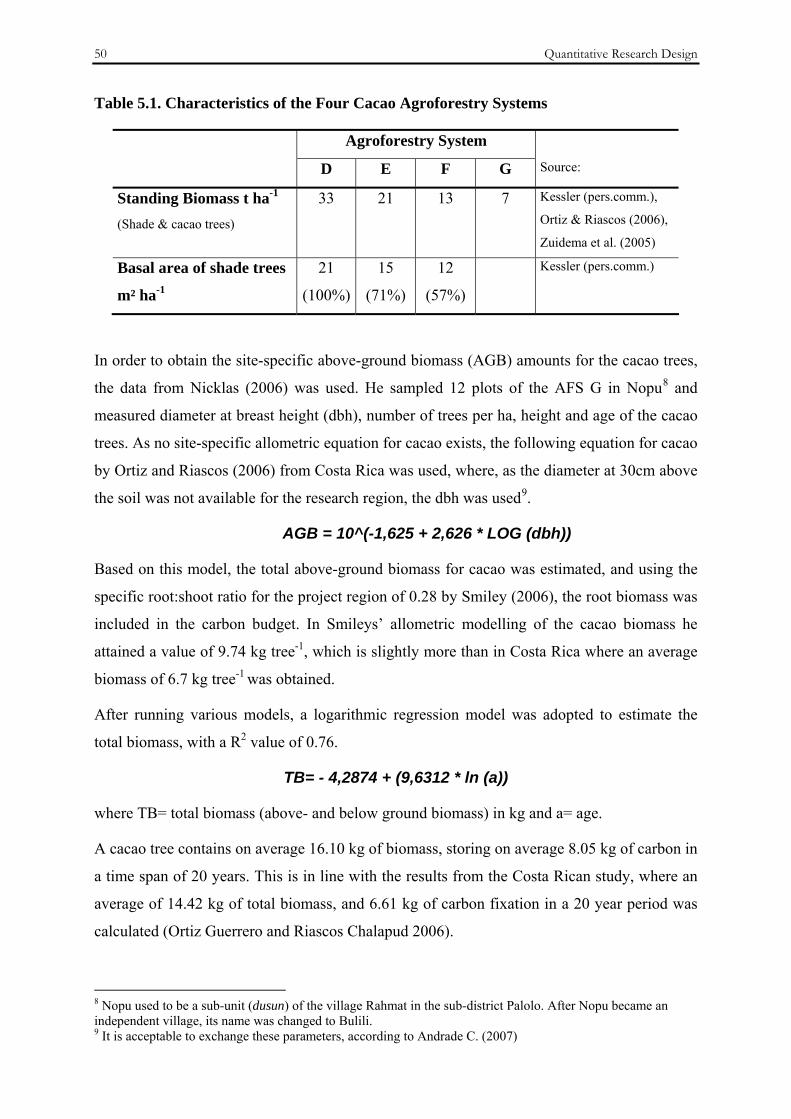
50 Quantitative Research Design
Table 5.1. Characteristics of the Four Cacao Agroforestry Systems
Agroforestry System
D E F G Source:
Standing Biomass t ha-1 (Shade & cacao trees)
33 21 13 7
Kessler (pers.comm.),
Ortiz & Riascos (2006),
Zuidema et al. (2005)
Basal area of shade trees
m² ha-1
21
(100%)
15
(71%)
12
(57%)
Kessler (pers.comm.)
In order to obtain the site-specific above-ground biomass (AGB) amounts for the cacao trees,
the data from Nicklas (2006) was used. He sampled 12 plots of the AFS G in Nopu8 and
measured diameter at breast height (dbh), number of trees per ha, height and age of the cacao
trees. As no site-specific allometric equation for cacao exists, the following equation for cacao
by Ortiz and Riascos (2006) from Costa Rica was used, where, as the diameter at 30cm above
the soil was not available for the research region, the dbh was used9.
AGB = 10^(-1,625 + 2,626 * LOG (dbh))
Based on this model, the total above-ground biomass for cacao was estimated, and using the
specific root:shoot ratio for the project region of 0.28 by Smiley (2006), the root biomass was
included in the carbon budget. In Smileys’ allometric modelling of the cacao biomass he
attained a value of 9.74 kg tree-1, which is slightly more than in Costa Rica where an average
biomass of 6.7 kg tree-1 was obtained.
After running various models, a logarithmic regression model was adopted to estimate the
total biomass, with a R2 value of 0.76.
TB= - 4,2874 + (9,6312 * ln (a))
where TB= total biomass (above- and below ground biomass) in kg and a= age.
A cacao tree contains on average 16.10 kg of biomass, storing on average 8.05 kg of carbon in
a time span of 20 years. This is in line with the results from the Costa Rican study, where an
average of 14.42 kg of total biomass, and 6.61 kg of carbon fixation in a 20 year period was
calculated (Ortiz Guerrero and Riascos Chalapud 2006).
8 Nopu used to be a sub-unit (dusun) of the village Rahmat in the sub-district Palolo. After Nopu became an independent village, its name was changed to Bulili. 9 It is acceptable to exchange these parameters, according to Andrade C. (2007)
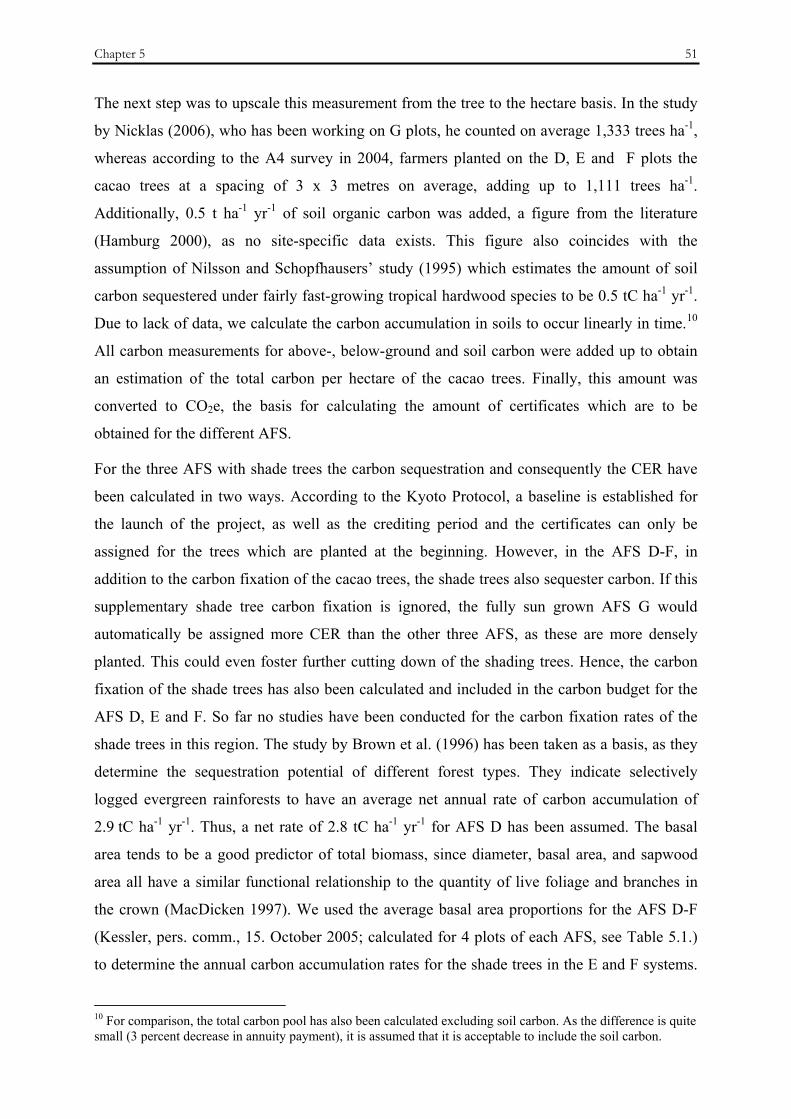
Chapter 5 51
The next step was to upscale this measurement from the tree to the hectare basis. In the study
by Nicklas (2006), who has been working on G plots, he counted on average 1,333 trees ha-1,
whereas according to the A4 survey in 2004, farmers planted on the D, E and F plots the
cacao trees at a spacing of 3 x 3 metres on average, adding up to 1,111 trees ha-1.
Additionally, 0.5 t ha-1 yr-1 of soil organic carbon was added, a figure from the literature
(Hamburg 2000), as no site-specific data exists. This figure also coincides with the
assumption of Nilsson and Schopfhausers’ study (1995) which estimates the amount of soil
carbon sequestered under fairly fast-growing tropical hardwood species to be 0.5 tC ha-1 yr-1.
Due to lack of data, we calculate the carbon accumulation in soils to occur linearly in time.10
All carbon measurements for above-, below-ground and soil carbon were added up to obtain
an estimation of the total carbon per hectare of the cacao trees. Finally, this amount was
converted to CO2e, the basis for calculating the amount of certificates which are to be
obtained for the different AFS.
For the three AFS with shade trees the carbon sequestration and consequently the CER have
been calculated in two ways. According to the Kyoto Protocol, a baseline is established for
the launch of the project, as well as the crediting period and the certificates can only be
assigned for the trees which are planted at the beginning. However, in the AFS D-F, in
addition to the carbon fixation of the cacao trees, the shade trees also sequester carbon. If this
supplementary shade tree carbon fixation is ignored, the fully sun grown AFS G would
automatically be assigned more CER than the other three AFS, as these are more densely
planted. This could even foster further cutting down of the shading trees. Hence, the carbon
fixation of the shade trees has also been calculated and included in the carbon budget for the
AFS D, E and F. So far no studies have been conducted for the carbon fixation rates of the
shade trees in this region. The study by Brown et al. (1996) has been taken as a basis, as they
determine the sequestration potential of different forest types. They indicate selectively
logged evergreen rainforests to have an average net annual rate of carbon accumulation of
2.9 tC ha-1 yr-1. Thus, a net rate of 2.8 tC ha-1 yr-1 for AFS D has been assumed. The basal
area tends to be a good predictor of total biomass, since diameter, basal area, and sapwood
area all have a similar functional relationship to the quantity of live foliage and branches in
the crown (MacDicken 1997). We used the average basal area proportions for the AFS D-F
(Kessler, pers. comm., 15. October 2005; calculated for 4 plots of each AFS, see Table 5.1.)
to determine the annual carbon accumulation rates for the shade trees in the E and F systems.
10 For comparison, the total carbon pool has also been calculated excluding soil carbon. As the difference is quite small (3 percent decrease in annuity payment), it is assumed that it is acceptable to include the soil carbon.
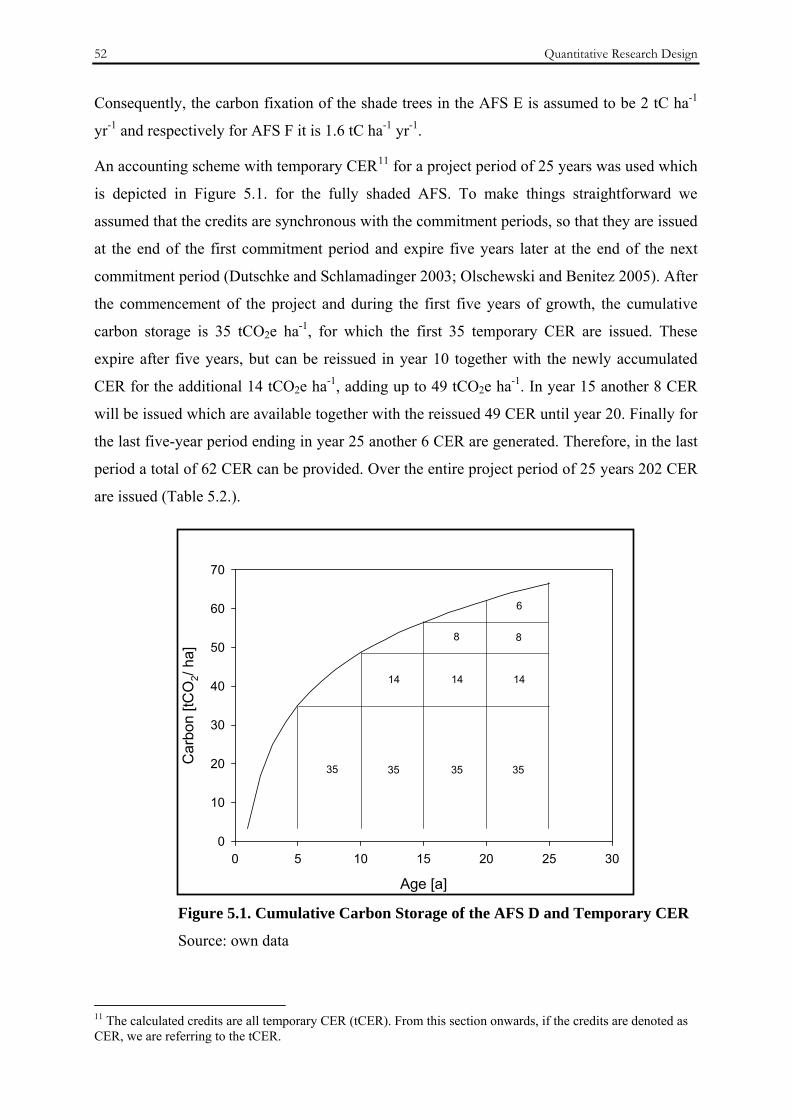
52 Quantitative Research Design
Consequently, the carbon fixation of the shade trees in the AFS E is assumed to be 2 tC ha-1
yr-1 and respectively for AFS F it is 1.6 tC ha-1 yr-1.
An accounting scheme with temporary CER11 for a project period of 25 years was used which
is depicted in Figure 5.1. for the fully shaded AFS. To make things straightforward we
assumed that the credits are synchronous with the commitment periods, so that they are issued
at the end of the first commitment period and expire five years later at the end of the next
commitment period (Dutschke and Schlamadinger 2003; Olschewski and Benitez 2005). After
the commencement of the project and during the first five years of growth, the cumulative
carbon storage is 35 tCO2e ha-1, for which the first 35 temporary CER are issued. These
expire after five years, but can be reissued in year 10 together with the newly accumulated
CER for the additional 14 tCO2e ha-1, adding up to 49 tCO2e ha-1. In year 15 another 8 CER
will be issued which are available together with the reissued 49 CER until year 20. Finally for
the last five-year period ending in year 25 another 6 CER are generated. Therefore, in the last
period a total of 62 CER can be provided. Over the entire project period of 25 years 202 CER
are issued (Table 5.2.).
Figure 5.1. Cumulative Carbon Storage of the AFS D and Temporary CER
Source: own data
11 The calculated credits are all temporary CER (tCER). From this section onwards, if the credits are denoted as CER, we are referring to the tCER.
Age [a]
0 5 10 15 20 25 30
Car
bon
[tCO
2/ ha
]
0
10
20
30
40
50
60
70
6
14 14 14
8 8
35 35 35 35
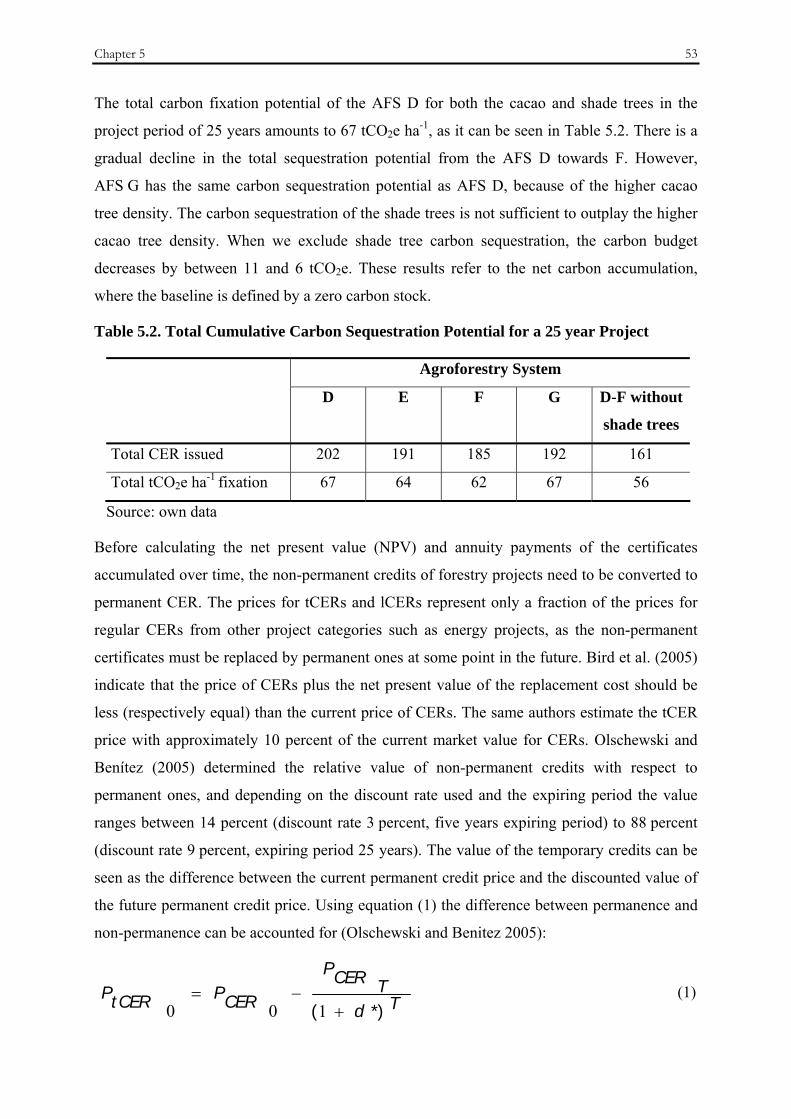
Chapter 5 53
The total carbon fixation potential of the AFS D for both the cacao and shade trees in the
project period of 25 years amounts to 67 tCO2e ha-1, as it can be seen in Table 5.2. There is a
gradual decline in the total sequestration potential from the AFS D towards F. However,
AFS G has the same carbon sequestration potential as AFS D, because of the higher cacao
tree density. The carbon sequestration of the shade trees is not sufficient to outplay the higher
cacao tree density. When we exclude shade tree carbon sequestration, the carbon budget
decreases by between 11 and 6 tCO2e. These results refer to the net carbon accumulation,
where the baseline is defined by a zero carbon stock.
Table 5.2. Total Cumulative Carbon Sequestration Potential for a 25 year Project
Agroforestry System
D E F G D-F without
shade trees
Total CER issued 202 191 185 192 161
Total tCO2e ha-1 fixation 67 64 62 67 56
Source: own data
Before calculating the net present value (NPV) and annuity payments of the certificates
accumulated over time, the non-permanent credits of forestry projects need to be converted to
permanent CER. The prices for tCERs and lCERs represent only a fraction of the prices for
regular CERs from other project categories such as energy projects, as the non-permanent
certificates must be replaced by permanent ones at some point in the future. Bird et al. (2005)
indicate that the price of CERs plus the net present value of the replacement cost should be
less (respectively equal) than the current price of CERs. The same authors estimate the tCER
price with approximately 10 percent of the current market value for CERs. Olschewski and
Benítez (2005) determined the relative value of non-permanent credits with respect to
permanent ones, and depending on the discount rate used and the expiring period the value
ranges between 14 percent (discount rate 3 percent, five years expiring period) to 88 percent
(discount rate 9 percent, expiring period 25 years). The value of the temporary credits can be
seen as the difference between the current permanent credit price and the discounted value of
the future permanent credit price. Using equation (1) the difference between permanence and
non-permanence can be accounted for (Olschewski and Benitez 2005):
Td
TCERP
CERPtCERP*)( +
−=100
(1)
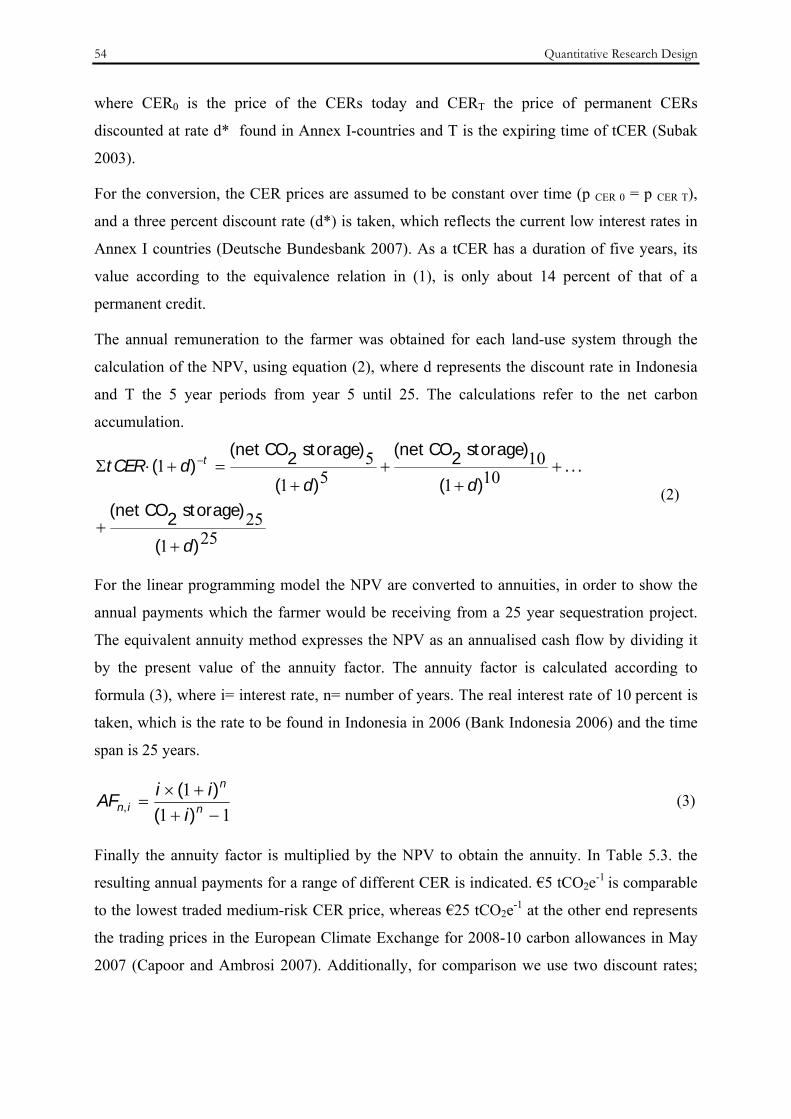
54 Quantitative Research Design
where CER0 is the price of the CERs today and CERT the price of permanent CERs
discounted at rate d* found in Annex I-countries and T is the expiring time of tCER (Subak
2003).
For the conversion, the CER prices are assumed to be constant over time (p CER 0 = p CER T),
and a three percent discount rate (d*) is taken, which reflects the current low interest rates in
Annex I countries (Deutsche Bundesbank 2007). As a tCER has a duration of five years, its
value according to the equivalence relation in (1), is only about 14 percent of that of a
permanent credit.
The annual remuneration to the farmer was obtained for each land-use system through the
calculation of the NPV, using equation (2), where d represents the discount rate in Indonesia
and T the 5 year periods from year 5 until 25. The calculations refer to the net carbon
accumulation.
25125
10110
5151
)(
)storage 2CO net(
...)(
)storage 2CO net(
)(
)storage 2CO net()(
d
dddtCER t
++
++
++
=+⋅Σ −
(2)
For the linear programming model the NPV are converted to annuities, in order to show the
annual payments which the farmer would be receiving from a 25 year sequestration project.
The equivalent annuity method expresses the NPV as an annualised cash flow by dividing it
by the present value of the annuity factor. The annuity factor is calculated according to
formula (3), where i= interest rate, n= number of years. The real interest rate of 10 percent is
taken, which is the rate to be found in Indonesia in 2006 (Bank Indonesia 2006) and the time
span is 25 years.
111
−++×
= n
n
in iii
AF)(
)(, (3)
Finally the annuity factor is multiplied by the NPV to obtain the annuity. In Table 5.3. the
resulting annual payments for a range of different CER is indicated. €5 tCO2e-1 is comparable
to the lowest traded medium-risk CER price, whereas €25 tCO2e-1 at the other end represents
the trading prices in the European Climate Exchange for 2008-10 carbon allowances in May
2007 (Capoor and Ambrosi 2007). Additionally, for comparison we use two discount rates;

Chapter 5 55
10 percent which the interest rate observed in Indonesia, as well as 3 percent, to indicate the
impact of low discount rates12.
Table 5.3. Annuity Payments for Different Discount Rates and CER Prices
Agroforestry System
Annuity payments € ha-1 D E F G D-F without
shade trees
d 10%, CER €5 tCO2e-1 5.54 5.18 5.00 5.09 4.28
d 10%, CER €12 tCO2e-1 13.30 12.40 12.00 12.20 10.30
d 10%, CER €25 tCO2e-1 27.70 25.90 25.00 25.50 21.40
d 3%, CER €12 tCO2e-1 28.80 27.10 26.20 27.10 22.80
d 3%, CER €25 tCO2e-1 60.00 56.40 54.60 56.40 47.40
Source: own data
When the CER price is €5 tCO2e-1, the evolving payments per hectare for the AFS are around
€5. Taking high credit prices of €25 tCO2e-1, and using a normal discount rate of 10 percent
the annuity payments per hectare are around €25-27. Once the discount rate is lowered to
three percent, the per hectare payments increases up to €60 tCO2e-1. The variation between the
four different AFS is not very pronounced, as the net carbon accumulation is similar between
all four systems. However, the highest annuity payments from carbon sequestration are
always obtained for the fully shaded AFS and decline towards the AFS F. Very similar
payments are achieved by the AFS type E and G, and those for AFS F are lower. Once the
carbon sequestration for the shade trees for AFS D-F is excluded, the remuneration is
15 percent lower than the payments for the intensively managed fully-sun grown cacao plots.
These obtain payments in the mid-range, because the cacao trees are more densely planted in
comparison to the other three shaded systems.
In a survey conducted in 80 of the 119 villages in the research area approximately 20,590 ha
were used for cacao plantations in 2007. Approximately 1 percent of this area was planted
with the AFS type D, 31 percent with AFS E, 60 percent with AFS F and 8 percent with
AFS G (Reetz, pers. comm, 16. April 2008). Thus, if a carbon sequestration project were to be
implemented in this region, the approximate carbon offset potential of the cacao agroforestry
12 Different discount rates imply altered time preferences and natural resource usage. The higher the discount rate the higher will be the discrimination against future generations. A lower discount rate implies a less rapid development and usage of exhaustible resources, longer rotation periods and higher stocks of renewable resources. However, there is not a clear cut relationship between low discount rates and an improved preservation of natural resources. For further discussion see Pearce and Kerry (1990).
56 Quantitative Research Design
systems would be 1,300,000 tCO2e-1, summing up to 3,855,699 CER in 25 years. At low
carbon prices of €5 tCO2e-1 this would amount to an annuity payment of €104,000, at a price
of €12 tCO2e-1 to €250,000 and at €25 tCO2e-1 to €522,000 for a 25 year project.
5.2.2. Carbon Sequestration Rates for Avoided Deforestation
Accounting for the preserved carbon from avoided forest conversion is not a simple issue.
However, it is an important one because although tropical deforestation is not the main source
of GHG emissions, it makes a significant contribution to the global budget comparable to the
emissions reductions to be gained by implementing the Kyoto Protocol in its first
commitment period (Santilli et al. 2005). As mentioned in Chapter 2.2.2. avoiding
deforestation has been increasingly discussed on the political agenda. At the 11th COP of the
UNFCCC in Montreal in 2005, Papua New Guinea and Costa Rica, on behalf of the Coalition
for Rainforest Nations, put forward a submission to further consider whether and how
incentives to reduce tropical deforestation could be included in a future climate regime under
the UNFCCC. Consequently, several proposals have been made for different approaches to
account for avoided deforestation. For example Achard et al. (2005) presented a proposal to
assess the reduction of the conversion rates below a baseline for each potential change at the
global and country level. The proposed carbon accounting system would mainly rely on forest
area and forest area changes, and for greater accuracy additional data on biomass and carbon
stocks and changes in specific forest types would be needed. Other authors argue that it is
difficult to assess deforestation baselines, as depending on the region and time, these differ
within every country. Therefore, Prior et al. (2006) propose a cap-and-trade stock based
methodology. Carbon credits are allocated to countries based on an approximation of the
amount of carbon currently held in that country’s forest carbon reservoirs. Those countries
than have the opportunity to either sell credits and at the same time transfer equivalent areas
of forest to protected reserves, or carry out deforestation activities, or a combination of both.
If a country decides to sell some of the credits allocated to its carbon pool, it could make use
of the so-called Carbon Reservoir Mechanism, which would be modelled after the Joint
Implementation. This mechanism can be used to financially reward conservation and
protection of tropical forests. It creates an incentive for protecting those parts of the carbon
pool under danger of being lost as it makes carbon credits generated through the protection
available for trading. An additional problem of the measurement or monitoring of forest area
changes can be attributed to the remaining challenge of estimating carbon stock changes from
forest degradation (DeFries et al. 2007).
Chapter 5 57
For the present study a simplified approach of the land-use simulation model by Soares-Filho
et al. (2006) has been used. They estimated the effect of recent protected areas created since
2004 in reducing future carbon emissions from deforestation in the Amazon. An empirically
based, policy-sensitive model of Amazon deforestation was developed and several
deforestation-conservation scenarios were run. The present deforestation trends are
hypothesised to continue in the ‘business-as-usual’ (BAU) scenario, whereas on the other
hand in the ‘governance’ scenario, Brazilian environmental legislation is assumed to be
implemented across the Amazon basin and the protected area network to expand. The carbon
emissions expected for each scenario were estimated by supposing that 85 percent of the
carbon contained in forest trees is released in to the atmosphere after deforestation.
Deforestation and land conversion processes in Central Sulawesi have been analysed in the
STORMA project. The observed land-use changes have been associated with different factors,
such as an expansion of the agricultural area by 56 percent between 1980 and 2001,
sometimes at the expense of the forest margin of the National Park. Specifically the area
dedicated to cacao plantations has increased from zero in 1979 to nearly 18,000 hectares in
2001. Furthermore, selective and clear-cut logging takes place. Another important factor is the
population growth of 60 percent in the last two decades causing massive land cover
transformations and infrastructure expansion (Maertens et al. 2006). A satellite image analysis
detected a mean annual deforestation rate of 0.3 percent in the research region between 1983
and 2002 (Erasmi and Priess 2007). For the TNLL area of 221,412 hectares, the annual forest
loss has been 0.3 percent between 1999 and 2002 (Erasmi 2007). As we have seen in
Chapter 4 this rate is rather small in comparison to the estimation of the deforestation rate for
the entire island. However, even though the conversion rates for TNLL and the wider research
region are relatively low, the intensity of land-use activities differs around the National Park.
The region towards the south is less populated in comparison to the northern and eastern parts
which exhibit concentrated agricultural activities. In this region a tremendous loss of 2,200 ha
of National Park forest occurred in 2001 (Erasmi et al. 2004).
The TNLL had a closed forest cover in 1972 of 207,708 ha. In 2002 the closed forest cover
had decreased to 193,720 ha (Erasmi 2007). Hence, if the annual forest loss rate of 0.3 percent
remains stable, in the BAU scenario annually 581 ha of closed forest will be deforested. For
the natural forest type with traditional use of rattan extraction but no timber extraction with a
closed canopy the standing biomass is estimated to be 140 t ha-1. The estimates for the virgin
rainforest of the TNLL are up to 240 t C ha-1 or 435 tCO2e ha-1 (Kessler 2008). As mentioned
above, assuming that 85 percent of carbon contained in forest trees is released to the

58 Quantitative Research Design
atmosphere after deforestation, in the ‘total preservation scenario’ reducing the deforestation
rate from the BAU scenario to 0 percent, annually 215,500 t CO2e are not released through
deforestation. As the conversion rates in the vicinity of the National Park vary greatly
depending on the location and the logging activities are more concentrated close to the border,
an extreme ‘Sulawesi scenario’ will be assessed. An island wide annual deforestation rate of
2.4 percent is used, leading to an annual forest loss of 4,649 ha for the TNLL. If this was
reduced to 0 percent, annual carbon emissions of 1,719,000 t could be saved for the entire
National Park.
5.3. Methodology for Data Modelling
5.3.1 Potential Methodological Approaches and Model Types
In order to determine the appropriate methodology for the study at hand, several
methodological approaches were appraised and evaluated. Several considerations had to be
accounted for, such as the objective of evaluating new policy options of carbon payments at
the farm level and the impact it might have on land-use decisions, as well as the diversity of
households in the research region. Additionally, we had to integrate financial and time
constraints.
A great variety of models and methodologies exist, they can be static or dynamic,
mathematical or physical, stochastic or deterministic. Economic models can be most easily
classified into optimisation or simulation models. Usually two different branches of models
are applied in economics and agricultural sciences, being econometric/simulation models,
optimisation models, or a combination of both.
Econometric models are employed to statistically estimate system parameters (the coefficients
relating changes in one variable to changes in another) from empirical observations to
describe the system behaviour based on theoretical assumptions. The advantage of
econometric models is that they represent the best possible guess of the true relationships
between the variables (Börner 2005). Three steps are to be carried out for econometric
modelling: the structure of the system is specified using a set of equations. Consequently, the
values of the parameters are estimated. Finally the resulting output is used to make forecasts
for the future performance of the system. In general econometric models require the
availability of large degrees of freedom both in terms of cross section and time series data.
Optimisation or mathematical programming models are not used for predicting what will
happen in a certain situation. Instead they explain what to do in order to make the best of the

Chapter 5 59
situation; they are normative or prescriptive models (Sterman 1991). They consist of three
components: the goal or objective is specified by the objective function, the decision variables
are the choices to be made and the constraints restrict the choices of the decision variables to
those that are acceptable and possible. Hence, given the assumptions of the model, the model
aims at achieving the best – optimal – solution as its output.
5.3.2. Linear Programming Models
According to Hazell and Norton (1986) “mathematical programming in agriculture had its
origins in attempts to model the economics of agricultural production”. If it is used for whole-
farm planning, it can assist farmers in efficiently adapting to a changing economic and
technological environment, or as a tool for policy analysis. With the help of these models
farmers’ reaction to interventions can be simulated indicating their adaptation with respect to
the allocation of their resources. Specifically linear programming, which is amongst the most
common optimisation models, is regularly mentioned as the method of choice to model the
effects of interventions on farm households (Upton and Dixon 1994). It is a very useful
technique to assess technology changes or adoption potentials ex ante, so that careful planning
for new policies or strategies can be undertaken. Generally, given the objective function of the
farm household, the solution procedure maximises the total gross margin of the farm by
finding the optimal set of activities for the household type or it minimises costs of the
activities under the respective restrictions. These are the availability of certain technical
constraints, such as usually the land, labour and capital endowments. Mathematically, the
optimal values of unknown variables within a system of equations are examined. When these
values are combined, they define the alternative decisions. To determine the optimal feasible
strategy, an algorithm (such as the simplex method) is used (Teufel 2005). At the farm level
the programming model is explicitly a normative or prescriptive tool.
Linear programming has been applied to farm household research for several decades. Its
advantages are the structured data requirements, which provide a good insight into the studied
systems, the flexibility of model structures and the ease with which model runs can be
replicated with various data sets (McCarl and Nuthall 1982). Disadvantages are several
fundamental assumptions which underlie linear programming models, such as linearity,
additivity, divisibility, certainty and non-negativity (Paris 1991). These need to be kept in
mind, when using the tool. A brief overview is given of the limitations and problems.
Specifying the objective function involves assuming certain values and preferences, making it
important to critically assess whose goals are incorporated. It is a challenge to incorporate
60 Quantitative Research Design
intangibles, which can be roughly quantified to integrate measurable components or proxies
need to be sought for these. In developing countries particularly, when the model attempts to
depict the land-use systems of smallholder households, a variety of objectives need to be
accounted for, such as cash income, subsistence requirements and leisure time. Hence the
food security necessities for these households can be included in the model by using
constraints, resembling satisficing rules (Schreinemachers and Berger 2006). In reality linear
relationships between the variables, an assumption of linear programming model is almost
always not true. Over small ranges in the variables a linear relationship might be a good
approximation, but when the linearity assumption cannot be justified, non linear programming
can be used. Furthermore complex systems usually exhibit a high degree of feedback between
sectors. When models ignore feedback effects they have to rely on exogenous variables and
are said to have a narrow boundary. Theoretically, feedback can be incorporated into
optimisation models, but the resulting complexity and non-linearity usually render the
problem insoluble. Often these effects are not acknowledged, as they present irresolvable
problems because of their complexity and non-linearity (Sterman 1991). With respect to the
dynamics of optimisation models, some are static and determine the optimal solution for a
particular moment in time not taking into account how the optimal state is reached or how the
systems will evolve in the future. This can be considered by dynamic models which are
designed for longer time horizons and link time periods. Delays are a crucial component of
the dynamic behaviour of systems, but – like non-linearity – they can be incorporated into
optimisation models, however it involves a great deal of effort. Therefore one has to be aware
of these restrictions when constructing a model. Despite all these limitations optimisation
techniques can be extremely useful, when they are planned and applied properly.
Optimisation models can be considered whenever the problem is one of choosing the best
from among a well-defined set of alternatives. If the meaning of best is also well defined, and
if the system to be optimised is relatively static and free of feedback, optimisation may be the
best technique to use. As mentioned above, to make prescriptive statements it is legitimate to
use optimisation models, however, they can be employed for forecasting only if the farm
household in fact optimises and makes the best possible decisions. To model how systems
actually behave, simulation techniques are more useful. Optimisation models can approximate
how a system or people ought to behave and simulate policy changes (Sterman 1991).
Several studies exist, employing linear programming models, which assess the adoption of
new technologies or the introduction of policy options. Mudhara and Hildebrand (2004) for
example used a linear programming model to simulate the livelihoods of smallholder farmers
Chapter 5 61
and assess the potential adoption of improved fallows in Zimbabwe. The authors indicate the
contribution linear programming models can make towards an ex ante evaluation of new
technologies before their dissemination. Hence, it allows for the precise identification of
target farmers for this new technology. The study emphasises the fact that household linear
programming models have to accommodate household resource levels. Since the objective
function was to maximise discretionary household income, several constraints were included
to reflect specific household characteristics such as food security, household composition and
available arable land. They perceive the advantage of household linear programming models
in their sensitivity towards diverse household characteristics. Thus, households and
technologies can be matched by determining the technology that is both compatible to the
resources of the specific household and satisfies its stated objective function. Various authors
have employed linear programming models to simulate technology changes, for example
Teufel (2005) who analysed the introduction of potential technical improvements for milk
production of smallholder households in Pakistan. As the households were poorly integrated
into markets and household decisions could not be sufficiently explained by maximising only
household income, he chose a multi-criteria decision making approach to integrate further
objectives into the model. Usually, when herd dynamics are included, long-term effects are an
important consideration. This is also true for forestry projects, where a time lag between the
investment period and the returns are observed, as well as fallow periods which might be a
part of the system (Mudhara and Hildebrand 2004). However, as the considered interventions
did not represent large investments with long time-lags between investment and return, Teufel
(2005) developed a single year static model. In South Sulawesi in Indonesia, a study was
conducted by Taher (1996) regarding smallholder cacao farmers’ technology adoption and
application and an optimisation of their activities. A static linear programming model focused
on the farm level activities based on different technologies. As the farm condition was
assumed to be stable, no risk and time dimensions were included in the model. The main
objective of farmers was to achieve an optimal farm gross margin by optimising the gross
margin of several crops and off-farm activities subject to labour and land constraints.
Different scenarios were run with respect to the most favourable mix of activities, and the
outcome indicates that it may well be the best solution for the farmers to diversify their
activities. Thus, policy recommendations to improve the farmers’ practices were made.
So-called bio-economic farm household models have been widely applied to simulate farmers’
behaviour. They are optimisation models which allow us to combine biophysical and socio-
economic data at different scales with expert information and stylised facts and hence, are

62 Quantitative Research Design
quite adapted to the scientific reality of farm household research in developing countries. For
example, Barbier and Bergeron (2001) simulated the effect of population pressure, market
integration, technological improvement, and policy interventions on economic decisions about
natural resource management in the hillsides of Honduras. Therefore, they applied a dynamic
linear programming model to a microwatershed, focusing on the sustainability of changing
farm production with a 20 year time horizon. For a study to evaluate the effects of particular
policy and technological changes on deforestation, land-use, and farm household income in
the Brazilian Amazon, Vosti et al. (2002) focused on smallholders’ decision making. They
explored land-use determinants with a multivariate regression analysis, and used a linear
programming model that explicitly incorporates biophysical constraints on production to
simulate household responses’ to policy and technology changes. The model does not account
for risk, as the farmer has information about alternative production activities, the impact of
the agricultural activities on the soil and nutrient availability and input and output prices. In
the same region Börner (2005) assessed policy options to target rural poverty and
environmental degradation under technological and economic changes. His linear and non-
linear mathematical programming model also included a biophysical component of a set of
crop specific yield damage functions. A 25-year simulation horizon was chosen because of
inter-temporal decision making due to fallow periods forming part of the farming system. All
these bio-economic studies examine issues involving the interplay between economic and
particular biophysical variables. They investigate how individuals manage multiple
biophysical processes to generate human welfare, with consequent changes in stocks and
qualities of the natural resources. These models all account explicitly for changes in
biophysical input availability (e.g. soil nutrients, climate), their impact on crop growth, and
their effect on economic decisions about land-use management, which in turn alters input
stocks for the next period (Vosti et al. 2002). All these studies integrated two different types
of data sets on the economic and biophysical components, as they were part of bigger research
projects. None of these studies have been considering payments for environmental services
provided by the farmers through their land-use systems. Máñez Costa (2004) developed a
linear programming model to calculate the income of farming systems in Guatemala which
can be differentiated according to the provision of environmental services. The farmers incur
income losses due to the adoption of systems, which generate these services. Therefore, she
calculated the extent of payments necessary as a compensation based on existing
environmental measures. These measures are all based on changes in the farming techniques
or specific conservation approaches, however, no payments are considered for the intangible

Chapter 5 63
services provided by the farming systems themselves, such as biodiversity conservation or
carbon sequestration.
5.3.3. Models of Carbon Sequestration Economics
As all the reviewed optimisation models above have not addressed carbon sequestration, a
brief appraisal will be done on studies and methodologies which were conducted to assess
economic impacts of carbon sequestration. However, very few of these use optimisation
techniques. De Koning et al. (2002) investigated the carbon sequestration potential of
afforestation projects and secondary forests in Ecuador and Argentina and conducted an
economic analysis of different land-use systems. The net present value was determined of
these systems and compensation payments for the landowners calculated to induce a change
from agricultural activities to forestry, assuming timber production and carbon sequestration.
The compensations reflected the opportunity cost of land-use change. The income per hectare
for the landowners from compensations for carbon sequestration was obtained, indicating that
forestry projects are not competitive without these payments compared to cattle ranching.
Also Santos and Bauer (2006) conducted a cost-benefit analysis, using the net present value
and internal rate of return as criteria to evaluate forestry-carbon activities for a region in the
Brazilian Amazon. The authors of a study in northern Sweden also employed a linear
programming model which maximises the net present value of wood production and carbon
sequestration for a 3.2 million hectare region (Backeus et al. 2006). For a management
programme they determined the maximised objective function for wood harvesting, biofuel
production and carbon storage. The approach of this study differed in comparison to the
research at hand as the optimal harvest levels were determined for the entire region using
different carbon prices. Focusing on the household level, Antle et al. (2007) assessed the
economic impacts of agricultural carbon sequestration for terraces and agroforestry in Peru.
They employed an econometric-process simulation model to simulate farmers’ land-use and
management decisions with respect to carbon contracts. The impact of carbon contracts on the
adoption rate of terraces and agroforestry practices was assessed and provided input to the
regional policy analysis with the aggregated results of various models. Additionally, they
investigated the potential of the contracts to alleviate poverty.
5.3.4. Present Model Specifications
The present study aims at better understanding the land-use systems and determinants for
land-use decisions in the vicinity of the TNLL, as well as the impact of different policy
options for payment scenarios for environmental services. We are looking at smallholder

64 Quantitative Research Design
farming systems with a mixture of paddy rice, maize and cacao agroforestry systems. Hence,
we selected a model approach, which is appropriate for the present circumstances, from the
reviewed types of models. In order to portray the different options that a farm system has, we
chose a static single year linear programming model for several reasons. It proves to be a
flexible tool for modelling farm decisions and allows for the inclusion of adjustments in the
resource allocation due to changes in the attractiveness of the different activities, as well as
taking into account the simultaneous decision-making on consumption and production.
Stochastic or econometric models such as the study by Antle et al. (2007) with sufficient
detail in the production activities would have far greater data requirements. Long-term
considerations are an important component in forestry projects, as investments at the
beginning are followed by a period of low income, hence time lags between investment and
return are to be observed. Also in some agroforestry projects different timings for improved
fallows are taken into account and hence, longer time horizons are brought into the model,
such as the four year planning period in Mudhara and Hildebrands’ study (2004). In the
research region most of the agroforestry plots contain trees of mixed age, and there is no
clearly defined investment period and time of returns. Hence, the time lag between investment
and returns has been ignored, as there are always some trees which can already be harvested
whilst the others still mature. The initial investment costs are very low and the additional
labour in the first three unproductive years cannot be clearly separated from other activities
necessary for the already productive trees on the cacao plots. Therefore, for the study at hand
a single year model seemed to be sufficient in regards to the study objectives. Because of the
already mentioned time and financial constraints, no biophysical crop simulation for the
agroforestry plots was carried out in the model. Crop production is assumed to be constant,
and changes in soil carbon over time are not considered, which was mentioned already in
5.2.1. As the farm condition is assumed to be stable and the farmer has information about
alternative production activities, and input and output prices, no risk is included in the model.
To determine the values to be incorporated into the objective function, in the survey the
respondents were asked about their daily activities pursued during an average day and had to
rank these in the order of importance to them. Activities such as agricultural production for
sales, as well as religious activities were of highest importance to them, followed by
agricultural production for home consumption, spending time with their family, resting and
watching television. Thus, given the objective function, the solution procedure in the model
aims at maximising total gross margin of the farm by finding the optimal set of the different
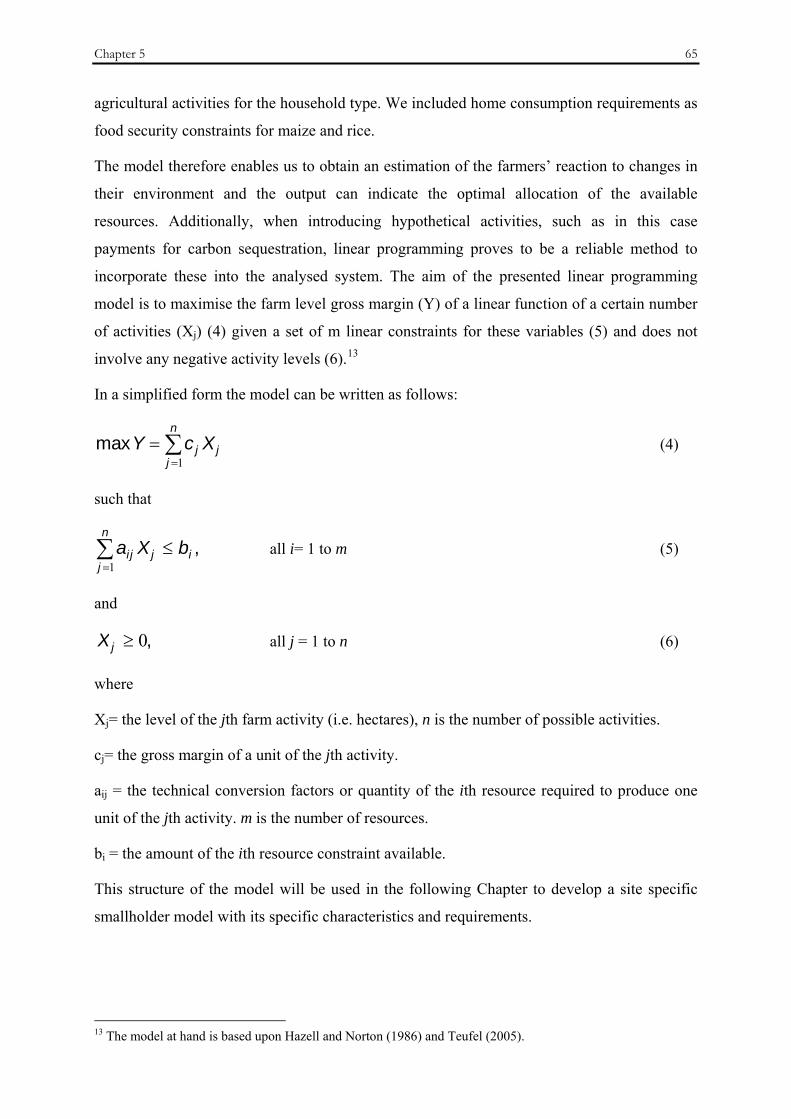
Chapter 5 65
agricultural activities for the household type. We included home consumption requirements as
food security constraints for maize and rice.
The model therefore enables us to obtain an estimation of the farmers’ reaction to changes in
their environment and the output can indicate the optimal allocation of the available
resources. Additionally, when introducing hypothetical activities, such as in this case
payments for carbon sequestration, linear programming proves to be a reliable method to
incorporate these into the analysed system. The aim of the presented linear programming
model is to maximise the farm level gross margin (Y) of a linear function of a certain number
of activities (Xj) (4) given a set of m linear constraints for these variables (5) and does not
involve any negative activity levels (6).13
In a simplified form the model can be written as follows:
∑=
=n
jjj XcY
1max (4)
such that
,∑=
≤n
jijij bXa
1 all i= 1 to m (5)
and
,0≥jX all j = 1 to n (6)
where
Xj= the level of the jth farm activity (i.e. hectares), n is the number of possible activities.
cj= the gross margin of a unit of the jth activity.
aij = the technical conversion factors or quantity of the ith resource required to produce one
unit of the jth activity. m is the number of resources.
bi = the amount of the ith resource constraint available.
This structure of the model will be used in the following Chapter to develop a site specific
smallholder model with its specific characteristics and requirements.
13 The model at hand is based upon Hazell and Norton (1986) and Teufel (2005).
66 Quantitative Research Design
5.4. Summary
This Chapter provides an overview of the methodology used to obtain the required input for
the analysis of the farm households and their behaviour when offering them market-based
incentives for carbon sequestration. The data for the analysis of the prevailing land-use
systems was collected in a household survey in six villages, using a standardised
questionnaire. The villages, as well as the households had been selected on the basis of
existing data from previous surveys in the research region. Using the carbon accounting
technique we calculated the carbon sequestration rates of the agroforestry systems and the
evolving payments to be obtained. Additionally, the amount of carbon saved when avoiding
deforestation in the TNLL was determined. Finally, different methodological approaches for
farm household modelling were evaluated, leading to the choice of the linear programming
model. It allows for an estimation of the farmers’ reaction to changes in their environment, as
well as to policies and the output can indicate the optimal allocation of the available
resources. The structure of the model provides the basis for the analysis in Chapter 7.
Chapter 6 67
6. QUALITATIVE RESEARCH DESIGN
6.1. Methodology for Analysis of Institutional Framework
This Chapter describes the methods which were employed for the analysis of the second part
of the study. It starts out with an explanation of the qualitative research approach and the
reasons for its adequacy for the present investigation; this includes an outline of the criteria
used for the selection of the research villages, as well as the participatory rural appraisal tools
used in the data collection. Some socio-economic background information on these villages is
also provided. Finally, we will explain the method of the focus group more in-depth and
outline the selected content analysis methodology for the systematic text investigation.
The analysis of the second part of the research concentrates on the institutional setting for
natural resource management processes. We will therefore be assessing whether the KKMs
could provide the institutional structure for a carbon sequestration project, and allow for an
active involvement of local stakeholders, as well as for monitoring and enforcing the project
performance. A qualitative research design was adopted in order to assess this institutional
arrangement and the four topics outlined in the objectives in the conceptual framework in
Chapter 3 (institution, participation, monitoring & enforcement and status of the
environment). The main motivation to opt for this approach was to obtain information on the
impact the agreements had in the village. Through the analysis of changes in the vegetation
cover, one can assess whether or not the forest margin has remained stable since the
introduction of the agreements. Surveys allow for obtaining data on the number of rules
associated with the agreements and how often the regulations had been violated. However, it
is also essential to examine what is happening within the village; whether the institutional
arrangement has allowed for the participation of the community, which structures have been
68 Qualitative Research Design
established and if the villagers observe changes in the impact on the environment associated
with the new institution. The perceptions, thoughts and evaluations of the people living in
these villages are therefore considered important. The discussions we carried out were aimed
at acquiring an in-depth insight into the participation processes in the formation of the
agreements and the perceived impact on the status of the environment, as well as their
regulatory structure.
Qualitative methods typically refer to a range of data collection and analysis techniques which
employ purposive sampling, participant observation and semi-structured, open-ended
interviews. Sampling is guided by the search for contrast to clarify the analysis and achieve
optimum identification of emergent categories. Thus, particular samples are selected to
identify and illustrate specific phenomena (Glaser and Strauss 1967). The aim is to capture
and understand individual definitions, descriptions and meanings of events. Qualitative
techniques, which we have used to both produce and analyse textual data, allow for an in-
depth analysis of social, political, and economic processes (Dudwick et al. 2006).
Open-ended questioning and focus group discussions are particularly appropriate in
community settings to allow respondents to identify and articulate their priorities and
concerns free from researchers’ restrictions and assumptions. One of the key issues related to
qualitative research is whose voices and opinions are heard and communicated to outsiders as
a consequence of the research (Chambers 1997). In a village community different groups may
have overlapping or contrasting experiences of social norms, networks and management
processes. With the help of qualitative methods researchers can explore the different views of
homogeneous as well as very diverse groups of people in order to help reveal the variety of
perspectives within a community. Furthermore, the integration of non-scientific knowledge,
values and preferences through social discourse will improve the quality of research by giving
access to practical knowledge and experience and to a wider range of perspectives and options
(Asselt Marjolein and Rijkens-Klomp 2002). We therefore were interested in the perspectives
of the community members where the agreements have been established, to help enrich the
discussion on arrangements for natural resource management processes.
There are obviously disadvantages and shortcomings associated with qualitative research
which need to be acknowledged and kept in mind. As Abercrombie (1988) points out, social
science research in general can never be objective because of the subjective perceptions of
both the researcher as well as the respondent. Usually, all propositions will be limited to their
meaning to a particular language context as well as social groups. Additionally, the researcher

Chapter 6 69
will often unintentionally impose his own value judgements and finally all observations are
theory laden.
Four main limitations of qualitative research can be put forward (Dudwick et al. 2006). The
first shortcoming is the ability to extrapolate the findings to a wider population, due the
selected sample size being usually quite small and not randomly selected. Secondly, because
groups may be selected by the researcher himself or on recommendation of others, a difficulty
arises in replicating, and independently verifying the results of qualitative research. Thirdly,
when it comes to analysing the collected data, typically in the form of interview transcripts or
observation accounts, interpretation is necessary. In such a situation two researchers looking
at the same data may arrive at somewhat different conclusions. Finally, it is difficult to control
for external mitigating factors in the research, which makes it sometimes complicated -but
again, not impossible- to make compelling claims regarding causality on the basis of
qualitative data alone.
In order to ensure the quality of the research and overcome these limitations as much as
possible, reliability and validity are essential criteria for qualitative research. For the conduct
of research one needs to be methodical with consistency and comprehensiveness of analytic
procedures being exercised at all times. Based upon the more general considerations, as well
as specific criteria, certain procedures have been elaborated which should be followed and
satisfied to secure the quality of the results (Gropengießer 2001; Bortz and Döring 2006).
To guarantee selection validity and overcome the critique of presenting results on extreme
cases, an emphasis is made to select “normal” interview partners. The technique validity
should be ensured, taking into account six quality factors (Mayring 2002).
1. Technique documentation – detailed documentation of the procedures of the
collection, preparation and analysis of the data.
2. Argumentative interpretation validation – the interpretation has to be justified in an
argumentative style and needs to be coherent. Certain criteria can be used, such as an
adequate pre-understanding of the interpretation, which allows for a more theory-
derived analysis.
3. Rule-guided working method – qualitative research needs to be open towards the
subject of research, but must also pursue certain pre-arranged steps of analysis in order
to assess it.
70 Qualitative Research Design
4. Closeness to the object – the researcher needs to be as close as possible to the normal
course of life of the subject of research.
5. Communicative validation – the validity of the research can be verified by confronting
the respondent with the results.
6. Triangulation – different analysis paths should be considered to try and find different
solution approaches for the same question and the results should be compared.
Even if the selection and technique validity criteria have been fulfilled, the results could still
be extreme outliers and only apply to a specific sample. Therefore, the correlative validity of
the results should be ensured, whereby the obtained results need to be compared with other
research findings.
To conclude, it is important to be aware of the problems associated with qualitative research
and to conduct careful planning, methodology and execution of the research. However, when
the guidelines are followed, the limits of the chosen specific research design are
acknowledged, and a good-faith effort is made to minimise the shortcomings, qualitative
research can provide well-founded and rounded results which are of practical relevance for
social science research.
6.1.1. Data Collection
For the research we chose four villages in the surroundings of the National Park. The main
selection criterion for the villages was that they had to have a Community Conservation
Agreement (Kesepakatan Konservasi Masyarakat - KKM)14. According to a survey on
community forest use and the conservation agreements in the surroundings of the TNLL
conducted in 2006 by Palmer, 49 out of the total sample of 72 villages reported that they had
negotiated or were in the process of establishing a KKM (2007). Through discussions in June
2006 with different NGOs - The Nature Conservancy (TNC), Association of Evergreen
Indonesia (Persatuan Evergreen Indonesia -PEI), Jambata Foundation and Free Earth
Foundation (Yayasan Tanah Merdeka -YTM), we obtained important information on the
agreements and their status. Each organisation has carried out substantive work in the
majority of the villages in the research region and have been involved in the establishment of
the KKMs. TNC is an international NGO and Jambata and PEI are Indonesian NGOs and they
all focus on environmental issues, whereas the Indonesian organisation YTM is traditionally
14 The agreements are explained in more detail in Chapter 8.1.1.
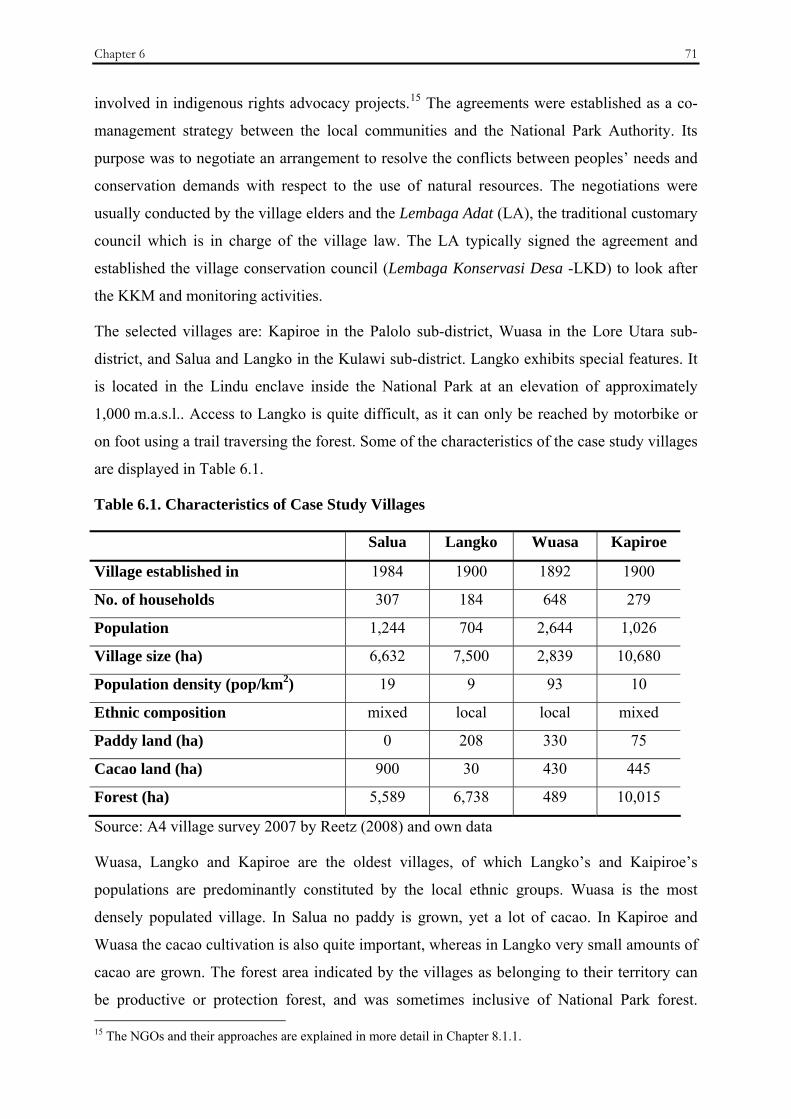
Chapter 6 71
involved in indigenous rights advocacy projects.15 The agreements were established as a co-
management strategy between the local communities and the National Park Authority. Its
purpose was to negotiate an arrangement to resolve the conflicts between peoples’ needs and
conservation demands with respect to the use of natural resources. The negotiations were
usually conducted by the village elders and the Lembaga Adat (LA), the traditional customary
council which is in charge of the village law. The LA typically signed the agreement and
established the village conservation council (Lembaga Konservasi Desa -LKD) to look after
the KKM and monitoring activities.
The selected villages are: Kapiroe in the Palolo sub-district, Wuasa in the Lore Utara sub-
district, and Salua and Langko in the Kulawi sub-district. Langko exhibits special features. It
is located in the Lindu enclave inside the National Park at an elevation of approximately
1,000 m.a.s.l.. Access to Langko is quite difficult, as it can only be reached by motorbike or
on foot using a trail traversing the forest. Some of the characteristics of the case study villages
are displayed in Table 6.1.
Table 6.1. Characteristics of Case Study Villages
Salua Langko Wuasa Kapiroe
Village established in 1984 1900 1892 1900
No. of households 307 184 648 279
Population 1,244 704 2,644 1,026
Village size (ha) 6,632 7,500 2,839 10,680
Population density (pop/km2) 19 9 93 10
Ethnic composition mixed local local mixed
Paddy land (ha) 0 208 330 75
Cacao land (ha) 900 30 430 445
Forest (ha) 5,589 6,738 489 10,015
Source: A4 village survey 2007 by Reetz (2008) and own data
Wuasa, Langko and Kapiroe are the oldest villages, of which Langko’s and Kaipiroe’s
populations are predominantly constituted by the local ethnic groups. Wuasa is the most
densely populated village. In Salua no paddy is grown, yet a lot of cacao. In Kapiroe and
Wuasa the cacao cultivation is also quite important, whereas in Langko very small amounts of
cacao are grown. The forest area indicated by the villages as belonging to their territory can
be productive or protection forest, and was sometimes inclusive of National Park forest. 15 The NGOs and their approaches are explained in more detail in Chapter 8.1.1.

72 Qualitative Research Design
According to these numbers Kapiroe has the largest forest resources, whereas Wuasa has the
smallest amount.
Discussions with the NGOs provided us with important information on the villages, as well as
their KKMs, and we used three main criteria for the selection of these villages. These were;
the negotiation stage of agreement, the location of the village and the ethnic composition.
1. The main criteria for selection are that the four villages are at different stages of
negotiation or execution of the KKM (Table 6.2.). In Wuasa the negotiation process
first commenced in 1999 and the agreement was signed between the village headman
and the head of the sub-district Lore Utara in 2002. The National Park Director
recognised the agreement shortly afterwards and the community conservation
agreement became legal and was implemented.
Similarly, in Langko, the negotiations started in 2004 and they have already been
signed by the head of the TNLL. The customary council and TNC began negotiations
in Kapiroe in 2005 but the agreement is yet to be signed. In Salua different institutions
have been working with KKMs. CARE carried out a programme called “Biodiversity
Conservation for the National Park” between 1995 and 2000. Its purpose was
sustainable agricultural development to support the conservation and management of
the National Park. CARE initially promoted the agreements as an accompanying
measure to their development programme. However, after completing their first phase
of project activities in the area in 2000, they stopped any further support for them
(Mappatoba and Birner 2004).
The Central Sulawesi Integrated Area Development and Conservation Project
(CSIADCP), which was established in 1998 and lasted until 2005, focused on
supporting community welfare in the villages in the bufferzone of the TNLL
(ANZDEC 1997). They also promoted KKMs, called traditional KKM (Kesapakatan
Konservasi Masyarakat Adat -KKMA). Thus, in Salua the first KKM negotiation
process was initiated by CARE in 1996 but never finalised, then taken up by
CSIADCP in 2004. The process was eventually finalised by 2006. This range of dates
for the start of the negotiation process is in line with Palmers’ survey (2007). The first
negotiations started in 1995 and only 38 of 49 villages had their agreements
recognised or acknowledged by TNLL in 2006.
2. All four villages are located in different points around the TNLL, one towards the
north-east, one in the east, one in the west and one in the centre of the National Park
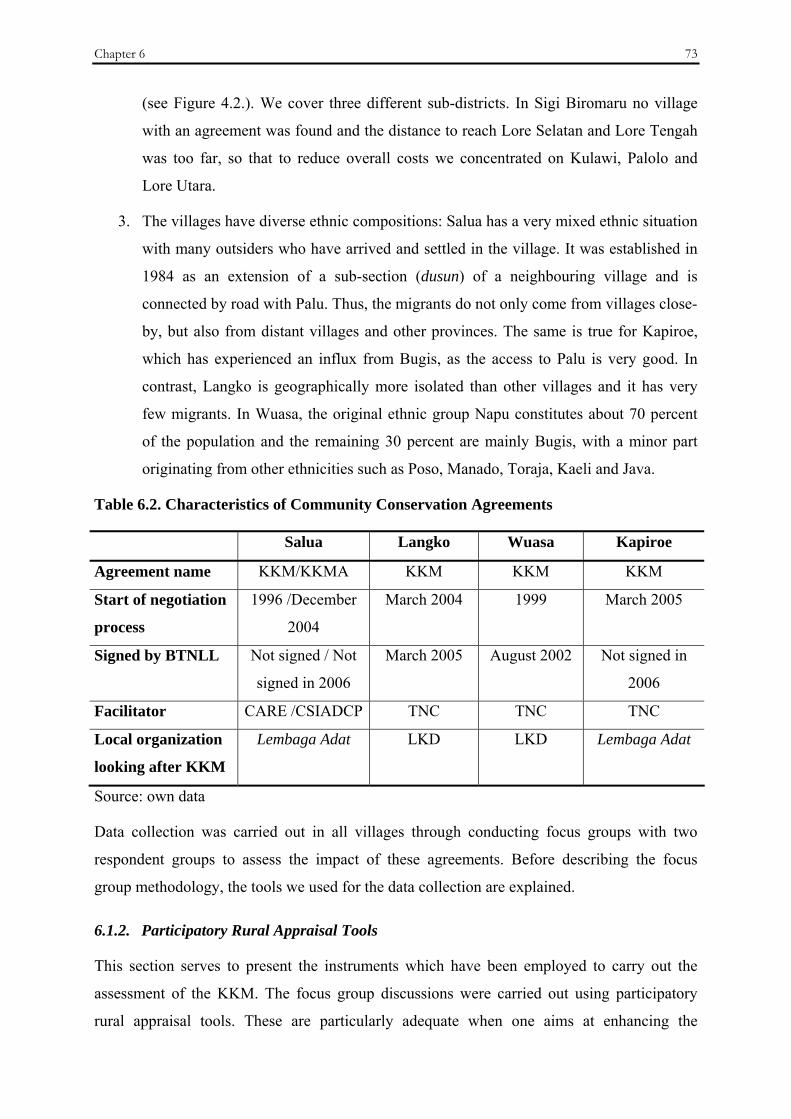
Chapter 6 73
(see Figure 4.2.). We cover three different sub-districts. In Sigi Biromaru no village
with an agreement was found and the distance to reach Lore Selatan and Lore Tengah
was too far, so that to reduce overall costs we concentrated on Kulawi, Palolo and
Lore Utara.
3. The villages have diverse ethnic compositions: Salua has a very mixed ethnic situation
with many outsiders who have arrived and settled in the village. It was established in
1984 as an extension of a sub-section (dusun) of a neighbouring village and is
connected by road with Palu. Thus, the migrants do not only come from villages close-
by, but also from distant villages and other provinces. The same is true for Kapiroe,
which has experienced an influx from Bugis, as the access to Palu is very good. In
contrast, Langko is geographically more isolated than other villages and it has very
few migrants. In Wuasa, the original ethnic group Napu constitutes about 70 percent
of the population and the remaining 30 percent are mainly Bugis, with a minor part
originating from other ethnicities such as Poso, Manado, Toraja, Kaeli and Java.
Table 6.2. Characteristics of Community Conservation Agreements
Salua Langko Wuasa Kapiroe
Agreement name KKM/KKMA KKM KKM KKM
Start of negotiation
process
1996 /December
2004
March 2004 1999 March 2005
Signed by BTNLL Not signed / Not
signed in 2006
March 2005 August 2002 Not signed in
2006
Facilitator CARE /CSIADCP TNC TNC TNC
Local organization
looking after KKM
Lembaga Adat LKD LKD Lembaga Adat
Source: own data
Data collection was carried out in all villages through conducting focus groups with two
respondent groups to assess the impact of these agreements. Before describing the focus
group methodology, the tools we used for the data collection are explained.
6.1.2. Participatory Rural Appraisal Tools
This section serves to present the instruments which have been employed to carry out the
assessment of the KKM. The focus group discussions were carried out using participatory
rural appraisal tools. These are particularly adequate when one aims at enhancing the
74 Qualitative Research Design
participation of community members in assessments. On the basis of an extensive literature
review Asselt Marjolein and Rijkens-Klomp (2002) define participatory methods as “methods
to structure group processes in which non-experts play an active role in order to articulate
their knowledge, values and preferences”. These methods usually entail group methods.
As explained in 6.1.1, we selected the four villages of Kapiroe, Wuasa, Salua and Langko in
the vicinity of the National Park. In every village two focus group meetings were held in June
and July 2006. One group was purposively selected and consisted of the local village
authorities, such as the village headman or the village secretary, as well as members of the LA
and the LKD. The second group comprised villagers, which we randomly selected by walking
through the village and asking farmers whether they wanted to participate in the meeting. We
separated the respondents into these two groups to avoid the domination of the discussion by
the authorities, as well as to ensure that the farmers did not feel inhibited in front of their
leaders and could speak freely.
In each meeting around five people assisted and the discussions lasted approximately two and
a half to three hours. As my knowledge of the Indonesian language was not sufficient to
conduct a group discussion by myself, the workshops were facilitated by two Indonesian
assistants under my supervision. The structure of the discussion and the different topics to be
covered had been elaborated by me beforehand, and with the team we discussed this outline
for them to feel comfortable to guide the meeting (see Appendix IV for the outline). During
the gatherings I was present and could intervene or provide additional comments which were
integrated into the discussion. All focus groups were recorded and later transcribed and
translated into English. It should be noted that a translation will usually imply some loss of
information. Yet, the workshops were always followed up by an evaluation session of our
small team where all in attendance wrote down the main points, impressions, as well as the
atmosphere during the discussions - these working notes helped to complete the transcripts of
the discussions. Additionally, all labelled cards from the evaluation session were
photographed, in order to keep an extra record of the assessment of the participants. Whilst
analysing the contents of the discussion, if there were ambiguous parts in the translations, I
usually discussed these with one of the assistants in order to clarify the doubts. The
methodology ensured that the transcribed and translated interview material was as thoroughly
checked for possible misunderstandings as was feasible. See Appendix V for some pictures
taken during the focus groups.
Chapter 6 75
The meetings started with a warm-up session during which the participants had to draw a map
of their village and the adjacent forest. This served to indicate which area was part of the
KKM, as well as the location of the different types of forest, such as the National Park forest,
or adjacent protection forest (hutan lindung) or productive forest (hutan produksi).
Furthermore, in some villages traditional land and forest zones exist, which were outlined and
their specific uses or functions explained, as well as the areas monitored by the LKD. On the
maps it was observed where illegal logging or rattan collection had taken place in the past or
still occurred. In the initial session we therefore obtained some general information about the
KKMs and the different involved organisations, as well as an impression of the familiarity of
the group with the agreements. This first part was followed by a brainstorming session, giving
the participants the chance to propose different themes they associated with the agreements.
They could contribute their opinions and ideas by writing them on cards which were all
displayed on a board. This allowed for the participation and feedback of all respondents, as it
was a free, interactive and non-committal way to explore options and views; all the
participants were encouraged that “all ideas are good ideas” (Borrini-Feyerabend et al. 2000).
The topics were ideas which could be positive or negative, impacts, results, consequences,
causes; any idea associated with KKM was seen as a contribution to the discussion.
Afterwards these cards were assigned to different topics. These were institution, participation,
education, monitoring, preservation, status of the environment, illegal resource extraction,
environmental impact and economic impact. Consequently, the participants were given a
range of scores from +3 (very good) to -3 (very bad), and asked to allocate them to each topic.
Through this method the participants could, as a group, determine how every topic scored
“Before KKM” and “After KKM”. This was then used to evaluate whether there was any
positive or negative impact caused by the KKM so far. As the agreements had not been signed
before the survey was conducted in the villages of Salua and Kapiroe, the participants
evaluated “Before the start of the KKM process” and “After the start of the KKM process”.
At the end of each session the facilitators presented a short introduction to the topic of
compensation payments and carbon sequestration in forestry ecosystems. Initial feedback
from participants was noted with regard to the possibilities of implementing conservation
agreements in all villages in the entire surrounding of the TNLL, and the necessary
monitoring efforts this would require. Furthermore, the issue of compensation payments was
discussed in terms of past experience and associated doubts and problems.

76 Qualitative Research Design
6.2. Focus Groups
For the purpose of the research at hand we wanted to obtain an evaluation of the KKMs, and
specifically their institutional structure and purpose, the participation and involvement of the
village stakeholders and the agreement’s impact on the status of the environment, as well as
the monitoring and enforcement structures. We were interested in various people’s opinions
and evaluations with respect to these topics. We therefore gathered the village members in
discussion or so-called focus groups to appraise and evaluate the agreements.
The qualitative research method of focus groups16 is usually employed in research designs
with the objective to gain an insight to opinions, attitudes and awareness of a group of people
with respect to a specific topic. It entails the explorative virtues of being a communicative and
open technique (Krüger 1983). There are various definitions for this method, but we selected
one which gave a good all-encompassing description: “The focus group is a special type of
group in terms of purpose, size, composition, and procedures […] In summary, a focus group
is a carefully planned discussion designed to obtain perceptions on a defined area of interest
in a permissive, non-threatening environment (Krueger 1994 p.6)”.
Group discussions are a relatively young method in comparison to other techniques in
empirical social research. In the USA they were employed by Lewin in the field of
psychology as early as the 1930s. He was essentially working with experimental small groups,
and did not focus so much on the factual result of the discussion but more on the group, the
participants and its dynamics. His particular interests were leadership styles and behaviour
and responses by the group members. Similarly, the sociologist Bales (1950) placed his
emphasis on the interaction processes in the groups. In the USA focus group discussions have
been used mainly for market and opinion research in order to prepare consumer surveys or
investigate motivation structures among consumers. Merton and Kendall (1946) developed a
fairly standardised set of procedures for interviewing groups, but it was covered in oblivion
and it was not until the late 1960s that the technique began to be used regularly. It has
subsequently grown in popularity (Greenbaum 1998). In Germany the Frankfurt Institute for
Social Research started to work with group discussions in the 1950s. Their focus was on
accounting for the comprehensive group process discussion results. Thus, their discussions
were primarily used to obtain the content-thematic issues of the discussed topics.
16 The terms “focus groups“ and “group discussions” are used interchangeably, as there is no uniformity with respect to the terminology. In the English language area various names are used, such as nominal group technique, brainstorming techniques, Delphi technique, focussed interview, group interview, focus group, group discussion, etc. Specifically the last two are used synonymously (Lamnek 2005).
Chapter 6 77
Four methodological approaches can be identified. According to Pollock (1955) group
discussions are used in order to determine the individual non-public opinion. The group is
seen as an important determinant to express personal attitudes and opinions in communication
processes, to indicate the non-public conviction with respect to a certain theme. Mangold
(1959, 1967) was interested in using group discussions as a method to obtain the informal
group opinion. He concentrates on the collective opinion which emerges during the process of
mutual interaction. The situation dependent group opinion is the main focus of Niessen
(1977). The social reality is only reflected by a group situation, which has an influence on the
generation of group opinions. Bohnsack (2003) points his attention towards investigating the
collective orientation patterns when aiming at explaining collective phenomena.
The main interest of all four concepts is the content findings of the discussion, whereas the
group processes and dynamics are not considered. Focus groups are considered to be more
realistic and close to daily life than the individual interview and hence can lead to more viable
and reliable results. This is in line with the purpose of the research at hand, since the present
research interests lay in the content of the informal group opinion, and not so much in the
individuals’ views or in the group processes or dynamics.
There are a variety of advantages associated with the focus group methodology in empirical
research designs (Mangold 1967; Wittenberg 2007). It proves to be an appropriate method to
explore the variation breadth with respect to a specific topic. The variety of participants in a
discussion can be a stimulation and encouragement for the individual to express his own
thoughts and opinion. Additionally, a focus group can stimulate the activation and expression
of deeper awareness contents and provoke spontaneous, uncontrolled reactions; this allows us
to draw conclusions on the latent content of the expressed opinions (Mangold 1967). The final
advantage is that when the research objective is to explore a new field of investigation, this
can be done with reduced effort, personnel, time and cost. Clearly, there are also
disadvantages which need to be kept in mind: Irregular participation of the respondents in the
discussion can arise due to social and language barriers and sometimes opinions may be
suppressed in order to conform to the group opinion. Furthermore, a bias can be introduced
due to the prevailing group dynamic trends, as well as the erratic contributions of participants,
e.g. opinion leaders or silent participants can make a standardisation impossible. Finally, as
with all qualitative research, reliability and validity are an issue. However, when certain
quality criteria are met and specific procedures are implemented, these concerns can be
overcome.

78 Qualitative Research Design
In order to assure the validity and quality of the research, we adhered to the quality criteria as
outlined in section 6.1. We specifically chose to discuss the research topics in two groups, and
since the individual participants of one group were purposively selected, the members of the
other group were chosen randomly to guarantee a selection of average, “normal” respondents
(selection validity). The advantage of focus groups is that the structured discussion gives the
space to express individual opinions in a permissive, non-threatening environment. This was
additionally supported by the separation of the respondents into two discussion groups to give
them the space to articulate their views. We acknowledge the importance of the participation
of these groups, as it allows to “involve those affected by, knowledgeable of, or having
relevant expertise or experience on the issue at stake in knowledge production and/or
decision-making” (van Asselt and Rijkens-Klomp 2002). It is most likely that the perceptions
with respect to the development of the agreement negotiation and establishment differ
between the groups and therefore it is relevant for this research to include these different
dimensions. To ensure the technique validity we settled on the focus group interview
methodology and carefully documented the different stages (see 6.1.2.). This also holds true
for the analysis technique (see 6.3.).
The theoretical framework, which underlies the present research and has also been used as a
foundation for the interpretation of the contents of the group discussions, has been delineated
in Chapter 3. Similarly, the necessary steps for setting up and organising a focus group have
been followed during the field research, as well as the rules and guidelines for the analysis of
the material collected during the meetings. We conducted the discussions directly in the
villages, usually at some public place such as the school or a villager’s home, thus providing
the advantage of respondents staying in their familiar environment. The results of the
interpretation of the discussion have been presented in three of the villages in workshops
carried out in February 2008. Thus, the findings have been mirrored by the same group
discussion participants, who participated in 2006. We discussed the results, as well as changes
which have been taking place since 2006, to allow us to assure the validity of the results. We
also conducted a further workshop in March 2008 with BTNLL, TNC and other organisations
working in the Lore Lindu region and presented and discussed the research results and the
feedback from the villages. Again, the findings were corroborated by the different institutions.
Finally, to ensure for correlative validity, the existing literature on KKMs and its research
findings (Mappatoba and Birner 2004; Burkard 2007; Palmer 2007; Thamrin 2007) have been
compared with the present research and similar patterns emerge.
Chapter 6 79
6.3. Content Analysis
For the systematic text analysis of the group discussions we chose a deductive, logical
approach, as we were interested in specific issues of the KKM. Thus, we used the qualitative
content analysis following Mayrings’ (2007) approach order to apply a rule-guided,
reproducible assessment of the group discussion interview material. This involves the
transcription of the data for the analysis of the substantive content (Bloor 2001) and
consequently data indexing, data storage and retrieval, and interpretation.
We will first present an overview of the method and then explain the steps taken for the data
analysis for this research.
The qualitative content analysis is the longest established method for examining a text among
the empirical methods of social investigation (Titscher et al. 2000) and can be defined as “the
use of a replicable and valid method for making specific inferences from the text to other
states or properties of its source” (Krippendorff 1980). Its aim is to analyse recorded or
documented material derived from any kind of human communication. A systematic, as well
as rule- and theory-guided procedure is pursued and allows for conclusions and inferences to
be made based on specific aspects of the communication (Mayring 2007). The development
of content analysis is fundamentally connected to the analysis of mass media and has gained
importance during the first half of the twentieth century in communication sciences. Other
areas of application are in hermeneutics (the process of communication and understanding), as
well as in the study of literature to allow for a systematic text analysis. Finally, in qualitative
social research it is used for interpretation.
For the analysis of text material an elaborate category system is developed which is adopted in
due course as a basis for the summarising interpretation of the data. Some authors also talk
about indexing the data in order to bring together all extracts of data that are pertinent to a
particular theme, topic or hypothesis (Coffey and Atkinson 1996). The categories, sometimes
also called index codes, are perceived as the more-or-less operational definitions of a variable
(Titscher et al. 2000). Thus, in an interview, the entire text will be searched for sections,
expressions, or words, which are relating to or expressed by this category (or code) and
consequently assigned to it. At the beginning these categories are likely to be quite broad, but
usually there is an entire set of categories – a category system – which develops and becomes
more narrow and focused as we work on the text material and follow a theory-guided
procedure. The main categories are further divided into subcategories in order to specify
80 Qualitative Research Design
certain aspects more in detail. The development of this coding system is crucial to the
analysis.
For indexing the data, a method is required which collects all extracts of text which have been
allocated to the same category, so that they can be retrieved for comparison with other
extracts of the same category. Nowadays, there are a variety of different softwares available
to facilitate the analysis of qualitative data, each allowing for the data storage and retrieval of
text by the given codes (Bloor 2001).
Another important differentiation is whether one chooses an inductive or deductive approach.
Qualitative research often uses a process of analytic induction. This involves the data
collection and a formulation of hypotheses based on the data, consequently testing the
hypotheses using the data and attempting to develop the theory. The theory is developed
during the investigation. It is called grounded theory because it arises out of and is directly
relevant to the particular setting under the study (Frankfort-Nachmias and Nachmias 1996).
Similarly, if the categories are derived when going through the interviews, an inductive
approach for developing the categories is taken, whereas, if the categories have been
developed by a theory-driven procedure, a deductive approach is followed. In this case the
research questions and hypothesis guide the structure of the coding system. In reality usually a
mixture between both approaches is carried out; one applies an a priori developed category
system to the interview text and then refines and amends it. Once the category system is
developed and all relevant text sections have been assigned, the data needs to be interpreted.
Mayring (2007) developed three different procedures in his content analysis technique which
give guidance for the category development, as well as the data interpretation. The three
procedures underpinning the content analysis are Summary, Explication and Structuring. The
first approach reduces the material but preserves the main content. Using abstraction one
needs to create a summary which still reflects the initial material. Explication involves
explaining, clarifying and annotating the material. Thus, additional material is used to
explicate the specific text sections. The last approach aims at filtering specific aspects from
the material, using pre-formulated criteria. These techniques should not be blindly applied to
the text, but Mayring argues that one needs to adjust and modify them according to the
material at hand. When required, techniques can be mixed, but should keep as close as
possible to the initial form of interpretation. Thus, for the analysis of the interview material
from the focus groups on KKM, we selected the structuring content approach. It was

Chapter 6 81
appropriate for our research needs, as only the text sections with respect to specific topics and
content realms were extracted and summarised.
Having explained the method, we now turn to the actual data analysis, which consisted of four
steps, following a deductive and theory-driven approach. The first analytical step was the
development of a category system based on the research objectives (Chapter 1) and the
analytical framework (Chapter 3). We obtained the main structure of the category system
which was additionally guided by the four focus points of the analysis (Chapter 1 & 3). This
category system was a requirement for the second step during which we conducted a
deductive analysis of the entire text material of one group interview and assigned sections,
quotes or words to the codes. This served to expand and reformulate the category system as
several codes had to be revised, renamed or some had to be divided into subcategories in
order to account for the richness of the interview texts and the data. Finally, we derived a final
version of the coding system. In the third step of the analysis we carried out the main run-
through of the text and the final category system was applied to all eight group interviews.
The entire coding analysis was carried out with the MaxQDA 2007 Software17. The fourth
step involved the data retrieval for each index code. The extracted material belonging to this
category was paraphrased and summarised according to whether it was a quote from the
decision maker or the farmer group. This served not only to check for differences between the
two groups, but also between the different villages. Consequently, the data was interpreted
using the research questions in order to falsify or verify them.
We ensured for the inter-coder reliability carrying out check coding as described by Miles and
Huberman (2004). Hence, coding is conducted separately by two independent coders. Another
researcher and myself performed the coding of the group interview and discussed the derived
categories. Disagreements about the assignment of sections to certain codes were examined
and the respective text sections recoded in consensus. The final inter-coder reliability was
calculated to be 90 percent across all categories and was considered to be a satisfactory value.
6.4. Summary
In order to address the conflicts which have been arising on the one hand through the
households’ needs to use the forest and its resources and on the other hand through the
conservation demands from a recognized National Park, conservation agreements have been
negotiated and established. Several NGOs participated in the negotiation between the villages
17 See www.maxqda.de

82 Qualitative Research Design
and the National Park Authority. Four villages, which are at different stages of negotiation or
execution for these agreements have been selected for an in-depth case study on the impact of
these institutional arrangements on natural resource management processes. This Chapter
reviews the qualitative research design chosen for the analysis, illustrating the participatory
tools we used to work with the community members. Furthermore, the focus group method
employed for the data collection, as well as the content analysis method for the data
interpretation and both their theoretical founding are explained.
Chapter 7 83
7. CARBON PAYMENTS FOR AGROFORESTRY SYSTEMS
7.1. Farm Household Modelling
In this section the farm households of the research region will be portrayed with their different
agricultural enterprises, as well as their forest conversion activities using a linear
programming model. Three components are vital for the model, which need to be well
defined: the objective function and the resource constraints of the farmers, and the
environmental services offered through the agroforestry systems. Therefore, we briefly
characterise the production environment in the region and the farm households. The structure
of the modelling process and inputs are explained, which are built upon the review of linear
programming and carbon sequestration methodologies in Chapter 5.3., and the model
structure with equations (4) to (6). A static comparative model is developed maximising the
objective function of farm level gross margin subject to specific local requirements, such as
the food security constraint, and we then develop the baseline – status-quo – situation of the
farmers. In the second part of this Chapter several scenarios will be introduced, which assess
different payment options for carbon sequestration. The impacts on the land-use systems of
variations in carbon credit prices and discount rates is assessed, as well as at which level of
credit prices households have an incentive to keep or switch towards the shade grown cacao
AFS. In the last scenario, payments for avoiding further deforestation, i.e. for the carbon
saved by not clearing forest, are introduced into the model.
7.1.1. Farm Households in the Lore Lindu Region
As discussed in Chapter 4.2. Lore Lindu is predominantly a rural region. 87 percent of the
farmers depend on agricultural activities as their main income source (Maertens et al. 2006).
84 Carbon Payments for Agroforestry Systems
According to the STORMA A3 village survey in 2001 about half of the agricultural area is
allotted to perennial crops, mainly cacao and coffee, and to a lesser degree coconut, vanilla,
pepper, and clove. Approximately one third is allocated to paddy rice, the principal food crop.
Other annual crops, such as maize, upland rice, peanuts, cassava vegetables and soybeans as
well as homegardens are found on the remaining land. Rice is above all produced for home
consumption, while cacao and coffee are cash crops and mainly destined for export. As
mentioned previously, during the last 20 years the paddy rice area increased by 20 percent,
and the area dedicated to perennial crops tripled. Because of its specific cultivation
requirements paddy rice production is found in the lowland areas, and upland rice and maize
are cultivated in the more hilly parts. Also coffee and cacao are usually grown in the upland
regions where new land was acquired often by expanding into the forest margin. 38 of 80
villages reported that they have agricultural land inside the National Park and on average the
households have acquired 30 percent of their land by clearing forest (STORMA 2003).
With the help of a poverty assessment tool based on principle component analysis (Zeller et
al. 2006) the households in the region were classified into poverty groups according to their
relative welfare. The N (0.1)-normally distributed poverty index allows the grouping of
households into terciles and makes it possible to draw comparisons between the poorest, poor
and better off households. The poorest and local households were found to have acquired on
average 7.9 ha of land by clearing primary forest, whereas better-off and migrant households
obtained on average 18.1 ha by purchase (Nuryartono 2005). The observed pattern is that
because the local population has sufficient labour available, they can clear the plots in the first
place, establish ownership rights, and then sell these plots to migrants who lack the access to
the informal land-use rights (Ebersberger and Weber 2005). Among the poorest households a
higher percentage have been clearing forest since 1999 than among the less-poor (28 percent
versus 11 percent respectively). There is no significant difference between the mean area
cleared, but the better-off households convert less forest (0.6 ha during five years) than the
poor households (1.17 ha) (Schwarze et al. 2006). The same authors determined with a probit
model that the probability for a household to engage in deforestation declines with increasing
wealth, the share of irrigated land in total land owned and non-agricultural income-earning
activities.
7.1.2. Model Inputs
The linear programming model developed for the Lore Lindu region is based on empirical
household data. The major agricultural activities of the farming households are annual crops,

Chapter 7 85
such as paddy rice, upland rice, maize; perennial crops such as cacao, coffee, bananas,
coconut and fruit trees, as well as livestock activities. Animal husbandry is of minor
importance in the area and does not absorb a lot of land or labour. Schwarze (2004) derived in
his study that only 8 percent of the total household income is contributed by livestock in this
region. Similar results are obtained by Keil (2004), who concluded that only 29 percent of the
households own 2.4 heads of cattle and 2.2 percent own 3 heads of buffalo on average.
Therefore animal husbandry has not been included in the model.
As explained in Chapter 5.2.1., the agroforestry systems (AFS) in the region are characterised
by different shade tree density and management intensity and are subsequently divided into
four types: D (natural forest trees as shade trees), E (shaded by a diverse spectrum of planted
trees and trees naturally grown after clear-cutting), F (shaded by planted trees), and type G
(no shade trees). These AFS constitute the basis to characterise the four household categories
which are the focal point for the analysis. We categorised the households according to the
dominant AFS among their cacao plots, and determined four corresponding household types
(HHD - HHG). For example, the household type G (HHG) has a total of 1.1 hectares of cacao
plots, of which the major area is made up by the G type AFS plots (0.79 hectares), but he also
has a small plot of E type cacao (0.33 hectares). Apart from the cacao plots, all household
categories also have paddy rice and upland rice, as well as maize plots. Consequently, for all
four household types a separate linear programming model was developed and the four annual
and perennial crops constitute the different activities. The general structure of the modelling
approach is shown in Figure 7.1. The data collected at the farm level provides the basic set of
descriptive data, and enables the calculation of the gross margin for the agricultural activities.
Given the objective function, the solution procedure maximises total gross margin by finding
the optimal set of activities for the household type, under the given restrictions such as farm
size, suitability of the land for various crops, family work force, and the seasonal peak
requirement of labour for each activity. Additionally, the solution procedure also maximises
the returns from the sales of timber, which the household obtains when they convert forest.
Various economic-political-environmental parameters from the research region form the basis
for the calculation of deforestation activities and carbon payments for the AFS. New
production techniques and packages can easily be incorporated by adding further activities to
the model. The farm condition is assumed to be stable, and risk and time dimensions are not
included in the model as explained in section 5.3.4.
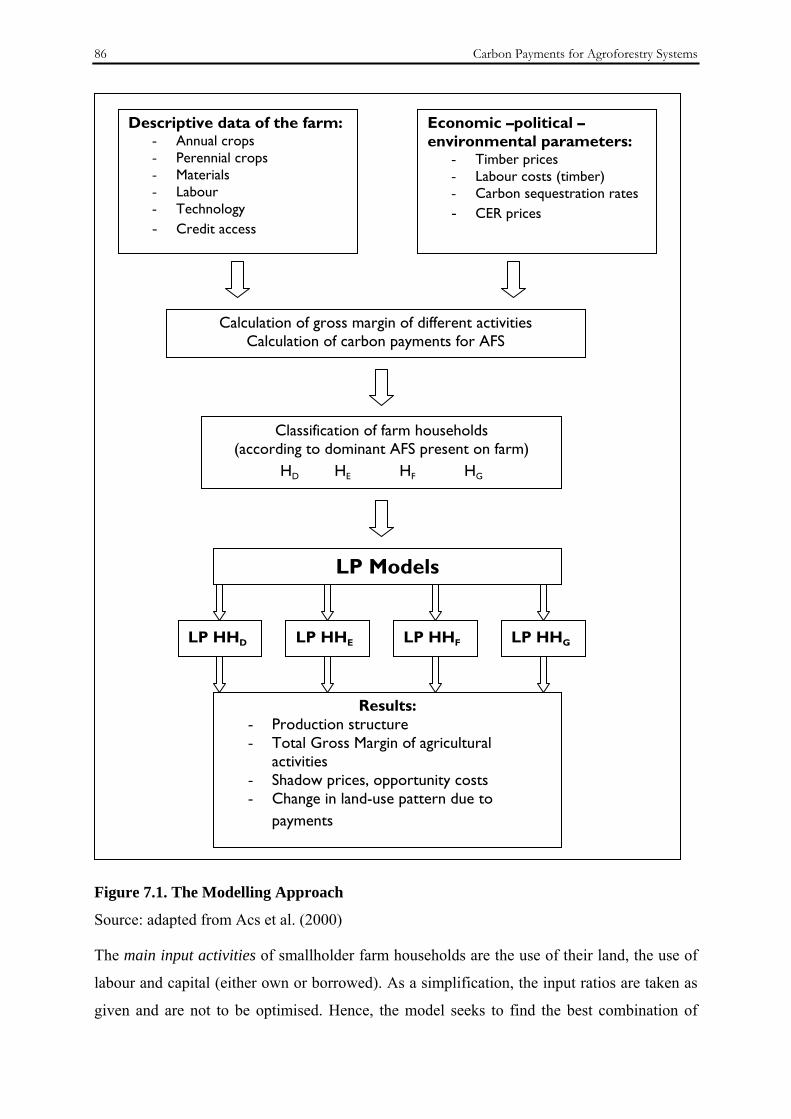
86 Carbon Payments for Agroforestry Systems
Figure 7.1. The Modelling Approach
Source: adapted from Acs et al. (2000)
The main input activities of smallholder farm households are the use of their land, the use of
labour and capital (either own or borrowed). As a simplification, the input ratios are taken as
given and are not to be optimised. Hence, the model seeks to find the best combination of
Descriptive data of the farm: - Annual crops - Perennial crops - Materials - Labour - Technology - Credit access
Economic –political –environmental parameters:
- Timber prices - Labour costs (timber) - Carbon sequestration rates - CER prices
Calculation of gross margin of different activities Calculation of carbon payments for AFS
LP Models
Results: - Production structure - Total Gross Margin of agricultural
activities - Shadow prices, opportunity costs - Change in land-use pattern due to
payments
Classification of farm households (according to dominant AFS present on farm)
HD HE HF HG
LP HHD LP HHE LP HHF LP HHG
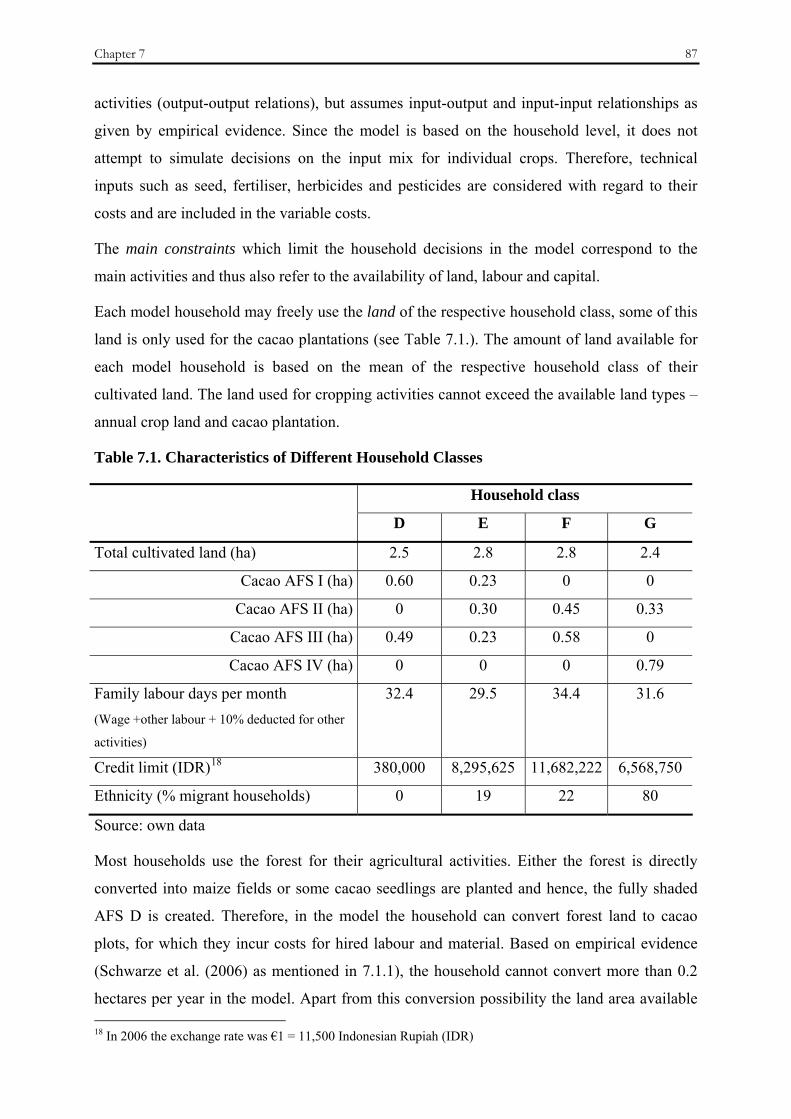
Chapter 7 87
activities (output-output relations), but assumes input-output and input-input relationships as
given by empirical evidence. Since the model is based on the household level, it does not
attempt to simulate decisions on the input mix for individual crops. Therefore, technical
inputs such as seed, fertiliser, herbicides and pesticides are considered with regard to their
costs and are included in the variable costs.
The main constraints which limit the household decisions in the model correspond to the
main activities and thus also refer to the availability of land, labour and capital.
Each model household may freely use the land of the respective household class, some of this
land is only used for the cacao plantations (see Table 7.1.). The amount of land available for
each model household is based on the mean of the respective household class of their
cultivated land. The land used for cropping activities cannot exceed the available land types –
annual crop land and cacao plantation.
Table 7.1. Characteristics of Different Household Classes
Household class
D E F G
Total cultivated land (ha) 2.5 2.8 2.8 2.4
Cacao AFS I (ha) 0.60 0.23 0 0
Cacao AFS II (ha) 0 0.30 0.45 0.33
Cacao AFS III (ha) 0.49 0.23 0.58 0
Cacao AFS IV (ha) 0 0 0 0.79
Family labour days per month (Wage +other labour + 10% deducted for other
activities)
32.4 29.5 34.4 31.6
Credit limit (IDR)18 380,000 8,295,625 11,682,222 6,568,750
Ethnicity (% migrant households) 0 19 22 80
Source: own data
Most households use the forest for their agricultural activities. Either the forest is directly
converted into maize fields or some cacao seedlings are planted and hence, the fully shaded
AFS D is created. Therefore, in the model the household can convert forest land to cacao
plots, for which they incur costs for hired labour and material. Based on empirical evidence
(Schwarze et al. (2006) as mentioned in 7.1.1), the household cannot convert more than 0.2
hectares per year in the model. Apart from this conversion possibility the land area available 18 In 2006 the exchange rate was €1 = 11,500 Indonesian Rupiah (IDR)
88 Carbon Payments for Agroforestry Systems
to each household is fixed; no trading or renting of land is included in the model. It has been
observed in most villages that the land is limited and additional purchases are very difficult,
as there is no more non-forest land available. Within the model time horizon of one year, only
one crop can be grown per land unit. Requirements for crop rotation are not implemented as
they are not important within the cropping systems of the study region.
For the agricultural activities two types of labour are available which are family labour and
hired labour. The total labour capacity of the household represents a constraint in the model.
If additional labour is required it may be hired according to the recorded daily wage rate on a
monthly basis. In general there is no limit to the use of hired labour, the only restriction is
capital availability. The rate for hired labour of IDR 19,000 per day is based on values found
in the survey area in 2006. Assuming 23 working days per month, the monthly wage rate is
IDR 437,000.
The cacao plantations need labour all year around, however paddy rice, upland rice and maize
are usually harvested twice a year, in some regions even three times. However, in some
regions only one harvest took place once a year. In general there is a great regional variation
in the time of the year in the cropping pattern to be found, as the microclimatic conditions
fluctuate strongly. The recall period for the farmers was the last year (see Appendix VI for
monthly labour requirements for each household class and activity for one year).
In order to obtain the family labour capacity for the four household categories the OECD
modified equivalence scales19 were used. The figure of 23 working days per month is taken to
calculate the family labour availability. Family labour is also used for off-farm employment
(wage labour and other labour). In the survey we also obtained data on the amount of time
spent on wage labour employment and off-farm labour employment and consequently
deducted this time from the family labour capacity. In addition to the cropping activities
included in the model, family members have to perform various other activities, such as other
perennial and annual crops not considered in the model. Therefore, 10 percent of the family
labour is deducted for these activities (see Table 7.1.). The total family labour capacity is
equally distributed over twelve months.
Capital is required for a variety of activities, such as covering the costs of the inputs for the
crop activities, such as fertilizer, herbicides, hiring additional labour and also for the forest 19 Equivalence scales are used to assign each household type in the population a value in proportion to its needs. The factors commonly taken into account are size of the household and age of its members (adults or children). A wide range of equivalence scales exist, the OECD modified equivalence scales assigns a value of 1 to the household head, of 0.5 to each additional adult member and of 0.3 to each child (OECD Social Policy Division 2006).
Chapter 7 89
conversion activities. In the survey households were asked about their monetary savings and
cash, however no answers were provided by the respondents. Therefore, a proxy is used for
the limiting cash constraint, the credit limit (see Table 7.1.), which is the maximum amount of
credit the household expects to be able to borrow from formal and informal sources (Diagne
and Zeller 2001). As the formal and informal credit market in the research region have been
investigated by Nuryartono (2005) already, this proved to be a reliable method.
Rice is a staple food in Indonesia and in the project region it is produced for sales but also for
home consumption. According to Glenk et al. (2006), who obtained a constant marginal
willingness to pay for the consumption value component, it can be suggested that rice
cultivation is perceived as a necessity for the households in the research region regardless of
their poverty level. Therefore, a rice food security constraint has been included for the
households’ rice requirements, which is based on the household expenditure data for rice
consumption. The expenditure data for rice consumption, consisting of purchases, gifts and
home consumption (STORMA A4 survey 2005) allowed us to derive for each household class
the proportion of expenditure for rice consumption covered by home production. Using the
market prices for paddy and upland rice, the necessary quantities of rice home production are
obtained and than converted to minimum land requirements using the per hectare productivity
figures. On average all households retain for home consumption 222 kg rice from their own
production. For paddy rice 0.08 ha are needed and 0.07 ha for upland rice. These figures are
included as a restriction in the model, indicating the households’ minimum land requirements
for rice to fulfil their home consumption needs. Similarly in the model by Keil et al. (2007),
developed for the same research region, the households’ rice requirements were included as a
constraint. The gross margin for maize proves to have a very low value, increasing the
likelihood for this activity to be forced out of the model. Hence, as maize is an important crop
production activity observed throughout the research region, a maize food security constraint
for minimum maize production, calculated specifically for each household class, has been
included. On average all households use 442 kg per year. Again, the respective home
consumption figures were converted into minimum land requirements using the per hectare
productivity figures for maize.
7.1.3. Objective Function Coefficients
The objective function is maximising the total gross margin of the cropping activities, as well
as the returns from timber sales from the forest conversion activities. The values of these
activities enter the equation as objective function coefficients and are discussed in turn.

90 Carbon Payments for Agroforestry Systems
We calculated the gross margin values for the three main annual crops, paddy rice, upland
rice, and maize, as well as for cacao, but we differentiated between the four AFS, which are
grown under distinct shade regimes on the plot. Other crops such as peanuts, cassava, beans
and other vegetables were left out, as only very small quantities are planted and harvested.
Similarly coffee, coconut, kemiri and other perennial crops were omitted, since only few
farmers were engaged in these activities. The gross margin (GM) was calculated as follows:
Gross Income (GI) – Variable Cost (VC) = GM
where GI/ha = Q sales* P sales + Q home consumed * P market – Q seeds *P seeds
and VC/ha = CMaterial 20 + CHired Labour 21
(Q= quantity, P= price, C= cost)
For the four household types, as well as for the annual and perennial crops, we derived
different gross margin values (in Indonesian Rupiah (IDR)), as indicated in Table 7.2.
Table 7.2. Gross Margins for Agricultural Activities and Households
Household Class
(IDR ha-1) D E F G
Paddy rice 2,114,115 4,309,772 5,669,864 2,735,000
Upland rice 831,600 1,446,256 2,537,778 0
Maize 0 1,188,298 3,371,167 1,116,000
D Cacao 1,034,195 1,300,000 0 0
E Cacao 0 4,344,886 4,030,471 6,475,421
F Cacao 2,031,915 8,558,012 4,273,694 0
G Cacao 0 0 0 16,807,098
Total 6,011,825 22,335,521 23,254,139 28,249,519
Source: own data
As it can be seen the gross margin values for the shade free cacao production is much higher
than for the shade intensive cacao AFS D. These results exhibit a similar cacao intensification
gradient between AFS D and G as has been observed in the data collected in the STORMA
A4 survey in 2001. However, the average gross margin obtained in the A4 survey for AFS G
was much lower (6.8 million IDR) in comparison to the present one (16.8 million IDR), but
20 land preparation + seeds + fertiliser +fertiliser transport + herbicides+ pesticides +pesticide equipment +harvest equipment hire +harvest costs 21 land preparation, fertiliser, herbicide and pesticide application + plantation maintenance

Chapter 7 91
the maximum observation was 14 million IDR which is closer. The high value obtained
within this survey reflects a typical household G, who concentrates on intensively managed
cacao production.
When the farmer converts forest to agroforestry plots, he can sell some of the timber, even
though the extractable timber which is suitable for sales is quite limited. An estimation can
been made on revenues from timber sales according to data collected in the field on prices for
timber, timber harvest rates in cacao plots, and data on the number of trees counted in the
agroforestry plots. We applied the planning horizon of 25 years which we used for the
calculation of the carbon credits, and calculated the NPV of the timber revenue.
Consequently, as an input for the linear programming model, we derived the annuities by
applying the same annuity factor as determined by equation (3) for the carbon payments in
Chapter 5.2.1 to the NPV. These annual payments and hence objective function coefficients
range from 95,000 IDR for the conversion activity of forest to the AFS D, over 130,000 IDR
for the conversion to AFS E, 225,000 IDR to AFS F and 290,000 IDR to AFS G.
7.1.4. Model Formulation
The simplified model for the farm household has been described in Chapter 5.3.4. On the
basis of this structure we formulated the Lore Lindu household model which aims at
maximising farm-level gross margin (equation 7) of a linear function of a certain number of
activities (Xj). For this specific model two types of variables (activities (X)) have been
defined:
- free variables without any restrictions, which are optimised by the model at different
stages of the programming procedure, and
- positive variables, which can only assume non-negative values. These represent the
actual farm activities.
The model equations are shown in Table 7.3., differentiating between two types of equations:
- Objective function (7); the variable on the right side of the objective function is
optimised (maximised) during the solving process. This equation includes the free
variables.
- Constraints (8) - (17); all other model equations represent the conditions, which have
to be fulfilled in the model solution. These ensure the logical, physical and economic
restrictions of the household.

92 Carbon Payments for Agroforestry Systems
The model contains four production activities, maize, upland and paddy rice, and cacao,
which is sub-divided into the four activities according to the management intensity of the
AFS. Another activity is forest conversion for which limited labour is needed and costs are
incurred for hiring labour, but it also produces revenues from the timber and firewood sales.
Table 7.3. Equations of the Linear Programming Model
Farm income
Annual farm level gross margin (7)
Gross margin from crop production activities
(including value of home consumption and minus
variable costs for crop production) (cj )
= Farm level gross margin (Y)
+ revenue from timber sales (T)
- costs of hired labour (Chl)
Introduction of new activities (Scenarios 1-7)
+ revenue from cacao production including carbon
payments (PC)
(7a)
+ compensation payments from avoided
deforestation (AD)
(7b)
ChlTXc j
n
jjj −+∑
=1 = max Y
(Xj= the level (hectares) of the jth farm
activity, n are the number of possible
activities)
Land
Monthly land-use
Monthly sum of crop area requirements ≤ Farm size (A) (8)
∑=
n
jjX
1≤ A
Forest conversion ≤ Forest conversion limit (9)
Sum of paddy and upland rice area requirement ≥ Minimum rice area (10)
Total maize area requirement ≥ Minimum maize area (11)
Cacao D area requirement ≥ Minimum cacao plantation D (12)
Cacao E area requirement ≥ Minimum cacao plantation E (13)
Cacao F area requirement ≥ Minimum cacao plantation F (14)
Cacao G area requirement ≥ Minimum cacao plantation G (15)

Chapter 7 93
Labour
Monthly sum of household labour requirements for
crop production (Lcp)
≤ Monthly household labour (L) (16)
- hired labour for crop production (HL)
+ monthly labour requirements for forest
conversion (Lfc)
LfcHLXLcpn
jjj +−∑
=1≤ L
Capital
Annual sum of variable cost requirements for crop
production (VC)
≤ Annual credit limit (M) (17)
+ expenses for forest conversion (Cfc)
+ expenses for hired labour (Chl)
ChlCfcXVCn
jjj ++∑
=1≤ M
Source: own data; Equations 12-15 only in baseline model 1 (B1)
7.1.5. Assumptions of the Linear Programming Model
A model tries to represent a system, however, the system needs to be simplified and the
essential features need to be documented. Therefore assumptions are made about certain
processes and activities. Some of these have already been mentioned in Chapter 5.3.4. and the
model inputs section 7.1.2., but will be summarised in this section with additional ones.
- Crop rotation constraint
Most models with cropping activities use a crop rotation constraint, when different crops are
planted on the same plot at different times of the year. In the research area no crop rotation
activities have been observed for the crops considered by this model. Yet, some intercropping,
such as of maize and cacao, as well as upland rice and maize, is practised in the region, but it
was not considered in the model because very few of the interviewed households reported
these practices.
- Perennial cacao production
Cacao trees are perennial crops, but in this model they are treated like annual crops. As
explained beforehand, the investment costs in this region are very low, and for the calculation
of their gross margin, only the productive trees from year four onwards have been included. It
94 Carbon Payments for Agroforestry Systems
is assumed that the agroforestry systems are in place. The static model is looking at one point
in time, which is an average point in their productive life span between year four and year
twenty-five. In the carbon payment scenarios the farmer can choose between the “old” AFS
activities (without payments) and the “new” activities which include the carbon payments. In
the “new” activities the additional labour and costs for hired labour for the conversion to a
system with fewer shade trees are included.
- Gross margin calculation
We assume the gross margins of the different activities to be constant over the planning
horizon of 25 years, because we are not sure about variations of market prices for the different
crops. Supply and demand can change market prices and predictions of these underlying
conditions are difficult to obtain. Furthermore, we do not have the analytical tools to predict
inflation far into the future, which also affects prices. Therefore, as it is also done in project
analysis (Belli 2001), we work with constant prices.
- Land constraint
As mentioned above, the land area available to the households is fixed, as practically no
further sales and rental of land takes place. However, the forest conversion restriction allows
the farmer to convert annually 0.2 ha of forest and use it for his cacao production (equation 8).
In reality, usually once the forest is cleared, maize is planted and only in subsequent years
cacao seedlings are planted. In some cases farmers start to plant some cacao seedlings directly
in forest patches, thus moving towards a fully shaded agroforestry system D. For
simplification, since we use a static model and calculated the total gross margin for one year,
a direct conversion from forest to cacao plantations is assumed for which capital and labour
are necessary.
- Land quality differences
The quality differences for land used for perennial and for annual crops is taken into account
in the baseline model with the rice and maize food security constraints (equation 10 and 11).
For the model to reflect the real situation special land suitability constraints had to be
included, which determine the area shares of the different cacao AFS for the household types
(equations 12-15). For a second baseline model, as well as the scenarios, the cacao land
suitability constraint is removed, in order to obtain the impact due to the payments only.
Additionally, in scenario 6 we introduce complete flexibility for a hypothetical case of free
crop distribution. More detailed differences in soils and soil quality, their improvement or
deterioration are not considered in the model.

Chapter 7 95
- Risk
The farm condition is assumed to be stable, risk and time dimensions are not included in the
model. Prices for crops and timber are assumed to be constant, and that certainty with respect
to prices and input-output relationships exists.
- Transaction Costs
For the calculation of carbon payments no transaction costs are considered, which usually
entail considerable pre-implementation transactions for developing a carbon sequestration
project. It is widely accepted that these can be quite substantial and especially for small
farmers can reduce the payments. Transaction costs are discussed in detail in Chapter 3.4. and
8.1.
- Time horizon
The time horizon of the carbon sequestration project is 25 years, which is also the life span of
the cacao trees in the region. The model itself looks at only one year, hence for the cacao
gross margin calculations an average point in their productive lifespan is used, whereas for the
carbon sequestration payments, as well as the revenues from timber sales, the annuities are
considered.
7.1.6. Baseline Results
On the basis of the model specifications four models have been developed for the four
household types taking into account their particular activities and resource endowments. The
results of the baseline model are summarised in the following Table 7.4. The annual Total
Gross Margin (TGM), as well as the different shares of the crops of the total cultivated area
for paddy rice, upland rice, maize and cacao is listed for the four household types in the model
baseline (B1) situation. In brackets, the actually observed shares are indicated and it can be
seen that the area shares for paddy and upland rice, as well as maize are much lower in the
model, whereas the shares of cacao are much higher in comparison to the actually observed
shares. A calibration of the baseline has been repeated various times, still the differences
cannot be reduced any more. The encountered difficulty was that the very low prices for
maize and rice and the favourable producer prices for cacao, which in the model induced all
household types to cultivate only very small areas of rice and maize. The minimum farmgate
price indicated in the interviews was 8,000 up to 13,000 IDR kg-1 for cacao, in comparison to
paddy and upland rice of 3,000 IDR kg-1 and maize of 750 IDR kg-1. Hence, an economically
rational farmer would probably switch completely to cacao, a phenomenon which has also

96 Carbon Payments for Agroforestry Systems
been observed in the research region in the last years. In the survey at hand, 40% of the
farmers declared to have switched to cacao from another crop on their land and the main
reason was due to the very high cacao prices which can be obtained in comparison to the other
crops. However, even though it might not seem profitable, most farmers will maintain some
rice and maize production for food security reasons. An additional reason for not switching
from paddy fields to cacao mentioned by a few farmers was that the customary law (adat) did
not allow them to convert the fields.
Table 7.4. Baseline Model 1 and Optimal Mix of Activities
Household Class
D E F G
Baseline 1 TGM (IDR yr-1) 4,256,000 10,459,000 12,661,000 28,592,000
Area Share per crop
(%age of cultivated area)
Paddy rice 0.03 (0.26) 0.02 (0.25) 0.02 (0.23) 0.05 (0.10)
Upland rice 0.05 (0.4) 0.04 (0.28) 0.01 (0.32)
Maize 0.04 (0.22) 0.12 (0.18) 0.15 (0.21)
Cacao D 0.47 (0.19) 0.08 (0.08)
Cacao E 0.43 (0.09) 0.36 (0.15) 0.13 (0.14)
Cacao F 0.44 (0.16) 0.39 (0.07) 0.57 (0.19)
Cacao G 0.67 (0.34)
Total Cacao 0.91 (0.34) 0.90 (0.24) 0.93 (0.34) 0.80 (0.48)
Source: own data
As mentioned briefly above, baseline 1 (B1) indicates the TGMs of the four household types
as it can be observed also in the real world (Table 7.4. and 7.5.). For the model to reflect this
reality, special land suitability constraints (equations 12-15) had to be included, which
determine the area shares of the different cacao AFS for the household types. As shown in
Table 7.2., the cacao gross margins increase in profitability when moving along the cacao
AFS intensification gradient from D towards G. However, the farmers in the region do not
only employ the AFS with the highest gross margin, even if this would be rational from an
economic point. There are a variety of complex factors and circumstances, which are not
reflected in the model, such as the distance of the plot to the forest, traditional land-use
practices and cultural preferences, which play important roles in the households’ decisions
with respect to cultivating a specific cacao system. The farmers who predominantly grow the

Chapter 7 97
fully shaded cacao might not just be restricted because of labour, land and credit constraints to
this land-use system, but also because their cacao plot borders the forest and they also grow a
variety of other tree crops in the same plot. Some farmers also believe that the shade trees
prevent diseases from spreading. In order to establish the impact of the payments on the farm
TGMs and consequently on the optimal mix of activities we need to determine the TGM
without these special constraints. Baseline 2 (B2) in Table 7.5. thus indicates the TGM for all
four household classes free of cacao land suitability restrictions. Once the constraints are
released, as expected, an intensification of the cacao AFS takes place. Household type E, who
grows in the first baseline model apart from dominantly AFS E also AFS D and F, completely
stops to grow the fully shaded cacao and adopts more of the unshaded AFS G. Similarly,
household type F starts to grow more of the fully sun grown cacao and gives up the AFS E in
the baseline situation free of restrictions. This intensification phenomenon is also taking place
in reality in this region (Steffan-Dewenter et al. 2007).
Table 7.5. Baseline Models for Four Household Classes
Household Class
D E F G
Baseline 1 (B1) TGM (IDR yr-1)
4,256,000 10,459,000 12,661,000 28,592,000
Baseline 2 (B2) TGM (IDR yr-1)
4,314,000 12,220,000 15,312,000 31,105,000
Crop Areas (ha) B1 B2 B1 B2 B1 B2 B1 B2
Paddy rice 0.07 0.07 0.07 0.07 0.06 0.13 0.13 0.13
Upland rice 0.11 0.11 0.11 0.11 0.04 0.04 0 0
Maize 0 0 0.12 0.12 0.12 0.25 0.38 0.38
Cacao D 1.49 1.56 0.24 0 0 0 0 0
Cacao E 0.77 0.94 1.31 0.06 1.09 0 0.33 0
Cacao F 0.25 0 1.16 0.77 1.73 1.05 0 0
Cacao G 0.02 0.04 0 1.74 0 1.38 1.72 2.00
Total Cacao 2.53 2.53 2.71 2.57 2.82 2.42 2.05 2.00
Source: own data
The results mirror the poverty gradient, which we obtained when we categorised the
households according to their relative welfare. A cross-tabulation calculation was
implemented for all households of their poverty index (see Chapter 7.1.1. for an explanation
on the properties of the index) and the type of AFS of the cacao plots (Table 7.6.). This
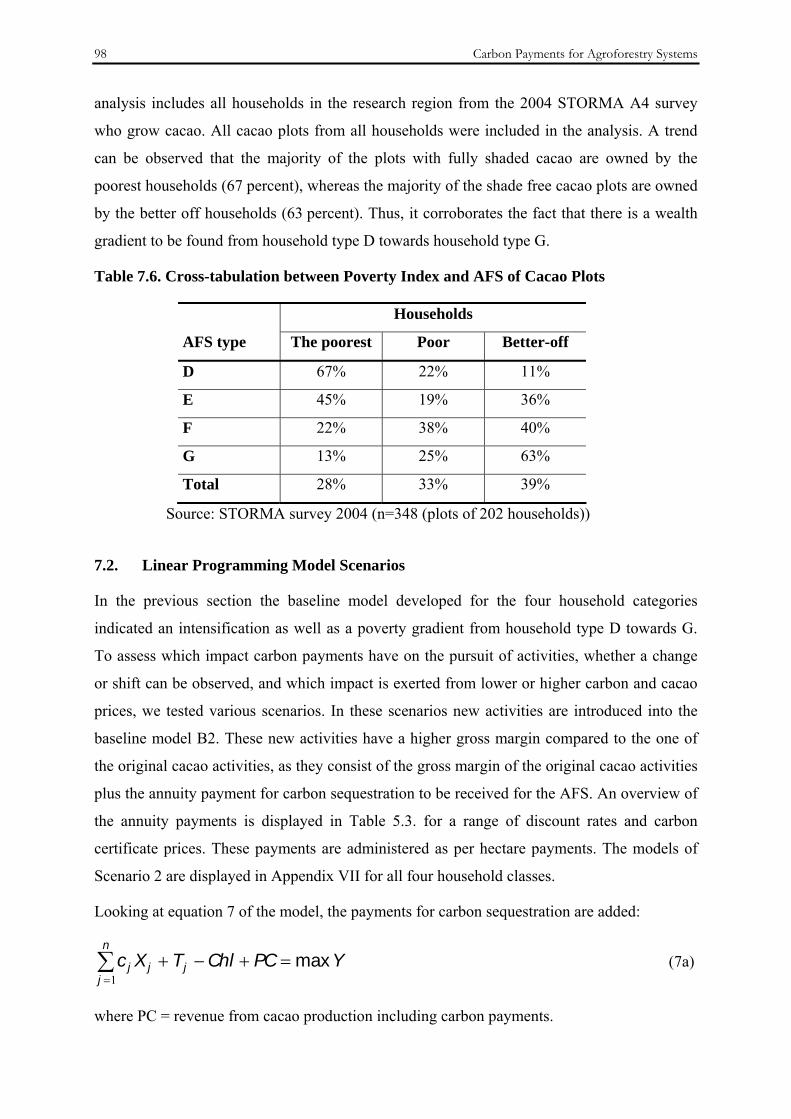
98 Carbon Payments for Agroforestry Systems
analysis includes all households in the research region from the 2004 STORMA A4 survey
who grow cacao. All cacao plots from all households were included in the analysis. A trend
can be observed that the majority of the plots with fully shaded cacao are owned by the
poorest households (67 percent), whereas the majority of the shade free cacao plots are owned
by the better off households (63 percent). Thus, it corroborates the fact that there is a wealth
gradient to be found from household type D towards household type G.
Table 7.6. Cross-tabulation between Poverty Index and AFS of Cacao Plots
Households
AFS type The poorest Poor Better-off
D 67% 22% 11%
E 45% 19% 36%
F 22% 38% 40%
G 13% 25% 63%
Total 28% 33% 39%
Source: STORMA survey 2004 (n=348 (plots of 202 households))
7.2. Linear Programming Model Scenarios
In the previous section the baseline model developed for the four household categories
indicated an intensification as well as a poverty gradient from household type D towards G.
To assess which impact carbon payments have on the pursuit of activities, whether a change
or shift can be observed, and which impact is exerted from lower or higher carbon and cacao
prices, we tested various scenarios. In these scenarios new activities are introduced into the
baseline model B2. These new activities have a higher gross margin compared to the one of
the original cacao activities, as they consist of the gross margin of the original cacao activities
plus the annuity payment for carbon sequestration to be received for the AFS. An overview of
the annuity payments is displayed in Table 5.3. for a range of discount rates and carbon
certificate prices. These payments are administered as per hectare payments. The models of
Scenario 2 are displayed in Appendix VII for all four household classes.
Looking at equation 7 of the model, the payments for carbon sequestration are added:
YPCChlTXc j
n
jjj max=+−+∑
=1 (7a)
where PC = revenue from cacao production including carbon payments.

Chapter 7 99
As a definition and for the better understanding of the following analysis, the objective
function coefficient of the “old” cacao activities is the original gross margin of cacao. The
objective function coefficient of the “new” cacao activities is the original gross margin plus
the carbon annuity payment.
In the scenarios the farmer can take up additional cacao activities, however if the new area
exceeds the old area of that AFS type, he needs to convert land either from another cacao
activity, forest or land occupied by an annual crop. This requires additional resources such as
for the land preparation, hiring labour, etc. Thus, in the scenarios there are two cacao
activities, both with the objective value inclusive of carbon payments, but one with the “old”
labour and capital requirements and the other one with the higher resource requirements. For
example, if he cultivates in the baseline model 1.2 hectares of the AFS D, but increases his
AFS D area to 1.5 hectares, in the scenario he will cultivate 1.2 hectares of the AFS D with
the original resource requirements and another 0.3 hectares of “new” AFS D with higher
resource requirements.
In the next sections various scenarios will be analysed and presented. These include the
following specifications and considered impacts:
Specification Purpose
Scenario 1 d 10%, CER €5 tCO2e-1
Scenario 2 d 10%, CER €12 tCO2e-1 Changing carbon prices
Scenario 3 d 10%, CER €25 tCO2e-1
Scenario 4 d 10%, CER €12 tCO2e-1 Depressed cacao prices
Scenario 5 d 10% Incentives for shade grown cacao
Scenario 6 d 10%, CER €12 tCO2e-1 Cash crops first?
Scenario 7 d 10% Payments for avoiding forest conversion
7.2.1. Impact of Changing Prices of Carbon and Cacao
To perform a sensitivity analysis, but also to detect which impact the variations in prices for
carbon credits, as well for cacao have on the land-use systems, first of all various CER are
considered. As explained in the previous Chapter and indicated in Table 5.3., the annuity
payments for carbon sequestration can vary considerably, when using a range of credit prices
from €5 to €25 tCO2e-1.
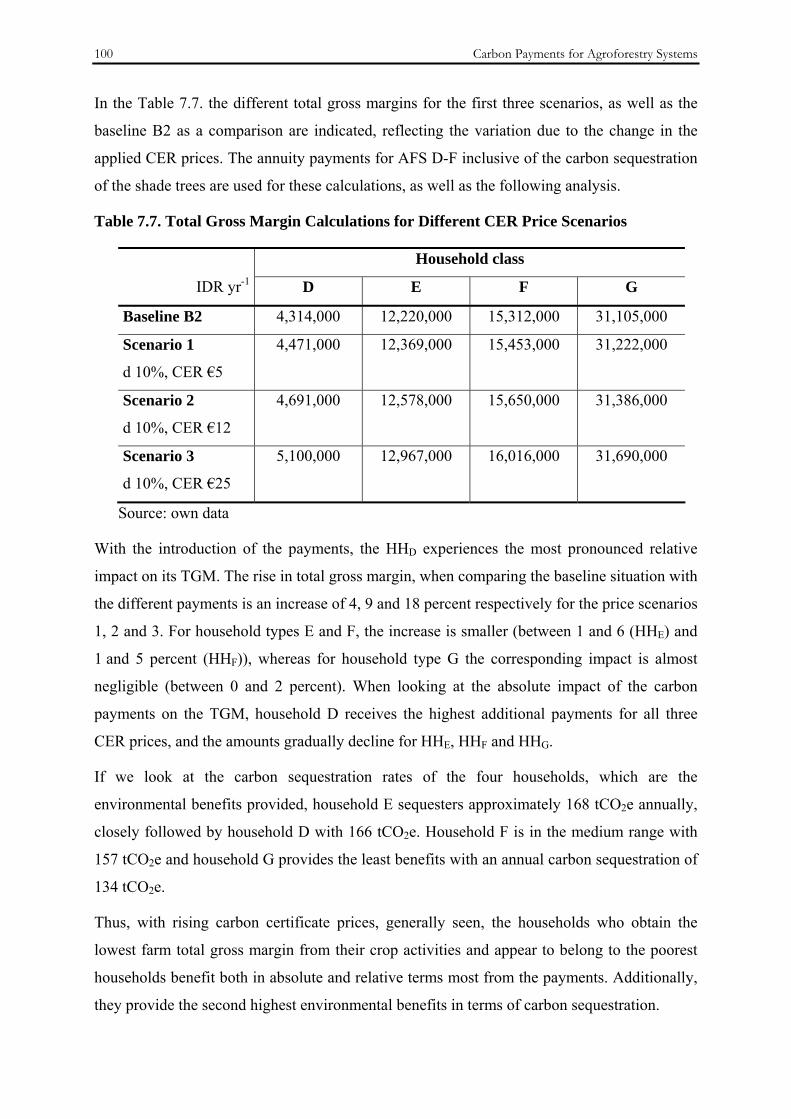
100 Carbon Payments for Agroforestry Systems
In the Table 7.7. the different total gross margins for the first three scenarios, as well as the
baseline B2 as a comparison are indicated, reflecting the variation due to the change in the
applied CER prices. The annuity payments for AFS D-F inclusive of the carbon sequestration
of the shade trees are used for these calculations, as well as the following analysis.
Table 7.7. Total Gross Margin Calculations for Different CER Price Scenarios
Household class
IDR yr-1 D E F G
Baseline B2 4,314,000 12,220,000 15,312,000 31,105,000
Scenario 1
d 10%, CER €5
4,471,000 12,369,000 15,453,000 31,222,000
Scenario 2
d 10%, CER €12
4,691,000 12,578,000 15,650,000 31,386,000
Scenario 3
d 10%, CER €25
5,100,000 12,967,000 16,016,000 31,690,000
Source: own data
With the introduction of the payments, the HHD experiences the most pronounced relative
impact on its TGM. The rise in total gross margin, when comparing the baseline situation with
the different payments is an increase of 4, 9 and 18 percent respectively for the price scenarios
1, 2 and 3. For household types E and F, the increase is smaller (between 1 and 6 (HHE) and
1 and 5 percent (HHF)), whereas for household type G the corresponding impact is almost
negligible (between 0 and 2 percent). When looking at the absolute impact of the carbon
payments on the TGM, household D receives the highest additional payments for all three
CER prices, and the amounts gradually decline for HHE, HHF and HHG.
If we look at the carbon sequestration rates of the four households, which are the
environmental benefits provided, household E sequesters approximately 168 tCO2e annually,
closely followed by household D with 166 tCO2e. Household F is in the medium range with
157 tCO2e and household G provides the least benefits with an annual carbon sequestration of
134 tCO2e.
Thus, with rising carbon certificate prices, generally seen, the households who obtain the
lowest farm total gross margin from their crop activities and appear to belong to the poorest
households benefit both in absolute and relative terms most from the payments. Additionally,
they provide the second highest environmental benefits in terms of carbon sequestration.
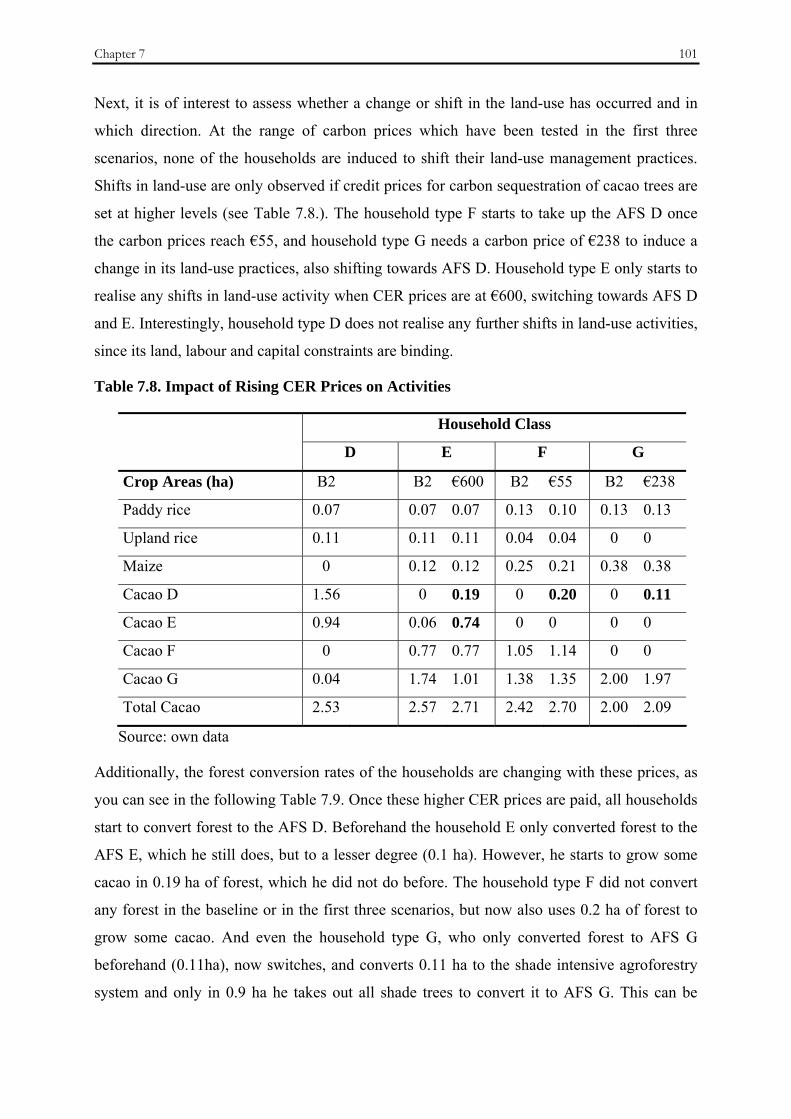
Chapter 7 101
Next, it is of interest to assess whether a change or shift in the land-use has occurred and in
which direction. At the range of carbon prices which have been tested in the first three
scenarios, none of the households are induced to shift their land-use management practices.
Shifts in land-use are only observed if credit prices for carbon sequestration of cacao trees are
set at higher levels (see Table 7.8.). The household type F starts to take up the AFS D once
the carbon prices reach €55, and household type G needs a carbon price of €238 to induce a
change in its land-use practices, also shifting towards AFS D. Household type E only starts to
realise any shifts in land-use activity when CER prices are at €600, switching towards AFS D
and E. Interestingly, household type D does not realise any further shifts in land-use activities,
since its land, labour and capital constraints are binding.
Table 7.8. Impact of Rising CER Prices on Activities
Household Class
D E F G
Crop Areas (ha) B2 B2 €600 B2 €55 B2 €238
Paddy rice 0.07 0.07 0.07 0.13 0.10 0.13 0.13
Upland rice 0.11 0.11 0.11 0.04 0.04 0 0
Maize 0 0.12 0.12 0.25 0.21 0.38 0.38
Cacao D 1.56 0 0.19 0 0.20 0 0.11
Cacao E 0.94 0.06 0.74 0 0 0 0
Cacao F 0 0.77 0.77 1.05 1.14 0 0
Cacao G 0.04 1.74 1.01 1.38 1.35 2.00 1.97
Total Cacao 2.53 2.57 2.71 2.42 2.70 2.00 2.09
Source: own data
Additionally, the forest conversion rates of the households are changing with these prices, as
you can see in the following Table 7.9. Once these higher CER prices are paid, all households
start to convert forest to the AFS D. Beforehand the household E only converted forest to the
AFS E, which he still does, but to a lesser degree (0.1 ha). However, he starts to grow some
cacao in 0.19 ha of forest, which he did not do before. The household type F did not convert
any forest in the baseline or in the first three scenarios, but now also uses 0.2 ha of forest to
grow some cacao. And even the household type G, who only converted forest to AFS G
beforehand (0.11ha), now switches, and converts 0.11 ha to the shade intensive agroforestry
system and only in 0.9 ha he takes out all shade trees to convert it to AFS G. This can be
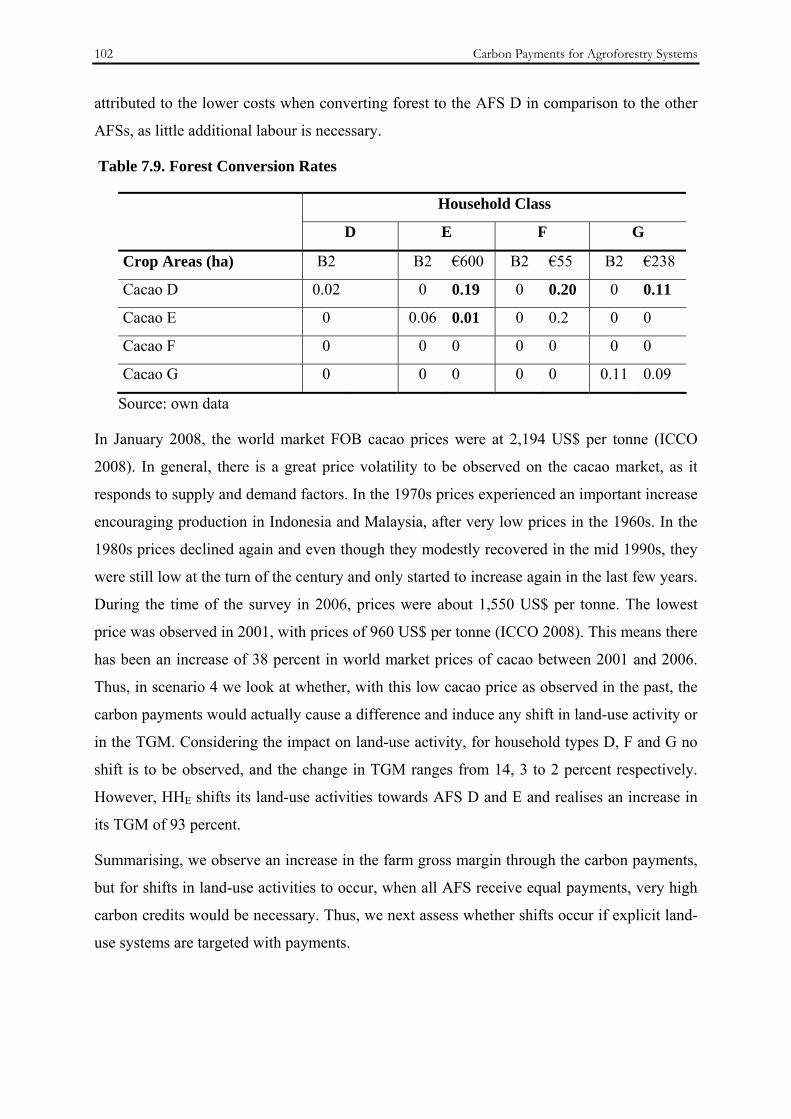
102 Carbon Payments for Agroforestry Systems
attributed to the lower costs when converting forest to the AFS D in comparison to the other
AFSs, as little additional labour is necessary.
Table 7.9. Forest Conversion Rates
Household Class
D E F G
Crop Areas (ha) B2 B2 €600 B2 €55 B2 €238
Cacao D 0.02 0 0.19 0 0.20 0 0.11
Cacao E 0 0.06 0.01 0 0.2 0 0
Cacao F 0 0 0 0 0 0 0
Cacao G 0 0 0 0 0 0.11 0.09
Source: own data
In January 2008, the world market FOB cacao prices were at 2,194 US$ per tonne (ICCO
2008). In general, there is a great price volatility to be observed on the cacao market, as it
responds to supply and demand factors. In the 1970s prices experienced an important increase
encouraging production in Indonesia and Malaysia, after very low prices in the 1960s. In the
1980s prices declined again and even though they modestly recovered in the mid 1990s, they
were still low at the turn of the century and only started to increase again in the last few years.
During the time of the survey in 2006, prices were about 1,550 US$ per tonne. The lowest
price was observed in 2001, with prices of 960 US$ per tonne (ICCO 2008). This means there
has been an increase of 38 percent in world market prices of cacao between 2001 and 2006.
Thus, in scenario 4 we look at whether, with this low cacao price as observed in the past, the
carbon payments would actually cause a difference and induce any shift in land-use activity or
in the TGM. Considering the impact on land-use activity, for household types D, F and G no
shift is to be observed, and the change in TGM ranges from 14, 3 to 2 percent respectively.
However, HHE shifts its land-use activities towards AFS D and E and realises an increase in
its TGM of 93 percent.
Summarising, we observe an increase in the farm gross margin through the carbon payments,
but for shifts in land-use activities to occur, when all AFS receive equal payments, very high
carbon credits would be necessary. Thus, we next assess whether shifts occur if explicit land-
use systems are targeted with payments.
Chapter 7 103
7.2.2. Incentives for Environmentally Friendly Agroforestry Systems
In Chapter 4.3. we introduced the topic of the observed trade-off situation in the region
between the shade-grown cacao with lower economic returns and biodiversity conservation
and an intensification of the cacao cultivation with unshaded plantations and higher returns.
Research in the region clearly indicates that the transition from AFS D to E has little effect on
overall species richness, however completely shade free systems harbour significantly lower
species numbers than shaded cacao systems (Schulze et al. 2004; Steffan-Dewenter et al.
2007). Similarly, studies with other perennial crops indicate that at the transition from shaded
agroforestry systems to intensively managed shade free monocultures, a major loss of overall
biodiversity occurs (Perfecto et al. 1996). Thus, the land-use transition from small scale
subsistence plots to intensive agricultural systems results in disproportional losses of
biodiversity and ecological functioning and less sustainable land-use systems.
To prevent the intensification of the cacao agroforestry systems to monocultures in the region,
economic incentives are required. These could be price premiums, as they are already
available for a long time for fair trade or organic coffee. Recently, premiums have also been
introduced for fair trade cacao and organic cacao. The fair trade premium for standard quality
cacao is €100 per tonne. The minimum price for fair trade standard quality cacao, including
the premium, is €1,250 per tonne. Also for organic cacao, producers receive a higher price
than for conventional cacao, ranging between €75 to 225 per tonne (ICCO 2007). Alternatives
could also be price premiums offered through carbon certificates to offer an incentive for the
shade grown, biodiversity rich and sustainable cacao agroforestry systems. Hence, using the
reduced costs or opportunity costs of the different cacao AFS activities, the minimum prices
for carbon certificates can be determined, which are needed for a specific activity to enter the
farming plan. Therefore, in scenario 5 we assess at which minimum credit price the household
types would adopt the full shade AFS D or the slightly less shaded AFS E, which both offer
higher biodiversity values in comparison to the unshaded AFS, to decelerate the land-use
transition process. The results indicate that household D needs a credit price of €14 tCO2e-1 to
adopt more (0.12ha) of the AFS D, household E is stimulated to shift more (0.34ha) towards
the AFS E with credit prices of €27 and household F adopts more AFS D (0.08ha) with
carbon credit prices of €32 tCO2e-1. These prices are in a range of carbon credits to be
observed on markets currently and they are lower than the price premiums paid for organic
cacao. However, household G would need very high credit prices of €185 tCO2e-1 to induce
him to adopt more of the less intensive cacao production practices.

104 Carbon Payments for Agroforestry Systems
To summarise, with carbon credit prices observed on carbon markets currently most
household types have an incentive to either grow the full shade or slightly less shaded cacao.
7.2.3. “Cash Crop First?” Scenario
Another potential outcome in scenario 6 is investigated to see what happens if there were no
food security restrictions in the model and the farmer could freely decide which crops to grow
on his land (see Table 7.10.). Generally, in the region, a shift from a “food first” to a “cash
crop first” strategy has been observed, as explained in 7.1.6. Thus, it is hypothesised that all
household classes will shift towards cacao production and stop their rice and maize
cultivation. Scenario 2 is compared with the new scenario 6 which does not contain the food
security requirements.
Table 7.10. Impact of Release of Food Security Constraints
Household Class
D E F G
Scenario 2
TGM IDR yr-1
4,691,000 12,578,000 15,650,000 31,386,000
Scenario 6
TGM IDR yr-1
9,774,000 19,765,000 15,756,000 34,777,000
Crop Areas (ha)
Paddy rice 0.07 0 0.07 0.04 0.13 0.11 0.13 0
Upland rice 0.11 0 0.11 0 0.04 0.02 0 0
Maize 0 0 0.12 0 0.25 0.24 0.38 0.10
Cacao D 1.56 1.44 0 0 0 0 0 0
Cacao E 0.94 0.19 0.06 0 0 0 0 0
Cacao F 0 0 0.77 1.59 1.05 1.14 0 0
Cacao G 0.04 1.08 1.74 1.38 1.38 1.32 2.00 2.29
Total Cacao 2.53 2.72 2.57 2.97 2.42 2.46 2.00 2.29
Source: own data
The impact of a free crop distribution would mean that the household class D would not grow
any more rice or maize and household E only keeps a very small amount of paddy rice
production. This results in a considerable increase in their farm TGM for HHD and HHE, who
would respectively more than double it and obtain a 60 percent growth in comparison to
scenario 2. In this “cash crop first” scenario household type D shifts more towards the
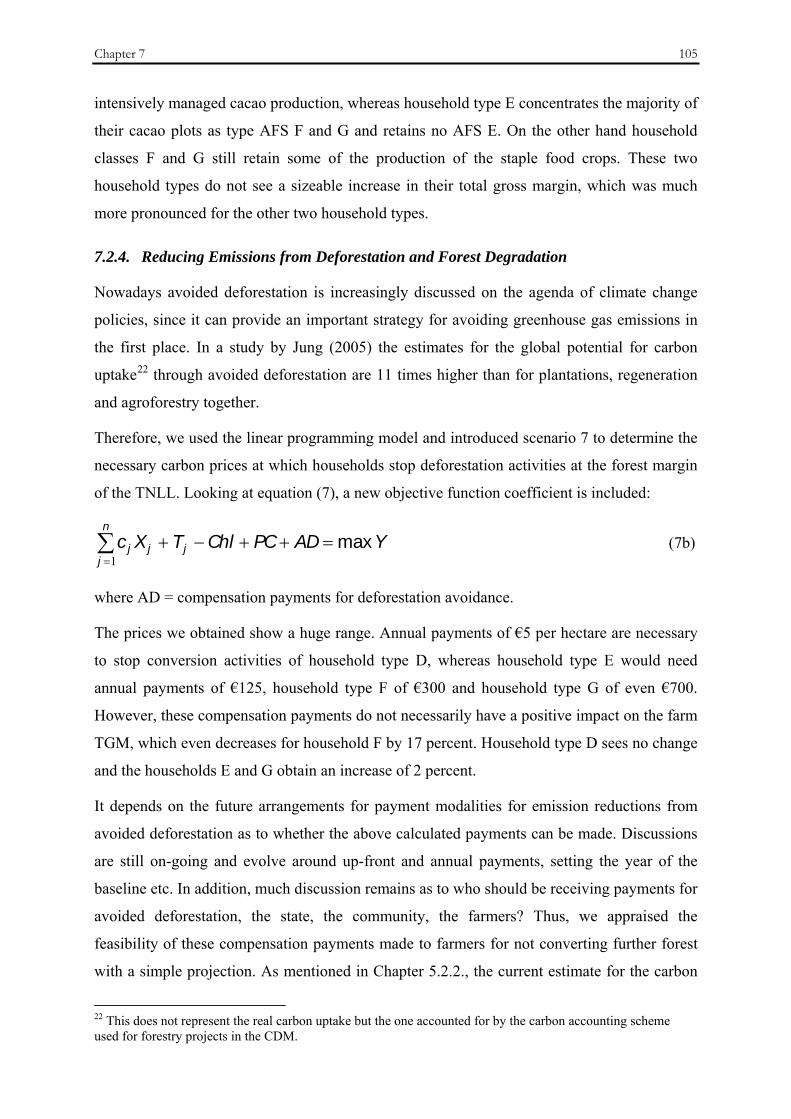
Chapter 7 105
intensively managed cacao production, whereas household type E concentrates the majority of
their cacao plots as type AFS F and G and retains no AFS E. On the other hand household
classes F and G still retain some of the production of the staple food crops. These two
household types do not see a sizeable increase in their total gross margin, which was much
more pronounced for the other two household types.
7.2.4. Reducing Emissions from Deforestation and Forest Degradation
Nowadays avoided deforestation is increasingly discussed on the agenda of climate change
policies, since it can provide an important strategy for avoiding greenhouse gas emissions in
the first place. In a study by Jung (2005) the estimates for the global potential for carbon
uptake22 through avoided deforestation are 11 times higher than for plantations, regeneration
and agroforestry together.
Therefore, we used the linear programming model and introduced scenario 7 to determine the
necessary carbon prices at which households stop deforestation activities at the forest margin
of the TNLL. Looking at equation (7), a new objective function coefficient is included:
YADPCChlTXc j
n
jjj max=++−+∑
=1 (7b)
where AD = compensation payments for deforestation avoidance.
The prices we obtained show a huge range. Annual payments of €5 per hectare are necessary
to stop conversion activities of household type D, whereas household type E would need
annual payments of €125, household type F of €300 and household type G of even €700.
However, these compensation payments do not necessarily have a positive impact on the farm
TGM, which even decreases for household F by 17 percent. Household type D sees no change
and the households E and G obtain an increase of 2 percent.
It depends on the future arrangements for payment modalities for emission reductions from
avoided deforestation as to whether the above calculated payments can be made. Discussions
are still on-going and evolve around up-front and annual payments, setting the year of the
baseline etc. In addition, much discussion remains as to who should be receiving payments for
avoided deforestation, the state, the community, the farmers? Thus, we appraised the
feasibility of these compensation payments made to farmers for not converting further forest
with a simple projection. As mentioned in Chapter 5.2.2., the current estimate for the carbon
22 This does not represent the real carbon uptake but the one accounted for by the carbon accounting scheme used for forestry projects in the CDM.
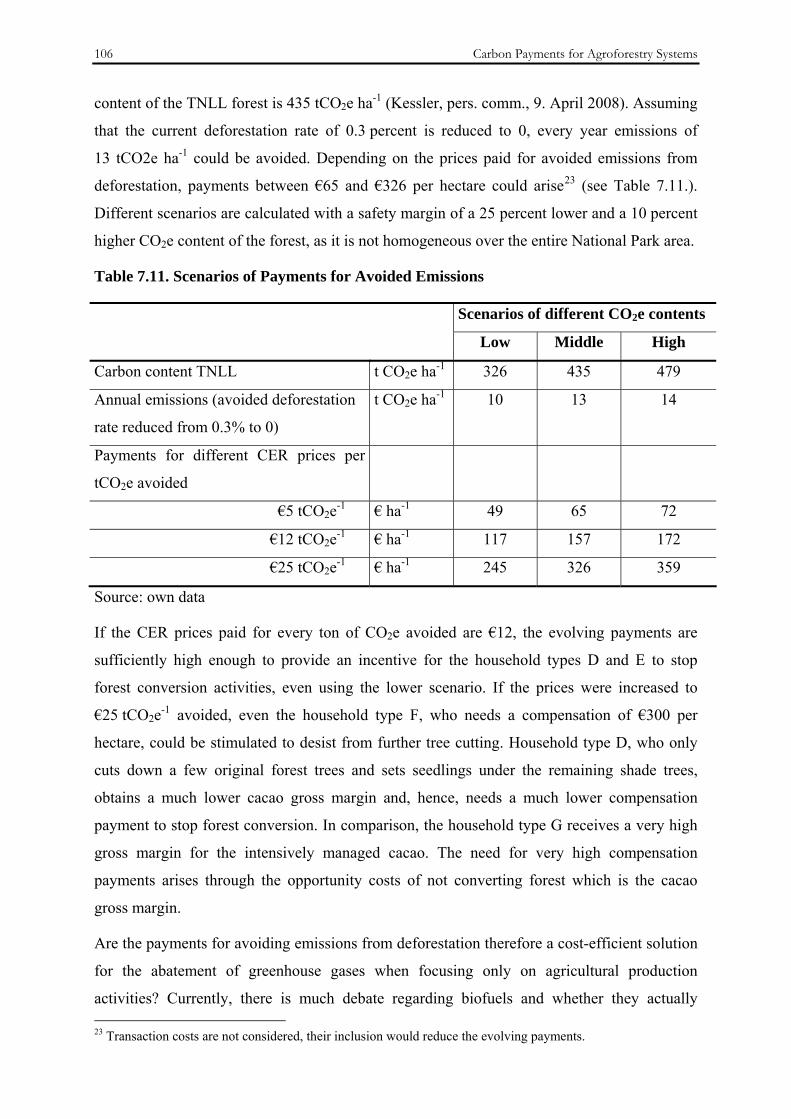
106 Carbon Payments for Agroforestry Systems
content of the TNLL forest is 435 tCO2e ha-1 (Kessler, pers. comm., 9. April 2008). Assuming
that the current deforestation rate of 0.3 percent is reduced to 0, every year emissions of
13 tCO2e ha-1 could be avoided. Depending on the prices paid for avoided emissions from
deforestation, payments between €65 and €326 per hectare could arise23 (see Table 7.11.).
Different scenarios are calculated with a safety margin of a 25 percent lower and a 10 percent
higher CO2e content of the forest, as it is not homogeneous over the entire National Park area.
Table 7.11. Scenarios of Payments for Avoided Emissions
Scenarios of different CO2e contents
Low Middle High
Carbon content TNLL t CO2e ha-1 326 435 479
Annual emissions (avoided deforestation
rate reduced from 0.3% to 0)
t CO2e ha-1 10 13 14
Payments for different CER prices per
tCO2e avoided
€5 tCO2e-1 € ha-1 49 65 72
€12 tCO2e-1 € ha-1 117 157 172
€25 tCO2e-1 € ha-1 245 326 359
Source: own data
If the CER prices paid for every ton of CO2e avoided are €12, the evolving payments are
sufficiently high enough to provide an incentive for the household types D and E to stop
forest conversion activities, even using the lower scenario. If the prices were increased to
€25 tCO2e-1 avoided, even the household type F, who needs a compensation of €300 per
hectare, could be stimulated to desist from further tree cutting. Household type D, who only
cuts down a few original forest trees and sets seedlings under the remaining shade trees,
obtains a much lower cacao gross margin and, hence, needs a much lower compensation
payment to stop forest conversion. In comparison, the household type G receives a very high
gross margin for the intensively managed cacao. The need for very high compensation
payments arises through the opportunity costs of not converting forest which is the cacao
gross margin.
Are the payments for avoiding emissions from deforestation therefore a cost-efficient solution
for the abatement of greenhouse gases when focusing only on agricultural production
activities? Currently, there is much debate regarding biofuels and whether they actually 23 Transaction costs are not considered, their inclusion would reduce the evolving payments.

Chapter 7 107
contribute towards the reduction of greenhouse gases. Therefore, there is a call to develop an
accounting system which calculates the entire life cycle analysis of the biofuels, and takes into
account the direct and indirect land-use changes and associated emissions, as well as air and
toxic emissions, biodiversity, water and soil impacts. In addition, the discussion is now
turning to the practical challenges of where and how emission reductions can best be
achieved, at what costs, and over what periods of time. Therefore, it is worthwhile to also
consider at a global scale, which options can provide a cost-efficient solution to reach the
abatement targets established by now in most countries. We compare the abatement costs of
alternative biofuels to the opportunity costs of not converting the TNLL forest into a cacao
plantation. These are calculated by converting the net present values of the average cacao
agroforestry system, as well as the AFS G to annuities, to derive the annual payments from a
100 year project horizon and divide these by the annually avoided tons of CO2e per hectare
when completely reducing deforestation.24 Table 7.12. lists these different options of
activities in the agricultural domain from different countries and one can see that bioethanol
production from sugar cane in Brazil is the most cost-efficient solution with negative
abatement costs of –27 € tCO2e-1. Still, as a second option comes the avoided deforestation of
the TNLL ((AD TNLL) 23 or 55 € tCO2e-1), which is far more effectual than the remaining
biofuel options.
Table 7.12. Abatement Costs of Biofuels and Avoided Deforestation
Bio
fuel
ra
pese
ed
(Ger
man
y)
Rap
esee
d oi
l (G
erm
any)
Bio
etha
nol
suga
r bee
t (G
erm
any)
Bio
etha
nol
suga
r can
e (B
rasi
l)
Bio
etha
nol
(USA
)
AD
TN
LL
Ave
rage
A
FS
AD
TN
LL
Ty
pe G
A
FS
Abatement
costs € tCO2e-1 154 83 291 -2725 290 23 53
Source: Schmitz (2006), Steenblick (2007) and own data
These numbers, however, do not take into account other environmental services provided by
the forest, which obviously will raise its value even more. Also, the environmental costs
associated with land-use changes related to diverting land from previous agricultural activities
24 The biofuels displace fossil fuels forever, whereas in this calculation the carbon emissions which are avoided by reducing deforestation are only displaced for 100 years. However, in 100 years we should have hopefully encountered sufficient alternative energy sources to meet our needs. 25 Abatement costs are negative, because of a very good greenhouse gas balance and the very low production costs. These are caused because Brazil has a long experience in developing sugar-growing and processing technology and its relatively low taxation of fossil fuels used in biofuel production (Henniges and Zeddies 2006).
108 Carbon Payments for Agroforestry Systems
or forest to biofuel production have not been considered. In Brazil the cerrado is converted for
sugar cane or soybean production and the Amazon logged for producing soybeans, which
increases the carbon debt of the obtained biofuels considerably. Bioethanol from sugar cane
produced on converted cerrado land would take approximately 17 years to repay its carbon
debt (Fargione et al. 2008). Yet, the transaction costs when implementing and carrying out a
REDD project have also not been included in the calculation of the abatement costs for
avoiding deforestation, which would lower its benefits. The costs can be quite considerable,
and results from a study by Michaelowa and Jotzo (2005) indicate transaction costs for
forestry carbon projects to range from US$ 1.48 per tCO2 for large to US$ 14.78 per tCO2 for
small ones.
7.3. Discussion
First of all, we can observe that the baselines of the linear programming model exhibit a
steady increase of the farm TGM from HHD towards HHG (Table 7.5.). At a first glance, the
results, especially of the household type G seem to be extremely high, also if you compare
them with results from Schwarze (2004) who obtained an average agricultural crop income
for the households of 3.7 million IDR, and a range for the three poverty groups from 1.7
million IDR of the poorest group to 5 million IDR of the better-off group. However, in the
linear programming model used by Keil et al. (2007), the medium-sized and strongly cacao-
based households reached a total gross margin of 17.5 million IDR. By combining the linear
programming model with a stochastic simulation the same household type can obtain, with a
15 percent probability, an income equal to or higher than 28 million IDR. It is important to
keep in mind that the four household types at hand are all cacao-based households, who in
general exhibit higher incomes than an average household.
Even though all the farmers in the sample are growing dominantly cacao, we can differentiate
the four household types based on their characteristics and the preceding results. It was shown
in Table 7.1. that household type D has the lowest credit limit and the least cultivated land.
The main share of its land is dedicated to the most shade intensive agroforestry system. This
household type also belongs dominantly to the poorest income group (Table 7.6.), and this is
mirrored by the fact that it obtains the lowest farm total gross margin in comparison to the
other household categories (Table 7.5.). Furthermore, it is mainly the households from the
local ethnic groups - Kaili, Kulawi and Napu - who own these fully shaded agroforestry
systems. Household types E and F have an increasing credit limit and most land available for
cultivation, and they dedicate the majority of their land to AFS E and AFS F, respectively.
Chapter 7 109
The household type E is not clearly a typically poor or better-off household, but is found in all
poverty classes, whereas the household type F shows a clear tendency to belong to more to the
richer farmers (Table 7.6.). In both household classes the share of migrants, such as Bugis,
Toraja and Poso families, gets more frequent. Finally, the household type G predominantly
grows the intensively managed AFS G. They can be classified as economically better-off, a
result corroborated by the extremely high farm total gross margin obtained in the analysis.
Mainly migrants belong to this household type. Interestingly, its credit limit is only the second
highest and its land availability is the same as that of household type D. Yet, among the four
household types it is the one who indicated the highest amount he can obtain from formal
credit sources (rising from household type D towards G) and a smaller proportion from
informal sources. This could be an indication that, even though he faces restricted land
availability and has a lower credit limit, he feels it to be more secure due to its source being
formal, and so he adopts a more intensive production system in comparison to the other
household types.
The intensification gradient for the household types is quite evident from the results of the
analysis, with the poorer, mainly local farmers growing the more shade intensive cacao and
the richer migrants concentrating on the productive unshaded cacao monocultures. Therefore,
the land cover transition observed in the Lore Lindu region is also induced by culturally
influenced innovations and the Bugi migrants from southern Sulawesi, the major centre of
cacao production in Indonesia (Neilson 2007), have been encouraging the intensified cacao
farming practices. An increasing proportion of the indigenous households have been
motivated to adopt these more intensive farming practices, as we have seen in the “cash crop
first” scenario in Chapter 7.2.3. Once the rice and maize food security constraints are
released, especially household types D and E concentrate their production on the unshaded
cacao and shift away from the subsistence “food first” to the “cash crop first” strategy, a
finding observed in other studies as well (Weber et al. 2007; Steffan-Dewenter et al. 2007).
The results also suggest that the two household types F and G, who are both better off, can
allow themselves some staple food production, since their monetary needs are covered already
by having a considerable amount of their land dedicated to the intensively managed cacao
production.
The ethnic affiliation, as well as poverty status plays an important role in the land-use changes
in the Lore Lindu region. As mentioned previously in Chapter 4.3., many of the farmers from
the local ethnic groups are the drivers of the encroachment processes at the National Park
forest margin where they open up new land for cultivation. Consequently, they sell the land to

110 Carbon Payments for Agroforestry Systems
the Bugi newcomers, who tend to be economically better endowed and practice a more
intensive management of their cacao agroforestry systems. This provokes a vicious cycle,
because after a while the local households spend the income gained through the land sales on
ceremonial purposes or status symbols. In due course, when they are short of money again,
they convert further forest to fulfil their subsistence needs (see Figure 7.2.).
Figure 7.2. Vicious Cycle of Poverty and Deforestation
Source: own illustration
Therefore, the carbon compensation payments could provide a solution to break this vicious
cycle of poverty and deforestation. Following the analysis of Chapter 7.2.2., the carbon
credits would need to be specifically targeted towards the shade intensive AFS D and E, as
these are mainly cultivated by the poorer local ethnic groups, who are contributing
considerably towards the forest conversion process at the border of the TNLL. Therefore, a
win-win situation is possible, whereby on the one hand the poorest households are given a
chance to escape poverty due to the increase in income from the carbon payments and on the
other hand with a stable income supply, their need to continue opening up the forest frontier
to obtain additional land can be reduced. If we aggregate the results of the analysis of the
avoided deforestation scenario, we can observe that if in addition to payments for carbon
sequestration of the agroforestry systems, payments for reducing the deforestation of the Lore
Lindu National Park are made to the local D and E households, their conversion activities can
be stopped. A further benefit of targeting these households is that they provide the highest
environmental benefit in terms of the annual carbon sequestration rate of their cacao
agroforestry systems.
On a regional scale, for the research area there is a carbon offset potential of 1,300,000 tCO2e
from all cacao plantations which in comparison to the BioCarbon Fund Projects of the World
Poverty of local ethnic groups
Encroachment & Deforestation
Land sales to migrants
Expenditures for ceremonial purposes
Chapter 7 111
Bank would be in the upper range of their projects. This could lead to annual payments from
€100,000 to €500,000 from the carbon sequestration of the AFS. However, the limits for a
small-scale afforestation project under the CDM, which only allows for an annual average
greenhouse gas removal by sinks of less than 16,000 tCO2e, would be exceeded. Such a
small-scale project could be an option for the AFS type D farmers, since the smallest area
share among the cacao plantations is planted with the full shade cacao (264 hectares), and
they would only need to gather a total area of their shade intensive cacao agroforestry systems
of 240 hectares.
With respect to the discussion of payments for avoided deforestation providing potential
solutions for climate change mitigation, we can see from the results that there is definitely a
huge potential for saving carbon emissions when protecting forest resources. If the
deforestation rate in the TNLL is reduced to zero percent, annual savings of approximately
215,500 – 1,719,000 t CO2e can be made. This is a considerable amount in comparison to the
annual emissions per capita of Germans (10 tCO2e yr-1 per person in 2004), US Americans
(20 tCO2e) and the Qataris (70 tCO2e) (Marland et al. 2007). Obviously, in comparison to the
country-wide emissions of Indonesia of three billion tCO2e annually, it is only a small
contribution. Nonetheless, if similar REDD schemes are developed for further areas in the
country, the combined effort of reducing forest loss and saving carbon could counteract the
current process of deforestation and increasing carbon emissions, as well as provide a
valuable income source. Indonesia has 88 million hectares of forest, of which 48 million are
primary forest (FAO 2006), and projecting a reduction of the current country-wide
deforestation rate of two percent, annual carbon savings of approximately 417 million t CO2e
are possible. Even if the price per t CO2e would be only €5, this would amount to a potential
income of €2 billion.
For the Lore Lindu region the results of the analysis indicate that with current carbon prices
most households can be stimulated to stop the ongoing conversion processes. Currently, the
debates are still ongoing with regard to the payment modalities for avoided deforestation
schemes, and they are often suggested to be nationally based and directed to government
agencies. The Indonesian government proposes that the funds should be directed towards
protected area authorities, 'certified' logging companies engaged in sustainable forest
management, initiatives to tackle illegal logging, PES schemes, and community-based forest
management (Government of Indonesia 2007). We have assumed that the payments will be
made directly to the households of the Lore Lindu villages. Such a scheme would involve
probably high transaction costs, thus, it is argued to include intermediary bodies between the
112 Carbon Payments for Agroforestry Systems
service providers and buyers. This issue is evaluated and discussed in the next Chapter.
Additionally, we have also seen by comparing the costs for avoided deforestation in the
TNLL with the abatement costs of biofuel options, if one searches for cost-efficient solutions
on a global scale for the abatement of greenhouse gases among activities in the agricultural
sector, it is reasonable to invest in the conservation of the TNLL before investing further in
other biofuel options in Germany.
7.4. Summary
This Chapter shows that there is a transition from the household type D towards G with an
increasing farm total gross margin to be observed both in the baseline model, as well as once
the payments for carbon sequestration are introduced. This is in line with a poverty gradient
observed among these farmers. With rising carbon certificate prices, the poorest households
who attain the lowest total gross margin from their crop activities benefit in absolute and
relative terms most from the payments. At this range of carbon prices none of the households
is induced to shift its land-use management practices. If the farmers were free of any
subsistence food requirements, especially the poorer farmers would opt for a “cash crop first”
strategy. On the contrary, the already richer households maintain some land for the cultivation
of the staple foods. Carbon certificates offer the possibility to give incentives for the majority
of households to adopt more of the shade intensive and biodiversity richer agroforestry
systems. However, current prices would only be sufficient for the poorer households to stop
them from further forest conversion, whereas the better off households need extremely high
carbon prices, due to the very high net-revenues of the fully sun grown cacao. Finally, win-
win situations seem to be possible, whereby deforestation processes and poverty can be
reduced with carbon payments.

Chapter 8 113
8. INSTITUTIONAL ARRANGEMENTS FOR CARBON SEQUESTRATION
PROJECTS
8.1. Analysis of Payments for Environmental Service Schemes
The first part of the research indicated which primarily impact a PES scheme, specifically a
carbon sequestration project for agroforestry systems, has on the involved households. The
financial, as well as the land-use impact has been derived and environmental benefits
highlighted. Consequently, this part focuses on the requirements and enabling institutional
conditions for the households to participate in a PES scheme. In particular, we are using the
community conservation agreements in Central Sulawesi as a case study to assess their
institutional arrangement and whether they can provide a framework for active involvement
of the local stakeholders in a potential carbon sequestration project. As outlined in Chapter 3,
institutions will be referred to as the “systems of rules, decision-making procedures, and
programs that give rise to social practices, and guide interactions among the occupants of
relevant roles. Where they arise to deal explicitly with matters involving human/environment
relations, it is normal to speak of institutions as environmental or resource regimes (Young et
al. 1999, p.6).” Unlike organizations, which are material entities that typically figure as actors
in social practices, institutions may be thought of as the rules of the game that determine the
character of these practices. Institutional arrangements are the rules and conventions which
establish peoples’ relationships with resources, translating interests into claims, and claims
into property rights (Gibbs and Bromley 1989).
Many carbon sequestration projects are carried out by large-scale plantation forestry and the
participation of smallholders is limited. One of the main reasons is the high transaction costs
of forest carbon projects (Pfaff et al. 2007). Experience shows that communities benefit less

114 Institutional Arrangements for Carbon Sequestration Projects
from large-scale plantation projects, whereas small-scale projects allow small farmers to
participate and offer the possibility to earn cash income through carbon credits as well as
offering the broader socio-economic and cultural benefits (Murdiyarso 2005). The CDM
provides the opportunity for smallholders to participate in carbon sequestration activities
through selected small-scale afforestation and reforestation activities. This means that they
can benefit from simplified modalities and procedures when preparing and implementing a
small-scale forestry CDM project activity (UNFCCC 2005). The objective is to coordinate
and consolidate the sequestration supply from smallholders in order to reduce transaction
costs. There is wide support for the creation of institutions and financial intermediaries to
bundle projects in a portfolio, such that investors are not tied to an individual project (Cacho
et al. 2003). Among local communities, the technical skills for developing baselines and
monitoring plans can be pooled and group contractual arrangements made. Intermediaries for
these processes can be different institutions, such as local governments, NGOs, private sector
entities and local community organisations. To enhance cost-effectiveness, a strategy is
advocated to develop projects whereby smallholders participate in groups rather than
individually e.g. being distinguished by local community boundaries. These projects are than
managed as common-property rather than individual property. Local communities then act as
service providers and obtain a share of the carbon revenues.
Experience shows that in many cases carbon smallholder projects were built upon some type
of existing community project, particularly community forest plantations or farmers’ groups.
For example, in Mexico the Scolel Te carbon sequestration project was initiated by a group of
interested farmers primarily originating from one farmers union (de Jong et al. 2002; Smith
and Scherr 2003). According to McKean (2000), a common-property regime can be
understood as “a property-rights arrangement in which a group of resource users share rights
and duties towards a resource”. Community-based natural resource management is advocated
to be the mid-way between government administration and market-oriented management.
Furthermore, collaborative management (co-management) of natural resources involves
sharing the rights and responsibilities between state agencies and local populations. Such
negotiated agreements are promoted to overcome problems of state-dominated natural
resource management, since they are voluntary and provide the potential to take into account
any development aspirations and the local knowledge of the communities (Borrini-
Feyerabend et al. 2000). The involvement of different stakeholders, such as local
communities, local associations, governments and industrial lobbies in natural resource
management is seen as participative governance. All parties join in a common decisional

Chapter 8 115
pattern to achieve agreement. In the literature, local communities, as part of the civil society,
are increasingly pointed out as the most efficient bottom organisations to minimise social
costs and maximise social welfare (Ballet et al. 2007). Community participation is therefore
considered to be an important component in natural resource management processes.
Supporting evidence from different case studies has confirmed that common-property
arrangements can reduce the transaction costs of governance under certain conditions (Ostrom
1990). Similarly, Williamson (1985) states that when splitting up transaction costs into
exclusion, monitoring, negotiation, application and information costs, all of these, apart from
negotiation costs, are low for local communities. Carbon offset projects typically entail a
variety of transaction costs in their design and implementation. These arise from project
search, feasibility studies, as well as negotiation, monitoring and verification, enforcement
and regulatory approval, plus insurance costs. Results from a study by Michaelowa and Jotzo
(2005) indicate transaction costs to range from US$ 1.48 per tCO2 for large projects to US$
14.78 per tCO2 for small ones. According to experience from a variety of carbon sequestration
projects the monitoring and enforcement activities in particular can be easily integrated into
community processes and costs minimised (Cacho et al. 2003). In the International Small
Group and Tree Planting Programme (TIST) in Tanzania the monitoring and supervision
activities were performed by the local institutions and reduced overall transaction costs
(Jindal et al. 2008).
We explained in Chapter 1 and 3 that we want to investigate in depth the institution of the
KKMs as an example of a community natural resource management scheme. In particular, we
aim to explore if this agreement can provide an institutional platform allowing for the
involvement of the local households in its negotiation and establishment, as well as a
regulatory framework. This would need to have an organisational structure which represents
the village households, as well as a requirement for the community to be involved in the
resource management process, since the legitimacy of regulatory interventions is increased
when the resource users participate in its design and the implementation (Hanna 1995).
Furthermore, this institution would need to be able to monitor and enforce the forest usage
regulations and finally, also be able to administer funds from potential carbon payments and
channel them towards the individual recipients. Consequently, before presenting the results
of the empirical analysis, we give an outline of the structure of the KKMs, as well provide
some background information on the institutional arrangements of the monitoring and
enforcement activities and the participation of the villagers in the agreements.

116 Institutional Arrangements for Carbon Sequestration Projects
8.1.1. Community Conservation Agreements: State of the Art in 2006
Using the definition given above, we are looking at institutions not in the sense of
organisations, but as a system of rules and procedures guiding practices and relationships
among people. For this particular case, we are analysing the institution of the KKMs
established in several villages in the vicinity of the TNLL. They are a “negotiated agreement
between community representatives and the National Park Management, which constitute
part of a co-management strategy. Their objective is to find a balance between the goals of
nature conservation and the objectives of the local communities to secure self-determined
sustainable livelihoods” (Agreement of Customary Community of Toro, 2003 (Mappatoba
2004)). The negotiations for the agreements between BTNLL and the villages started in the
late 1990s and were promoted by international and local NGOs. According to the survey
conducted by Palmer (2007), 49 villages in the surroundings of the TNLL had negotiated or
were in the process of negotiation for a KKM in 200626. The National Park Authority had
acknowledged and recognised 78 percent of the agreements by 2006. Out of these 24 percent
had been recognised before 2004, 58 percent in 2004 and 18 percent in 2005. The majority of
the arrangements were first initiated by the village or village leader (49 percent), and to a
lesser extent by an NGO (22 percent) or CSIADCP (19 percent) and only one by the National
Park director. The negotiations were usually conducted by the village elders and the
customary council (LA) who typically signed the agreement. All of the agreements were
supported and operated by one or more NGOs and can be characterised according to the
motivations and philosophies of these organisations, which differ considerably (Mappatoba
and Birner 2004). TNC is advocating a more environmental approach in connection with the
development of a zoning and management strategy for the National Park. They have been
actively involved in the area since 1992. The second approach is focusing on development.
This is pursued by CARE, also an international NGO, which has been working in the region
since 1995. Their objective is to promote sustainable agricultural practices and address the
needs of poor farmers in the area, whilst protecting the ecological balance of the environment.
YTM, an Indonesian NGO, was founded in 1992 and promotes empowerment for the
indigenous groups in Central Sulawesi. Their approach advocates the indigenous rights and
places a strong emphasis on the acknowledgement of customary land- and forest- use patterns.
YTM facilitated the first KKMs in the region. There are some other local organisations also
involved in the agreements, but to a lesser degree. JAMBATA and PEI both have an
26 They repeated the survey in the same sample villages as Maertens in 2001 (80 villages), however, their sample was reduced to a total of 72 villages because of funding and time constraints.
Chapter 8 117
environmental focus and have been working in a few villages, usually together with one of the
bigger NGOs. The CSIADCP project, described in Chapter 4, combined development and
environmental objectives and aimed to establish traditional KKMs (KKMA) in 60 villages
surrounding the National Park. Different NGOs have been working either alongside or in turn
in some villages, for example in the research village Salua. It appeared that the coordination
between the NGOs concerning their activities was not very strong and they seemed to only
promote their own agreement. This caused confusion sometimes as the community members
were not certain as to which organisation initiated and carried out which activity.
8.1.2. Monitoring and Enforcement
In most villages TNC has established a separate village conservation council (Lembaga
Konservasi Desa -LKD) for the supervision and co-ordination of the KKM. In order to
implement co-management structures, the LKD is made up of one member from each village
institutions and one official National Park ranger, as well as other personalities whose
opinions are perceived as relevant (Burkard 2007). This structure varies slightly between
villages. The LKD is normally in charge of the monitoring and enforcement activities.
Paragraph 21 of the agreement in Wuasa summarises the functions of the LKD as follows:
- to provide an umbrella for communication between the community and the BTNLL,
- to socialise the KKM to the local community,
- to carry out participatory planning with the BTNLL,
- to supervise the implementation of the KKM,
- to evaluate the KKM,
- to report the evaluation results of the KKM to the village head (Desa Wuasa 2002).
In other villages similar institutions to the LKD have been set up, such as Olungata in Salua
and in Kapiroe the Langgamba Ngata is planned. These institutions also constitute the
monitoring team and organise the monitoring activities. The number of members varies (see
Table 8.1.), and especially in Langko and Wuasa, they may be members of different village
institutions at the same time, such as the LA.
The frequency of the monitoring activities also varies between the villages. According to
paragraph 7 in the agreement in Wuasa and Langko, the LKD is required to carry out a
minimum of one monitoring activity every six months (Desa Wuasa 2002) (Desa Puroo;
Langko; Tomado dan Anca 2005) Usually, there is no established schedule in the village, but
it is carried out according to the personal time schedules of the members or if there is a
specific reason to do so. In some villages the National Park Authority has given some
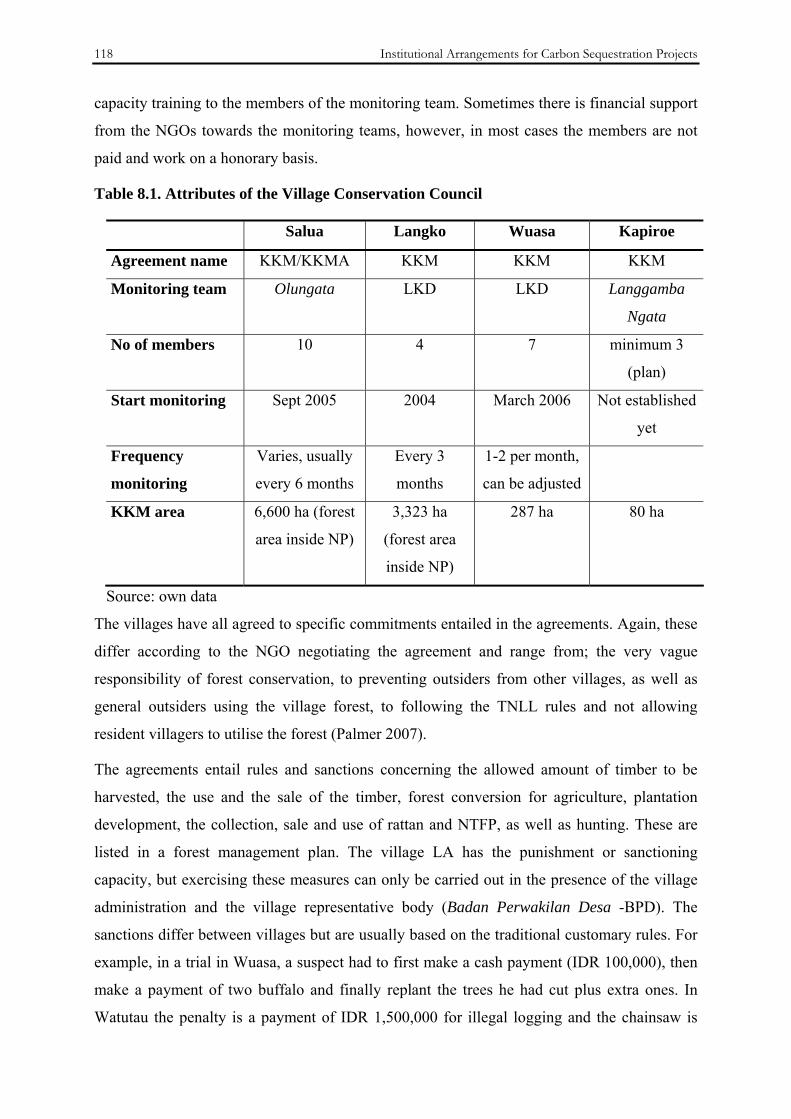
118 Institutional Arrangements for Carbon Sequestration Projects
capacity training to the members of the monitoring team. Sometimes there is financial support
from the NGOs towards the monitoring teams, however, in most cases the members are not
paid and work on a honorary basis.
Table 8.1. Attributes of the Village Conservation Council
Salua Langko Wuasa Kapiroe
Agreement name KKM/KKMA KKM KKM KKM
Monitoring team Olungata LKD LKD Langgamba
Ngata
No of members 10 4 7 minimum 3
(plan)
Start monitoring Sept 2005 2004 March 2006 Not established
yet
Frequency
monitoring
Varies, usually
every 6 months
Every 3
months
1-2 per month,
can be adjusted
KKM area 6,600 ha (forest
area inside NP)
3,323 ha
(forest area
inside NP)
287 ha 80 ha
Source: own data
The villages have all agreed to specific commitments entailed in the agreements. Again, these
differ according to the NGO negotiating the agreement and range from; the very vague
responsibility of forest conservation, to preventing outsiders from other villages, as well as
general outsiders using the village forest, to following the TNLL rules and not allowing
resident villagers to utilise the forest (Palmer 2007).
The agreements entail rules and sanctions concerning the allowed amount of timber to be
harvested, the use and the sale of the timber, forest conversion for agriculture, plantation
development, the collection, sale and use of rattan and NTFP, as well as hunting. These are
listed in a forest management plan. The village LA has the punishment or sanctioning
capacity, but exercising these measures can only be carried out in the presence of the village
administration and the village representative body (Badan Perwakilan Desa -BPD). The
sanctions differ between villages but are usually based on the traditional customary rules. For
example, in a trial in Wuasa, a suspect had to first make a cash payment (IDR 100,000), then
make a payment of two buffalo and finally replant the trees he had cut plus extra ones. In
Watutau the penalty is a payment of IDR 1,500,000 for illegal logging and the chainsaw is
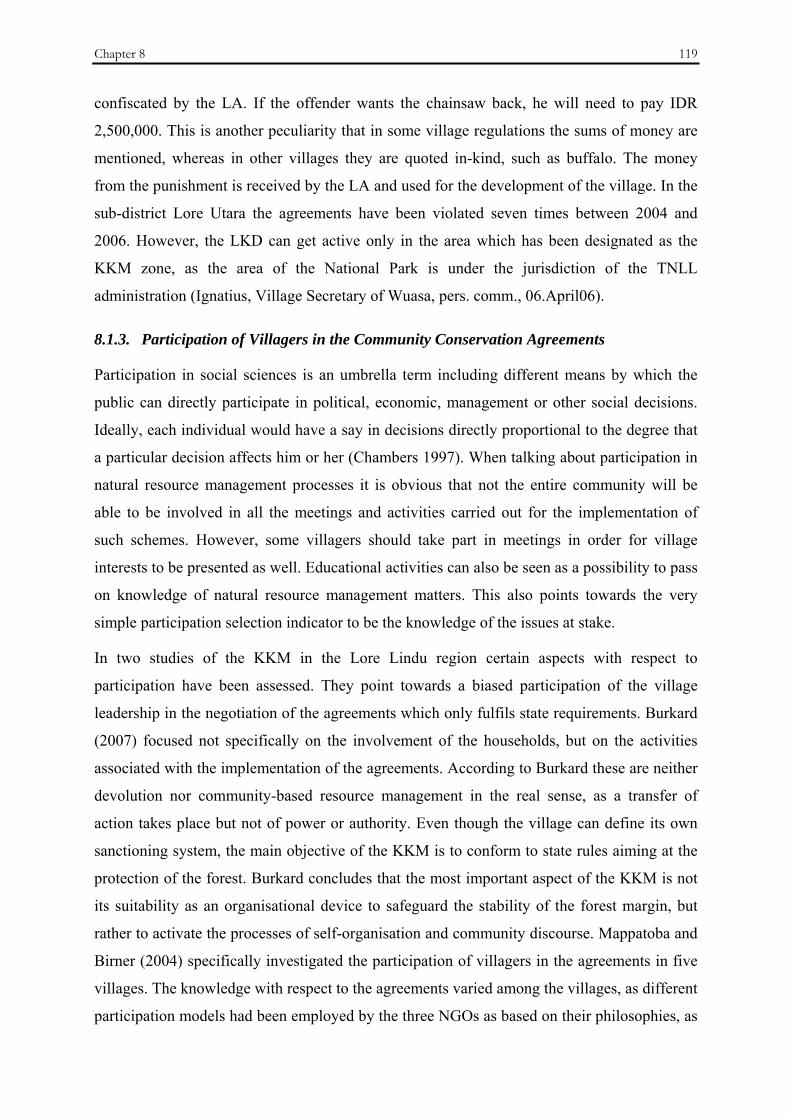
Chapter 8 119
confiscated by the LA. If the offender wants the chainsaw back, he will need to pay IDR
2,500,000. This is another peculiarity that in some village regulations the sums of money are
mentioned, whereas in other villages they are quoted in-kind, such as buffalo. The money
from the punishment is received by the LA and used for the development of the village. In the
sub-district Lore Utara the agreements have been violated seven times between 2004 and
2006. However, the LKD can get active only in the area which has been designated as the
KKM zone, as the area of the National Park is under the jurisdiction of the TNLL
administration (Ignatius, Village Secretary of Wuasa, pers. comm., 06.April06).
8.1.3. Participation of Villagers in the Community Conservation Agreements
Participation in social sciences is an umbrella term including different means by which the
public can directly participate in political, economic, management or other social decisions.
Ideally, each individual would have a say in decisions directly proportional to the degree that
a particular decision affects him or her (Chambers 1997). When talking about participation in
natural resource management processes it is obvious that not the entire community will be
able to be involved in all the meetings and activities carried out for the implementation of
such schemes. However, some villagers should take part in meetings in order for village
interests to be presented as well. Educational activities can also be seen as a possibility to pass
on knowledge of natural resource management matters. This also points towards the very
simple participation selection indicator to be the knowledge of the issues at stake.
In two studies of the KKM in the Lore Lindu region certain aspects with respect to
participation have been assessed. They point towards a biased participation of the village
leadership in the negotiation of the agreements which only fulfils state requirements. Burkard
(2007) focused not specifically on the involvement of the households, but on the activities
associated with the implementation of the agreements. According to Burkard these are neither
devolution nor community-based resource management in the real sense, as a transfer of
action takes place but not of power or authority. Even though the village can define its own
sanctioning system, the main objective of the KKM is to conform to state rules aiming at the
protection of the forest. Burkard concludes that the most important aspect of the KKM is not
its suitability as an organisational device to safeguard the stability of the forest margin, but
rather to activate the processes of self-organisation and community discourse. Mappatoba and
Birner (2004) specifically investigated the participation of villagers in the agreements in five
villages. The knowledge with respect to the agreements varied among the villages, as different
participation models had been employed by the three NGOs as based on their philosophies, as

120 Institutional Arrangements for Carbon Sequestration Projects
explained in Chapter 8.1.1. In those villages where CARE/CSIADCP and TNC worked, the
knowledge of the agreements, as well as on the details of the agreements was very limited.
Additionally, in these villages the attendance and participation of farmers in meetings related
to the agreement was the lowest among the five villages and one of the main reasons for not
participating was that they never received an invitation or did not know about the meeting.
The authors concluded that the KKM can not be considered to be a strategic negotiation
between two parties and that participation was mostly restricted to official village leaders, at
least for the agreements negotiated by CARE/CSIADCP and TNC.
These findings show a limited participation of the village community in the negotiation and
establishment of the agreements, which will be further investigated in the next section.
8.2. Empirical Results of the Community Conservation Agreements’ Analysis
The KKM have been analysed two-fold and the results will be presented accordingly. In the
first section the participants of the focus groups appraised the KKMs during the workshops.
They evaluated whether they observed a change in a number of different aspects as a result of
the implementation of the KKMs; i.e. how they rated the situation before and after the
implementation. In Kapiroe, since the KKM had not been implemented in 2006, the
evaluation was carried out with respect to before the negotiations started and afterwards. The
second part presents the results of the analysis of the content material of the discussions. One
has to bear in mind that the changes, which were perceived and discussed by the participants,
have not only been influenced by the KKM implementation or negotiations in isolation, but
also by a number of other factors and mixed variables, for example National Park regulations
and migration fluxes. Thus, we will try to be as objective as possible in order to highlight only
the impact of the agreements.
8.2.1 Self-assessment of Changes in Resource Management Processes
The focus group started with a brainstorming session. This gave the participants the time and
space to mention all ideas which they associated with the KKM. We grouped the ideas into
specific topics and the Figure 8.1. gives an overview of the frequency of ideas mentioned in
the different categories.
The first four columns indicate the frequency of the topics mentioned by the decision makers
and the last four columns by the villagers27. The bigger the circle is, the more often ideas
associated with this topic were mentioned. The villagers in Salua, as well as the decision
27 The term villagers and farmers are used interchangeably for this group of participants.

Chapter 8 121
makers in Wuasa were very active and came up with most ideas, followed by the decision
makers in Langko and the villagers in Wuasa. The topics which received most ideas were;
environmental impact, monitoring, education and institution. This indicates that these were
topics which the participants most associated with the agreements, whereas topics such as
cacao plots inside of the National Park, rattan collection and economic impact did not receive
great attention. Hence, the respondents considered them to be less connected with the
agreements .
Figure 8.1. Frequency of Mentioned Topics
Source: own data (Column 1-4=decision makers, 5-8=villagers)
With the exception of Langko, the topic institution was evaluated by all villages to have
improved because of the implementation of the KKM as we can see in the following Figure
8.2. (the scores range from +3 (very good) to -3 (very bad). In Wuasa and Kapiroe the
situation was perceived to have improved from being negative to positive for both groups.
Figure 8.2. Evaluation of the Topic “Institution”
Source: own data
In Langko, the decision makers were already very content about the institutional situation,
whereas the villagers observed a deterioration (decrease by 2). Some of the comments, which
were made with respect to this topic, were: “if the people from outside Lindu obey the Lindu
Institution
-3
-2
-1
0
1
2
3
Before Af ter Before Af ter Before A f ter Before Af ter Before Af ter Before A f ter Before Af ter Before Af ter
InstitutionLangko Kapiroe Salua Wuasa
Decision Makers
Decision Makers
Decision Makers
Decision MakersFarmers Farmers Farmers Farmers
Institution
-3
-2
-1
0
1
2
3
Before Af ter Before Af ter Before A f ter Before Af ter Before Af ter Before A f ter Before Af ter Before Af ter
InstitutionLangko Kapiroe Salua Wuasa
Decision Makers
Decision Makers
Decision Makers
Decision MakersFarmers Farmers Farmers Farmers
InstitutionLangko Kapiroe Salua Wuasa
Decision Makers
Decision Makers
Decision Makers
Decision MakersFarmers Farmers Farmers Farmers
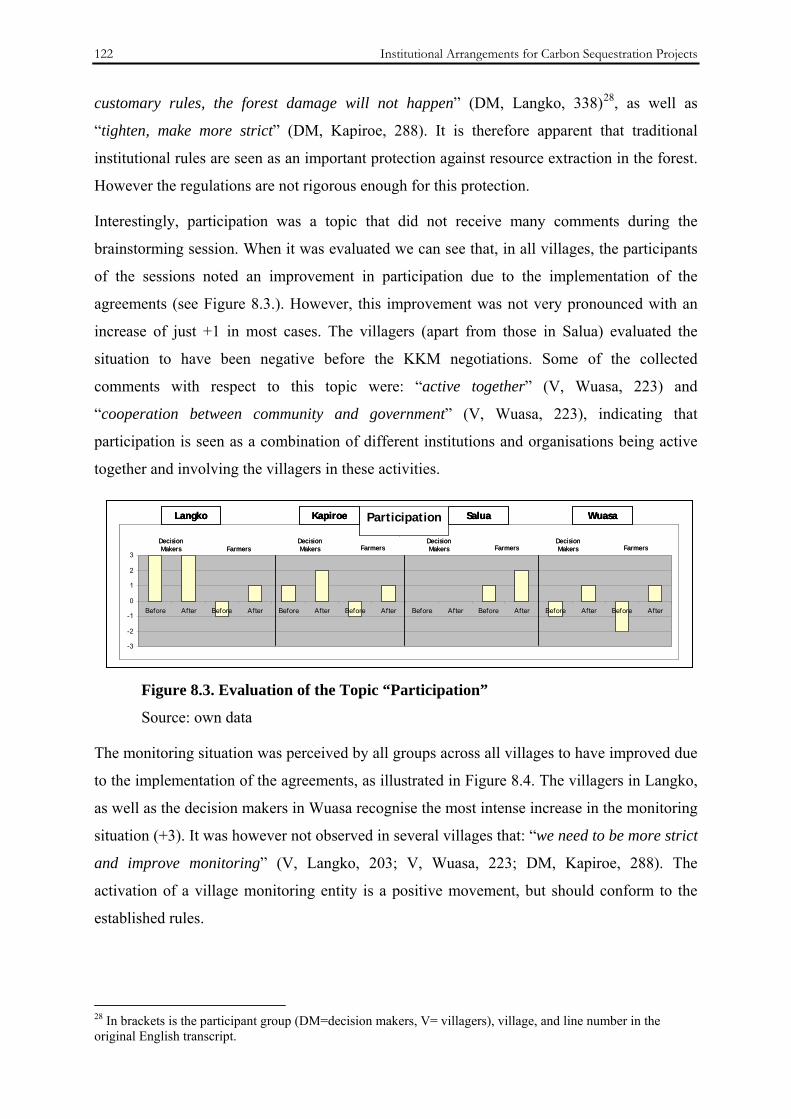
122 Institutional Arrangements for Carbon Sequestration Projects
customary rules, the forest damage will not happen” (DM, Langko, 338)28, as well as
“tighten, make more strict” (DM, Kapiroe, 288). It is therefore apparent that traditional
institutional rules are seen as an important protection against resource extraction in the forest.
However the regulations are not rigorous enough for this protection.
Interestingly, participation was a topic that did not receive many comments during the
brainstorming session. When it was evaluated we can see that, in all villages, the participants
of the sessions noted an improvement in participation due to the implementation of the
agreements (see Figure 8.3.). However, this improvement was not very pronounced with an
increase of just +1 in most cases. The villagers (apart from those in Salua) evaluated the
situation to have been negative before the KKM negotiations. Some of the collected
comments with respect to this topic were: “active together” (V, Wuasa, 223) and
“cooperation between community and government” (V, Wuasa, 223), indicating that
participation is seen as a combination of different institutions and organisations being active
together and involving the villagers in these activities.
Figure 8.3. Evaluation of the Topic “Participation”
Source: own data
The monitoring situation was perceived by all groups across all villages to have improved due
to the implementation of the agreements, as illustrated in Figure 8.4. The villagers in Langko,
as well as the decision makers in Wuasa recognise the most intense increase in the monitoring
situation (+3). It was however not observed in several villages that: “we need to be more strict
and improve monitoring” (V, Langko, 203; V, Wuasa, 223; DM, Kapiroe, 288). The
activation of a village monitoring entity is a positive movement, but should conform to the
established rules.
28 In brackets is the participant group (DM=decision makers, V= villagers), village, and line number in the original English transcript.
Participation
-3
-2
-1
0
1
2
3
Before After Before After Before After Before After Before After Before After Before After Before After
ParticipationLangko Kapiroe Salua Wuasa
Decision Makers
Decision Makers
Decision Makers
Decision MakersFarmers Farmers Farmers Farmers
Participation
-3
-2
-1
0
1
2
3
Before After Before After Before After Before After Before After Before After Before After Before After
ParticipationLangko Kapiroe Salua Wuasa
Decision Makers
Decision Makers
Decision Makers
Decision MakersFarmers Farmers Farmers Farmers
ParticipationLangko Kapiroe Salua Wuasa
Decision Makers
Decision Makers
Decision Makers
Decision MakersFarmers Farmers Farmers Farmers
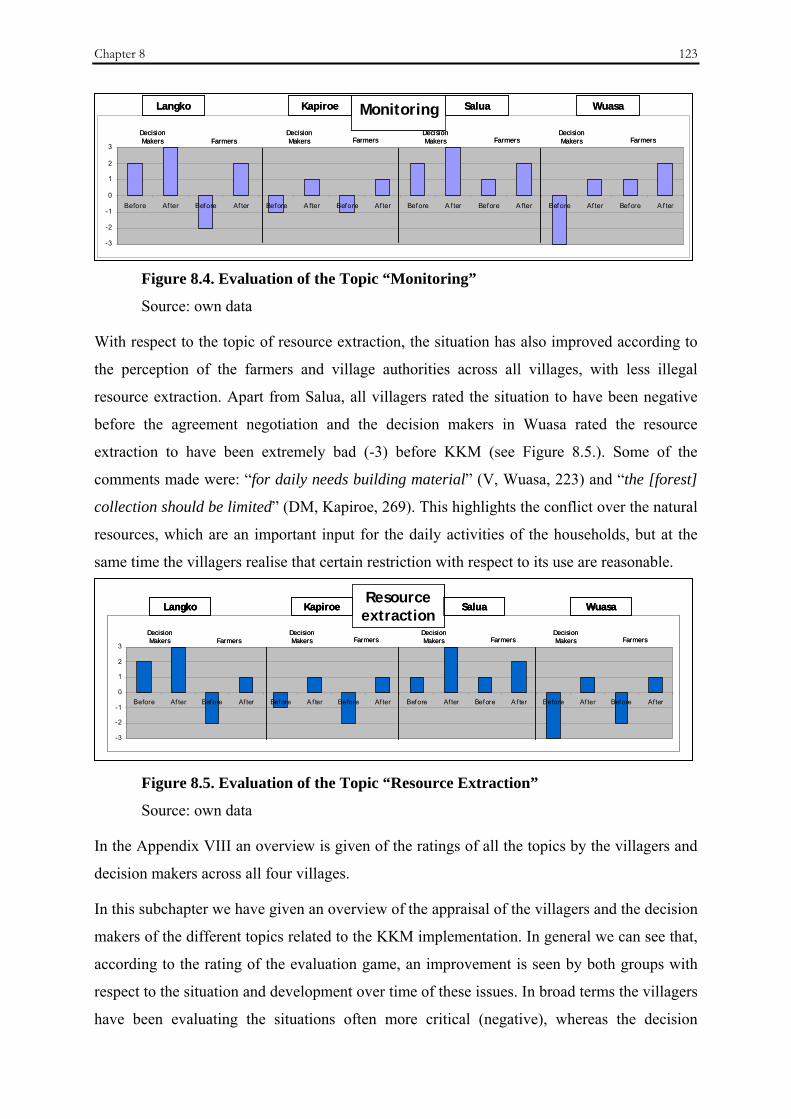
Chapter 8 123
Figure 8.4. Evaluation of the Topic “Monitoring”
Source: own data
With respect to the topic of resource extraction, the situation has also improved according to
the perception of the farmers and village authorities across all villages, with less illegal
resource extraction. Apart from Salua, all villagers rated the situation to have been negative
before the agreement negotiation and the decision makers in Wuasa rated the resource
extraction to have been extremely bad (-3) before KKM (see Figure 8.5.). Some of the
comments made were: “for daily needs building material” (V, Wuasa, 223) and “the [forest]
collection should be limited” (DM, Kapiroe, 269). This highlights the conflict over the natural
resources, which are an important input for the daily activities of the households, but at the
same time the villagers realise that certain restriction with respect to its use are reasonable.
Figure 8.5. Evaluation of the Topic “Resource Extraction”
Source: own data
In the Appendix VIII an overview is given of the ratings of all the topics by the villagers and
decision makers across all four villages.
In this subchapter we have given an overview of the appraisal of the villagers and the decision
makers of the different topics related to the KKM implementation. In general we can see that,
according to the rating of the evaluation game, an improvement is seen by both groups with
respect to the situation and development over time of these issues. In broad terms the villagers
have been evaluating the situations often more critical (negative), whereas the decision
Resource Extraction
-3
-2
-1
0
1
2
3
Before Af ter Before Af ter Before A f ter Before Af ter Before Af ter Before A f ter Before Af ter Before Af ter
Resource extraction
Langko Kapiroe Salua Wuasa
Decision Makers
Decision Makers
Decision Makers
Decision MakersFarmers Farmers Farmers Farmers
Resource Extraction
-3
-2
-1
0
1
2
3
Before Af ter Before Af ter Before A f ter Before Af ter Before Af ter Before A f ter Before Af ter Before Af ter
Resource extraction
Langko Kapiroe Salua Wuasa
Decision Makers
Decision Makers
Decision Makers
Decision MakersFarmers Farmers Farmers Farmers
Resource extraction
Langko Kapiroe Salua Wuasa
Decision Makers
Decision Makers
Decision Makers
Decision MakersFarmers Farmers Farmers Farmers
Controlling
-3
-2
-1
0
1
2
3
Before Af ter Before Af ter Before A fter Before Af ter Before A f ter Before A fter Before Af ter Before A f ter
MonitoringLangko Kapiroe Salua Wuasa
Decision Makers
Decision Makers
Decision Makers
Decision MakersFarmers Farmers Farmers Farmers
MonitoringLangko Kapiroe Salua Wuasa
Decision Makers
Decision Makers
Decision Makers
Decision MakersFarmers Farmers Farmers Farmers

124 Institutional Arrangements for Carbon Sequestration Projects
makers perceived the situation to be positive. The participants perceived the monitoring to
have increased, whereas the resource extraction activities seemed to have decreased. Thus,
there seems to be a positive impact caused by the establishment of the KKMs. However, these
first conclusions are only preliminary and based mainly on the scores of the evaluation game.
Already several of the comments show that there is also criticism with respect to the
institutional regulations and their application. Sometimes it appeared that some of the
concepts of the topics might not have been fully grasped by all the participants. In order to
investigate the understanding of the concepts and topics, as well as their interpretation, the
results of the in-depth analysis of the discussion material is presented in the following section.
8.2.2. Impact of the Agreements on Natural Resource Management
The content analysis of the focus group discussions with respect to the KKMs is based upon
the framework in Chapter 3, Figure 3.5. We concentrate on the four central points of
institution, participation, monitoring and enforcement and finally the status of the
environment. The information from all group discussions was analysed with respect to the
differences between both participant groups, as well as to the situation before and after the
implementation of the KKMs. The information has been summarised and aggregated across
all four villages. Only in specific cases will the differences will be highlighted, but in the final
part of this Chapter the main divergences between the villages are discussed. Additionally, we
shortly outline the perceptions of the concept of compensation payments, an extra benefit to
consider and assess the possibility of using the KKMs as a platform for a carbon sequestration
project.
Community Conservation Agreement Institution
With respect to the traditional customary institution in the village, which is the Lembaga Adat
(LA), there is little knowledge and understanding of the institution among the villagers, as
well as decreasing acceptance of the regulatory framework. The decision makers understand
the LA and the customary regulations very well. The purpose behind the agreements is not
known by the farmers in two of the villages, whereas the village leadership could quite clearly
define it to have been set up for conservation needs and a conservation management system.
Concerning the structure of the agreements, the farmers were familiar with the monitoring
institution (LKD, Olungata or Langgamba Ngata) and they had observed monitoring
activities taking place. Among the decision makers, there was a clear distinction between
Kapiroe- where they did not have a monitoring body at that time but recognised the need for
its establishment- and the remaining villages. The definition given in one village for the LKD
Chapter 8 125
was “the village fence to prohibit someone from entering a preserved location” (DM,
Kapiroe, 49-52) which points towards its protective function for the forest. The village
authorities remarked that the LA gives a good foundation for the agreements and its
regulatory framework such as the sanctions. The monitoring activities are carried out every
one to three months, but not on a constant basis. The villagers pointed out that the
participation in the negotiation and formation of the agreement was restricted to specific
people and various participants did not know the date of the start of the negotiations or the
establishment. This is reflected by the comment of the decision makers in Kapiroe that “it’s a
kind of participation from inside, it’s a decision made by the customary institution… and all
villagers will support this participation” (DM; Kapiroe, 273-274).
When we evaluated the change in the institutional setting the farmers across all villages were
quite critical towards the LA and its regulatory structure in the past and said that the rules
were not enforced. However, presently the villagers could see an improvement in the
institutional arrangement due to the new monitoring agency, the LKD; there was only one
village in which they still observed rule-breaking. The village leadership remarked that due to
the traditional rules of the customary agency, the regulatory framework and its enforcement
structure were in place and could be used by the new village conservation council, but that
they had observed an improvement in the institutional setting. However, in one village they
noted that the monitoring institution had become an abettor of government forest guard.
In summary, there is a gradient of knowledge in the community with respect to the agreement
formation. It is primarily the village leadership which participates in the negotiations and is
informed about its purpose and its structure, whereas many villagers do not know the
agreement nor its details or purpose. Thus, it appears as if the agreements have been imposed
downwards from an upper hierarchy. The traditional customary institution has provided a
good framework for the rules and regulations of the KKM.
Participation in the Negotiation and Establishment of the KKM
Both groups pointed out that there were previously hardly any educational activities and
information campaigns offered by the TNLL administration with respect to the National Park,
the forest and its functions. This has led to wide ignorance among the community members
regarding preservation and conservation issues. Sometimes extension programmes were
offered to the community but never put into practice. Following the implementation of the
agreements there is still a lack of understanding of the purpose of the National Park and the
need for it among the villagers. The village leadership appears well informed about the

126 Institutional Arrangements for Carbon Sequestration Projects
National Park after the KKM negotiations. Also, the authorities have observed less
confrontation between the government forest guard and the farmers.
As mentioned above, the participation of the villagers in the past has been very limited in
community decision-taking, as well as in the establishment and management of the National
Park and the KKMs. The same was remarked by the decision makers who said that there was
very little “socialisation”29 by the BTNLL concerning the rules and regulations of the
National Park, as well as their activities and programmes taking place. After the agreement
negotiation the farmers still observed a lack of participation in meetings with respect to the
KKM and conservation programmes and activities, whereas the village authorities noted an
improvement of the community participation in conservation activities.
To summarise, very little information has been passed on in the past to the community
members with respect to the conservation activities by the National Park administration and
no community-level involvement took place in the formation of the KKM. Overall the
decision makers have mixed opinions, some note a change and an improvement of
socialisation and educational activities by the TNLL administration and other NGOs because
of the establishment of the agreements, whereas others are more critical: “so you have any
suggestion for the [government] apparatus that they can have better approaches to the
community, not only threatening the villagers. Because it only triggers conflict amongst
villagers and forest guards” (DM, Wuasa, 391-392) and “before the KKM was formed, none
of the villagers are willing to support the government to conserve the forest due to shortage of
socialisation” (DM, Wuasa, 343). These statements are motivated by the bad collaboration
between the community and the National Park forest guards, which have been mentioned in
all villages.
Monitoring and Enforcement Activities
For monitoring and law enforcement it is important to know how illegal activities are defined.
In this case they are those activities which violate the customary and KKM laws, as well as
the state law with respect to the TNLL. Examples are illegal logging, extraction of rattan,
clearing land for agricultural activities in the TNLL and KKM area. Discussing illegal
activities is a sensitive issue, since nobody wants to admit their own faults or put the village
into a bad light. It is interesting therefore to contrast the opinions between both groups in the
same village. In the past the farmers had observed many illegal activities such as rattan and
29 This word comes from Bahasa Indonesia and means to make people aware of something through interaction, i.e. meetings. It will be used in due course as it expresses very well the concept of knowledge sharing.
Chapter 8 127
timber extraction, as well as animal hunting, especially by outsiders. With the new regulations
they noticed that less new land was opened up for plantations. The decision makers in Wuasa
also declared illegal logging to have taken place inside the KKM area and that they were
conscious that “socialisation” of the regulations is important to stop these activities. Neither
of the groups in Kapiroe noticed many illegal extraction activities, and in Langko the decision
makers did not observe any illegal deforestation activities, in contrast to the villagers who did.
Some villages have preservation strategies, such as the assignation of specific usage and
conservation zones through the traditional customary rules by the LA. In Langko, for
example, there are the so-called Suaka. The restricted area is called Suaka Wiyata and should
not be entered, otherwise bad things will happen, or the Suaka Ntodea is customary land,
which the community can use for cultivation but can not own it. The traditional limits are
often different with government borders of the National Park causing conflict. Usually, the
elders in Langko are engaged in the forest protection and their vision of preservation is that it
is not only important for their own sake, but for humanity in general: “especially in the
National Park no one should collect rattan inside of that area because that does not only
belong to the people in Lindu but also belongs to the world” (DM, Langko, 731).
Monitoring and enforcement activities, as explained in Chapter 8.2.1., are mainly looked after
by the newly established LKD. The farmers are very critical and remark that in the past the
penalties existed only in theory and little implementation and enforcement took place. The
National Park could be entered and timber extracted without any control. The decision makers
have a similar opinion, ascertaining that no direct forest control existed and embezzlement of
responsibilities occurred frequently. There are different perceptions by the farmers with
respect to the situation after the KKM implementation. In Wuasa and Salua there are
apparently no more illegal resource extraction activities in the forest area which the villagers
attribute to the introduction of sanctions. However, in Kapiroe and Langko the farmers say
that the existing regulations do not hinder forest conversion activities, as there is no
enforcement of the rules. The decision makers in Wuasa and Salua share the opinion of the
farmers in their villages and all ascertain a decrease in deforestation activities. In Langko the
decision makers are of the opinion that the situation has improved in comparison to the past
and that the existing customary structures help to support the new KKM regulations. They do
however clarify that that their activities are constrained because they do not receive any
financial support for their activities. The village conservation council members take their
monitoring responsibilities quite serious: “I told my members when you patrol and someone
gives you a cigarette in order to halt your patrol, you should decline it. We are appointed by
128 Institutional Arrangements for Carbon Sequestration Projects
the community to do our duty because they have confidence that we will execute our duties
well” (DM, Wuasa, 760-761).
The perceptions and also the situations across the villages are different with respect to
monitoring and enforcement. To conclude; in the past many illegal activities with respect to
forest resource extraction took place and the regulatory structures did not seem to constrain
these. After the introduction of the conservation agreements and the establishment of the
monitoring agencies, even if there was not a complete halt of the degradation activities, a
significant decrease occurred. The existing customary regulatory framework with respect to
illegal forest activities has provided a good foundation for the KKM.
Status of the Environment
In general, across all villages and both groups the impression was prevailing that the
environmental condition was good in the past, that there were plenty of birds and animals and
less natural disasters such as flooding and droughts. Both groups perceived the environmental
impacts to have become worse after the implementation of the KKM in the recent past. For
example in Palolo, strong flooding occurred and droughts were recorded due to El Niño.
However, they observed less clearing of land taking place now. Obviously, the KKM in itself
is not the determining factor for a change in environmental impacts. However the aim is to
detect whether it has influenced certain practices which in turn had an impact on the
environment. In all villages the farmers said that, in the past extensive resource extraction
such as forest conversion and rattan collection took place, an opinion which was mirrored by
the decision makers. In Langko, the extraction was only for private needs according to the
village authorities. Nearly all farmers observed a decrease of natural resource exploration
nowadays, whereas in Langko mixed comments were made, in that deforestation still takes
place, but less land is opened up for further plantations. The village authorities all perceive a
decrease in illegal activities, which corroborates the information by the farmers from all
villages excluding Langko. Obviously, forest extraction activities can not just be seen as
simply illegal, since people are often also driven by their needs, which have to be satisfied:
„in the past time, in the age of our ancestor, if the population increased, the land was also
extended because they opened up new lands. This is in contrast with the current
situation......nowadays, the number of people increased but the land space is constant.... in the
past, people were able to open up new land. So, sometimes people break the rules because
they have the necessity.” (F, Wuasa, 630).

Chapter 8 129
To summarise, the perceived status of the environment in the past was better than presently;
yet, the awareness of protecting the given natural resources was not given. Thus, due to an
increasing human impact the environment has suffered considerably. Nowadays, less resource
extraction occurs or it is more controlled, but the consequences of previous human activities
are felt with a higher intensity of floods, erosion and other environmental disasters.
Compensation Payments
In the 1980s compensation payments were addressed in the villages but the farmers’ previous
experience was bad as the incentive, which was promised to them by the Central Sulawesi
government in order not to further explore the forest, was never paid out. The fear is that
compensation payments would not be equally distributed, since in general “Indonesia is well
known to have corruption” (F, Langko, 629), and very often kin relationships influence the
distributional patterns. Payments are seen, however, also as a possibility to stimulate and exert
control over forestry extraction activities. Furthermore, since people have to forego a potential
income source when they cannot use the forest resources anymore, the compensation is
regarded as equitable.
The decision makers are overall quite critical of compensation payments and fear corruption,
especially if a variety of institutions are involved. Based on their experience, NGOs
intermingle their personal interests with the management of funds, causing embezzlement.
Often they do not fully understand the village realities and therefore use inappropriate targets
and objectives in the realisation of projects. The village authorities argue that if payments
would be channelled directly to the communities, the funds could be used efficiently to
improve the monitoring system. However, they also recognise that the payment cannot
compensate their need for work, as being idle does not make them happy: „R4: But especially
in Suaka Ntodea we disagree [about complete preservation] because we still need the rattan
and woods from there. R3: Even though that we will be given money, if we do not work
anymore so we will be unhealthy.” (Langko, DM, 859-862).
To summarise, the people in the villages fear corruption when compensation payments are
made and advocate for fewer organisations to be involved in order to secure more
transparency. However, payments can not solve their need for land and work, which are
perceived as necessities in their life.
Differences between Villages
Some of the information has been generalised across all villages, however, in some cases
there are also differences, which should be addressed. In Langko, the decision makers and the

130 Institutional Arrangements for Carbon Sequestration Projects
villagers are very often of different opinions, a result obtained already in their self-assessment
of the KKM (Chapter 8.2.1.). This corroborates the finding from the last Chapter that the
farmers are, in general, more critical then the village authorities. This can be attributed to the
fact that the decision makers have been much more involved in the negotiation of the
agreements and, therefore, do not want to shed bad light on their own actions. Furthermore, a
gradient in compliance or acceptance of the KKM which is proportional to the time length the
village has been involved in the negotiations is quite apparent. First there is Wuasa, followed
by Langko, and Kapiroe and Salua have the weakest agreements. Wuasa is probably the most
active village in terms of conservation activities and the awareness both among the decision
makers, as well as the farmers is very high. They have been involved the longest in
negotiations with the TNLL administration due to the limited access to the forest caused by
the establishment of the National Park. In an interview with the village secretary Pak Ignatius,
he explained that the dialogue at the village level started in 2000 in Lore Utara in five villages
to collect arguments for the discussion with the government. TNC assisted in the facilitation
of the discussions and the negotiation of the agreement. When we presented the generalised
results in the workshop in Wuasa in 2008, a participant from the villagers group remarked
immediately that they, as a group, did know what the KKM stands for and entails (see
purpose behind the agreements in the section about the KKM Institution). In Langko, even
though the views differ between both groups, a standpoint is provided by the very traditional
customary institution. Even though some farmers criticise it as not being respected anymore,
it gives groundwork to establish the new regulatory framework for the KKM. Among the
participants in Kapiroe we detected awareness with respect to the conservation need for the
forest and the consequences of deforestation are quite apparent in this area. However, the
agreement negotiations are still in process, influencing the knowledge status of the
community. In particular the villagers were not very well informed or integrated into the
discussions between the village, the BTNLL and TNC. Finally, in Salua the agreements were
implemented by different institutions which led to confusion with respect to the
responsibilities of the activities. The first negotiations were in 1996 and therefore were not
well remembered, and the second agreement was never signed in 2006 so the promoting
organisation started to retreat from the project region. Additionally, very little communication
towards the community has occurred with respect to the purpose of the agreement.
8.3. Discussion
The KKM is backed up by an organisational structure which is usually the village
conservation council LKD. The community is familiar with this new organisation and aware

Chapter 8 131
of its activities. However, in all villages apart from Wuasa, the villagers were not involved in
the agreement negotiation and sometimes did not even know of the existence of the
agreement. In contrast, the village authorities are familiar with the agreement and a
knowledge gap is therefore apparent between the different social strata in the village. This
finding is corroborated by the results of Mappatoba and Birner (2004) who detected that often
persons who have functions in the village were among those selected to participate in KKM
meetings.
The traditional customary institution LA is present in all villages and its regulatory framework
provides a good foundation for the rules of the conservation agreement. It can be build upon
in order to improve the local population’s acceptance of the new regulations. However, the
LA has different strength in the four villages, as well as acceptance among the community
members which is related to the socio-cultural situation in the village. Both in Wuasa and
Langko, the population is still dominated by the original ethnic groups. Thus, the LA and the
LKD, especially in Wuasa, have become a “voice” for the local community to fight for their
access to the forest. Burkard (2002) points out that in an ethnically mixed resettlement, such
as Kapiroe and Salua, the LA is comparatively weak and does not play a significant role in the
management and utilisation of natural resources.
A monitoring entity has also been constituted in most villages and is, with the limitations it
faces, relatively active. Several cases of law enforcement were recorded; however, restricted
or lacks of funds constrain the entity’s activities considerably and the monitoring is adjusted
according to personal schedules arrangements. Similarly, Palmer points out that the
monitoring entities carried out regular checks in just 50 percent of the villages with KKMs; in
25 percent checks were only carried out when there was a special reason to do so.
Approximately two thirds of the monitoring teams did not receive any financial resources to
pay for the enforcement activities (2007). Thus, the newly formed monitoring institutions
provide a simple basis for the monitoring and enforcement structures, but the entity needs to
be financially supported and strengthened to be more efficient.
The awareness with respect to nature conservation has become more widespread only in the
recent past and they can not be attributed purely to the establishment of the KKMs. As
considerable resource extraction has left its marks in the region with the participants believing
that environmental problems such as flooding and erosion have increased, the villagers are
more concerned about protecting the forest. 90 percent of the KKM villages perceived a
positive impact on the forest due to the agreement (Palmer 2007).

132 Institutional Arrangements for Carbon Sequestration Projects
Finally, compensation payments are regarded on the one hand as a good reimbursement for
desisting from using the forest resources. On the other hand, the fear of corruption and
embezzlement of funds has been expressed caused by bad experience. Indonesia is a country
which has considerable problems with corruption, and Transparency International has listed it
as Number 143 out of 179 countries on the Corruption Perception Index in 2007 - it scores 2.3
from 10 points, which is equal to very high perceived corruption (Transparency International
2007). Similarly, bribery is a topic ingrained in Indonesian culture and seen as “almost
morally acceptable” (Palmer 2005). Compensation payments are additionally not seen as a
solution for the inherent problem of land scarcity, associated with the need to work, obtain
food and pass on land to the villagers’ children. This was also mentioned to be one of the
main disadvantages of the National Park, that not enough land will be available for their
children (Mappatoba and Birner 2004).
These findings allow us to make some judgements as to whether the institutional arrangement
of the KKM could provide a basis for a carbon sequestration project or more generally for a
forest PES project.
A carbon sequestration project could benefit from the framework of the rules and regulations
of the KKM established on the basis of the traditional customary institution, providing an
important groundwork for the implementation of a PES project. The given regulatory
framework can be used and enriched. However, in the present circumstances the purpose of
the agreement has not been communicated to all stakeholders, and the involvement, at least of
some villagers or representatives of these villagers, is not given. As argued by Hanna (1995)
and mentioned in Chapter 3, a resource management process must represent the range of user
interests and have a clear purpose and transparent operation, which allows for a better
identification of the community with the aims of such a project. Thus, for a PES or forest
carbon sequestration project, the participation of all those affected by it can not be guaranteed
by the present institutional arrangement of the KKM. For an internationally financed project,
the LKD needs to be reinforced and monitoring activities have to be conducted more
thoroughly and frequently. More financial support can help to foster these activities. A PES
project typically involves payments to the providers of the environmental service at stake.
This requires a transparent organisational structure and the objectives and responsibilities
have to be clearly defined. The present structure of the community conservation agreements
and the associated village conservation councils differs between villages, because on the one
hand the NGOs used different approaches for the agreements and on the other hand the village
structures, due to their ethnic compositions, diverge. We have the additional problem in

Chapter 8 133
Indonesia, that due to high levels of corruption, which are even present in daily operations, a
mistrust is engrained in the people; whether projects will be carried out according to their
stated objectives and funds be handled efficiently and distributed fairly. Thus, with the present
institutional arrangement of the KKMs the administration and management of such a PES
project is very difficult.
We can conclude from this particular case study in Indonesia, that the structures of existing
natural resource management agreements can provide initial institutional linkages and
framework conditions to implement a forest PES project. It needs to be assessed on a case to
case basis, whether the natural resource management structures are sufficient and, as we have
seen from this case study, the socio-cultural aspects of the specific circumstances need to be
taken account of. In addition, it is of major importance to integrate the community members
into the processes of the management of the natural resource projects. Compliance with
regulations increases when they are considered acceptable and legitimate by those whose
interests are regulated. Obviously not all community members can participate in these
processes, yet an option might be to let the villagers vote on the outcome. Finally, the
governance structures in a country are an important factor for the success of development and
conservation initiatives, as the experience of a world-wide study shows. Higher governance
rates therefore, have a positive influence on conservation projects (Smith et al. 2003).
Specifically for PES projects this means for their establishment that advantage should be
taken of “intermediary bodies” which can be provided through traditional community
resource management institutions. Using known institutional arrangements can ensure
familiarity for the participants and they have trust in it. Negotiations can be rendered much
more efficiently, as a contact is given and contractual arrangements can be made with the
entire group rather than with individuals. This can substantially decrease transaction costs.
Additionally, if specific arrangements are already established, such as in this case monitoring
and enforcement structures, costs can be reduced even further.
8.4. Summary
This Chapter presents the results of the analysis of the institutional arrangement of the
community conservation agreements present in some of the villages in the Lore Lindu region.
We are using four central points for the analysis, and they are the institutional structure of the
agreements, the involvement of different social village groups in their establishment, the
regulatory structures for monitoring illegal activities, and the impact on the environment due
to the agreements as perceived by the villagers. The results obtained in this case study allow

134 Institutional Arrangements for Carbon Sequestration Projects
for making conclusions and recommendations as to whether community natural resource
management projects can be used as a foundation for a payment for environmental services
scheme.
Chapter 9 135
9. CONCLUSIONS
9.1. Synthesis of Results
Climate change is posing increasing challenges to humanity and requires action at different
levels and in distinct fields. One focus area for current mitigation strategies is to reduce
greenhouse gas emissions caused through land-use changes and deforestation activities. The
present study focuses on PES schemes, a class of economic instruments that are used as
market-based incentives to enforce or support sustainable forest management and
conservation activities.
We have used the Lore Lindu region in Central Sulawesi, Indonesia as a case study to address
the following research objectives. The principal purpose of the study was to investigate the
impact of a payments for carbon sequestration scheme on local households and their land-use
systems, as well as the conditions for the institutional arrangement of such a scheme. At the
household level, we explored not only the impact of such payments, but also their potential as
an incentive for the adoption of more environmentally beneficial land-use systems, and their
ability to offer a mechanism for the protection of the rainforest. At the institutional level, the
objective was to investigate the structures of the existing community conservation
agreements, and whether they can be used as a platform for a potential payments for carbon
sequestration scheme.
In order to meet these objectives we selected a quantitative and a qualitative research design.
The first part of the study focused on the household level. We conducted a survey with a
standardised questionnaire and evaluated the data in a comparative static linear programming
model. This way, we could assess the household behaviour and its adaptation with respect to
resource allocation in light of new policy options, as the solution to the model indicates the

136 Conclusions
optimum activities for the households. In the second part we discussed and evaluated the
impact of the institutional arrangement of community conservation agreements in focus
groups, using participatory rural appraisal tools.
The two complementary methodological approaches have allowed us to provide answers to
the research objectives outlined in the introduction. The quantitative analysis revealed the
following findings:
- The impact of carbon payments depends on the prices they obtain on the carbon
markets. With low carbon certificate prices of €5 tCO2e-1, the additional remuneration
for the agroforestry system in general is quite low, especially in comparison to the
very high gross margin of €1,460 per hectare of the intensively managed cacao.
However, with carbon certificate prices at the upper end, the households who obtain
the lowest total gross margin from their crop activities can realise an 18 percent
increase of their gross margin from cropping activities with the introduction of
payments. These households also realise the highest increase in absolute terms of their
gross margin. Additionally, they provide the second highest (and only marginally
lower than the highest) environmental benefit in terms of the annual carbon
sequestration rate from their cacao agroforestry systems.
- Therefore, in this specific context, the important question with respect to the carbon
payments is which household type derives more benefit and what are implications of
this? If the payments are targeted towards the high-shade cacao agroforestry systems,
indirectly the poorer households from the local ethnic group benefit, as they primarily
cultivate the low-input and shade intensive cacao systems. In turn, this additional
income can reduce their need to open up further land at the forest margin and sell it to
the migrants. A win-win situation is possible whereby the vicious cycle of poverty and
deforestation can be broken.
- Additionally, compensation payments can be used as an incentive for deforestation
reduction, which ultimately leads to avoided greenhouse gas emissions. The analysis
shows that the credit prices currently observed on carbon markets could be sufficient
for the majority of households in the Lore Lindu region to stop them from further
forest conversion.
The qualitative analysis revealed the following information about the institutional context:
- If one would want to implement such a payment scheme for carbon sequestration in
the region, the present institutional arrangement of the community conservation
Chapter 9 137
agreements could be used as a starting point. They provide an existing regulatory
framework, which is based on the rules and regulations of the traditional customary
council, the Lembaga Adat. The entity, that has been established on the basis of the
agreements and is in charge of monitoring activities, usually is the village
conservation council LKD. It addresses illegal activities, such as timber removal from
the assigned conservation areas and is involved in rule enforcement. Extractive
activities have declined since the establishment of the institution and environmental
awareness has increased, however, not homogeneously across all villages.
- Thus, for a potential PES project, the institutional framework needs to be strengthened
and community participation in the conservation activities fostered. This is because
the newly formed institution of the LKD is not very strong, due to financial
limitations, but also to sometimes unclear definitions of responsibilities between the
different village institutions. Additionally, the participation of the villagers in the
negotiation and formation of the agreement was restricted, which makes the
acceptance and compliance with the regulations difficult, since their interests have not
been represented in the process of the agreements’ establishment.
To summarise, payments for carbon sequestration can provide positive impacts for the
research region. If the carbon credits are specifically targeted towards more sustainable
agroforestry systems, increased environmental benefits in terms of higher carbon
sequestration rates, as well as increased income benefits for the poorer households can be
obtained. Such a scheme could build upon existing community conservation agreements.
However, the participation structures for the villagers, as well as monitoring and enforcement
need to be improved to safeguard the stability of the rainforest margin in the Lore Lindu
region.
9.2. Strengths and Limitations of the Study and Further Research
The present study exhibits some significant strengths and research findings. These are
subsequently summarised:
- By combining a quantitative and qualitative research design we were able to
concentrate on two different levels associated with PES schemes. The methods and the
advantages of each approach complement each other, allowing for a stronger research
design that results in valid and reliable results. The quantitative analysis permitted us
to measure the impact of carbon payments using the tool of linear programming. The

138 Conclusions
results enabled us to make recommendations with respect to the application and
usefulness of this incentive measure. The qualitative approach makes it possible to
include the individuals’ or group behaviour, their perceptions and thoughts, which are
not easy to document using numbers. “It captures what people say and do as a product
of how they interpret the complexity of their world, and allows researchers to
understand events from the viewpoint of the participants (Burns 2007, p11).
Therefore, we obtained an in-depth insight into the participation processes and
institutional framework of the agreements, as perceived by two different social groups
in four villages.
- This study provides valuable input to the research on payments for carbon
sequestration and its associated benefits. Our results indicate that targeting payments
on a site-specific basis can have the most advantageous impact, both in terms of
fostering environmental services, as well as households’ income. Specifically, the
carbon sequestration rates of more environmentally friendly land-use systems are
increased and poorer households realise a rise in their revenues. Thus, for future
research in the region in light of the proposal of a cacao certification project, we
recommend to target payments to specific segments of the population.
- In comparison to most other studies using a linear programming approach and
modelling households’ behaviour when introducing new policy options, this
investigation focuses on the economic instrument of PES schemes and specifically on
carbon sequestration. In addition, there is hardly any research on the economics of
carbon sequestration, which uses optimisation techniques at the household level. The
particular advantage of this study is, therefore, to obtain results for the introduction of
this market-based incentive for farmers and the impact on their land- and forest use
systems and transformation processes.
The study does face some limitations and restrictions, which are important to mention, as
these can guide further research towards remaining questions.
- When we considered the research methodology, we adopted a static comparative
linear programming model under certain assumptions which were outlined in Chapter
7.1.5. An extension of the model that would yield additional results refers to
integrating cacao production data of an entire life span of the trees and obtaining a
dynamic or multiperiod model. Such a model would be more sensitive towards the
production cycle of the cacao trees, as they do not produce a uniform stream of output
Chapter 9 139
over the years and the results could provide an optimal growth strategy on a farm
level. Moreover, the linear programming model could be expanded by integrating
further biophysical parameters, such as soil variables and nutrient availability. This
can allow for a more holistic approach and account for the changes in these parameters
and their impact on economic decisions with respect to the land-use. Future research
may explore these methodological extensions in more detail.
- Furthermore, we have only calculated and integrated into the model the direct
economic value of the cacao agroforestry systems in terms of their gross margin, to
which we added the potential payments to be received for the carbon sequestration of
the cacao and shade trees. Yet, there are further benefits to be obtained from these
cacao agroforestry systems. On the one hand there are the values of the NTFPs
obtainable in the agroforestry systems. These include, for example, the products of
fruit and other trees, such as bananas, kemiri nuts and coconuts. Vanilla and cloves, as
well as certain medicinal plants, which are used by traditional healers, are also
sometimes found in these agroforestry systems. In addition, apart from carbon
sequestration, other environmental services are provided by the agroforestry systems,
such as nutrient cycling, erosion control, especially in steep areas, as well as
ecosystem functioning and biodiversity values. Integrating these direct and indirect
values into the analysis of the land-use systems of the households would most
probably result in a shift in the valuation of the different agroforestry systems,
providing higher economic values for the shade-intensive systems.
- We made the assumption that the compensation payments for avoiding any further
deforestation are made to the farmers. In essence, the farmers would be paid to cease
illegal extraction activities, as they are not allowed to convert forest inside the
National Park. The current command-and-control approach by the National Park
administration does not work and is not respected by the villagers. Therefore, we
recommend investigating the appropriate structures for the payment modalities for
avoided deforestation. The potential receivers could also be institutions at the
community or regional level. Further approaches also need to be developed with the
villagers to stop their conversion activities of the National Park forest and involving
them more in conservation actions.
- With respect to the qualitative methodology we adopted for the second part of the
study, it is important to keep in mind that these results, strictly speaking, represent the
140 Conclusions
situation in a localised environment in four villages. It is difficult to extrapolate the
findings of a qualitative approach to a wider population, i.e. all villages in the research
region. However, we conducted the focus group discussions in specifically identified
villages in order to detect certain phenomena. We used a cross-section of four villages
which were at different stages in the implementation process of KKMs in order to
contrast them and identify emerging patterns. Thus, we have to keep in mind that these
results therefore are not representative for the entire research region. Yet, they indicate
certain trends and can complement the results of other studies in the region, which
have collected data in a wide cross section of villages in a standardised survey, such as
Palmer in 2006 and Reetz in 2007.
- Finally, a major shortcoming of the study is its application to the real world. The next
section discusses policy implications and recommendations based on the emerging
trends of the research are formulated, however, the results of the study remain
hypothetical constructs. Specifically in the reality of the Indonesian villagers, the
question that was always raised among the respondents referred to the benefits they
can obtain from the investigation. As we outlined in Chapter 2, there are a
considerable number of carbon projects carried out and more and more funds (e.g.
World Bank Forest Carbon Partnership Facility) available, especially in the voluntary
sector, as these projects have the great advantage of being “charismatic” with public
appeal. However, it is a long way off for forestry offset projects to be implemented in
the mainstream and the question remains whether they could eventually become
reality in the Lore Lindu region.
Notwithstanding, we can draw some important insights from this study which can be of help
for the advancement of the market-based inventive mechanism of the PES schemes.
9.3. Policy Implications and Recommendations
The potential advantage of PES programmes can be seen in the results of this study. They can
provide a stable income source for the farmers involved in these schemes. Especially in light
of fluctuating crop prices, a phenomenon which has been observed on the world market, but
also on local markets for cacao prices, this additional income can contribute to a reduction of
the vulnerability for the smallholders in the research region. The cash-flow, once the farmers
are participants and beneficiaries of such a scheme, is constant and stable. Potentially, this
support for the cash crop cacao could lead to a reduction in food supply, as the farmers would
have an incentive to switch towards these perennial cropping systems. However, in previously

Chapter 9 141
formulated contracts with the farmers, the areas which are designated to these schemes will be
decided on and cannot be enlarged afterwards. Obviously, the advantage of a stable income
source is also applicable for cash-poor smallholders in other regions of the world. However it
is important to help ensure that the support of specific land-use systems does not displace the
crop production systems which are necessary for local food supply.
In light of searching for options for climate change mitigation, it is important to settle on cost-
efficient solutions, which provide a high potential for the abatement of greenhouse gases. The
present study demonstrates that comparing different options in the agricultural sector, the
protection of the Lore Lindu National Park offers the possibility of a low-cost alternative for
the reduction of carbon dioxide in comparison to biofuel options in Germany. We can
recommend therefore, to conduct further studies in forest or protected areas in different parts
of the world with respect to their potential for carbon sequestration. This can potentially allow
for the provision of further investment funds for the conservation of forests. This is
specifically important in the light of the expansion of land dedicated to the production of
bioenergy crops. In some regions this takes place at the expense of primary forest, as in
Indonesia for the oil palm production, as well as sometimes displacing the traditional food
crops, which has been happening in the USA with maize production.
If the aim of a PES project is to integrate farmers, the findings of the present study indicate
that for their implementation, any scheme should take into account existing structures of
institutional arrangements. These institutions should either already focus on the management
of natural resource processes, and/or they should be institutions with existing participation
structures for the local communities which are affected by the project. Therefore, regulatory
structures can be built upon and compliance can be much more easily ensured. Using existing
structures offers the additional advantage of familiarity with the institution for the
participants. As the socio-cultural conditions differ between continents and countries, and
even sometimes in the same project region as we have observed in this study, it is
advantageous to work with local institutional frameworks. These usually have integrated local
customs already, and are reflected in the structure of the institution, making it easier for new
projects to build upon.
Finally, based on the results of the qualitative research findings we propose that PES schemes
need to be assessed on a case-by-case basis for their applicability to a specific region and
circumstances. They can offer win-win situations, whereby environmental benefits can be
boosted, as carbon sequestration is augmented or biodiversity services safeguarded, in

142 Conclusions
addition, the incomes of the local rural population can be increased and finally, incentives are
given to break the vicious cycles of poverty and deforestation. Therefore, climate change
policies should integrate this market-based incentive mechanism, as it offers mitigation
solutions for carbon dioxide emissions and at the same time offering a potential to
complement poverty reduction policies.
Chapter 9 143
REFERENCES
Abercrombie, N. 1988. The Penguin Dictionary of Sociology. Harmondsworth: Penguin.
Achard, F., A. S. Belward, H. D. Eva, S. Federici, D. Mollicone, and F. Raes. 2005. Accounting for avoided conversion of intact and non-intact forests: Technical options and a proposal for a policy tool. European Commission Joint Research Centre.
Acs, S., P. Berentsen, K. Takacs-György, and R. Huirne. 2000. Economic modelling of hungarian farms incorporating nature conservation. Wageningen. Farm Management Group, Wageningen UR.
Andrade C., H. J. 2007. Email from 11.01.2007.
Anggraenie, T. 2005. Market Structure and Price Variability of Agricultural Commodities in Central Sulawesi Province, Indonesia. Master thesis, Institute of Rural Development, Department of Agriculture, University of Göttingen, Göttingen.
Antle, J. M., and J. J. Stoorvogel. 2008. Agricultural carbon sequestration, poverty, and sustainability. Environment and Development Economics 13 (03):327-352.
Antle, J. M., J. J. Stoorvogel, and R. O. Valdivia. 2007. Assessing the economic impacts of agricultural carbon sequestration: terraces and agroforestry in the Peruvian Andes. Agriculture, Ecosystems and Environment 122 (4):435-445.
ANZDEC. 1997. Summary Environmental Impact Assessment of the Central Sulawesi Integrated Area Development and Conservation Project in the Republic of Indonesia.
Arrow, K., G. Daily, P. Dasgupta, S. Levin, K.-G. Mäler, E. Maskin, D. Starrett, T. Sterner, and T. Tietenberg. 1999. Managing Ecosystem Resources. The Beijer International Institute of Ecological Economics. Discussion Paper 122
Asquith, N. M., M. T. Vargas Ríos, and J. Smith. 2002. Can forest-protection carbon projects improve rural livelihoods? Analysis of the Noel Kempff Mercado climate action project, Bolivia. Mitigation and Adaptation Strategies for Global Change 7 (4):323-373.
Asselt Marjolein, B. A. v., and N. Rijkens-Klomp. 2002. A look on the mirror: reflection on participation in Integrated Assessment from a methodological perspective. Global Environmental Change 12:167-184.
Backeus, S., P. Wikstrom, and T. Lamas. 2006. Modeling carbon sequestration and timber production in a regional case study. Silva Fennica 40 (4):615-629.
144
Bales, R. F. 1950. Interaction process analysis; a method for the study of small groups. Cambridge, Mass.,: Addison-Wesley Press.
Ballet, J., N. Sirven, and M. Requiers-Desjardi. 2007. Social Capital and Natural Resource Management: A Critical Perspective. The Journal of Environment & Development 16:355- 374.
Bank Indonesia. 2006. Financial Statistics. http://www.bi.go.id/web/en/Data+Statistik/
Barbier, B., and G. Bergeron. 2001. Natural resource management in the Hillsides of Honduras. Washington D.C. IFPRI. Research Report 123.
Belli, P. 2001. Economic analysis of investment operations : analytical tools and practical applications. Washington, D.C.: World Bank.
Belsky, J. M., and S. F. Siebert. 2003. Cultivating cacao: Implications of sun-grown cacao on local food security and environmental sustainability. Agriculture and Human Values 20 (3):277-285.
Berié, E., ed. 2007. Der Fischer Weltalmanach 2008: Zahlen, Daten, Fakten. Frankfurt am Main: Fischer
Bird, D. N., M. Dutschke, L. Pedroni;, B. Schlamadinger;, and A. Vallejo. 2005. Should one trade tCERs or lCERs? ENCOFOR. http://www.joanneum.at/encofor/publication/Should_one_trade_tCERs_or_lCERs-ENCOFOR_policy_brief.pdf.
Bishop, J., and N. Landell-Mills. 2002. Forest Environmental Services: An Overview. In Selling Forest Environmental Services: Market-based Mechanisms for Conservation and Development, edited by S. Pagiola, J. Bishop and N. Landell-Mills. London: Earthscan.
Bloor, M. 2001. Focus groups in social research, Introducing qualitative methods. London ; Thousand Oaks, Calif.: SAGE Publications.
Bohnsack, R. 2003. Gruppendiskussion. In Qualitative Forschung : ein Handbuch, edited by U. Flick, E. v. Kardorff and I. Steinke. Reinbeck bei Hamburg: Rowohlt.
Börner, J.-C. 2005. A bio-economic model of small-scale farmers’ land use decisions and technology choice in the eastern Brazilian Amazon. Dissertation, Landwirtschaftliche Fakultät, Universität Bonn, Bonn.
Borrini-Feyerabend, G., M. T. Farvar, J. C. Nguinguiri, and V. A. Ndangang. 2000. Co-management of Natural Resources: Organising, Negotiating and Learning-by-Doing. Edited by GTZ and IUCN. Heidelberg: Kasparek Verlag.
Bortz, J., and N. Döring. 2006. Forschungsmethoden und Evaluation für Human- und Sozialwissenschaftler. 4., überarb. Aufl., Nachdruck ed, Springer-Lehrbuch. Berlin u.a.: Springer.
Brown, S. 1997. Estimating biomass and biomass change in tropical forests: A primer. Rome, Italy. FAO. Forestry Paper 134.
Brown, S., J. Sathaye, M. Cannell, and P. Kauppi. 1996. Management of Forests for Mitigation of Greenhouse Gas Emissions. In Climate change 1995: impacts, adaptations and mitigation of climate change: scientific analyses. Contribution of working group II to the second assessment report of the Intergovernmental Panel on Climate Change, edited by R. T. Watson, M. C. Zinyowera and R. H. Moss. Cambridge, U.K.: Cambridge University Press.
Chapter 9 145
Bulte, E. H., L. Lipper, R. Stringer, and D. Zilberman. 2008. Payments for ecosystem services and poverty reduction: concepts, issues, and empirical perspectives. Environment and Development Economics 13 (3):245-254.
Burkard, G. 2002. Stability or Sustainability? Dimensions of socio-economic security in a rainforest margin. Göttingen. STORMA. Discussion Paper Series 7. http://ufgb989.uni-forst.gwdg.de/DPS/index.htm.
Burkard, G. 2007. Community Conservation Agreements as Institutions for the Common Pool Resource Forest Margins: Genesis, Performance and Contexts in the Napu Village. Göttingen. STORMA. Discussion Paper Series 20. http://ufgb989.uni-forst.gwdg.de/DPS/index.htm.
Burns, R. B. 2000. Introduction to Research Methods. London: Sage Publications Ltd.
Burkard, G. 2002. Natural Resource Management in Central Sulawesi: Past Experience and Future Prospects. Göttingen. STORMA. Discussion Paper Series 8. http://ufgb989.uni-forst.gwdg.de/DPS/index.htm.
Cacho, O. J., G. R. Marshall, and M. Milne. 2003. Smallholder Agroforestry Projects: Potential for Carbon Sequestration and Poverty Alleviation. Agriculture and Economic Development Analysis Division, FAO. ESA Working Paper 03-06.
Capoor, K., and P. Ambrosi. 2007. State and Trends of the Carbon Market 2007. Washington D.C. World Bank, IETA.
Capoor, K., and P. Ambrosi. 2008. State and Trends of the Carbon Market 2008. Washington D.C. World Bank.
Carbon Finance. 2008. Indonesia eyes 100 Mt of avoided deforestation VERs. http://www.carbon-financeonline.com/index.cfm?section=global&action=view&id=11052
Carbon Positive. 2008. Carbon Positive News http://www.carbonpositive.net/viewarticle.aspx?articleID=1117
Carlson, G. A., D. Zilberman, and J. A. Miranowski. 1993. Agricultural and Environmental Resource Economics. Oxford: Oxford University Press.
CCX. 2008. Overview. http://www.chicagoclimatex.com/content.jsf?id=821
Challen, R. 2000. Institutions, transaction costs, and environmental policy : institutional reform for water resources, New horizons in environmental economics. Cheltenham, UK ; Northampton, MA: Edward Elgar Pub.
Chambers, R. 1997. Whose reality counts? Putting the first last. London: Intermediate Technology Publications.
Chomitz, K. M. 2007. At loggerheads? : agricultural expansion, poverty reduction, and environment in the tropical forests. Washington D.C. World Bank. Policy Research Report
CIRAD, IDDRI, CIFOR, and ECOFOR. 2007. International Regime, Avoided Deforestation and the Evolution of Public and Private Forest Policies in the South. In International Workshop. Paris, November 22-23, 2007.
Coase, R. 1937. The Nature of the Firm. Economica 4:386-405.
Coase, R. 1960. The problem of social cost. Journal of Law and Economics 3 (1):1-44.
Coase, R. H. 1988. Notes on the Problem of Social Cost. In The Firm, the Market and the Law, edited by R. H. Coase. Chicago: University of Chicago Press.
Coffey, A., and P. Atkinson. 1996. Making sense of qualitative data : complementary research strategies. Thousand Oaks: Sage Publications.
146
Costanza, R., R. d'Arge, R. de Groot, S. Farber, M. Grasso, B. Hannon, K. Limburg, S. Naeem, R. V. O'Neill, J. Paruelo, R. G. Raskin, P. Sutton, and M. van den Belt. 1997. The value of the world's ecosystem services and natural capital. Nature 387 (6630):253-260.
de Jong, T. R., R. Tipper, and G. Montoya-Gomez. 2002. An economic analysis of the potential for carbon sequestration by forests: evidence from southern Mexico. Ecological Economics 33:313-327.
de Koning, F., R. Olschewski, E. Veldkamp, P. Benítez, P. Laclau, M. López, M. de Urquiza, and T. Schlichter. 2002. Evaluation of the CO2 sequestration potential of afforestation projects and secondary forests in two different climate zones of South America. Eschborn. Deutsche Gesellschaft für Technische Zusammenarbeit (GTZ).
DeFries, R., F. Achard, S. Brown, M. Herold, D. Murdiyarso, B. Schlamadinger, and C. de Souza. 2007. Earth observations for estimating greenhouse gas emissions from deforestation in developing countries. Environmental Science & Policy 10 (4):385-394.
Desa Puroo; Langko; Tomado dan Anca. 2005. Kesepakatan Konservasi Masyarakat Dataran Lindu, Kecamatan Kulawi, Kabupaten Donggala.
Desa Wuasa. 2002. Kesepakatan Konservasi Masyarakat, Desa Wuasa, Kecamatan Lore Utara, Kabupaten Poso.
Deutsche Bundesbank. 2007. Monatsbericht März. Frankfurt am Main. Selbstverlag der Deutschen Bundesbank.
Diagne, A., and M. Zeller. 2001. Access to credit and its impact on welfare in Malawi. Washington, D.C., USA: International Food Policy Research Institute.
Dudwick, N., K. Kuehnast, V. N. Joes, and M. Woolcock. 2006. Analyzing Social Capital in Context: A Guide to Using Qualitative Methods and Data. Washington D.C. The World Bank Institute.
Dutschke, M., and B. Schlamadinger. 2003. Practical issues concerning temporary credits in the CDM. Hamburg, Germany. Hamburg Institute of International Economics (HWWA). Discussion Paper 227.
Ebeling, J., and M. Yasue. 2008. Generating carbon finance through avoided deforestation and its potential to create climatic, conservation and human development benefits. Philosophical Transactions of the Royal Society B-Biological Sciences 363 (1498):1917-1924.
Ebersberger, S., and R. Weber. 2005. Forest Conversion and Rural Migration - Investigating Local Variations. In International Symposium "The Stability of Rainforest Margins: Linking Ecological, Economic and Social Constraints of Land Use and Conservation". Göttingen, Germany: Universitätsdrucke Göttingen.
Engel, S., R. López, and C. Palmer. 2006. Community-industry contracting over natural resource use in a context of weak property rights: The case of Indonesia. Environmental and Resource Economics 33 (1):73-98.
Erasmi, S. 2007. Email from 19.02.2007.
Erasmi, S., and J. Priess. 2007. Satellite and survey data: a multiple source approach to study regional land-cover / land-use change in Indonesia. In Geovisualisierung in der Humangeographie, edited by F. Dickmann. Bonn, Germany: Kirschbaum Verlag.
Erasmi, S., A. Twele, M. Ardiansyah, A. Malik, and M. Kappas. 2004. Mapping deforestation and land cover conversion at the rainforest margin in Central Sulawesi, Indonesia.

Chapter 9 147
FAO. 2004. A review of carbon sequestration projects. Rome. FAO.
FAO. 2006. Global Forest Resources Assessment 2005. Rome. Food and Agricultural Organization. FAO Forestry Paper 147.
FAO. 2007. The State of Food and Agriculture - Paying Farmers for Environmental Services. Rome. FAO. Agriculture Series No. 38.
FAO. 2007. The State of the World’s Forests. Rome. FAO.
Fargione, J., J. Hill, D. Tilman, S. Polasky, and P. Hawthorne. 2008. Land clearing and the biofuel carbon debt. Science 319 (5867):1235-1238.
Faust, H., M. Maertens, R. Weber, N. Nuryartono, T. v. Rheenen, and R. Birner. 2003. Does Migration lead to Destabilization of Forest Margins? - Evidence from an interdisciplinary field study in Central Sulawesi. Göttingen. STORMA. Discussion Paper Series 11. http://ufgb989.uni-forst.gwdg.de/DPS/index.htm.
FONAFIFO, ed. 2005. The Environmental Services Program: a success story of sustainable development implementation in Costa Rica. FONAFIFO, over a decade of action. Edited by J. M. Rodríguez. San José.
Frankfort-Nachmias, C., and D. Nachmias. 1996. Research methods in the social sciences. 5th ed. New York: St. Martin's Press.
Franzen, M., and M. B. Mulder. 2007. Ecological, economic and social perspectives on cocoa production worldwide. Biodiversity and Conservation 16 (13):3835-3849.
FWI/GFW. 2002. The State of the Forest: Indonesia. Bogor. Forest Watch Indonesia, and Washington DC, Global Forest Watch.
Geist, H. J., and E. F. Lambin. 2002. Proximate causes and underlying driving forces of tropical deforestation. Bioscience 52 (2):143-150.
Gibbs, C. J. N., and D. W. Bromley. 1989. Institutional Arrangements for Management of Rural Resources: Common-Property Regimes. In Common property resources : ecology and community-based sustainable development, edited by F. Berkes. London ; New York: Belhaven Press.
Glaser, B. G., and A. L. Strauss. 1967. The discovery of grounded theory; strategies for qualitative research. Chicago,: Aldine Pub. Co.
Glenk, K., J. Barkmann, S. Schwarze, M. Zeller, and R. Marggraf. 2006. Differential influence of relative poverty on preferences for ecosystems services: Evidence from rural Indonesia. In 26th Conference of the International Association of Agricultural Economists (IAAE) “Contributions of Agricultural Economics to Critical Policy Issues”. Queensland, Australia.
Government of Indonesia. 2007. Reducing emissions from deforestation in developing countries (REDD). Paper submitted to UNFCCC SBSTA by the Government of Indonesia www.cifor.cgiar.org/NR/rdonlyres/4E81DB28-410F-4885-ACB6-6CA802603A32/0/indonesia.pdf.
Greenbaum, T. 1998. The Handbook for Focus Groups. 2nd Edition ed. Thousand Oaks: Sage.
Gropengießer, H. 2001. Didaktische Rekonstruktion des Sehens: Wissenschaftliche Theorien und die Sicht der Schüler in der Perspektive der Vermittlung. 2nd edition ed. Oldenurg: Didaktisches Zentrum Oldenburg.
Hamburg, S. 2000. Simple rules for measuring changes in ecosystem carbon in forestry-offset projects. Mitigation and Adaptation Strategies for Global Change 5 (1):25-37.

148
Hamilton, K., M. Sjardin, T. Marcello, and G. Xu. 2008. Forging a Frontier: State of the Voluntary Carbon Markets 2008. New York. Ecosystem Marketplace & New Carbon Finance. http://ecosystemmarketplace.com/documents/cms_documents/2008_StateofVoluntaryCarbonMarket.4.pdf.
Hanna, S. 1995. Efficiencies of user participation in natural resource management. In Property Rights and the Environment: Social and Ecological Issues, edited by S. Hanna and M. Munasinghe. Washington D.C.: Beijer International Institute of Ecological Economics and the World Bank.
Hartwick, J. M., and N. D. Olewiler. 1986. The economics of natural resource use. New York, NY: Harper & Row.
Hazell, P. B. R., and R. D. Norton. 1986. Mathematical Programming for Economic Analysis in Agriculture. Berkeley: MacMillan Publishing Company.
Henders, S. 2005. Determination of Carbon Sequestration Potential and Viability of combined small-scale timber-carbon sequestration projects for three plantation species in Southern Chile. Master Thesis, Faculty of Forestry, Georg-August Universität Göttingen, Göttingen.
Henniges, O., and J. Zeddies. 2006. Bioenergy and Agriculture: Promises and Challenges - Bioenergy in Europe: Experiences and Prospects. Washington D.C. IFPRI. Brief 9 of 12 Focus 14.
Hubbard, M. 1997. The 'new institutional economics' in agricultural development: Insights and challenges. Journal of Agricultural Economics 48 (2):239-249.
ICCO. 2007. The Chocolate Industry. http://www.icco.org/about/chocolate.aspx
ICCO. 2008. ICCO Daily Prices. www.icco.org
IPCC. 2007. Climate Change 2007: Synthesis Report - Summary for Policymakers. Valencia. IPCC.
IPCC. 2007. Climate Change 2007: The Physical Science Basis. Contribution of Working Group I to the Fourth Assessment Report of the Intergovernmental Panel on Climate Change. Edited by S. Solomon, D. Qin, M. Manning, Z. Chen, M. Marquis, K.B. Averyt, M. Tignor and H. L. Miller. Cambridge, United Kingdom and New York, NY, USA: Cambridge University Press.
Iskandar, H., D. Murdiyarso, and M. Kanninen. 2006. Bombana Mixed-tree Species, Indonesia. In Community Forest Management as Carbon Mitigation Option, edited by D. Murdiyarso and M. Skutsch. Bogor, Indonesia: CIFOR.
Jack, B. K., C. Kousky, and K. E. Sims. 2007. Lessons Relearned: Can Previous Research on Incentive-Based Mechanisms Point the Way for Payments for Ecosystem Services? Center for International Development at Harvard University. CID Graduate Student and Postdoctoral Fellow Working Paper No. 15
Jack, B. K., C. Kousky, and K. E. Sims. forthcoming. Designing Payments for Ecosystem Services: Lessons from Previous Experience with Incentive-based Mechanisms. PNAS.
Jindal, R., B. Swallow, and J. Kerr. 2008. Forestry-based carbon sequestration projects in Africa: Potential benefits and challenges. Natural Resources Forum 32 (2):116-130.
Jung, M. 2005. The role of forestry projects in the clean development mechanism. Environmental Science and Policy 8 (2):87-104.

Chapter 9 149
Kahn, J. R. 2005. The economic approach to environmental and natural resources. 3rd ed. Mason, Ohio: Thomson/South-Western.
Kant, Z. 2007. TNC Guide to the Carbon Market and Opportunities for Conservation Activities. TNC. http://earthmind.net/carbon/docs/tnc-2007-carbon-market.pdf.
Keil, A. 2004. The socio-economic impact of ENSO-related drought on farm households in Central Sulawesi, Indonesia, Berichte aus der Agrarökonomie. Aachen: Shaker Verlag.
Keil, A., M. Zeller, G. Gerold, C. Leemhuis, G. Gravenhorst, and D. Gunawan. 2007. The impact of ENSO on sustainable water management and the decision-making community at a rainforest margin in Indonesia (IMPENSO). Göttingen. Georg-August-Universität Göttingen. Final project report
Kessler, M. 2008. Email from 9.04.2008.
Kollmuss, A., and B. Bowen. 2007. Voluntary Offsets For Air-Travel Carbon Emissions. Medford, MA. Tufts Climate Initiative.
Krippendorff, K. 1980. Content analysis. An Introduction to its Methodology. Beverly Hills: Sage.
Krueger, R. A. 1994. Focus groups : a practical guide for applied research. 2nd Edition ed. London, New Delhi: Thousand Oaks.
Krüger, H. 1983. Gruppendiskussionen - Überlegungen zur Rekonstruktion sozialer Wirklichkeit aus Sicht der Betroffenen. Soziale Welt 34 (1):90-109.
Lamnek, S. 2005. Gruppendiskussion : Theorie und Praxis. 2., überarb. und erw. Aufl. ed, UTB Psychologie, Pädagogik, Soziologie ; 8303. Weinheim u.a.: Beltz.
Landell-Mills, N., and I. Porras. 2002. Silver bullet or fool's gold? A global review of markets for forest environmental services and their impact on the poor; Instruments for sustainable private sector forestry. London: IIED.
Laurance, W. F. 2007. A new initiative to use carbon trading for tropical forest conservation. Biotropica 39 (1):20-24.
Leemhuis, C. 2005. The Impact of El Niño Southern Oscillation Events on Water Resource Availability in Central Sulawesi, Indonesia - A hydrological modelling approach. PhD Dissertation, Department of Geography, Göttingen, Göttingen.
MacDicken, K. G. 1997. A Guide to Monitoring Carbon Storage in Forestry and Agroforestry Projects. Winrock International Institute for Agricultural Development.
Maertens, M. 2003. Economic Modeling of Land-Use Patterns in Forest Frontier Areas: Theory, Empirical Assessment and Policy Implications for Central Sulawesi, Indonesia. Berlin: dissertation.de.
Maertens, M., M. Zeller, and R. Birner. 2006. Sustainable agricultural intensification in forest frontier areas. Agricultural Economics 34 (2):197-206.
Máñez Costa, M. 2004. The Integration of Incentives for Environmental Protection in Farm Households - A Case Study in Guatemala. Berlin: dissertation.de - Verlag im Internet GmbH.
Mangold, W. 1967. Gruppendiskussion. In Handbuch der empirischen Sozialforschung, edited by R. König. Stuttgart: Ferdinand Enke Verlag.
Manguiat, M. S. Z., R. Verheyen;, J. Mackensen;, and G. Scholz. 2005. Legal Aspects in the Implementation of CDM Forestry Projects. Gland, Switzerland and Cambridge, UK. IUCN. IUCN Environmental and Law Paper No. 59
150
Mappatoba, M. 2004. Co-Management of Protected Areas, The Case of Community Agreements on Conservation in the Lore Lindu National Park, Central Sulawesi - Indonesia. Göttingen: Cuvillier Verlag Göttingen.
Mappatoba, M., and R. Birner. 2004. Co-Management of Protected Areas - The Case of Community Agreements on Conservation in the Lore Lindu National Park, Central Sulawesi, Indonesia. Eschborn. Gesellschaft für Technische Zusammenarbeit.
Marland, G., T. Boden, and R. J. Andres. 2007. Global, Regional, and National CO2 Emissions. In Trends: A Compendium of Data on Global Change, edited by O. R. N. L. Carbon Dioxide Information Center, U.S. Department of Energy. Oak Ridge, Tenn., U.S.A.
Matthews, R. C. O. 1986. The economics of institutions and the sources of growth. Economic Journal 96 (384):903-918.
Mayring, P. 2002. Einführung in die qualitative Sozialforschung. 5th Edition 2002 ed. Weinheim und Basel: Beltz Verlag.
Mayring, P. 2007. Qualitative Inhaltsanalyse: Grundlagen und Techniken. 9. Aufl., Dr. nach Typoskript ed, UTB für Wissenschaft ; 8229 Pädagogik. Weinheim u.a.: Beltz.
McCarl, B. A., and P. Nuthall. 1982. Linear-Programming for Repeated Use in the Analysis of Agricultural Systems. Agricultural Systems 8 (1):17-39.
McKean, M. 2000. Common property: What is it, what is it good for, what makes it work? In People and Forests: Communities, Institutions and Governance, edited by C. C. Gibson, M. A. McKean and E. Ostrom. Cambridge, USA: The MIT Press.
Meade, J. 1952. External Economies and Diseconomies in a Competitive Situation. Economic Journal 62 (245):54-67.
Merton, R. K., and P. L. Kendall. 1946. The focused interview. American Journal of Sociology 51:541-557.
Michaelowa, A., and F. Jotzo. 2005. Transaction costs, institutional rigidities and the size of the clean development mechanism. Energy Policy 33 (4):511-523.
Miles, M. B., and A. M. Huberman. 2004. Qualitative data analysis: an expanded sourcebook. 2nd Edition ed. Thousand Oaks, California: SAGE.
Moura Costa, P., and C. Wilson. 2000. An equivalence factor between CO2 avoided emissions and sequestration – description and applications in forestry. Mitigation and Adaptation Strategies for Global Change 5 (1):51-60.
Mudhara, M., and P. E. Hildebrand. 2004. Assessment of constraints to the adoption of improved fallows in Zimbabwe using linear programming models. In Valuing Agroforestry Systems, Methods and Applications, edited by J. R. R. Alavalapati and D. E. Mercer. Dordrecht: Kluwer Academic Publishers.
Munasinghe, M., and A. Schwab. 1993. Environmental economics and natural resource management in developing countries. Washington, D.C.: World Bank.
Murdiyarso, D. 2005. Sustaining Local Livelihoods through Carbon Sequestration Activities: A search for practical and strategic approach. Paper read at Carbon Sequestration and Sustainable Livelihoods, at Bogor, Indonesia.
Murdiyarso, D., M. van Noordwijk, A. Puntodewo, A. Widayati, and B. Lusiana. 2008. District-scale prioritization for A/R CDM project activities in Indonesia in line with sustainable development objectives. Agriculture Ecosystems & Environment 126 (1-2):59-66.
Chapter 9 151
Nasi, R., S. Wunder, and J. J. Campos A. 2002. Forest Ecosystem Services: Can They Pay the Way out of Deforestation? Costa Rica. GEF. Discussion Paper
Neff, T., L. Eichler, I. Deecke, and J. Fehse. 2007. Update on Markets for Forestry Offsets. Turrialba, Costa Rica. CATIE.
Neilson, J. 2007. Global markets, farmers and the state: sustaining profits in the Indonesian cocoa sector. Bulletin of Indonesian Economic Studies 43 (2):227-250.
Nicklas, U. G. 2006. Nährstoffeintrag durch Bestandsniederschlag und Streufall in Kakao-Agroforstsystemen in Zentral-Sulawesi, Indonesien. Diplomarbeit, Institut für Landschaftsökologie, Westfälische Wilhelms-Universität Münster, Münster.
Niessen, M. 1977. Gruppendiskussion: interpretative Methodologie, Methodenbegründung, Anwendung. München: Fink.
Nilsson, S., and W. Schopfhauser. 1995. The Carbon-Sequestration Potential of a Global Afforestation Program. Climatic Change 30 (3):267-293.
Noor, Y. R., J. Heyde, and I. N. Suryadiputra. 2005. Community-based Approach to Peatland Adaption and Management in Central Kalimantan, Jambi and South Sumatra, Indonesia. In Carbon Forestry: Who will benefit?, edited by D. Murdiyarso and H. Herawati. Bogor, Indonesia: CIFOR.
North, D. 1990. Institutions, Institutional Change and Economic Performance. New York: Cambridge University Press.
NSW GGAS. 2008. Scheme Introduction. http://www.greenhousegas.nsw.gov.au/overview/scheme_overview/overview.asp
Nuryartono, N. 2005. Impact of Smallholders' Access to Land and Credit Markets on Technology Adoption and Land Use Decisions: The Case of Tropical Forest Margins in Central Sulawesi - Indonesia. Göttingen: Cuvillier Verlag
OECD Social Policy Division. 2006. What are equivalence scales? OECD. http://www.oecd.org/dataoecd/61/52/35411111.pdf.
Olschewski, R., and P. C. Benitez. 2005. Secondary forests as temporary carbon sinks? The economic impact of accounting methods on reforestation projects in the tropics. Ecological Economics 55 (3):380-394.
Ortiz Guerrero, A. M., and L. D. Riascos Chalapud. 2006. Almacenamiento y fijación de carbono del sistema agroforestal cacao Theobroma cacao L. y laurel Cordia alliodora (Ruiz & Pavón) Oken en la reserva indígena de Talamanca, Costa Rica. Tesis de grado - Ingeniero Agroforestal, Facultad de Ciencias Agrícolas, Universidad de Narino, San Juan de Pasto.
Ostrom, E. 1990. Governing the Commons: The evolution of Institutions for Collective Action. Cambridge, UK: Cambridge University Press.
Pagiola, S., A. Arcenas, and G. Platais. 2005. Can payments for environmental services help reduce poverty? An exploration of the issues and the evidence to date. World Development 33 (2):237-253.
Pagiola, S., J. Bishop, and N. E. Landell-Mills. 2002. Selling forest environmental services market-based mechanisms for conservation ad development. London: Earthscan Publications Ltd.
Palmer, C. 2005. The Nature of Corruption in Forest Management. World Economics 6 (2):1-10.
152
Palmer, C. 2007. Background paper: Community forest use and conservation agreements in Lore Lindu, Indonesia. Zürich. ETH.
Paris, Q. 1991. An economic interpretation of linear programming. 1st ed. Ames: Iowa State University Press.
Pearce, D. W., A. Markandya, and E. Barbier. 1989. Blueprint for a green economy. London: Earthscan.
Pearce, D. W., and R. K. Turner. 1990. Economics of natural resources and the environment. Hemel Hempstead: Harvester Wheatsheaf.
Perfecto, I., R. A. Rice, R. Greenberg, and M. E. VanderVoort. 1996. Shade coffee: A disappearing refuge for biodiversity. Bioscience 46 (8):598-608.
Pfaff, A., S. Kerr, L. Lipper, R. Cavatassi, B. Davis, J. Hendy, and G. A. Sanchez-Azofeifa. 2007. Will buying tropical forest carbon benefit the poor? Evidence from Costa Rica. Land Use Policy 24 (3):600-610.
Pigou, A. C. 1950. The Economics of Welfare. 4th Edition ed. London: Macmillan.
Point Carbon. 2008. Carbon 2008- Post-2012 is now.
Prior, S., C. Streck, and R. O'Sullivan. 2006. Incentivising avoided deforestation - a stock based methodology. Centre for International Sustainable Development Law.
Reetz. S. 2008. Data from A4 village survey 2007.
Rohwer, N.-K. 2006. Object Oriented Image Analysis of High Resolution Satellite Imagery: A Land Cover Change Analysis in the Palolo Valley, Central Sulawesi, Indonesia, Based on QuickBird and IKONOS Satellite Data. Diplomarbeit, Geographisches Institut, University of Göttingen, Göttingen.
Roth, T. P. 1999. Ethics, economics, and freedom : the failure of consequentialist social welfare theory. Aldershot ; Brookfield USA: Ashgate.
Santilli, M., P. Moutinho, S. Schwartzmann, D. Nepstad, L. Curran, and C. Nobre. 2005. Tropical Deforestation and the Kyoto Protocol. Climatic Change 71:267-276.
Santos, N. E., and S. Bauer. 2006. Evaluation of Different Forestry Options to Improve Carbon Content in Rural Communities in Marajo Island, Brazil. Paper read at Tropentag 2006, at Bonn.
Sauermost, M., and M. Wiekert. 2008. CDM-Markt Kompakt - Indonesien. Köln. Bundesagentur für Außenwirtschaft, Deutsche Investitions- und Entwicklungsgesellschaft.
Schmitz, N. 2006. Biokraftstoffe, eine vergleichende Analyse. Gülzow. Fachagentur Nachwachsender Rohstoffe e.V.
Schreinemachers, P., and T. Berger. 2006. Land use decisions in developing countries and their representation in multi-agent systems. Journal of Land Use Science 1 (1):29-44.
Schulze, C. H., M. Waltert, P. J. A. Kessler, R. Pitopang, Shahabuddin, D. Veddeler, M. Muhlenberg, S. R. Gradstein, C. Leuschner, I. Steffan-Dewenter, and T. Tscharntke. 2004. Biodiversity indicator groups of tropical land-use systems: Comparing plants, birds, and insects. Ecological Applications 14 (5):1321-1333.
Schwarze, S. 2004. Determinants of Income Generating Activities of Rural Households - A Quantitative Study in the Vicinity of the Lore-Lindu National Park in Central Sulawesi/Indonesia. PhD Dissertation, Agricultural Faculty, University of Göttingen, Göttingen.

Chapter 9 153
Schwarze, S., M. Zeller, and N. Nuryartono. 2006. Income sources, poverty, and forest encroachment: Implications for rural development policies in Central Sulawesi, Indonesia. In 26th Conference of the International Association of Agricultural Economists (IAAE) “Contributions of Agricultural Economics to Critical Policy Issues”. Queensland, Australia.
Siebert, S. F. 2002. From shade- to sun-grown perennial crops in Sulawesi, Indonesia: implications for biodiversity conservation and soil fertility. Biodiversity and Conservation 11 (11):1889-1902.
Sitorius, F. 2002. Land, Ethnicity and the Competing Power Agrarian Dynamics in Forest Margin Communities in Central Celebes, Indonesia. Göttingen. STORMA. Discussion Paper Series 5. http://ufgb989.uni-forst.gwdg.de/DPS/index.htm.
Smiley, G. L. 2006. Biophysical resource use and productivity in cocoa-gliricidia agroforests of Central Sulawesi. Edited by J. Kroschel, Tropical Agriculture: Advances in crop research; Vol.9. Weikersheim: Margraf Publishers.
Smith, J., and S. J. Scherr. 2002. Forest Carbon and Local Livelihoods: Assessment of Opportunities and Policy Recommendations. CIFOR. CIFOR Occasional Paper No. 37
Smith, J., and S. J. Scherr. 2003. Capturing the Value of Forest Carbon for Local Livelihoods. World Development Vol. 31 (No. 12):pp. 2143–2160.
Smith, R. J., R. D. J. Muir, M. J. Walpole, A. Balmford, and N. Leader-Williams. 2003. Governance and the loss of biodiversity. Nature 426 (6962):67-70.
Soares-Filho, B. S., D. C. Nepstad;, L. M. Curran;, G. C. Cerqueira;, R. A. Garcia;, C. A. Ramos;, E. Voll;, A. McDonald;, P. Lefebvre;, and P. Schlesinger. 2006. Modelling conservation in the Amazon basin. Nature 440 (7083):520-523.
Steenblick, R. 2007. Biofuels - at what cost? Government support for ethanol and biodiesel in selected OECD countries. Geneva, Switzerland. The Global Subsidies Initiative (GSI) of the International Institute for Sustainable Development (IISD).
Steffan-Dewenter, I., M. Kessler, J. Barkmann, M. M. Bos, D. Buchori, S. Erasmi, H. Faust, G. Gerold, K. Glenk, S. R. Gradstein, E. Guhardja, M. Harteveld, D. Herteld, P. Höhn, M. Kappas, S. Kohler, C. Leuschner, M. Maertens, R. Marggraf, S. Migge-Kleian, J. Mogea, R. Pitopang, M. Schaefer, S. Schwarze, S. G. Sporn, A. Steingrebe, S. S. Tjitrosoedirdjo, S. Tjitrosoemito, A. Twele, R. Weber, L. Woltmann, M. Zeller, and T. Tscharntke. 2007. Tradeoffs between income, biodiversity, and ecosystem functioning during tropical rainforest conversion and agroforestry intensification. Proceedings of the National Academy of Sciences of the United States of America 104 (12):4973-4978.
Sterman, J. D. 1991. A Skeptic’s Guide to Computer Models. In Managing a Nation: The Microcomputer Software Catalog, edited by G. O. e. a. Barney: Boulder, CO: Westview Press.
Stern, N. H. 2006. The economics of climate change : Stern review on the economics of climate change. England: HM Treasury.
STORMA. 2003. Ergebnisbericht 2000/2-2003/1, Sonderforschungsbereich 552 der DFG: Georg-August-Universität Göttingen.
Subak, S. 2003. Replacing carbon lost from forests: an assessment of insurance, reserves, and expiring credits. Climate Policy 3 (2):107-122.
154
Taher, S. 1996. Factors influencing smallholder cocoa production: a management analysis of behavioural decision-making processes of technology adoption and application. Dissertation, Wageningen University, Wageningen.
Teufel, N. 2005. Smallholder milk production in the Punjab of Pakistan and the evaluation of potential interventions. Dissertation, Faculty of Agricultural Sciences, University of Hohenheim, Hohenheim.
Thompson, G., J. Frances, R. Levavic, and J. Mitchell. 1991. Markets, hierarchies, and networks : the coordination of social life. London ; Newbury Park: Sage Publications.
Titscher, S., M. Meyer, R. Wodak, and E. Vetter. 2000. Methods of text and discourse analysis. London ; Thousand Oaks [Calif.]: SAGE.
Transparency International. 2007. TI Corruption Perceptions Index.
Tschakert, P. 2007. Environmental services and poverty reduction: Options for smallholders in the Sahel. Agricultural Systems 94 (1):75-86.
UNEP Risoe. 2008. The CDM/JI Pipeline Analysis and Database.
UNFCCC. 1997. Decision 2/CP.3. Methodological Issues Related to the Kyoto Protocol. http://unfccc.int/resource/docs/cop3/07a01.pdf#page=31.
UNFCCC. 2001. The Marrakesh Accords and the Marrakesh Declaration. Advanced unedited version
UNFCCC. 2003. Modalities and procedures for afforestation and reforestation project activities under the clean development mechanism in the first commitment period of the Kyoto Protocol, Decision 19/CP9 http://unfccc.int/resource/docs/cop9/06a02.pdf.
UNFCCC. 2005. Simplified baseline and monitoring methodologies for selected A/R small-scale CDM project activity categories Sixth Meeting Report, Annex 2
UNFCCC. 2008. Clean Development Mechanism (CDM). http://unfccc.int/kyoto_protocol/mechanisms/clean_development_mechanism/items/2718.php
UNFCCC. 2008. Kyoto Protocol Status of Ratification. http://unfccc.int/kyoto_protocol/status_of_ratification/items/2613.php
Upton, M., and J. M. Dixon. 1994. Methods of micro-level analysis for agricultural programmes and policies : a guideline for policy analysts, FAO farm systems management series ; 9. Rome: Food and Agriculture Organization of the United Nations.
van Asselt, M. B. A., and N. Rijkens-Klomp. 2002. A look on the mirror: reflection on participation in Integrated Assessment from a methodological perspective. Global Environmental Change 12:167-184.
van Edig, X. 2005. Measurement of Absolute Poverty and Indicators of Poverty Among Rural Households in Central Sulawesi, Indonesia. Diplomarbeit, Department of Geography, University of Göttingen, Göttingen.
van Noordwijk, M., D. A. Suyamto, B. Lusiana, A. Ekadinata, and K. Hairiah. 2008. Facilitating agroforestation of landscapes for sustainable benefits: Tradeoffs between carbon stocks and local development benefits in Indonesia according to the FALLOW model. Agriculture Ecosystems & Environment 126 (1-2):98-112.
Vedeld, P., A. Angelsen, E. Sjaastad, and G. Kobugabe Berg. 2004. Counting on the environment: Forest incomes and the rural poor. Washington D.C. The World Bank. Environmental Economics Series Paper No. 98.
Chapter 9 155
Vosti, S. A., J. Witcover, and C. L. Carpentier. 2002. Agricultural Intensification by Smallholders in the Western Brazilian Amazon. Washington D.C., USA. IFPRI. Research Report 130.
Waltert, M., M. Langkau, M. Maertens, S. Härtel, S. Erasmi, and M. Mühlenberg. 2003. Predicting the Loss of Bird Species from Deforestation in Central Sulawesi. In Land Use, Nature Conservation and the Stability of Rainforest Margins in Southeast Asia, edited by G. Gerold, M. Fremerey and E. Guhardja. Berlin: Springer.
Weber, R. 2005. Kulturlandschaftswandel während des 20. Jh. in Zentralsulawesi - eine historisch-geographische Analyse der Lore-Lindu-Bergregenwaldregion. PhD thesis, Department of Geography, University of Göttingen.
Weber, R., H. Faust, B. Schippers, S. Mamar, E. Soetarto, and W. Kreisel. 2007. Migration and ethnicity as cultural impact factors on land use change in the rainforest margins of Central Sulawesi, Indonesia. In The stability of tropical rainforest margins, linking ecological, economic and social constraints of land use and conservation, edited by T. Tscharnke, C. Leuschner, M. Zeller, E. Guhardja and A. Bidin. Berlin, Germany: Springer Verlag.
Williamson, O. E. 1985. The economic institutions of capitalism. New York: The Free Press.
Wittenberg, R. 2007. Einführung in die sozialwissenschaftlichen Methoden und ihre Anwendung in empirischen Untersuchungen I – Skript. Nürnberg. Friedrich-Alexander-Universität Erlangen, Wirtschafts- und Sozialwissenschaftliche Fakultät. Reader
World Bank. 2003. World Development Report 2003. Sustainable development in a dynamic world: transforming institutions, growth, and quality of life. Washington, DC and New York, USA, Oxford University Press. World Bank.
World Bank. 2004. Sustaining Forests: A Development Strategy. Washington D.C. World Bank.
World Bank. 2007. Indonesia and Climate Change: Current Status and Policies. Jakarta, Indonesia. World Bank, DFID, PEACE.
Wunder, S. 2005. Payments for environmental services: Some nuts and bolts. CIFOR. Occasional Paper 42.
Wunder, S. 2008. Payments for environmental services and the poor: concepts and preliminary evidence. Environment and Development Economics 13 (03):279-297.
Young, O. R., A. Agrawal, L. A. King, P. H. Sand, A. Underdal, and M. Wasson. 1999. Institutional Dimensions of Global Environmental Change - Science Plan. Bonn, Germany. International Human Dimensions Programme on Global Environmental Change. IHDP Report No. 9.
Zbinden, S., and D. R. Lee. 2005. Paying for environmental services: An analysis of participation in Costa Rica's PSA program. World Development 33 (2):255-272.
Zeller, M., S. Schwarze, and T. v. Rheenen. 2002. Statistical Sampling Frame and Methods Used for the Selection of Villages and Households in the Scope of the Research Program on Stability of Rainforest Margins in Indonesia (STORMA). Göttingen. STORMA. Discussion Paper Series No. 1. http://ufgb989.uni-forst.gwdg.de/DPS/index.htm.
Zeller, M., M. Sharma, C. Henry, and C. Lapenu. 2006. An operational method for assessing the poverty Outreach performance of development policies and projects: Results of case studies in Africa, Asia, and Latin America. World Development 34 (3):446-464.
Zilberman, D., L. Lipper, and N. McCarthy. 2008. When could payments for environmental services benefit the poor? Environment and Development Economics 13 (03):255-278.

156
Zuidema, P. A., P. A. Leffelaar, W. Gerritsma, L. Mommer, and N. P. R. Anten. 2005. A physiological production model for cocoa (Theobroma cacao): model presentation, validation and application. Agricultural Systems 84 (2):195-225.
Appendix 157
APPENDIX
Appendix I: Survey Questionnaire ................................................................................. 158
Appendix II: Pictures taken during Interviews ................................................................ 185
Appendix III: Graphical Presentation of the Four Agroforestry Systems......................... 186
Appendix IV: Outline of Structure for Focus Group Meetings......................................... 188
Appendix V: Pictures taken during Focus Groups........................................................... 189
Appendix VI: Monthly Labour Requirements per Household Class and Activity ........... 190
Appendix VII: Linear Programming Models ..................................................................... 191
Appendix VIII: Overview of Ratings of all Topics in Focus Groups.................................. 200

158 Appendix
Appendix I: Survey Questionnaire
159
STORMA – Stability of Rainforest Margins University of Goettingen and Kassel, IPB/Bogor – UNTAD/Palu
Household Survey Questionnaire
2006 We are researchers from a research collaboration between Indonesia and Germany, working together with 4 universities: Universitas Tadulako and Institut Pertanian Bogor (Indonesia) and University of Goettingen and Kassel (Germany). The project is called STORMA. We have already visited your households a few times during the last five years. This time we are conducting a strudy about the contribution of the forest system to your agricultural production. We also want to talk about the relationship you have with the forest and the Lore Lindu region. Your response is very helpful to derive a good and useful result for this research, and your answers are kept anonymous. STORMA is an interdisciplinary research project collecting and exchanging data. The data collected by the researchers can later be used by decision makers for a better assessment of the situation of the Lore Lindu region. STORMA is NOT a NGO or a regional development programme. That means, STORMA is not providing (material) help or development funding at present or in the future. STORMA and its members are NOT part of the government or from non-governmental institutions! After STORMA there may also no other donor coming in and paying for projects in your village. If you agree to participate in this study you will be asked to answer the survey questions asked by the interviewer. The interview will take about 2 hours. We respect the answers you give and want to remind you, that there are no right or wrong answers. We hope you will give answers that comply with your knowledge and opinion. If you have any question regarding this research, please address them to the interviewer.

Household ID Nr. ________
160
Interviewer Name: _____________________________ Date of interviews (dd/mm/yy): _____/_____/_______ Supervisor Name: ____________________________ Date questionnaire checked by supervisor (dd/mm/yy): _____/_____/_______ Signature supervisor: ____________________________ 000. Household Identification Use the Household ID from previous surveys and put the ID nr. on top of every page. First ask about general household characteristics 001 Household ID:
___________ 002. Desa: 003. Dusun / RT: ______/______
004. Kecamatan (circle): 1. Sigi Biromaru 2. Palolo 3. Kulawi 4. Kulawi Selatan 5. Lore Utara
005. Name of Respondent: _____________________________________________________________
006. Status of respondent: 1. HH head 2. Spouse 3. other (specify)
007. Respondents sex: 1. Male 2. Female
008. If respondent is not HH head: Name of HH Head? ______________________________

Household ID Nr. ________
161
010. Environmental and social issues
011. With which one of these statements about the natural environment and the economic well-being do you most agree? (read and circle answer) a) Protecting the natural environment should be given priority, even at the risk of slowing down economic growth. b) Economic growth should be given priority, even if the natural environment suffers to some extent. 012. How serious do you rate the following social problems in your village at the moment? (read problems) Social problem Not at all
serious Slightly serious
Somewhat serious
Serious Very serious
Don’t know
a) Not enough food b) Crime (e.g. stealing crops from neighbour) c) Bad health facilities d) Religious conflict e) Bad education f) Bad housing conditions g) Ethnic problems
0= None 3=water pollution 6= More pest/diseases 9= other (specify) 1=excessive drought 4= deforestation 7= land sliding
013. Which environmental problem have you noticed that has become stronger during the last 5 years in your village and its surroundings? (do not read, circle, multiple answers possible) 2= soil degradation 5=flooding 8= erosion
014. How serious do you rate the following environmental problems in your village at the moment? (read problems) Environmental problem Not at all
serious Slightly serious
Somewhat serious
Serious Very serious
Don’t know
a) Loss of forest b) Excessive drought c) Less rattan d) Soil degradation /poor soils e) Flooding f) Loss of endemic animals g) Water degradation

Household ID Nr. ________
162
015. Have these problems had an impact on you and your family? (circle)
1= Yes 0= No (If no, skip to 017)
1= harvest failure 4= reduced water supply for household use
7= less fire wood 016. If yes, which impact have you noticed? (Do not read, circle, multiple answers possible)
2= reduced agricultural output 5= less forest animals 8= flooded rice fields 3=reduced water supply for irrigation 6= increase in time for
wood collection 9= other (specify) ________________
0= None 6= anoa 12= bamboo 1= rattan 7= bird 13= leafs 2= dammar (resin) 8= other animal 14= palm sugar
017. Which products do you get from the Forest for personal use /consumption? (do not read, circle, multiple answers possible)
3= fire wood 9= fruit 15= other plants 4= wood 10= vegetables 16= other (specify)
5= wild pig 11= roots ______________ 0= None 4= climate control 7=religious /cultural 1= water supply 5=landscape scenery values 2= biodiversity 6= traditional function 8= medicine
018. Which other functions has the forest for you? (do not read, circle, multiple answers possible)
3= soil control (specify)____________ 9=other (specify)___ 019. Which type of forest is located closest to your house, this does not necessarily have to be located in your village? (circle)
1= Don’t know 2=TNLL 3= Hutan Lindung 4= Productive Forest
5 = Other (Specify)
020. In your opinion, what is the condition of the forest in the TNLL? (circle)
1= Very good 2= Good 3= Ok
4= Less well 5= Not good
0= Don’t know
021. In your opinion how has the forest area in the TNLL, changed in the last 10 years? ( If 1, 2, or 0, skip to 023)
1= increased 2= remained the same 3= decreased 0= don’t know
1= more cacao plantations 3= political pressure 5=land claim 7= other (specify) 022. In your opinion, if the forest area has decreased, what is/are the reasons for this? (do not read, circle, multiple answers possible)
2= more people in the village
4= land scarcity 6= economic pressure _____________
1= 3= 5= 7= 023. Which community organisations are dealing with natural resource management in your village? 2= 4= 6= 8= 024. What are their duties? 1= 3= 5= 7=
2= 4= 6= 8=

Household ID Nr. ________
163
1= Extremely well 2= Very well
3= Well 4= Moderately well 5= Not at all
0= Don’t know
1 2 3 4 5
025. In your opinion, how does the institution comply with their duties?
6 026. Does the KKM exist in your village? 1= yes 0=no 3= Don’t know (if no, skip to 028)
027. In your opinion, has the Community Conservation agreement in your village had an impact on the forest area in the TNLL? (circle)
1=increase in loss of forest area
2= forest area remained the same
3=more forest 0= don’t know
0= don’t know 3= Education 6= Health service 1= Infrastructure 4= Roads 7= Forest management
028. If there would be a development project in your village; in your opinion, which focus should this have? (do not read, circle, multiple answers possible) 2= Agricultural development 5= Water management 8= Other (please specify)__________
0= don’t know 2= Forest management 4= other (specify) 029. If there would be an environmental project; in your opinion, which focus should this have? (do not read, circle, multiple answers possible)
1= Water management 3= Land management ______________
030. In your opinion, if there would be an environmental project for your village which aims at stopping the loss of forest, which enforcement measure for penalties or incentive to protect trees will work make the villagers comply and help to save the forest in the TNLL? ______________________________________________________________________________________________ 031. How well do you think the following enforcement and incentive measures work to stop villagers cutting trees in the TNLL? (read each point and tick category) 1= Extremely well 2= Very well 3= Well 4= Moderately well 5= Not at all 0= Don’t know a) Individual cash payment of penalty b) Individual payment of penalty with a good (buffalo, rice, etc.) c) village cash payment of penalty d) Village penalty payment with goods (buffalo, rice, etc.) e) physical punishment f) compensating villagers with a payment to stop cutting trees g) compensating villagers with seeds and trees ( Cacao, Jati and Kemiri’s tree) to stop cutting trees

Household ID Nr. ________
164
040. Household labour composition 041. How many people live in your household? ____________ Persons Note: Members of the household are all people who eat from the same pot and sleep under the same roof. Include also members, who are absent for less than two months. 042. How many household members (including you) work on the farm regularly? _____ Persons 043. Who works on the farm regularly? (Start with HH head, carry on with spouse, then children, then other HH members)
How often this person works on the farm ( on average)
How often this person works as a
wage labourer on the farm or any other
labour (on average)
How often this person works any other labour (on
average)
How often this person works at
the forest in collecting rattan
or wood
Member ID No.
Relation with Head
( Code 1)
Name Sex 1=Male
2=Female
Age in years
Hours per day?
Days per week?
Months per
year?
Days per week?
Months per year?
Days per
week?
Months per year
Days per
week
Month per year
1 HH head 2 3 4 5 6 7 8 9
10 Code 1 4= Father or mother 7= Mother-, father-, son- or daughter-in-law 1= Spouse 5= Grandchild 8= Other relative 2= Son or daughter 6= Grandparents 9= Other non-relative 3= Step son/daughter

Household ID Nr. ________
165
050. Land owned/rented 051. Please draw the map of your house and plots (Prepare a sheet of paper) Number of plots
052. How many plots do your family own? 053. How many of these plots are rented out? 054. How many plots has your family rented in? 055. How many plots has your family borrowed? 056. How many plots has your family lent from someone else? 057. How many plots does your family have with the shared harvest (bagil hasil) system? Do you own this plot? 1= yes, 0= no
058. How many plots does your family have with the tangala system? Do you own this plot? 1= yes, 0= no 059. How many plots are you using for agriculture now (excluding lahan pekarangan)? 060. Changes in possession of land use Before the survey, fill out the plot ID number and plot size from last survey. Please ask for the information for the already registered plots. If the plots have been merged or split and the size has changed, give the plot a new number.
Plot ID number
Plot type Plot size
are
Do you still own the plot?
1= yes, 0= no
Who cultivates the plot?
1=himself 2= another
person
Is the area still the same
1= yes, 0= no
If plot size has changed,
state new size
(Are)
Distance to plot from homestead
on foot Minutes meter
How far is that plot from the forest? Code 1
Is the plot still used for the
same crop as in last survey?
1= yes, 0= no
For what do you use the
plot? Code 2
1 Homegarden
Code 1 Code 2 1= Inside TNLL 2=In the forest 1=Lahan pekarangan 6=Ladang (upland plot) 11= Pasture 3=Directly bordering the forest 2=Sawah with simple irrigation 7=Garden in the forest (pagalan) 12= Fallow land 4=Less than 50m 3=Sawah with semi-technical irrigation 8= Uncultivated land 13= Abandoned/unused land 5=Less than 100m 4=Sawah with technical irrigation 9=Primary forest 14= Other (please specify): 6=Less than 500m 5=Plot in the plains 10= Secondary forest _______________________ 7=Less than 1km _______________________ 8=More than 1km

Household ID Nr. ________
166
061. Have you any other plot that did not mention on table 060 (circle) 1= yes 0= no If no, skip to 070
062. If you own any newly acquired plots, please give further information: Continue with numbering of plots from Table 060.
Plot ID number
Description of plot
Type of plot
Code 1
Plot size
are
Distance to plot from homestead
on foot minutes meter
How far is the
plot from the
forest?
Code 2
How was it acquired?
Code 3
Code 1 Code 2 Code 3 1=Lahan pekarangan 1= Inside TNLL 1= Bought 2=Sawah with simple irrigation 2=In the forest 2=Gift 3=Sawah with semi-technical irrigation 3=Directly bordering the forest 3=Through marriage 4=Sawah with technical irrigation 4=Less than 50m 4=Heritage 5=Tegalan (dry fields in the valley) 5=Less than 100m 5=Received from government 6=Ladang (upland dry fields) 6=Less than 500m 6=Cleared primary forest 7=Garden in the forest (pagalan) 7=Less than 1km 7=Share harvest (bagi hasil) 8=Non-agricultural land 8=More than 1km 8= Leased against fixed payment 9=Primary forest 9= Borrowed for cultivation 10= Secondary forest 10= Share land (bagi tanah) 11= Pasture 11=Taken as loan from defaulting borrowers 12= Fallow land 12= Other (please specify) 13= Abandoned/unused land 14= Other (please specify):
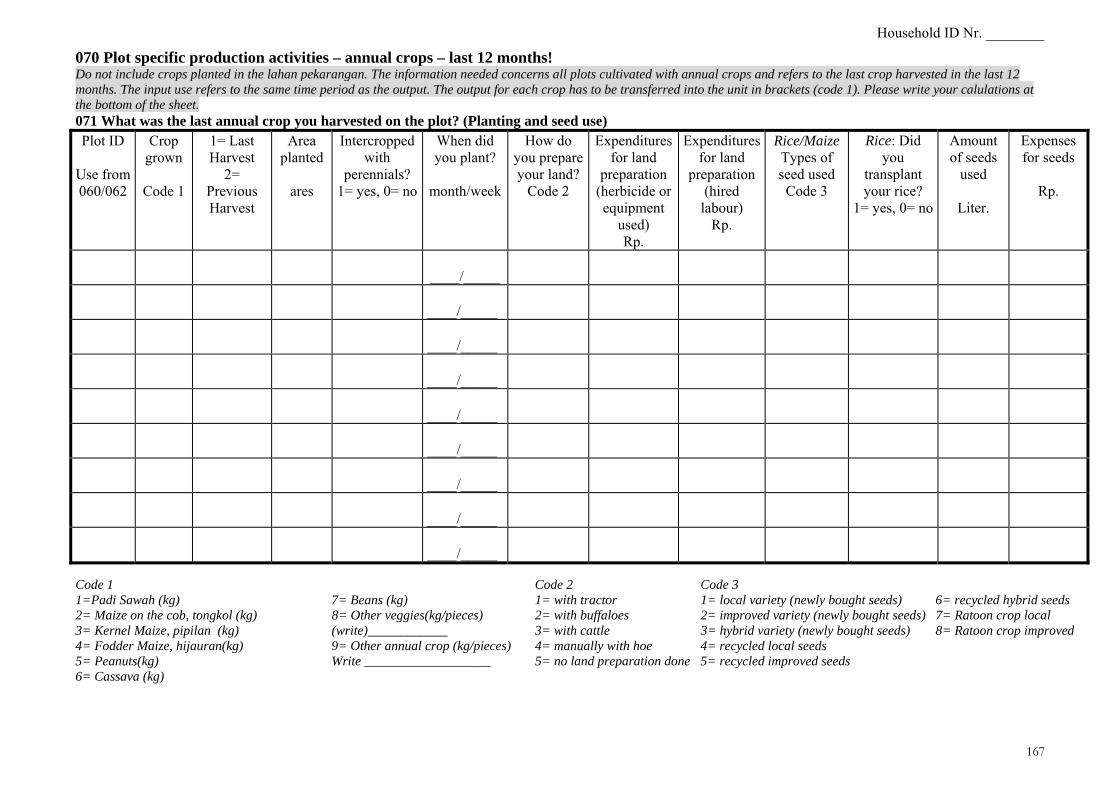
Household ID Nr. ________
167
070 Plot specific production activities – annual crops – last 12 months! Do not include crops planted in the lahan pekarangan. The information needed concerns all plots cultivated with annual crops and refers to the last crop harvested in the last 12 months. The input use refers to the same time period as the output. The output for each crop has to be transferred into the unit in brackets (code 1). Please write your calulations at the bottom of the sheet. 071 What was the last annual crop you harvested on the plot? (Planting and seed use) Plot ID
Use from 060/062
Crop grown
Code 1
1= Last Harvest
2= Previous Harvest
Area planted
ares
Intercropped with
perennials? 1= yes, 0= no
When did you plant?
month/week
How do you prepare your land?
Code 2
Expenditures for land
preparation (herbicide or equipment
used) Rp.
Expenditures for land
preparation (hired
labour) Rp.
Rice/Maize Types of seed used Code 3
Rice: Did you
transplant your rice?
1= yes, 0= no
Amount of seeds
used
Liter.
Expenses for seeds
Rp.
____/_____
____/_____
____/_____
____/_____
____/_____
____/_____
____/_____
____/_____
____/_____
Code 1 Code 2 Code 3 1=Padi Sawah (kg) 7= Beans (kg) 1= with tractor 1= local variety (newly bought seeds) 6= recycled hybrid seeds 2= Maize on the cob, tongkol (kg) 8= Other veggies(kg/pieces) 2= with buffaloes 2= improved variety (newly bought seeds) 7= Ratoon crop local 3= Kernel Maize, pipilan (kg) (write)____________ 3= with cattle 3= hybrid variety (newly bought seeds) 8= Ratoon crop improved 4= Fodder Maize, hijauran(kg) 9= Other annual crop (kg/pieces) 4= manually with hoe 4= recycled local seeds 5= Peanuts(kg) Write ___________________ 5= no land preparation done 5= recycled improved seeds 6= Cassava (kg)
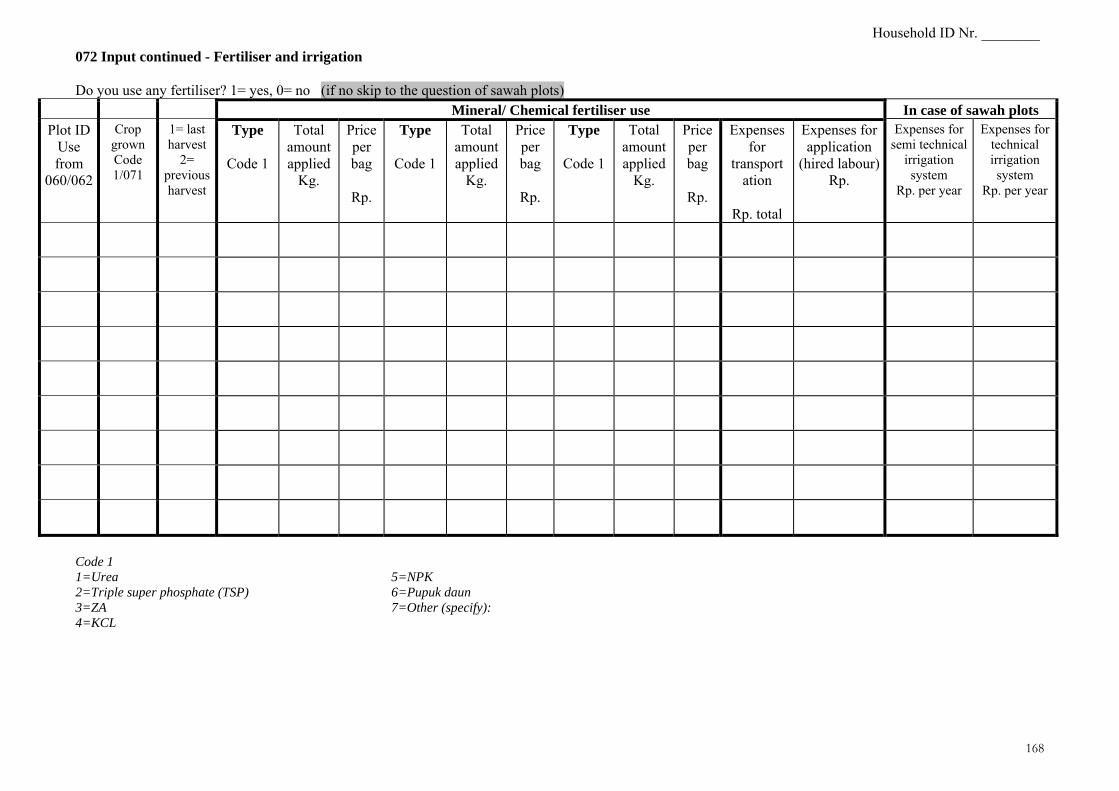
Household ID Nr. ________
168
072 Input continued - Fertiliser and irrigation Do you use any fertiliser? 1= yes, 0= no (if no skip to the question of sawah plots)
Mineral/ Chemical fertiliser use In case of sawah plots Plot ID
Use from
060/062
Crop grown Code 1/071
1= last harvest
2= previous harvest
Type
Code 1
Total amount applied
Kg.
Price per bag
Rp.
Type
Code 1
Total amount applied
Kg.
Price per bag
Rp.
Type
Code 1
Total amount applied
Kg.
Price per bag
Rp.
Expenses for
transport ation
Rp. total
Expenses for application
(hired labour)Rp.
Expenses for semi technical
irrigation system
Rp. per year
Expenses for technical irrigation system
Rp. per year
Code 1 1=Urea 5=NPK 2=Triple super phosphate (TSP) 6=Pupuk daun 3=ZA 7=Other (specify): 4=KCL

Household ID Nr. ________
169
073 Input continued - Weed control and pesticides
In case herbicides were applied In case pesticides were applied Plot ID
Use from
060/062
Crop grown
Code 1/071
1= Last harvest
2= Previous harvest
Was growth of
weeds controlled?
1=yes, 0=
no
Method of weed control
Code 1
Total amount applied?
litres
Price paid per
litres
Rp.
Total expenses for hiring equipment
Rp.
Total expenses for hiring labour for
weed control
Rp.
Were pesticides
used?
1=yes, 0=no
Used against what?
Code 2
Amount applied
litres
Price paid per litre
Rp.
Expenses for hiring labour for application
Rp.
Expenses for hiring
application equipment
Rp.
Code 1 Code 2 1=Herbicides 1=Insect caterpillar 4=Walang sangit 2=Manual weeding 2=Insect wereng 5=Lychen /cendawan 3= Water management 3=Insect penggerek(cut) 6=Other (specify):
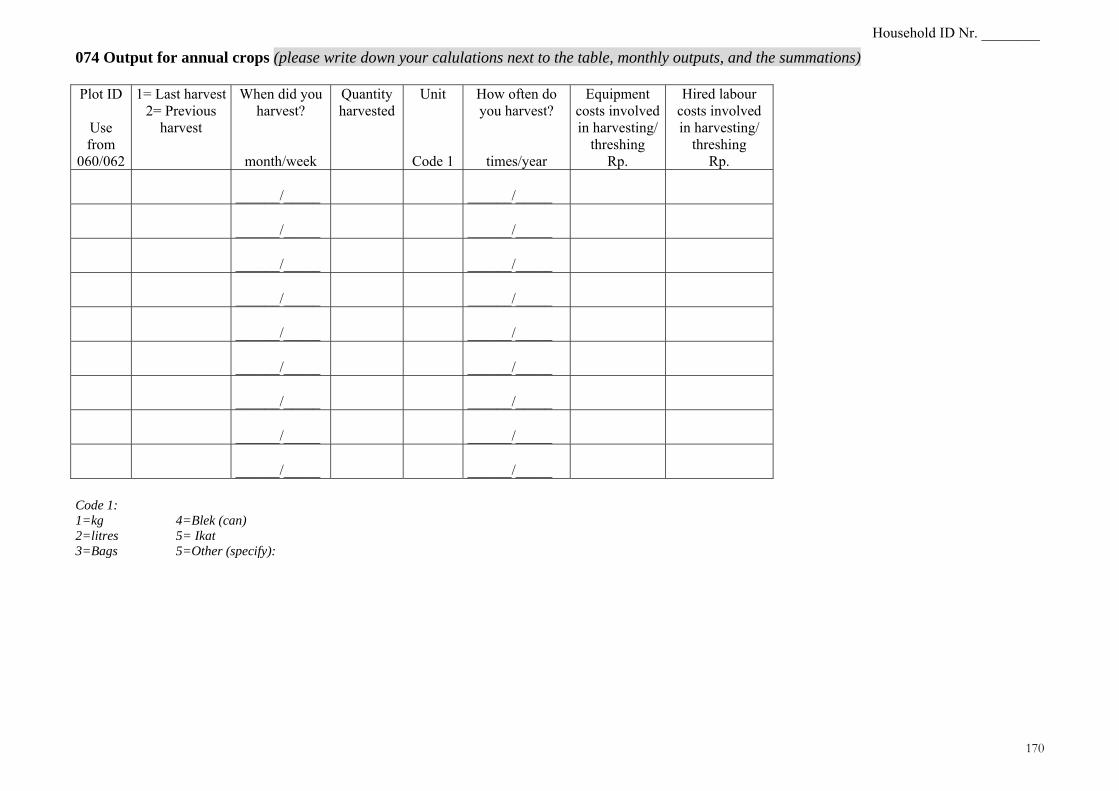
Household ID Nr. ________
170
074 Output for annual crops (please write down your calulations next to the table, monthly outputs, and the summations) Plot ID
Use from
060/062
1= Last harvest2= Previous
harvest
When did you harvest?
month/week
Quantity harvested
Unit
Code 1
How often do you harvest?
times/year
Equipment costs involved in harvesting/
threshing Rp.
Hired labour costs involved in harvesting/
threshing Rp.
______/_____
______/_____
______/_____
______/_____
______/_____
______/_____
______/_____
______/_____
______/_____
______/_____
______/_____
______/_____
______/_____
______/_____
______/_____
______/_____
______/_____
______/_____
Code 1: 1=kg 4=Blek (can) 2=litres 5= Ikat 3=Bags 5=Other (specify):
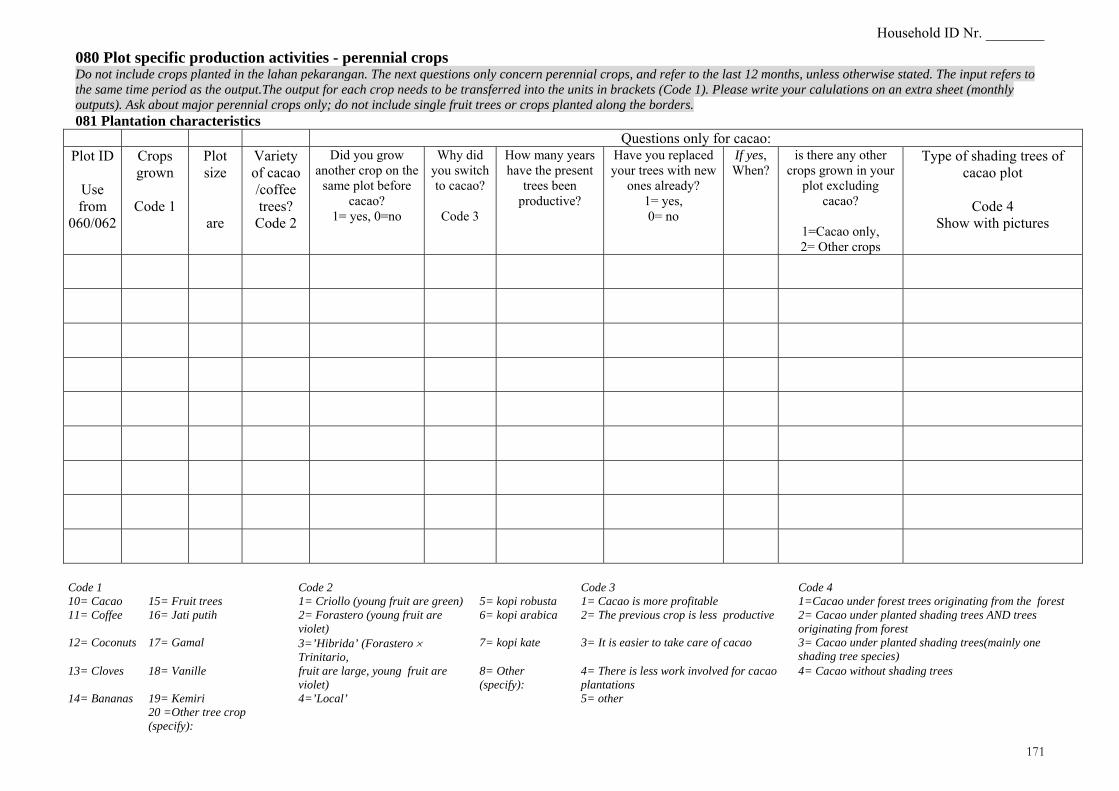
Household ID Nr. ________
171
080 Plot specific production activities - perennial crops Do not include crops planted in the lahan pekarangan. The next questions only concern perennial crops, and refer to the last 12 months, unless otherwise stated. The input refers to the same time period as the output.The output for each crop needs to be transferred into the units in brackets (Code 1). Please write your calulations on an extra sheet (monthly outputs). Ask about major perennial crops only; do not include single fruit trees or crops planted along the borders. 081 Plantation characteristics
Questions only for cacao: Plot ID
Use from
060/062
Crops grown
Code 1
Plot size
are
Variety of cacao /coffee trees?
Code 2
Did you grow another crop on the
same plot before cacao?
1= yes, 0=no
Why did you switch to cacao?
Code 3
How many years have the present
trees been productive?
Have you replaced your trees with new
ones already? 1= yes, 0= no
If yes, When?
is there any other crops grown in your
plot excluding cacao?
1=Cacao only, 2= Other crops
Type of shading trees of cacao plot
Code 4
Show with pictures
Code 1 Code 2 Code 3 Code 4 10= Cacao 15= Fruit trees 1= Criollo (young fruit are green) 5= kopi robusta 1= Cacao is more profitable 1=Cacao under forest trees originating from the forest 11= Coffee 16= Jati putih 2= Forastero (young fruit are
violet) 6= kopi arabica 2= The previous crop is less productive 2= Cacao under planted shading trees AND trees
originating from forest 12= Coconuts 17= Gamal 3=’Hibrida’ (Forastero ×
Trinitario, 7= kopi kate 3= It is easier to take care of cacao 3= Cacao under planted shading trees(mainly one
shading tree species) 13= Cloves 18= Vanille fruit are large, young fruit are
violet) 8= Other (specify):
4= There is less work involved for cacao plantations
4= Cacao without shading trees
14= Bananas 19= Kemiri 20 =Other tree crop (specify):
4=’Local’ 5= other

Household ID Nr. ________
172
082 Land preparation and pesticide use
In case pesticides were used: Plot ID
Use from
060/062
Crops grown
Code 1/081
Age of tree (in year)
Expenses for land preparation
(equipment + herbicide)
Rp.
Expenses for land preparation (hired labour))
Rp.
Expenses for seeds and
young plantsRp.
Was any pesticide
used?
1=yes, 0= no
.. used against what?
Code 1
Amount applied
Litres
Price paid per
litre
Rp.
Expenses for
application(hired
labour) Rp.
Expenses for
application (equipment)
Rp.
Code 1 1=Insect caterpillar 4=Walang sangit 2=Insect wereng 5=Lychen /cendawan 3=Insect penggerek(cut) 6=Other (specify):
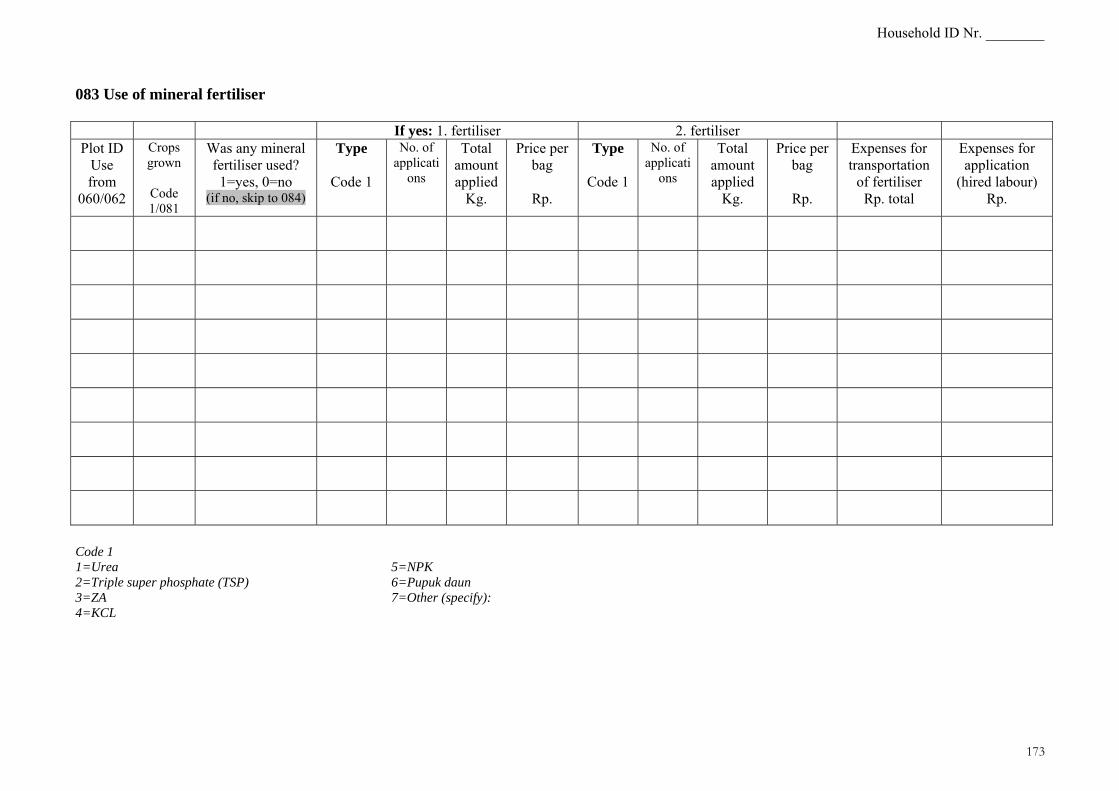
Household ID Nr. ________
173
083 Use of mineral fertiliser
If yes: 1. fertiliser 2. fertiliser Plot ID
Use from
060/062
Crops grown
Code 1/081
Was any mineral fertiliser used? 1=yes, 0=no
(if no, skip to 084)
Type
Code 1
No. of applicati
ons
Total amount applied
Kg.
Price per bag
Rp.
Type
Code 1
No. of applicati
ons
Total amount applied
Kg.
Price per bag
Rp.
Expenses for transportation
of fertiliser Rp. total
Expenses for application
(hired labour) Rp.
Code 1 1=Urea 5=NPK 2=Triple super phosphate (TSP) 6=Pupuk daun 3=ZA 7=Other (specify): 4=KCL

Household ID Nr. ________
174
084 Maintenance of the plantation :
If herbicides were applied: Plot ID
Use from 060/062
Crops grown
Code 1/081
Was growth of weeds controlled?
1=yes, 0= no
(if no, skip to 085)
If yes, Method of
weed control Code 1
Total amount applied
litres
Price paid per
litre
Rp.
Total expenses for
hiring equipment
Rp.
Total expenses for hiring labour for maintenance of
plantation Rp.
Code 1 1=Herbicides 2=Manual weeding 3=Herbicide and manual

Household ID Nr. ________
175
085 Output from perennial crops (please write down your calulations at the bottom of the table, monthly outputs, and the summations)
Ask for cacao only: Plot ID
Use from
060/062
Crops grown
Code 1/081
1= Panen Raya
2= Panen Antara
When did you harvest?
Time/year
How many months for
every single
harvest
Months
How often do
you harvest?
Code 1
Total amount
harvested (quantity)
Unit
Code 2
Costs involved in harvesting
Rp.
Total labour costs
Paid in cash
Rp.
Which year was your
first panen raya
harvest?
How does the first
(PR) harvest
compare to the last (PR)
harvest? Code 3
How does the price
received per unit of first PR harvest with last harvest
Code 3
_____/____
_____/____
_____/____
_____/____
_____/____
_____/____
_____/____
Code 1 Code 2 Code 3 1= every day 7=every month 1=kg dried seed 1= More 2= three times a week 8=every two months 2=kg fresh seed 2= Same 3= twice a week 9=twice a year 3= pieces 3= Less 4= every week 10=every year 4=Other (specify): 5= every two weeks 11= other (specify):______ 6= every three week

Household ID Nr. ________
176
090 Sales of annual and perennial crops The output for each crop needs to be transferred into the units in brackets (Code 2)
If yes: If no: Crop
Code 1
How much did you produce
during the last 12 months?
Unit
Code 2
Did you sell any of this
production?
1= yes, 0= no
How much did you sell during the
last 12 months?
Price received
Rp.
Price received per
unit Rp/unit
Transportation costs from
homestead to market
Rp.
Costs involved in selling the
whole harvest Rp.
How much would you have to pay at the
market for the same quality of the product
per unit? Rp./unit
Code 1 13= Cloves Code 2 1=Padi Sawah (kg) 14=Bananas 1=kg 2= Padi Ladang beras 15=Fruit trees 2=litres 3= padi tadah hujan 16= Jati Putih 3=Bags 4= Maize on the cob, tongkol (kg) 17= Gamal 4=Blek 5= peanuts 18= Vanille 5= Ikat 6= Cassava 19= Kemiri 6= pieces 7= Beans 20= Other tree 1(specify)……… 7=Tundun 8= other veggies(write)............... 21= Other tree 2 (specify)……… 8=Other (specify): 9= other annual crop
22= Other tree 3 (specify)……..
10=Cacao 23= Kernel Maize, pipilan 11= Coffee 24= Fodder Maize, hijauran(kg) 12= Coconuts

Household ID Nr. ________
177
095 Labour usage for crop production 096 Padi Sawah: Keperluan modal dan tenaga kerja untuk musim tertentu
Activity Type of labour* Jan Feb Mar Apr Mei Jun Jul Agu Sep Okt Nov Des
Hire labour?(circle)
Take credit? (circle)
P W Penyiapan
lahan O-hari
Ya
Tdk
Ya
Tdk
P W Pesemaian
O-hari
Ya Tdk
Ya Tdk
P W Pencabutan
(bundle) O-hari
Ya Tdk
Ya Tdk
P W Penanaman
(plant) O-hari
Ya Tdk
Ya Tdk
P W Pemupukan
O-hari
Ya Tdk
Ya Tdk
P W Penyiangan
O-hari
Ya Tdk
Ya Tdk
P W Pen-
yemprotan O-hari
Ya Tdk
Ya Tdk
P W Panen
O-hari
Ya Tdk
Ya Tdk
P W
O-hari
Ya Tdk
Ya Tdk
* P = Pria; W = Wanita, O-hari = Orang- hari

Household ID Nr. ________
178
097 Maize: Keperluan modal dan tenaga kerja untuk musim tertentu (only for maize harvested in kg)
Activity Type of labour* Jan Feb Mar Apr Mei Jun Jul Agu Sep Okt Nov Des
Hire labour?(circle)
Take credit? (circle)
P W Penyiapan
lahan O-hari
Ya Tdk
Ya Tdk
P W Penanaman
O-hari
Ya Tdk
Ya Tdk
P W Pemupukan
O-hari
Ya Tdk
Ya Tdk
P W Penyiangan
O-hari
Ya Tdk
Ya Tdk
P W Pen-
yemprotan O-hari
Ya Tdk
Ya Tdk
P W Panen
O-hari
Ya Tdk
Ya Tdk
P W
O-hari
Ya Tdk
Ya Tdk
* P = Pria; W = Wanita, O-hari = Orang-hari
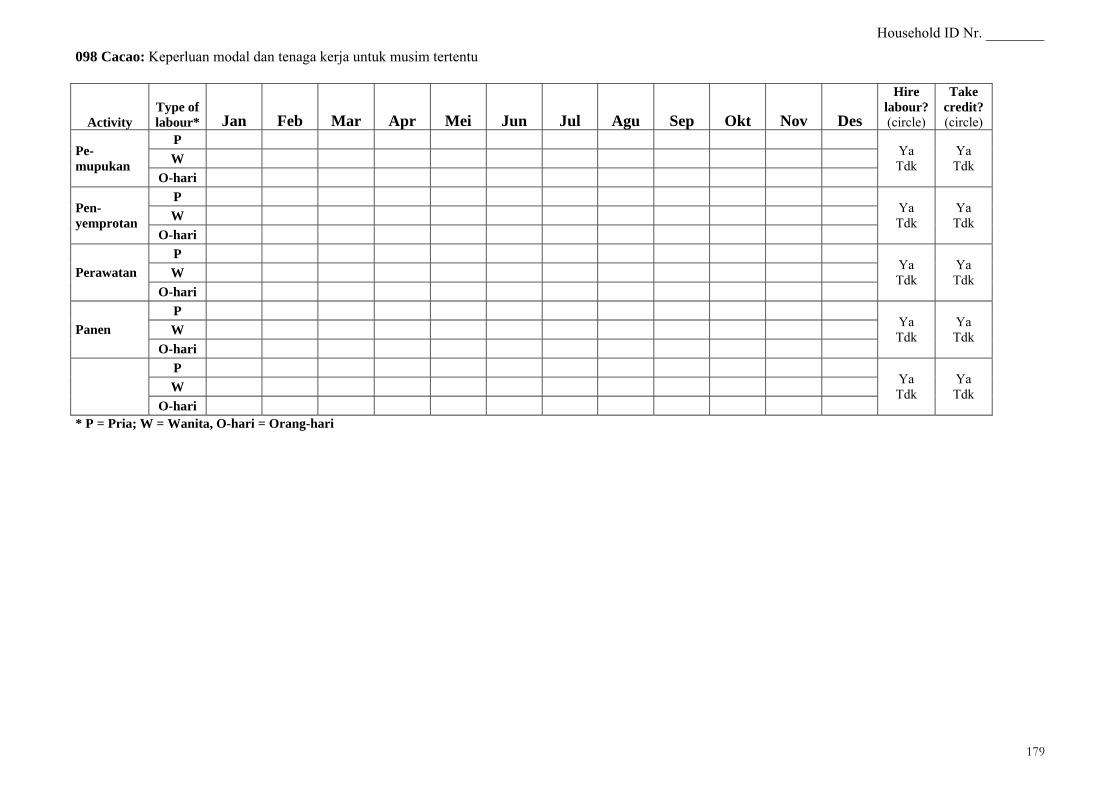
Household ID Nr. ________
179
098 Cacao: Keperluan modal dan tenaga kerja untuk musim tertentu
Activity Type of labour* Jan Feb Mar Apr Mei Jun Jul Agu Sep Okt Nov Des
Hire labour?(circle)
Take credit? (circle)
P W Pe-
mupukan O-hari
Ya Tdk
Ya Tdk
P W Pen-
yemprotan O-hari
Ya Tdk
Ya Tdk
P W Perawatan
O-hari
Ya Tdk
Ya Tdk
P W Panen
O-hari
Ya Tdk
Ya Tdk
P W
O-hari
Ya Tdk
Ya Tdk
* P = Pria; W = Wanita, O-hari = Orang-hari

Household ID Nr. ________
180
100 Daily Activities
A= spend time with family B= spend time with friends C= religious activities D=agricultural production for home consumption E= agricultural production for sales F= collection of forest products G= work as wage labourer H= other paid work I= watch TV
101 On an average day, what are the different activities you do apart from sleeping? (do not read, circle)
J= sport K =Take a rest L1 Other (specify)……………. L2 Other (specify)……………. L3 Other (specify)…………….
102 Which are your personal preferences usually for the mentioned activities above? Rank them according to importance (1= most important, highest number= least importance).
A B C D E F G H I J K L1 L2 L3
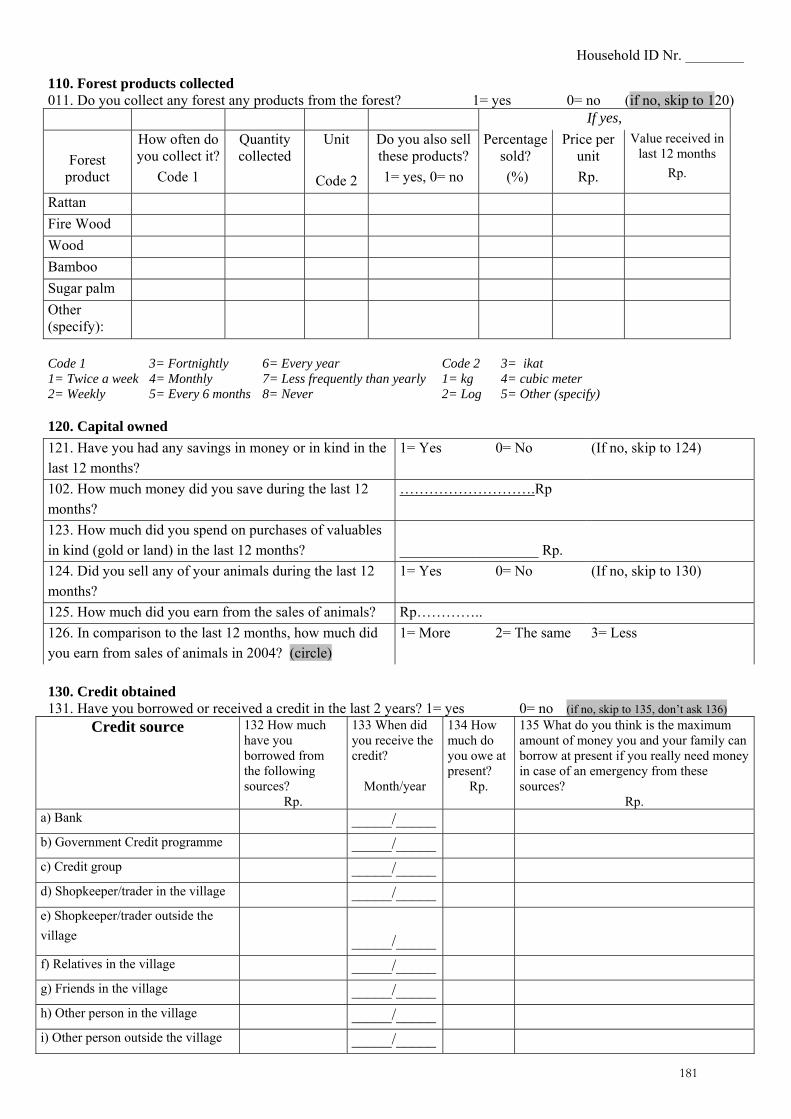
Household ID Nr. ________
181
110. Forest products collected 011. Do you collect any forest any products from the forest? 1= yes 0= no (if no, skip to 120)
If yes,
Forest product
How often do you collect it?
Code 1
Quantity collected
Unit
Code 2
Do you also sell these products? 1= yes, 0= no
Percentage sold? (%)
Price per unit Rp.
Value received in last 12 months
Rp.
Rattan Fire Wood Wood Bamboo Sugar palm Other (specify):
Code 1 3= Fortnightly 6= Every year Code 2 3= ikat 1= Twice a week 4= Monthly 7= Less frequently than yearly 1= kg 4= cubic meter 2= Weekly 5= Every 6 months 8= Never 2= Log 5= Other (specify)
120. Capital owned 121. Have you had any savings in money or in kind in the last 12 months?
1= Yes 0= No (If no, skip to 124)
102. How much money did you save during the last 12 months?
……………………….Rp
123. How much did you spend on purchases of valuables in kind (gold or land) in the last 12 months?
___________________ Rp.
124. Did you sell any of your animals during the last 12 months?
1= Yes 0= No (If no, skip to 130)
125. How much did you earn from the sales of animals? Rp………….. 126. In comparison to the last 12 months, how much did you earn from sales of animals in 2004? (circle)
1= More 2= The same 3= Less
130. Credit obtained 131. Have you borrowed or received a credit in the last 2 years? 1= yes 0= no (if no, skip to 135, don’t ask 136)
Credit source 132 How much have you borrowed from the following sources?
Rp.
133 When did you receive the credit?
Month/year
134 How much do you owe at present?
Rp.
135 What do you think is the maximum amount of money you and your family can borrow at present if you really need money in case of an emergency from these sources?
Rp. a) Bank _____/_____ b) Government Credit programme _____/_____ c) Credit group _____/_____ d) Shopkeeper/trader in the village _____/_____ e) Shopkeeper/trader outside the village
_____/_____
f) Relatives in the village _____/_____ g) Friends in the village _____/_____ h) Other person in the village _____/_____ i) Other person outside the village _____/_____

Household ID Nr. ________
182
1= food 4= herbicides 7= pesticides 10= positive event 13= harvesting 2= health 5= rent land 8= fertiliser 11= transportation 14= seeds /young
plants
136 What did you use the loan for? (don’t read, can be more than one answer, circle)
3= education 6= land preparation 9= labour payment
12= agricultural equipment
15= other (specify) ________________
140. Possession of assets 141. Do you own any of the following assets?
Estimate current sales value using method 1. Ask for current sales value 2. If sale is impossible ask about the costs to replace it
Type of asset How many do you own?
Last survey current survey
Which year did you buy/own it/ them?
Method Value in Rp. a) Buffaloes b) Bulls and cows c) Pigs and goats d) Chicken e) Any building outside lahan pekarangan
f) Mobil g) Sepeda motor h) Bicycle i) Other vehicle (boat) j) Carts/trailors k) Radio l) TV m) Satellite dish n) VCD/tape player o) Gas cookers p) Kerosene cooker q) Fans r) Knapsack sprayer s) Water pump t) Motor plough u) Husking machine v) House with content 142. Do you own any other assets not mentioned in 141? 1= Yes 0= No 143. If yes, specify: Type of asset How many do
you own? Which year did
you buy it/ them? Estimate current sales value using method 1. Ask current sales value 2. If sale is impossible ask about the costs to replace it
Method Value in Rp. w) x)

Household ID Nr. ________
183
Thank you very much for your assistance and for your time helping to answer the questionnaire. Interviewer comments: Signature of interviewer: ______________________________________

Appendix 184

Appendix 185
Appendix II: Pictures taken during Interviews
Figure II.1. Pipin conducting an interview in Lempelero
Figure II.2. Rifai conducting an interview in Kapiroe
Figure II.3. Sumarno conducting an interview in Sintuwu
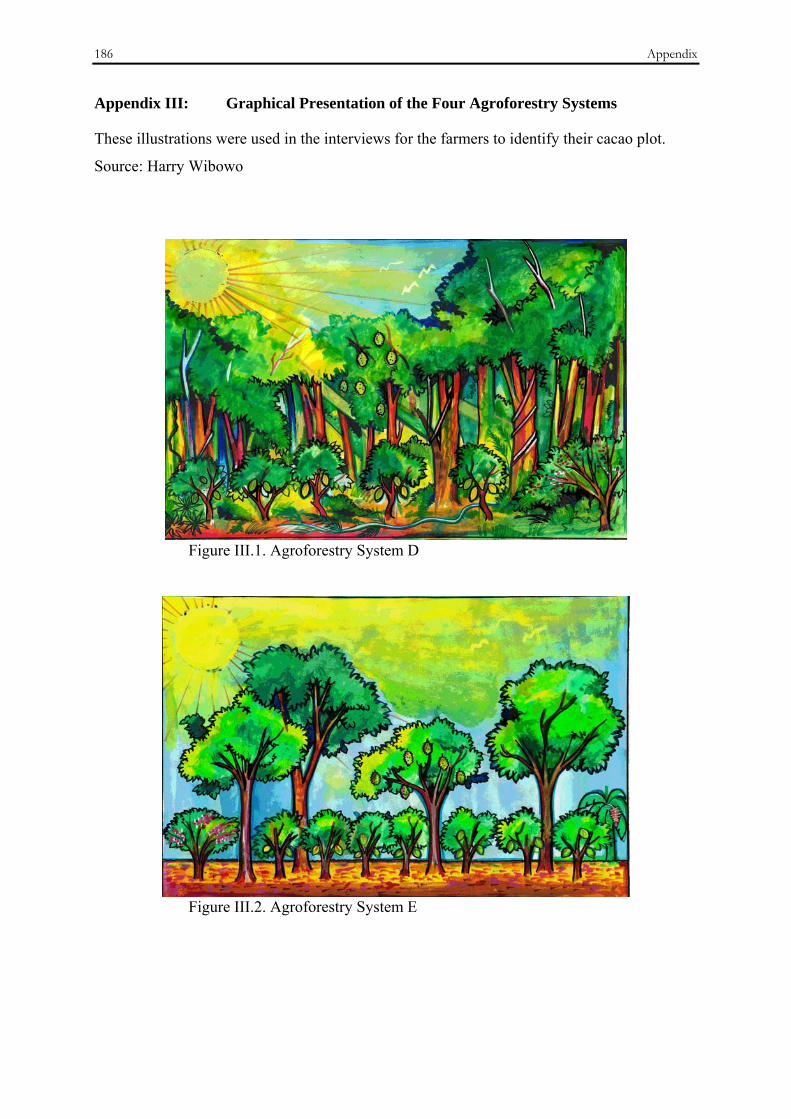
186 Appendix
Appendix III: Graphical Presentation of the Four Agroforestry Systems
These illustrations were used in the interviews for the farmers to identify their cacao plot.
Source: Harry Wibowo
Figure III.1. Agroforestry System D
Figure III.2. Agroforestry System E

Appendix 187
Figure III.3. Agroforestry System F
Figure III.4. Agroforestry System G

188 Appendix
Appendix IV: Outline of Structure for Focus Group Meetings
1. Drawing a map of village and surroundings, of the forest, NP, hutan produksi etc., different zones, which area KKM applies to etc. Everybody should be drawing, and explain where specific zones are etc.
IRA
2. KKM – what? If you think about KKM, what are economic, environmental and social issues of the KKM?
They should write only the main idea/word on the card. S & I put them on the wall randomly. The order them according to groups /topics: SUMARNO
3. Divide ideas/activities into topics: institution, participation, education, monitoring, preservation, status of the nature, illegal resource extraction, environmental impact and economic impact –– Add ideas from list if necessary a) Environmental impact b) Social impact c) Economic
impact Amount of rattan collection Land rights acceptance Penalty for rattan
collection Amount of illegal logging Distribution of land Penalty for illegal
logging Knowledge in village with respect to NP
Capacity building for villagers
Amount of cacao plantations
Forest (NP) monitoring by polisi hutan
Participation of all villagers
Income possibilities
Amount of flooding, erosion Existing organisations abilities/ powers
Economic activity shifting
Rattan collection/illegal logging in non-NP forest
New organisations evolved?
Amount of animals Enforcement of rules Water pollution Who has lost out? Before KKM /after KKM – give +++ or ---- IRA 4. Carbon sequestration – explain logic of payments
- Avoided deforestation: need for complete protection, village institution enforcing rules & sanctions Participation of entire village - Agroforestry: contract for not cutting trees, but harvest allowed Cacao trees with old original forest trees receive higher payment
SUMARNO

Appendix 189
Appendix V: Pictures taken during Focus Groups
Figure V.1. Focus Group in Wuasa
Figure V.2. Focus Group in Langko
Figure V.3. Focus Group in Salua
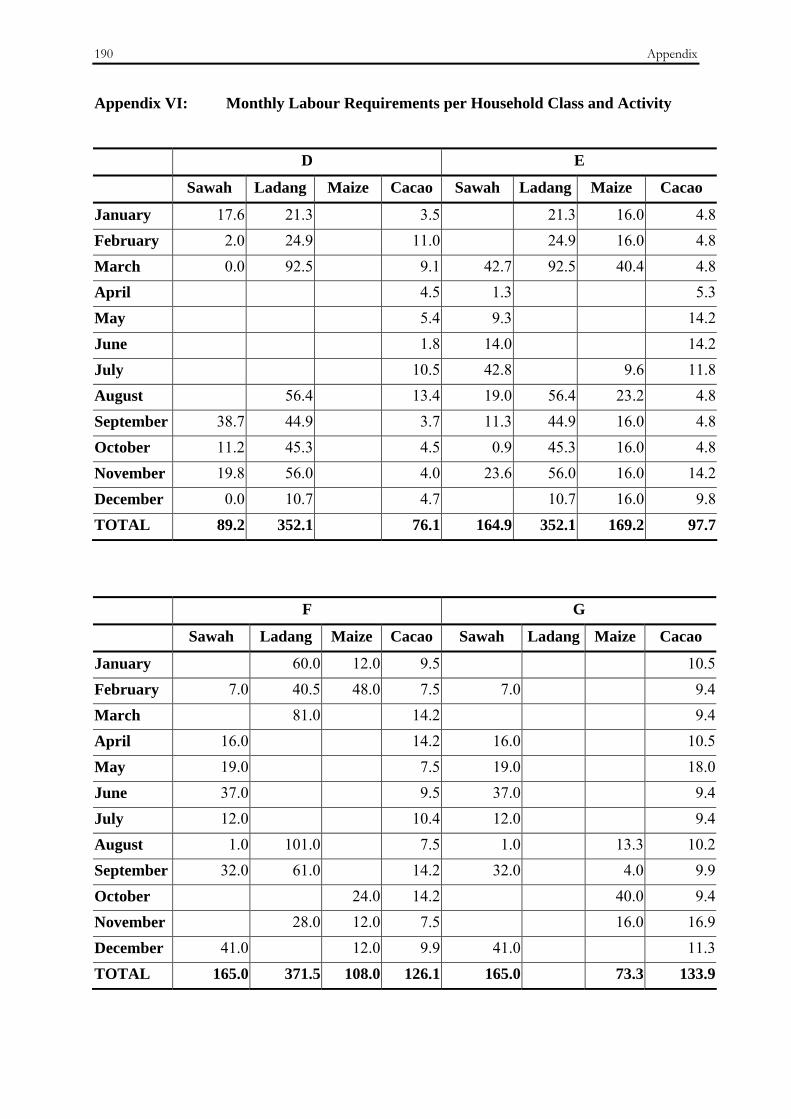
190 Appendix
Appendix VI: Monthly Labour Requirements per Household Class and Activity
D E
Sawah Ladang Maize Cacao Sawah Ladang Maize Cacao
January 17.6 21.3 3.5 21.3 16.0 4.8February 2.0 24.9 11.0 24.9 16.0 4.8March 0.0 92.5 9.1 42.7 92.5 40.4 4.8April 4.5 1.3 5.3May 5.4 9.3 14.2June 1.8 14.0 14.2July 10.5 42.8 9.6 11.8August 56.4 13.4 19.0 56.4 23.2 4.8September 38.7 44.9 3.7 11.3 44.9 16.0 4.8October 11.2 45.3 4.5 0.9 45.3 16.0 4.8November 19.8 56.0 4.0 23.6 56.0 16.0 14.2December 0.0 10.7 4.7 10.7 16.0 9.8TOTAL 89.2 352.1 76.1 164.9 352.1 169.2 97.7 F G
Sawah Ladang Maize Cacao Sawah Ladang Maize Cacao
January 60.0 12.0 9.5 10.5February 7.0 40.5 48.0 7.5 7.0 9.4March 81.0 14.2 9.4April 16.0 14.2 16.0 10.5May 19.0 7.5 19.0 18.0June 37.0 9.5 37.0 9.4July 12.0 10.4 12.0 9.4August 1.0 101.0 7.5 1.0 13.3 10.2September 32.0 61.0 14.2 32.0 4.0 9.9October 24.0 14.2 40.0 9.4November 28.0 12.0 7.5 16.0 16.9December 41.0 12.0 9.9 41.0 11.3TOTAL 165.0 371.5 108.0 126.1 165.0 73.3 133.9

Appendix 191
Appendix VII: Linear Programming Models
All matrices are for scenario 2, with a discount rate of 10% and a CER of €12 per tCO2e

192 Appendix
Table V.1 Linear Programming Model Household Type D
Activities Sawah Padi ladang Maize Cacao D Cacao E Cacao F Cacao G
Cacao Dnew
Cacao Enew
Cacao Fnew
Cacao Gnew
Forest to Coc D
Forest to Coc E
Forest to Coc F
Forest to Coc G
Hired Labour RHS
Objective values (GM 000 IDR/ha) 2.114 832 2.264 1.187 2.469 2.170 7.009 1.187 2.459 2.140 6.989 66 87 153 197 -437 Constraints Land (ha)
January 1 1 1 1 1 1 1 1 1 1 1 -1 -1 -1 -1 2,52 <= 2,52 February 1 1 1 1 1 1 1 1 1 1 1 -1 -1 -1 -1 2,52 <= 2,52
March 1 1 1 1 1 1 1 1 1 -1 -1 -1 -1 2,45 <= 2,52 April 1 1 1 1 1 1 1 1 -1 -1 -1 -1 2,33 <= 2,52 May 1 1 1 1 1 1 1 1 -1 -1 -1 -1 2,33 <= 2,52
June 1 1 1 1 1 1 1 1 -1 -1 -1 -1 2,33 <= 2,52 July 1 1 1 1 1 1 1 1 -1 -1 -1 -1 2,33 <= 2,52
August 1 1 1 1 1 1 1 1 1 -1 -1 -1 -1 2,45 <= 2,52 September 1 1 1 1 1 1 1 1 1 1 -1 -1 -1 -1 2,52 <= 2,52
October 1 1 1 1 1 1 1 1 1 1 1 -1 -1 -1 -1 2,52 <= 2,52 November 1 1 1 1 1 1 1 1 1 1 1 -1 -1 -1 -1 2,52 <= 2,52 December 1 1 1 1 1 1 1 1 1 1 -1 -1 -1 -1 2,45 <= 2,52
Forest Conversion Cacao D 1 1 -1 1,36 ≥ 0,00 Forest Conversion Cacao E 1 1 -1 0,94 ≥ 0,00 Forest Conversion Cacao F 1 1 -1 0,00 ≥ 0,00 Forest Conversion Cacao G 1 1 -1 0,04 ≥ 0,00 Land restrictions Minimum sawah prodn (ha) 1 0,07 ≥ 0,07 Minimum padi prodn (ha) 1 0,11 ≥ 0,11 miminum maize prodn (ha) 1 0,00 ≥ 0,00
D-restriction 1 1 1,56 ≥ 0,59 E-restriction 1 1 0,94 ≥ 0,00 F-restriction 1 1 0,00 ≥ 0,25 G-restriction 1 1 0,04 ≥ 0,00
Deforestation 1 1 1 1 0,20 <= 0,20 MaxRes D 1 0,00 <= 1,56
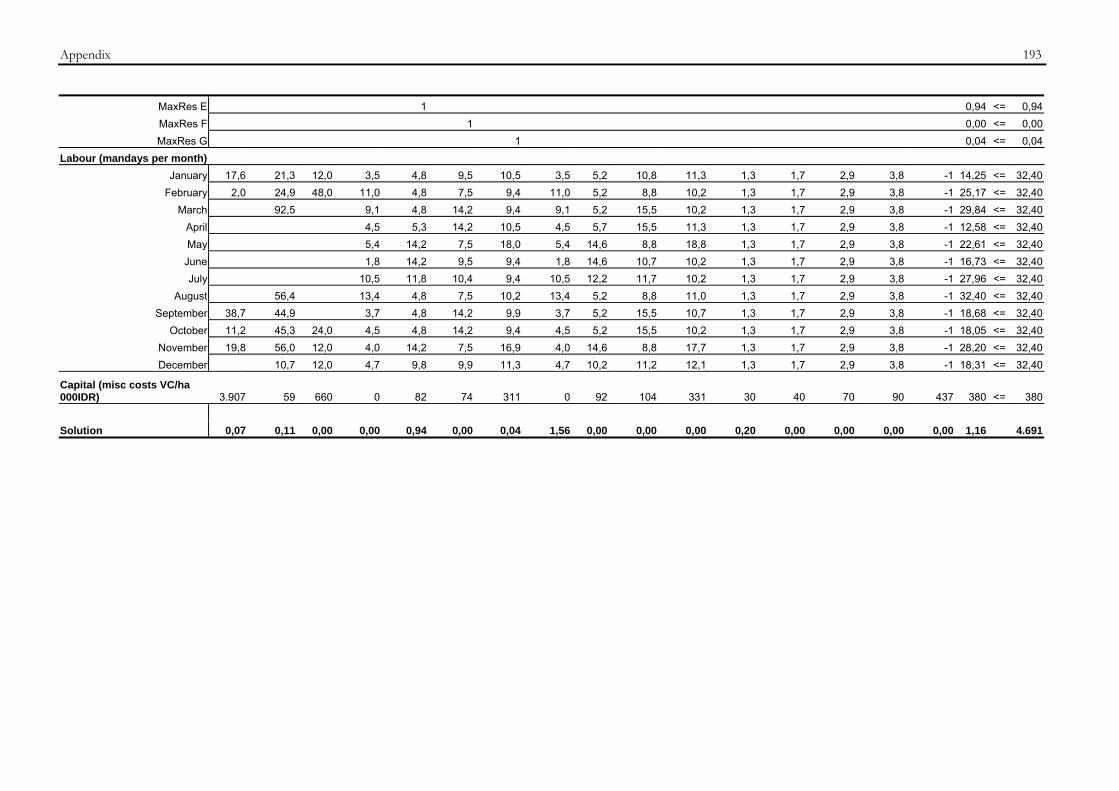
Appendix 193
MaxRes E 1 0,94 <= 0,94 MaxRes F 1 0,00 <= 0,00 MaxRes G 1 0,04 <= 0,04
Labour (mandays per month) January 17,6 21,3 12,0 3,5 4,8 9,5 10,5 3,5 5,2 10,8 11,3 1,3 1,7 2,9 3,8 -1 14,25 <= 32,40
February 2,0 24,9 48,0 11,0 4,8 7,5 9,4 11,0 5,2 8,8 10,2 1,3 1,7 2,9 3,8 -1 25,17 <= 32,40 March 92,5 9,1 4,8 14,2 9,4 9,1 5,2 15,5 10,2 1,3 1,7 2,9 3,8 -1 29,84 <= 32,40
April 4,5 5,3 14,2 10,5 4,5 5,7 15,5 11,3 1,3 1,7 2,9 3,8 -1 12,58 <= 32,40 May 5,4 14,2 7,5 18,0 5,4 14,6 8,8 18,8 1,3 1,7 2,9 3,8 -1 22,61 <= 32,40
June 1,8 14,2 9,5 9,4 1,8 14,6 10,7 10,2 1,3 1,7 2,9 3,8 -1 16,73 <= 32,40 July 10,5 11,8 10,4 9,4 10,5 12,2 11,7 10,2 1,3 1,7 2,9 3,8 -1 27,96 <= 32,40
August 56,4 13,4 4,8 7,5 10,2 13,4 5,2 8,8 11,0 1,3 1,7 2,9 3,8 -1 32,40 <= 32,40 September 38,7 44,9 3,7 4,8 14,2 9,9 3,7 5,2 15,5 10,7 1,3 1,7 2,9 3,8 -1 18,68 <= 32,40
October 11,2 45,3 24,0 4,5 4,8 14,2 9,4 4,5 5,2 15,5 10,2 1,3 1,7 2,9 3,8 -1 18,05 <= 32,40 November 19,8 56,0 12,0 4,0 14,2 7,5 16,9 4,0 14,6 8,8 17,7 1,3 1,7 2,9 3,8 -1 28,20 <= 32,40 December 10,7 12,0 4,7 9,8 9,9 11,3 4,7 10,2 11,2 12,1 1,3 1,7 2,9 3,8 -1 18,31 <= 32,40
Capital (misc costs VC/ha 000IDR) 3.907 59 660 0 82 74 311 0 92 104 331 30 40 70 90 437 380 <= 380 Solution 0,07 0,11 0,00 0,00 0,94 0,00 0,04 1,56 0,00 0,00 0,00 0,20 0,00 0,00 0,00 0,00 1,16 4.691
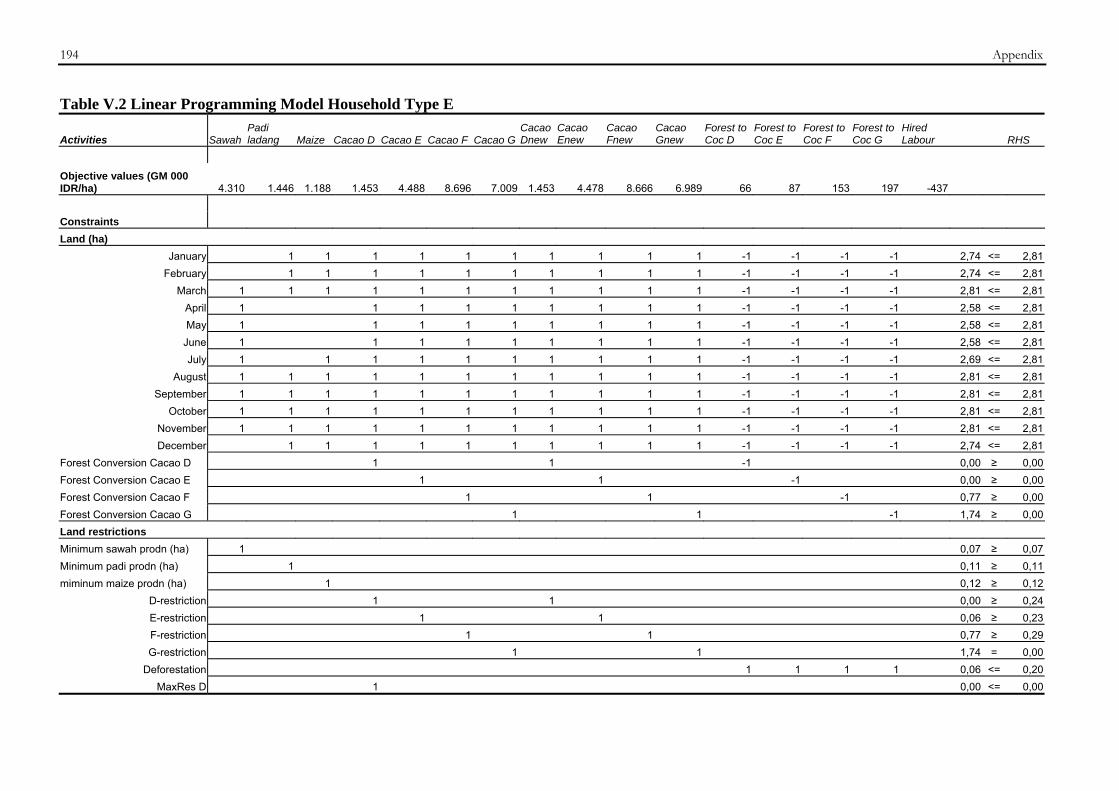
194 Appendix
Table V.2 Linear Programming Model Household Type E
Activities Sawah Padi ladang Maize Cacao D Cacao E Cacao F Cacao G
Cacao Dnew
Cacao Enew
Cacao Fnew
Cacao Gnew
Forest to Coc D
Forest to Coc E
Forest to Coc F
Forest to Coc G
Hired Labour RHS
Objective values (GM 000 IDR/ha) 4.310 1.446 1.188 1.453 4.488 8.696 7.009 1.453 4.478 8.666 6.989 66 87 153 197 -437 Constraints Land (ha)
January 1 1 1 1 1 1 1 1 1 1 -1 -1 -1 -1 2,74 <= 2,81 February 1 1 1 1 1 1 1 1 1 1 -1 -1 -1 -1 2,74 <= 2,81
March 1 1 1 1 1 1 1 1 1 1 1 -1 -1 -1 -1 2,81 <= 2,81 April 1 1 1 1 1 1 1 1 1 -1 -1 -1 -1 2,58 <= 2,81 May 1 1 1 1 1 1 1 1 1 -1 -1 -1 -1 2,58 <= 2,81
June 1 1 1 1 1 1 1 1 1 -1 -1 -1 -1 2,58 <= 2,81 July 1 1 1 1 1 1 1 1 1 1 -1 -1 -1 -1 2,69 <= 2,81
August 1 1 1 1 1 1 1 1 1 1 1 -1 -1 -1 -1 2,81 <= 2,81 September 1 1 1 1 1 1 1 1 1 1 1 -1 -1 -1 -1 2,81 <= 2,81
October 1 1 1 1 1 1 1 1 1 1 1 -1 -1 -1 -1 2,81 <= 2,81 November 1 1 1 1 1 1 1 1 1 1 1 -1 -1 -1 -1 2,81 <= 2,81 December 1 1 1 1 1 1 1 1 1 1 -1 -1 -1 -1 2,74 <= 2,81
Forest Conversion Cacao D 1 1 -1 0,00 ≥ 0,00 Forest Conversion Cacao E 1 1 -1 0,00 ≥ 0,00 Forest Conversion Cacao F 1 1 -1 0,77 ≥ 0,00 Forest Conversion Cacao G 1 1 -1 1,74 ≥ 0,00 Land restrictions Minimum sawah prodn (ha) 1 0,07 ≥ 0,07 Minimum padi prodn (ha) 1 0,11 ≥ 0,11 miminum maize prodn (ha) 1 0,12 ≥ 0,12
D-restriction 1 1 0,00 ≥ 0,24 E-restriction 1 1 0,06 ≥ 0,23 F-restriction 1 1 0,77 ≥ 0,29 G-restriction 1 1 1,74 = 0,00
Deforestation 1 1 1 1 0,06 <= 0,20 MaxRes D 1 0,00 <= 0,00
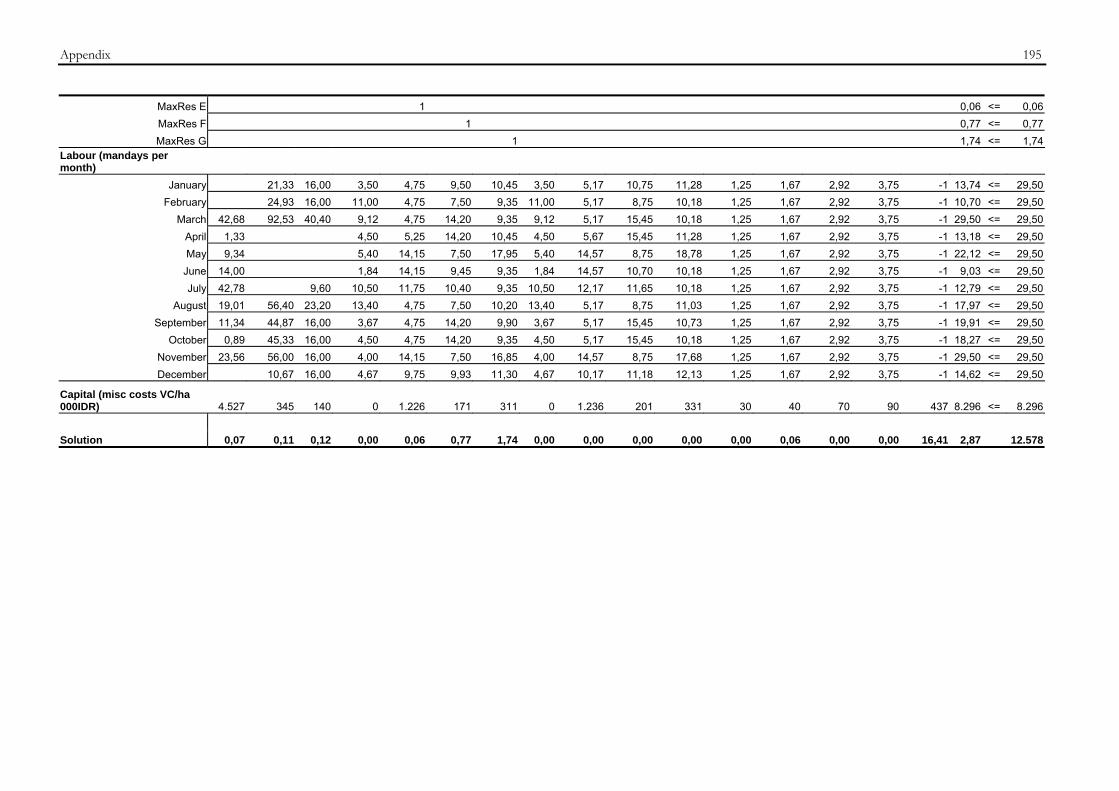
Appendix 195
MaxRes E 1 0,06 <= 0,06 MaxRes F 1 0,77 <= 0,77 MaxRes G 1 1,74 <= 1,74
Labour (mandays per month)
January 21,33 16,00 3,50 4,75 9,50 10,45 3,50 5,17 10,75 11,28 1,25 1,67 2,92 3,75 -1 13,74 <= 29,50 February 24,93 16,00 11,00 4,75 7,50 9,35 11,00 5,17 8,75 10,18 1,25 1,67 2,92 3,75 -1 10,70 <= 29,50
March 42,68 92,53 40,40 9,12 4,75 14,20 9,35 9,12 5,17 15,45 10,18 1,25 1,67 2,92 3,75 -1 29,50 <= 29,50 April 1,33 4,50 5,25 14,20 10,45 4,50 5,67 15,45 11,28 1,25 1,67 2,92 3,75 -1 13,18 <= 29,50 May 9,34 5,40 14,15 7,50 17,95 5,40 14,57 8,75 18,78 1,25 1,67 2,92 3,75 -1 22,12 <= 29,50
June 14,00 1,84 14,15 9,45 9,35 1,84 14,57 10,70 10,18 1,25 1,67 2,92 3,75 -1 9,03 <= 29,50 July 42,78 9,60 10,50 11,75 10,40 9,35 10,50 12,17 11,65 10,18 1,25 1,67 2,92 3,75 -1 12,79 <= 29,50
August 19,01 56,40 23,20 13,40 4,75 7,50 10,20 13,40 5,17 8,75 11,03 1,25 1,67 2,92 3,75 -1 17,97 <= 29,50 September 11,34 44,87 16,00 3,67 4,75 14,20 9,90 3,67 5,17 15,45 10,73 1,25 1,67 2,92 3,75 -1 19,91 <= 29,50
October 0,89 45,33 16,00 4,50 4,75 14,20 9,35 4,50 5,17 15,45 10,18 1,25 1,67 2,92 3,75 -1 18,27 <= 29,50 November 23,56 56,00 16,00 4,00 14,15 7,50 16,85 4,00 14,57 8,75 17,68 1,25 1,67 2,92 3,75 -1 29,50 <= 29,50 December 10,67 16,00 4,67 9,75 9,93 11,30 4,67 10,17 11,18 12,13 1,25 1,67 2,92 3,75 -1 14,62 <= 29,50
Capital (misc costs VC/ha 000IDR) 4.527 345 140 0 1.226 171 311 0 1.236 201 331 30 40 70 90 437 8.296 <= 8.296 Solution 0,07 0,11 0,12 0,00 0,06 0,77 1,74 0,00 0,00 0,00 0,00 0,00 0,06 0,00 0,00 16,41 2,87 12.578
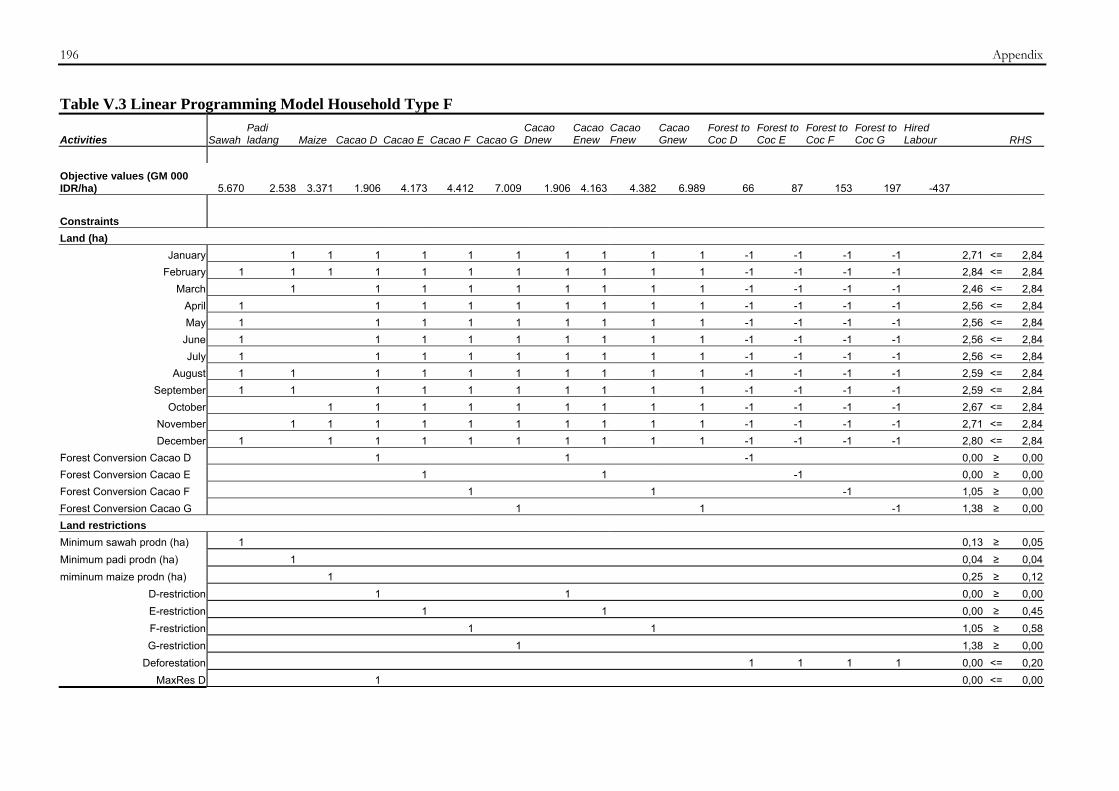
196 Appendix
Table V.3 Linear Programming Model Household Type F
Activities Sawah Padi ladang Maize Cacao D Cacao E Cacao F Cacao G
Cacao Dnew
Cacao Enew
Cacao Fnew
Cacao Gnew
Forest to Coc D
Forest to Coc E
Forest to Coc F
Forest to Coc G
Hired Labour RHS
Objective values (GM 000 IDR/ha) 5.670 2.538 3.371 1.906 4.173 4.412 7.009 1.906 4.163 4.382 6.989 66 87 153 197 -437 Constraints Land (ha)
January 1 1 1 1 1 1 1 1 1 1 -1 -1 -1 -1 2,71 <= 2,84 February 1 1 1 1 1 1 1 1 1 1 1 -1 -1 -1 -1 2,84 <= 2,84
March 1 1 1 1 1 1 1 1 1 -1 -1 -1 -1 2,46 <= 2,84 April 1 1 1 1 1 1 1 1 1 -1 -1 -1 -1 2,56 <= 2,84 May 1 1 1 1 1 1 1 1 1 -1 -1 -1 -1 2,56 <= 2,84
June 1 1 1 1 1 1 1 1 1 -1 -1 -1 -1 2,56 <= 2,84 July 1 1 1 1 1 1 1 1 1 -1 -1 -1 -1 2,56 <= 2,84
August 1 1 1 1 1 1 1 1 1 1 -1 -1 -1 -1 2,59 <= 2,84 September 1 1 1 1 1 1 1 1 1 1 -1 -1 -1 -1 2,59 <= 2,84
October 1 1 1 1 1 1 1 1 1 -1 -1 -1 -1 2,67 <= 2,84 November 1 1 1 1 1 1 1 1 1 1 -1 -1 -1 -1 2,71 <= 2,84 December 1 1 1 1 1 1 1 1 1 1 -1 -1 -1 -1 2,80 <= 2,84
Forest Conversion Cacao D 1 1 -1 0,00 ≥ 0,00 Forest Conversion Cacao E 1 1 -1 0,00 ≥ 0,00 Forest Conversion Cacao F 1 1 -1 1,05 ≥ 0,00 Forest Conversion Cacao G 1 1 -1 1,38 ≥ 0,00 Land restrictions Minimum sawah prodn (ha) 1 0,13 ≥ 0,05 Minimum padi prodn (ha) 1 0,04 ≥ 0,04 miminum maize prodn (ha) 1 0,25 ≥ 0,12
D-restriction 1 1 0,00 ≥ 0,00 E-restriction 1 1 0,00 ≥ 0,45 F-restriction 1 1 1,05 ≥ 0,58 G-restriction 1 1,38 ≥ 0,00
Deforestation 1 1 1 1 0,00 <= 0,20 MaxRes D 1 0,00 <= 0,00
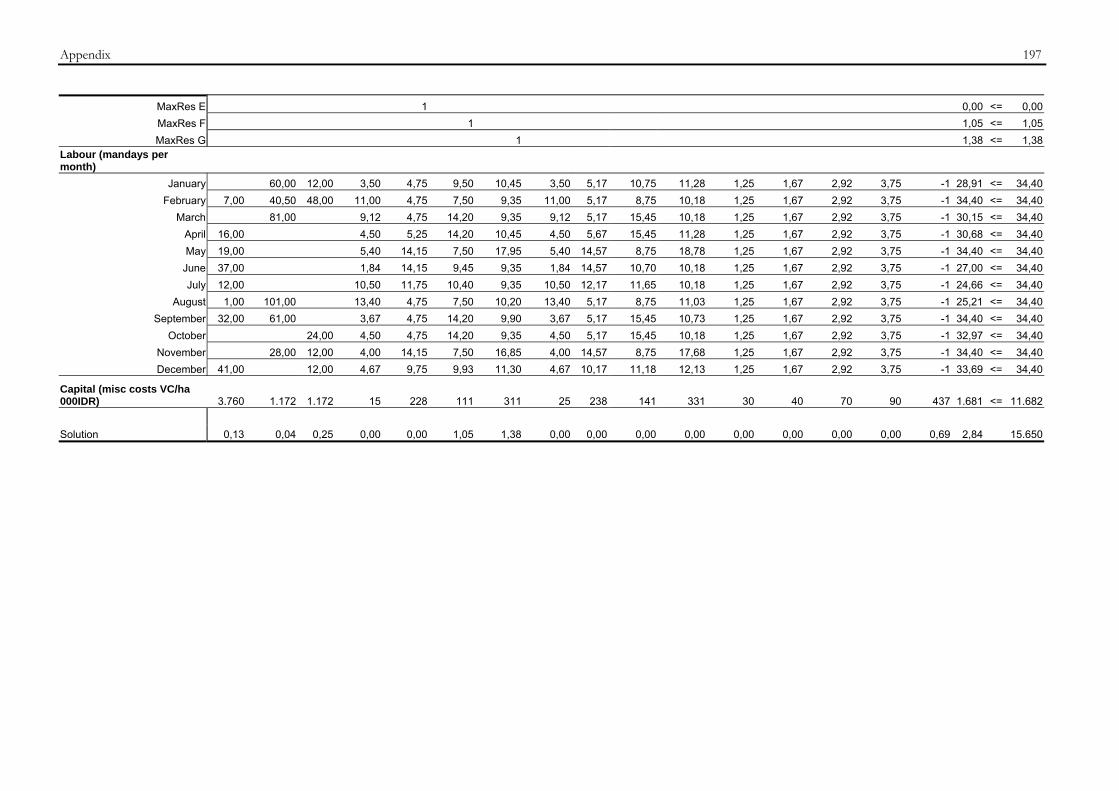
Appendix 197
MaxRes E 1 0,00 <= 0,00 MaxRes F 1 1,05 <= 1,05 MaxRes G 1 1,38 <= 1,38
Labour (mandays per month)
January 60,00 12,00 3,50 4,75 9,50 10,45 3,50 5,17 10,75 11,28 1,25 1,67 2,92 3,75 -1 28,91 <= 34,40 February 7,00 40,50 48,00 11,00 4,75 7,50 9,35 11,00 5,17 8,75 10,18 1,25 1,67 2,92 3,75 -1 34,40 <= 34,40
March 81,00 9,12 4,75 14,20 9,35 9,12 5,17 15,45 10,18 1,25 1,67 2,92 3,75 -1 30,15 <= 34,40 April 16,00 4,50 5,25 14,20 10,45 4,50 5,67 15,45 11,28 1,25 1,67 2,92 3,75 -1 30,68 <= 34,40 May 19,00 5,40 14,15 7,50 17,95 5,40 14,57 8,75 18,78 1,25 1,67 2,92 3,75 -1 34,40 <= 34,40
June 37,00 1,84 14,15 9,45 9,35 1,84 14,57 10,70 10,18 1,25 1,67 2,92 3,75 -1 27,00 <= 34,40 July 12,00 10,50 11,75 10,40 9,35 10,50 12,17 11,65 10,18 1,25 1,67 2,92 3,75 -1 24,66 <= 34,40
August 1,00 101,00 13,40 4,75 7,50 10,20 13,40 5,17 8,75 11,03 1,25 1,67 2,92 3,75 -1 25,21 <= 34,40 September 32,00 61,00 3,67 4,75 14,20 9,90 3,67 5,17 15,45 10,73 1,25 1,67 2,92 3,75 -1 34,40 <= 34,40
October 24,00 4,50 4,75 14,20 9,35 4,50 5,17 15,45 10,18 1,25 1,67 2,92 3,75 -1 32,97 <= 34,40 November 28,00 12,00 4,00 14,15 7,50 16,85 4,00 14,57 8,75 17,68 1,25 1,67 2,92 3,75 -1 34,40 <= 34,40 December 41,00 12,00 4,67 9,75 9,93 11,30 4,67 10,17 11,18 12,13 1,25 1,67 2,92 3,75 -1 33,69 <= 34,40
Capital (misc costs VC/ha 000IDR) 3.760 1.172 1.172 15 228 111 311 25 238 141 331 30 40 70 90 437 1.681 <= 11.682 Solution 0,13 0,04 0,25 0,00 0,00 1,05 1,38 0,00 0,00 0,00 0,00 0,00 0,00 0,00 0,00 0,69 2,84 15.650

198 Appendix
Table V.4 Linear Programming Model Household Type G
Activities Sawah Padi ladang Maize Cacao D Cacao E Cacao F Cacao G
Cacao Dnew
Cacao Enew
Cacao Fnew
Cacao Gnew
Forest to Coc D
Forest to Coc E
Forest to Coc F
Forest to Coc G
Hired Labour RHS
Objective values (GM 000 IDR/ha) 2.735 1.605 2.232 1.906 6.628 3.848 16.948 1.906 6.618 3.818 16.928 66 126 220 283 -437 Constraints Land (ha)
January 1 1 1 1 1 1 1 1 1 -1 -1 -1 -1 1,89 <= 2,39 February 1 1 1 1 1 1 1 1 1 1 -1 -1 -1 -1 2,02 <= 2,39
March 1 1 1 1 1 1 1 1 1 -1 -1 -1 -1 1,89 <= 2,39 April 1 1 1 1 1 1 1 1 1 -1 -1 -1 -1 2,02 <= 2,39 May 1 1 1 1 1 1 1 1 1 -1 -1 -1 -1 2,02 <= 2,39
June 1 1 1 1 1 1 1 1 1 -1 -1 -1 -1 2,02 <= 2,39 July 1 1 1 1 1 1 1 1 1 -1 -1 -1 -1 2,02 <= 2,39
August 1 1 1 1 1 1 1 1 1 1 1 -1 -1 -1 -1 2,39 <= 2,39 September 1 1 1 1 1 1 1 1 1 1 1 -1 -1 -1 -1 2,39 <= 2,39
October 1 1 1 1 1 1 1 1 1 1 -1 -1 -1 -1 2,26 <= 2,39 November 1 1 1 1 1 1 1 1 1 1 -1 -1 -1 -1 2,26 <= 2,39 December 1 1 1 1 1 1 1 1 1 1 -1 -1 -1 -1 2,02 <= 2,39
Forest Conversion Cacao D 1 1 -1 0,00 ≥ 0,00 Forest Conversion Cacao E 1 1 -1 0,00 ≥ 0,00 Forest Conversion Cacao F 1 1 -1 0,00 ≥ 0,00 Forest Conversion Cacao G 1 1 -1 1,89 ≥ 0,00 Land restrictions Minimum sawah prodn (ha) 1 0,13 ≥ 0,13 Minimum padi prodn (ha) 1 0,00 ≥ 0,00 miminum maize prodn (ha) 1 0,38 ≥ 0,38
D-restriction 1 1 0,00 ≥ 0,00 E-restriction 1 1 0,00 ≥ 0,33 F-restriction 1 1 0,00 ≥ 0,00 G-restriction 1 1 2,00 ≥ 0,79
Deforestation 1 1 1 1 0,11 <= 0,20 MaxRes D 1 0,00 <= 0,00

Appendix 199
MaxRes E 1 0,00 <= 0,00 MaxRes F 1 0,00 <= 0,00 MaxRes G 1 2,00 <= 2,00
Labour (mandays per month)
January 21,33 3,50 4,75 9,50 10,45 3,50 5,17 10,75 11,28 1,25 1,67 2,92 3,75 -1 12,80 <= 31,60 February 7,00 24,93 11,00 4,75 7,50 9,35 11,00 5,17 8,75 10,18 1,25 1,67 2,92 3,75 -1 11,51 <= 31,60
March 92,53 9,12 4,75 14,20 9,35 9,12 5,17 15,45 10,18 1,25 1,67 2,92 3,75 -1 10,60 <= 31,60 April 16,00 4,50 5,25 14,20 10,45 4,50 5,67 15,45 11,28 1,25 1,67 2,92 3,75 -1 14,89 <= 31,60 May 19,00 5,40 14,15 7,50 17,95 5,40 14,57 8,75 18,78 1,25 1,67 2,92 3,75 -1 30,27 <= 31,60
June 37,00 1,84 14,15 9,45 9,35 1,84 14,57 10,70 10,18 1,25 1,67 2,92 3,75 -1 15,43 <= 31,60 July 12,00 10,50 11,75 10,40 9,35 10,50 12,17 11,65 10,18 1,25 1,67 2,92 3,75 -1 12,17 <= 31,60
August 1,00 56,40 13,33 13,40 4,75 7,50 10,20 13,40 5,17 8,75 11,03 1,25 1,67 2,92 3,75 -1 17,43 <= 31,60 September 32,00 44,87 3,99 3,67 4,75 14,20 9,90 3,67 5,17 15,45 10,73 1,25 1,67 2,92 3,75 -1 17,37 <= 31,60
October 45,33 39,99 4,50 4,75 14,20 9,35 4,50 5,17 15,45 10,18 1,25 1,67 2,92 3,75 -1 25,60 <= 31,60 November 56,00 16,02 4,00 14,15 7,50 16,85 4,00 14,57 8,75 17,68 1,25 1,67 2,92 3,75 -1 31,60 <= 31,60 December 41,00 10,67 4,67 9,75 9,93 11,30 4,67 10,17 11,18 12,13 1,25 1,67 2,92 3,75 -1 19,85 <= 31,60
Capital (misc costs VC/ha 000IDR) 4.907 525 668 15 1.100 246 972 25 1.110 276 992 30 40 70 90 437 6.569 <= 6.569 Solution 0,13 0,00 0,38 0,00 0,00 0,00 2,00 0,00 0,00 0,00 0,00 0,00 0,00 0,00 0,11 8,52 2,50 31.386

200 Appendix
Appendix VIII: Overview of Ratings of all Topics in Focus Groups
Langko Kapiroe Salua Wuasa DM V DM V DM V DM V B A B A B A B A B A B A B A B A
Institution 3 3 3 1 -2 1 -2 1 2 3 1 2 -1 1 -1 1 Participation 3 3 -1 1 1 2 -1 1 . . 1 2 -1 1 -2 1 Education 2 3 1 2 1 2 -1 1 1 3 -2 -1 . . -2 2 Monitoring 2 3 -2 2 -1 1 -1 1 2 3 1 2 -3 1 1 2 Preservation 2 3 2 1 2 2 -1 -1 1 -1 3 1 -2 -1 3 2 Resource Extraction 2 3 -2 1 -1 1 -2 1 1 3 1 2 -3 1 -2 1 Rattan 3 3 2 1 -2 -1 -2 1 -1 2 . . -1 2 . . Cacao 2 2 3 3 . . . . 1 -1 2 -1 1 -2 . . Environmental Impact 1 2 3 -2 -1 -1 2 1 -1 3 2 3 3 -3 3 2 Economic . . -2 2 . . 2 1 . . . . 2 2 1 1
DM= Decision Makers, V= Villagers; B= Before, A= After
Related Documents


