Volume 3 Number 39 Carbon dioxide production in soils and carbon and nitrogen changes in soils variously treated Article 1 February 1916 Carbon dioxide production in soils and carbon and nitrogen changes in soils variously treated R. S. Poer Iowa State College R. S. Snyder Iowa State College Follow this and additional works at: hp://lib.dr.iastate.edu/researchbulletin Part of the Agriculture Commons , Agronomy and Crop Sciences Commons , Bacteriology Commons , and the Soil Science Commons is Article is brought to you for free and open access by Iowa State University Digital Repository. It has been accepted for inclusion in Research Bulletin (Iowa Agriculture and Home Economics Experiment Station) by an authorized editor of Iowa State University Digital Repository. For more information, please contact [email protected]. Recommended Citation Poer, R. S. and Snyder, R. S. (1916) "Carbon dioxide production in soils and carbon and nitrogen changes in soils variously treated," Research Bulletin (Iowa Agriculture and Home Economics Experiment Station): Vol. 3 : No. 39 , Article 1. Available at: hp://lib.dr.iastate.edu/researchbulletin/vol3/iss39/1

Welcome message from author
This document is posted to help you gain knowledge. Please leave a comment to let me know what you think about it! Share it to your friends and learn new things together.
Transcript
Volume 3Number 39 Carbon dioxide production in soils andcarbon and nitrogen changes in soils variously treated
Article 1
February 1916
Carbon dioxide production in soils and carbon andnitrogen changes in soils variously treatedR. S. PotterIowa State College
R. S. SnyderIowa State College
Follow this and additional works at: http://lib.dr.iastate.edu/researchbulletin
Part of the Agriculture Commons, Agronomy and Crop Sciences Commons, BacteriologyCommons, and the Soil Science Commons
This Article is brought to you for free and open access by Iowa State University Digital Repository. It has been accepted for inclusion in ResearchBulletin (Iowa Agriculture and Home Economics Experiment Station) by an authorized editor of Iowa State University Digital Repository. For moreinformation, please contact [email protected].
Recommended CitationPotter, R. S. and Snyder, R. S. (1916) "Carbon dioxide production in soils and carbon and nitrogen changes in soils variously treated,"Research Bulletin (Iowa Agriculture and Home Economics Experiment Station): Vol. 3 : No. 39 , Article 1.Available at: http://lib.dr.iastate.edu/researchbulletin/vol3/iss39/1

Research Bulletin No. 39 February, 1916
Carbon Dioxide Production in Soils and Carbon and Nitrogen Changes
in Soils Variously Treated
By R. S. Potter and R. S. Snyder
AGRICULTURAL EXPERIMENT STATION
IOWA STATE COLLEGE OF AGRICULTURE AND
MECHANIC ARTS
AGRONOMY SECTION
Soil Chemistry & Bacteriology
AMES, IOWA


TABLE OF CONTENTS
Page INTRODUC'rION
Outline of scope of bulletin ........................... 253
HISTORICAL
Review of results of previous investigations ........ . .... 253
I,OSS OF NITROGEN
Review of results of pl'evious investigations .... . ...... . . 264
VOLATILIZATION OF AMMONIA FROM SOIL
Review of results of previous investigations ............. 265 ,
Ammonia and nitrate transfol'mation ... . .............. 266
EXPEIUMEN'l'AL WORK
The carbon dioxide of the humus plot soils in the field .... 267
The carbon dioxide of the humus plot soiis in the labora-tory ... . ................... . ... . . . ................ 271
Discussion of results of field and laboratory tests of soils from humus plots ................................ . . 276
Conclusion of field and laboratory results .... . .......... 286
Carbon and nitrogen changes in soil treated with lime, ammonium sulfate and sodium nitrate ..... . ...... . ... 287
Methods of analysis . ...... . ... . ...................... 288
Conclusions ........... . ..... . .............. . .... . ... 296
t 'arbon and nitrogen changes in soils treated with lime and various amounts of stable manure ..... .. ........ 297
Conclusions . ..... . .. ........................... . ... . 305
B I BLI OG RAPHY ............ . ....................... 306


CARBON DIOXIDE PRODUCTION IN SOILS AND CARBON AND NITROGEN CHANGES
IN SOILS VARIOUSLY TREATED By R. S. Potter and R. S. Snyder".
The carbon dioxide of the soil atmosphere, along with the water, has long been recognized as the most active agent in the decomposition of comparatively inert minerals to give available and soluble plant food material. It is probable that herein lies the great benefit which comes from the application to soil of organic material which not only increases the energy material easily available for the bacteria, but also improves the physical eondition of the soil. This in turn increases bacterial activity, which gives rise to increased carbon dioxide production.
At the Iowa Agricultural Experiment Station, for some time past, both in the laboratory and in the field, determinations have been made of the carbon dioxide of the soil atmosphere or of the carbon dioxide evolved by soils. These experiments have been earried out with the primary object of obtaini.ng information as to the rate of decomposition of the soil or of organic matter added to the soil, under various conditions ·alld treatments.
In this paper attention will be confined mainly to the production of carbon dioxide by soils and its measuremcnt. J.Jittlc will be said concerning its effectiveness as an agent ror rellllering plant foods available.
HISTORICAL.
SOlL CARBON DJ()XIDg.
The first recorded measurements of the carbon dioxi.de of the soil atmosphere were made by Boussingault and Lewy (2) in 1852. A tube was sunk about 35 cm. into various soils, and from 2% to 10 1. of air were drawn from the soil thru barium hydroxide solution and the barium carbonate weighed. In a field recently manured, the carbon dioxide ran 2.77 % by volume and after three days of continuous rain, 9.78 % . In this latter sample, there were 10.35 % of oxygen. Since 0.04% carbon dioxide was found in atmospheric air, it is probable that these results were somewhat too high. The results of many analyses :showed from 0.247 to 9.78 % carbon dioxide and in general the sum of the carbon dioxide and oxygen was equal to about 20.5 % . Without studying the effects of temperature and moisture, it was
"The a uthors wish to express the ir apprecia tion for the sugges tions given by Dr. P. E. Brown in conducting this investigation. The ir tha l!ks a re also due to Mr. T . H. Benton for his aid in the field carb on ?Ioxld~ experiment; all the samples of soil air were drawn a nd a na ly>.cQ. by hIm.
-254-
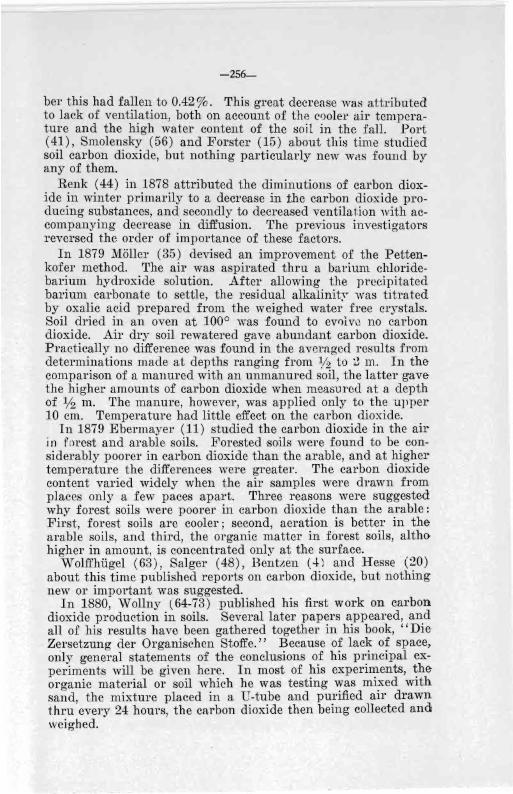
concluded that in general high organic content of a soil was accompanied u~, an increase in carbon dioxide.
In 1870, Petersen (37) investigated soils in the laboratory for their carbon dioxide producing power. He used a method which he ascribed to Franz Schulze (53), but which was very similai' to that probably originally proposed by Dalton (9) and reviverl by Pettenkofer (38) for usc in the determination of the carbon dioxide in atmospheric air. The results obtained cannot be said to represent typical conditions, for the soil was always carefully ground and then mixed with sea sand. From 20 to 30 g. of a poor clay soil containing 1.8 % organic matter were placed in com bustion tubing, purified air was drawn thru at the rate of one liter per hour and the resulting carbon dioxide determined. In one case 1.2 % calcium carbonate was used and no lime in the other. In 16 days the unlimed soil gave 14.89 mg. carboil dim:ide, using 21.7 g. soil. The 9.36 mg. of carbon dioxide from the limed soil on the first da~' was assumed to be from the calciu'm carbonate. Both the limed and the unlimed soils gave more carbon dioxide at first, which was attributed to absorbed carbon dioxide being displaced by the purified air. In another experiment, ~ 7.8 g. of a soil containing 58% humus was mixed with 3% lime. and the carbon dioxide produced in 16 days was 244.7 mg. A similar sample, unlimed, gave 44:.67 mg. in the same time. Using the same soil, 20.6 g. of soil gave 4:7.2 mg. carbon dioxide in 16 days, while 181.12 mg. was evolved from a similar cample containing 1 % of lime. Since the soil was still acid, probably all the calcium carbonate had been decomposed, which, if true, would account for 90.6 mg. carbon dioxide. This would leave 90 mg. carbon dioxide from the decomposition of the organic matter, a decided increase over that from the unlimed soil.
CARBON DIOXIDE OF SOIL ATMOSPHERE.
Pettenkofer (39, 40) then took up the problem of the carbon dioxi.de in the soil atmosphere. A shaft 4: m. in depth was dug and five lead tubes inserted, the lower ends of which wCI'e at depths ranging fl'om 4: lll . to 2/3 m. After 'refilling the shaft, several determinations were made each month, for two years of the percentage of carbon dioxide in the soil air, 14 to 18 1. of ail' being dra wn thru barium hydroxide in 2% to 3 hours. In general, more carbon dioxide was found in the lower layers than in the upper. Also, more carbon dioxi.de was found in summer than in winter, the average of the months of December, January. February and 1\1arch, 1871-1872, being 0.39 % carbon dioxide and for June, July, August and September, 1872, 1.20 % . An average of 0.67% carbon dioxide was found for the first year and 1.18% for the second, no marked difference in the weather bei.ng noted. The lower amounts of carbon dioxide 'in the upper layers

·255 ..
was attributeu tu iucreased loss by Jiffusioll [LUU \'()Iltilatioll. The, higher amounts in summer were due not only to the greater evolution of carbon dioxide, but also to diminished diffusion and ventilation, the soil being cooler than the air above it. 'rhe reverse was true in late fall and winter. 'rhe carbon dioxide in the soil atmosphere Pettenkofer attributed to living organisms and he believed the amount to be .the balance left after the evolution of the carbon dioxide by the animal organism and its absorption by plant-like organisms.
OTHER STUDIES OF SOIL CARBON DIOXIDE.
Fleck (13) continued work on carbon dioxide of the soil atmosphere, using precisely the same methods as Pettcnkofer, and in general very similar results were obtained. The oxygen was determined in many cases and the sum of the carbon dioxide and the oxygen was found to be fairly constant, from which fact the carbon dioxide was attributed to oxidation processes.
Lewis and Cunningham (31), working in India, found that the carbon dioxide always increased to a maxinllun with the rainfall and soon fell to a minimum after the rain was over.
Fodor (14) then took up the work, following Pettenkofer 's methods closely. The chief deviation which he made was that a narrow tube w·as used, which was driven into the soil, and hence causing less disturbance of the soil. Also only a small amount of air was drawn for each analysis.' Oxygen and carbon dioxide
. were both determined, and it was found that the sum of the yolumes of the two ,"as 20.87 %. Fodor likewise interpreted this to mean that the carbon dioxide arose from oxidation processes. The carbon dioxide was not always greater where the organic matter was high, and it was concluded that the permeability of the soil was of more inituence. Moisture was found to be an unimportant factor. The barometric pressure had an unmistakable influence on the carbon dioxide, even at a depth of 4 m. In general the curve showed that a fall of pressure was accompanied b,- a rise in carbon dioxide. The movement of gas in soil was il~vestigated by putting carbon monoxide in the soil air and then anal~-zing for this at various times later at different contiguous points. Air pressure, the velocity and direction of the wind and rain all had an influence upon the gas transference. It was estimated that in one year enough carbon dioxide was evolved by a giv'en area of soil to account for the usual carbon dioxide content of a column of air above the area 159.5 m. in height . Ther efore, most of the carbon dioxide of the air was believed to come from the soil.
The n ext work along these lines was published in 1875 by an Amrrican, W. Nichols (36) . In soil highly manured, in June, 1.fl31};" carbon dioxide was found, in July, 1.58 % and ill N OYCl1l-
-256-
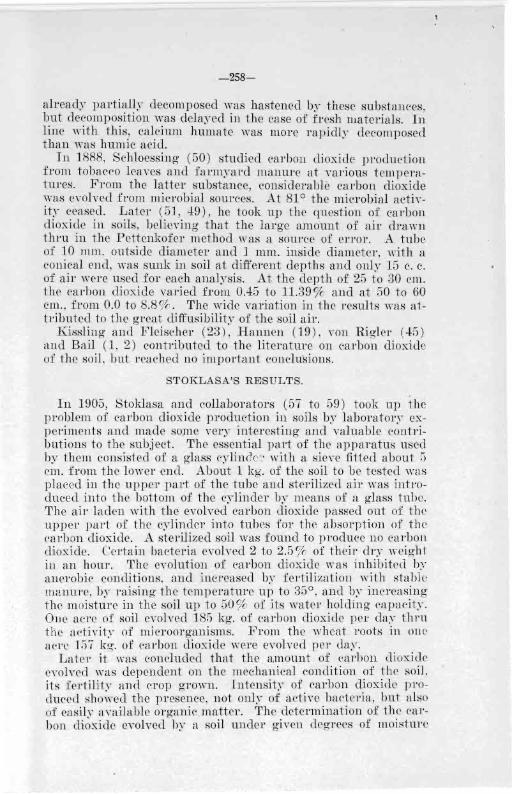
bel' this had fallen to 0.42%. This great decrease was attributed to lack of ventilation, both on account of the ('()oler air tempcrature and the high water content of the soil in the fall. Port (41), Smolensky (56) and Forster (15) about this time studied soil carbon dioxide, but nothing particularly new Wc!S found by any of them.
Renk (44) in 1878 attributed the diminutions of carbon dioxide in winter primarily to a decrease in the carbon dioxide producing substances, and secondly to decreased ventilat.ion with accompanying decrease in diffusion. The previous investigators reversed the order of importance of these factors.
In 1879 Moller (35) devised an improvement of the Pettenkofer method. The air was aspirated thru a barium chloridebarium hydroxide solution. After allowing the pl'ceipitated barium carbonate to settle, the residual alkalinit:, was titrated by oxalic acid prepared from the weighed water free crystals. Soil dried in an oven at 1000 vms found to eV01vo no carbon dioxide. Air dry soil rewatered gave abundant carbon dioxide_ Practically no difference was found in the averaged results from determinations made at depths ranging from % -to ~ m. In the comparison of a manured with an unmanured soil, the latter gave the higher amounts of carbon dioxide when measured at a depth of % m. The manure, however, was applied only to the upper 10 cm. Temperature had little effect on the carbon dioxide.
In 1879 Ebermayer (11) studied the carbon dioxide in the air in forest and arable soils. Forested soils were found to be considerably poorer in carbon dioxide than the arable, and at higher temperature the differences were greater. The carbon dioxide content varied widely when the air samples were drawn from places only a few paces apart. Three reasons were suggested why forest soils were poorer in carbon dioxide than the arable: First, forest soils are cooler; second, aeration is better in the arable soils, and third, the organic matter in forest soils, alth(} higher in amount, is concentrated only at the surface.
Wolffhiigel (63), Salger (48), Bentzen (4) and Hesse (20) about this time pnblished reports on carbon dioxide, but nothing new or important was snggested.
In 1880, W ollny (64-73) published his first work on carbon dioxide production in soils. Several later papers appeared, and all of his results have been gathered together in his book, "Die Zersetzung del' Organischen Stoffe." Because of lack of space, only general statements of the conclusions of his principal experiments will be given here. In most of his experiments, the organic material or soil which he was testing was mixed with sand, the mixture placed in a U-tube and purified air drawn thru every 24 hours, the carbon dioxide then being collected and weighed.

-257-
In experiments with horse manure and sand, mixtures contain ing the larger amount of the manure gave increased carbon dioxide up to a certain limit, beyond which little effect was fonnd. This was attributed to the antiseptic properties of carbon dioxide.
Grinding peat increased its rate of decomposition, while similar grinding had little effect upon pea straw. Steamed leather and horn meals gave off carbon dioxide more rapidly than thR raw materials. Fresh manures were more rapidly decomposer] than old. The leaves, stalks and roots of legumes were found tl, be more quickly decomposed than the corresponding parts of nonlegumes.
Horse manure treated separately with mercuric chloride, thymol, phenol and heated for six hours at 1150 gave off comparatively little carbon dioxide, showing that most of the carbon dioxide arose from the activities of micro-organisms.
Peat and soil after boiling with 1 % hydrochloric acid gave off much less carbon dioxide than the untreated materials, due to a removal of mineral matter. Nutrient solutions added to mixtures of rye straw and sand and of peat and sand increaHed cal~· bon dioxide production.
CONCLUSIONS FROM WOLLNY'S EXPERIMENTS.
As the result of investigations on a large number of materials, W ollny drew the following broad general ocncIusions: Animal materials are more easily decomposed than vegetahle. Materials containing higher percentages of nitrogen are morc easily decomposed than those with a lower content.
From experiments in which various mixtures of oxygen and nitrogen were passed over organic material and soil, it was concluded that the intensity of the decomposition processes varied roughly with the quantity of available oxygen. Th e formation of carbon dioxide took place in the. complete absence of oxygen , but in a relatively lessened degree. Ozone in some cases cau8er:! an increase in carbon dioxide production and in others a tlecrease as compared with air, due probably to the antiseptic action of the ozone. Increase of temperature and moisture up to certain limits increased carbon dioxide production. Neither direct nor alternating currents of electricity had any effect on decomposition processes.
In experiments with various chemicals, it was found that the mineral acids decreased carbon dioxide production somewhat in proportion to their strength. Small amounts of potassium hydroxide increased carbon dioxide production, while larger amounts . caused a decrease, due probably to absorption of the gas. Alkali carbonates caused an increase. In experiment;; with calcium hydroxide and carbonate, the degradation of material
-258-
already partially decomposed was hastened by these substances, but decomposition was delayed in the case of fresh materials. In line with this, calcium humate was more rapidly decomposed than "'as humic acid.
In 1888, Schloessing (50) studied carbon dioxide production from tobac('o leaves and farmyard manure at various temperatures. From the latter substance, considerable carbon dioxide was eyolved from microbial sources. At 81 ° the microbial activit~" ceased. Later (5],49), he took up the question of carbon dioxide in soils, believing that the large aJllount of ail' drawn thru in the Pettenkofer method was a source of error. A tube of 10 mm. outside diameter and] mm. inside diameter, with a conical end, was sunk in soil at different depths and only 15 c. c. of air were used for each analysis. At the depth of 25 to 30 cm. the carbon dioxide varied from 0.45 to 11.39 % and at 50 to 60 cm., from 0.0 to 8.850. The wide variation in the results was attributed to the great diffusibility of the soil air.
Kissling and F leischer (23), Hannen (19 ), von Rigler (.J.5) and Bail (1, 2) contributed to the literature on caJ'bon dioxide of the soil, but reuched no important conclu·sions.
STOKLASA'S RESULTS.
In 1905, Stoklasa and collaborators (57 to 59) took up the problem of carbon dioxide production in soils by laboraton" expeJ'iments and made so)ne very interesting and valuable contributions to the subject. The essential part of the apparatus used by them consisted of a glass cylindc·.> with a sieve fitted about 5 cm. from the lower end. About 1 kg. of the soil to be tested was placed in the upper part of the tube and sterilized air was introduced into the bottom of the cylinder by means of a glass tube. The air laden with the evolved carbon dioxide passed out of the upper part of the cylinder into tubes for the absorption of the carbon dioxide. A sterilized soil was found to produce no carbon dioxide. Certain bacteria evolved 2 to 2.5 % of their dry weight in an hour. The evolution of carbon dioxide was inhibiteu b~' anerobic conditions, and increased by fertilization with stable manure, by raising the temperature up to 35°, and b~' increasing the moisture in the soil up to 50% of its water holding capacit~· . One acre of soil evolved 18f) kg. of carbon dioxiue pel' day thru the activit.,· of microorganisms. 1<'rom the wheat roots ill Oll e acre 157 kg. of carbon dioxide were evolved per day.
Later it was concluded that the a.mount of carbon dioxiuc evolved was dependent on the mechani.cal condition of the soil, its fcrtility and crop grown. Intensity of carbon dioxide produced showed th e presence, not only of active bacteria, but also of easily available organi.c matter. The determination of the carbon dioxide evolved by a soil under given degrees of moisture
-259-
and temperature in a certain length of time was believed to furnish a reliable and accurate method of determination of the bacterial activity. 'fhe most active respiration took p lace in neutral or slightly alkaline soils, wellsll.pplied with easily available 01"
ganic and inorganic material. R Lau (26) then studied carbon dioxide in field soils, but he
found nothing particularly new. Soil was richest in carbon dioxide in summer and poorest in " 'inter, poorest in carbon dioxide at 2 :00 a. m. and richest at 2 :00 p. m. Sandy soils contained the l east amount of carbon dioxide and moor soils most. Carhon dioxide yaried with the humus content and physical condition of the soil. Such plants as potatoes, having a high rate of transpiration. gave more carbon dioxide than plants whose rate of transpiration was low. .
In 1904 and 1910, Sewerin (5J, 55) determined the carbon dioxide evolved from cultures in solutions and from soil vari(jusly treated. Soil to the amount of 1100 gr. was placed in Erlenmeyer flasks and a slow stream of air was passed over it, and the carbon dioxide determined every five days. Contrary to Stokla1la's results, considerable carbon dioxide was given off by sterilized soils. For exa,mple, a garden soil containing carbonate and sterilized by heating in the autoclave one hour at two atmospheres, gave in 60 days 0.367 J gr. carbon dioxide and a similar sample of soil sterilized and reinoculated gave 4.3J9J gr. carbon dioxide. At least part of the carbon dioxide from the sterile soils was believed to be released during the sterilization by the heat. In general, from 10 to 20 times as much carbon dioxide came from the sterilized and reinoculated soil. The maximum carbon dioxide production in the reinoculated steri lized soils took place in the period from the fifth to the t\yelfth da~·s.
METHODS OF VAN SUCHTELEN,
In 1910 Van Surhtelen (62) measured the carbon dioxide evolyed by soils under laboratory conditions. Two methods were emplo~-ed . In the fiest, 1 kg. of sand was placed in an 8 liter flask and covered by a 6 kg. of soil. The tube for the entrance of the ail' reached thl'U the soil down into the sand. The other apparatus was much like that previously used by Stoklasa, except that a sample could be taken directly without disturbing the soil in any way. It consisted simpl~r of a metal tube 30 cm. long by 8 em. in diameter, open at both ends with a suitable sieve to hold the soil in place and a side tube for the entrance of air to be used for sweeping out the carbon dioxide. It held about 1.8 kg. of soil. 'fo test the efficiency of this tube, six samples were taken from an aI'ea of soil 40 cm. square and the amounts of carbon dioxide in ,mg. evohed by each sample under the same conditions was determined. The results in mg. of carbon dioxide were 81 ;

-260-
43; 49; 54; 33; 30. In spite of these wide differences, the author believes that by this tube the most nearly typical figures for carbon dioxide are obtainable. By this method it was found that sieving a soil increased the carbon dioxide production over the unsieved in the ratio of 100 to 177. The amount of carbon dioxide developed was increased by the amount of air passed thru the soil. For instance, when air at the rate of 8 1. per hour was passed thru 6 kg. of soil mixed with 3 gr. dextrose, 24 mg. of carbon dioxide was evolved in the first six hours, while 134 mg. of carbon dioxide was given off when air was forced thru a similar mixture at the rate of 48 1. per hour. In the next 12 hours, the carbon dioxide evolved was 139 mg. and 522 mg., respectively. It was not until the sixth period of 12 hours that carbon dioxide given off from the soil with the slower stream of air caught up with the one with the faster stream. In that period ;nu mg. was evolved from the former and 194 mg. from the latter. It was then shown that there was a gradual decrease in carbon dioxide from a soil up to six days, 55 mg. being given the first day, and 27 mg. the sixth day. When air was passed thru 1.8 kg. soil at the rate of 8, 16 and 32 1. per 12 hours, 7, 13 and 20 mg. of carbon dioxide, respectively, were given off.
EFFECT OF WATER CONTENT.
Studying the effect of the water content of soil whose complete water capacity was 20% , it was shown that in 5 days, using 6 kg. of soil with 6 % water, 18.5 mg. of carbon dioxide vvere given; with 15 %, 208 mg., and with 18%, 115 ;mg. The same soil, to the amount of 6 kg. was mixed with 3 gr. dextrose, in a five days' test gave with 10% water, 300 mg.; with 13%,771 mg., and with 16 %, 740 mg. In 24 hours at 4.4 % moisture content with 6 kg. of soil mixed with 3 gr. dextrose, 1 mg. of carbon dioxide was given, while without dextrose 0.8 mg. was evolved. At 7.5% moisture content with dextrose. 253 mg. carbon dioxide were evolved, and without dextrose, 87 mg. 6 kg. of soil previously frozen gave 16.5 mg. carbon dioxide the first day, which amount gradually decreased to 4 ..mg. on the sixth day. 6 kg. of the same soil, under like conditions, but not previously frozen, gave 52.5 mg. carbon dioxide the first day and 28 mg. the sixth. Ammonium sulfate added to the soil at the rate of 0.1 gr. nitrogen per 100 gr. soil increased carbon dioxide production nearly fivefold. 0.1 gr. superphosphate per 100 gr. soil doubled the carbon dioxide production. Magnesium sulfate increased carbon dioxide production nearly three-fold. Treatment of soil with carbon disulphide at first greatly lowered the carbon dioxide production, which later greatly increased. In sixteen days the ratio of the carbon dioxide from the carbon disulphide treated soil to that from the untreated was 7.2 to 6.0. At first much more carbon
-261-
dioxide was developed fro,m soil taken from the upper surfaces than from the deeper parts, but later, due to aeration, this difference was not apparent. Van Suchtelen finally concluded that the comparison of the carbon dioxide production of different soils furnishes a better means for the estimation of their relative bacterial activity than their bacterial content.
RIDSULTS ON WISCONSIN DRIFT IN IOWA.
In 1911 Jodidi (22) published the results of some field determinations of carbon dioxide carried out at the Iowa Agricultural Experiment Station in 1910. In order to draw the sample of air from the soil an iron tube %" inside diameter and 12" long, with its lower end drawn out to a point and the periphery of its lower two inches perforated with 12 small holes, was sunk into the soil. Both carbon dioxide and oxygen were determined iIi an Orsat apparatus provided with a 100 c. c. burette, whose finest graduation was 0.1 c. c. , thus permitting the determination of the percentage of either carbon dioxide or oxygen to 0.1 %. Deter,minations were made on several days in April, May, June, July and August on 22 plots located side by side on the Wisconsin drift area.
The following general conclusions were drawn: 1. Increase of moisture and temperature (as well as tillage opera
tions) was followed by more rapid decomposition of the organic m-atter in all of the plots herein investigated.
2. While owing to a variety of conditions obtaining in the plots there is a difference in the rapidity with which the organic matter in them decomposes, it is especially marked in the case of plot B, which though with a high humus content shows the lowest percentage of carbon dioxide in the soil atmosphere. It seems fairly reasonable to ascribe it in part to the inert nature of the peat with which it was annually treate.d.
LIDMMERMAN'S INVESTIGATION.
In 1911 Lemmermann (27, 28) and associates published the report of an extensive investigation on the action of calcium oxide and calcium carbonate on the production of carbon dioxide in soils. One kg. of the soil was mixed with the materials to be added and placed in a flask whose volume was about twice that of the apparent volume of the soil. Ten liters of purified air were passed for a short time daily thru the soil and the carbon dioxide collected and weighed.
In the first experiment, when 0.1 %, 0.5 % and 1.0 % calcium oxide, or its equivalent of CaC0 3, were added to the soil,it was shown that 0.1 % CaO increased the carbon dioxide very s1ightly, while 0.5 and 1.0 % decreased the carbon dioxide considerably, altho no doubt much was fixed by the excess lime. All treatments of calcium carbonate increased the carbon dioxide, the greater applications somewhat the more. The authors were of the opinion that none of the carbon dioxide came from the cal-
-262-
eium carbonate, but believed that the lessee increases for the heavier applications were due to combinations of the carbon dioxide with the calcium carbonate. In the next series 15 gr. of fresh horse manure were mixed with 1 kg. of soil and the same applications of calcium oxide and calcium carbonate made as above. No unmanured soils 'were used. The results showed that with 0.1 % and 1.0% calcium oxide, when the amount of carbon dioxide theoretically bound by the calcium oxide used was taken into account, increased carbon dioxide was given. With 0.5 % application, there was a decrease. In all cases, the carbonate gave an increase. In a similar experiment, using finely cut leaves from rye, 0.1 % oxide and an equivalent amount of carbonate gave increased carbon dioxide production, but all other applications gave decreases. In the next, using 10 gr. of all' dry peat with similar applications of lime, 0.1 % calcium oxide gave an increase, but all other applications gave decreases. 0.1 % oxide was the only application which gave an increase when 25 gr. of finely cut mustard leaves were used.
DETERMINE DECOMPOSITION OF ORGANIC MATTER.
The decomposition of the organic matter was then determined by analysis of the soil and added materials for carbon before and after the experiment. The combustion method according to Dennstedt was used. The first expei'iment was carried out with a sandy and a humus soil, using 1 kg. in each test. Some pots were manured with 15 gr. of fresh lucern and some with the dried material. ']'0 some of the pots 0.1 % to 1.0 % calClUm oxide was added. Kainit and superphosphate were also used in a few cases. The experiment ran eight weeks. Each soil with nothing added lost no carbon, while with 0.5% calcium oxide an appreciable quantity was lost. From the sandy soil, using the fresh lucern, 60.12% of the carbon from the green manure was lost, while from the pot receiving the dried lucern, 62.75% of the carbon was lost. Using fresh lucern, the pot with 0.1 % calcium oxide, 61.71 % of the carbon of the lucern was evolved, and with 0.5 % calcium oxide, 85% of the carbon. With 1.0% calcium oxide, more carbon was lost than was contained in the lucern. With the kainit, 60.98 % of the carbon of the green manure was lost, and with kainit and superphosphate, 56.04 % of the carbon, and with the dry lucern, 46.34 % of the carbon of the added ma'terial were lost. . The second experiment of this series was similarly planned, except that lupine 'was the green manure used. Stall manure was used and the green manure and stall manure were also applied in combination. Calcium carbonate was added to some of the pots. The experiment ran eight weeks. The untreated soil lost 1.24 % of its carbon, and the limed soil 15.36 % . Where the lupine was applied in the surface soil 72.33 % of its carbon was

-263-
lost and when applied in the lower layers 73.57 % was lost. 32.76% of the stall manure's carbon was lost when applied to the surface and 36.12% was lost when applied deeply. 'When the stall manure was added with the green manure, 52.40% of their carbon was lost. In the computation of the loss of carbon from the limed soils evidently the soils were analyzed for carbonate carbon, which was deducted. The method used for this carbonate carbon is not given ,and h~nce reserve must be exercised in interpreting the data.
In work published in 1911-1912, Hutchinson (21) concluded that the determination of the carbml dioxide production is a reliable measure for the bacterial activity of a soil, that the opti~num moisture content of a soil may be determined by this method and that it is possible to determine the optimum application of lime and superphosphate to promote decomposition oj' green manure, oil cake, etc.
LITERATURE PUBLISHED IN 1915.
In the year 1915, there were several publications on the carbon dioxide of soils. Russel and Appleyard (47) measured the carbon dioxide, oxygen and nitrates in the soil of various plots at Rothamsted, thruout most of the months of 1913 and 1914. They found that soil air contained on an average 0.25 % carbon dioxide and 20.6% oxygen by volume. It showed much greater fluctuation in composition than atmospheric air . Besides the free air there are gases dissolved in the water and colloids of the soils, whose composition does not correspond to that of the free ail'. This is mainly carbon dioxide and nitrogen and very little oxygen. 'l'he fiuctuations in composition of the free soil air wcre mainly due to fluctuations in the rate of the biochemical changes in the soil, the curves being similar to those showing the amounts of nitrate and the bacterial count. The rate of biochemical acti\"ity attained a maximum in late spring and again in autumn, and minimum values in summer and winter. From November to May the cunes followed closely those for the soil temperature. From Mav to November they followed rainfall and to a less extent the soii moisture curves .. The dissolved oxygen brought in by rains was an important factor in facilitating biochemical change.
Grass land usually contained more carbon dioxide than arabh' land, but the differences wcre not attributed to the crop, owing' to the large differences in soil composition and conditions. No eyidence was obtained that the growing crop markedly increased carbon dioxide in the soil ail' , and if it gave rise to an~T great evolution of carbon dioxide in the soil it probably caused a COl'l'csponding inhibitory effect in the activities of soil bacteria. Wind Yelocity, barometric pressure, variation of temperatul'e hom the mean, small rain fall, cte., Rcelllcd to havc hut lttle effect on thc soil atmospllCl'C.
-264-
In this same year Fred and Hart (17) carried on some laboratory tests upon carbon dioxide production in soils. One kg. of soil, with its added materials, was placed in a two-liter Erlenmeyer suction flask, the proper amount of water added and air was drawn thru each day for 12 days for a period of 10 minutes and the carbon dioxide in the withdrawn air determined. The addition of mineral fertilizers to soils caused an increase in carbon dioxide production and bacterial numbers. Calcium sulfate gave a slight increase in carbon dioxide evolution. The addition of ammonium sulfate to soil caused an enormous increase in carb.on dioxide production. Magnesium and potassiu,m sulfate increased carbon dioxide production from soil. It was believed that mineral fertilizers might be beneficial to soil, partly by causing increased bacterial activity.
WORK OF FRAP.
In October, 1915, Fraps (16) published an account of work done upon the production of carbon dioxide in the laboratory. Soil to the amount of 500 gr. was mixed with the organic material and water and placed in a precipitating jar, which was then placed in an air-tight vessel and purified air driven thru at various intervals and the carbon dioxide absorbed and weighed. The experiments were run for various lengths of time. In one day 10% of cottonseed meal was oxidized, 30% in four days. In the first week 10.1 % of manure and 8.8% corn cobs were oxidized. Oxidation decreased rapidly after the first week. "Humic acid" was very resistant to oxidation. The relative powers of the soil to oxidize excrement varied comparatively little with most of the soils tested. There were decided differences in the oxidation of the carbon of various soils. In general the soils containing the least nitrogen appeared to carry their carbon in a more easily oxidized form. When dry, soils oxidized organic matter rapidly. Carbonate had little or no effect upon oxida tion in the soils tested.
Altho the study of the carbon dioxide producing power of soils is the main purpose of this paper, yet some of the factors were observed having no apparent direct connection therewith. A brief resume of only the more important papers pertaining to these factors will follow.
LOSS OF NITROGEN.
There are on r ecord but few reports of carefully controlled pot experiments showing the effect of lime on the loss or gain of nitroaen. Numerous field experiments have been carried out, and ~hile in general, for practical purposes, field experiments give the more valuable data, yet it is more diff.icult to con.trol the various factors and hence any effect noted IS not certamly due to anyone variable.
-265-
In 1889 Schloesing (52) introduced into flasks eight different soils which had previously been growing legumes. The atmosphere was renewed weekly, and at the end of eleven months almost all of the soils showed a slight loss of nitrogen. In no case was there a gain of more than 0.01 gm. nitrogen per kilogram of soil.
In 1891 Berthelot (5, 6) found that clay soils when kept moist gradually lost nitrogen. He gives very few details in connection with his work.
The most important results in connection with the loss of nitrogen due to the liming of soil were obtained by Lemmermann (29, 30) and his collaborators. The general plan of their experiments was as follows: Lime was added to the soils at the rate of 0.6 per cent, 1.0 per cent and 1.2 per cent. This corresponds to 6, 10 and 12 tons per acre. Ammonium sulfate at the rate of 10 and 20 mg. per 100 gm. soil was used. Their general results and conclusions 'were as follows:
'l'here was a very slight loss of nitrogen when soils were treated with lime, the greater losses being with the higher amounts. vVith the heavier treatment of ammonium sulfate and lime there was a considerable loss of nitrogen, while with the smaller treatments, a very slight loss occurred. For practical purposes, then, the results of these investigations show that soils containing, or treated with large amounts of calcium carbonate, will lose part of their nitrogen; but, as the authors point out, such treatments as they have used will but seldom be used in practice. The method by which a loss of nitrogen was detected was simply the determination of the total nitrogen of the soil before and after incubation. Because of the slight differences necessarily dealt with, extr~mely accurate work was necessary. The above investigators used in all cases the average of eight nitrogen determinations. It is shown in the experimental part of this paper that soil treated with three tons of lime and one-half ton of ammonium sulfate per acre lost an appreciable quantity of ammonia nitrogen, yet not enough to be detected by total nitrogen determinations,.
VOLATILIZATION OF AMMONIA FROM THE SOIL.
Berthelot (5 , 6) placed moist soil in pots under bell jars in such a manner that the water which condensed on the bell jar ran into receiving vessels. The liquid thus collected was analyzed for ammonia by distillation with magnesia, and the residue was analyzed for total nitrogen. Plants were grown in some of the pots. The soil alone gave off a very small amount of am.monia and other nitrogen compounds. Still less nitrogen in the form of ammonia and other compounds was collected from the jars with the plants.

-266-
'l'akeuehi (61) carried out an interesting and significant experiment relative to the loss of ammonia when ammonium sulfate is in contact with lime. Pure ammonium sulfate and lime were mixed with varying amounts of water. A current of air was passed thru the mixture and then into standard acid. At room temperature but a trace of ammonia was given off.
Hall and Miller (18) found that soils absorb a very small amount of ammonia from the atmosphere. Also more ammonia was collected in vessels containing acid when placed over fields recently manured with ammonium sulfate and chloride than when placed over untreated plots. They state that in all their tests it was found impossible to keep the dust from accumulating in the acid vessels, so it appears possible that the increase of ammonia ,might have been due to the higher content of ammonia in the dust from the ammonia treated plots.
Ehrenberg (12) found that when large quantities of ammonium sulfate and calcium oxide were applied to soils, there was a considerable volatilization of ammonia, which seemed to be influenced by the wind. It was found in the same year that lime might even increase the power of the soil to absorb am,monia. In the following year it was found in other experiments that lime increased the rate of evaporation of ammonia from soils, and decreased it with others. The procedure by which these results were obtained was to mix the soil with the lime and the" pass air through the mixture.
It is thus seen that the data in regard to the action of lime relative to the evaporation of ammonia from the soil are very conflicting. None of the work thus far done has shown absolutely whether or not ammonia, as such, volatilizes from the soil . alone and under the application of normal amounts of lime.
Ammonia and Nitrate Transformation.
The voluminous literture in connection with this phase of the subject will not be gone into here as this investigation was not planned primarily to add .anything new to the existing data on the subject. Such data as were taken have been mainly to correlate with the other results.
-267-
EXPERIMENTAL
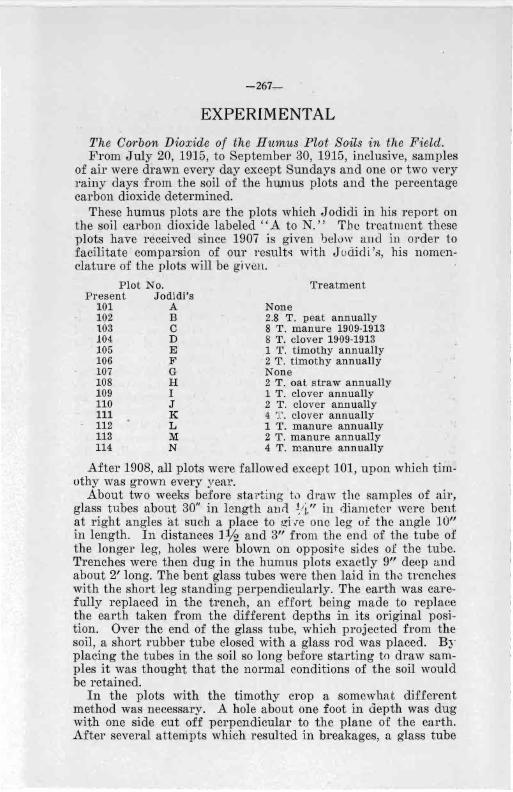
The Corbon Dioxide of the Humus Plot Soils in the Field. From July 20, 19] 5, to September 30, 1915, inclusive, samples
of air were drawn every day except Sundays and one or two very rainy' days from the soil of the hu,mus plots and the percentage carbon dioxide determined.
These humus plots are the plots which Jodidi in his report on the soil carbon dioxide labeled " A to N." Tbe treatment these plots have received since 1907 is given bel0w und in order to facilitate comparsion of our result" with J udicIi '<'l, his nomenclature of the plots will be given.
Plot No. Present Jodidi's
101 A 102 B 103 C 104 D 105 E 106 F 107 G 108 H 109 I 110 J 111 lC 112 L 113 ~ 114 N
Treatment
None 2.8 T. peat annually 8 T. manure 1909-1913 8 T. clover 1909-1913 1 T. timothy annually
' 2 T. timothy annually None 2 T . -oat straw annually 1 T. clover annually 2 T . clover annually 4 T . clover annually IT. manure annually 2 T. manure annually 4 T . m.anure annually
After 1908, all plots were fallowed except 101, upon which timothy was grown every year.
About two weeks before starting t,) draw the samples of ail', glass tubes about 30" in length anl1 J/ l," in diamcter were bent at right angles at such a place to !.;i Ie allc leg oJ' the angle ] 0" in length. In distances 1% and 3" from the end of the tube of the longer leg, holes were blown on opposite sides of the tube. Trenches were then dug in the humus plots exactly 9" deep and about 2' long. The bent glass tubes were then laid in th0 trcnches with the short leg standing perpendicularly. The earth was carefully replaced in the trench, an effort being made to replace the earth taken from the different depths in its original position. Over the end of the glass tube, which projected from the soil, a short rubber tube closed with a glass rod was placed. By placing the tubes in the soil so long before starting to draw samples it was thought that the normal conditions of the soil would be retained.
In the plots with the timothy crop a somcwhat different method was necessary. A hole about one foot in depth was dug with one side cut off perpendicular to the plane of the earth. After several attenipts which resulted in breakages, a glass tube

-268-
closed at the end but with two holes blown in the side were driven about 8" into the perpendicular side of the hole :.)" from the surface of the soil. This glass tube was then connected to another glass tube by a rubber tube and the soil packed carefully round them.
Starting July 20 by the usual method, asing mercury, 110 c. c. samples of the soil air were drawn from each humus plot. It was the invariable practice always to start with plot 101 and then progress on up to 114. The first sample was taken at about 8 0 'clock in the morning and it took on the average, one hour and ten minutes to take all the samples. They were then brought to the laboratory and analyzed in a Winkler gas apparatus somewhat modified according to our plans by Eimer' and Amend. The burette was made to contain 100 cc. and the graduated portion was made of sufficient volume to accommodate somewhat over 2 cc. and of a length great enough to permit of graduation into 1/ 100 cc., thus permitting estimations of amounts of carbon dioxide a little over 2 % with an accuracy of .01 %. The whole burette was enclosed in a water jacket.
The humus plots used were part of tho-;:e used by Jodidi during the summer of 1910. Their soi.! is classified by the U. S. Bureau of Soils as Carrington silt hun. The topography of the plots has an unmistakable effect on the l·esults. 'rhey run in a north and south direction and lie side by side. The highest point on the series is on the south end of plot 110 and there is a gentle fan-like slope down from this point III all directions. Plots 101 and 102 are quite low, water 1>0nH~tiJlles collecting on them after heavy rains.
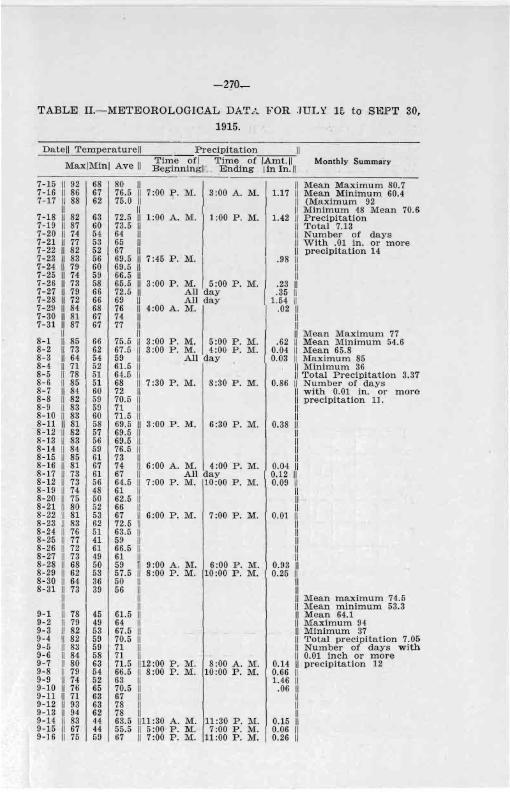
The temperature of the soil of each plot was taken at the same time each sample of air was drawn, but all of that data is not given because the temperature varies with the depth at which it is taken. In fact, these variations were greater than the variations between the plots. The temperature of t.he soils of all the plots for each day has been averaged and the results given in table 1 and plotted in plate 1.
TABLE I.-AVERAGE SOIL TEMPERATURES (F.).
Date Temp IIDate Temp IIDate Temp IIDate Temp IIDate T emp IIDate T emp
7-20 66 8 2 71.7 8-14 72.6 8-27 63.8 I 9-9 63.5 9-23 59.1 7-21 66 8-3 64.0 8-16 76.5 8-28 63.0 9-11 63.2 9-24 61.2 7-22 67.8 8-4 61.2 8-17 68.8 8-30 55.4 9-13 70.6 9-25 61.2 7-23 70.0 8-5 62.2 8-18 66.6 8-31 59.6 9-14 70.6 9-27 58.0 7-24 69 8-6 68.0 8-19 64.8 9-1 64.5 9-15 56.4 9-28 54.8 7-26 67.5 8-7 71.4 8-20 63.6 9-2 65.0 9-16 66.2 9-29 54.0 7-27 68.5 8-9 70.3 8-21 64.8 9-3 65.0 9-17 60.7 9-30 55.8 7-28 73.4 8-10 76.0 8-23 71.2 9-4 66.0 9-18 65.8 7-29 72.5 8-11 71.6 8-24 63.3 9-6 68.0 9-20 60.2 I 7-30 71.7 8-12 69.2 8-25 63.6 9-7 68.8 9-21 51.6 II 7-31 71.6 8-13 76.8 8-26 66.8 9-8 69.8 9-22 51.6
In table II are given metel'ological data taken from the records of the weather station situated here. The data and curves
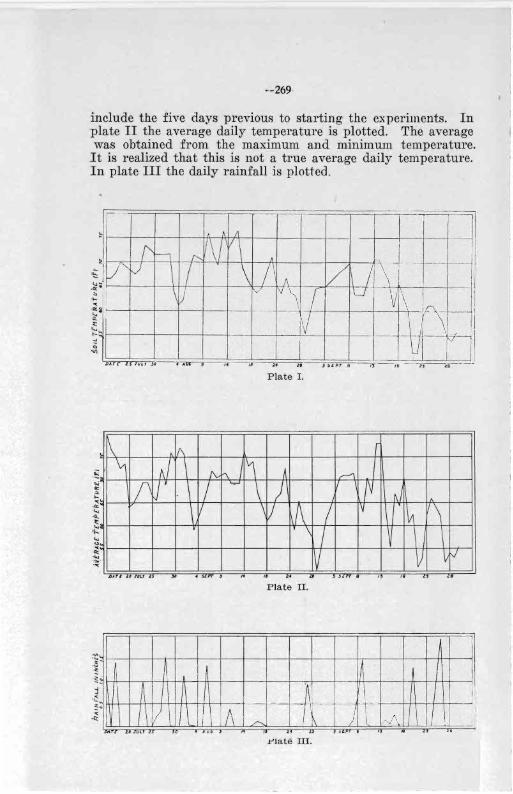
--269
include the five days previous to starting the experiments. In -plate II the average daily temperature is plotted. The average was obtained from the maximum and minimum temperature. It is realized that this is not a true average daily temperature. In plate III the daily rainfall is plotted .
-+--+li=i ~ \7 \ / A / /\ ! :~ \ U rv IV \ ( U - VI\ :" 1
~:~ .. ~~~~rn,~,,~,,~,~,w~'~'~' ~"=='~' ~~==~JS~C>T~.==~~=~~\=kI~~J Pla t e I.
1\ 1/\ r
'1 AI \ f\.. f\/ 1'1 A r4
f' U . \ / '"=-' \ ) I~ : ~
\ II \1/ \f\ / III I V\ \
,I \ I ~ \ ,
IV V ~fJ JJ~rl ;U 3 lor 2.1 ,. .. st , H " 24 -----,-. • J . ,. , .
Plate II.
--
A A ~ 1\ :)
I I /, /'-. 1 ) -J\. I DATl"""""Tr /Jl r""TJ -" 4 ~ v'" J "
, .. , " . .
J;-'la t e III.
-270~
TABLE II.-METEOROLOGICAL DA'f~'" FOR .JUL Y 1G to Sl'JPT 30,
1915.
Datell Temperaturell Precipitation II
7-15 7-16 7-17
7-18 7-19 7-20 7-21 7-22 7-23 7-24 7-25 7-26 7-27 7-28 7-29 7- 30 7-31
8-1 8-2 8- 3 8-4 8-5 8-6 8-7 8-8 8-9 8-10 8-11 8~12 8-13 8-14 8-15 8-16 8-17 8-12 8-19 8-20 8-21 8-22 8-23 8-24 8-25 8-26 8-27 8-28 8-29 8-30 8-31
9-1 9-2 9- 3 9-4 9-5 9-6 9-7 9-8 9-9 9-10 9-11 9-12 9-13 9-14 9-15 9-16
MaxlMinl Ave II Time of l--Tlme of /Amt.1I Beginningl~ . Ending I in In. II
Monthly Summary
II 92 II 86 II 88 II II 82 II 87 II 74 II 77 II 82 II 83 II 79 II 74 11 73 II 79 II 72 II 84 II 81 II 87 I
85 73 64 71 78 85 84 82 83 83
I 81 II 82 II 83 II 84 II 85 II 81 II 73 II 73 II 74 II 75 II 80 II 81 II 83 II 76 11 77 11 72 II 73 II 68 II 62 II 64 II 73 II II II 78 II 79 II 82 II 82 II 83 II 84 II 80 II 79 II 74 II 76 11 71 II 93 II 94 II 83 II 67 II 75
68 67 62
63 60 54 53 52 56 60 59 58 66 66 68 67 67
66 62 54 52 51 51 60 59 59 60 58 57 56 59 61 67 61 56 48 50 52 53 62 51 41 61 49 50 53 36 39
45 49 53 59 59 58 63 54 52 65 63 63 62 44 44 fi9
80 II 76.5 II 75.0 II
II 72.5 II 73.5 II 64 II 65 II 67 II 69.5 II 69.5 II 66.5 II 65.5 II 72. 5 II 69 II 76 II 74 II 77 II
II 75.5 II 67.5 II 59 II 61.5 II 64.5 Ii 68 II 72 II 70.5 II 71 II 71.5 II 69 .5 II 69.5 II 69.5 II 76.5 II 73 II 74 !I 67 II 64.5 II 61 II 62.5 II 66 II 67 II 72.5 II 63.5 II 59 II 66 .5 II 61 II 59 n 57.5 50 56
61.5 64 67.5 70.5 71 71
7:00 P. M. 3:00 A. M.
1:00 A. M . 1 :00 P. M .
7:45 P . M' l 3 :00 P . M. 5:00 P . M .
All day All day
4:00 A . M .
3:00 P . M. 5:00 P . M. 3:00 P . M. 4:00 P. M.
All day
7:30 P . M . 8 :30 P. M.
3 :00 .P . M. 6 :30 P . M.
6:00 A . M. 4:00 P. M . All day
7:00 P . M . 110 :00 P. M .
6:00 P . M. 7:00 P . M.
9 :00 A . 1\1. 6 :00 P . M . 8:00 P . M . 10 :00 P. M.
71.5 11 12 :00 P . M. 66.5 II 8 :00 P. M. 63 II
8:00 A . M. 10 :00 P. M.
70.5 II 67 II 78 II 78 II 63.5 11 11 :30 A . M. 55.5 II 5 :00 P. M. 67 II 7:00 P . M.
11 :30 P. M. 7 :00 P . M .
11:00 P . M.
--- ----- --Mean Maximum 80.7
1.17 II Mean Minimum 6004 II (Maximum 92 I! Minimum 48 M ean 70.&
1.42 II Precipitation II Total 7.13 II Number of days II With .01 in. or more II precipitation 14
/
1 ::: lili
.35 II 1.54 II
.02 II II II II Mean Maximum 77
.62 II Mean Minimum 54.6 0.04 II Mean 65.8 0.03 II M aximum 85
II Minimum 36 II Total Precipita tion 3.37
0.86 II Number of days II with 0.01 in. or more II precipitation 11. II II
0.38 II II II II II
0.04 II 0.12 II 0.09 II
II II II
0.01 II II Ii II II II
0.93 II 0.25 II ·
II II II M ean maximum 74.5 II Mean minimum 53.3 II M ean 64.1 II M aximum 94 II Minimum 37 II Total precipitation 7.05 II Number of days with II 0.01 inch or more
0.14 II precipitation 12 0.66 II 1046 II
.06 II II II II
0.15 II 0.06 II 0.26 II
· ·271
9-17 II 78 51 64.5 II II 9-18 II 80 61 70.5 II II 9-19 II 77 44 60.5 II II 9-20 II 79 46 62.5 II 9:30 P. M. 3:00 A. M. 1.30 II 9-21 II 65 37 51 II II 9-22 II 67 39 53 II II 9-23 II 73 52 62.5 II II 9-24 II 74 58 66 II II 9-25 II 69 59 61 11 10:00 A. M. 7:00 P. M. 0.97 II 9-26 II 71 53 62 II 7:00 P. M. 7:00 P. M. 1.96 II 9-27 II 56 48 52 II 7:00 P. M. 11:30 P. M. 0.02 II 9-28 II 57 51 54 II II 9-29 II 56 50 53 11 10 :00 A. M. 11:30 P. M. 0.01 II 9-30 II 64 . 47 55.5 II II
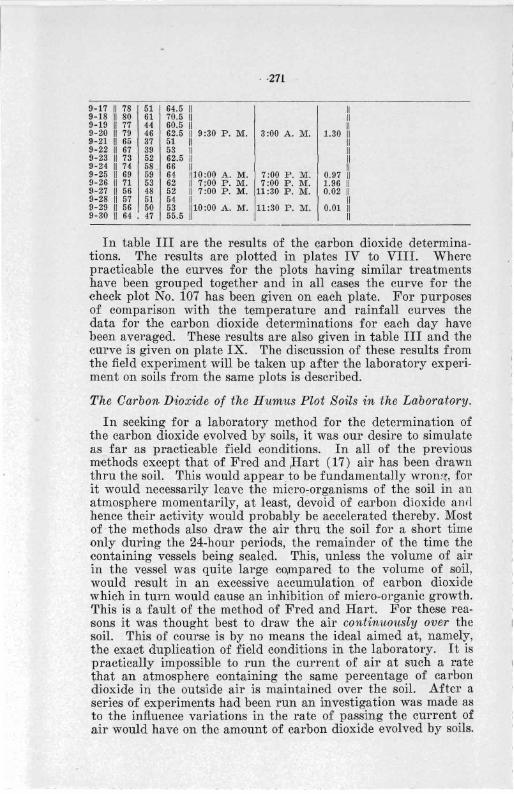
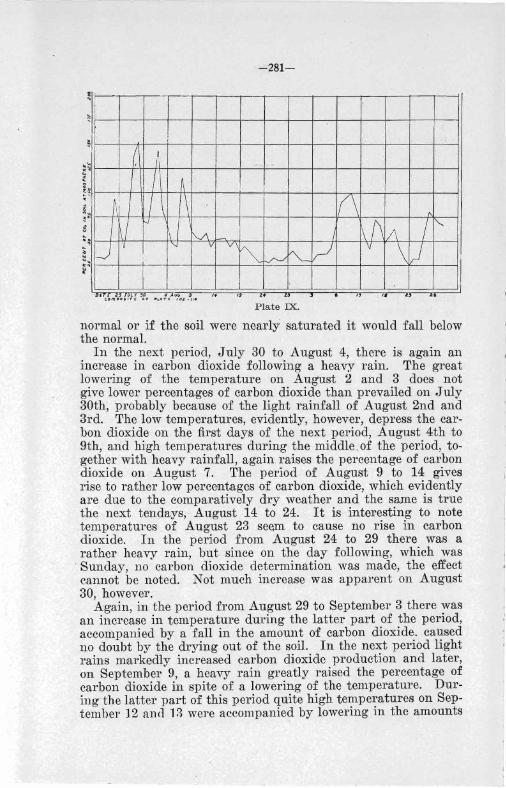
In table III are the results of the carbon dioxide determinations. The results are plotted in plates IV to VIII. Where practicable the curves for the plots having similar treatments have been grouped together and in all cases the curve for the check plot No. 107 has been given on each plate. For purposes of comparison with the temperature and rainfall curves the data for the carbon dioxide determinations for each day have been averaged. These results are also given in table III and the eurve is given on plate IX. The discussion of these results from the field experiment will be taken up after the laboratory experiment on soils from the same plots is described.
The Carbon Dioxide of the H1tm1tS Plot Soils in the Laboratory.
In seeking for a laboratory method for the determination of the carbon dioxide evolved by soils, it was our desire to simulate as far as practicable field conditions. In all of the previous methods except that of Fred and ,Hart (17) air has been drawn thru the soil. This would appear to be fundamentally wron.~, for it would necessarily leave the micro-organisms of the soil in an atmosphere momentarily, at least, devoid of carbon dioxide and hence their activity would probably be accelerated thereby. Most of the methods also draw the air thru the soil for a short time only during the 24-hour periods, the remainder of the time the containing vessels being sealed. This, unless the volume of air in the vessel was quite large co,mpared to the volume of soil, would result in an excessive accumulation of carbon dioxide which in turn would cause an inhibition of micro-organic growth. This is a fault of the method of Fred and Hart. For these reasons it was thought best to draw the air contintw1tsly over the soil. This of course is by no means the ideal aimed at, namely, the exact duplication of field conditions in the laboratory. It is practically impossible to run the current of air at such a rate that an atmosphere containing the same percentage of carbon dioxide in the outside air is maintained over the soil. After a series of experiments had been run an investigation was made as to the influence variations in the rate of passing the current of air would have on the amount of carbon dioxide evolved by soils.

-272-
TABLE IlL-PERCENTAGE OF CARBON DIOXIDE IN THE SOIL
ATMOSPHERE OF THE HUMUS PLOTS.
Date Plot Numbers. Ave.
I 101 I 102 I 103 I 1041 1051 1061 1071 108 1 1091 110 111 1 112 I 113 1 1141
July ILost 1 .18i .33/ .17 20 .22 .35 .15
. 411 .32 .43 .40 .38 .44 .52 .n 21 .21 .39 .29 .45 .19 .44 .38 .09 .30 .38 .19 .23 .37 .48 .33 22 .18 .44 .331 .361 .19 .34 .31 .38 .29 Lost .28 .31 .39 .53 .36: 23 .24 .50 .271 .26 .20 . 44 .36 .37 .27 .35 .37 .2~ .43 .57 .36, 24 1. 70 .58 1.051.02 .851.17 .75 .72 .65 .81 1.30 . 77 1.41 1. 21 .93 26 1.71 .21 . 42 .47 .36 .38 .42 .39 .35 .31 .51 .29 .28 .78 .42 27 2.10 .89 .63 .78 .69 .09 .69 .77 .68 .84 .85 Lost ,89 1.11 .77 28 .70 Lost
1. 3911.331. 25 11.88 1.221.351.20 1.57 2.01 1.16 1. 61 2.30 1. 39-29 Lost .65 .811.471.332.10 1.511.411.56 1.79 1.71 1.31 1.87 2,40 1.53 30 2.60 .89 . 40 .54 .47 .96 .781 .37 ,48 .68 .79 .61 ,81 1. 32 .70 31 2 , 2~ .72 .37 .54 .41 .69 .57 .65 .60 .63 .79 .70 .82 1. 36 .68
Aug. 2.50 1.03 1.36[1.621.411.65 1.271.301.22 1.29 1.61 1.21 1.65 2.15 1.44 3 2.50 .2~
. 501. 87 .59 .92 . 71 . 75 .87 .89 .97 .73 1.01 1. 76 .83-4 2,50 .31 .40 .67 .39 .50 .61 .63 .66 .67 .68 .75 .93 1.56 .67 5 2.40 .26 .31 . 60 .29 .37 .49 .69 .48 .39 . 61 .22 .63 1.01 . 48-6 2,25 . 05 .33 .39 ,20 .46 .42 .39 .29 .43 .75 .47 .63 ,94 .44 7 2.55 .37 1.26 ,1.47 1.08 1.31 .95 1.04 1. 00 1.12 1.45 .87 1. 20 1. 95 1.16 9 2.50 .52 .31 .67 .26 .57 .54 .73 .57 .45 .81 .57 ,75 1.04 .65
10 2.60 .55 .52 .72 .58 .27 .63 .42 .30 .45 .74 .48 .54 .77 , 54 11 2.40 .25 .41 .63 .38 .48 .60 .62 .49 .50 .64 .42 .51 .79 .52" 12 ~.50 .62 .46 .68 .44 .48 ,67 .52 .63 .65 . 77 .45 .50 .84 .58 13 2.40 .54 .33 .52 .28 .30 .48 .47 .42 .45 .59 .28 .55 .74 .44 14 2.30 .51 .43 .50 .29 .47 .41 .40 .48 .41 . 61 .34 .43 .90 .52" 16 2.35 .63 .37 .54 .44 .35 .45 .46 .64 .62 .77 .26 .63 .78 .53-17 2.15 .55 .40 .51 .26 j~1 .48 .32 .47 .40 .53 .36 .56 ,72 .44 18 1 .1.92 .45 .43 .49 .39 .53 .30 .59 .61 .74 .48 .51 .68 .51 19 I 1. 79 .421 .35 .55 .37 .231 .43 .35 .45 Lost .46 .34 .43 .62 .39 20 1. 89 .62 .51 .62 .31 .45 .28 .46 1 .38 .47 .46 .39 1.42
. 47 1 .45-
21 1.77 .45 .39 .51 .18 .31 .46 .36 .29 .36 . 49 .21 ,42 .59 .39 23 1.54 .46 .22 .32 .15 .33 .17 .37 .18 .23 . 41 .24 .21 .33 .28-24 1.32 .34 .41 .37 .17 .28 .15 .31 .22 .29 .30 .31 .34 .46 .30 25 1.24 .39 .29 .38 .12 .25 ,12 .25 .26 .24 .38 .25 .34 .36 .28 26 1. 23 .44 .28 .45 .19 .43 .22 .31 .27 .31 .39 .29 .34 .35 .33 27 1.08 .44 .26 .39 .21 .351 .26 .29 .23 .28 .35 .22 .29 .33 .30' 28 .98 . 37 .32 .38 .19 ,28 .24 .28 .24 .29 .36 .24 .29 .41 . 30 30
1. 48\ ,47 .40 .53 .30 .40 .28 .37 .29 .41 .59 .25 .42 .45 .4(}
31 1.42 .38 .36 .39 .27 .41 .26 .32 .22 .30 .41 .22 .37 .48 .34 Sep, I
1 1. 68 .27 .28 .34 .22 .30 .22 .25 .31 .30 .38 .26 .30 .48 .30 2 1.37 .30 [ .31 .36 .28 .35 .25 .24 .32 .29 .41 .23 .28 .46 .30 3 1.49 .24 .30 .39 .21 .25 .23 .27 .29 .24 .38 .21 .29 .41 .29-4 1. 61 .37 .33 .45 .29 .37 .27 .36 .39 .37 .41 .27 .37 .51 .36 6 1. 32 .44 .31 .60 .26 .34 .33 .37 .35 .32 .34 .30 .36 .44 .37 7 1. 31 ,38 .34 .63 .29 .44 .46 .45 .34 .36 . 48 .29 .51 .62 .43 8 1.91 .78 .76 .99 .76 .63 .50 .56 .59 .64 .66 .49 .60 .89 . 68 9 1.84 1.29 1Lost 1.30 .81 .88 .59 .65 .76 .93 1.16 .61 .72 1.15 .90'
11 2.1011.331 1.21 1.39 .91 .99 .63 . 66 .90 .87 1.27 .75 .82 1.25 1. 00 13 2.30 1. 56 . 66 .92 .47 .63 .401 .50 .63 .58 .76 .43 .57 1.01 .70, 14 2 .30 .72 .48 .62 .28 .54 .31 .33 .56 . 47 .57 .36 ,61 1.04 .53 15 2.25\ .581 .47 .62 .40 .54 .29 .45 .25 .28 .35 . 23 .34 .70 .42 16 2.30 .81 .51 .88 .41 .68 .53 .55 .84 .78 .90 .67 .79 1.03 . n-17 I 2.25 .78 .4S .75 .55 . 68 .38 .55 .64 .79 .85 .48 .72 ,94 .66 18 2.25 .73 .44 .70 .40 .37 .30 .46 .39 .33 .75 .28 .36 .73 .4S-19 2.351Lost .72 .78 .701 .67 .33 .49 .63 .61 .93 . 41 .58 1.16 .62-21 2.18 .58 .42 .61 .35 .38 .35 .33 .28 .31 .71 . 32 .34 . 48 .43 22 1.38 .10 .29 .34 .27 .28 .25 .30 .34 .29 .37 .35 .30 .45 .32' 23 1.98 .41 .24 .38 .18 .16 .15 .12 .20 .18 .30 .23 . 24 .41 .25-24 1.99 . 23 .30 .50 .22 .27 .22 ,18 .29 .33 .46 .26 .38 .52 .32 25 1. 98 .28 .29 .37 .27 . 26 1
.25 .17 .33 .40 .52 .24 .34 .54 .32 27 2.20 .54 .71 .81 .83 .91 .59
1
.52 .81 .75 .93 . 74 .72 1.58 .80 28 2.20 .68 .67
. 821 .51
. 801 .52 ,48 .71 .70 .92 .71 .68 1.50 . 7
29 2.25 .65 .69 .73 .57 .59 .46 .43 .65 .65 .89 .61 .77 1.34 . 69 30 2.20 .62 .61 .61 .36 .67 .43 .49 . 68 .71 .78 .101 .70 1.23 .6
Ave. I 1.801 .5171 .4851·6531.429!.5681.4581.4~01.5051 .5381. 689 1 .4311.5911.8851
-273-
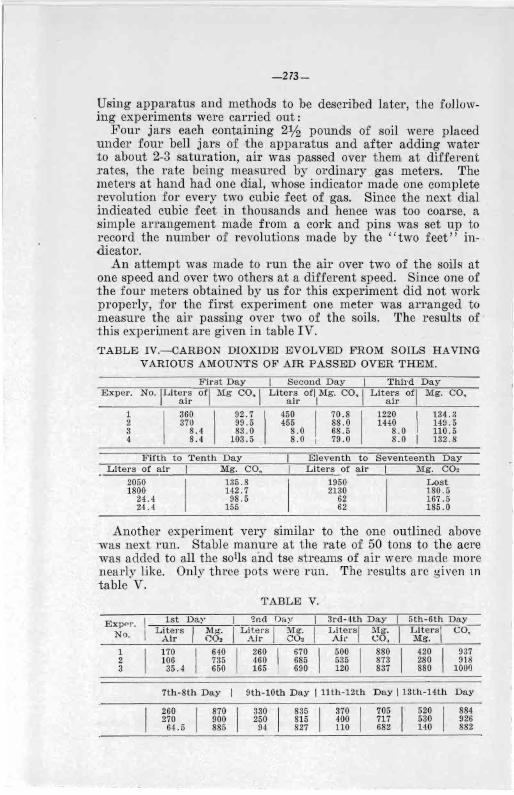
Using apparatus and methods to be described later, the following experiments were carried out:
Four jars each containing 2% pounds of soil were placed under four bell jars of the apparatus and after adding water to about 2-3 saturation, air was passed over them at different Tates, the rate being measured by ordinary gas meters. The meters at hand had one dial, whose indicator made one complete revolution for every two cubic feet of gas. Since the next dial indica ted cubic feet in thousands and hence was too coarse, a simple arrangement made from a cork and pins was set up to Tecord the number of revolutions made by the "two feet" indicator.
An attempt was made to run the air over two of the soils at one speed and over two others at a different speed. Since one of the four meters obtained by us for this experiment did not work properly, for the first experiment one meter was arranged to measure the air passing over two of the soils. The results of this experiment are given in table IV.
'l'ABLE IV.-CARBON DIOXIDE EVOLVED FROM SOILS HAVING VARIOUS AMOUNTS OF AJiR PASSED OVER THEM.
Exper.
1 2 3 4
First Day Second Day No.!Liters Of! Mg co.! Liter:; ofl Mg. CO,!
air air I
Third Day Lite~s Of! Mg. CO,
a ir
360 I 92.7 I 450 I 70.8 I 1220 I 370 99.5 455 88.0 1440 8.4 83.0 8.0 68 .5 8 .0 8.4 103.5 8.0 I 79.0 8.0
134.X 149.5 110 .5 132.8
Fifth to Tenth Day E leventh to Seventeenth Day Liters of air I Mg. CO, Lite rs of air I Mg. CO,
2050
I 135.8 1950
I Lost
1800 142.7 2130 180 .5 24.4 98.5 62 167.5 24.4 I 155 62 185 .0
Another experiment very similar to the one outlined above -was next run. Stable manure at the rate of 50 tons to the acre was added to all the soils and tse streams of air were made more nearly like. Only three pots were run. The results arc given 111
table V.
Exppr. No.
1 2 3
TABLE V.
~.,..:l=S.::...t ....:D::,.=a ):...,· ,.,..--;I-=-c 2 nd [h y Liters I M;;-. ! LiterS! Mg. !
A.ir C02 .Ajr C02
170 640 I 260 I 670 I 106 735 460 685 35.4 650 165 I 690
3rd-4th Day Lite r sl !l1g. Ail' CO,
500 I 880 535 873 120 837
15th-6th Day
! LiterS! CO-;Mg.
I 420 I 937 280 018 880 1000
7th-8th Day 19th-10th Day I 11th-12th Day I 13th-14th D ay
260 I 270 64.5
870 I 330 I 900 250 885 94
835 I 815 827
370 I 400 110
705 I 717 682
520 I 530 140
884 926 882

-274-
This indicates that within the limits of the experiment a variation in the amount of air has very little influence upon the evoluton of carbon dioxide. In our work an effort was always made to adjust the air currents so that all were running at the same speed, therefore it is believed that the error from that standpoint is negligible. 'l'he results obtained by the experiments above are in harmony with the observations of Russel and Applegard (47) pointed out in the historical section of this paper, that high winds had no apparent effect on the carbon dioxide content of the soil atmosphere.
The general arrangement of the apparatus used throughout our work is shown in fig. 1, and the detailed arrangement in plate X. The current of air, drawn by a water pump, first enters the flask A containing concentrated sulfuric acid, which takes the water and ammonia from the air. The object of removing the water is to keep the soda lime tube from clogging. The air then passes through tube Band C. Tube B holds 220 gm. of soda lime and tube C 1.5 Kg. 'fhe soda lime in B is renewed every two or three days during the course of an experiment. The current of air is then divided, one-half going through D containing sulfuric acid of such a strength that it gives a partial pressure of water vapor about equal to the partial pressure of water vapor in the atmosphere of Iowa during the summer months. The other half of the air current goes through apparatus in all respects
. like that traversed by the half entering D. The current of air, after leaving D, goes through twelve tubes, each leading to a bell jar. Only one of these is shown in plate X, but they are all arranged in exactly the same manner. The air, entering the bell jar E, which is 35 cm. in height and 15 cm. in diameter, passes over the soil in pot F, bubbles through standard acid in G, and through 5 per cent potassium hydroxide in H. H consists of a glass cylinder 20 cm. by 3.5 cm. The rubber stopper closing it bears a 25 c. c. Kjeldahl connecting bulb. It is placed at such a height than when the air is passing. through it, it is filled with alkali up to within a few mm. of the end of the bent exit tube. This makes a simple and effectivc carbon dioxide absorption tower. To test its efficiency, two of these towers were connected in series to a bottle containing a dilute solution of sodium bicarbonate. A currcnt of air was drawn through the system at about the rate used ill all our work and very dilute acid was slowly dropped into the sodium bicarbonate solution. After one day the carbon dioxide was determined in the alkali in each bottle. After deducting the blank for the alkali, the tower next the bicarbonate solution contained 350 mg. carbon dioxide, while the next tower contained 0.9 mg. This was considered a sufficiently complete absorption for our purposes.
'l'here was no ohject in removing the ammonia or in its collee··

;;.....275-
tion in G in this experiment, but there was in an experiment to be described later. For this experiment it was easier to use the apparatus as it stood than to remove the part pertaining to the ammonia.
On Sept. 10th about four pounds of soil was obtained from each of plots 102-114 and after determining the moisture content sufficient of the wet soil was weighed out to give two pounds of oven dry soil and placed in the glass jars corresponding to F of Plate X. These jars were 11. cm. in height and 11.5 cm. in diameter. After placing the soils under the bell jars air was aspirated over the soils at the rate of about fifty liters per day. The carbon dioxide evolved was determined every few days as indicated in the table below. On October 12 all of the soils were made up to a uniform moisture content, namely 24.1 per cent. The results calculated in pounds of carbon dioxide per <lcre are given in table VI.
TABLE VI.
Plot 11 dayl 2-3 I 4-10 1 11-181 19-25 1 26-321 33-391 40-461 47-54 1 55-61162-68
102 103 104 105 106 107 108 109 110 111 112 113 114
1 :u II ~g:g I ::: I m I m I m I i~i II?,st m m 36.5 73 .0 336 267 172 121 190 " 190 278 35. 7 51. 3 424 113 118 195 146 " 220 235 32.6 65.2 411 146 166 134 209 " 183 214 30.652.0451107172 79182" 147193 31.870.7386 164140106176" 242275 28.8 54 .4 303 106 124 64 lost " 157 133 29.5 43.8 191 1141135 80 173 " 179 221 35.073.8400170198127257" 267310 28.5 I 56.0 327 152 161 109 lost " 159 368 29 5 63.7 350 158 181 114 196 " 193 295 I 36:5 • 70.7 473 191 252 144 253 .'--_" -'----"3-"46~ 406
::lOA , zr "U~ J D • 1$ I t! ZJ '07- I Q5 -:~- --- IO C'-- 101-· _ _
P late IV.
23U 2~7 ~12 274 202 168 228 147 140 284 205 265 294

-276-
The results for the various periods have been divided by the number of days in the period. This gives the average amount of gas given off per day for the respective periods. These calculations are given in table VII.
TABLE VII.-AVERAGE AMOUNT OF CARBON DIOXIDE GIVEN OFF PER DAY BY THE ,sOIL FROM THE HUMUS PLOTS.
Plot I 1 dayl 2-3 I 4-10 I 11-181 19-25 1 26-321 33-391 47-541 55-611 62-68IAve.
102 41.8 33.4 32.0 I ] 9.4 28.4 15.1 21.6 36.71 25 . 1 32.9 28.6 103 35.7 20.5 38.6 ]8.0 26.9 14.4 23.9 27.4 28.1 34.0 27.6S 104 36.5 36.5 33.6 33.4 24.6 17.3 27.1 27.1 39.7 34.6 31.0 105 35.'l 25.6 42.4 14.1 14 .0 13 . 6 20.9 32.7 33.6 40.6 27.3 106 32.6 32.6 41.1 18 .2 23.7 19 .1 28.4 26.1 30.1 28.9 28.1 107 30.6 26.0 45.1 13.4 24.6 11 .3 26.0 20.1 27.6 26.9 25.2 108 31.8 35.3 38.6 20.5 20.0 15.1 25.1 36.0 39.3 32.6 29.4 109 28.8 27.2 30.3 13.2 17 .7 9.1 lost 22.4 19 .0 21.0 21.0 110 29.5 21.9 19.1 H.' I "., 11.4 24.7 25.6 31.6 20.0 21.7 111 35.0 3ti.9 40.0 21.2 28.3 18 .1 36.7 38.1 44.3 40 .6 33.9 112 28.0 28.0 32.7 19.0 24.0 17.6 los t 22.7 52.6 29.31 25 . 3 113 ~U I 36.8 35.0 19.7 25.0 17. 3 28.0 27.6 42.1 37.9 29.0 114 35.3 47.3 24.9 36.0 20.6 36.1 49.4 58.0 42.0 38.5
The results in the above table have been plotted and are shown in plates XI to XV. The curves from the different plots are grouped in the same way as the similar curves for the field results. It should be pointed out that the only way in which the curves for the field results can be compared to similar curves for the laboratory results is as to the relative position of the curves from the various plots. That is, as to whether the tendency of the curves for a particular plot is to be above or below the curves from another plot.
DISCUSSION OF THE RESULTS OF THE FIELD AND LABORATORY TESTS ON THE SOILS FROM
THE HUMUS PLOTS.
Plates IV to VIII and their comparison to plates I to III will be taken up first. In plate IV has been grouped the curves for the percentage of carbon dioxide in the soil atmosphere of plots 101, 105, 106 and 107. It should be recalled that plot 101 receives no treatment and has been growing timothy since 1908. Plots 105 and 106 have been fallowed since the same year and have also received annual applications of one and two tons per acre of timothy hay respectively. Plot 107, fallowed since 1908 is the check, receiving no treatment. It will be observed that the curve for plot 101 is not complete. Our apparatus would permit of readings of carbon dioxide below about 2.25 per cent and the soil air of this plot often contained more carbon dioxide than that and hence was not determined. There is some correlation between the rain£all curve shown in plate III and the curve for the carbon dioxide of plot 101. It should be pointed ant here
-277-
that the values for the rainfall shown in plate III represents the precipitation from 7 :00 p. m. to 7 :00 p. m., while the carbon dioxide determinations were made at about the middle of the respective period. Hence to obtain more definite information as to. the relationship of the rainfall and the carbon dioxide, table II, which gives the time of the rainfall, should be consulted. In general, it is seen that increased precipitation increases the amount of carbon dioxide in plot 101, the increase in carbon dioxide often lagging a day or more behind, as for instance, after the heavy rain of September 9th. Unfortunately, the weather record failed to. give the time of this precipitation, but at any rate there is a decided lag in the increasc in carbon dioxide. The failure of the heavy rain of September 26th to cause a large increase'in the carbon dioxide was no doubt due to the rather low temperature throughout that week.
It is apparent that the soil atmosphere of plot 101 contained considerably more carbon dioxide than did any of the other plots. Russel and Appleyard came to the conclusion that crops had little or no effect on the soil tmosphere. Whether the large amounts of carbon dioxide found by us are due to the growing timothy or to the decaying dead roots, we are unable to state. The last factor must be of some impo,rtance for timothy has been growing uninterruptedly since 1907 on this plot.
The curves for plots 105, 106 and 107 are interesting. It is difficult to understand why the tendency is for 107 to be above 105, but such is the case. From table III, whose last line gives the average amount of carbon dioxide given in the soil air for each plot per day, it is seen that 105 gave .429 %, while 107 gave .458 %. During Septem,ber 105 averaged .432 %, ~while 107 aver.,. aged .380 % for the same period, but why during July and August, -105 receiving one ton of timothy annually should be giving more carbon dioxide than 107, receiving no applications, we cannot explain. As will be shown in a later experiment, green manures decompose quite rapidly when added to soil and hence it might be fair to assume that most of the timothy had disappeared nine months later, yet it certainly would not cause an inhibition in the carbon dioxide production. No doubt some local differences in the soil are the cause. The curve for plot 106 is at nearly every point above both 105 and 107. The great increase in carbon dioxide between July 25th and 30th is no doubt due to. a combination of heavy rainfall and high temperature, as is seen by inspection of plates I to III.
Plate V, showing curves for the carbon dioxide of the soil air of plots 102, 108 and 107, will be taken up next. Needless to say, it was not thought that the peat and oat straw treated plots have any particular connection, and hence were put on the same plate. It was only because they did not naturally go with any of the

/.1
DA r t L S:rUO 3 0 ., AU" 11 {0 7- 102.----- 1() 6 ---
.1JA T f: lr lilLY .l~ of '"' V""' 14 ,,{-- 10 J /0 -1 --
1\ i\
" I. fj
H • 1
Plate V.
P late V I .
fIAT T It ,'"'..., ~o ---'07- 1(J1 " 110--- 11/- --
J;'late VII.
/\ / \
! :", \ . '. \
j. .... \ f'
I . \ ' , l \ / :/\ .•.. -' . ,.:\\
,sep , a
..

-280-
dioxide production and temperature and precipitation, the discussion will be taken up by five day periods. During the five days previous to starting the analyses of the soil atmosphere samples over two inches of rain fell. On July 20, the first day of drawing the samples, the average air temperature was slightly below 65°. During the following five days the average air temperature varied between 65° and 70° and at the time of taking the soil air samples, the soil temperature during the last two days of that period was hetwebn 70° and 75°. On the third day of that period nearly an inch of rain fell. 'rhis rainfall in combination with a slight rise in temperature no doubt accounts for the sharp increase in carbon dioxide on July 24. During the period of July 25 to 30 the fall in the percentage of carbon dioxide was caused by the drying out of the soil, together with a slight decrease in temperature. On July 28 and 29 the percentage of carbon dioxide reached its highest point, caused by the heavy rain of July 28, and the relatively high temperatures prevailing. The sudden drop of the percentage carbon on July 30 is interesting and is almost entirely due to moisture relations for the temperature only dropped a degree or two. These great decreases in carbon dioxide after the increases accompanying rainfall perhaps furnish confirmation of the theory of Russel and Appleyard (47) that rainfall increases carbon dioxide in soil air largely because of its dissolved oxygen increasing biochemical activities. After this oxygen had been utilized the percentage carbon dioxide would either again tend to become
:.: "i/I ',\, "f A \ :1 ::: "i\: '"~ " ,. , I
:x: ~ '!~\' ; \ ~':' ::, ~c i, 1 J 1\ ;
" " I' : , , \.
",AT1p 2 II'-t JIl ., AUG' / 1 I Z., ,Z;:t
10 7 - /I f ---···· /13 -- - 112-.-_
Plate VIII.
.. . .. ~
a
:'f " I I
,1 :;
~ I ~\ I ~
. J .J
' I~ ~
~I [ [ r bAft Z1 'P;r ,6
~
\ r"v\
'J v
,
f "w;--r-'f
-281-
'(\ A I '-.. /\
V
~ "'-~ IJ \ ) ~
, .. " . " .. .. Plate IX.
normal or if the soil were nearly saturated it would fall below the normal.
In the next period, July 30 to August 4, there is again an increase in carbon dioxide following a heavy rain. The great lowering of the temperature on August 2 and 3 does not give lower percentages of carbon dioxide than prevailed on July 30th, probably because of the light rainfall of August 2nd and 3rd. The low temperatures, evidently, however, depress the carbon dioxide on the first days of the next period, August 4th to 9th, and high temperatures during the middle .of the period, together with heavy rainfall, again raises the percentage of carbon dioxide on August 7. The period of August 9 to 14 gives rise to rather low percentages of carbon dioxide, which evidently are due to the comparatively dry weather and the same is true the next ten days, August 14 to 24. It is interesting to note temperatures of August 23 seem to cause no rise in carbon dioxide. In the period from August 24 to 29 there was a rather heavy rain, but since on the day following, which was Sunday, no carbon dioxide determination was made, the effect cannot be noted. Not much increase was apparent on August 30, however.
Again, in the period from August 29 to September 3 there was an increase in temperature during the latter part of the period, accompanied by a fall in the amount of carbon dioxide. caused no doubt by the drying out of the soil. In the next period light rains markedly increased carbon dioxide production and later, on September 9, a heavy rain greatly raised the percentage of carbon dioxide in spite of a lowering of the temperature. During the latter part of this period quite high temperatures on Septern her ] 2 an <1 1:1 were a ccom panied by lowering in the amounts

-282-
Plate X.
of carbon dioxide, again due to the drying out of the soil. Light rains between September 13 and 18 had the usual effect on the carbon dioxide. In the period of September 18 to 23, the heavy rain of September 20 caused little rise in the carbon dioxide and this, together with the great decrease during the latter part of the period, was no doubt due to the very low temperatures prevailing. In the next period, on September 26, nearly two inches of rain fell and there was also a rise in temperature during the first part of the period. The increase in carbon dioxide was not so great as is often followed by heavy rains, due no doubt to rather lower temperature than prevailed earlier.
In conclusion, it is quite apparent that rainfall has a much greater effect on carbon dioxide than has temperature. It is also apparent that rainfall must have some other effect than merely raising the moisture content to optimum, for the carbon dioxide production would be geratly lowered before the soil had lost more than a very small percentage of water. No doubt the effect of rainfall is that mentioned by Russel and A pplegard (47).
The results obtained in the laboratory experiment on the soil taken from the humus plots directly after the completion of the field experiment will be discussed at this point. The results are given in tables VI and VII and the curves will be found in plates XI to XV. The same grouping was followed in these plates as in the curves for the field results. Taking up plate XI, it is seen that' the general tendency is for the curves for 105 and 106 to be above the curve for the check polt 107. For the first seven points, plot the soil from plot 105, the plot which received one ton of timothy, gives less carbon dioxide than the soil from 106, which received more than two tons of timothy per acre. For the last three periods 105 gave off considerably more carbon dioxide, The average amount of carbon dioxide for the whole period was 28.1 lbs. for 106, 27.3 for 105 and 25.2 for 107. It should be recalled that in the field results thruout the whole period 105 produced more carbon dioxide than did 106, but that during the last month 106 was producing more than 105.
The results for plots 102 and 108, together with the check, are

-283-
given in plate XII. The general tendency is for the curve for the check plot to be below those for the other two, but there are several points when the reverse is true. From the average it is seen that 108 produced more carbon dioxide than did 102, altho the differences are slight, namely, 29.4 Ibs. and 28.6 Ibs., respectively. The order was reversed in the case of the field experiments, although the differences there were slight, also.
The curves for 103 and 104, receiving eight ton applications of
~ ( '\
// .\\ \~ ------- .J
.'
V' '\ \ ~-,.- 1--
/" ~/'~ --- ./ V-r-
.\\ ./J ~. /j .' ~ ~ V ,
''\' / 'J /-..-1\
It .------ .- .. _-- . ---\j
'"" 107-'-" I06'.2.. -....!°IOS----- " " . Plate XI.
~
A /'-\ ...-, ,
...- ...-/ ,,'; "-
/ (\/ '\ ,,-.........
, 1\ , /. >
: v··· .. /.'
1\, / : '. r--•• f><..//" './
'. \\ _Lr\. ;/ ~ V '. .-'
---------------
0
'" -\ vi ... 1 ... ~' . I.
·t ....
V V • ,.
. .
'''u , " " .0 " ,> .. " 5' OT' oo
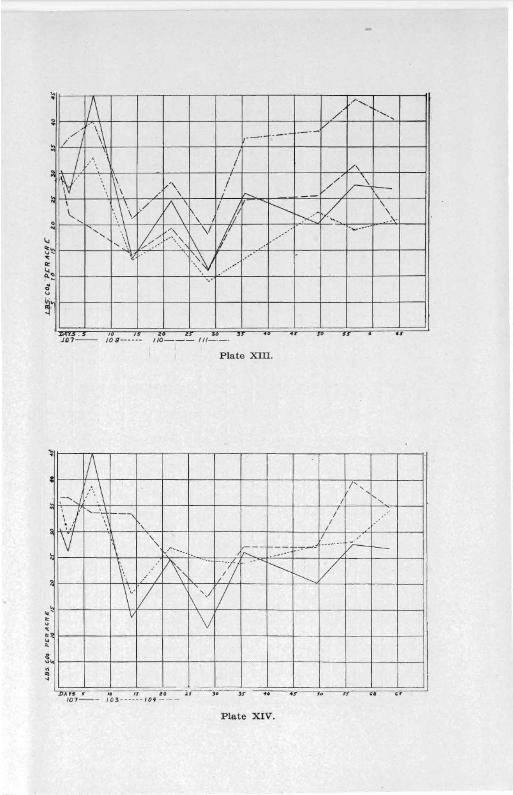
~~~~~--~~--+--+--+--+--+--+--~~--~~ '4
'1)..0'5 : !> I II( 1>0. 2S" ; ,
J07-- 10 8- ----- IID--- 111----
Plate XIII.
~
[7\ ~
: .. ~ I', ,---',.j
, . I "-
\/ '-':'71 -- I l.·> "
I
" " I
IV " 1\ " 1;::'--l--- -~,.....:----- -- r;-t--,' .. ~~
-- -----
\, r\" ----- >7 .'
~ 1/ 0 // r--------
\': [7 'I fl ~
1\ ' II V
~
~
I I I ~ DA r~ ~ 10 IS to 1.!
107-- 10 3 ------IO f ---
Plate XIV.
1
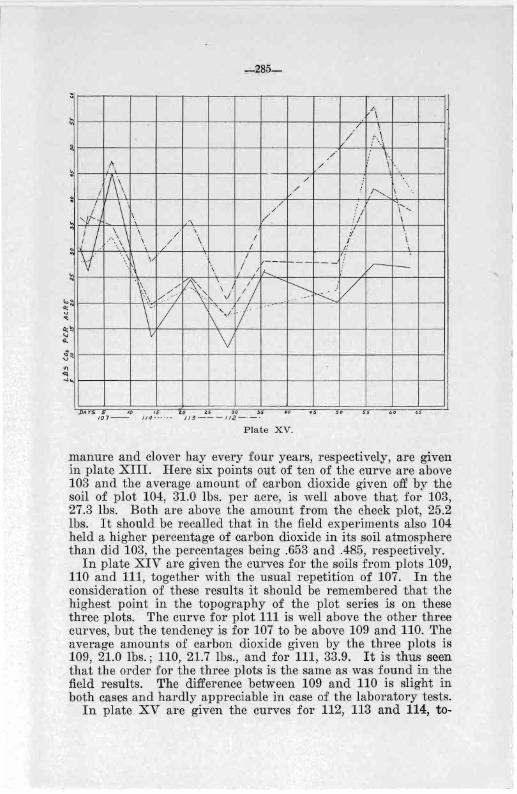
'"
t-. ~r-~hr-+---r---r--1---+---~ ~-+--~---r--+---~--~-4 .' f\ \ /
i / \ 1 / ~r-71~~---r---r--1---+---~~/~--1---+-~~~¢--+--~
~ '/1 \ . \ ,\ 1/ ~ I / \ \ \ /\
I / . .\ \ ./ \.
<II ~'r-~---+---r---r--1---+---~~---+---+---r--4---+-~
DIns s 10 I S 0 ZS 30 ~·s .. s 10 7 - 11 4 ------ /13--- 11 2 - ---
Plate XV.
manure and clover hay every four years, respectively, are given in plate XIII. Here six points out of ten of the curve are above 103 and the average amount of carbon dioxide given off by the soil of plot 104, 31.0 Ibs. per acre, is well above that for 103, 27.3 Ibs. Both are above the amount from the check plot, 25.2 Ibs. It should be recalled that in the field experiments also 104 held a higher percentage of carbon dioxide in its soil atmosphere than did 103, the percentages being .653 and .485, respectively.
In plate XIV are given the curves for the soils from plots 109, 110 and 111, together with the usual repetition of 107. In the consideration of these results it should be remembered that the highest point in the topography of the plot series is on these three plots. The curve for plot 111 is well above the other three curves, but the tendency is for 107 to be above 109 and 110. The average amounts of carbon dioxide given by the three plots is 109, 21.0 Ibs.; 110, 21.7 Ibs. , and for 111, 33.9. It is thus seen that the order for the three plots is the same as was found in the field results. The difference between 109 and 110 is slight in both cases and hardly appreciable in case of the laboratory tests.
In plate XV are given the curvcs for 112, 113 and 114, to-
- "':"286-
gether with 107. Here again the order for the first three curves is the same as was found for the field results. On inspection of the averages it is seen that plot 107 is hardly appreciably below 112, while in the case of the field results it is somewhat higher than 112. The average for the laboratory results are for 112, 25.3 lbs. ; 113, 29.9 lbs. , and 114, 38.5 lbs. In the laboratory test these plots receiving various applications of clover annually are well above the results for the plots receiving similar applications of clover hay. This bears out in general the field results.
CONOLUSIONS OF THE FIELD AND LABORATORY RESULTS.
1. The percentage of carb.on dioxide in the soil atmosphere of the plot growing a crop of timothy hay is much higher than in the soil of uncropped plots, but it cannot be said whether this is due directly to the growing crop or the decay of root residues.
2. The plot receiving two tons of timothy hay per acre annually held in its atmosphere about 25 per cent more carbon dioxide than the plot receiving one ton of the same material at the same time, and the latter plot gave slightly less carbon dioxide than the plot receiving no additions.
3. In the plot receiving 2.8 tons of peat annually there was more carbon dioxide in the soil atmosphere than in the plot receiving 2 tons of oat straw annually, and even in the plot adjacent to it receiving four tons of manure every four years.
4. The plot receiving four tons of clover annually had considerably more carbon dioxide in its soil atmosphere than did the plot receiving a similar application of stable manure. The same was true in regard to the annual applications of one ton of the same materials, but the order was reversed when the two and four tons applications of clover hay and stable manure are .considered.
5. Rainfall has a very decided influence towards increasing l\3arbon dioxide of the soil atmosphere. The great increases :found by us probably confirm the opinion advanced by others .that the rainfall acts partially because of its dissolved oxygen.
6. The effect of temperature upon carbon dioxide production in the field is difficult to discover because of the variation of the moisture relations, but at times the carbon dioxide content of the ;soil atmosphere unmistakably rose and fell with the temperature.
7. From the discussion of the methods used by other investigators and from the experiments where the amount of air passed over soils was varied, it is concluded that field results can be most closely duplicated in the laboratory by passing air continu.Dusly over the soil rather than continuously through the soil, 01'
internlittently over it or through it.

--287-
8. The amount of carbon dioxide evolved by soils in the lagoratory is not appreciably affected by a reasonable variation in the amount of air passed over them. .
9. In a comparison of the results on soil carbon dioxide from the field and the same soil in the laboratory, the relationship of rather widely separated plots is not always the same, but in general, particularly when plots closely adjacent are compared, the laboratory and field results in a relative way compare quite favorably.
CARBON AND NITROGEN CHANGES IN SOIL TREATED WITH LIME, AMMONIUM SULFATE AND '
SODIUM NITRATE.
Several hundred pounds of Miami silt loam were obtained from one of the station orchards, which is situated in the Wisconsin drift area. The soil is light in color and low in organic matter. It contains 0.1137 per cent nitrogen and 1.35 per cent carbon. It has a lime requirement, according to the Veitch method, of 600 pounds of calcium carbonate per acre. After partially air drying, the soil waS thoroly mixed and then allowed to air dry completely. All but 80 to 90 pounds was placed in a tin storage can and reserved for the remaining experiments in this series. The smaller sample was spread out, thoroly mixed again and exactly 1134 gm. (2% pounds) was weighed out into the glass pots. (F of plate X.) At the same time a small sample of the soil was drawn and sealed up in a mason jar.
The treatment of the pots of soils in tons (T) and pounds per acre was as follows:
Pot No. 1, 2, 13, 14 3. 4, 15, 16 5, 6, 17, 18 7, 8, 19, 20 9, 10, 21, 22
11, 12, 23, 24
Treatment. Check. 3 T. CaCOa 1285 Ibs. NaNOa 1000 Ibs. (NH4) 2S0. 3 T. CaCOa ; 1285 Ibs. NaNOa 3 T. Ca'COa ; 1000 Ibs. (NH4) 2S0.
Just before starting the experiment, air was drawn through the apparatus for an hour to free it of carbon dioxide. While this was being done 3.4 gm. lime (precipitated calcium carbonate) were added to the designated soils and very thol'oly mixed. The soil, whose saturation capacity for water was 34 per cent, was made up to 22 per cent moisture as follows: First a fresh soil emulsion was prepared by mixing 400 gm. of fresh field soil with four liters of ammonia and carbon dioxide free water. After allowing the soil to settle a few minutes three liters were decanted and then 100 cc. were pipetted into each of twenty·four 250 c .. flasks, numhered 1 to 24 to correspond to the pot numbers.
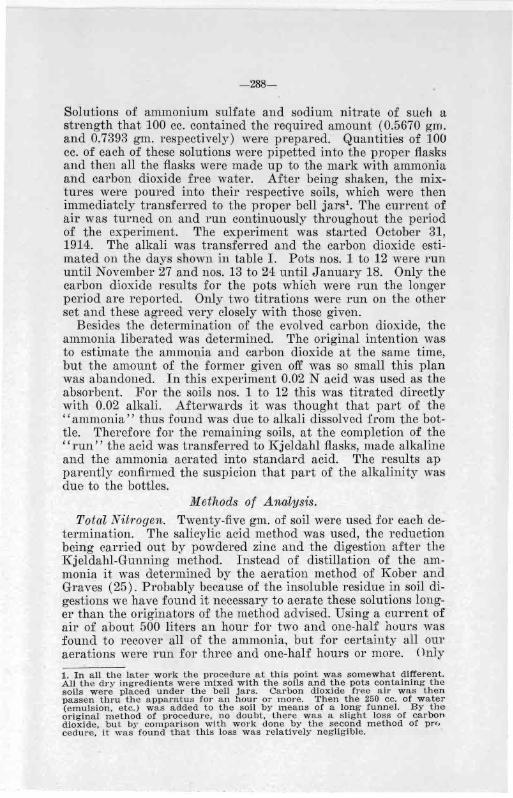
-288-
Solutions of ammonium sulfate and sodium nitrate of sueh a strength that 100 cc. contained the required amount (0.5670 gm. and 0.7393 gm. respectively) were prepared. Quantities of 100 cc. of each of these solutions were pipetted into the proper flasks and then all the flasks were made up to the mark with ammonia and carbon dioxide free water. After being shaken, the mixtures were poured into their respective soils, which were then immediately transferred to the proper bell jarsl. The current of air was turned on and run continuously throughout the period of the experiment. The experiment was started October 31, 1914. The alkali was transferred and the carbon dioxide estimated on the days shown in table 1. Pots nos. 1 to 12 were run until November 27 and nos. 13 to 24 until January 18. Only the carbon dioxide results for the pots which were run the longer period are reported. Only two titrations were run on the other set and these agreed very closely with those given.
Besides the determination of the evolved carbon dioxide, the ammonia liberated was determined. The original intention was to estimate the ammonia and carbon dioxide at the same time, but the amount of the former given off was so small this plan was abandoned. In this experiment 0.02 N acid was used as the absorbent. For the soils nos. 1 to 12 this was titrated directly with 0.02 alkali. Afterwards it was thought that part of the "ammonia" thus found was due to alkali dissolved from the bottle. Therefore for the remaining soils, at the completion of the " run" the acid was transferred to Kj eldahl flasks , made alkaline and the ammonia aerated into standard acid. The results ap parently confirmed the suspicion that part of the alkalinity was due to the bottles.
Methods of Analysis.
Total Nitrogen. Twenty-five gm. of soil were used for each de~ termination. The salicylic acid method was used, the reduction being carried out by powdered zinc and the digestion after the Kjeldahl-Gunning method. Instead of distillation of the ammonia it was determined by the aeration method of Kober and Graves (25) . Probably because of the insoluble residue in soil digestions we have found it necessary to aerate these solutions longer than the originators of the method advised. Using a current of air of about 500 liters an hour for two and one-half hours was found to recover all of the ammonia, but for certainty all our aerations were run for three and one-half hours or more. Only
1. In a ll the later work the procedure at this pOint was somewh at different. All the dry ingredients were mixed with the soi ls and the pots containing the soils were placed under the be ll jars. Carbon dioxide free a ir was then passen thru the apparatu s for an hour or more. The n the 250 cc. of wate r (emulsion. etc. ) was added to the soil by means of a long funnel. By the original method of procedure. no doubt. there was a slight loss of carbon dioxide. but by compari son with work done by the second method of prr, cedure. it was found that this loss was relatively n egligible.

-289-
by extreme care in every operation was the probable error of the determinations reduced as low as it was. By this method, working with this and other soils, we were able to determine all of 150 parts per million of nitrate nitrogen added to the "nil. All determintaions were. made in quadruplicate.
Ammonia Nitrogen. This was determined by the method proposed by the authors (42). It was thought that in the case of limed soils there would he a loss of ammonia upon air drying. 30me of the limed samples containing the larger amrmnt of ammonia were analyzed in the moist condition and also after quickly air drying by the aid of an electric fan. I n all cases the same amount of ammonia was found befol'e and :Iftcr the drying. All determinations were made in duplicate.
Nitrate Nitrogen. Nitrates were determined by the modification of the aluminum reduction method as proposed by Burgess (8), using the apparatus proposed by us (42). The determinations were always made on the wet soil within two hours after I'emoving from the pots.
Carbonates. The determination was made by the method of Maclntire and Willis (32) using a somewhat different apparatus than that used by them. A Kjeldahl flask contained the soil and the absorption tower was just like the one used in the main part of the experiment. According to our experience the atmospheric blank was not sufficiently constant to be included in the alkali blank. In all cases the apparatus was carefully freeu from carbon dioxide. One part of 85 per cent phosphoric acid to fifteen parts of water was used. This was shown by the sponsors of the method to decompose quantitatively calcium carbonate in the soil.
In table VIII are found the results of the carbon dioxide determinations, expressed in pounds per acre.
It will be observed that there are no results given for the time between December 11 and 19. During that time the apparatus sprung a leak at such a place that it was not apparent to us, and all the results were high for that period. The degree of cloReness with which the duplicate soils agreed is considered satisfactory.
The results for the various periods have been divided by the number of days in the period. This gives the average amount of gas given off per day for the respective period. The results found in table IX have been plotted and are shown in plate XVI. The curves as plotted carry the assumption that the average amount of carbon dioxide given off per day each period was being given off at that rate in the exact middle of the period. While not absolutely justifiable some such an assumption seems necessary. The points of the curve between December 11 and December 19, which were lost, have been assumed to lie on a straight line between the two points before and after this time. ThiR is the best

- 290--
'f ABLE VIII.-CARBON DIOXIDE DETERMINA'l'lONs' (Expressed in terms of pound per acre.)
"" I
I :> 0 .-:' t-Z ., M
"" "" , '" '"
,., '" ,;. ")
, '" 0 , , ,.,
Treatment I ,., bl) M bl) t- ,n 'G "" "" ij M oj oj ~
.< ~ ~ ... :> ... :> ... :> c; :> £; ...., '" '" '" " > 0 > 0 > 0 > 0 >
0 ..: Z ~ Z ..: Z ..: z ..: 13 Check .... 287 ...... 220 . ... . 258
1::: ~: 148 . .... 143 144
14 Check .... 274 280.5 226 223 249 151 149.5 145 . .... 15 Lime ..... 1205 . ..... 440 . .... 506 256 . .... 221 . .... 16 Lime ..... 1169 1186 439 439.5 471 257 256.5 236 228.5 17 NaNO, . ... 282 . ..... 171 . .... 214 . .. .. 130 . .... 124 ..... 18 NaNO, 272 277 180 175.5 212 213 128 129 130 127 19 (NH.)'SO. 308 ...... 161 . .... 222 . .... 130 i30' . 126 20 (NH.)2S0. 1 2731 290 16~ 162 21-1 218 130 (126)a 126 12 Lime &
NaNO, .... 1109 . ..... 343 . .. .. 490 ..... 241 . .... 243 . .... 22 Lime &
NaNO, .... 11651137 364 353.51 478 484 259 250 241 242 23 Lime &
(NH.) ,SO. 1083 ...... 347 ..... [(480)b (240) b ..... 210 ..... .24 Lime &
1079\t081 (NH.J,SO. 354 350.5 (480) b (240) b ..... 1 218 214 -
J I c, ,., 1.,1 I .... ~
,,, "" .... '"
, ~
00 ., . , '" , M '" ",n
I
:"9 , to
:ZI Treatment I '" c;l ., "" rl ,.,
" :;, oj ...., . c5 " c5 Ii '. d ~ d
... '" '" '" 0
I '" > '" '" > oj > oj > ~ A ..: A A -< ..., -:: ...., ..:
[
... c5 '" t;l
'" 00 a£ '" ('j ,- ... '" 0 > z ..:
130 . .. 126 128
(227)a . .. 227 227 112 . .. 116 114
(109)a .., 109 109
208 . .. 202 205
154 .. . 154 154
'" M oj
3 ... '" 0 >
E-< ..: 13 Check ........... 1 113 ... (138)e 201 ... (153)a ..... 190 ..... 1981 .. .. 14 Check .. . . . . . . . .. 109 111 (138) e 205 203 153 153 184 187 1960 1970 15 Lime ............ (175)a ... (231)c (360)a '" (247)a ..... (295)a .... . 4165 ... . 16 Lime . . .. . . . . . . .. 175 175 (231) c 360 360 247 247 295 295 4107 4136 17 NaNO, .......... 95 ... (108)c 151 ... 118 ..... 148 ..... 1653 .... 18 NaNOs ........... 93 94 (1081c 147 149 123 120.5 150 149 16591656 19 (NH.J,SO. .. ..... (103)a ... (121)c 161 ... 130 ..... 159 ..... 1730 .... 20 (NH.) ,SO. ....... 103 103 (121) c 179 170 127 128.5 156 157.5 1701 1715 21 Lime & NaNO, .. 'j194 ... (214)c 280 ... 196 ..... 260 ..... 3778 .... 22Lime & NaNO, ... 196 195 (214)c (280)a 280 211 203.5 268 264 38783828 23 Lime & (NH.)'SO. 139 ... (168) c 248 . .. 175 . . . .. 200 ..... 3444 .... 24 Lime & (NH.J,SO. 141 140 (168)c 238 243 171 173 203 201.534463445
(a) Value assumed to be the same as duplicate. (b) Value taken arbitrarily from general direction of curves. ~e) Value taken directly from the curves. + that can be done and is no doubt not far from correct bec<!lIl'" the general tendency of all the curves is to be in straight lincs. '.' The lllost striking thing shown by the curves is the rapidity 'with which they drop to nearly horizontal lines. This is not surprising for the limed soils, but the reason is not so apparent for the unlimed. That it is not due to the freeing of carbon dioxide mechanically held in the soil is shown by the analysis of the soil for carbonates. By the analysis of the original soil 318 pounds per acre of carbon dioxide were found. In the case of the check 'Pots, if it is .assumed that the normal carbon dioxide production is 20 pounds a day after November 13, then the excess during

"'7.291-
TABLE .IX.-AVIDRAGE AMOUNT OF CARBON DIOXIDE GIVEN
OFF PER DAY IN SOIL VARIOUSLY TREATED.
'" ... :> d 0 <=> t- '" Z '" <;' '" ~ ..... .....
'" , '" ~ ' Treatment 0 , '7 ... ..... 00 '7 , ~ ,.... '" t- ..... '" '" '"
<=> ..... Z ,., '" "" ...., .; :> :> :> :> :> d d ci ci .
0 " 0 0 0 I 0 0 '" '" cd cd il< 0 Z Z Z Z Z Q , Q ~ ~
,Check ....... . ......... '113. 14 140 55.536.121.320.6 18.3 15.9 18.5 19.118.7 3 T. CaCO •.... . .... . ... 15. 16 593 109.7 69.7 36.6 32.6 32.7 25.0 32.7 30.929.6 1285 lbs. NuNO; ....... 17.18 138.5 43.730.218.418.1 16.3 13.4 13.5 15.014.9 1000 lbs. (NH,)zS04 ..... 19.20 245 40.531.118.618.0 15.7 14.7 15.5 16.015.7 3 T. CaCO, + 1285 lbs. 1
NaNO, . ........ . ... . ... 121, 22 568.5 88.269.135.737.6 29.3 27.9 25.5 26.6 26. ,4 3 T . CaCO, + 1000 lbs. 1
87 . 51 Iost llost .30.6 21. 6120.1 (NH,)zSO. . .... .. ..... 123.24 540.5 22.0 20.0 22 . 1
the first thirteen days was 495 pounds. Therefore, if all of the carbon dioxide found by the analysis of the soil were mechanically held and all of it were given off in the first few days, neither of which assumptions is probable, there would still be an excess of 177 pounds given off during the first thirteen days.
As pointed 'out in the historical section of this paper, Van Suchtelen (62) and Klein (24) found the same rapid der.rease in the amount of carbon dioxide given off by soils. Klein (24) attributed it to the previous drying of the spil, which, physically and chemically, caused the soil to be a better nutrient medium for the bacteria. It is probable that this explanaion is correct !'ather. than the · explanation of Van Suchtelen. He attributed this fall in carbon dioxide to the rapid oxidation by the bacteria of the easily available organic matter due to the current of purified air used in his method. That might possibly hold for ' his method, but the fact that in the laboratory experiments on 'our humus plot soils, no such drop was found, shows that where
! ffil : ., ! I
I . ,I \
~Iitllt.iml.~ ) .. ~ " . • .f ··.- 1".'- ..... ""_._ .,. ... .... - - .... C • • L' .. r--i" ....... s ... ·<'rr- -
Plate XVI.
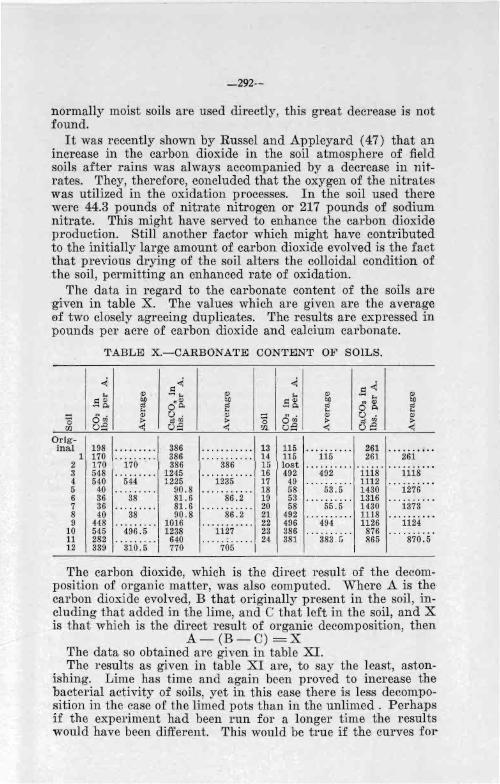
-292--
normally moist soils are used directly, this great decrease is not found.
It was recently shown by Russel and Appleyard (47) that an increase in the carbon dioxide in the soil atmosphere of field soils after rains was always accompanied by a decrease in nitrates. They, therefore, concluded that the oxygen of the nitrates was utilized in the oxidation processes. In the soil used there were 44.3 pounds of nitrate nitrogen or 217 pounds of sodium nitrate. This might have served to enhance the carbon dioxide production. Still another factor which might have contributed to the initially large amount of carbon dioxide evolved is the fact that previous drying of the soil alters the colloidal condition of the soil, permitting an enhanced rate of oxidation.
The data in regard to the carbonate content of the soils arc given in table X. The values which are given are the average of two closely agreeing duplicates. The results are expressed in pounds per acre of carbon dioxide and calcium carbonate.
T'ABLE X.-CARBONATE CONTENT 01<' SOILS.
Orig-inal 198
1 170 2 170 3 548 4 540 5 40 6 36 7 36 8 40 9 448
10 545 11 282 12 I 339
.. ....... 386
. .. .. . ... 386 170 386 386
......... 1245 544 1225 1235
......... 90.8 38 81.6 86.2
.. ·:is .... 1 ~u 1016
496.5 1238
.. :iio:5 "I ~fg 1127
705
86.2
13 115 14 115 15 lost 16 492 17 49 18 58 19 53 20 58 21 492 22 496 23 386 24 381
.......... 261 ••••..• , •• 115 261 261
.......................... 492 1118 1118
.......... 1112 ... . . . ... . 53.5 1430 1276
.......... 1316 ......... . 55.5 1430 1373
.......... 1118 ........ . . 494 1126 1124
..... .. . . . 876 .... .... . . 383.:' 865 870.5
The carbon dioxide, which is the direct result of the decomposition of organic matter, was also computed. Where A is the carbon dioxide evolved, B that originally present in the soil, including that added in the lime, and C that left in the soil, and X is that which is the direct result of organic decomposition, then
A- (B-C) =X The data so obtained are given in table XI. The results as given in table XI are, to say the least, aston
ishing. Lime has time and again been proved to increase the bacterial activity of soils, yet in this case there is less decomposition in the case of the limed pots than in the unlimed. Perhaps if the experiment had been run for a longer time the results would have been different. This would be true if the curves for

-293-
TABLE XL-COMPOSITION OF CARBON DIOXIDE EVOLVED
FROM ORGANIC DECOMPOSITIONS.
Treatment
Check .........................•..... 3 T. CaCO, ......................... . 1285 Ibs. NaNO •..................... 1000 Ibs. (NH.)'SO. . . ....... .. .. ... . . 3 T. CaCO, + 1285 Ibs. NaNO •.. ..... 3 T. CaCO, + 1000 Ibs. (NH.),SO •....
Soil
13. 14 15. 16 17. 18 19. 20 21. 22 23. 24
CO, added I in CaCO, lbs. per
acre
2637
2637 2637
CO, from Organic Matter lbs. per
acre
1787 1693 1411.5 1472.5 1387 893.5
the carbon dioxide production had continued in a horizontal direction as the last few points indicated would be the case. In fact, in another experiment to be reported on later it was found in the case of four pots made up with the same soil and exactly like pots nos. 1 to 4 in this series, except that they were run 18 weeks, that the limed soils did give off more carbon dioxide from the organic material than did the unlimed. Just why the increase does not manifest itself immediately is not certain. It is possible that the large amount of the gas given off by the limed pots inhibits the action of the bacteria until it has diffused from the soil. It is believed that the experimental error involved in the determination of the evolved carbon dioxide is quite small, but the error in the determination of the residual carbon dioxide in the soil is relatively large. An error in the titration of 0.1 cc., for instance, makes an error of 17.7 pounds of carbon dioxide per acre. But the greatest variation of any of the duplicate titrations of the carbon dioxide in these soils was just 0.1 cc., so it seems that the variations in the above table are well outside the experimental error. However, the values for the pots 23 and 24 involving so many assumd values might quite possibly be too low. Our results for ammonium sulfate are certainly contrary to those of Van Suchtelen (62) and Fred and Hart (17). The soil used by the two latter investigators was a Miami silt loam, the same type as ours, yet there might have been decided differences in organic matter content. reaction, etc. The great differences are, no doubt, due to the differences in the soil flora. It is also observed that the sodium nitrate treated pots show a decreased carbon dioxide production. The reason for this is not clear. The only apparent explanation is that sodium nitrate at this concentration is toxic. This, however, is hardly probable.
In table XII the ammonia evolved by the soils will be considered. The results are expressed in pounds of nitrogen per acre.
The losses, while small, were definite. For instance, one cc. of 0.02 N. ammonia is equivalent to 0.5 pound of nitrogen per acre. As pointed out in the introduction, no doubt nos. 1 to 12 are to()

-294-
TABLE XII.-AMilWNIA EVOLVED FROM SOILS.
Treatment . ' '1 bs. per I bs. per I Soil l~l't~~:~~1 Soil !t'rt~~:~~
~~~ __ ~ ________________ ~~~~\,~A~cr7e~~~~~.:~A~cr~e~ Check ............................ 1, 2 0.5 13, 14 0.35 3 T. CaCO, .................. .... 3, 4 0.55 15, 16 0.25 1285 Ibs. NaNOs ................. 5, 6 0.5 17, 18 0.30 1000 Ibs. (NH.)oSO, ............. 7, 8 0.85 19, 20 0.30 3 T. CaCOs + 1285 Ibs. NaNO .. 9, 10 0'.85 21, 2'2 0.35 3 T. CaC03 + 1000 Ibs. (NH.)'SO. 11, 12 1.5 '23, 24 2.67
high. The small amount of ammonia nitrogen lost from the limed pots is interesting. The loss of 2.7 pounds from pots 23 and 24 in the 12 weeks, if kept up, would mean a loss of about 11 pounds during the year. However, as shown by table XIII, the ammonium sulfate is gradually becoming transformed, so that the loss after the 12 weeks would be no greater than the soils receiving no ammonium sulfate.
In table XIII the amounts of ammoniacal and nitrate nitrogen are given. They are expressed in pounds of nitrogen per acre.
It will be recalled that 212 pounds of nitrogen was added to . pots 5 to 12 and 17 to 24. The above data are of interest be
cause, to the knowledge of 'the authors, they are obtained from the only experiment of its kind, showing the transformation of ammonium sulfate and sodium nitrate using an absolute method for ammonia. In all other like experiments the magnesia method or the hydro-chloric acid extraction method have been used. The former gives too high results and the latter too low.
The results from the above table suggest a possible reason for the depression of the carbon dioxide production in the ammonium sulfate treated pots. In the case of these soils it seems that in no instance has it all been nitrified, which shows that at least ammonification has not been increased by the presence of the nitrate. Therefore it is possible that there has been such an increase in the nitrification that the number of bacteria has been reduced and hence carbon dioxide production inhibited. It is a well known fact that the nitrifiers can live and multiply in a medium free from organic matter. If, as our results show, there IS a depression in the carbon dioxide production, due to the application of am1l10nium sulfate, this need cause no deleterious result for the nitrifiers are apparently considerably activated. The finding of less nitrate nitrogen in the sodium nitrate treated pots than actually had been added is not, of course, necessarily due to denitrification in the narrow sense of the term; it is mOTe probably due to assimilation. .
As mentioned in the introduction, all total nitrogen determinations were carried out in quadruplicate. In the second column of table XIV the average and the probable error of these determinations are given. In the third column the average of the duplicate pots are given. In the next column are the corrected
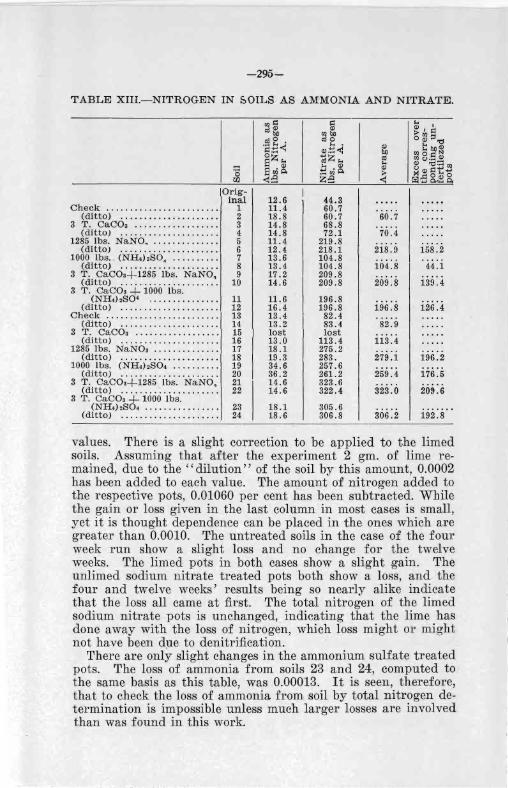
-295-
TABLE XIII.-NITROGEN IN 50ILS AS AM'MONIA AND NITRATE.
Check ....................... . (ditto) .................... .
3 T. CaCOa ....... • .......... (ditto) .............. .. . . .. .
1285 Ibs. NaNO •........ ...... (ditto) .................... .
1000 Ibs . . (NH,)'SO, ......... . (ditto) .................... .
3 T. CaCO,-I-1285 Ibs. NaNO, (ditto) .................... .
IOrig-inal
1 2 3 4 5 6 7 8 9
10 3 T. CaCO, + 1000 Ibs.
(NH.),SO' . .. . . . . . . . . . . . . 11 (ditto) .. . .................. 12
Check .. ...... .. . . ............ 1 13 (ditto) ......... . ...... ..... 14
3 T. CaCO, .................. 15 (ditto) ..................... 16
1285 Ibs. NaNO, .............. 17 (ditto) ..................... 18
1000 Ibs. (NH,),SO. .......... 19 (ditto) ..................... 20
3 T. CaCO,+1285 Ibs. NaNO, 21 (ditto) ........... .......... 22
3 T. CaCO, + 1000 Ibs. (NH.),SO, ............... .
(ditto) .................•... 23 24
12.6 11.4 18.8 14.8 14.8 11.4 12.4 13.6 13.4 17.2 14.6
11.6 16.4 13.4 13 .2 lost 13.0 18.1 19.3 34.6 36.2 14.6 14.6
18.1 18 . 6
H.3 60.7 60.7 68.8 72.1
219.8 218.1 104.8 104.8 209.8 209.8
196.8 196.8
82.4 83.4 lost
113.4 275.2 283. 257.6 261.2 323.6 322.4
305.6 306.8
60.7
70.4
218 .9
104.8
209.8
196.8
82.9
113.4
279.1
259:4 323.0
306.2
i58:2 44.1
139.4
126.4
196.2
i76:5 209.6
192.8
values. There is a slight correction to be applied to the limed soils. Assuming that after the experiment 2 gm. of lime remained, due to the" dilution" of the soil by this amount, 0.0002 has been added to each value. The amount of nitrogen added to the respective pots, 0.01060 per cent has been subtracted. While the gain or loss given in the last column in most cases is small, yet it is thought dependence can be placed in the ones which are greater than 0.0010. The untreated soils in the case of the four week run show a slight loss and no change for the twelve weeks. The limed pots in both cases show a slight gain. The unlimed sodium nitrate treated pots both show a loss, and the four and twelve weeks' results being so nearly alike indicate that the loss all came at first. The total nitrogen of the limed sodium nitrate pots is unchanged, indicating that the lime has done away with the loss of nitrogen, which loss might or might not have been due to denitrification.
There are only slight changes in the ammonium sulfate treated pots. The loss of ammonia from soils 23 and 24, computed to the same basis as this table, was 0.00013. It is seen, therefore, that to check the loss of ammonia from soil by total nitrogen determination is impossible unless much larger losses are involved than was found in this work.

-296-
-TABLE XIV.-DETERMINATION OF NITROGEN CONTENT OF SOILS.
Treatment Pot No.
Ni trogp.n in per cent of Oven
Dry Soil
Average Average Oor-
rected
J,OS8 or
Gain
-----;-----:------------------------ -Check ____________________________ _
(ditto) _______________________ _ :'1'. OaCOa _____________________ _
(ditto) ______________________ _ 1285 Ibs . NaNOa _________________ _
(ditto) ______________________ _ 1000 Ibs. (NIH.) 280. _____________ _
(ditto) ______________________ _ 3 T. OaJOOa+I2811 lbs. NaNOa ___ _
(ditto) ______________________ _
3 T. (JaeOa + 1000 lbs. (NH.)2S0. __________________ _
(ditto) _______________________ _ Check ____________________________ _
(ditto) ______________________ _ ~'1'. OaO'Oa _____________________ _
(ditto) _______________________ _ 1285 Ibs. NaNOa ________________ _
(ditto) _______________________ _ 1000 lbs. ('N1H.)2S04 _____________ _
(ditto) _______________________ _
3 T. 'OaOOa + 1285Ibs. NaNOa __ (ditto) _______________________ _
3 T. OaOOa + 1000 Ibs. (NIH.hSO. __________________ _
(ditto) _______________________ _
1 2 . 4-b 6 7 8 9
10
11 12 13 M 15 16 17 18 19 20 21 22.
23 24
Original
.11228 ± .00028
.11277 ± .00032
.11484 ± .00011
.11488 ± .00019
.12129 ± .00010
.12176 ± .00013
.1263() ± .000m
.12632 ± _ 000"22
.12384 ± .00016
.12<375 ± .00005
.123'70 ± .00039
.12307 ± .00016
.11370 ± . 00000
.11379 ± .00<m lost
.11428 + .OC0l6
.1220-2 ± .00021
.12150 ± .00059
.12412 + .00000
.12598 ± .00010
.12381 ± .00010
.12465 ± .00018
.1236.Q ± .OOOlO
. 12340 ± . 00000
.11370 ± .00022
CONCLUSIONS.
.11253
.11482
.12153
.12631
.12479
.12338
.11374
.1142
. 12J76
.12505
.12423
.12354
.112O
.11oo
.11oo
.1157
.1144
.113()
.1137
.1145
.1112
.11445
.1138
.1131
.1137
~.0012
+.0013
-.0028
+.0020
+.0007
-.0007
.0000
+ .0008
-.()()25
+ .()(Xf75
+.0001
-.0000
1. Calcium carbonate increased the total amount of carbon dioxide evolved from the soil, but actually slightly less carbon dioxide was evolved from the organic matter of the limed soils than the unlimed.
2. Sodium nitrate and ammonium sulfate both decreased the amount of carbon dioxide evolved from the soil both when the limed soils receiving treatments of the above materials are compared with untreated limed soils and in the similar cases where no lime was used.
3. Altho the soil used had a lime requirement of only 600 pounds per acre by the Veitch method, yet in the course of about ten weeks only slightly more than a half ton of three tons of added lime r emained in the soil. In the case of the ammonium sulfate treated soils, the amount of lime remaining in the soil was even less.
4. Sodium nitrate and ammonium sulfate decreased the amount of carbon dioxide evolved from the organic matter of the soil.
5. The ammonia lost from the soils by volatilization is pl'1W

-297-
tically negligible except perhaps in the case of the soil treated with both ammonium sulfate and lime.
6. The changes in total nitrogen of the variously treated soils are, in general, so small that nothing more definite will be said. The most significant change seems to be in the unlimed sodium nitrate treated soils.
CARBON AND NITROGEN CHANGES IN SOIL TREATED WITH LHIE AND VARIOUS AMOUNTS
OF STABLE JIANURE.
This experiment was carried out with the same apparatus as the preceding, the same determinations were made, also part of the large sample of Miami silt loam was used.
The treatment of the pots of soils in tone (T) per acre was as follows:
Pot. No. 1, 2 2, 4 5, 6 7, 9 9, 10
11, 12 13, 14 15, 16 17, 18 19, 20 21, 22 23, 24
Treatment. Check 3 T. CaCO g
10 T. Manure 20 T. Manure 30 T. Manure 50 T. Manure 3 T. CaCOg ; 10 T. Manure 3 T. CaCOg ; 20 T. Manure 3 T. CaCOg ; 30 T. Manure 3 T. CaCO g ; 50 T. Manure 2.73 T. MgCOg
1.5 T. CaCOg ; 1.36 T. MgCO g
The manure used was obtained from a compost heap. It was first air dried and then coarsely ground. The precipitated calcium carbonate and magnesium carbonates were used. The magnesium carbonate was analyzed and from the analysis it was added in such amount that equivalent amounts of it with respect to the carbon dioxide content were used as compared with the calcium carbonate. .
The soils were mixed with the lime and the manure and then the pots were placed in the apparatus, which was then frtled from carbon dioxide. To all the soils 100 cc. of fresh soil emulsion was added and to those soils containing manure, 100 cc. of manure emulsion was also applied. '1'0 all the soils a total of 250 cc. of water was added. This 250 cc. included, of course, the soil and manure emulsions. The water was added thru a long funnel, the pots remaining under the bell jars. The experiment was started January 21, 1915, and ran until May 25 of the same year, a total of 124 days. The soils were maintained at the uniform moisture content of 22 p er cent thruout the experiment.

-298-
Carbon dioxide was determined at various periods thruout the course of the experiment as indicated in table XV, which follows:
The methods of analyses were the same as described for the preceding experiments. Because of the similarity of the experiments, not so much explanation will accompany the tables.
In table XV are given the results of the carbon dioxide determinations and in table XVI are given the average amount of carbon dioxide given off per day for each period.
The results for the carbon dioxide determinations have been plotted and appear in plates XVII to XXI.
As is apparent, the plates are only made to shovv a maximum of 500 pounds of carbon dioxide per acre. This was done to save space. On each plate, where there is a value which exceeds this, the proper amount is indicated near where the curve leaves the plate.
On plate XVII are given the cunes for the check plots, for the soils receiving lime, 10 tons of manure, and 10 tons of manure with lime. The curves for the check plots and the limed pots are very similar to the like curves in the pervious experiment. After about 25 days the general tendency of the curves is to be horizontal, with the limed pots having their curve well above the ulllimed. The general tendency of the curves for the· manured pots is very similar to the unmanured, both being above the unmanured pot curves and the limed manured being above the unlimed manured.
The 20 ton manure treatments are given in plate XVJII together with the check and the limed pots for purposes of comparison. The general tendency of the curves is the same as for the ten ton treatments. The curves for the 20 ton treatments are seen to be slightly above those for the corresponding 10 ton treatments.
In plate XIX are given the curves for the 30 ton manure treatments with the unmanured pot curves repeated as usual. No comment need be made on these curves except that their tendency is the same as for the other curves. The same is true of the curves for the 50 ton manure treatments, appearing in plate XX.
In plate XXI are given the curves for the soils treated with magnesium carbonate and magnesium and calcium carbonate. These experiments were carried out as a preliminary to work on a comparison of magnesium and calcium limestones. Recently McIntire and Willis (33) have published data indicating that magnesium carbonate decomposes much more rapidly in the soil than does C:.Jlcium carbonate. From an exam,ination of the curves it is seen that the curve for the magnesium carbonate treatment is above that of the calcium carbonate and that this difference is somewhat greater at first. The curve for the mix--
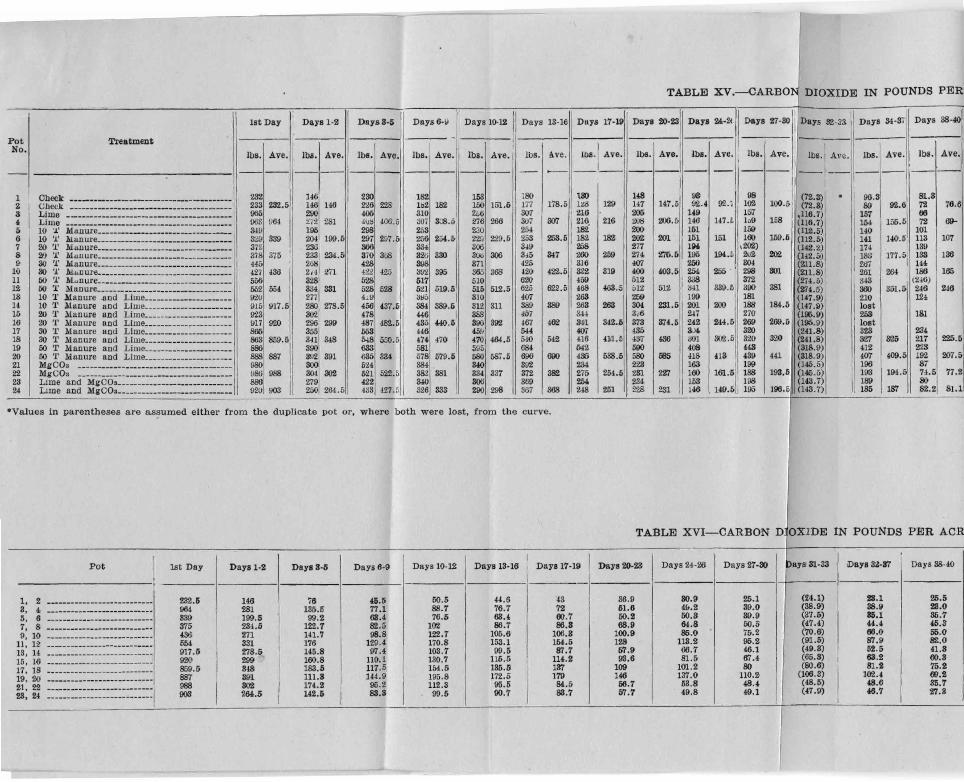
,-
TABLE XV.-CARBON DIOXIDE IN POUNDS PER
1st Day Days 1-2 DaysS-!> Days 6-~ Days 10-12 I Days 13-16 Days 17-19 Daye 20-23 Days 24,-21- Days 27-SQ Days 32-33 Days Si-37 Days 38-40
Pot Treatment ---- ---- ----- ---- ---- ----- --No. lbs. Ave. lbs. Ave. lbs. Ave. lbs. Ave. lbs. Ave. lbs. A.ve_ Ibs _ Ave. ll>s. Ave. Ibs. Ave. lbs. Ave. Ibs. Ave. lbs. Ave. ll>s. Ave.
---- ---- ---- ----- ---- ---- ---- -- ---- -- ---- ----I Check ------------------------.---------- 2S2 146 2SQ 182 153 ISO 18Q 148 9G 98 (72.S) 96_3 81.S 2 Check --------------------------------------- 233 232.5 146 146 2'26 228 1b2 lSi! 150 151.5 177 178.5 128 129 147 J4,7.5 9'2.4 9'2./ 10"2 100_& (72.8) 89 92.6 72 76.6 3 Lime ------------------------------------ 005 200 406 310 256 'J(fT 2J.6 lIDij U9 157 ,116.7) 157 00 4< Lime M;oure::::::::::::::=::::::::::::::== 003 004 ~'i2 281 -lUS 406.5 807 3C8.'; 276 266 80T 'J(fT 216. 216 2IJ8 206. 5 146 147_0 109 158 (116.7) 154; 156.5 72 69-5 10 'J.' &19 195 298 258 230 254 182 200 161 159 (112_5) 140 101 6 10 'J.' Man ure __________________________________ 3"29 339 204 199.5 297 297.5 2:56 254.5 2'29 229.5 258 2:58.5 182 182 202 201 151 151 180 159.5 (112.5) 141 140.5 113 1W 7 20 'J.' Manure _______________________________ 372 236 266 33! 8Q6 3-l9 2158 2i7 1114. (202) (142.2) 174 139 8 '}f) 'J.' Man ure. _________________________________ 378 375 233 234.5 :no 868 S26 38Q BOO 306 3.5 Si7 280 259 274 276.5 195 194.5 2>.12 202 (UZ.5) 133 177.5 133 136 9 80 T Manure _________________________________
445 268 428 398 371 425 316 4W 256 804 (211.8) 267 144 10 80 '1' MaDUl"e.. ________________________________
427 436 214 :m 422 425 39'2 395 865 368 420 422.5 322 3111 400 403.& 254 255 298 8Ql (211.8) 261 264 186 165 11 50 '1' lYldn ure __________________________________ 556 3"28 528 517 510 6"2Q 459 512 338 37'2 (274.5) 343 (246) 12 50 '1' Manure ________________________________
562 564 334 331 528 528 521 5111.51
515 512.5 625 6"22.5 468 463.5 bIZ 512 :m 339.5 390 331 (274.5) 300 351.5 246 246 13 10 '1' Manure ,and Lime ______________________ lI'2U 277 LV iWb 31U 407 263 259 199 181 (147.11) 210 124 14 10 '1' Manure and Li me ______________________ 1115 W7.5 280 273.5 456 437.5 384 389.5 312 311 339 389 263 263 804 231.5 201 200 188 184.5 (147.11) lost 15 20 '1.' Manure and Lime ______________________ 9'23 802 478 446 I 388 4&7 3-l! 316 247 27<1 (196_9) 258 181 HI 20 '1' Manure and Lime ___________ c __________ 91i 920 296 299 487 482.5 435 440.5 300 392 467 462 34<1 342.5 373 374.5 242 244_5 200 269.5 (195_11) lost 17 80 '1' Manure and Llme ______________________ 865 ml 348
553 H6
I 459 544 4W 435 3J4 ~ (241.8) 32S 2S1
18 30 rl' Manure and Lime ______________________ 8<i3 859.5 5,18 550.5 474 470 470 464.5 540 542 4.16 41!1_5 f37 436 001 802.5 3"20 320 (241.8) 'i!/1:l m 217 225.5 19 50 '1' Manure and Lime ______________________ 886 633 581 595 684 542 590 408 443 (318.9) 412 223 20 50 '1' Manure and Lime ______________________
388 887 1 ro' 635 33! 678 579.5 580 587.5 696 600 435 538.5 580 5B5 U8 413 439 441 (318.9) 407 409_5 19"2 007.5
31 MgCOs --------- ---------------- ------------- 980 524 384
I 340 392 234 223 168 199 (145.5) 196 87
22 MgC03 986 988 804 302 621 522_5 3& 881 33! 337 372 382 275 254.5 231 227 180 161.51
188 198.5 (146_5) 193 194.5 7f.5 77.2 23 LIme and-MgCO;:::::::==:::::===:::::::::== 886 279 42"2 340 306 369 254 334 153 198 (143.7) 189 SO 24 LIme and MgCO 3 ____________________________
920 903 250 264. 5 433 4Zi. o 326 333 290 2\lB 367 368 248 251 228 231 148 149.5 195 196.5 (143.7) I 185 187 82.2 81.1
·Values in parentheses are assumed either from the duplicate pot or, where both were lost, from the curve.
TABLE XVI-CARBON D OXIDE IN POUNDS PER ACR
Pot 1St Day Days 1-2 DaysS-a Days 6-9 Days 10-12 Days 13-16 Days 17-19 Days 20-23 Days 24-26 Days 27-80 pays 81-33 Days 3"l-87 Days 38-40
1, 2 ----------- -- -- -- -- -- ------ 232.6 146 76 45.5 50.5 44.6 43 36.9 80.9 25.1 (24.1) 28.1 25.5 8, 4 ------ -- -- -- ------ --------- OO! 281 135.5 77_1 88.7 76.7 721 61.6 4&.2 89.0 (38.9) 38.11 28.0 5, 6 -------- -- -- -- ------ ------- 339 199.6 99_2 63.4 76_0 63.4 80.7 50.2 00.3 89.9 (87.6) 85.1 35.7 7, 8 ---------------- ----------- 875 234.5 12'2.1 82.5 102 86.7 86.3 68.11 64_8 50_5 (47.4) 44_4 45.8 9, 10 ------ ----_ .. ----- --------- 4St) 271 141. 7 98.8 122.7 105.6 106.3 100.9 86.0 75.Z (70.6) 66.0 56.0
11, 12 ---------- -- -.. ------------- 654 331 176 129.4 170.8 153_1 154.5 128 113.2 95.2 (91.5) 87.9 82.0 13, 14 ---------- -------- -- -- ----- 917_" Zi8.1i 145.8 97.4 103 .7 99_5 87.7 67.9 66.7 46_1 (411.3) 52.5 41.3 15, 16 ------ -- --- - ---- -_ .. --- ----- 920 299 180.8 110.1 130.7 115.5 114.2 93.6 81.5 67.4 (85.3) 68.2 80.3 17, 18 -- -- -------- -- ---- -- ------- 859.fl Si8 183.5 117.5 154. Ii 185. Ii 187 109 101.2 SO (SO.6) 81.2 75.2 19, 20 ------ -- -- -- -- ---- --------- 837 391 111.8 144.9 195.8 172.5 179 146 137.0 110_2 (100.3) 102.4 69.2 21. 22 ------- ----------- --- ----- 988 8Q2 174_2 95.2 112_3 95.6 84_5 56.7 58.8 48.4 (48.5) 48.6 35.7 28, 24 --- --- --_ .. -- ---- ----------- 903 2M.5 142.5 88.3 99.5 90.7 33.7 57.7 49.8 49.1 (47.9) 46.7 27.3

;:c:)~c
-
[N POUNDS PER ACRE GIVEl'l OFF IN THE VARIOUS PERIODS. ,
1 ays 34-37 Days 38-40 Days 41-44 Days 4ll-4:1 Days 48-51 Days 52-54 Days 66-58 Days 69-65 Days 86-72 Days 75 -79 Days 76-79 Days 8>-86 Da s 87-113 Days 94-100 Daya10l-1W Days 108-114 Days11J).l21 DaY8 U22-124 Total
--- ----- ----- ----- ---- ----- ----- --' ---- ----- ----bs. Ave . Ibs. Ave. Ibs. Ave. Ibs. Ave. lOs. 1 Ave. IbS. j Ave. Ibil. Ave. Ibs. Ave. Ibs. Ave. Ibs. Ave. Ibs. Ave. Ibs. Ave. It Ave Ills. Ave. Ibs. Ave. Ibs. Ave. Ills. Ave. Ibs. Ave. Ibs. Ave.
r -- ---- ---- ---- .---- ---- ---- ---- ---- -- ._- 1- -- -- -- ---- ---- ---- ---- ----
81.8 83.8 71.4 13 00.7 84.1; (147) 148 198 160 17 175 165 lB9 135 (49) 3769 92.6 72 76.6 SO. 5 81.6 71.4 71.4 d8.2 7Il.6 67.5 67.1 83 83.8 (Hi) (U7) 147 147.5 197 197.5 159 169.5 ~1 174.5 178 176.6 169 167 187 188 140 137.5 49 49 37;l8 3749
00 150 101 96.4 79.8 131 (212) 100 257 237 234 240 274 178 00 6313 155.5 72 69- 147 148.5 99.2 100.1 100 97.7 72.8 76.3 130 130.5 (i.l2) (212) 189 190 259 2.58 200 ZI9.5 2u 249 .5 242 2a8 235 237.0 261 267.5 190 184 90 00 &290 6301
101 li6 118 115 98.5 139 1(284) j ~ 376 262 (: 262 234 281 195 (90) li686
~ 140.5 113 107 128 122 117 117.5 114 114.5 100 99.3 136 137.5 (234) (234) 258 259.5 374 375 (262) 262 280 252 2.'i7 2:)! 244 293 287 206 200.5 90 90 5728 5707 139 200 136 140 130 17& 281
I ~ (299) 171 266 31( (3"20) (314) 304 228 124 6357
II 177.5 133 136 193 196.5 146 HI 146 143 139 134.5 206 190.5 375 328 314.& (404) 3"21 231 201 334 300 34' 3'26 (320) (314) 311 307." 23"2 230 89.3 106.7 72.6 7051 [ 144 25lO 191 171 . ISO 211 35"2 (43U) 2M 393 ~ (407) (407) 415 286 107 8843
2&1 186 165 198 224 186 138.6 174 172.5 178 li9 22D 215.5 375 363.6 4W 382 (40.) 4.17 231 .5 342 367.5 408 (407) (l07) S99 407 284 286 93 100 86H 8758 g (240) (349) 272 284 276 388 727 I 532 (486) 278 442 ~ (518) (517) 508 336 132 11857
35a.& 246 246 349 349 283 276.6 <S8 286 282 279 392 390 750 738. Ii 760 &6 (668) 577 :ll>'2 33Q 520 481 518.5 (518) (517) .'>24- 516 350 343 137 184.5 12i>W l2205 0 124 ISO 124 135 129 144 288 51S (312) 174 282 42i (400) (394) 87S 182 115 8124 ~t 181 212 158 181 140 199 3Q4 300 (341) 100 300 :rn (378) (386) 406 264 106 8ll«J ~t
156 424 (WT) 286 471 (.83) (483) :I 234 244 272 179 200 434 446 5ZI 363 151 10895 r 320 217 225.5 272 258 199 177.5 237 254.6 209 1114 248 254 300 412.5 435 429.5 (556) 531 318 498 4,71.5 49' 483.1> (.83) (483) 445 483 295 329 173 162 10912 10900 2 223 364- 268 tdi 270 325 (645) 765 (721) 546 : 592 535 6a 427 167 IS8&!
~ 409.6 19'2 207.5 <172 368 (116) 192 (286) 286 252 261 324 324.5 (645) (&5) 7.'>4 759.5 771 746 no ~ 750 698 714 650 . 621 565 550 603 608.5 430 428.5 161 1& 14143 13998 87 179 125 146 llS 136 (231) 250 (326) 256 3ii 294 256 324 236 99.2 U51
8 19!-5 74.5 77.2 197 188 125 125 138 142 114 113.5 136 136 (231) (231) 246 248 3"26 326 200 2.,"8 ~ 311 295 294.5 257 256.5 278 301 231 233.51
98.5 98.9 7408 7430 9 80 178 13"2 132 112 120 (2"27) 253 330 260 ~ 262 295 230 94 .5 7088 5 187 82.2 8].1 174 176 125 128 .• 126 129 1~ 110 122 124 (227) (227) 23Q 241.5 265 297.5 236 248 284 295. 5 282 289 238 247.5 (2115) 295 219 2"' 4.5 99.2 96.9 683Q 695Il
UNDS PER ACRE GIVEN OFF PER DAY IN THE VARIOUS PERIODS.
3"l-37 Days 38-40 Days 41-44 Days 45-47 Days 48-51 Days 52-i>4 Days 55-011 Days O9-6Ii Days 66-72 Days 73-79 Days 80-86 D ys 87-93 Days 94-100 iDays 101-107 Days 1fj8-.]4 Days 115-121 Days J2l(-124
--13.1 25.5 20A 27.1 17.7 22. 4 20.9 (21.0) 21.1 28.2 22.7 24.9 25.2 .~3.8 26. 8 19.6 16.8 !B.II 211.0 87.1 33.4 24.4 25.4 32.6 (80.3) 27.1 36.8 31.3 85.6 34.0 33.9 38.2 26.2 30.0 15.1 35.7 30.& 39.2 28.8 38.1 34.2 (33.4) 37.0 58.5 37.8 40.0 36.7 3LS 4],0 2l'.6 30.0 ~.4 45.3 49.1 47.0 35.7 44.8 42.6 46.8 44.9 50.3 42 .S 46.6 (45.7) (44.8) 43 .9 3"2.8 35 . 5 16.0 00.0 56.0 62.8 43.1 69.6 53.8 61.8 58.1 59.6 52.4 58.0 (58.0) (58.0) 58.0 40 .7 33.3 l7.11 82.0 87.2 92.2 7],5 98.0 72.& 105 92.4 82.5 68.6 74.0 (73.9) (73.8) i 73.6 49 .0 44.8 ,2.6 41.8 45.0 41.3 83.8 43.0 36.0 41.1 74.0 43. 5 40.3 60.5 (58 .3) 56.2 54 .0 26 .0 38.3 13.2 60.3 53.0 5"?7 45.2 46.6 49.7 43.5 42.8 48.8 42.8 53.1 (58.7) (55. 2) 57 . 11 37 .7 35.3 11.2 75.2 &.5 59.2 62.6 64.6 &.5 58.9 61.4 75.6 62.3 69.2 (69.1) (69.1) 611.0 47.0 .'>4.0 12.4 09.2 92.0 (81.7) 71.5 37.0 81.1 (92.2) 1~ 106 99.7 100.2 &'.6 78 .5 86 .8 6],1 49.6 1S.6 85.7 47 41.7 35.4 37.S 34.0 (34.4) 35.4 46.6 36.9 44.4 42 ."7 36.8 43 .0 33.3 8"2 .9 r·7
27.3 44 42.8 8"2.2 85.6 81.0 (32.4) 34 .6 42.4 35.4 42.2 41 : .. 35.3 42.2 3"2.0 32.3
,
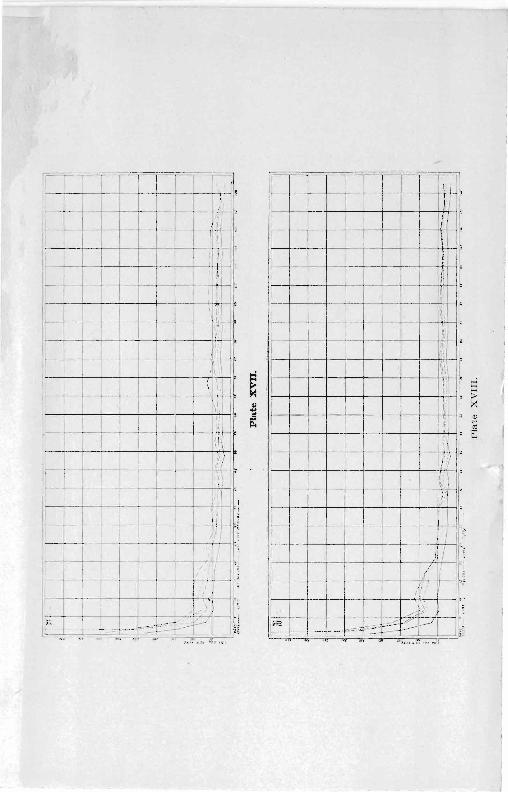
I I I I I I! 1 1 IT,"
i I ,rr
I I 'II
>--' --T---+I--i-+-+--+-I~ I I,; I' -+--+-~-+-L--..!.-----,----nl-----:-Il',.4-\1 I' E
I -+-t--t---+--+-~I -LI -----"I I'_..+_ \, ~ I I 1 \i,
-+1 ----7-1 -+-+-+--+---,---L~" ' £ ,--t---;--t--t-+-+-+--l--++"W ~
I i (I 1 ------r---+-~--7-I--+-+--+----1-+\--/1 I ~
If' ~
! 1 ill ~ i I, I I'; ,
I') I I
I I \ : I "i I 1 ,)' '~
1 ,r-i-i
,
I I
I
•
I I I
I
I I
I I I
I I
I
Ii I n
I Ii/ 11
I l
/' ,': ~ . fTI' 1)1 'I: ' I'; ,
li\
II; -'I 'T'
I ~ 1
1\\ t i! " ~
I: ,
/1' ,/
1
I /
, .' ;.
I ~ I "-,
17 .
1 , I ,
I,' ' '::.(
I'
I l i',
1 I I

I
I I : ~ I,: I i I
I!I: I 1~~~~-4-4-+-+-~I!II:~;
'I:
i::
I: 1 ~~~--+-~~--+-~-4--~~14·~1
1~~~~~~-+-+-4~H-
I f.--+--------j-l--+--+--+--+-+-++--I.

--301-
TABLE XVII. CARBONATE CONTENT OF THE SOILS. C02 in lbs. I CaCO, in lbs I
Soil per acre Average per A. Average
Original 298 676 1 53.3 121 2 53.3 53 .3 121 121 3 818 1860 4 804 811 1830 1845 5 98 222 6 178 138 405 313 7 249 565 8 53.3 151 121 343 9 -14.4 101
10 89 66.6 202 151 11 178 405 1.2 142 160 323 364 13 814 1850 14 814 1850 15 969 2200 J G 969
2700 2200
l/ 1191 IS 1192 1191 2702 2701 19 1360 3045 20 1299 1330 2950 2997 21 222 505 22 187 204 425 465 23 506 1150 24 506 506 1150 1150
ture of calcium and magnesium carbonates is in general between the ones for the pure carbonates.
'I'he data in regard to the carbonate content of the soils are given in table XVII. 'I'he results are given in terms of carbon dioxide and calcium carbonate.
The results given in table XVII are interesting. The soil had a lime requirement according to the Veitch method of 600 pounds of calcium, carbonate pel' acre, yet at the end of about four months of three tons of added calcium carbonate less than one ton was left in the soil. Another interesting feature is that more calcium carbonate was found in the limed manured soils than in the soils receiving lime only. Also, the higher manured soils retained the larger amounts of calcium carbonate. This shows that by the decomposition of the manure no excess of acids over bases was produced. It also indicates that by the addition of stable manure no depletion of lime was caused, rather a conservation. Another interesting point is that the magnesium carbonate was much more completely decomposed than the calcium carbonate.
The carbon dioxide which is the direct result of the decomposition of the organic matter has been computed and the results are given in table XVIII. In the last column of the table the excess of carbon dioxide given by each set of limed pots over the corresponding unlimed is given. With the exception of the twenty ton treatments the effect of the carbon dioxide is quite apparent. From the curves discussed above, it is observed that so far as is apparent there is no tendency for the curves for the limed pots to approach that of the unlimed, so that if they should both keep on in a horizontal direction the excess of carbon
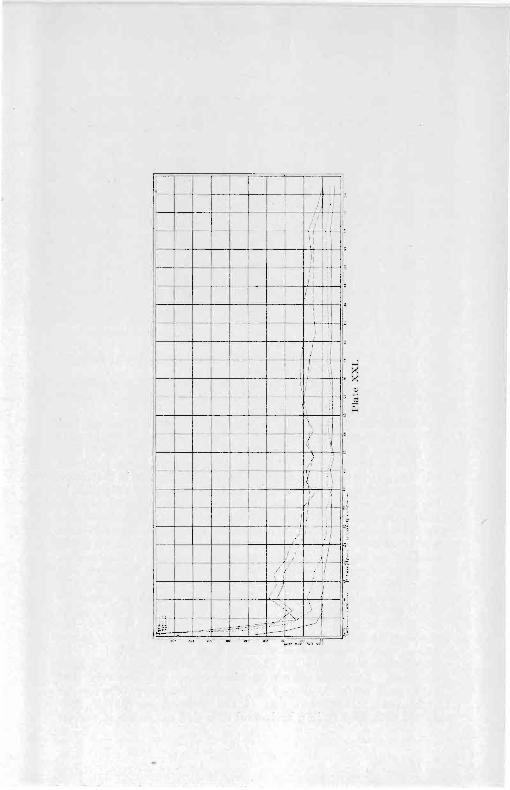
/
I I /
, I
,I I" II
;i / I
I
\
I I
! I I: II
\
I~
,)
1/
H ~ ~ <I)
"'ol p:;
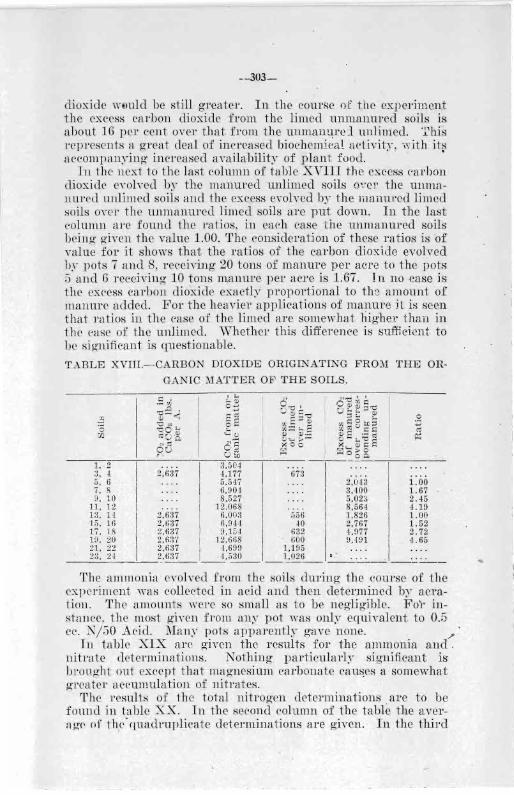
--303-
dioxide wtmld be still greater. In the COUl'i';C nE the expel'imeu,t the excess carbon dioxide from the limed unmanured soils is about 16 pel' cent over that from the unmanurc:l unlimec1, 'l'his represents a great deal of increased biochemical activity, ',','ith it~ accompanying increased availability of plant food , .
In the next to the last column of table XVIII the excess earbon dioxide eyolved by the manured unlimed soils over the unmanureel unlimed soils and the excess evolved by the manured limed soils over the unmanured limed soils are put down. In the last column are found the ratios, in each case tne unmanured soils being given the value 1.00. The consideration of these ratios is of value for it shows that the ratios of the carbon dioxide evolved by pots 7 and 8, receiving 20 tons of manure pel' acre to the pots 5 and 6 receiving 10 tons manure pel' acre is 1.67. ]n no case is the excess carbon dioxide exactly proportional to the amount of manure added. For the heavier I:1pplications of manure it is seen that ratios in the case of the limed are somewhat higher than in the case of the unlimed. 'Whether this difference is suffici.ent to be significant is questionable.
TABLE XVITI.-·CARBON DIOXIDE ORIGINATING FROM THE OR·
GANIC ?fATTER OF THE SOILS. , '-
\: • ~ Q) .- 'if) O+-'
'g:e~ ~~ :go.... 21: ro{) <~ '- Q
,," - "',, ~o 8g;,
I I I
I, 2 3,504 3, 4 2,637 4,177 5, 6 5.547
678--1-2,043
7,8 6,90 1 9, 10 8,527
11, 12 12.068 13, 14 2,637 6,003 556 15. 16 2,637 6,941 40 17, 18 2,637 9,15·1 632 19, 20 2,"~'1 12,668 600 21, 22 2,637 1,699 1,195
I 3,400 5,023 8,564 1,826 2,767 4,977 9,491
1.00 1. 67 2.45 4.19 1.00 1.52 2.72 4.65
__ ~~_I _2.,Sl.I ___ .1,~ _~ _' . _______ ___ _
The ammonia evolved from the soils during the course of the experiment was collected in acid and then deterJllined by aeration. The amounts wer'e so small as to be negligible. FOl' instance. the most given from any pot was only equivalent to 0.5 cc. N/50 Acid. Many pots apparently gave none. "
In table XIX are given the results for the ammonia and. nitrate determinations. Nothing particularly significant is brought out except that magnesium carbonate cau!'!es a somewhat greater accumulation of nitrates.
The results of the total nitrogen determinations are to be fonnd in table XX. In the second column of the table the avern g'f' of t h,c' quadruplicate determinations are given. In the third
..
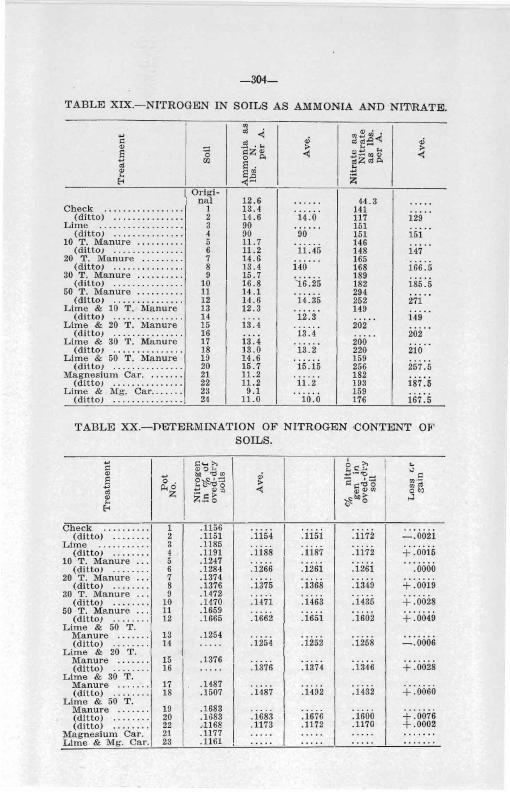
-304-
TABLE XIX.-NITROGEN IN SOILS AS AMMONIA AND NITRATE.
'" .., oj < ~~2< .: ·~Z;;
.,; .,; <1) :>- ... ~ :>-S '0 o "'- ..: .s:::rn~ <: ~ w. S ojZoj",-... <1) au;
~ '"" Eo< ..::e I Origi- I i nal 12.6 ...... 44.3 · ....
Check , ......... , . .. . . . 1 13.4 . ... . . 141 (ditto) . , . " .. . .. ... . . 2 14.6 14.0 117 129
Lime . . .. . .. ... . . .. . .. . 3 90 . ..... 151 . . . .. (ditto) ..... . .. . ...... 4 90 90 151 151
10 T. Manure . .. , .. . . .. 5 11.7 · .... . 146 . , ... (ditto) .. . ..... ..... . . 6 11.2 11.45 148 147
20 T. Manure . . . . . . .. . 7 14.6 165 · . . .. (ditto) ...... . . .. ... .. 8 13.4 140 168 166.5
30 T. Manure . ......... 9 15.7 Cis :25 189 i85 :5 (ditto) .. . ..... . .. . .. . 10 16.8 182
50 T. Manure . . . . . . . . . . 11 14 .1 . .. . .. 294 27i' . (ditto) · . . . . . . . . . . . . . . 12 14 . 6 14.35 252 Lime & 10 T. M a nure 13 12.3 ... . . . 149
(ditto) · . . . . . . . . . . . . . . 14 . '" 12 . 3 .... . 149 Lime & 20 T. M a nure 15 13 .4 . . .. . . 202 202 ' . (ditto) ... . . . ......... 16 . ... 13 .4 . ... . Lime & 30 T. Ma nure 17 13 .4 · iil:2 ' 200 2io ' . (ditto) .............. . 18 13 . 0 220 Lime & GO T. M a nure 19 14 . 6 . . .... 159 . . . ..
(ditto) ....... . . . .. .. . 20 15.7 15.15 256 257.5 Magnes ium Ca r . ... . ... 21 11.2 . . . ' " 182 · ....
(ditto) lVIi.· 'C;':r:: : : : : : I 22 11 . 2 11.2 193 187.5
Lime & 23 9.1 · ... .. 159 iS7 :5 (ditto) · . . . . . . . . . . . . . . 24 11.0 10 . 0 176
TABLE XX.-nETERMINATION OF NITROGEN ,CONTENT 0]1' SOILS.
.., I :::c.... ~ e~ ~ I ... .: Q) :> ~,
" <1) .., bO '"CJ ", .i +-J '-rc .: a I
0 ~~rd~ :>- 'a ,:.-d'8 I "'--.., il<o ..:
I
",ol oj Z !:: ~ ~ :.':I <1) <1)'" o b.'l <1) Z.~ 0 ~bO~ r-J '""
I Eo< I
Check " , . . , .... 1 .1156 ... ..
I ... .. .....
(ditto) .. .. , ., . 2 . 1151 .1154 .1151 . 1172 -.0021 Lime . . . .. ... . .. 3 .1185 ... .. . . . . . . ... . -+ :00i5 (ditto ) 4 .1191 .1188 . 1187 .1172 10 T . Manure .. . 5 .1247 ... . . ... . . . . . . . . ......
(ditto) 6 .1284 .1266 .1261 . 1261 .0000 20 T. M a nure ... 7 . 1374 ... .. ... . . . .. .. . ... . ..
(ditto) 8 . 1376 . 1375 .1368 .1349 + . 0019 30 T. Manure . . . 9 .1472 . .. . . ... . . . . . . . . ... . .
(ditto) 10 .1470 .1471 .1463 . 1435 + .0028 50 T. Mf!.nure . . . 11 .1659 · . . .. . . .. . . . ... -+ :0049 (ditto) 12 .1665 .1662 .1651 .1602 Lime & 50 T .
Manure ....... 13 .1254 · . . .. . ... . ., .. . ':':' :0006 (ditto) 14 . . .. , . 1254 . 1252 . 1258
Lime & 20 T. Manure .... . . . 15 , .1376 I ... .. .. , .. . .. .. -+ :0028 (ditto) 16 . . . . . . 1376 .1374 .1346
Lime & 30 T .
I Manure ..... . . 17 .1487 · .... . .. . . . . . . . . ... . .. (ditto) 18 . 1507 .1487 . 1492 .1432 + .0060
Lime & 50 T . Manure .. . . ... 19 .1683 . .. ..
I . . .. .
:isoo -+ :0076 (ditto) .. . ... .. 20 .1683 . 1683 .1676 (ditto) 22 .·1168 .11,3 . 1172 . 1170 + .0002
M a gnesium Car . 21 .1177 . . ... . ... . . . . . . . .... . . Lime & M g. Car. 23 . 1161 ..... . ... . ..... . . .... .

-305-
column are the averages of the duplicate pots. In the next column the "corrected values" are given. This" correction" was due to addition of lime and loss of weight due to loss of carbon dioxide. The values in the "corrected" column therefore represent per cent of nitrogen in the soils after the experiment, calculated back to the original oven dry soil. In the next column are the values for the percentage of nitrogen in the original mixtures. This was obtained from the nitrogen determinations on the original soil and the manure. The last column is self explanatory.
The check pots showed a slight loss and the limed a slight gain of nitrogen. This same thing was found in the previous experiment.
In the soils receiving 10 tons of manure there was practically no change in case of either the limed or unlimed pots, but in the remainder of the' manured pots the increases in nitrogen were notable, somewhat greater increases being found in the limed soiTs. The heavier treatments of manure also gave greater increases in nitrogen than the lighter, This increase in nitrogen is no doubt due to the easily available energy material added in the manure. Certainly there has been no denitrification, or if there has been, it has been more than made up for by the great azofication.
CONOLUSIONS.
1. Calcium carbonate in the course of 124 days increased both the total amount of carbon dioxide evolved from soil and the amount given off by the organic matter in the soil. The same is true for the soils receiving applications of 10, 20, 30 and 50 tons of manure per acre.
2. Less calcium carbonate was decomposed from the soils receiving manure than from the unmanured. The gre~ier the application of manure the less was the decomposition of the carbonate.
3. The ammonia evolved from the soil under the conditions of the experiment was negligible. It is believed that the conditions of this experiment approximate field conditions closely enough to venture the stAtement that under normal conditions there is no danger of the loss of nitrogen from the field by volatilization of ammonia.
4. There was quite an accumulation of nitratc'3 in the manured soils. Magnesium carbonate caused a somewhat greater accumulation of nitrates than did calcium carbonate.
5. The addition of large amounts of manure to the soil caused an increase in the total nitrogen after a period of about four months. It is suggested that this accumulation of nitrogen was caused by increased azofication due to easily available energy material added with the manure.

BlBLIOGRA P BY
1. Bail, O. Untersuchungen eininger bei del' Vermesung pflanzlicher Stoffe thatigen Spross.ilze. Central. Bakt. II. Abt. 8 : 567. 1902.
2. Bail, O. Versuche ueber di e. Vermesung pflanzlicher Stoffe. Central Bald. II. Abt. 9 : 501, 538, 577, 633. 1902.
3. Barakokov, P. The carbon dioxid e content of soils during different stages of growth of plants. Russ. Jour. Expt. Landw. 11: 321. 1910. (Expt. Sta. Record 28: 523.)
4. Bentzen, G. E. Die Kohlensaure in der Grundluft. Ze itsch. f. BioI. 18 : 44. 1882.
5.. Berthelot, P. M. E. Observation s ur la formation de l 'ammoniaque et d e composes azotes volatils aux depens d e la terre vegetale et des plantes. Compt. rend. 109 : 419. 1889.
6. Berthelot, P. :/vI. E. Nouvelles observations s ur les composes azotes volatils emis par la terre vegetale. Compt. rend. 112 : 195·197. 1891.
7. Boussingault, J. B. and Lewy B. Memoire s ur la composition de l'air confine dans la terre vegetale. Compt. rend. 35 : 756. 1853.
8. Burges, P . S. The almr:inum reduction method as applied to the d etermination of nitrates in alkali soils. Univ. Cal. Pubs. Agr. Sci. 51-62. 1913.
9. Dalton, J. On the constitution of the atmosphe.re. Phil. Trans. 2: 174. 1826.
10. Darbi shire, F. V. and Russel, E. J. Oxidation in soil and its rela· tion to productivity. J. Agr. Sci. 2 : 305. 1908.
11. Ebermayer, E. Ueber den Kohlensauregehalt e ines bewaldeten und nichtbewaldeten Bodens. Landw. Vel's. 23: 64. 1879.
12. Ehrnberg, P. Zur Ammoniakverdunstung aus Erdboden; gleichzeitig einige ausfuhrungen ueber Stickstoffbilanz·Gefassversuche. Landw. Ztg. 61 : 41·53. 1912.
13. Fleck, H. Ueber den Kohlensauregehalf derF Grundluft. Neu. Repert. Pharm. 22: 483. 1873.
14. Fodor, J. V. Del' Kohlensauregehalt der Bodengase Vierteljahresscbr. f. offentl. Gesund. 7 : 205. 1875 .
15. Forster , J. Untersuchungen ueber den Zisa, emjang d er luft im Boden und Wohnung. Zeitsch. f. BioI. 11 : 392. 1875.
16. Fraps, G. S. Oxidation of organic compounds in the s oil. Texas Bull . 181. 1915.
17. ji'rf'd, E. D. and Hart, E. B. The comparative effect of phosphates and sulfates on soil bacteria. Rsch. Bull. Wis. Agr. Exp. Stat. 35 . 1915.
18. Hall, A. D. and Miller, N. H . J. On the absorption or aml1lonia from the atmosphere . Jour. Agr. Sci. 4: 56 . 1911.
19. Hannen, F. Unter suchungen u eber den Einfluss del' physi kaliscben Beschaffenheit des Bodens auf die Diffusion del' K ohlen saure. Wollny's Forsch. 15 : 6. 1892.
20. Hesse, W. Ueber den Kohlensauregehalt del' Grober luft c\rcll. f. Hyg. 401. 1883.
21. Hutchinson, C. M. Report. Agr l Research Inst. and ColI. 1'1.:>'a (India). 78-83. 1911-1912.
22. Jodidi, S. L. Influence of var ious factors on the decomposition of soil organic matter. Rsch. Bull. Iowa Agr. J;;xpt. Sta. :1. J 911.
23. Kissling, R. and Fleischer, M. Die Bodenluft in besondeten and nicht besondeten Hochmoor und Nieriprungsmoorboden. Landw. Jahrb. 20: 876. 1891.
24. Klein, M. A. St udies in the drying of soils. J. Am. Soc. Agron. 7: 49. 1915.
25. Kober, P. A. and Graves, S. S. Quantitative ammonia distillati() n

-307-
by aeration, for Kjeldahl, urea and other nitrogen estimations. lIt. Jour. Amer. Ch ern. ,Soc. 35 : 1594. 1915.
26. Lau, E. Beitrage zur Kenntnissder Zusammensetzung der '!l1
Ackerboden befindlischen Luft. Inaug. Dessert. Rostock. 1906. 27. Lemmermann, 0., Aso K., Fisher H. und Fresenius, L. Unter
s uchungen ueber der Zersetzung der Kohlenstofferdingungen verschiedener organischer Substanzen im Boden, spezial unter dem Einfiuss von Kalk. Landw. Jahrb. 41 : 217-256. 1911.
28. Lemmermann, 0., Blanck, E., Heinitz, B. und von Wlodeck, I. Untersuchungen ueber das Verhalten des Ammoniak-Stichstoff im gekalkten und ungekalkten Boden. Landw. Jahrb. 41: 163·216. 1911.
29. Lemmermann, O. und Fresenius, L. Ueber die Erhohung der ammoniakbinden Kraft des Bodens unter den Einfiuss von Kohlensauren Kalk. Landw. Ztg. 61 : 240-253, 274-285 . 1912.
30. Lemmermann, O. und Fresenius, L. Same as above, continued. Landw. Jahrb. 45: 127-135. 1913.
31. Lewis, F. R. and Cunningham, D. D. The soil in its relation to disease. Eleventh annual report of the Sanitary Commission with the Government of India. 1874.
32. Mac Intire, W. H. and Willis, L n. Soil carbonat6s--A new melhod of determination. Bull. Tenn. Agr. Exp. Stat. 100: 83-97. 1913.
33. MacIntire, W . H. The non-existence of magnesium carbonate in humid soils. Bull. Tenn. Agr. Evp. Stat. 7. 1914.
34. Marr, T. Die Koolzuurproductie in Onzen Bourogrond. }1eded. Proefstat. Oost. Java. 4 ser., 503. 1908.
35. Moller, J. Ueber die freie Kohlensaure im Boden. Mitth. forst!. Versuchs Oeste.rreichs 1: (2). 1879.
36. Nichols, ' V. Observations on the composition of the ground atmosphere in the neighborhood of decaying organic matter. . Sixth annual report of the Mass. State Board of Health. 1875.
~7. Petersen, P. Einfiuss des Mergels auf die Bildung von Kohlensaure und Saltpetersaure im Ackerboden. Landw. Verso 13 : 155.
1870. 38. Pettenkofer, Max V. Ueber eine Methode die KohlensaUl;e in del'
atmospharischen Luft zu bestlmmen. Chern. Soc. Trans. 10: 292. 1858.
39. Pettenkofer, Max V. Ueber den KohlensauregehaJt de'r Luft in Boden von Mtinchen yerschiedenen l'iefen. Ze itsdl. f. BioI. 7: 395. 1871; 9 : 25. 1873.
40. Pettenkofer, Max. v. Ueber den Kohlensauregehalt del' Luft in del' Lybischen 'Vuste ueber und un tel' der BodenobNilaclie.
Zeitsch. f. BioI. 11 : 381. 1875. 4 J. Port. · Ueber den Kohlensauregehalt der Grundluft. Bayerisches.
Artztl. Intelligenzblatt. 9. 1875. 42. Potter, R. S. and Snyder, R. S. The. determination of ammonia in
soils. Rsch. Bull . Iowa Agr. Exp. Stat. 17. 1914. Jour. Indus. and Engin. Chern. 7: 221. 1915.
43 . Potter, R. S. and Snyder, R. S. The determination of nitrates in soils. Rsch. Bull. Iowa Agric. Exp. Stat. 24. 1915. Jour. Indus. and Engin. Chern. 7: 863. 1915.
44. Renk, F. Die Kost in Krankenhause Mtinchen. Ann. d. Stadt. Allg. Krank. Mtinchen. 1: 535. 1878.
45. Riglers, G. v. Ueber die Selbstreinigung des Bodens. Arch. f. Hyg. 30: 380. 1897.
46. Russel, E. J. Oxidation in soil and its relation to productivity: J. Agr. Sci. 1 : 261. 1905.

-308-
47. Russel, E. J. and Appleyard, A. The atmosphere ·of the soil; its composition and the cause of variation. Jour. Agr. Sci. 7 : 1. 1915.
48. Salger, ·C. Boden-Untersuchungen mit besonderen Berucksichtigung des Einflusses der Ventilation auf die Kohlensaure Menge im Bodn. In Aug. Dissert. Erlangen. 1880.
49. Schloesing, T. Sur l'atmosphere confinee dans Ie sol. Compt. Rend. 109: 618. 1889.
50. Schloesing, T. Sur la combustion lente de certaine matieres organique. Compt. Rend. 106: 1293. 1888.
51. Schloesing, T. Sur Ja combustion lente de certaine matieres organique.Compt. Rend. 108: 527. 1889.
52. Schloesing, T. Sur les relations de l'azote atmospherique. avec la terre vegetale. Compt. Rend. 109 : 210c213. 1889.
53. Schulze, F. Ueber quantitative Hestimmunc' der Kohlensaure zu agricultur chemischen Versuchs-~wecken. Landw. Verso 12: 1. 1869.
54. Sewerin, S. A. Die im Miste vorkommenden Bakterien und der physiologische Rolle bei der zersetzung Desselben. Central. Bakt. II. Abt. 13 : 616. 1904.
55. Sewerin, S. A. Die ]\'[{lbilisierung der Phosphorsaure des Bodens unter dem Einflus der Lebenstatigkeit der Bakterien. Central Bakt. II. Abt. 28 : 561. 1910.
56. Smolen sky, P. Ueber den Kohlensauregehelt der Grundluft Zeitsch. f. BioI. 13: 383. 1877.
57. Stoklasa, J. and Ernst, A. Ueber den Ursprung die Menge und die Bedeutung de.'l Kohlendioxyds im Boden. Central. Bakt. II. Abt. 14. 1905.
58. Stoklasa, J. and Ernst, A. Ueber den Ursprung die Menge und die Bedeutung des Kohlen dioxyds. im Boden. Ztschr. Zuckerindue. Bohmen, 31: 291-401. 1911.
59. Stoklasa, J . Biochemischen Kreislauf des Phosphat-Ions im Bod~n. 'Central. Bakt. II. Abt. 29: 401. 1911.
60. Suprunenko, A. Carbondioxide in ground air. Zap. Novo-Alex. Inst. 21: 59. 1910. (Exp. Stat. Re.cord 25: 621.)
61. Takeuschi. T. Can calcium carbonate cause loss of ammonia by evaporation from the soil? Bul. Col. Agr. Tokyo Imp. Univ. 7: 3. 433-436. 1907.
62. Van ISuchtelen, F. H. H . Ueber die Messung der ebenstatigflkeit der aerobiotischen Bakterien im Boden durch die Kohlensaure produkUon. Central. Bakt. Abt. 2 : 28. 45-63. 1910.
63. Wolffhiigel, G. Ueber den Kohlensauregehalt in gerollboden von Miinchen. Zeitsch. f. BioI. 15: 98. 1897.
64.Wollny, E. Beitrage zur I<'rage des Einftusses der Klimat und der Wetterung auf den Kohlensaurekehalt der Bodenluft. Wollny's Forsch. 5: 299. 1882.
65. Wollny, E. BeitTage zur Fra6"e der Schwankungt)n in Kohlensauregehalt der atmospherischen Luft. Wollny's Forsch. 8: 405. 1885.
66. Wollny, E. Der Kohlensauregehalt der Bodenluft in dem desondeten in dem mit sand gemischten, und in dem universandeten Moorboden . Wollny's Forsch. 20: 195. 1897-1898.
67. Wollny, E. Untersuchungen ueber den Einflus der Farbe des Boden auf des sen Feuchtigkeitsverbaltnisse und Kohlensauregehalt. Wollny's Forsch. 12: 385. 1889.
68. Wollny' E. Untersuchungen ueber den Einfluss der Pflanzendecken auf den Kohlensauregehalt der Bodenluft. Wollny's Forsch. 19: 151. 1896.
69. Wollny' E . Untersuchungen ueber den Einfluss der Pflanzendecke und Beschattung auf den Kohlensauregehalt der Bodenluft. Wollny's Forsch. 2: 1. 1880.

-309-
70. Wollny' E. Untersuchungen uber den Einfiuss der physikalischen Eigenschaften des Bodens auf dessengehalt an freier Kohlensaure. Wollny's Forsch. 9: 1&5. 1886.
71. Wollny' E . Untersuchungen ueber den Einfiuss der physikalischen Eigenschaften des Bodens auf dessen Gehalt an freier Kohlensaure. Wollny's Forsch. 4: 1. 1881.
72. W·ollny, E. Untersuchungen ueber den Kohlensauregehalt der Bodenluft. I. Landw. Verso 25 : 373. 1880.
73. Wollny, E. Untersuchungen ueber den Kohlensauregehalt der Bodenluft II. Landw. Verso 36: 197. 1889.
74. Zhukov, G. I. Carbon dioxide of .the. air and soil. Russ. Jr,ur. Exp. Landw. 12: 552. 1911. (Exp. Stat. Record )

OFFICERS AND STAFF IOWA AGRICULTURAL EXPERIMENT STATION
STATE BOARD OF EDUCATION Hon. Hon. Hon. Hon.
D. D. Murphy, Elkader Hon. E P. Schoentgen, Council Bluffs Paul E. Stillman, J e fferson Hon. W. C. Stuckslager, Lisbon Parker K . Holbrook, Onawa Hon. George T. Baker, Davenport Henry iVL Eichler, Washington Hon. Frank F. Jones, Villisca
Hon. Charles R. Brenton, Dalias Center OFFICERS
Hon. D. D. Murphy, Elkader, Preside nt Hon. W. H. Gemmill, Carroll, ~ ~ .. retary
FINANCE COMl\lITTEE Hon. W. R. Boyd, President, Cedar Rapids Hon. Thos. Lambert, Sabula
Hon. 'V. H. Gemmill, Carroll AGRI CULTURAL EXPERIMENT STATION STAFF
Raymond A. Pearson, M. S. A., LL. D., Presh lent C . F. Curtiss, M. S. A., D. S., Director
VV. H. Stetvenson, A. B ., B. S. A., Vice-Director AGRICULTURAL ENGINEERING
M. F. P. Costelloe, B. S. in C . E. '\. W. C lyde, B. S., Assitant Acting Chief W. G. Kaiser, B. S., Assistant
AGRONOMY 'V. H . Stevenson,
Chief A. B., B. S. A., R. S. Potter, A. B., M . S., Ph. D.,
H. D. Hughes, B. S., M. S. A., Chief in Farm Crops
Assistant Chief in Soil C h emistry F. S . ViTjlkins, B. S., Assistant in
Farm Crops P. E. Brown, B. S., A. M., Ph. D ..
C hief in Soil Chemist ry and Bacteriology
R. S. Snyder, B. S., Assistant in Soil Chemistry
L. C. Burnett, M. S. A., Chief in' Cereal Breeding
F. B. Howe, B. S., Assistant in Soil Survey
John Buchanan, B. S. A., Superintendent of Co-operative Experi
H. IV. Johnson, B. S., M. S., Assist ant in Soils
ments Knute Espe, B. S., Assistant in Soil
Survey L. W. Forman, B. S. A., M.
in Field Experiments S., Chief T. H. Benton, l\l. S., Assistant in
Soil Survey ANIMAL HUSBANDRY
W. H . Pew, B. S. A., Chief G . M. Turpin, B. S., Chief in Poultry J. M. Evvard, M. S., Assistant Chief Husbandry
in Animal Husbandry and Chief in L. S. Gillette, B. S., M. S., Assistant Swine Production Chief in Dairy Husbandry
R. Dunn, B. S., Assistant in Animal A. C. McCandlish, M. S. A ., Assist-Husbandry ant in Dairy Husbandry
Orren Lloyd-Jones, M. S., Ph. D., O. C. Ufford, B. S., Assistant in Assistant in Animal Husbandry Poultry Husbandry
BACT ERIOLOGY R. E . Buchanan, B. S., Ph. D., Chief; Associate in Dairy and So il Bacteriology
BOTANY L. H. Pammell, B . Agr., M. S., Ph. Charlotte M . King, Assistant Chief
D., Chief in Botany 1. E. Melhus, Ph. D., Chief in Plant Pathology
CHEMISTRY A. W. Dox,
Chief B. S. A., A. M., Ph. D., S. B. Kuzirian, A. B., A. M., Ph. D.,
Assistant W . G. Gaessler, B. S., Assistant Chief A . R. Lamb, B. S., M. S., Assis tant
G. B. Plaisance, B. S. , M. S. , Assistant
G. vV. Roark, Jr., B. S., Assistant DAIRYING
M. Morte nsen, B. S . A., Chief B. W. Hamme r, B. S. A., Chief in
Dairy Bacteriology
D. E . Bailey, B. S., Assistant Chief in Dairying
H . E. Summers, B. S. , Chief (On leave of absence)
ENTv_ .• OLOGY R. L. W e bster, A. B ., Acting Chief
FARM MANAGEMENT H. B. Munger, B. S., Chief O. G. Lloyd, B. S., M . S., Assistant
Chief HORTICULTURE AND FORESTRY
S . A. Beach, B. S. A ., M. S., Chief T. J. Maney, B. S., Assistant Chief A. T . Erwin, M. S., Chief in Truck in Pomology
Crops G. B. MacDonald, B. S. F., 1\1. F. Laurenz Greene, B. S., M. S. A., Chief in Forestry
Chief in Pomology
F. W . Beckman, C.
r.URAL SOCIOLOGY G. H . Von Tungeln, Ph. B., M. A., Chief
VETERINARY MEDICINE C. H. Sta nge, D. V. M., Chief
GENERAL OFFICERS Ph. B., Bulietin Editor F. E. Colburn , E. Brashear, B. S. A., AssistRnt to Dire('(or
Photographer
Related Documents