Accepted for Publication in Env. Sci. Technol (May 14, 2013) 1 Carbon and Chlorine Isotope Fractionation During 1 Microbial Degradation of Tetra- and Trichloroethene 2 Charline Wiegert, 1* Manolis Mandalakis, 2 Tim Knowles, 3+ Paraskevi N. Polymenakou, 2 Christoph 3 Aeppli, 1 ˚ Jiřina Macháčková, 4 Henry Holmstrand, 1 Richard P. Evershed, 3 Richard D. Pancost 3 and 4 Örjan Gustafsson 1 5 1 Department of Applied Environmental Science (ITM), Stockholm University, 106 91 Stockholm, 6 Sweden 7 2 Hellenic Centre for Marine Research (HCMR), 71003, Heraklion, Crete, Greece 8 3 School of Chemistry, University of Bristol, Bristol BS8 1TS, United Kingdom 9 4 AECOM CZ s.r.o., Liberec 460 11, Czech Republic 10 + current address: Mass Spec Analytical Ltd., Building 20F, Golf Course Lane, Bristol, BS34 7RP 11 ˚current address: Department of Marine Chemistry and Geochemistry, Woods Hole Oceanographic 12 Institution, Woods Hole, MA 02543, USA 13 14 * CORRESPONDING AUTHOR. Department of Applied Environmental Science (ITM), Stockholm University, Svante Arrhenius väg 8c, SE-106 91 Stockholm, Sweden. Tel.: +46 (0)8 674 7759. E-mail: [email protected]

Welcome message from author
This document is posted to help you gain knowledge. Please leave a comment to let me know what you think about it! Share it to your friends and learn new things together.
Transcript
Accep
ted fo
r Pub
licati
on in
Env
. Sci.
Techn
ol
(May
14, 2
013)
1
Carbon and Chlorine Isotope Fractionation During 1
Microbial Degradation of Tetra- and Trichloroethene 2
Charline Wiegert,1*
Manolis Mandalakis,2 Tim Knowles,
3+ Paraskevi N. Polymenakou,
2 Christoph 3
Aeppli,1˚ Jiřina Macháčková,
4 Henry Holmstrand,
1 Richard P. Evershed,
3 Richard D. Pancost
3 and 4
Örjan Gustafsson1 5
1Department of Applied Environmental Science (ITM), Stockholm University, 106 91 Stockholm, 6
Sweden 7
2Hellenic Centre for Marine Research (HCMR), 71003, Heraklion, Crete, Greece 8
3School of Chemistry, University of Bristol, Bristol BS8 1TS, United Kingdom 9
4AECOM CZ s.r.o., Liberec 460 11, Czech Republic 10
+ current address: Mass Spec Analytical Ltd., Building 20F, Golf Course Lane, Bristol, BS34 7RP 11
˚current address: Department of Marine Chemistry and Geochemistry, Woods Hole Oceanographic 12
Institution, Woods Hole, MA 02543, USA 13
14
* CORRESPONDING AUTHOR. Department of Applied Environmental Science (ITM), Stockholm
University, Svante Arrhenius väg 8c, SE-106 91 Stockholm, Sweden. Tel.: +46 (0)8 674 7759. E-mail:
Accep
ted fo
r Pub
licati
on in
Env
. Sci.
Techn
ol
(May
14, 2
013)
2
Abstract 15
Two-dimensional Compound Specific Isotope Analysis (2D-CSIA), combining stable carbon and 16
chlorine isotopes, holds potential for monitoring of natural attenuation of chlorinated ethenes (CEs) in 17
contaminated soil and groundwater. However, interpretation of 2D-CSIA data sets is challenged by a 18
shortage of experimental Cl isotope enrichment factors. Here, isotope enrichments factors for C and Cl 19
(i.e. εC and εCl) were determined for biodegradation of tetrachloroethene (PCE) and trichloroethene 20
(TCE), using microbial enrichment cultures from a heavily CEs contaminated aquifer. The obtained 21
values were εC = −5.6±0.7‰ (95% CI) and εCl = −2.0±0.5‰ for PCE degradation, and εC = −8.8±0.2‰ 22
and εCl = −3.5±0.5‰ for TCE degradation. Combining the values for both εC and εCl yielded 23
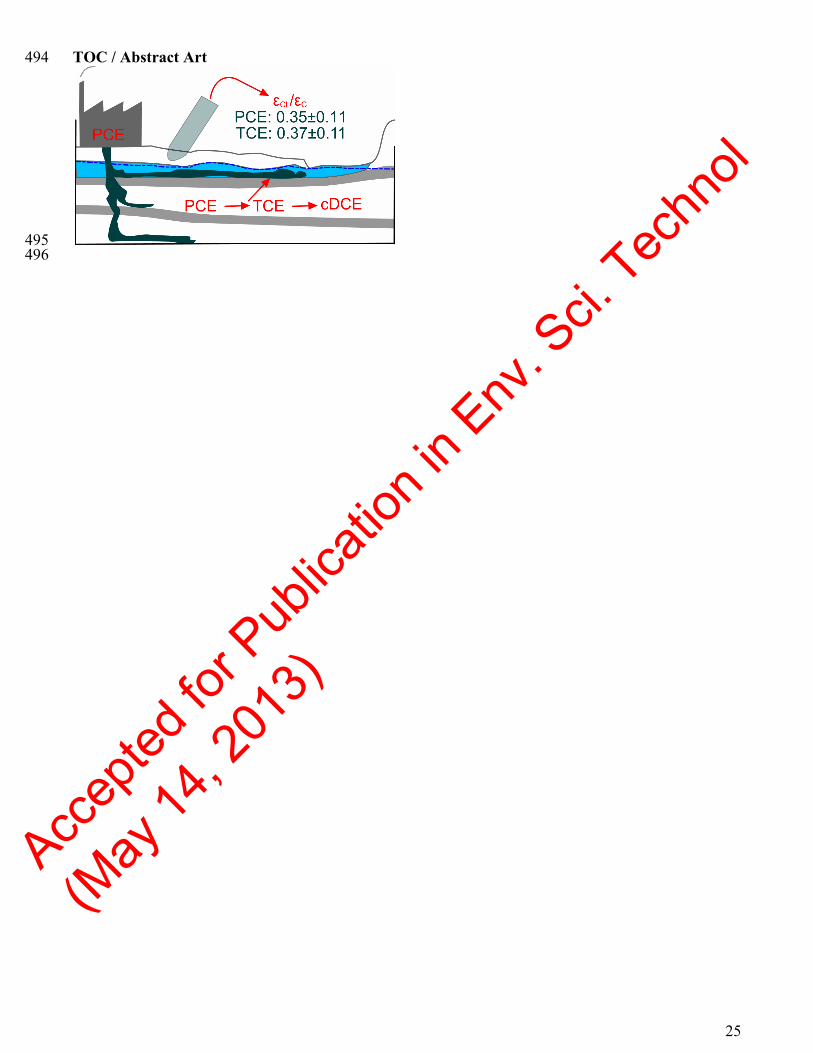
mechanism-diagnostic εCl/εC ratios of 0.35±0.11 and 0.37±0.11 for the degradation of PCE and TCE, 24
respectively. Application of the obtained εC and εCl values to a previously investigated field site gave 25
similar estimates for the fraction of degraded contaminant as in the previous study, but with a reduced 26
uncertainty in assessment of the natural attenuation. Furthermore, 16S rRNA gene clone library analyses 27
were performed on three samples from the PCE degradation experiments. A species closely related to 28
Desulfitobacterium aromaticivorans UKTL dominated the reductive dechlorination process. This study 29
contributes to the development of 2D-CSIA as a tool for evaluating remediation strategies of CEs at 30
contaminated sites. 31
32
Accep
ted fo
r Pub
licati
on in
Env
. Sci.
Techn
ol
(May
14, 2
013)
3
Introduction 33
Chlorinated ethenes (CEs) are frequent soil and groundwater contaminants due to the extensive use of 34
tetrachloroethene (PCE) and trichloroethene (TCE) as industrial solvents.1 The CEs are sequentially 35
biodegraded under anoxic conditions to the less chlorinated, but more toxic compounds dichloroethenes 36
(DCEs) and vinyl chloride (VC), and eventually to harmless ethene.2 This sequential reductive 37
dechlorination involves bacteria, indigenous to the environment, which use the CEs as electron 38
acceptors and H2 or other compounds as the electron donor, to support their growth.2 Several 39
dehalorespiring bacteria from various genera have been shown to reduce PCE and TCE in pure, mixed 40
and enriched cultures.3,4
41
Monitored Natural Attenuation (MNA) is a cost-effective alternative to traditional remediation methods, 42
as it builds on the indigenous degradation activity in the soil and groundwater.1,5
However, such in situ 43
degradation requires accurate methods for site characterization, assessment and monitoring, which may 44
not be possible using traditional concentration-based methods alone.6 However, recent technical 45
advances in compound-specific isotope analysis (CSIA) for chlorine isotopes (δ37
Cl) now facilitate 46
dual-isotope analysis (2D-CSIA), which allows for the simultaneous elucidation of the extent and 47
mechanism of biodegradation.7,8
48
Degradation monitoring of CEs by CSIA relies on the kinetic isotope effect (KIE) resulting from 49
sequential scission of chlorine atoms from the alkene carbon backbone during reductive dechlorination. 50
The lighter stable isotope of carbon or chlorine (12
C and 35
Cl, respectively) forms weaker bonds than the 51
heavier isotopes (13
C and 37
Cl) due to their higher zero-point energies, and thus react at faster rates.9 52
Consequently, the residual reaction substrate typically becomes isotopically enriched, while the 53
products become depleted in the heavier isotopes. The KIE is defined as the position-specific ratio of 54
the reaction rates for a chemical element (e.g., for chlorine written as KIECl = 35
k/37
k) and is 55
synonymous with the inverse of a position-specific isotope fractionation factor (α = KIE−1
).10
However, 56
unlike α, the KIE is seldom used to report bulk (molecularly averaged) isotope fractionation. The basic 57
Accep
ted fo
r Pub
licati
on in
Env
. Sci.
Techn
ol
(May
14, 2
013)
4
parameters used in CSIA degradation studies are summarized in the Rayleigh equation which describes 58
the relationship between the observed isotope composition (R, the heavy-to-light isotope abundance 59
ratio) and the remaining fraction (f) of the substrate compound, using the initial substrate isotope 60
composition (R0) and the reaction specific isotope fractionation factor α, often reported in the form of 61
the isotope enrichment factor ε (see Elsner (2010)7 and Hofstetter and Berg (2010)
11 for review papers): 62
(1) 63
We recently reported the first field application of 2D-CSIA for PCE and TCE to demonstrate its 64
potential to assess ambient biodegradation in a heavily contaminated aquifer.12
The extent of in situ PCE 65
degradation was estimated using C isotope enrichment factors (εC) from the literature, while a Cl isotope 66
enrichment factor (εCl) was inferred from the field derived εCl/εC ratios. While demonstrating the 67
applicability of 2D-CSIA for the assessment of in situ degradation of CEs, this work also highlighted 68
the lack of well-constrained εCl values derived from laboratory experiments, which limited further 69
interpretation of the 2D-CSIA data sets for PCE and TCE. Abe et al. reported laboratory-derived εC and 70
εCl for oxidation and reductive dechlorination of cDCE and VC.13
The 2D-CSIA approach was then 71
applied for cDCE degradation at a field site,14
which underscored the need for εCl values and better 72
understanding of the microbial communities leading the degradation. Recent works described the first 73
dual C and Cl data set for TCE and cDCE abiotic degradation by zero valent iron (ZVI) at a field site15
74
and in laboratory experiments.16
However, no laboratory-derived Cl values for microbial PCE and TCE 75
hydrogenolysis are available so far. 76
The purpose of this study was to: (i) determine the C and Cl isotopic enrichment factors during 77
biodegradation of PCE and TCE, using a mixed bacterial culture from a previously investigated 78
contaminated field site, and (ii) explore the changes in the microbial community over the course of PCE 79
degradation. To our knowledge, this work provides the first combined C and Cl isotopes data set for 80
biotic reductive dechlorination of PCE and TCE at the laboratory scale. 81
Accep
ted fo
r Pub
licati
on in
Env
. Sci.
Techn
ol
(May
14, 2
013)
5
Materials and Methods 82
Site Description 83
The North Bohemian Carcass Disposal Plant (SAP; Mimoñ, Czech Republic) was chosen for this 84
study.12
The factory used PCE for fat extraction from 1963 to 1988, when drinking water contamination 85
was discovered at a water treatment plant 400 m downstream from the putative source area. The PCE 86
consumption was estimated at 4250 tons, with a net contamination of 149−246 tons. Our recent field 87
study focused on a newly discovered area of the plume that had not been subject to cleanup activities.12
88
The 2D-CSIA investigation, combining δ13
C and δ37
Cl, revealed ongoing PCE degradation in anoxic 89
areas, although not significant enough to allow MNA as an efficient remediation strategy. Furthermore, 90
concentration data also suggested cDCE accumulation. 91
Soil Sampling 92
Three soil cores (Z−32, Z−53, Z−54) were obtained from the contaminated zone of the site, each 93
exhibiting different levels of PCE contamination, while a fourth core (Z−65) was collected at a non-94
contaminated background location (Table S1). Two soil cores of 0.7 m length each were obtained and 95
subsequently pooled, from each location. Two different depths below the groundwater table were 96
sampled, using a percussion drilling set (Eijkelkamp, Giesbeek, the Netherlands). The soil was covered 97
by a plastic sleeve during drilling to avoid any exposure to the atmosphere after extraction from the 98
subsurface. An additional cover was applied on the sample immediately after retrieval. 99
Degradation Experiments 100
All four soil samples were initially screened for their capacity to degrade chlorinated ethenes. For this 101
purpose, separate cultures were established using a reduced anaerobic mineral medium, which was 102
prepared and sterilized according to Cole et al.17
In brief, each soil (about 5 g) and Cole’s basal medium 103
(100 mL) were placed in a 120-mL glass serum bottle, while its headspace was continuously flushed 104
with a stream of N2. Immediately after transfer, the bottles were tightly sealed with Viton rubber 105
stoppers and each culture was spiked with PCE stock solution (100 μL; ~500 mmol·L−1
in methanol) 106
using a gas-tight syringe to achieve an initial concentration of 500 µmol·L−1
. Preliminary experiments 107
Accep
ted fo
r Pub
licati
on in
Env
. Sci.
Techn
ol
(May
14, 2
013)
6
indicated that PCE dissolution in the culture medium was accomplished within a few hours. The 108
maintenance of anaerobic conditions during the preparation of cultures and throughout the 109
biodegradation experiments was verified by using resazurin in the nutrients medium as a redox color 110
indicator. A mixture of butyric acid, propionic acid and ethanol was also added as electron donor and 111
carbon source (final concentration 200 μmol·L−1
each) and the bottles were incubated at 30 °C without 112
shaking. Note that in heterogeneous systems mass transfer limitations might lead to masking of isotopic 113
effects.18
However, in our homogeneous system, we did not observe indication of such masking effect, 114
even in the absence of shaking. By using a gas-tight syringe, small aliquots (50 μL) were collected at 115
regular time intervals and the progress of the biodegradation process in each culture was assessed by 116
analyzing the concentration of PCE using an in-vial microscale liquid-liquid extraction method, 117
followed by gas chromatography mass spectrometry (GC-MS). A detailed description of the 118
concentration analysis is provided in the Supporting Information (SI). 119
During the initial screening, biodegradation activity was evident in the soil samples Z-32, Z-53 and Z-120
54, as the concentration of PCE substantially decreased after 15 to 20 days of incubation. In contrast, the 121
soil from the non-contaminated background site Z-65 showed no tendency of biodegradation (data not 122
shown). The soil enrichment culture from Z-32, which exhibited the fastest biodegradation rate among 123
all samples, was selected for the inoculation of secondary cultures and the implementation of the final 124
series of biodegradation experiments for PCE and TCE. By following the same procedure as described 125
above, up to twelve identical cultures were prepared for each series of experiments by mixing 100 mL 126
of fresh Cole’s medium with 10 mL of cell suspension from the primary culture Z-32. After sealing with 127
Viton stoppers, the bottles from each one of the two series were spiked with the stock solution of PCE 128
or TCE in methanol to reach an initial concentration of 400 or 500 µmol·L−1
, respectively. The progress 129
of biodegradation was monitored in all replicate cultures by analyzing PCE or TCE at regular time 130
intervals. See section S2 in SI for a detailed description of the concentration analyses. 131
The cultures were sacrificed at a PCE or TCE remaining fraction f ranging from 100 to 5%, by adding 132
400 µL of concentrated HCl to stop bacterial activity (pH adjusted to 2). Two control samples were 133
Accep
ted fo
r Pub
licati
on in
Env
. Sci.
Techn
ol
(May
14, 2
013)
7
taken for each series of biodegradation experiments, by spiking with HCl immediately after their 134
preparation, i.e. samples with f = 100%. 135
Samples for δ37
Cl analyses were shipped to Stockholm University (SU), and an aliquot from each 136
sample was forwarded to the University of Bristol (UB) for δ13
C analyses. The samples were stored in 137
the dark at 4°C until further analysis. 138
DNA extraction 139
A total of three samples, corresponding to 100%, 53% and 7.6% remaining fraction of PCE were 140
chosen to characterize the microbial community evolution concomitant to the degradation reaction, 141
using 16S rRNA gene clone library analysis. DNA extraction and PCR amplification was not successful 142
for the TCE experiments and is not reported in the following. 143
Total DNA was extracted from the PCE degrading cultures using the FastDNA-Spin Kit for Soil (Q-144
BIOgene, Carlsbad, CA). Aliquots of 1 mL were distributed to individual Lysing Matrix tubes included 145
in the extraction kit. DNA extraction was performed according to the manufacturer’s protocol and the 146
cell lysis was achieved using a Qiagen TissueLyser II (Retsch GmbH, Haan, Germany). DNA extracts 147
were stored at -80°C until analysis. Nucleic acid extracts from each sample were analyzed 148
spectrophotometrically at 260 and 280 nm using a Nanodrop ND-1000 3.3 spectrophotometer (Coleman 149
Technologies Inc.). 150
Clone Library Construction and Sequence Analysis of the 16S rRNA genes 151
Bacterial 16S rRNA genes were amplified from mixed genomic samples by using PCR with the 152
universal bacterial primers 27f (5’-AGAGTTTGATCMTGGCTCAG-3’) and 1492r (5’-153
GGYTACCTTGTTACGACTT-3’) for the PCE degradation experiments. The detailed protocol is 154
described in SI (section S3). 155
Operational taxonomic units (OTUs) were defined at a minimum sequence similarity of 98%. A total 156
of 44 different OTUs were identified. All 44 partial 16S rRNA gene sequences generated in the present 157
study were deposited in GenBank under accession numbers KC109145-KC109188. 158
Stable Chlorine Isotope Analysis 159
Accep
ted fo
r Pub
licati
on in
Env
. Sci.
Techn
ol
(May
14, 2
013)
8
The selection and use of PCE and TCE standards as well as the instrumentation and procedure used 160
for δ37
Cl determination followed previously established methods.12,19
Briefly, sample volumes of 50 µL 161
to 1 mL were extracted with 0.5−2 mL cyclopentane in 4-mL glass vials. These volumes were selected 162
to achieve consistent PCE and TCE concentrations of at least 1 µmol·L-1
in the solvent. The extracts 163
were shaken for 2 min on a vortex shaker and dried over sodium sulfate. 164
Analyses of δ37
Cl of PCE and TCE were performed according to a previously published method, 12,19
165
using the same instrument (GCqMS; GC 8000 gas chromatograph with MD-800 mass analyzer, Fisons, 166
Manchester, UK) and authentic isotopic standards, i.e. the same compounds as the analytes. PCE and 167
TCE were measured on masses of two molecular ions containing zero and one 37
Cl, respectively, i.e. m/z 168
130 and 132 for TCE, 164 and 166 for PCE. 169
All δ37
Cl values are reported relative to the international Standard Mean Ocean Chlorine (SMOC). To 170
this end, the δ37
Cl values of the PCE and TCE isotopic standards were determined vs SMOC using 171
thermal ionization mass spectrometry (TIMS) according to published procedures.19,20
The trueness of 172
the instrument was tested with PCE and TCE standards spanning −2.5 to +2.9‰ vs SMOC (Figure S1). 173
This test demonstrated that one isotopic standard with known δ37
Cl was sufficient for determining δ37
Cl 174
values, rather than two isotopic standards as were necessary for certain instrumental setups.21
Note, that 175
due to limited availability of δ37
Cl isotopic standards, we were not able to cover the full range of the 176
samples’ δ37
Cl values, which were between −0.9±0.7‰ to 7.5±0.8‰ for PCE, and between 3.0±0.5‰ 177
and 16.6±0.5‰ for TCE (Table S3). Although it is in principle possible that such values outside the 178
range of available isotopic standards could suffer from additional uncertainties, it is reasonable to 179
assume that the determined range of δ37
Cl trueness extends in a linear way.22,23
In future studies, cross-180
calibration with other laboratories could be integrated as well as standardization through availability of 181
δ37
Cl authentic material. See Table S3 for a list of used isotopic standards. All standards were stored in 182
the dark at 4°C. 183
Accep
ted fo
r Pub
licati
on in
Env
. Sci.
Techn
ol
(May
14, 2
013)
9
The obtained average analytical precision of the δ37
Cl analysis was ±0.6‰ vs SMOC. This includes 184
the standard deviation from the GCqMS measurements (n = 5 sample/standard pairs) and the propagated 185
standard deviation from the TIMS measurements of the authentic standards. 186
Stable Carbon Isotope Analysis 187
Liquid-liquid extractions were performed in the same manner as for δ37
Cl analysis. The δ13
C analyses 188
were performed using previously described protocols and instrumentation (GC combustion 189
isotope−ratio mass spectrometry GC−C−IRMS).12
The measurements were performed on a HP 6890 GC 190
with split/splitless injector, hyphenated to a Thermo DeltaPlusXL spectrometer via a Thermo GC/C-III 191
interface (HP, Palo Alto, California, United States; Thermo Finnigan, Bremen, Germany). The average 192
Standard Deviation (SD) of the δ13
C analysis was ±0.4‰, and was determined by replicate injections of 193
target compound (n = 3) 194
Accep
ted fo
r Pub
licati
on in
Env
. Sci.
Techn
ol
(May
14, 2
013)
10
Results and Discussion 195
Degradation of PCE and TCE by enriched soil bacteria cultures 196
The microbial consortium dechlorinated PCE via TCE to cDCE, and TCE to cDCE, after a lag phase 197
of 9 and 17 days, respectively (illustrated in Figure 1). No further degradation of cDCE was observed. 198
This is in agreement with the previous observations from the field site, showing cDCE accumulation 199
and no production of vinyl chloride or ethene.12
200
Degradation rates were evaluated from the incubation experiments showing f < 50% of the initial PCE 201
or TCE. Due to their relatively long incubation time (compared with e.g. experiments with f > 50%), 202
these were the samples with the most data for concentrations over time and the most suitable data sets 203
for fitting of pseudo first-order kinetics. The best fits of the pseudo first order kinetic equation to the 204
obtained data yielded PCE degradation rates ranging from 0.3 to 0.5 day−1
in cultures with a specific 205
growth rate (SGR) of 0.3−0.74 g·g−1
·h−1
. The same approach applied to TCE degradation experiments 206
led to a range of 0.4−1.9 day−1
for SGR 0.4−2 g·g−1
·h−1
. These ranges fall in the spectrum of previously 207
reported values of 0−0.410 day−1
and 0−3.130 day−1
for reductive dechlorination of PCE and TCE 208
respectively, at both the laboratory and the field scale.24
209
Microbial Community Changes during PCE Reductive Dechlorination 210
Clone library analysis of the 16S rRNA genes was used to determine potential changes in the 211
microbial community composition during PCE reductive dechlorination and to identify major 212
microorganisms mediating this process. Before the initiation of PCE degradation, i.e. at 100% 213
remaining fraction, the microbial culture is dominated by an OTU closely related to Clostridium sp. 214
strain DR7 (Table S2). In this culture, a total of 55 out of 72 analyzed sequences corresponded to the 215
specific strain, while the other 17 sequences were assigned to 13 different OTUs that were classified 216
into five phyla. 217
At the intermediate stage of PCE reduction, i.e. at 53% remaining fraction, the microbial community 218
composition was also dominated by the OTU closely related to Clostridium sp. strain DR7. In addition, 219
a second OTU closely related to Desulfitobacterium aromaticivorans UKTL was found with a high 220
Accep
ted fo
r Pub
licati
on in
Env
. Sci.
Techn
ol
(May
14, 2
013)
11
numbers of clones. More specifically, 51 and 10 out of 80 analyzed sequences corresponded to 221
Clostridium sp. strain DR7 and Desulfitobacterium aromaticivorans UKTL, respectively, while the 222
other 19 sequences were assigned to 14 different OTUs that were also classified into five phyla (Table 223
S2). 224
The microbial community at the final stage of PCE reduction, i.e., at 7.6% remaining fraction, was 225
still dominated by close relatives of Clostridium sp. strain DR7 and Desulfitobacterium aromaticivorans 226
UKTL. However, these two organisms were present at substantially different proportions compared to 227
the intermediate stage. In particular, Desulfitobacterium aromaticivorans UKTL became more abundant 228
than Clostridium sp. strain DR7, with 34 and 22 out of 74 sequences respectively. 229
The results show that these two species, which belongs to the taxonomic order of Clostridiales, are 230
involved in PCE reductive dechlorination at the study field site. Desulfitobacterium aromaticivorans 231
UKTL is closely related to Desulfitobacterium chlororespirans and Desulfitobacterium dehalogenans, 232
which are known dechlorination bacteria.25,26
Generally, the members of the genus Desulfitobacterium, 233
are widely known for reductive dehalogenation activity.27
The second prominent species is closely 234
related to Clostridium sp. strain DR7. This species is known for fermentation processes. Clostridium 235
spp. are often detected in dechlorinating communities,28,29
and associated with anaerobic processes 236
other than PCE dechlorination, such as acetogenesis, or fermentation. The later process lead to the 237
production of H2 that might be used by dechlorinating bacteria as electron donor. 30,31
This might 238
explain the observed increase in Desulfitobacterium spp. that occurs only after a lag phase; these 239
organisms only start to dechlorinate (and grow) once a sufficient level of H2 is present. 240
Carbon and Chlorine Isotope Fractionation during PCE Reductive Dechlorination 241
PCE isotopic signatures were measured at different stages of degradation, to determine the C and Cl 242
enrichment factors for the enriched microbial culture, by applying the Rayleigh equation (eq. 3) to the 243
concentration and 2D-CSIA data (Figure 2A).32
The δ13
C signatures exhibited values from −25.8±0.1‰ 244
to −7.0±0.7‰ at 100% and 3.5% remaining fraction, respectively (Table S4). For PCE, an C value of 245
Accep
ted fo
r Pub
licati
on in
Env
. Sci.
Techn
ol
(May
14, 2
013)
12
−5.6±0.7‰ (95% confidence interval, CI; n = 11, R2 = 0.96, the standard error, SE, was 0.3‰) was 246
determined. 247
The herein obtained C value is comparable to those obtained for other experiments with mixed 248
consortia, e.g. enriched mixed cultures from contaminated aquifers, yielding C in the range −2‰33
to 249
−7‰,34
whereas further comparisons with results from, e.g. pure strains are more difficult to the 250
inherent complexity of our enrichment culture. However we note the difference from abiotic processes, 251
that yielded much higher fractionation behavior with C up to −16.5‰ for reduction by vitamin B1235
252
and −25.3‰ for degradation on zero-valent iron.36
253
As for the Cl isotopes, an enrichment was observed with δ37
Cl values increasing from 1.01±0.6‰ to 254
7.5±0.8‰ at 100% and 3.5% remaining fraction, respectively (Table S4). The Cl value was −2.0±0.5‰ 255
(95% CI, n = 10, R2 = 0.91, with 0.2‰ SE; Figure 2B). Numata et al. (2002)
37 first reported Cl isotopes 256
fractionation factors for the reductive dechlorination of PCE to cDCE, with significantly more negative 257
Cl values of −9‰, −10‰ and −13‰ for three different anaerobic consortia. However, it is worth noting 258
that these authors used non-compound specific isotopic measurements and therefore relied on a complex 259
Rayleigh-model evaluation scheme, which might be associated with larger uncertainties due to the lack 260
of compound-specific information. Furthermore, the mixed consortia cannot be compared with the 261
diversity of field-derived enrichment cultures, which represent the microbial response to a mix of many 262
controls imposed by a heterogeneous system. The closest comparable Cl is our previous field-derived 263
estimate of the in situ Cl, which spanned −0.8 to −7.8‰.12
Although not directly comparable due to 264
influences from the microbial enrichment process, our laboratory Cl likely represents a reduction in the 265
uncertainty at this field site. 266
We calculated the process diagnostic εCl/εC ratio by combining the 2D-CSIA data for C and Cl 267
isotopes. The εCl/εC ratio for the herein reported PCE reductive dechlorination is 0.35±0.11 (95% CI, n = 268
10, R2 = 0.87, with 0.05‰ SE; Figure 2C), which is at the lower end of the range of our previous field- 269
derived values from 0.42 to 1.12.12
We also calculated the ratio of the apparent kinetic isotope effects 270
Accep
ted fo
r Pub
licati
on in
Env
. Sci.
Techn
ol
(May
14, 2
013)
13
(AKIE; see Elsner and Hunkeler, 2008)32
to obtain a diagnostic measure of the mechanism at hand, by 271
removing the influence of non-reactive positions and intramolecular competition of isotopes. 272
Subtraction of one (1) from the AKIEs has been recommended to cancel out any influence of 273
commitment to catalysis.13
The (AKIECl-1)/(AKIEC-1) ratio for the PCE degradation experiment was 274
0.71 (Figure 3; Table S5). 275
Carbon and Chlorine Isotope Fractionation during TCE Reductive Dechlorination 276
The enrichment in δ13
C signatures for the TCE degradation ranged from −26.9±0.01‰ to −2.1±0.2‰ 277
at 100% and 3.5% remaining fraction, respectively (Table S3). The corresponding C value was 278
−8.8±2.0‰ (95% CI, n = 10, R2 = 0.92, with 0.9‰ SE) (Figure 2D). Our C value falls within the range 279
of literature values for enriched mixed cultures from contaminated aquifers, i.e. −2.5‰38
to −16.0‰.39
280
Values obtained using pure cultures span a range of −3 to −18.8‰.40
The herein reported value is also 281
similar to a literature value of −7.9‰ for the specific abiotic degradation of TCE to cDCE by zero 282
valent iron (ZVI).16
However, most studies of abiotic transformation of TCE report larger carbon 283
isotope fractionation with C values in the range −17.2‰ (with vitamin B12),35
to −26.5±1.5‰ (with 284
nanoparticulate Fe2+
).41
285
For Cl isotopes, δ37
Cl values increased from 5.2±0.54‰ to 16.6±0.51‰ at 100% and 3.5% remaining 286
fraction, respectively (Table S4). The determined Cl value was −3.5±0.5‰ (95% CI, n = 10, r2 = 0.97, 287
with 0.2‰ SE; Figure 2E). The obtained Cl value is similar to the values of −2.6±0.2‰ and −2.98‰ 288
reported for abiotic degradation of TCE by ZVI in two recent studies.15,16
289
The process diagnostic εCl/εC ratio for microbial TCE hydrogenolysis was 0.37±0.11 (95% CI, n = 10, 290
r2 = 0.88, with 0.04 SE; Figure 2F), with a (AKIECl-1)/(AKIEC-1) ratio of 0.59. The observed 291
differences in (AKIECl-1)/(AKIEC-1) ratios between PCE (0.71) and TCE (0.59) could potentially be 292
due to rate limiting but non-fractionating pre-equilibrium steps, e.g. isotopic masking through 293
commitment to catalysis or differences between the PCE and TCE enrichment cultures, if the same 294
reaction mechanism is assumed in both cases.10
A common dissociative electron transfer has indeed 295
Accep
ted fo
r Pub
licati
on in
Env
. Sci.
Techn
ol
(May
14, 2
013)
14
been suggested for the PCE and TCE degradation using cobalamin as model for the catalytic center of 296
dehalogenation enzymes.42
The large difference between the herein obtained (AKIECl-1)/(AKIEC-1) 297
ratios and that of the biotic transformation of cDCE to VC, i.e. 0.08 (Figure 3; Table S5),43
suggest that 298
another mechanism is involved in the degradation of these two compounds. This hypothesis is supported 299
by mechanistic investigations. For cobalamin, it has been found that these compounds indeed follow a 300
different reaction mechanism than PCE and TCE. cDCE and VC form a carbon-cobalt bond as initial 301
reaction step rather than a dissociative electron transfer reaction. 302
Application of incubation derived εC and εCl to the SAP Field Site Data Set 303
The remaining fraction (f) of PCE at the SAP wells (n=11) was re-calculated by applying the herein 304
obtained εC and εCl values to the SAP δ13
C and δ37
Cl data.12
Three wells gave negative estimates of f, 305
presumably due to seasonally fluctuating anaerobic/aerobic conditions. Thus, they were depleted in 37
Cl 306
relative to the designated contaminant source zone, and where therefore excluded from further analysis. 307
The use of chlorine isotope data led to a seemingly slightly higher average estimate (f = 32±21%; 1 SD) 308
than that obtained with the carbon isotope data (f = 16±10%; 1 SD). However, the average residual of 309
fCl-fC was 10%, ranging from 4-17% when the two-sided 95% confidence interval for εC and εCl was 310
taken into consideration. Hence, there is reasonable agreement between these two independent estimates 311
considering the inherent variability of the natural system. It is further possible that any apparent 312
difference in the estimates between the two isotope systems simply reflect instrument bias (e.g. 313
combustion efficiency in the GC-IRMS interface during conversion of organochlorine molecules to 314
CO2, or small non-linearity effects in GCqMS) for one or both of the used isotope instruments, or small 315
offsets in the calibrations used for isotope analysis. To illustrate, a single sided off-set in the δ37
Cl 316
values by 0.4‰, corresponding to a typical analytical uncertainty, reduces the residual average to zero 317
due to the small value of Cl. This could, for instance, be induced by the marginal deviation, which is not 318
statistically significant, from the 1:1 line of the regression line in the linearity plot (Figure S1). In 319
conclusion, future studies are warranted to perform cross-calibrations for two or more isotope systems 320
to obtain the highest possible accuracy in multi-dimensional CSIA field-site investigations. Furthermore 321
Accep
ted fo
r Pub
licati
on in
Env
. Sci.
Techn
ol
(May
14, 2
013)
15
the availability of authentic standard with a large δ37
Cl range would improve the confidence in studies 322
of this type. 323
Implications 324
We performed a 2D CSIA investigation to address two aspects of PCE and TCE dechlorination. First, 325
this study shows that 2D CSIA assessment has the potential to distinguish reaction mechanisms, based 326
on the characteristic εCl/εC or (AKIECl-1)/(AKIEC-1) ratios. Our empirical results support earlier 327
hypotheses that microbial PCE and TCE hydrogenolysis follows a dissociative electron transfer as first 328
reaction step, while cDCE and VC hydrogenolysis follows a different reaction pathway (i.e., formation 329
of a Co-C bond). 330
Second, we aimed to improve confidence in CSIA-based assessment of in situ natural attenuation by 331
introducing an additional line of evidence. This is based on the idea that appropriate values can be 332
chosen based on the characteristic εCl/εC or (AKIECl-1)/(AKIEC-1) ratios that different dehalogenation 333
bacteria exhibit. To this end, our study is a first step towards creating a library of such ratios. 334
Furthermore, our values determined in the laboratory were in the range of values determined at the field 335
site where the used microbial enrichment culture originated. Although this result generally supports the 336
validity of the concept of using laboratory-enrichment cultures to investigate PCE/TCE dechlorination 337
processes occurring at field sites, we saw more variability in the field data than in the laboratory 338
experiment. This was in spite of the fact that the 2D approach is expected to correct for physical 339
processes influencing isotopic fractionation such as sorption, dilution and isotopic masking due to pre-340
equilibrium steps. The reason for the observed variability in εCl/εC in the field data is most likely the 341
variability in microbial community at the field site. It is worth noting that by the choice of the medium, 342
electron donor and carbon source, selective pressure is introduced during the microbial cultivation 343
process, thereby reducing the microbial diversity. 344
This study suggests that the presented diagnostic (AKIECl-1)/(AKIEC-1) ratio is indicative for 345
Desulfitobacterium spp. that are able to reduce PCE and TCE to cDCE. Other known dehalogenating 346
bacteria, especially Sulfurospirillum spp. (known for PCE-to-cDCE dehalogenation) and 347
Accep
ted fo
r Pub
licati
on in
Env
. Sci.
Techn
ol
(May
14, 2
013)
16
Dehalococcoides spp. (PCE-to-ethene dehalogenation) may exhibit different εCl/εC ratios, and need to be 348
investigated as a next step to facilitate 2D-CSIA-based assessment of PCE/TCE-contaminated field 349
sites. 350
351
Accep
ted fo
r Pub
licati
on in
Env
. Sci.
Techn
ol
(May
14, 2
013)
17
ACKNOWLEDGMENT 352
This study received funding from the European Community´s Seventh Framework Programme (FP7 353
2009-2012) isoSoil project, under grant agreement No. 212781. The work at SU was further supported 354
by the Delta Facility of the Faculty of Science. CA acknowledges a postdoctoral fellowship from the 355
Swiss National Science Foundation. RPE and RDP acknowledge the Royal Society Wolfson Research 356
Merit Awards. ÖG acknowledges support as an Academy Research Fellow at the Swedish Royal 357
Academy of Sciences through a grant from the Knut and Alice Wallenberg Foundation. Petr Dostal, 358
Monika Kralova and Monika Stavelova (Aecom) are gratefully acknowledged for the soil sampling. The 359
authors thank Yngve Zebühr (SU) for his helpful technical support concerning the GCqMS 360
measurements and Heike Siegmund at SIL (SU) for δ13
C determination of the PCE and TCE standards. 361
We thoroughly thank three anonymous reviewers for their in-depth comments on the manuscript. 362
Accep
ted fo
r Pub
licati
on in
Env
. Sci.
Techn
ol
(May
14, 2
013)
18
Supporting Information Available 363
The groundwater data, a detailed description of the CEs concentration analyses run during the 364
degradation experiments, the protocol used for the clone library construction, details about the 365
calibration approach used for δ37
Cl measurements, a table with the CEs concentrations and stable C and 366
Cl isotopic data set, as well as a table comparing the ε and AKIE values for C and Cl isotopes in 367
different studies on CEs degradation. 368
This material is available free of charge via the Internet at http://pubs.acs.org. 369
The authors declare no competing financial interest. 370
Accep
ted fo
r Pub
licati
on in
Env
. Sci.
Techn
ol
(May
14, 2
013)
19
References 371
(1) Committee on Intrinsic Remediation, Water Science and Technology Board, Board on 372
Radioactive Waste Management, National Research Council (NRC). Natural Attenuation for 373
Groundwater Remediation; National Academy Press: Washington, D.C., 2000. 374
(2) Wiedemeier, T. H.; Newell, C. J.; Rifai, H. S.; Wilson, J. T. Natural attenuation of fuels and 375
chlorinated solvents; John Wiley & Sons Inc.: New York, USA, 1999. 376
(3) Löffler, F. E.; Cole, J. R.; Ritalahti, K. M.; Tiedje. J. M. Diversity of Dechlorinating Bacteria. In 377
Häggblom M.M., and Bossert I.D. (Eds), Dehalogenation: Microbial Processes and Environmental 378
Applications; Kluwer Academic Publishers: Boston/Dordrecht/London, 2003. 379
(4) Futagami, T.; Goto, M.; Furukawa, K. Biochemical and genetic bases of dehalorespiration. 380
Chem Record 2008, 8, 1–12. 381
(5) Mulligan, C. N.; Yong, R. N. Natural attenuation of contaminated soils. Environment 382
International 2004, 30, 587–601. 383
(6) Bombach, P.; Richnow, H. H.; Kästner, M.; Fischer, A. Current approaches for the assessment 384
of in situ biodegradation. Applied Microbiology and Biotechnology 2010, 86, 839–852. 385
(7) Elsner, M. Stable isotope fractionation to investigate natural transformation mechanisms of 386
organic contaminants: principles, prospects and limitations. J. Environ. Monit. 2010, 12, 2005. 387
(8) Cincinelli, A.; Pieri, F.; Zhang, Y.; Seed, M.; Jones, K. C. Compound Specific Isotope Analysis 388
(CSIA) for chlorine and bromine: A review of techniques and applications to elucidate environmental 389
sources and processes. Environmental Pollution 2012, 169, 112–127. 390
(9) Criss, R. E. Principles of Stable Isotope Distribution; Oxford University Press, Inc.: New York, 391
USA, 1999. 392
Accep
ted fo
r Pub
licati
on in
Env
. Sci.
Techn
ol
(May
14, 2
013)
20
(10) Elsner, M.; Zwank, L.; Hunkeler, D.; Schwarzenbach, R. P. A New Concept Linking Observable 393
Stable Isotope Fractionation to Transformation Pathways of Organic Pollutants. Environ. Sci. Technol. 394
2005, 39, 6896–6916. 395
(11) Hofstetter, T. B.; Berg, M. Assessing transformation processes of organic contaminants by 396
compound-specific stable isotope analysis. TrAC Trends in Analytical Chemistry 2010. 397
(12) Wiegert, C.; Aeppli, C.; Knowles, T.; Holmstrand, H.; Evershed, R. P.; Pancost, R.; 398
Macháčková, J.; Gustafsson, O. Dual carbon-chlorine stable isotope investigation of sources and fate of 399
chlorinated ethenes in contaminated groundwater. Environ. Sci. Technol. 2012. 400
(13) Abe, Y.; Aravena, R.; Zopfi, J.; Shouakar-Stash, O.; Cox, E.; Roberts, J. D.; Hunkeler, D. 401
Carbon and Chlorine Isotope Fractionation during Aerobic Oxidation and Reductive Dechlorination of 402
Vinyl Chloride and cis-1,2-Dichloroethene. Environmental Science & Technology 2009, 43, 101–107. 403
(14) Hunkeler, D.; Abe, Y.; Broholm, M. M.; Jeannottat, S.; Westergaard, C.; Jacobsen, C. S.; 404
Aravena, R.; Bjerg, P. L. Assessing chlorinated ethene degradation in a large scale contaminant plume 405
by dual carbon–chlorine isotope analysis and quantitative PCR. Journal of Contaminant Hydrology 406
2011, 119, 69–79. 407
(15) Lojkasek-Lima, P.; Aravena, R.; Shouakar-Stash, O.; Frape, S. K.; Marchesi, M.; Fiorenza, S.; 408
Vogan, J. Evaluating TCE Abiotic and Biotic Degradation Pathways in a Permeable Reactive Barrier 409
Using Compound Specific Isotope Analysis. Groundwater Monit R 2012, 32, 53–62. 410
(16) Audí-Miró, C.; Cretnik, S.; Otero, N.; Palau, J.; Shouakar-Stash, O.; Soler, A.; Elsner, M. Cl and 411
C isotope analysis to assess the effectiveness of chlorinated ethene degradation by zero-valent iron: 412
Evidence from dual element and product isotope values. Applied Geochemistry 2013, 32, 175–183. 413
Accep
ted fo
r Pub
licati
on in
Env
. Sci.
Techn
ol
(May
14, 2
013)
21
(17) Cole, J. R.; Cascarelli, A. L.; Mohn, W. W.; Tiedje, J. M. Isolation and characterization of a 414
novel bacterium growing via reductive dehalogenation of 2-chlorophenol. Applied and Environmental 415
Microbiology 1994, 60, 3536–3542. 416
(18) Aeppli, C.; Berg, M.; Cirpka, O. A.; Holliger, C.; Schwarzenbach, R. P.; Hofstetter, T. B. 417
Influence of Mass-Transfer Limitations on Carbon Isotope Fractionation during Microbial 418
Dechlorination of Trichloroethene. Environ. Sci. Technol. 2009, 43, 8813–8820. 419
(19) Aeppli, C.; Holmstrand, H.; Andersson, P.; Gustafsson, O. Direct Compound-Specific Stable 420
Chlorine Isotope Analysis of Organic Compounds with Quadrupole GC/MS Using Standard Isotope 421
Bracketing. Analytical Chemistry 2010, 82, 420–426. 422
(20) Holmstrand, H.; Andersson, P.; Gustafsson, Ö. Chlorine Isotope Analysis of Submicromole 423
Organochlorine Samples by Sealed Tube Combustion and Thermal Ionization Mass Spectrometry. Anal. 424
Chem. 2004, 76, 2336–2342. 425
(21) Bernstein, A.; Shouakar-Stash, O.; Ebert, K.; Laskov, C.; Hunkeler, D.; Jeannottat, S.; 426
Sakaguchi-Söder, K.; Laaks, J.; Jochmann, M. A.; Cretnik, S.; Jager, J.; Haderlein, S. B.; Schmidt, T. 427
C.; Aravena, R.; Elsner, M. Compound-Specific Chlorine Isotope Analysis: A Comparison of Gas 428
Chromatography/Isotope Ratio Mass Spectrometry and Gas Chromatography/Quadrupole Mass 429
Spectrometry Methods in an Interlaboratory Study. Anal. Chem. 2011, 83, 7624–7634. 430
(22) Aeppli, C.; Bastviken, D.; Andersson, P.; Gustafsson, Ö. Chlorine Isotope Effects and 431
Composition of Naturally Produced Organochlorines from Chloroperoxidases, Flavin-Dependent 432
Halogenases, and in Forest Soil. Environmental Science & Technology 2013, 130131073931007. 433
(23) Laube, J. C.; Kaiser, J.; Sturges, W. T.; Bönisch, H.; Engel, A. Chlorine Isotope Fractionation in 434
the Stratosphere. Science 2010, 329, 1167–1167. 435
Accep
ted fo
r Pub
licati
on in
Env
. Sci.
Techn
ol
(May
14, 2
013)
22
(24) Suarez, M. P.; Rifai, H. S. Biodegradation Rates for Fuel Hydrocarbons and Chlorinated 436
Solvents in Groundwater. Bioremediation Journal 1999, 3, 337–362. 437
(25) Dennie, D.; Gladu, I.; Lépine, F.; Villemur, R.; Bisaillon, J.-G.; Beaudet, R. Spectrum of the 438
Reductive Dehalogenation Activity of Desulfitobacterium frappieri PCP-1. Applied and Environmental 439
Microbiology 1998, 64, 4603–4606. 440
(26) Kunapuli, U.; Jahn, M. K.; Lueders, T.; Geyer, R.; Heipieper, H. J.; Meckenstock, R. U. 441
Desulfitobacterium aromaticivorans sp. nov. and Geobacter toluenoxydans sp. nov., iron-reducing 442
bacteria capable of anaerobic degradation of monoaromatic hydrocarbons. International Journal of 443
Systematic and Evolutionary Microbiology 2010, 60, 686–695. 444
(27) Villemur, R.; Lanthier, M.; Beaudet, R.; Lépine, F. The Desulfitobacterium genus. FEMS 445
Microbiology Reviews 2006, 30, 706–733. 446
(28) Smidt, H.; de Vos, W. M. Anaerobic Microbial Dehalogenation. Annu. Rev. Microbiol. 2004, 58, 447
43–73. 448
(29) Chang, Y. C.; Hatsu, M.; Jung, K.; Yoo, Y. S.; Takamizawa, K. Isolation and characterization of 449
a tetrachloroethylene dechlorinating bacterium, Clostridium bifermentans DPH-1. Journal of Bioscience 450
and Bioengineering 2000, 89, 489–491. 451
(30) Flynn, S. J.; Löffler, F. E.; Tiedje, J. M. Microbial Community Changes Associated with a Shift 452
from Reductive Dechlorination of PCE to Reductive Dechlorination of cis-DCE and VC. Environmental 453
Science & Technology 2000, 34, 1056–1061. 454
(31) Lee, P. K. H.; Warnecke, F.; Brodie, E. L.; Macbeth, T. W.; Conrad, M. E.; Andersen, G. L.; 455
Alvarez-Cohen, L. Phylogenetic Microarray Analysis of a Microbial Community Performing Reductive 456
Dechlorination at a TCE-Contaminated Site. Environ. Sci. Technol. 2011, 46, 1044–1054. 457
Accep
ted fo
r Pub
licati
on in
Env
. Sci.
Techn
ol
(May
14, 2
013)
23
(32) Elsner, M.; Hunkeler, D. Evaluating Chlorine Isotope Effects from Isotope Ratios and Mass 458
Spectra of Polychlorinated Molecules. Anal. Chem. 2008, 80, 4731–4740. 459
(33) Hunkeler, D.; Aravena, R.; Butler, B. J. Monitoring Microbial Dechlorination of 460
Tetrachloroethene (PCE) in Groundwater Using Compound-Specific Stable Carbon Isotope Ratios: 461
Microcosm and Field Studies. Environmental Science & Technology 1999, 33, 2733–2738. 462
(34) Liang, X.; Dong, Y.; Kuder, T.; Krumholz, L. R.; Philp, R. P.; Butler, E. C. Distinguishing 463
Abiotic and Biotic Transformation of Tetrachloroethylene and Trichloroethylene by Stable Carbon 464
Isotope Fractionation. Environmental Science & Technology 2007, 41, 7094–7100. 465
(35) Slater, G. F.; Lollar, B. S.; Lesage, S.; Brown, S. Carbon Isotope Fractionation of PCE and TCE 466
During Dechlorination by Vitamin B12. Ground Water Monitoring & Remediation 2003, 23, 59–67. 467
(36) Dayan, H.; Abrajano, T.; Sturchio, N. .; Winsor, L. Carbon isotopic fractionation during 468
reductive dehalogenation of chlorinated ethenes by metallic iron. Organic Geochemistry 1999, 30, 755–469
763. 470
(37) Numata, M.; Nakamura, N.; Koshikawa, H.; Terashima, Y. Chlorine Isotope Fractionation 471
during Reductive Dechlorination of Chlorinated Ethenes by Anaerobic Bacteria. Environ. Sci. Technol. 472
2002, 36, 4389–4394. 473
(38) Bloom, Y.; Aravena, R.; Hunkeler, D.; Edwards, E.; Frape, S. K. Carbon Isotope Fractionation 474
during Microbial Dechlorination of Trichloroethene, cis-1,2-Dichloroethene, and Vinyl Chloride: 475
Implications for Assessment of Natural Attenuation. Environmental Science & Technology 2000, 34, 476
2768–2772. 477
(39) Lee, P. K. H.; Conrad, M. E.; Alvarez-Cohen, L. Stable Carbon Isotope Fractionation of 478
Chloroethenes by Dehalorespiring Isolates. Environmental Science & Technology 2007, 41, 4277–4285. 479
Accep
ted fo
r Pub
licati
on in
Env
. Sci.
Techn
ol
(May
14, 2
013)
24
(40) Aeppli, C.; Hofstetter, T. B.; Amaral, H. I. F.; Kipfer, R.; Schwarzenbach, R. P.; Berg, M. 480
Quantifying In Situ Transformation Rates of Chlorinated Ethenes by Combining Compound-Specific 481
Stable Isotope Analysis, Groundwater Dating, And Carbon Isotope Mass Balances. Environmental 482
Science & Technology 2010, 44, 3705–3711. 483
(41) Elsner, M.; Chartrand, M.; VanStone, N.; Lacrampe Couloume, G.; Sherwood Lollar, B. 484
Identifying Abiotic Chlorinated Ethene Degradation: Characteristic Isotope Patterns in Reaction 485
Products with Nanoscale Zero-Valent Iron. Environ. Sci. Technol. 2008, 42, 5963–5970. 486
(42) Glod, G.; Angst, W.; Holliger, C.; Schwarzenbach, R. P. Corrinoid-Mediated Reduction of 487
Tetrachloroethene, Trichloroethene, and Trichlorofluoroethene in Homogeneous Aqueous Solution: 488
Reaction Kinetics and Reaction Mechanisms. Environmental Science & Technology 1997, 31, 253–260. 489
(43) Abe, Y.; Aravena, R.; Zopfi, J.; Parker, B.; Hunkeler, D. Evaluating the fate of chlorinated 490
ethenes in streambed sediments by combining stable isotope, geochemical and microbial methods. 491
Journal of Contaminant Hydrology 2009, 107, 10–21. 492
493
Accep
ted fo
r Pub
licati
on in
Env
. Sci.
Techn
ol
(May
14, 2
013)
25
TOC / Abstract Art 494
495 496
Accep
ted fo
r Pub
licati
on in
Env
. Sci.
Techn
ol
(May
14, 2
013)
26
Figures 497
498
499
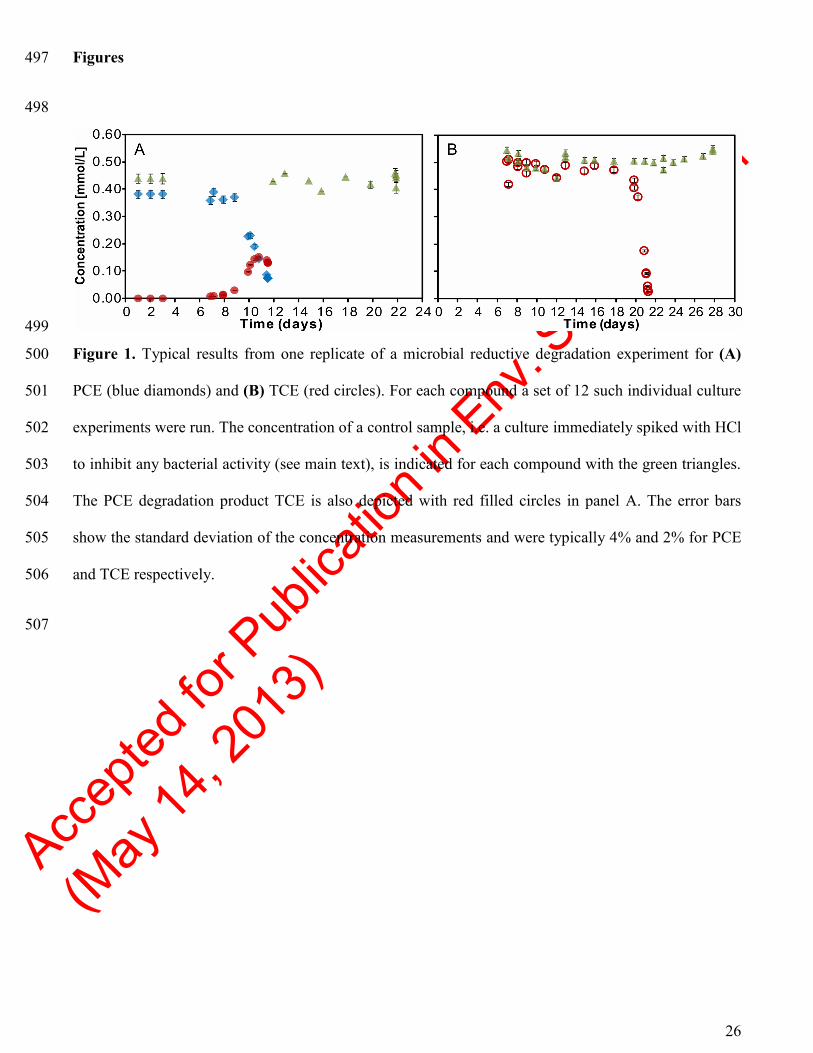
Figure 1. Typical results from one replicate of a microbial reductive degradation experiment for (A) 500
PCE (blue diamonds) and (B) TCE (red circles). For each compound a set of 12 such individual culture 501
experiments were run. The concentration of a control sample, i.e. a culture immediately spiked with HCl 502
to inhibit any bacterial activity (see main text), is indicated for each compound with the green triangles. 503
The PCE degradation product TCE is also depicted with red filled circles in panel A. The error bars 504
show the standard deviation of the concentration measurements and were typically 4% and 2% for PCE 505
and TCE respectively. 506
507
Accep
ted fo
r Pub
licati
on in
Env
. Sci.
Techn
ol
(May
14, 2
013)
27
508
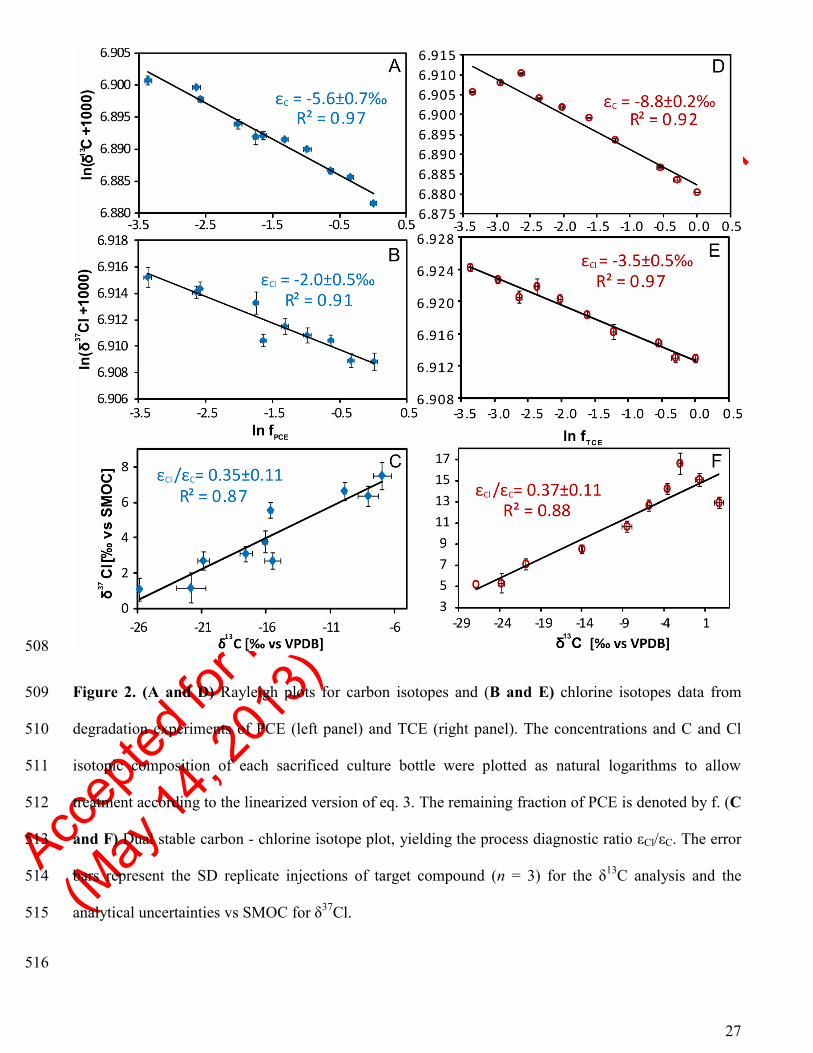
Figure 2. (A and D) Rayleigh plots for carbon isotopes and (B and E) chlorine isotopes data from 509
degradation experiments of PCE (left panel) and TCE (right panel). The concentrations and C and Cl 510
isotopic composition of each sacrificed culture bottle were plotted as natural logarithms to allow 511
treatment according to the linearized version of eq. 3. The remaining fraction of PCE is denoted by f. (C 512
and F) Dual stable carbon - chlorine isotope plot, yielding the process diagnostic ratio εCl/εC. The error 513
bars represent the SD replicate injections of target compound (n = 3) for the δ13
C analysis and the 514
analytical uncertainties vs SMOC for δ37
Cl. 515
516
Accep
ted fo
r Pub
licati
on in
Env
. Sci.
Techn
ol
(May
14, 2
013)
28
517
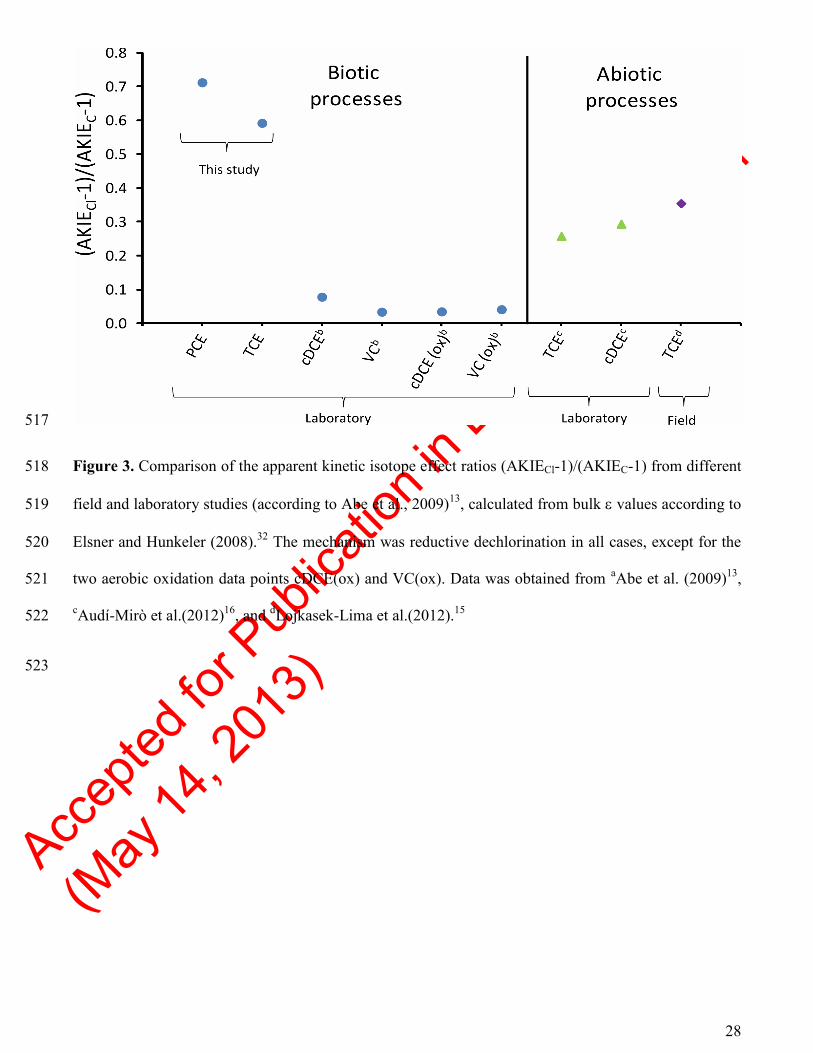
Figure 3. Comparison of the apparent kinetic isotope effect ratios (AKIECl-1)/(AKIEC-1) from different 518
field and laboratory studies (according to Abe et al., 2009)13
, calculated from bulk values according to 519
Elsner and Hunkeler (2008).32
The mechanism was reductive dechlorination in all cases, except for the 520
two aerobic oxidation data points cDCE(ox) and VC(ox). Data was obtained from aAbe et al. (2009)
13, 521
cAudí-Mirò et al.(2012)
16, and
dLojkasek-Lima et al.(2012).
15 522
523
Related Documents


