CARBOHYDRATE CHARACTERIZATION OF RAINWATER FROM SOUTHEASTERN NORTH CAROLINA Jade N. Byrd A Thesis Submitted to the University of North Carolina Wilmington in Partial Fulfillment of the Requirements for the Degree of Master of Science Center for Marine Science University of North Carolina Wilmington 2012 Approved by Advisory Committee Robert J. Kieber Douglas Gamble Ralph N. Mead Joan D. Willey G. Brooks Avery Chair Accepted by ______________________________ Dean, Graduate School

Welcome message from author
This document is posted to help you gain knowledge. Please leave a comment to let me know what you think about it! Share it to your friends and learn new things together.
Transcript

CARBOHYDRATE CHARACTERIZATION OF RAINWATER FROM SOUTHEASTERN
NORTH CAROLINA
Jade N. Byrd
A Thesis Submitted to the
University of North Carolina Wilmington in Partial Fulfillment
of the Requirements for the Degree of
Master of Science
Center for Marine Science
University of North Carolina Wilmington
2012
Approved by
Advisory Committee
Robert J. Kieber Douglas Gamble
Ralph N. Mead Joan D. Willey
G. Brooks Avery
Chair
Accepted by
______________________________
Dean, Graduate School

ii
TABLE OF CONTENTS
ABSTRACT ................................................................................................................................... iii
ACKNOWLEDGEMENTS ........................................................................................................... iv
DEDICATION .................................................................................................................................v
LIST OF TABLES ......................................................................................................................... vi
LIST OF FIGURES ...................................................................................................................... vii
INTRODUCTION ...........................................................................................................................1
Sources and geochemical significance of carbohydrates .....................................................1
Importance of identifying carbohydrates .............................................................................1
METHODS ......................................................................................................................................3
Sample collection .................................................................................................................3
Storm classification ..............................................................................................................3
Sample analysis ....................................................................................................................4
Saccharide analysis ...........................................................................................................4
Recovery ...........................................................................................................................6
Cation analysis ..................................................................................................................6
Dissolved organic carbon analysis ....................................................................................7
Analysis of supporting data ..............................................................................................7
RESULTS & DISCUSSION............................................................................................................8
Dissolved organic carbon (DOC) comparison ...................................................................11
Carbohydrate concentrations by trajectory ........................................................................12
Seasonal carbohydrate concentrations ...............................................................................17
Hurricane Irene and effects on carbohydrate concentrations .............................................23
Levoglucosan and potassium as biomass burning indicators ............................................26
IMPLICATIONS ...........................................................................................................................29
Wet deposition as a removal for aerosols ..........................................................................29
Rainwater carbohydrate flux and contribution to surface waters ......................................30
LITERATURE CITED ..................................................................................................................32
APPENDIX ....................................................................................................................................35

iii
ABSTRACT
Carbohydrates are widely reported in atmospheric aerosols, but no documented studies
exist that examine individual carbohydrates in rainwater. Using a method developed in our
laboratory, we have identified and quantified specific carbohydrates in rainwater. Carbohydrate
concentrations were measured in rain from 53 events in Wilmington, NC from May 2011-
October 2012. Individual concentrations ranged from 0.1 nM to 5.8 μM, with glucose and
sucrose being the predominant carbohydrates. Concentrations exhibited a distinct seasonal
oscillation, with higher concentrations in spring and summer, driven primarily by increased
biogenic inputs during the growing season. Levoglucosan, a carbohydrate associated with
biomass burning, was observed during the summer, when fires occur, and the highest levels were
observed in rain occurring during a local fire approximately 20 km from our location.
Levoglucosan concentrations were also correlated with K+ concentration, another biomass
burning indicator. Concentrations of carbohydrates in rain were an order of magnitude higher in
storms of terrestrial origin compared to marine events, suggesting a significant terrestrial source,
most likely from biogenic inputs. Carbohydrate concentrations comprised up to 35 percent of
dissolved organic carbon in rain. Overall concentrations compare to reported aerosol
concentrations, which suggests that wet deposition is an important removal of these compounds
from the atmosphere.

iv
ACKNOWLEDGEMENTS
I would like to give special thanks to Kate Mullaugh, who provided instruction, a very
significant amount of patience, and mentoring of this project. I’d like to thank my committee for
their support and input, and ideas: thanks to Dr. Willey for helping with sea salt calculations and
the conversion of aerosol concentrations to comparative rainwater concentrations, to Dr. Avery
for helping with the flux calculations, to Dr. Kieber for all his help with writing and revisions,
and to Dr. Mead for helpful analytical ideas for fixing the GC/MS a hundred times. I would also
like to thank everyone in the MACRL lab that collaborated on the rain project. I couldn’t have
completed my work without those who helped collect supporting data, and especially without
those who collected and froze samples for me when I couldn’t be here. I’m especially thankful
to Alyssa Wetterauer for keeping me sane when I got fidgety, for providing reason to the
situation when I was absolutely unreasonable and stressed out, and for being an amazing friend
and colleague for the past two years.
This research was funded by NSF grants AGS0646153 and AGS1003078.

v
DEDICATION
I would like to dedicate this thesis to my parents, Wayne and Francine Byrd. It is
because of their love, support, and advice that I was able to be the person I am and make it to this
point in my education.

vi
LIST OF TABLES
Table Page
1. Automated temperature gradient program used for GC/MS analysis .......................................5
2. Ions used to quantify specific carbohydrates ............................................................................5
3. Response factors for carbohydrates ..........................................................................................6
4. Volume weighted averages and standard deviations of analytes measured in rain
during collection period ............................................................................................................8
5. Carbohydrate sources ..............................................................................................................15
6. Classification of storms by season ..........................................................................................17
7. Summary of aerosol concentrations ........................................................................................29

vii
LIST OF FIGURES
Figure Page
1. Volume weighted averages and standard deviations of carbohydrates collected
during entire sample period at Wilmington, NC, USA .............................................................9
2. Volume weighted averages of carbohydrates collected from 14 June 2011 to 13
June 2012 in Wilmington, NC, USA ......................................................................................10
3. Volume weighted averages of carbohydrate concentrations as a percent of the total
concentrations for the entire sample period ............................................................................10
4. Relationship between carbohydrate concentration and DOC concentration ..........................11
5. Carbohydrates as a percent of dissolved organic carbon ........................................................12
6. Summary of volume weighted average concentrations for all terrestrial and marine
events ......................................................................................................................................12
7. Volume weighted concentrations and standard deviations of carbohydrates in
terrestrial events ......................................................................................................................14
8. Terrestrial volume weighted average carbohydrate concentrations represented as
a percent of the total terrestrial carbohydrate concentration ...................................................14
9. Volume weighted concentrations and standard deviations of carbohydrates in
marine events .........................................................................................................................16
10. Marine volume weighted average carbohydrate concentrations represented as a
percent of the total marine carbohydrate concentration ..........................................................16
11. Volume weighted average concentrations and standard deviations of spring rain
events in Wilmington, NC ......................................................................................................18
12. Spring season volume weighted average carbohydrate concentrations represented
as a percent of the total spring carbohydrate concentration ....................................................18
13. Volume weighted average concentrations and standard deviations of summer rain
events in Wilmington, NC ......................................................................................................19
14. Summer season volume weighted average carbohydrate concentrations represented
as a percent of the total summer carbohydrate concentration .................................................20
15. Volume weighted average concentrations and standard deviations of fall rain events
in Wilmington, NC 20

viii
Figure Page
16. Fall season volume weighted average carbohydrate concentrations represented as a
percent of the total fall carbohydrate concentration ...............................................................21
17. Volume weighted average concentrations and standard deviations of winter rain
events in Wilmington, NC ......................................................................................................21
18. Winter season volume weighted average carbohydrate concentrations represented
as a percent of the total winter carbohydrate concentration....................................................22
19. Volume weighted average concentrations of carbohydrates for all seasons ...........................22
20. Trajectory of various time points collected during Hurricane Irene, with increasing
terrestrial influence as the storm progressed ..........................................................................23
21. Storm track of Hurricane Irene ...............................................................................................24
22. Levoglucosan, arabitol, and dulcitol concentrations collected during Hurricane
Irene ........................................................................................................................................24
23. Concentrations of pinitol, mannitol, and arabitol collected during Hurricane Irene ..............25
24. Concentrations of glucose, fructose, galactose, and sucrose collected during
Hurricane Irene .......................................................................................................................25
25. Hurricane Irene total carbohydrates represented as deposition ..............................................26
26. NASA MODIS satellite image of a biomass burning event in Pender County,
NC, from June 23, 2011, with a star representing the sampling site ......................................27
27. Levoglucosan concentration versus potassium concentration ................................................28

INTRODUCTION
Sources and Geochemical Significance of Carbohydrates
Carbohydrates are biologically and chemically labile compounds which enter the
atmosphere from release by plants, animals, and microorganisms (Simoneit, Elias et al. 2004;
Medeiros, Conte et al. 2006), and exist widely in urban, rural, and remote atmosphere (Ma,
Wang et al. 2009). Specific carbohydrates can be traced to particular sources, whether terrestrial
or marine, and can be traced further to specific species of plants or human activity. Sources of
carbohydrates include natural biogenic detritus such as plant wax, lichens, yeast, bacteria,
microbes, or pollen, and also anthropogenic emissions such as oil or soot, soil organic matter,
and biomass burning, both natural and anthropogenic (Medeiros, Conte et al. 2006; Caseiro,
Marr et al. 2007; Ma, Wang et al. 2009). Carbohydrates are found in both in marine and
terrestrial plants and animals (Aluwihare and Repeta 1999; Medeiros, Conte et al. 2006; Fu,
Kawamura et al. 2012), and they represent the carbon released most commonly into the
atmosphere after the process of photosynthesis (Cowie and Hedges 1984).
Importance of Identifying Carbohydrates
Despite the potential importance of atmospheric borne carbohydrates to the environment,
there have been no studies examining the occurrence and distribution of individual carbohydrates
in rainwater. Total carbohydrates have been examined in seawater and plant matter (Mopper
1973; Cowie and Hedges 1984), as well as carbohydrates in aerosols (Simoneit, Elias et al. 2004;
Ma, Wang et al. 2009; Jia, Bhat et al. 2010; Fu, Kawamura et al. 2012), but none of these studies
have examined specific carbohydrates in rain. Furthermore, previous studies utilizing bulk
methods were uncertain due to interference from noncarbohydrate compounds (Mopper 1973;
Cowie and Hedges 1984). In the current study, molecular approach was used to identify specific

2
carbohydrate compounds. Specific carbohydrates can be used as tracers to identify pathways
and sources of organic carbon transport (Cowie and Hedges 1984). For example, atmospheric
particles contain organic tracers that are characteristic of their sources, mode of formation and
subsequent alteration during transport downwind (Medeiros, Conte et al. 2006).
Previous aerosol research can be used to support the interpretations of this study with
respect to potential sources of specific carbohydrates (Ma, Wang et al. 2009; Jia, Bhat et al.
2010). For example, levoglucosan is found in the presence of biomass burning (Simoneit, Elias
et al. 2004; Medeiros, Conte et al. 2006; Jia, Bhat et al. 2010; Wang, Chen et al. 2011); sucrose
is a component of pollen (Shaked, Rosenfeld et al. 2004; Firon, Shaked et al. 2006; Medeiros,
Conte et al. 2006; Jia, Bhat et al. 2010; Snider, Oosterhuis et al. 2011; Fu, Kawamura et al.
2012). Mycose (trehalose) is found in microorganisms such as fungi, bacteria, and yeast, and is a
sign of stress in plants (Ashraf and Harris 2004), which not only can be important with respect to
source of the carbohydrate, but also environmental conditions during the sampling period.
Potassium can also be used to quantify the influence of biomass burning (Medeiros, Conte et al.
2006).
The purpose of this study was to characterize and quantify specific carbohydrates in
rainwater to offer information about organic carbon transport and rainwater as a source of
carbohydrates to surface water. The abundance of aerosol studies concerning carbohydrates
allowed comparison of concentrations in aerosols and rainwater, and gave insight into the source
of carbohydrates to rainwater and the importance of wet deposition as a removal mechanism for
carbohydrates from aerosols.

METHODS
Sample Collection
Samples were collected during rain events at the University of North Carolina
Wilmington (34°13.9′N, 77°52.7′W), using Aerochem-Metrics (ACM) Model 301 Automatic
Sensing Wet/Dry Precipitation Collectors. Samples were collected in beakers that were pre-
combusted at 450°C for at least 4 hours to remove organics. Beakers were replaced after each
rain event. Samples were filtered using 0.2 μm pore size polyethersulfone filters (Pall) under
gentle vacuum to reduce the presence of particulates and bacteria. Immediately after the
cessation of each event, known volumes of filtered samples were flash frozen in pre-combusted
pear-shaped flasks in a dry ice and acetone bath.
Storm Classification
Precipitation events were categorized using air-mass back-trajectories generated by
version 4 of the Hybrid Single Particle Lagrangian Integrated Trajectory Model (HYSPLIT)
developed at the National Oceanic Atmospheric Administration – Air Resources Laboratory
(NOAA/ARL - http://www.arl.noaa.gov/ready/hysplit4.html). Single back-trajectories were run
for each precipitation event collected at UNCW starting at the recorded conclusion of
precipitation. Trajectories were generated for a 120-hour time period, at the 1000 m, 500 m, and
10 m height levels to represent the air masses at various elevations that may contribute to wet
deposition (Walker, Aneja et al. 2000). The last 72 hours of each trajectory were visually
categorized for this study based on path (terrestrial, oceanic, coastal, or mixed). Imagery from
the NASA MODIS satellite was used to identify the presence of burn events in the region
(http://activefiremaps.fs.fed.us/activefiremaps.php?op=archive&rCode=ssa&sensor=modis).

4
Sample Analysis
Saccharide Analysis
Standards used for qualitative analysis were of a purity > 90%. Standards and reagents
used for quantitative analysis were of a purity > 98%. Frozen samples were lyophilized to
completion. Remaining sample was transferred to pre-combusted vials using a mixture
containing 80% methanol (Honeywell) and 20% deionized water (DIW) obtained from a MilliQ
Ultra purification system. The sample was placed in an ultrasonic bath for 5 minutes. This
process was repeated twice. Resulting sample was evaporated to dryness under a flow of ultra
high purity (UHP) nitrogen. Dried sample was derivatized in a method similar to Pietrogrande
and Bacco (2011) to allow analysis by gas chromatography. 200 μL N,o-Bis (Trimethylsilyl)
trifluoroacetamide (BSTFA) + 10% TMCS (Thermo Scientific) and 100 μL pyridine (Acros)
were added to sample to substitute the active hydrogen with trimethylsilanized derivant and
accept the proton removed from the carbohydrate, respectively. Pyridine was stored over
molecular sieve and with a dry nitrogen head-space in order to minimize the water content
present during derivatization. BSTFA + 10% TMCS was stored at 4°C until used.
Derivatization took place at 70°C for one hour. After derivatization, sample was completely
evaporated under nitrogen and transferred to a pulled point glass insert (Agilent) with rinses of
dichloroethane (Acros), hexane (Honeywell), and dichloromethane (Honeywell). Sample was
reconstituted in a known concentration of dichloroethane.
Samples were analyzed within 24 hours of preparation. Samples were injected in
triplicate on a Varian CP-3800 Gas Chromatograph coupled to a Saturn 2200 GC/MS, using a
Varian CP-8400 Autosampler. Gas chromatograph was fitted with a DB-5 column (30 m x 0.250
mm internal diameter, 0.25 μm film thickness, Agilent). The oven temperature program is

5
summarized in Table 1. Samples of 1 μL were injected at 280 °C. Helium was used as the
carrier gas at a flow rate of 1.2 mL/min. Scan range of mass spectrometer was 40-650 m/z.
Analyses were performed using a split ratio of 50:50.
Table 1. Automated temperature gradient program used for GC/MS analysis.
Beginning Temperature (°C) Ramp (°C/min) Hold time (min) Total Time (min)
65 - 1 1
180 20 - 6.75
220 3 - 20.08
280 20 - 23.08
300 3 2 31.75
Specific carbohydrates were identified based upon retention time and mess spectra of
authentic standards. The ions used to quantify specific carbohydrates are summarized in Table 2.
Carbohydrates were quantified with calibration curves constructed using standards of glucose
and sucrose (Supelco) in methanol (Honeywell) for monosaccharides and disaccharides,
respectively.
Table 2. Ions used to quantify specific carbohydrates.
Carbohydrate Ions (m/z)
Arabinose 204, 217, 355
Levoglucosan 204, 217, 333
Arabitol 217, 243, 319
Fructose 217, 257, 347, 437
Pinitol 217, 260, 318
Glucose 191, 204, 217
Galactose 191, 204, 217
Mannitol 205, 217, 319
Dulcitol 217, 305, 319
Sucrose 217, 361, 437
Trehalose 191, 217, 361
Response factors were calculated that allow the use of these sugars. RF values for
carbohydrates are in Table 3.
6
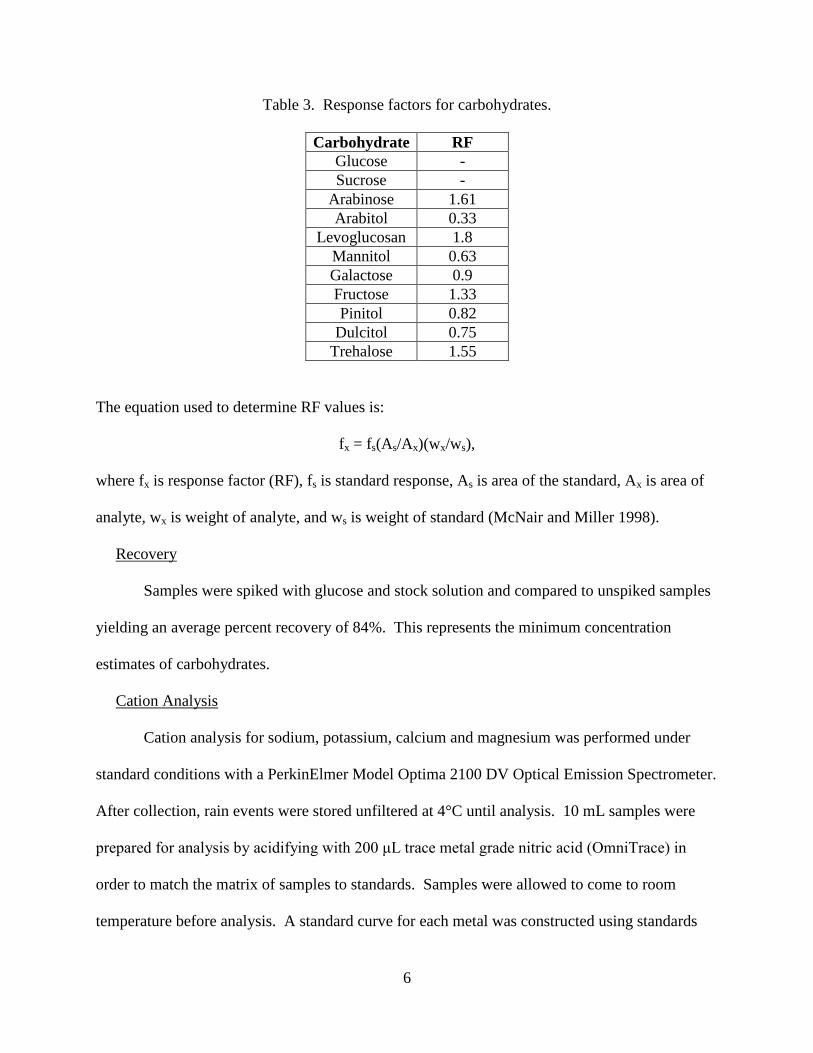
Table 3. Response factors for carbohydrates.
Carbohydrate RF
Glucose -
Sucrose -
Arabinose 1.61
Arabitol 0.33
Levoglucosan 1.8
Mannitol 0.63
Galactose 0.9
Fructose 1.33
Pinitol 0.82
Dulcitol 0.75
Trehalose 1.55
The equation used to determine RF values is:
fx = fs(As/Ax)(wx/ws),
where fx is response factor (RF), fs is standard response, As is area of the standard, Ax is area of
analyte, wx is weight of analyte, and ws is weight of standard (McNair and Miller 1998).
Recovery
Samples were spiked with glucose and stock solution and compared to unspiked samples
yielding an average percent recovery of 84%. This represents the minimum concentration
estimates of carbohydrates.
Cation Analysis
Cation analysis for sodium, potassium, calcium and magnesium was performed under
standard conditions with a PerkinElmer Model Optima 2100 DV Optical Emission Spectrometer.
After collection, rain events were stored unfiltered at 4°C until analysis. 10 mL samples were
prepared for analysis by acidifying with 200 μL trace metal grade nitric acid (OmniTrace) in
order to match the matrix of samples to standards. Samples were allowed to come to room
temperature before analysis. A standard curve for each metal was constructed using standards

7
prepared in 2% nitric acid from commercially available ICP stock solutions (Clåritas).
Absorbance was analyzed at 589.592 nm for sodium, 317.933 nm for calcium, 285.213 nm for
magnesium, and 766.490 nm for potassium.
Duplicated samples were measured with average RSD values of 0.43% for magnesium,
2.82% for calcium, 1.05% for sodium, and 0.74% for potassium. A standard rainwater reference
material in a matrix of 2% nitric acid containing the cations analyzed (LGC Standards) was
analyzed with each sample run, with a difference between the analytical value and the reported
value of 10.93% for magnesium, -36.41% for sodium, and 49.61% for potassium.
Dissolved Organic Carbon Analysis
Filtered rain events were acidified with 100 μL 6M HCl and stored in combusted vials at
4°C until analysis to determine dissolved organic carbon concentrations by high temperature
combustion using a Shimadzu TOC 5000 total organic carbon analyzer equipped with an ASI
5000 autosampler. Standards were made using 0-500 µM potassium hydrogen phthalate solution
and deionized water (DIW) obtained from a MilliQ Ultra purification system. This curve was
used to determine the concentration of duplicate samples. The resulting RSD was ≤3% at typical
rainwater concentrations (Willey, Kieber et al. 2006).
Analysis of Supporting Data
Inorganic ions (Cl−, NO3−,and SO4
2- ) were analyzed using suppressed ion
chromatography. A Ross electrode with low ionic strength buffers was used for pH analysis.

RESULTS & DISCUSSION
Rainwater was collected from 53 rain events from June 2011 through October 2012
analyzed for carbohydrates (Figure 1). This represents 40% of the total rain events that occurred
during the study. Rain events with inadequate volume or not collected within 6 hours of the
cessation of the rain event were not analyzed for carbohydrates. A subset of samples from 14
June 2011 to 13 June 2012 (138 rain events, 49 of which were analyzed for carbohydrates) was
used to represent an average calendar year for comparison purposes (Figure 2). The sample year
had 145.2 cm of rain (10.5 mm per event) which is near the 156.1 cm per year average at the
Wilmington, North Carolina, USA, International Airport (ILM) based on data from 1999-2009
collected by the National Climatic Data Center (2009). This indicates that the data set
represented an average year (Figure 2) and was not abnormally wet or dry. 105.8 cm of rain were
analyzed for carbohydrates, which represents 72.8% of the total rain by volume collected during
the sample year. Table 4 contains the volume weighted average concentrations of other relevant
analytes in the rainwater samples analyzed. These parameters are at or near concentrations
reported earlier at this location (Kieber, Willey et al. 2002; Kieber, Skrabal et al. 2004),
suggesting the compositional characteristics of the rainwater were near normal for the sampling
period.
Table 4. Volume weighted averages and standard deviations of analytes measured in rain
during collection period.
Analyte Volume Weighted Average
pH 4.95 ± 0.06
DOC 76.5 ± 11.2 μM
Cl- 42.84 ± 9.35 μM
NO3- 9.24 ± 0.85 μM
NSS 5.28 ± 0.66 μM

9
The concentrations of individual carbohydrates ranged from 0.1 nM to 5 μM, displayed in
Figures 1 & 2 as volume weighted averages to take into account the amount of rainfall received
for each event. High standard deviations in volume weighted averages are due to affects of
seasonality and storm origin. Carbohydrates found in rainwater are similar to those characterized
in aerosol studies (Simoneit, Elias et al. 2004; Jia, Bhat et al. 2010; Tominaga, Matsumoto et al.
2011; Wang, Chen et al. 2011). Sucrose is the most predominant carbohydrate (Figure 3) due to
its biogenic input in the spring and summer from pollen-producing plants (Firon, Shaked et al.
2006; Jia, Bhat et al. 2010; Snider, Oosterhuis et al. 2011; Fu, Kawamura et al. 2012). Glucose
is also significant due to its ubiquity in the environment in plant matter. (Dahlman, Persson et al.
2003; Cowie and Hedges 1984).
Figure 1. Volume weighted averages and standard deviations of carbohydrates collected
during entire sample period at Wilmington, NC, USA (n = 53).

10
Figure 2. Volume weighted averages of carbohydrates collected from 14 June 2011 to 13 June
2012 in Wilmington, NC, USA.
Figure 3. Volume weighted averages of carbohydrate concentrations as a percent of the total
concentrations for the entire sample period.
11
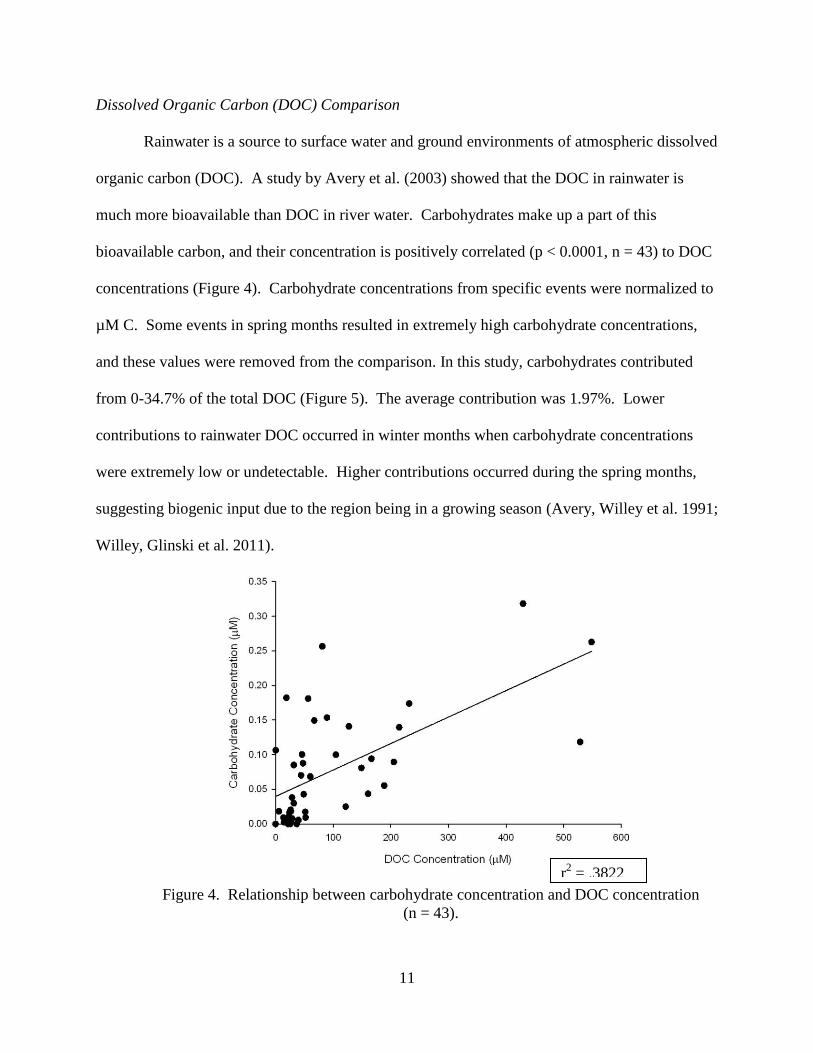
Dissolved Organic Carbon (DOC) Comparison
Rainwater is a source to surface water and ground environments of atmospheric dissolved
organic carbon (DOC). A study by Avery et al. (2003) showed that the DOC in rainwater is
much more bioavailable than DOC in river water. Carbohydrates make up a part of this
bioavailable carbon, and their concentration is positively correlated (p < 0.0001, n = 43) to DOC
concentrations (Figure 4). Carbohydrate concentrations from specific events were normalized to
µM C. Some events in spring months resulted in extremely high carbohydrate concentrations,
and these values were removed from the comparison. In this study, carbohydrates contributed
from 0-34.7% of the total DOC (Figure 5). The average contribution was 1.97%. Lower
contributions to rainwater DOC occurred in winter months when carbohydrate concentrations
were extremely low or undetectable. Higher contributions occurred during the spring months,
suggesting biogenic input due to the region being in a growing season (Avery, Willey et al. 1991;
Willey, Glinski et al. 2011).
Figure 4. Relationship between carbohydrate concentration and DOC concentration
(n = 43).
r2 = .3822

12
Figure 5. Carbohydrates as a percent of dissolved organic carbon (DOC).
Carbohydrate Concentrations by Air-Mass Back Trajectory
Rain events were classified as being of a terrestrial, marine, mixed, or coastal trajectory.
A summary of terrestrial and marine events is shown in Figure 6. Terrestrial carbohydrate
concentrations in rain were an order of magnitude higher than those in marine events, due to
biogenic input.
Figure 6. Summary of volume weighted average concentrations for all terrestrial and
marine events.

13
Events classified as terrestrial had a path that crossed predominantly over land within the
last 72 hours before the storm reached Wilmington, NC. Volume weighted average
concentrations in terrestrial events ranged from 1.83 nM to 93.2 nM, indicating an input from
biogenic terrestrial material (Figures 7 & 8). Glucose, the predominant carbohydrate in
terrestrial storms, most likely is present in a higher concentration due to its ubiquity in the
environment in plant matter (Dahlman, Persson et al. 2003) and the fact that it is present at high
levels in vascular plants (Cowie and Hedges 1984). The other carbohydrates present also have
biogenic terrestrial sources. Caseiro et al. (2007) compiled a table of several different
carbohydrates and their sources, which is summarized to include carbohydrates found in this
study (Table 5). Sucrose is the next most abundant carbohydrate in rain after glucose, which is
likely because of its presence in pollen and the increase of pollen in spring (Firon, Shaked et al.
2006; Jia, Bhat et al. 2010; Snider, Oosterhuis et al. 2011; Fu, Kawamura et al. 2012).
Levoglucosan is also an important contributor, likely because of its source through biomass
burning(Simoneit, Elias et al. 2004; Medeiros, Conte et al. 2006; Jia, Bhat et al. 2010; Wang,
Chen et al. 2011).

14
Figure 7. Volume weighted concentrations and standard deviations of carbohydrates in
terrestrial events (n = 11).
Figure 8. Terrestrial volume weighted average carbohydrate concentrations represented
as a percent of the total terrestrial carbohydrate concentration.

15
Table 5. Carbohydrate sources (Caseiro, Marr et al. 2007).
Carbohydrate Source
Arabinose Lichens
Fructose Lichens, soil biota
Galactose Soil biota
Glucose Fungi, lichens, soil biota, wood burning
Sucrose Plants, soil biota
Mycose (Trehalose) Yeast, bacteria, fungi, soil biota
Arabitol Fungi, lichens
Mannitol Fungal spores, fungi, lichens, soil biota
Levoglucosan Wood burning
Storms that passed predominantly over the Atlantic Ocean within 72 hours prior to
landfall in Wilmington, NC were classified as marine events. Volume weighted average
concentrations of carbohydrates in these events (n = 13) were significantly lower (p = 0.014)
than those of terrestrial storms, ranging from below 1.0 nM to 18.1 nM (Figures 9 and 10). Fu et
al. (2011) reported values for carbohydrates in marine aerosols, which were lower than values
reported for other aerosol studies (Simoneit, Elias et al. 2004; Jia, Bhat et al. 2010; Tominaga,
Matsumoto et al. 2011; Wang, Chen et al. 2011). Galactose contributed at a higher percent
(11.0% as opposed to 3.7%) in marine storms than in terrestrial events, possibly due to its
increased presence in plankton (Brockmann, Eberlein et al. 1979; Aluwihare and Repeta 1999).
Levoglucosan contributed a lower percent in marine events, which is likely due to the fact that its
source is biomass burning, which originates over land. Higher carbohydrate concentrations in
terrestrial events as opposed to marine events corresponds with data for other analytes in
rainwater, such as organic acids (Willey, Kieber et al. 2000; Avery, Kieber et al. 2006).

16
Figure 9. Volume weighted concentrations and standard deviations of carbohydrates in
marine events (n = 13).
Figure 10. Marine volume weighted average carbohydrate concentrations represented as
a percent of the total marine carbohydrate concentration.

17
Seasonal Carbohydrate Concentrations
Storms were separated into four equal time periods (Table 6) in order to allow for
analysis of seasonal trends.
Table 6. Classification of storms by season.
Season Dates
Spring February 1-April 30
Summer May 1-July 31
Fall August1-October 31
Winter November1-January 31
Volume weighted carbohydrate concentrations in spring were highest, ranging from
below 1.0 nM to 283.23 nM (Figures 11 & 12). The likely cause of high concentrations in the
spring is new growth and pollination of plants, since this period is during the growing season in
the sampling region (Avery, Willey et al. 1991; Willey, Glinski et al. 2011). Sucrose
concentrations were an order of magnitude higher in spring rain events (3.4 μM in one event),
and sucrose was the most abundant carbohydrate (42%). This is most likely due to the
composition of pollen being high in sucrose (Firon, Shaked et al. 2006; Jia, Bhat et al. 2010;
Snider, Oosterhuis et al. 2011; Fu, Kawamura et al. 2012). The most recent study of Fu et al.
(2012) determined the concentrations of sucrose in several different pollen species, and found the
pollen to be composed predominantly of sucrose. They also found a seasonal trend in sucrose
concentrations, with all carbohydrates increasing during the local growing season, but sucrose
increasing an order of magnitude. Glucose is the next most abundant carbohydrate, again
probably due to its ubiquity in the environment in plant matter, followed by levoglucosan, which
is expected to be present due to burn events in the surrounding area.

18
Figure 11. Volume weighted average concentrations and standard deviations of spring rain
events in Wilmington, NC (n = 10).
Figure 12. Spring season volume weighted average carbohydrate concentrations
represented as a percent of the total spring carbohydrate concentration.

19
Concentrations of carbohydrates in summer season were lower than that of spring, but
carbohydrates were still abundant in rain events (Figures 13 and 14), as they still fell into the
growing season in the region (Willey, Glinski et al. 2011). Volume weighted average
concentrations ranged from 8.8 nM to 186 nM. Sucrose was still the carbohydrate with the
highest concentration, followed by trehalose and glucose. The high concentration for trehalose
could possibly be caused by an extreme burn event in the area during this time period, which
could have released specific compounds into the atmosphere due to the composition of
vegetation that underwent burning, or due to plant stress in the region (Ashraf and Harris 2004).
Ashraf and Harris found elevated concentrations of trehalose in plants that had undergone stress.
Figure 13. Volume weighted average concentrations and standard deviations of summer rain
events in Wilmington, NC (n = 7).

20
Figure 14. Summer season volume weighted average carbohydrate concentrations
represented as a percent of the total summer carbohydrate concentration.
Concentrations of carbohydrates showed a significant decrease (p = 0.031) from summer
to fall, with a fall volume weighted average concentration range from 0 nM to 17.16 nM (Figures
15 and 16). Concentrations likely decreased because the biogenic input is not as significant in
fall as in the spring and summer months.
Figure 15. Volume weighted average concentrations and standard deviations of fall rain events
in Wilmington, NC (n = 27).

21
Figure 16. Fall season volume weighted average carbohydrate concentrations
represented as a percent of the total fall carbohydrate concentration.
Carbohydrate concentrations continued to decrease in winter months (Figures 17 and 18),
with concentrations ranging from 0.06 nM to 16.96 nM. This is most likely because much of the
vegetation in this region is not producing new growth during this time period. A comprehensive
graph is shown representing the decrease in concentration by season (Figure 19).
Figure 17. Volume weighted average concentrations and standard deviations of winter rain
events in Wilmington, NC (n = 7).

22
Figure 18. Winter season volume weighted average carbohydrate concentrations
represented as a percent of the total winter carbohydrate concentration.
A summary of the volume weighted averages for the four seasons is in Figure 19,
showing that concentrations in spring and summer were an order of magnitude higher than those
in fall and winter, due to biogenic inputs of new plant growth in the spring and summer months.
Figure 19. Volume weighted average concentrations of carbohydrates for all seasons.
23
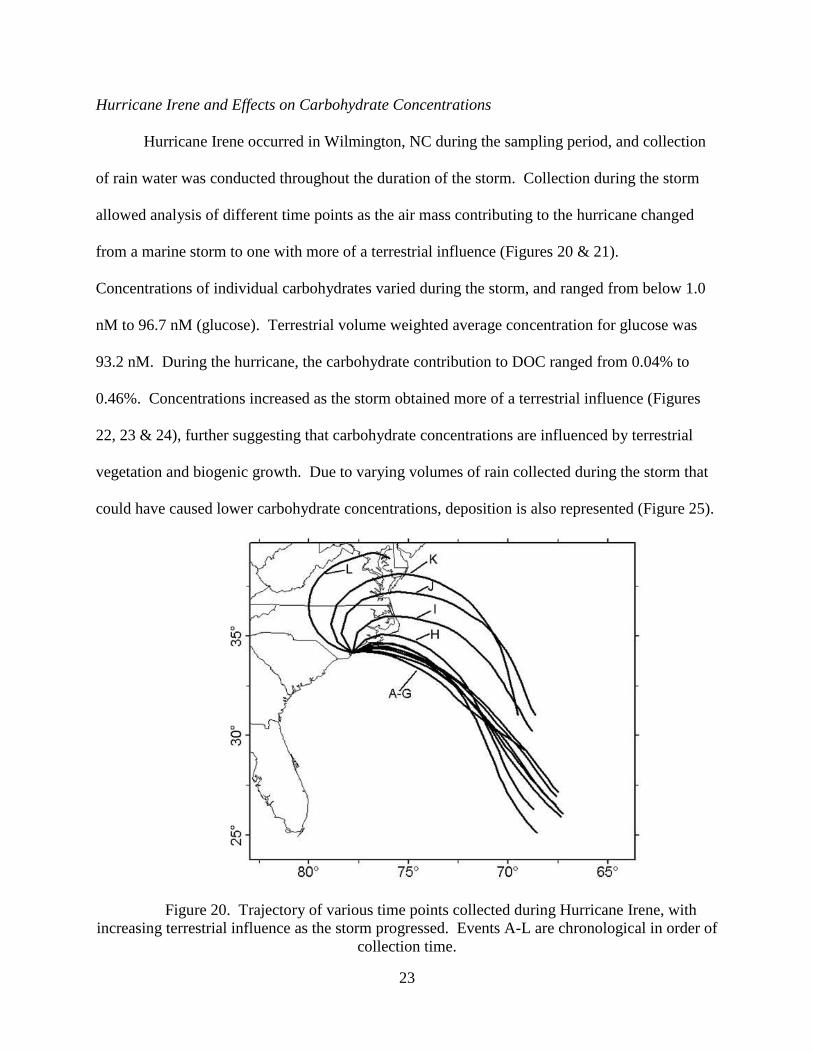
Hurricane Irene and Effects on Carbohydrate Concentrations
Hurricane Irene occurred in Wilmington, NC during the sampling period, and collection
of rain water was conducted throughout the duration of the storm. Collection during the storm
allowed analysis of different time points as the air mass contributing to the hurricane changed
from a marine storm to one with more of a terrestrial influence (Figures 20 & 21).
Concentrations of individual carbohydrates varied during the storm, and ranged from below 1.0
nM to 96.7 nM (glucose). Terrestrial volume weighted average concentration for glucose was
93.2 nM. During the hurricane, the carbohydrate contribution to DOC ranged from 0.04% to
0.46%. Concentrations increased as the storm obtained more of a terrestrial influence (Figures
22, 23 & 24), further suggesting that carbohydrate concentrations are influenced by terrestrial
vegetation and biogenic growth. Due to varying volumes of rain collected during the storm that
could have caused lower carbohydrate concentrations, deposition is also represented (Figure 25).
Figure 20. Trajectory of various time points collected during Hurricane Irene, with
increasing terrestrial influence as the storm progressed. Events A-L are chronological in order of
collection time.

24
Figure 21. Storm track of Hurricane Irene.
Figure 22. Levoglucosan, arabitol, and dulcitol concentrations collected during
Hurricane Irene, with a line separating marine and terrestrial influence.
0.0
0.5
1.0
1.5
2.0
2.5
3.0
3.5
Co
nce
ntr
ati
on
, n
M
Levoglucosan
Arabitol
Dulcitol

25
Figure 23. Concentrations of pinitol, mannitol, and arabitol collected during Hurricane
Irene, with a line separating marine and terrestrial influence.
Figure 24. Concentrations of glucose, fructose, galactose, and sucrose collected during
Hurricane Irene, with a line separating marine and terrestrial influence.
0
2
4
6
8
10
12
14
16
18
Co
nce
ntr
ati
on
(n
M)
Pinitol
Mannitol
Trehalose
0
20
40
60
80
100
120
Con
cen
trati
on
(n
M)
Fructose
Glucose
Galactose
Sucrose

26
Figure 25. Hurricane Irene total carbohydrates represented as deposition, with a line
separating marine and terrestrial influence.
Levoglucosan and Potassium as Biomass Burning Indicators
Rain events with elevated concentrations of levoglucosan (greater than 30 nM) were
compared to imagery from the NASA MODIS satellite to determine if the increased
concentration was affected by biomass burning in the region.
Events 1058 and 1059 were collected on June 29, 2011, when a fire in Pender County,
NC, USA had been burning over 21,000 acres since June 13, 2011. Active fire spots were
detected in the region (Figure 26), and most likely contributed to the elevated concentrations of
these two events (23.94 nM and 42.87 nM, respectively). Non-burn concentrations around this
time period ranged from 1-12 nM. These findings agree with several other studies conducted that
examined the effect of biomass burning on levoglucosan concentrations (Leithead, Li et al. 2005;
Medeiros, Conte et al. 2006; Yuan-xun, Min et al. 2006; Mazzoleni, Zielinska et al. 2007; Jia,
0
200
400
600
800
1000
1200
1400
Ca
rbo
hy
dra
te D
epo
siti
on
(μ
mo
l/m
2)

27
Bhat et al. 2010; Wang, Chen et al. 2011; Urban, Lima-Souza et al. 2012). Medeiros et al.
(2006) performed a study Maine in which aerosols were collected during a biomass burning
event, which resulted in levoglucosan concentrations increasing by up to an order of magnitude.
A study by Urban et al. (2012) showed an increase in levoglucosan concentration in the
increased presence of fire spots around the sampling area.
Figure 26. NASA MODIS satellite image of a biomass burning event in Pender County,
NC, from June 23, 2011, with a star representing the sampling site and a circle around fire spots
representing the burn event.
In spring 2012, levoglucosan concentrations were elevated in 5 separate events. No
significant burn events occurred in the regions surrounding the study site, but because
levoglucosan is a compound capable of long-range transport (Simoneit, Elias et al. 2004;
Medeiros, Conte et al. 2006), it is possible that these concentrations were affected by burn events
in other regions and the levoglucosan remained in aerosol form until wet deposition removed the
carbohydrate in an event in Wilmington. The study of Medeiros et al. (2006) demonstrated long-
range transport from Quebec, Canada to the sampling site in Howland Experimental Forest,
Maine (~250 miles). No other significant burn events occurred in conjunction with a rain event
during the sampling period.

28
Potassium is possibly a useful indicator of biomass burning when combined with
levoglucosan concentrations, but does have other inputs to the environment through weathering,
so is not as strong of an indicator as levoglucosan. These two parameters can be used together to
indicate biomass burning (Medeiros, Conte et al. 2006; Urban, Lima-Souza et al. 2012). Rain
samples analyzed during the sampling period displayed a positive correlation (p < 0.05) with
levoglucosan concentration (Figure 27). In the absence of local burn events, potassium could
possibly be used in this study to confirm the increase in levoglucosan due to biomass burning
from other locations. The high number on the graph is Event 1133, which had a very distinct
season influence.
Figure 27. Levoglucosan concentration versus potassium concentration. (n = 37)
r2 = 0.6041

IMPLICATIONS
Wet Deposition as a Removal for Aerosols
Despite the number of studies done to determine the concentration of carbohydrates in aerosols,
no studies exist that examine the concentration of specific carbohydrates in rainwater. Wet
deposition is potentially an important removal mechanism for carbohydrates in aerosols (Table
7) (Simoneit, Elias et al. 2004; Jia, Bhat et al. 2010; Tominaga, Matsumoto et al. 2011; Wang,
Chen et al. 2011). The equation below was used to determine equivalent nanomolar
concentrations in rainwater from the given concentrations in the aerosol studies. In the equation,
h is the height of the air column. 1000 m is used for the height, and was chosen because it is the
greatest height at which air mass back trajectories were calculated for storms , and is likely to
contribute to wet deposition (Walker, Aneja et al. 2000). Aerosol concentrations are reported in
ng/m3. Glucose is the carbohydrate used to compare the concentrations because of its ubiquity in
aerosols and rainwater, and its molecular weight is 180.16 g/mol, used here to convert ng to
nmol. A scavenging factor of 10 is used in the assumption that there is 100% scavenging by rain
of all glucose in aerosol form.
((h)(ng/m3))/((180.16)(10))
Table 7. Summary of aerosol concentrations.
Study Converted Glucose Concentration Location of Study or Reported Values
Wang 27 nM China
Jia 28 – 38 nM (average of all
carbohydrates)
Texas
Tominaga 12 – 42 nM Japan
Simoneit 0.5 nM – 1.2 µM Chile, Malaysia, Japan, Belgium,
Brazil, China, USA
This
study
.17 – 809 nM Wilmington, NC, USA

30
Glucose concentrations in this study ranged from 0.17 – 809 nM. Since glucose concentrations
from aerosols studies in Table 7 ranged from 0.5 nM – 12 µM and this study is within that range,
it is reasonable to assume both that aerosols are an important source of carbohydrates to
rainwater, and wet deposition is a good removal mechanism of carbohydrates in aerosol. An
aerosol study of the region to compare to this study would be helpful in this assumption, because
the aerosol samples in these studies ranged over different months, conditions, and locales, and
therefore are not completely comparable to the concentrations in rainwater in Wilmington, NC.
Rainwater Carbohydrate Flux and Contribution to Surface Waters
Flux of rainwater carbohydrates to the surface water of Long Bay was calculated to
determine the influence of carbohydrates on the standing concentration. A flux of carbohydrates
from rain could be important due to their bioavailability and significance as a food source. The
volume weighted average of monosaccharides collected during the sample year (14 June 2011-13
June 2012) is 176.65 nM. Wilmington had an average rainfall over 10 years of 1.452 m, yielding
an annual monosaccharide flux of 256 µmol m-2
yr-1
. Long Bay is approximately 10,000 km2.
Using the surface area of Long Bay, the total monosaccharide flux is 2.56 x 10¹²
µmol yr-1
. The
volume weighted average of disaccharides for the sample year was 144.43 nM. Using the same
calculation, the flux of disaccharides to Long Bay is 2.09 x 10¹²
µmol yr-1
. Several studies have
been done on the composition of surface seawater, and those that examined monosaccharide
concentrations had values near 3 µM (Bhosle, Bhaskar et al. 1998; Witter and Luther 2002;
Engbrodt and Kattner 2005). Assuming that carbohydrates mix in the top 10 m of the water
column, the contribution of carbohydrates to surface water is about 0.0256 µM. On a yearly
basis, this is not a significant contribution to surface waters, but episodic contributions may be
more significant. In E1145 in spring 2012, total concentrations of carbohydrates were

31
approximately 13 µM. This concentration would cause a more significant effect on the biology
of the surface waters. In addition, carbohydrates in rain that have not been considered in one of
these surface water studies, such as arabitol, levoglucosan, pinitol, dulcitol, and trehalose, could
contribute more to surface water concentrations.

LITERATURE CITED
Aluwihare, L. I. and D. J. Repeta (1999). "A comparison of the chemical characteristics of
oceanic DOM and extracellular DOM produced by marine algae." Marine Ecology
Progress Series 186: 105-117.
Ashraf, M. and P. J. C. Harris (2004). "Potential biochemical indicators of salinity tolerance in
plants." Plant Science 166: 3-16.
Avery, G.B., R. J. Kieber, et al. (2006). "Rainwater monocarboxylic and dicarboxylic acid
concentrations in southeastern North Carolina, USA, as a function of air-mass back
trajectory." Atmospheric Environment 40: 1683-1693.
Avery, G. B., J. D. Willey, et al. (1991). "Formic and acetic acids in coastal North Carolina
rainwater." Environmental Science and Techonology 25(11): 1875-1880.
Bhosle, N. B., P. V. Bhaskar, et al. (1998). "Abundance of dissolved polysaccharides in the
oxygen minimum layer of the Northern Indian Ocean." Marine Chemistry 63: 171-182.
Brockmann, U. K., K. Eberlein, et al. (1979). "The Development of a Natural Plankton
Population in an Outdoor Tank with Nutrient-Poor Sea Water. II. Changes in Dissolved
Carbohydrates and Amino Acids." Marine Ecology Progress Series 1: 283-291.
Caseiro, A., I. L. Marr, et al. (2007). "Determination of saccharides in atmospheric aerosol using
anion-exchange high-performance liquid chromatography and pulsed-amperometric
detection." Journal of Chromatography 1171: 37-45.
Cowie, G. L. and J. I. Hedges (1984). "Carbohydrate sources in a coastal marine environment."
Geochemica et Cosmochemica 48: 2075-2087.
Dahlman, L., J. Persson, et al. (2003). "Carbon and nitrogen distribution in the green algal
lichens Hypogymnia physodes and Platismatia glauca in relation to nutrient supply."
Planta 217: 41-48.
Engbrodt, R. and G. Kattner (2005). "On the biogeochemistry of dissolved carbohydrates in the
Greenland Sea (Arctic)." Organic Geochemistry 36: 937-948.
Firon, N., R. Shaked, et al. (2006). "Pollen grains of heat tolerant tomato cultivars retain higher
carbohydrate concentration under heat stress conditions." Scientia Horticulturae 109:
212-217.
Fu, P., K. Kawamura, et al. (2011). "Molecular characterization of marine organic aerosols
collected during a round-the-world cruise." Journal of Geophysical Research 116.

33
Fu, P., K. Kawamura, et al. (2012). "Seasonal variations of sugars in atmospheric particulate
matter from Gosan, Jeju Island: Significant contributions of airborne pollen and Asian
dust in spring." Atmospheric Environment 55: 234-239.
Jia, Y., S. Bhat, et al. (2010). "Characterization of saccharides and other organic compounds in
fine particles and the use of saccharides to track primary biologically derived carbon
sources." Atmospheric Environment 44: 724-732.
Kieber, R. J., S. A. Skrabal, et al. (2004). "Redox speciation of copper in rainwater: Temporal
variability and atmospheric deposition." Environmental Science and Techonology 38:
3587-3594.
Kieber, R. J., J. D. Willey, et al. (2002). "Chromium speciation in rainwater: Temporal
variability and atmospheric deposition." Environmental Science and Techonology 36:
5321-5327.
Leithead, A., S.-M. Li, et al. (2005). "Levoglucosan and dehydroabietic acid: Evidence of
biomass burning impact on aerosols in the Lower Fraser Valley." Atmospheric
Environment 40: 2721-2734.
Ma, S. X., Z. Z. Wang, et al. (2009). "Composition and source of saccharides in aerosols in
Guangzhou, China." Chinese Science Bulletin 54: 4500-4506.
Mazzoleni, L. R., B. Zielinska, et al. (2007). "Emissions of levoglucosan, methoxy phenols, and
organic acids from prescribed burns, laboratory combustion of wildland fuels, and
residential wood combustion." Environmental Science and Techonology 41(7): 2115-
2122.
McNair, H. M. and J. M. Miller (1998). Basic Gas Chromatography. New York, Wiley.
Medeiros, P. M., M. H. Conte, et al. (2006). "Sugars as source indicators of biogenic organic
carbon in aerosols collected above the Howland Experimental Forest, Maine."
Atmospheric Environment 40: 1694-1705.
Mopper, K. (1973). Aspects of the biogeochemistry of carbohydrates in aquatic environments.
MIT –Woods Hole Oceanographic Institution Joint Program in Oceanography.
NCDC and NOAA (2009). Local climatological data: Annual summary with comparative data.
Wilmington, NC.
Shaked, R., K. Rosenfeld, et al. (2004). "The effect of low night temperatures on carbohydrates
metabolism in developing pollen grains of pepper in relation to their number and
fuctioning." Scientia Horticulturae 102: 29-36.

34
Simoneit, B. R. T., V. O. Elias, et al. (2004). "Sugars-Dominant water-soluble organic
compounds in soils and characterization as tracers in atmospheric particulate matter."
Environmental Science and Techonology 38(22): 5939-5949.
Snider, J. L., D. M. Oosterhuis, et al. (2011). "High temperature limits in vivo pollen tube growth
rates by altering diurnal carbohydrate balance in field-grown Gossypium hirsutum
pistils." Journal of Plant Physiology 168(11): 1168-1175.
Tominaga, S., K. Matsumoto, et al. (2011). "Measurements of particulate sugars at urban and
forested sites." Atmospheric Environment 45: 2335-2339.
Urban, R. C., M. Lima-Souza, et al. (2012). Use of levoglucosan, potassium, and water-soluble
organic carbon to characterize the origins of biomass burning aerosols. Atmospheric
Environment.
Walker, J. T., V. P. Aneja, et al. (2000). "Atmospheric transport and wet deposition of
ammonium in North Carolina." Atmospheric Environment 34: 3407-3418.
Wang, G., C. Chen, et al. (2011). "Molecular composition and size distribution of sugars, sugar
alcohols and carboxylic acids in airborne particles during a severe urban haze event
caused by wheat straw burning." Atmospheric Environment 45: 2473-2479.
Willey, J. D., D. A. Glinski, et al. (2011). "Decadal variations of rainwater formic acid and acetic
acid concentrations in Wilmington, NC, USA." Atmospheric Environment 45: 1010-
1014.
Willey, J. D., R. J. Kieber, et al. (2000). "Rainwater dissolved organic carbon: Concentrations
and global flux." Global Biogeochemical Cycles 14(1): 139-148.
Willey, J. D., R. J. Kieber, et al. (2006). "Changing Chemical Composition of Precipitation in
Wilmington, North Carolina, U.S.A.: Implications for the Continental U.S.A."
Environmental Science and Techonology 40(18): 5675-5680.
Witter, A. E. and G. W. Luther (2002). "Spectrophotometric measurement of seawater
carbohydrate concentrations in neritic and oceanic waters from the U.S. Middle Atlantic
Bight and the Deleware Estuary." Marine Chemistry 77: 143-156.
Yuan-xun, Z., S. Min, et al. (2006). "Source profiles on particulate matters emitted from cereal
straw burnings." Journal of Environmental Sciences 19: 167-175.
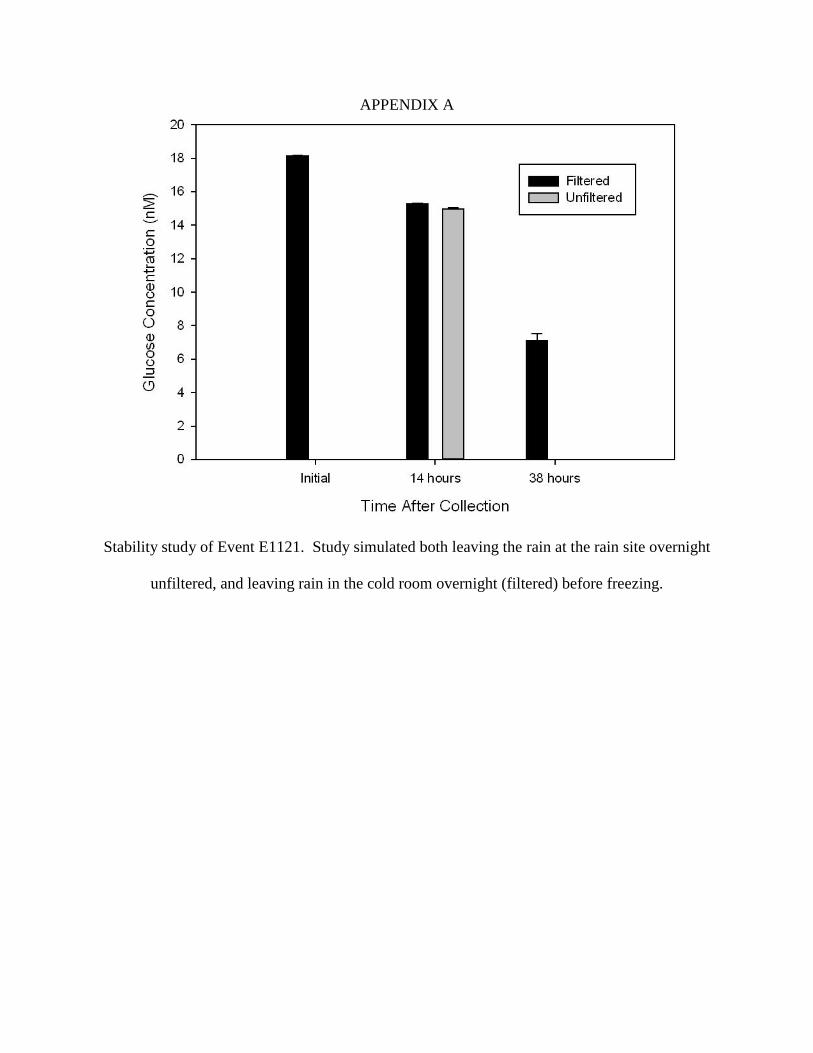
APPENDIX A
Stability study of Event E1121. Study simulated both leaving the rain at the rain site overnight
unfiltered, and leaving rain in the cold room overnight (filtered) before freezing.

36
APPENDIX B
A study was done to determine the stability of derivatized compounds. Stability was assumed to
be 24 hours, but was found to be closer to 16 hours because of the changing chromatogram of
glucose. The increase in “inside peaks” is shown below, with a representation of a glucose
chromatogram with inside peaks (circled), showing probable compromised derivatization,
meaning that glucose may be only partially derivatized.
37
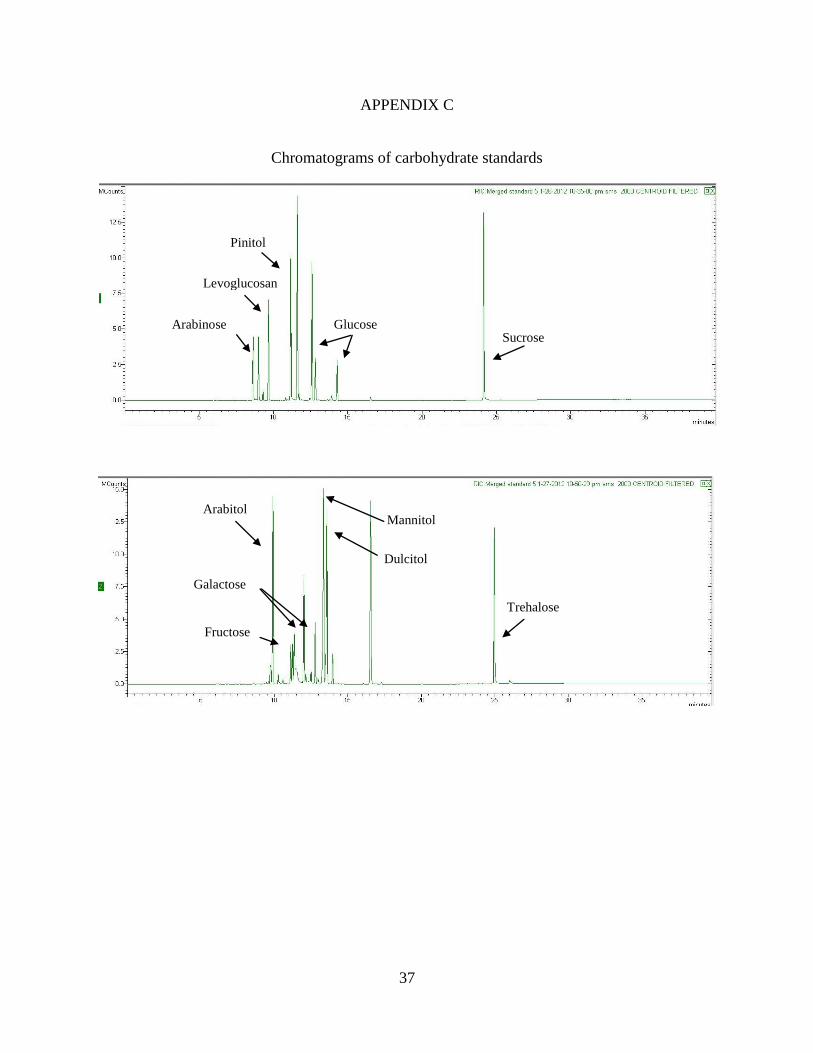
APPENDIX C
Chromatograms of carbohydrate standards
Arabinose
Levoglucosan
Arabitol
Fructose
Glucose
Galactose
Dulcitol
Trehalose
Sucrose
Pinitol
Mannitol

38
APPENDIX D
Pyridine was added to the derivatization process to act as a proton acceptor and increase the peak
area of standards and samples (Pietrogrande & Bacco, 2011)

39
APPENDIX E
Table of retention times of carbohydrates
Carbohydrate Retention Time (min)
Arabinose 8.98
Levoglucosan 9.65
Arabitol 9.90
Fructose 11.11,11.23,11.35
Pinitol 11.58
Glucose 12.57,14.28
Galactose 12.00,12.78
Mannitol 13.33
Dulcitol 13.56
Sucrose 24.16
Trehalose 24.96
40
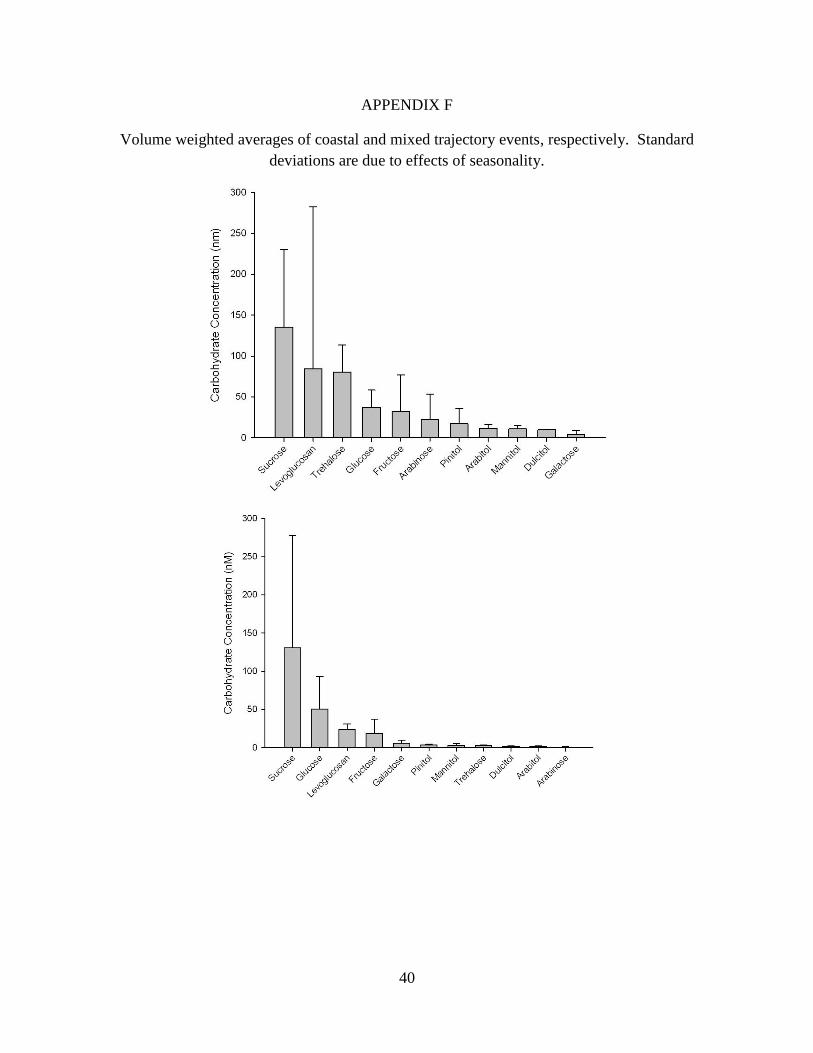
APPENDIX F
Volume weighted averages of coastal and mixed trajectory events, respectively. Standard
deviations are due to effects of seasonality.
Related Documents