Capturing Performance Knowledge for Automated Analysis Kevin A. Huck * , Oscar Hernandez † , Van Bui † , Sunita Chandrasekaran ‡ , Barbara Chapman † , Allen D. Malony * , Lois Curfman McInnes § and Boyana Norris § * Computer and Information Science Department, University of Oregon Eugene, OR 97403-1202 Email: khuck,[email protected] † Department of Computer Science, University of Houston Houston, TX 77204-3010 Email: oscar, [email protected], [email protected] ‡ Centre for High Performance Embedded Systems, Nanyang Technological University Singapore, 637553 Email: [email protected] § Mathematics and Computer Science Division, Argonne National Laboratory Argonne, IL 60439 Email: curfman,[email protected] Abstract—Automating the process of parallel performance experimentation, analysis, and problem diagnosis can enhance environments for performance-directed application development, compilation, and execution. This is especially true when paramet- ric studies, modeling, and optimization strategies require large amounts of data to be collected and processed for knowledge synthesis and reuse. This paper describes the integration of the PerfExplorer performance data mining framework with the OpenUH compiler infrastructure. OpenUH provides auto- instrumentation of source code for performance experimentation and PerfExplorer provides automated and reusable analysis of the performance data through a scripting interface. More importantly, PerfExplorer inference rules have been developed to recognize and diagnose performance characteristics important for optimization strategies and modeling. Three case studies are presented which show our success with automation in OpenMP and MPI code tuning, parametric characterization, and power modeling. The paper discusses how the integration supports performance knowledge engineering across applications and feedback-based compiler optimization in general. I. I NTRODUCTION Accurate parallel performance analysis is a complicated and intimidating task for even an experienced performance analyst. On the one hand, the management of multi-experiment performance data from parametric studies and the applica- tion of multi-step processes involving various statistical, data mining, and meta-analysis operations can introduce errors if done manually. On the other, lack of support for analysis automation translates ultimately to the loss of knowledge, earned through experience, about successful performance en- gineering practices – what analysis methods are useful for what performance problems, how performance models are obtained and validated, and how to interpret performance results relative to opportunities for optimization. Advancement in parallel performance problem solving and its integration in optimization frameworks will depend on creating analysis workflows and capturing expert rules for automated use. Effective performance analysis automation requires perfor- mance tools which support data management, process script- ing, and knowledge engineering, as well as their integration with parallel program development environments. While the “heavy lifting” analysis will occur in the performance system, it is the ability to encode general expertise and case-specific methods that allows development tools to direct analysis strategies to problem solving needs. There are two key re- search challenges. The first is in designing flexible analysis components and usable interfaces for their integration. The second is in engaging the parallel programming and tuning environments to use the knowledge-based analysis automation capabilities. This paper describes the integration of the PerfExplorer [9] performance data mining system with the OpenUH [13] compiler infrastructure. The union provides OpenUH auto- instrumentation of source code for performance experimenta- tion and automated analysis of the performance results using PerfExplorer scripts. More importantly, PerfExplorer inference rules are developed to recognize and diagnose performance characteristics important for OpenUH modeling and optimiza- tion strategies. To demonstrate the benefits of automating analysis meth- ods, two case studies are presented on OpenMP and MPI code tuning, one targeting load balance problems (a multiple sequence alignment application) and another targeting data locality problems (a fluid dynamics application). In both, the goal is to capture the optimization process and insight gained by the manual tuning of these applications in the form of PerfExplorer analysis scripts and inference rules. The approach is validated by comparing the optimized code to the unoptimized. A third case study is reported for the fluid dynamics application, but in the context of power modeling. Here PerfExplorer scripts and inference rules demonstrate how optimizing various functions affects the power consumption in the hardware. This paper is organized as follows. Section I gives an introduction to our automation framework. Section II provides a brief introduction to the tools and gives a description on their integration in this project. Section III illustrates the example problems and corresponding graphs and results. Related work

Welcome message from author
This document is posted to help you gain knowledge. Please leave a comment to let me know what you think about it! Share it to your friends and learn new things together.
Transcript
Capturing Performance Knowledgefor Automated Analysis
Kevin A. Huck∗, Oscar Hernandez†, Van Bui†, Sunita Chandrasekaran‡,Barbara Chapman†, Allen D. Malony∗, Lois Curfman McInnes§ and Boyana Norris§
∗Computer and Information Science Department, University of OregonEugene, OR 97403-1202 Email: khuck,[email protected]†Department of Computer Science, University of Houston
Houston, TX 77204-3010 Email: oscar, [email protected], [email protected]‡Centre for High Performance Embedded Systems, Nanyang Technological University
Singapore, 637553 Email: [email protected]§Mathematics and Computer Science Division, Argonne National Laboratory
Argonne, IL 60439 Email: curfman,[email protected]
Abstract—Automating the process of parallel performanceexperimentation, analysis, and problem diagnosis can enhanceenvironments for performance-directed application development,compilation, and execution. This is especially true when paramet-ric studies, modeling, and optimization strategies require largeamounts of data to be collected and processed for knowledgesynthesis and reuse. This paper describes the integration ofthe PerfExplorer performance data mining framework withthe OpenUH compiler infrastructure. OpenUH provides auto-instrumentation of source code for performance experimentationand PerfExplorer provides automated and reusable analysisof the performance data through a scripting interface. Moreimportantly, PerfExplorer inference rules have been developedto recognize and diagnose performance characteristics importantfor optimization strategies and modeling. Three case studiesare presented which show our success with automation inOpenMP and MPI code tuning, parametric characterization,and power modeling. The paper discusses how the integrationsupports performance knowledge engineering across applicationsand feedback-based compiler optimization in general.
I. INTRODUCTION
Accurate parallel performance analysis is a complicatedand intimidating task for even an experienced performanceanalyst. On the one hand, the management of multi-experimentperformance data from parametric studies and the applica-tion of multi-step processes involving various statistical, datamining, and meta-analysis operations can introduce errors ifdone manually. On the other, lack of support for analysisautomation translates ultimately to the loss of knowledge,earned through experience, about successful performance en-gineering practices – what analysis methods are useful forwhat performance problems, how performance models areobtained and validated, and how to interpret performanceresults relative to opportunities for optimization. Advancementin parallel performance problem solving and its integrationin optimization frameworks will depend on creating analysisworkflows and capturing expert rules for automated use.
Effective performance analysis automation requires perfor-mance tools which support data management, process script-ing, and knowledge engineering, as well as their integration
with parallel program development environments. While the“heavy lifting” analysis will occur in the performance system,it is the ability to encode general expertise and case-specificmethods that allows development tools to direct analysisstrategies to problem solving needs. There are two key re-search challenges. The first is in designing flexible analysiscomponents and usable interfaces for their integration. Thesecond is in engaging the parallel programming and tuningenvironments to use the knowledge-based analysis automationcapabilities.
This paper describes the integration of the PerfExplorer [9]performance data mining system with the OpenUH [13]compiler infrastructure. The union provides OpenUH auto-instrumentation of source code for performance experimenta-tion and automated analysis of the performance results usingPerfExplorer scripts. More importantly, PerfExplorer inferencerules are developed to recognize and diagnose performancecharacteristics important for OpenUH modeling and optimiza-tion strategies.
To demonstrate the benefits of automating analysis meth-ods, two case studies are presented on OpenMP and MPIcode tuning, one targeting load balance problems (a multiplesequence alignment application) and another targeting datalocality problems (a fluid dynamics application). In both,the goal is to capture the optimization process and insightgained by the manual tuning of these applications in theform of PerfExplorer analysis scripts and inference rules. Theapproach is validated by comparing the optimized code tothe unoptimized. A third case study is reported for the fluiddynamics application, but in the context of power modeling.Here PerfExplorer scripts and inference rules demonstrate howoptimizing various functions affects the power consumption inthe hardware.
This paper is organized as follows. Section I gives anintroduction to our automation framework. Section II providesa brief introduction to the tools and gives a description on theirintegration in this project. Section III illustrates the exampleproblems and corresponding graphs and results. Related work
# create a rulebase for processingruleHarness = RuleHarness.useGlobalRules(
"openuh/OpenUHRules.drl")# load a trialtrial = TrialMeanResult(Utilities.getTrial(
"Fluid Dynamic", "rib 45", "1_8"))# calculate the derived metricstalls = "BACK_END_BUBBLE_ALL"cycles = "CPU_CYCLES"operator = DeriveMetricOperation(trial, stalls,
cycles, DeriveMetricOperation.DIVIDE)derived = operator.processData().get(0)# compare values to average for applicationfor event in derived.getEvents():
MeanEventFact.compareEventToMain(derived,mainEvent, derived, event)
# process the rulesruleHarness.processRules()
Fig. 1. Sample Jython script.
is discussed in Section IV. The paper concludes with a discus-sion on how the integration supports performance knowledgeengineering across applications and feedback-based compileroptimization in general.
II. DESIGN
In this section, we briefly overview the design of Perf-Explorer 2.0 and the OpenUH compiler infrastructure, anddescribe our approach to their integration.
A. PerfExplorer 2.0
Instrumentation and measurement tools such as TAU [18]can collect very detailed performance data from parallelapplications. The potential sizes of datasets and the needto assimilate results from multiple experiments makes it achallenge to both process the information and discover and un-derstand new insights about performance. In order to performanalysis on collections of TAU performance experiment data,we developed PerfExplorer, a framework for parallel perfor-mance data mining and knowledge discovery. The frameworkarchitecture enables the development and integration of datamining operations that can be applied to parallel performanceprofiles. PerfExplorer is built on PerfDMF, a data managementframework which provides a library to access the parallelprofiles and save analysis results in a relational database.PerfDMF includes support for nearly a dozen performanceprofile formats, including TAU. PerfExplorer is integrated withexisting data mining toolkits, and allows for extensions usingthose toolkits.
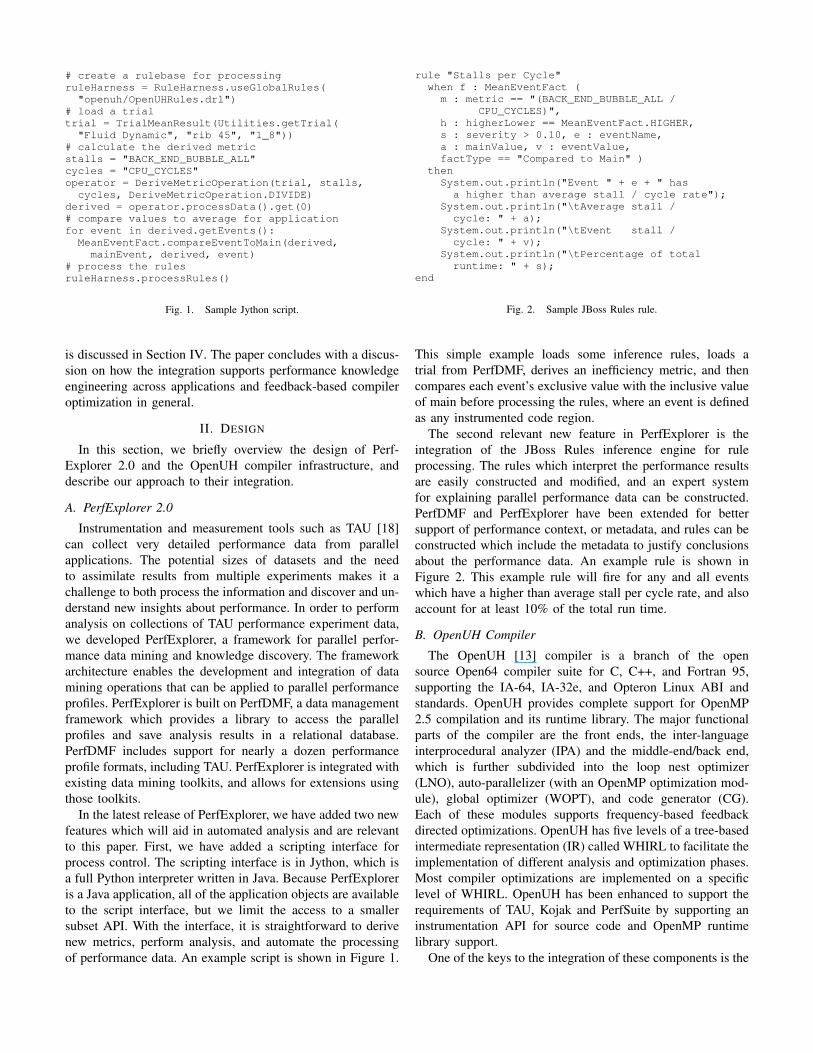
In the latest release of PerfExplorer, we have added two newfeatures which will aid in automated analysis and are relevantto this paper. First, we have added a scripting interface forprocess control. The scripting interface is in Jython, which isa full Python interpreter written in Java. Because PerfExploreris a Java application, all of the application objects are availableto the script interface, but we limit the access to a smallersubset API. With the interface, it is straightforward to derivenew metrics, perform analysis, and automate the processingof performance data. An example script is shown in Figure 1.
rule "Stalls per Cycle"when f : MeanEventFact (m : metric == "(BACK_END_BUBBLE_ALL /
CPU_CYCLES)",h : higherLower == MeanEventFact.HIGHER,s : severity > 0.10, e : eventName,a : mainValue, v : eventValue,factType == "Compared to Main" )
thenSystem.out.println("Event " + e + " has
a higher than average stall / cycle rate");System.out.println("\tAverage stall /
cycle: " + a);System.out.println("\tEvent stall /
cycle: " + v);System.out.println("\tPercentage of total
runtime: " + s);end
Fig. 2. Sample JBoss Rules rule.
This simple example loads some inference rules, loads atrial from PerfDMF, derives an inefficiency metric, and thencompares each event’s exclusive value with the inclusive valueof main before processing the rules, where an event is definedas any instrumented code region.
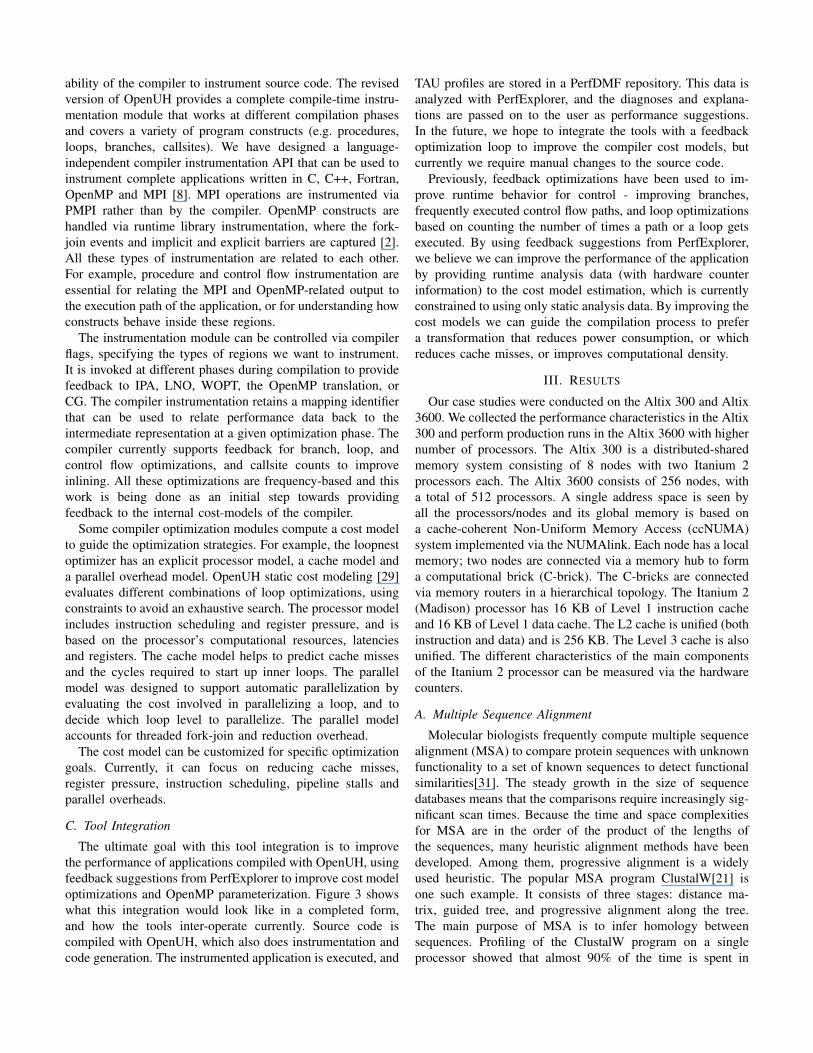
The second relevant new feature in PerfExplorer is theintegration of the JBoss Rules inference engine for ruleprocessing. The rules which interpret the performance resultsare easily constructed and modified, and an expert systemfor explaining parallel performance data can be constructed.PerfDMF and PerfExplorer have been extended for bettersupport of performance context, or metadata, and rules can beconstructed which include the metadata to justify conclusionsabout the performance data. An example rule is shown inFigure 2. This example rule will fire for any and all eventswhich have a higher than average stall per cycle rate, and alsoaccount for at least 10% of the total run time.
B. OpenUH Compiler
The OpenUH [13] compiler is a branch of the opensource Open64 compiler suite for C, C++, and Fortran 95,supporting the IA-64, IA-32e, and Opteron Linux ABI andstandards. OpenUH provides complete support for OpenMP2.5 compilation and its runtime library. The major functionalparts of the compiler are the front ends, the inter-languageinterprocedural analyzer (IPA) and the middle-end/back end,which is further subdivided into the loop nest optimizer(LNO), auto-parallelizer (with an OpenMP optimization mod-ule), global optimizer (WOPT), and code generator (CG).Each of these modules supports frequency-based feedbackdirected optimizations. OpenUH has five levels of a tree-basedintermediate representation (IR) called WHIRL to facilitate theimplementation of different analysis and optimization phases.Most compiler optimizations are implemented on a specificlevel of WHIRL. OpenUH has been enhanced to support therequirements of TAU, Kojak and PerfSuite by supporting aninstrumentation API for source code and OpenMP runtimelibrary support.
One of the keys to the integration of these components is the
ability of the compiler to instrument source code. The revisedversion of OpenUH provides a complete compile-time instru-mentation module that works at different compilation phasesand covers a variety of program constructs (e.g. procedures,loops, branches, callsites). We have designed a language-independent compiler instrumentation API that can be used toinstrument complete applications written in C, C++, Fortran,OpenMP and MPI [8]. MPI operations are instrumented viaPMPI rather than by the compiler. OpenMP constructs arehandled via runtime library instrumentation, where the fork-join events and implicit and explicit barriers are captured [2].All these types of instrumentation are related to each other.For example, procedure and control flow instrumentation areessential for relating the MPI and OpenMP-related output tothe execution path of the application, or for understanding howconstructs behave inside these regions.
The instrumentation module can be controlled via compilerflags, specifying the types of regions we want to instrument.It is invoked at different phases during compilation to providefeedback to IPA, LNO, WOPT, the OpenMP translation, orCG. The compiler instrumentation retains a mapping identifierthat can be used to relate performance data back to theintermediate representation at a given optimization phase. Thecompiler currently supports feedback for branch, loop, andcontrol flow optimizations, and callsite counts to improveinlining. All these optimizations are frequency-based and thiswork is being done as an initial step towards providingfeedback to the internal cost-models of the compiler.
Some compiler optimization modules compute a cost modelto guide the optimization strategies. For example, the loopnestoptimizer has an explicit processor model, a cache model anda parallel overhead model. OpenUH static cost modeling [29]evaluates different combinations of loop optimizations, usingconstraints to avoid an exhaustive search. The processor modelincludes instruction scheduling and register pressure, and isbased on the processor’s computational resources, latenciesand registers. The cache model helps to predict cache missesand the cycles required to start up inner loops. The parallelmodel was designed to support automatic parallelization byevaluating the cost involved in parallelizing a loop, and todecide which loop level to parallelize. The parallel modelaccounts for threaded fork-join and reduction overhead.
The cost model can be customized for specific optimizationgoals. Currently, it can focus on reducing cache misses,register pressure, instruction scheduling, pipeline stalls andparallel overheads.
C. Tool Integration
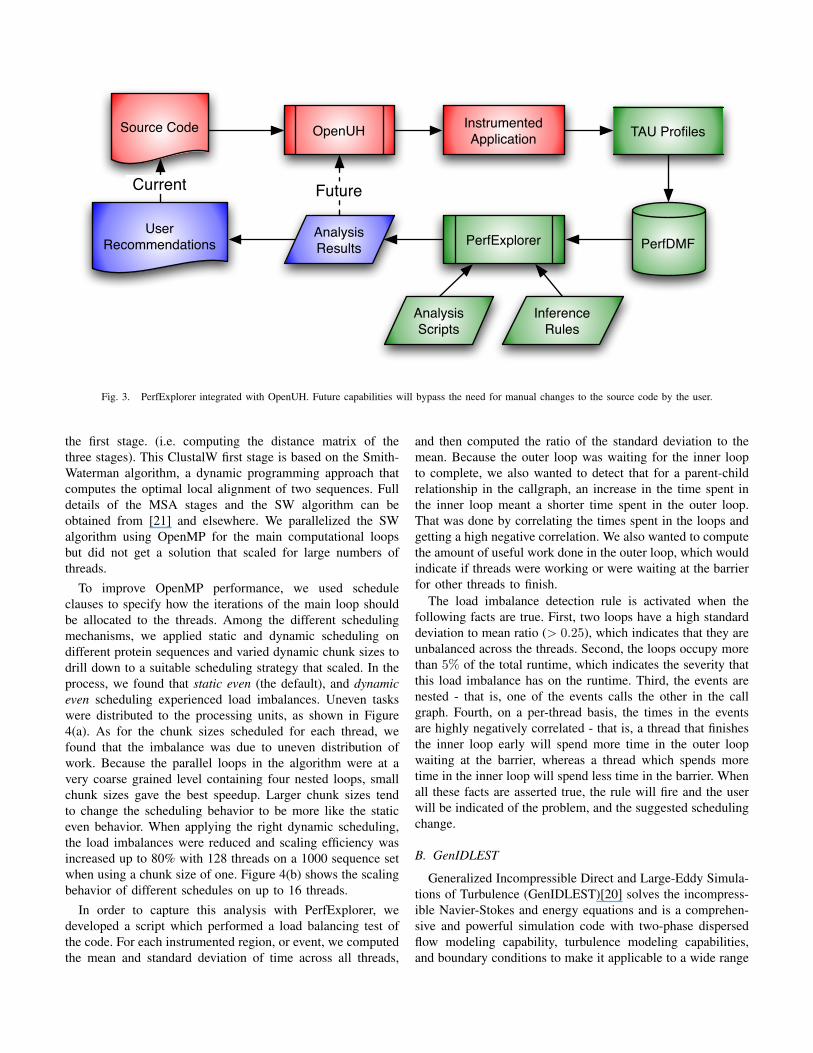
The ultimate goal with this tool integration is to improvethe performance of applications compiled with OpenUH, usingfeedback suggestions from PerfExplorer to improve cost modeloptimizations and OpenMP parameterization. Figure 3 showswhat this integration would look like in a completed form,and how the tools inter-operate currently. Source code iscompiled with OpenUH, which also does instrumentation andcode generation. The instrumented application is executed, and
TAU profiles are stored in a PerfDMF repository. This data isanalyzed with PerfExplorer, and the diagnoses and explana-tions are passed on to the user as performance suggestions.In the future, we hope to integrate the tools with a feedbackoptimization loop to improve the compiler cost models, butcurrently we require manual changes to the source code.
Previously, feedback optimizations have been used to im-prove runtime behavior for control - improving branches,frequently executed control flow paths, and loop optimizationsbased on counting the number of times a path or a loop getsexecuted. By using feedback suggestions from PerfExplorer,we believe we can improve the performance of the applicationby providing runtime analysis data (with hardware counterinformation) to the cost model estimation, which is currentlyconstrained to using only static analysis data. By improving thecost models we can guide the compilation process to prefera transformation that reduces power consumption, or whichreduces cache misses, or improves computational density.
III. RESULTS
Our case studies were conducted on the Altix 300 and Altix3600. We collected the performance characteristics in the Altix300 and perform production runs in the Altix 3600 with highernumber of processors. The Altix 300 is a distributed-sharedmemory system consisting of 8 nodes with two Itanium 2processors each. The Altix 3600 consists of 256 nodes, witha total of 512 processors. A single address space is seen byall the processors/nodes and its global memory is based ona cache-coherent Non-Uniform Memory Access (ccNUMA)system implemented via the NUMAlink. Each node has a localmemory; two nodes are connected via a memory hub to forma computational brick (C-brick). The C-bricks are connectedvia memory routers in a hierarchical topology. The Itanium 2(Madison) processor has 16 KB of Level 1 instruction cacheand 16 KB of Level 1 data cache. The L2 cache is unified (bothinstruction and data) and is 256 KB. The Level 3 cache is alsounified. The different characteristics of the main componentsof the Itanium 2 processor can be measured via the hardwarecounters.
A. Multiple Sequence Alignment
Molecular biologists frequently compute multiple sequencealignment (MSA) to compare protein sequences with unknownfunctionality to a set of known sequences to detect functionalsimilarities[31]. The steady growth in the size of sequencedatabases means that the comparisons require increasingly sig-nificant scan times. Because the time and space complexitiesfor MSA are in the order of the product of the lengths ofthe sequences, many heuristic alignment methods have beendeveloped. Among them, progressive alignment is a widelyused heuristic. The popular MSA program ClustalW[21] isone such example. It consists of three stages: distance ma-trix, guided tree, and progressive alignment along the tree.The main purpose of MSA is to infer homology betweensequences. Profiling of the ClustalW program on a singleprocessor showed that almost 90% of the time is spent in
Source Code Instrumented Application
PerfDMF
TAU ProfilesOpenUH
PerfExplorer
Inference Rules
Analysis Scripts
Analysis Results
Future
User Recommendations
Current
Fig. 3. PerfExplorer integrated with OpenUH. Future capabilities will bypass the need for manual changes to the source code by the user.
the first stage. (i.e. computing the distance matrix of thethree stages). This ClustalW first stage is based on the Smith-Waterman algorithm, a dynamic programming approach thatcomputes the optimal local alignment of two sequences. Fulldetails of the MSA stages and the SW algorithm can beobtained from [21] and elsewhere. We parallelized the SWalgorithm using OpenMP for the main computational loopsbut did not get a solution that scaled for large numbers ofthreads.
To improve OpenMP performance, we used scheduleclauses to specify how the iterations of the main loop shouldbe allocated to the threads. Among the different schedulingmechanisms, we applied static and dynamic scheduling ondifferent protein sequences and varied dynamic chunk sizes todrill down to a suitable scheduling strategy that scaled. In theprocess, we found that static even (the default), and dynamiceven scheduling experienced load imbalances. Uneven taskswere distributed to the processing units, as shown in Figure4(a). As for the chunk sizes scheduled for each thread, wefound that the imbalance was due to uneven distribution ofwork. Because the parallel loops in the algorithm were at avery coarse grained level containing four nested loops, smallchunk sizes gave the best speedup. Larger chunk sizes tendto change the scheduling behavior to be more like the staticeven behavior. When applying the right dynamic scheduling,the load imbalances were reduced and scaling efficiency wasincreased up to 80% with 128 threads on a 1000 sequence setwhen using a chunk size of one. Figure 4(b) shows the scalingbehavior of different schedules on up to 16 threads.
In order to capture this analysis with PerfExplorer, wedeveloped a script which performed a load balancing test ofthe code. For each instrumented region, or event, we computedthe mean and standard deviation of time across all threads,
and then computed the ratio of the standard deviation to themean. Because the outer loop was waiting for the inner loopto complete, we also wanted to detect that for a parent-childrelationship in the callgraph, an increase in the time spent inthe inner loop meant a shorter time spent in the outer loop.That was done by correlating the times spent in the loops andgetting a high negative correlation. We also wanted to computethe amount of useful work done in the outer loop, which wouldindicate if threads were working or were waiting at the barrierfor other threads to finish.
The load imbalance detection rule is activated when thefollowing facts are true. First, two loops have a high standarddeviation to mean ratio (> 0.25), which indicates that they areunbalanced across the threads. Second, the loops occupy morethan 5% of the total runtime, which indicates the severity thatthis load imbalance has on the runtime. Third, the events arenested - that is, one of the events calls the other in the callgraph. Fourth, on a per-thread basis, the times in the eventsare highly negatively correlated - that is, a thread that finishesthe inner loop early will spend more time in the outer loopwaiting at the barrier, whereas a thread which spends moretime in the inner loop will spend less time in the barrier. Whenall these facts are asserted true, the rule will fire and the userwill be indicated of the problem, and the suggested schedulingchange.
B. GenIDLEST
Generalized Incompressible Direct and Large-Eddy Simula-tions of Turbulence (GenIDLEST)[20] solves the incompress-ible Navier-Stokes and energy equations and is a comprehen-sive and powerful simulation code with two-phase dispersedflow modeling capability, turbulence modeling capabilities,and boundary conditions to make it applicable to a wide range
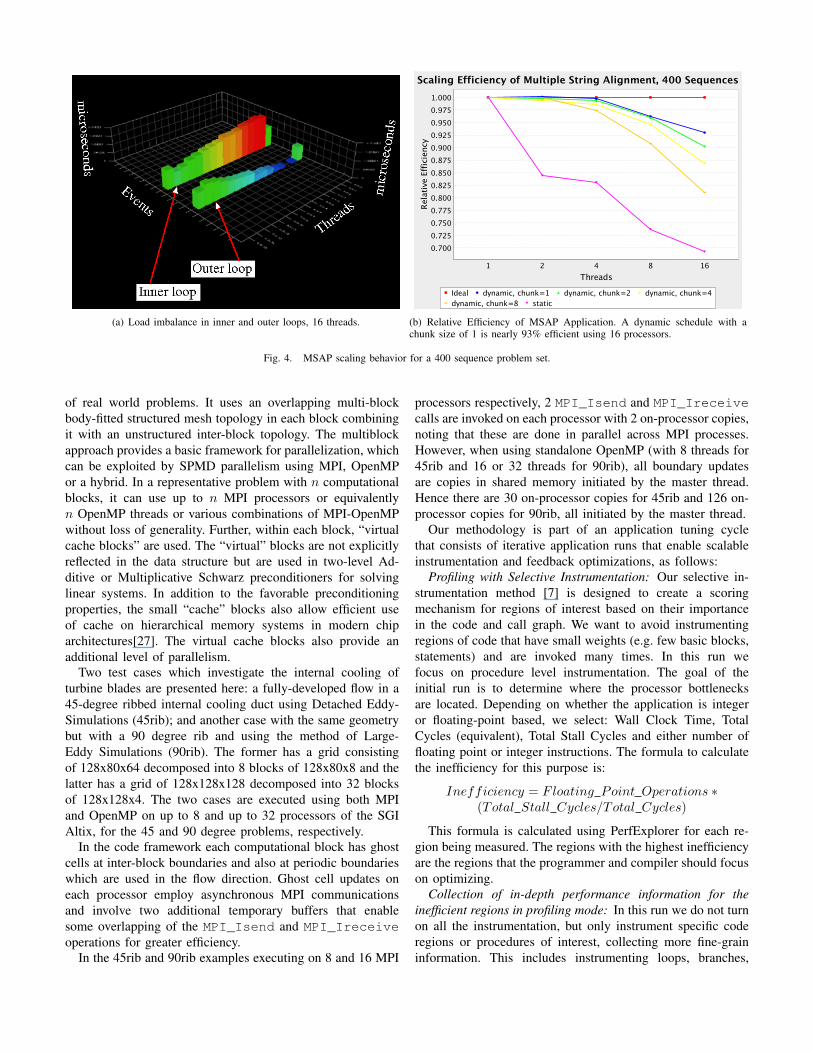
(a) Load imbalance in inner and outer loops, 16 threads. (b) Relative Efficiency of MSAP Application. A dynamic schedule with achunk size of 1 is nearly 93% efficient using 16 processors.
Fig. 4. MSAP scaling behavior for a 400 sequence problem set.
of real world problems. It uses an overlapping multi-blockbody-fitted structured mesh topology in each block combiningit with an unstructured inter-block topology. The multiblockapproach provides a basic framework for parallelization, whichcan be exploited by SPMD parallelism using MPI, OpenMPor a hybrid. In a representative problem with n computationalblocks, it can use up to n MPI processors or equivalentlyn OpenMP threads or various combinations of MPI-OpenMPwithout loss of generality. Further, within each block, “virtualcache blocks” are used. The “virtual” blocks are not explicitlyreflected in the data structure but are used in two-level Ad-ditive or Multiplicative Schwarz preconditioners for solvinglinear systems. In addition to the favorable preconditioningproperties, the small “cache” blocks also allow efficient useof cache on hierarchical memory systems in modern chiparchitectures[27]. The virtual cache blocks also provide anadditional level of parallelism.
Two test cases which investigate the internal cooling ofturbine blades are presented here: a fully-developed flow in a45-degree ribbed internal cooling duct using Detached Eddy-Simulations (45rib); and another case with the same geometrybut with a 90 degree rib and using the method of Large-Eddy Simulations (90rib). The former has a grid consistingof 128x80x64 decomposed into 8 blocks of 128x80x8 and thelatter has a grid of 128x128x128 decomposed into 32 blocksof 128x128x4. The two cases are executed using both MPIand OpenMP on up to 8 and up to 32 processors of the SGIAltix, for the 45 and 90 degree problems, respectively.
In the code framework each computational block has ghostcells at inter-block boundaries and also at periodic boundarieswhich are used in the flow direction. Ghost cell updates oneach processor employ asynchronous MPI communicationsand involve two additional temporary buffers that enablesome overlapping of the MPI_Isend and MPI_Ireceiveoperations for greater efficiency.
In the 45rib and 90rib examples executing on 8 and 16 MPI
processors respectively, 2 MPI_Isend and MPI_Ireceivecalls are invoked on each processor with 2 on-processor copies,noting that these are done in parallel across MPI processes.However, when using standalone OpenMP (with 8 threads for45rib and 16 or 32 threads for 90rib), all boundary updatesare copies in shared memory initiated by the master thread.Hence there are 30 on-processor copies for 45rib and 126 on-processor copies for 90rib, all initiated by the master thread.
Our methodology is part of an application tuning cyclethat consists of iterative application runs that enable scalableinstrumentation and feedback optimizations, as follows:
Profiling with Selective Instrumentation: Our selective in-strumentation method [7] is designed to create a scoringmechanism for regions of interest based on their importancein the code and call graph. We want to avoid instrumentingregions of code that have small weights (e.g. few basic blocks,statements) and are invoked many times. In this run wefocus on procedure level instrumentation. The goal of theinitial run is to determine where the processor bottlenecksare located. Depending on whether the application is integeror floating-point based, we select: Wall Clock Time, TotalCycles (equivalent), Total Stall Cycles and either number offloating point or integer instructions. The formula to calculatethe inefficiency for this purpose is:
Inefficiency = Floating Point Operations ∗(Total Stall Cycles/Total Cycles)
This formula is calculated using PerfExplorer for each re-gion being measured. The regions with the highest inefficiencyare the regions that the programmer and compiler should focuson optimizing.
Collection of in-depth performance information for theinefficient regions in profiling mode: In this run we do not turnon all the instrumentation, but only instrument specific coderegions or procedures of interest, collecting more fine-graininformation. This includes instrumenting loops, branches,
calls, and possibly individual statements. During this run wecollect hardware counters to perform the processor bottleneckanalysis. The general formula we have adopted for this purposeis the following based on Jarp [10]:
Total Stall Cycles = L1D Cache Misses +Branch Misprediction + Instruction Misses +StackEngine stalls + Floating Point Stalls +
Pipeline Inter Register Dependencies +Processor Frontend F lushes
We primarily collect performance data for stall cycles from theL1D Cache Misses and Floating Point Stalls (on the Itanium,the floating-point registers are fed directly from level 2 cache).If 90% of the stalls are due to these two causes, we ignoreother sources of stalls in the formula. If that is not the case,we will have to perform additional runs to calculate the othercomponents of the formula. The 90% is a general guidelinebased on behavior seen in different applications.
Memory Analysis Metrics: In the same way as the secondrun, we use hardware counters to perform the memory bottle-neck analysis based on the following formula:
Memory Stalls = (L2 data references L2 all −L2 misses) ∗ L2 Memory Latency + (L2 misses−L3 missed) ∗ L3 Memory Latency + (L3 misses−
Number of remote memory accesses) ∗Local Memory Latency +
(Number of remote memory accesses) ∗Remote memory access latency + TLB misses ∗
TLB miss penalty
Remote Memory Accesses Ratio =Number of remote memory accesses/L3 misses
The coefficients in this formula are the different latencies(in cycles) for the different levels of memory for the Itanium 2processor (Madison), and the interconnection latencies of theSGI NumaLINK 4 for local and remote memory accesses. Thevalue for remote memory latency accesses is an estimation ofthe worst-case scenario for a pair of nodes with the maximumnumber of hops and is system dependent.
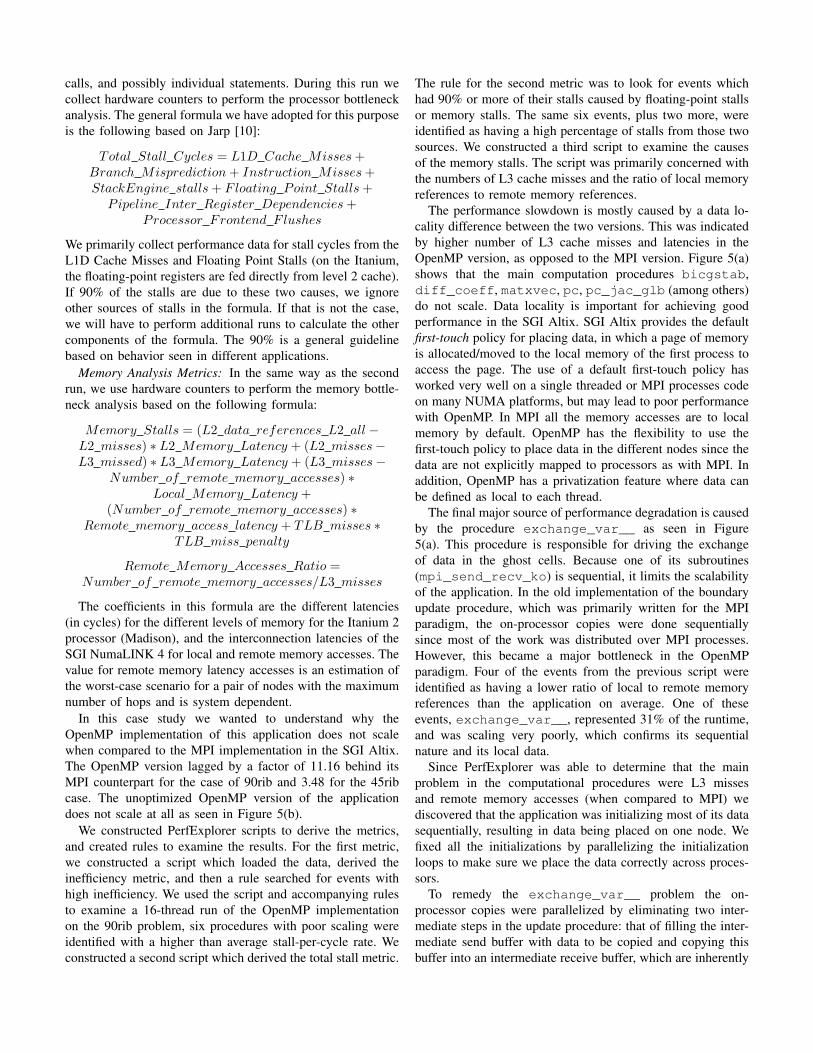
In this case study we wanted to understand why theOpenMP implementation of this application does not scalewhen compared to the MPI implementation in the SGI Altix.The OpenMP version lagged by a factor of 11.16 behind itsMPI counterpart for the case of 90rib and 3.48 for the 45ribcase. The unoptimized OpenMP version of the applicationdoes not scale at all as seen in Figure 5(b).
We constructed PerfExplorer scripts to derive the metrics,and created rules to examine the results. For the first metric,we constructed a script which loaded the data, derived theinefficiency metric, and then a rule searched for events withhigh inefficiency. We used the script and accompanying rulesto examine a 16-thread run of the OpenMP implementationon the 90rib problem, six procedures with poor scaling wereidentified with a higher than average stall-per-cycle rate. Weconstructed a second script which derived the total stall metric.
The rule for the second metric was to look for events whichhad 90% or more of their stalls caused by floating-point stallsor memory stalls. The same six events, plus two more, wereidentified as having a high percentage of stalls from those twosources. We constructed a third script to examine the causesof the memory stalls. The script was primarily concerned withthe numbers of L3 cache misses and the ratio of local memoryreferences to remote memory references.
The performance slowdown is mostly caused by a data lo-cality difference between the two versions. This was indicatedby higher number of L3 cache misses and latencies in theOpenMP version, as opposed to the MPI version. Figure 5(a)shows that the main computation procedures bicgstab,diff_coeff, matxvec, pc, pc_jac_glb (among others)do not scale. Data locality is important for achieving goodperformance in the SGI Altix. SGI Altix provides the defaultfirst-touch policy for placing data, in which a page of memoryis allocated/moved to the local memory of the first process toaccess the page. The use of a default first-touch policy hasworked very well on a single threaded or MPI processes codeon many NUMA platforms, but may lead to poor performancewith OpenMP. In MPI all the memory accesses are to localmemory by default. OpenMP has the flexibility to use thefirst-touch policy to place data in the different nodes since thedata are not explicitly mapped to processors as with MPI. Inaddition, OpenMP has a privatization feature where data canbe defined as local to each thread.
The final major source of performance degradation is causedby the procedure exchange_var__ as seen in Figure5(a). This procedure is responsible for driving the exchangeof data in the ghost cells. Because one of its subroutines(mpi_send_recv_ko) is sequential, it limits the scalabilityof the application. In the old implementation of the boundaryupdate procedure, which was primarily written for the MPIparadigm, the on-processor copies were done sequentiallysince most of the work was distributed over MPI processes.However, this became a major bottleneck in the OpenMPparadigm. Four of the events from the previous script wereidentified as having a lower ratio of local to remote memoryreferences than the application on average. One of theseevents, exchange_var__, represented 31% of the runtime,and was scaling very poorly, which confirms its sequentialnature and its local data.
Since PerfExplorer was able to determine that the mainproblem in the computational procedures were L3 missesand remote memory accesses (when compared to MPI) wediscovered that the application was initializing most of its datasequentially, resulting in data being placed on one node. Wefixed all the initializations by parallelizing the initializationloops to make sure we place the data correctly across proces-sors.
To remedy the exchange_var__ problem the on-processor copies were parallelized by eliminating two inter-mediate steps in the update procedure: that of filling the inter-mediate send buffer with data to be copied and copying thisbuffer into an intermediate receive buffer, which are inherently
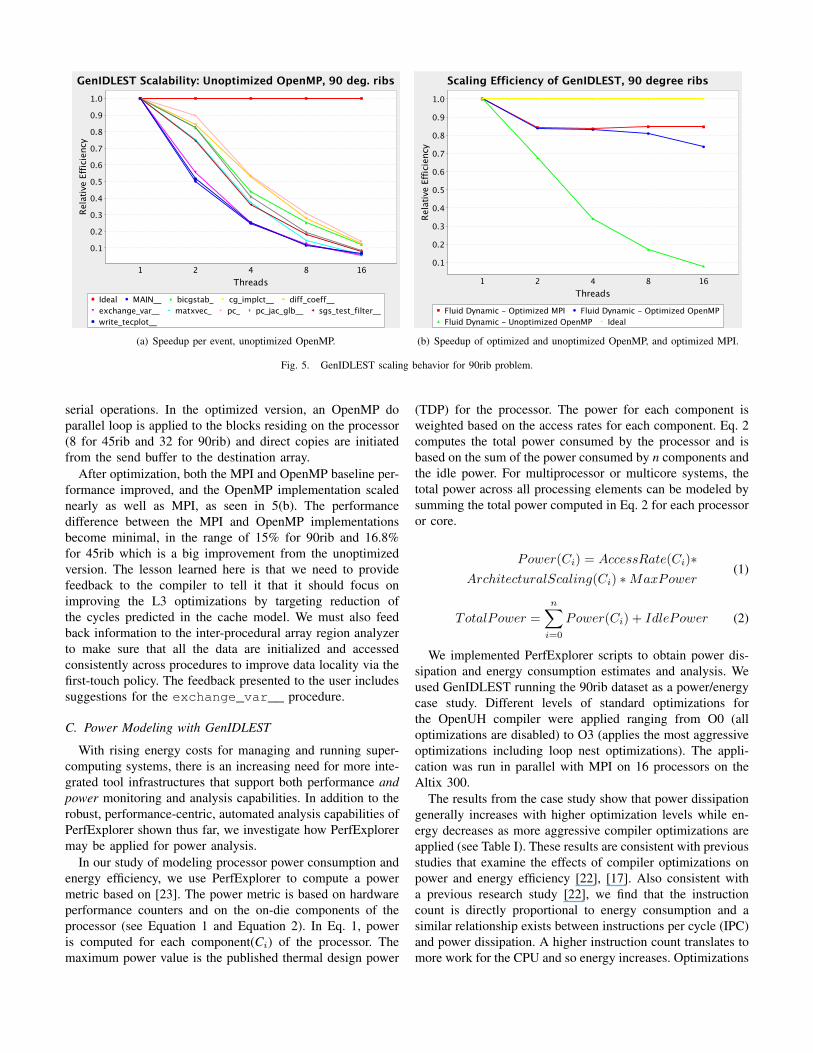
(a) Speedup per event, unoptimized OpenMP. (b) Speedup of optimized and unoptimized OpenMP, and optimized MPI.
Fig. 5. GenIDLEST scaling behavior for 90rib problem.
serial operations. In the optimized version, an OpenMP doparallel loop is applied to the blocks residing on the processor(8 for 45rib and 32 for 90rib) and direct copies are initiatedfrom the send buffer to the destination array.
After optimization, both the MPI and OpenMP baseline per-formance improved, and the OpenMP implementation scalednearly as well as MPI, as seen in 5(b). The performancedifference between the MPI and OpenMP implementationsbecome minimal, in the range of 15% for 90rib and 16.8%for 45rib which is a big improvement from the unoptimizedversion. The lesson learned here is that we need to providefeedback to the compiler to tell it that it should focus onimproving the L3 optimizations by targeting reduction ofthe cycles predicted in the cache model. We must also feedback information to the inter-procedural array region analyzerto make sure that all the data are initialized and accessedconsistently across procedures to improve data locality via thefirst-touch policy. The feedback presented to the user includessuggestions for the exchange_var__ procedure.
C. Power Modeling with GenIDLEST
With rising energy costs for managing and running super-computing systems, there is an increasing need for more inte-grated tool infrastructures that support both performance andpower monitoring and analysis capabilities. In addition to therobust, performance-centric, automated analysis capabilities ofPerfExplorer shown thus far, we investigate how PerfExplorermay be applied for power analysis.
In our study of modeling processor power consumption andenergy efficiency, we use PerfExplorer to compute a powermetric based on [23]. The power metric is based on hardwareperformance counters and on the on-die components of theprocessor (see Equation 1 and Equation 2). In Eq. 1, poweris computed for each component(Ci) of the processor. Themaximum power value is the published thermal design power
(TDP) for the processor. The power for each component isweighted based on the access rates for each component. Eq. 2computes the total power consumed by the processor and isbased on the sum of the power consumed by n components andthe idle power. For multiprocessor or multicore systems, thetotal power across all processing elements can be modeled bysumming the total power computed in Eq. 2 for each processoror core.
Power(Ci) = AccessRate(Ci)∗ArchitecturalScaling(Ci) ∗MaxPower
(1)
TotalPower =n∑
i=0
Power(Ci) + IdlePower (2)
We implemented PerfExplorer scripts to obtain power dis-sipation and energy consumption estimates and analysis. Weused GenIDLEST running the 90rib dataset as a power/energycase study. Different levels of standard optimizations forthe OpenUH compiler were applied ranging from O0 (alloptimizations are disabled) to O3 (applies the most aggressiveoptimizations including loop nest optimizations). The appli-cation was run in parallel with MPI on 16 processors on theAltix 300.
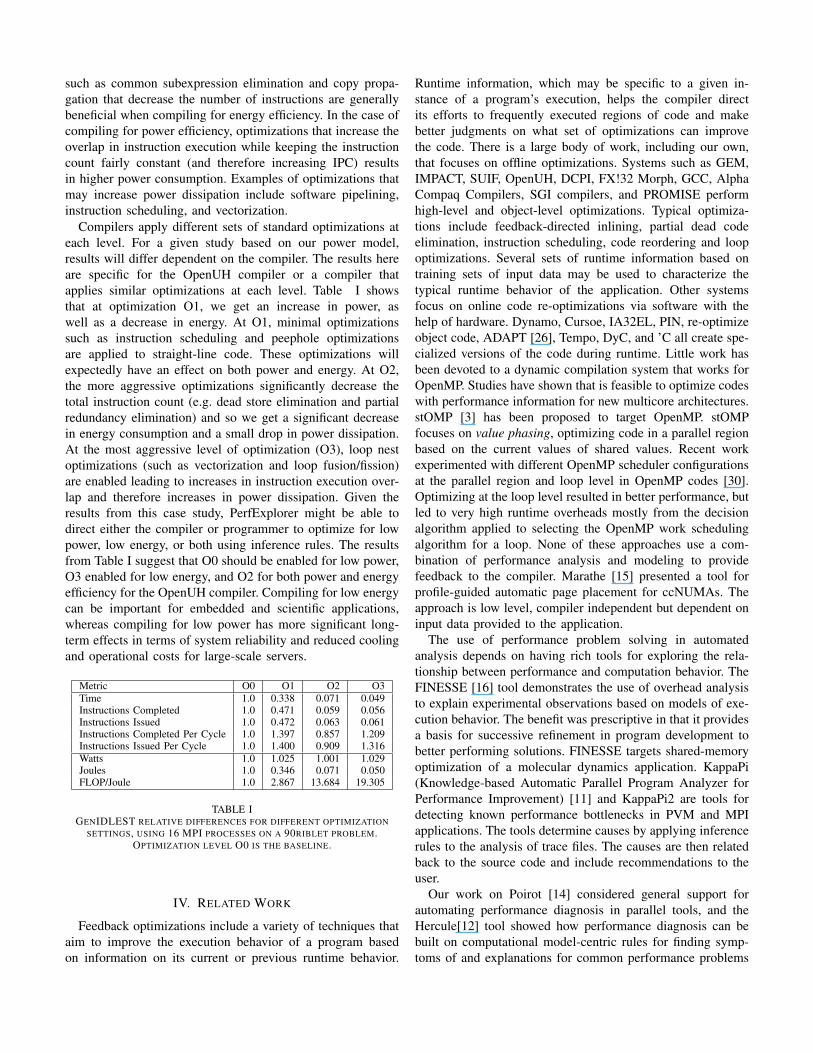
The results from the case study show that power dissipationgenerally increases with higher optimization levels while en-ergy decreases as more aggressive compiler optimizations areapplied (see Table I). These results are consistent with previousstudies that examine the effects of compiler optimizations onpower and energy efficiency [22], [17]. Also consistent witha previous research study [22], we find that the instructioncount is directly proportional to energy consumption and asimilar relationship exists between instructions per cycle (IPC)and power dissipation. A higher instruction count translates tomore work for the CPU and so energy increases. Optimizations
such as common subexpression elimination and copy propa-gation that decrease the number of instructions are generallybeneficial when compiling for energy efficiency. In the case ofcompiling for power efficiency, optimizations that increase theoverlap in instruction execution while keeping the instructioncount fairly constant (and therefore increasing IPC) resultsin higher power consumption. Examples of optimizations thatmay increase power dissipation include software pipelining,instruction scheduling, and vectorization.
Compilers apply different sets of standard optimizations ateach level. For a given study based on our power model,results will differ dependent on the compiler. The results hereare specific for the OpenUH compiler or a compiler thatapplies similar optimizations at each level. Table I showsthat at optimization O1, we get an increase in power, aswell as a decrease in energy. At O1, minimal optimizationssuch as instruction scheduling and peephole optimizationsare applied to straight-line code. These optimizations willexpectedly have an effect on both power and energy. At O2,the more aggressive optimizations significantly decrease thetotal instruction count (e.g. dead store elimination and partialredundancy elimination) and so we get a significant decreasein energy consumption and a small drop in power dissipation.At the most aggressive level of optimization (O3), loop nestoptimizations (such as vectorization and loop fusion/fission)are enabled leading to increases in instruction execution over-lap and therefore increases in power dissipation. Given theresults from this case study, PerfExplorer might be able todirect either the compiler or programmer to optimize for lowpower, low energy, or both using inference rules. The resultsfrom Table I suggest that O0 should be enabled for low power,O3 enabled for low energy, and O2 for both power and energyefficiency for the OpenUH compiler. Compiling for low energycan be important for embedded and scientific applications,whereas compiling for low power has more significant long-term effects in terms of system reliability and reduced coolingand operational costs for large-scale servers.
Metric O0 O1 O2 O3Time 1.0 0.338 0.071 0.049Instructions Completed 1.0 0.471 0.059 0.056Instructions Issued 1.0 0.472 0.063 0.061Instructions Completed Per Cycle 1.0 1.397 0.857 1.209Instructions Issued Per Cycle 1.0 1.400 0.909 1.316Watts 1.0 1.025 1.001 1.029Joules 1.0 0.346 0.071 0.050FLOP/Joule 1.0 2.867 13.684 19.305
TABLE IGENIDLEST RELATIVE DIFFERENCES FOR DIFFERENT OPTIMIZATION
SETTINGS, USING 16 MPI PROCESSES ON A 90RIBLET PROBLEM.OPTIMIZATION LEVEL O0 IS THE BASELINE.
IV. RELATED WORK
Feedback optimizations include a variety of techniques thataim to improve the execution behavior of a program basedon information on its current or previous runtime behavior.
Runtime information, which may be specific to a given in-stance of a program’s execution, helps the compiler directits efforts to frequently executed regions of code and makebetter judgments on what set of optimizations can improvethe code. There is a large body of work, including our own,that focuses on offline optimizations. Systems such as GEM,IMPACT, SUIF, OpenUH, DCPI, FX!32 Morph, GCC, AlphaCompaq Compilers, SGI compilers, and PROMISE performhigh-level and object-level optimizations. Typical optimiza-tions include feedback-directed inlining, partial dead codeelimination, instruction scheduling, code reordering and loopoptimizations. Several sets of runtime information based ontraining sets of input data may be used to characterize thetypical runtime behavior of the application. Other systemsfocus on online code re-optimizations via software with thehelp of hardware. Dynamo, Cursoe, IA32EL, PIN, re-optimizeobject code, ADAPT [26], Tempo, DyC, and ’C all create spe-cialized versions of the code during runtime. Little work hasbeen devoted to a dynamic compilation system that works forOpenMP. Studies have shown that is feasible to optimize codeswith performance information for new multicore architectures.stOMP [3] has been proposed to target OpenMP. stOMPfocuses on value phasing, optimizing code in a parallel regionbased on the current values of shared values. Recent workexperimented with different OpenMP scheduler configurationsat the parallel region and loop level in OpenMP codes [30].Optimizing at the loop level resulted in better performance, butled to very high runtime overheads mostly from the decisionalgorithm applied to selecting the OpenMP work schedulingalgorithm for a loop. None of these approaches use a com-bination of performance analysis and modeling to providefeedback to the compiler. Marathe [15] presented a tool forprofile-guided automatic page placement for ccNUMAs. Theapproach is low level, compiler independent but dependent oninput data provided to the application.
The use of performance problem solving in automatedanalysis depends on having rich tools for exploring the rela-tionship between performance and computation behavior. TheFINESSE [16] tool demonstrates the use of overhead analysisto explain experimental observations based on models of exe-cution behavior. The benefit was prescriptive in that it providesa basis for successive refinement in program development tobetter performing solutions. FINESSE targets shared-memoryoptimization of a molecular dynamics application. KappaPi(Knowledge-based Automatic Parallel Program Analyzer forPerformance Improvement) [11] and KappaPi2 are tools fordetecting known performance bottlenecks in PVM and MPIapplications. The tools determine causes by applying inferencerules to the analysis of trace files. The causes are then relatedback to the source code and include recommendations to theuser.
Our work on Poirot [14] considered general support forautomating performance diagnosis in parallel tools, and theHercule[12] tool showed how performance diagnosis can bebuilt on computational model-centric rules for finding symp-toms of and explanations for common performance problems
in applications, such as load imbalance, insufficient paral-lelization, and scheduling overhead. Since performance prob-lems are diagnosed in the context of the application’s parallelmodel, possible solutions for correcting the inefficiencies canbe proposed. In contrast to our current work, Hercule analyzesevent trace files, not profiles, and lacks support for analysisscripting.
EXPERT[19] is an automatic event-trace analysis tool forMPI and OpenMP applications. It searches the traces forexecution patterns indicating low performance and quanti-fies them according to their severity. The patterns targetboth problems resulting from inefficient communication andsynchronization as well as from low CPU and memoryperformance. SCALASCA[6] parallelizes the EXPERT traceanalysis methods and provides the CUBE[28] graphical viewerfor highlighting performance problems in relation to threadsof execution and metrics. CUBE implements PerformanceAlgebra, a technique for performing difference, merge andaggregation operations on parallel performance profile data. Incontrast to these tools, PerfExplorer provides support for trans-lating performance problems and metrics into performanceknowledge and rules, and for integrating these performanceanalytics capabilities into automated analysis environments.
Performance Assertions[25] have been developed to confirmthat the empirical performance data of an application or coderegion meets or exceeds that of the expected performance. Byusing the assertions, the programmer can relate expected per-formance results to variables in the application, the executionconfiguration (i.e. number of processors), and pre-evaluatedvariables (i.e. peak FLOPS for this machine). This techniqueallows users to encode their performance expectations forregions of code, confirm these expectations with empiricaldata, and even make runtime decisions about componentselection based on this data. The use of performance assertionsrequires extensive annotation of source code, and relies on theapplication developer’s experience and intuition in knowingwhere to insert the assertions, and what kind of performanceresult to expect.
Several strategies exist for reducing total power dissipatedand energy consumed by a microprocessor. Power and energysaving techniques can be applied at the level of circuits,architectures, system software, and at the application layer[24].Power analysis and optimizations at the system software andapplication layers have not been adequately explored, but someprogress has been made in recent times. Seng and Tullsen[17]studied the effects of power and energy savings for bothstandard compiler optimizations and individual optimizationson the Pentium 4. Their experiments suggest that compil-ing for the best performance is equated with high energysavings. Valluri and John[22] performed a similar but morein-depth study on the Alpha 21264 processor. They foundthat optimizations that improve performance by reducing theinstruction count are optimized for low energy. They alsofound that optimizations that improve performance by in-creasing the amount of overlap in execution of instructionsincrease average power dissipation in the processor. LUNA[5]
is a high level power analysis framework for multicore NoCarchitectures. LUNA has been employed by the compiler togenerate power profiles in the network that were used togenerate directives which are stored at each router to directthe operation of dynamic-voltage-scalable (DVS) links. TheCOPPER project[1] applies dynamic compilation strategies fordynamic power management. They introduce techniques forcompiler controlled dynamic register file reconfiguration andprofile-driven dynamic clock frequency and voltage scaling. Atthe application layer, PowerPack[4] provides library routinesthat allow users to embed ACPI calls in applications andreduce the CPU’s processing speed via DVS. Very few toolsprovide an automated framework that would enable the non-expert to successfully apply these optimization techniques toachieve low energy consumption and power dissipation ratesin their applications.
V. CONCLUSION
Automated performance analysis depends both on the pro-cessing of multi-experiment performance data and on expertknowledge to direct the processing, interpret the results, andprovide decision support. The research reported here repre-sents our first attempt to integrate PerfExplorer’s capabili-ties for capturing and automating performance analysis withtools for performance-directed modeling and optimization.The flexible programmatic support for analysis scripting andrule-based knowledge engineering in PerfExplorer has provensuccessful in the integration with the OpenUH compiler sys-tem and now sets the stage for more sophisticated feedback-directed compiler optimizations.
Our future work will explore several opportunities. The costmodel calculation for OpenUH can be modified to integratefeedback from runtime performance to generate more accuratecost models. Different optimization priorities may apply, suchas improving caching/memory strategies or utilizing processorfunctional units more effectively. The parallel model shouldbe improved to feed in information to detect imbalances dueto different amounts of work per thread in parallel loops.We also need to feed information with regard to sourcesof overhead and their causes, such as time spent in atomicoperations, locking, and critical sections, and their correlationto the distribution of work in parallel sections and number ofthreads. In addition, there are strategies for variable privatiza-tion and first touch policies to reduce the number of remotememory references that can be better informed by automatedperformance analysis.
We plan to extend our performance and power inferencerules with PerfExplorer and integrate the results with theOpenUH compiler cost model, thus enabling users to targetoptimizations based on both performance and power models.Furthermore, we will also extend our models to considerthe impacts of architecture characteristics and applicationmetadata on compilation strategies for improved power andenergy efficiency.
ACKNOWLEDGMENTS
University of Oregon research is sponsored by contracts DE-FG02-07ER25826 and DE-FG02-05ER25680 from the MICSprogram of the U.S. DOE, Office of Science and NSF grant#CCF0444475. University of Houston research is sponsoredby the NSF grants #CCF-0444468 and #CCF-0702775. Re-search at Argonne National Laboratory is supported through aCISE-BPC supplement under NSF grant #0444345 and DOEcontract DE-AC02-06CH11357. We would like to thank Dr.Danesh Tafti from the Mechanical Engineering Departmentof Virginia Tech for providing us a good description of theGenIDLEST application and useful insights to facilitate theprocess of optimization.
REFERENCES
[1] A. Azevedo, R. Cornea, I. Issenin, R. Gupta, N. Dutt, A. Nicolau,and A. Veidenbaum, “Architectural and compiler strategies for dynamicpower management in the copper project,” in IWIA ’01: Proceedingsof the Innovative Architecture for Future Generation High-PerformanceProcessors and Systems (IWIA’01). Washington, DC, USA: IEEEComputer Society, 2001, p. 25.
[2] V. Bui, O. Hernandez, B. Chapman, R. Kufrin, D. Tafti, and P. Gopalkr-ishnan, “Towards an implementation of the openmp collector api,” inPARCO, 2007.
[3] M. Burcea and M. Voss, “A runtime optimization system for OpenMP,”in WOMPAT, 2003, pp. 42–53.
[4] K. W. Cameron, R. Ge, and X. Feng, “High-performance, power-awaredistributed computing for scientific applications,” Computer, vol. 38,no. 11, pp. 40–47, 2005.
[5] N. Eisley, V. Soteriou, and L.-S. Peh, “High-level power analysis formulti-core chips,” in CASES ’06: Proceedings of the 2006 internationalconference on Compilers, architecture and synthesis for embeddedsystems. New York, NY, USA: ACM, 2006, pp. 389–400.
[6] M. Geimer, F. Wolf, B. J. N. Wylie, and B. Mohr, “Scalable paralleltrace-based performance analysis,” in Proc. 13th European PVM/MPIUsers’ Group Meeting, ser. LNCS, vol. 4192. Bonn, Germany: Springer,September 2006, pp. 303–312.
[7] O. Hernandez, H. Jin, and B. Chapman, “Compiler support for effi-cient instrumentation,” in ParCo ’07: Proceedings of the InternationalConference ParCo 2007. Julich, Germany: NIC-Directors, 2007, pp.661–668.
[8] O. Hernandez, F. Song, B. Chapman, J. Dongarra, B. Mohr,S. Moore, and F. Wolf, “Instrumentation and compiler optimizationsfor mpi/openmp applications,” in International Workshop on OpenMP(IWOMP 2006), 2006.
[9] K. A. Huck, A. D. Malony, S. Shende, and A. Morris, “Scalable,automated performance analysis with tau and perfexplorer,” in ParallelComputing (ParCo), Aachen, Germany, 2007.
[10] S. Jarp, “A methodology for using the itanium-2 performance countersfor bottleneck analysis,” HP Labs, Tech. Rep., August 2002.
[11] J. Jorba, T. Margalef, and E. Luque, “Performance analysis of parallelapplications with kappapi2,” Parallel Computing: Current & FutureIssues of High-End Computing, Proceedings of the International Con-ference ParCo 2005, vol. 33, pp. 155–162, 2006.
[12] L. Li and A. D. Malony, “Knowledge engineering for automatic parallelperformance diagnosis,” Concurrrency and Computation: Practice andExperience, 2006.
[13] C. Liao, O. Hernandez, B. Chapman, W. Chen, and W. Zheng,“OpenUH: An optimizing, portable OpenMP compiler,” in 12th Work-shop on Compilers for Parallel Computers, 2006.
[14] A. Malony and R. Helm, “A Theory and Architecture for AutomatingPerformance Diagnosis,” Future Generation Computer Systems, vol. 18,no. 1, pp. 189–200, Sep. 2001, (Special issue on Performance Data-mining in Parallel and Distributed Computing).
[15] J. Marathe and F. Mueller, “Hardware profile-guided automatic pageplacement for ccnuma systems,” in PPoPP ’06: Proceedings of theeleventh ACM SIGPLAN symposium on Principles and practice ofparallel programming. New York, NY, USA: ACM, 2006, pp. 90–99.
[16] G. D. Riley, J. M. Bull, and J. R. Gurd, “Performance improvementthrough overhead analysis: A case study in molecular dynamics,” inInternational Conference on Supercomputing, 1997, pp. 36–43.
[17] J. S. Seng and D. M. Tullsen, “The effect of compiler optimizationson pentium 4 power consumption,” in INTERACT ’03: Proceedings ofthe Seventh Workshop on Interaction between Compilers and ComputerArchitectures. Washington, DC, USA: IEEE Computer Society, 2003,p. 51.
[18] S. Shende and A. D. Malony, “The TAU parallel performancesystem,” The International Journal of High Performance ComputingApplications, vol. 20, no. 2, pp. 287–331, Summer 2006. [Online].Available: http://www.cs.uoregon.edu/research/tau
[19] F. Song, F. Wolf, N. Bhatia, J. Dongarra, and S. Moore, “Analgebra for cross-experiment performance analysis,” in Proceedingsof 2004 International Conference on Parallel Processing (ICPP’04),Montreal, Quebec, Canada, 2004, pp. 63–72. [Online]. Available:http://doi.ieeecomputersociety.org/10.1109/ICPP.2004.1327905
[20] D. K. Tafti, “Genidlest - a scalable parallel computational tool forsimulating complex turbulent flows,” in Proceedings of the ASME FluidsEngineering Division, November 2001.
[21] J. Thompson, D. Higgins, and T. Gibson, “CLUSTAL W: improving thesensitivity of progressive multiple sequence alignment through sequenceweighting, position-specific gap penalties and weight matrix choice,”Nucl. Acids Res., vol. 22, pp. 4673–4680, 1994.
[22] M. Valluri and L. John, “Is compiling for performance == compiling forpower,” 2001. [Online]. Available: citeseer.ist.psu.edu/valluri01is.html
[23] V.Bui, B. Norris, L. McInnes, K. Huck, O. Hernandez, L. Li, andB. Chapman, “A component infrastructure for performance and powermodeling of parallel scientific applications,” in Component-Based HighPerformance Computing, 2008.
[24] V. Venkatachalam and M. Franz, “Power reduction techniques formicroprocessor systems,” ACM Comput. Surv., vol. 37, no. 3, pp. 195–237, 2005.
[25] J. S. Vetter and P. H. Worley, “Asserting performance expectations,”in Supercomputing ’02: Proceedings of the 2002 ACM/IEEEconference on Supercomputing. Los Alamitos, CA, USA: IEEEComputer Society Press, 2002, pp. 1–13. [Online]. Avail-able: http://portal.acm.org/ft gateway.cfm?id=762809&type=pdf&coll=ACM&dl=ACM&CFID=52735087&CFTOKEN=45432917
[26] M. J. Voss and R. Eigemann, “High-level adaptive program optimizationwith ADAPT,” ACM SIGPLAN Notices, vol. 36, no. 7, pp. 93–102, 2001.
[27] G. Wang and D. K. Tafti, “Uniprocessor performance enhancement withadditive schwarz preconditioners on origin 2000,” Adv. Eng. Softw.,vol. 29, no. 3-6, pp. 425–431, 1998.
[28] F. Wolf and B. Mohr, “Automatic performance analysis of SMP clusterapplications,” Research Centre Julich, Tech. Rep. 05, 2001.
[29] M. E. Wolf, D. E. Maydan, and D.-K. Chen, “Combining loop transfor-mations considering caches and scheduling,” in MICRO 29: Proceedingsof the 29th annual ACM/IEEE international symposium on Microarchi-tecture. Washington, DC, USA: IEEE Computer Society, 1996, pp.274–286.
[30] Y. Zhang and M. Voss, “Runtime empirical selection of loop schedulerson hyperthreaded smps.” in IPDPS, 2005.
[31] A. Zomaya, Ed., Parallel Computing for Bioinformatics and Compu-tational Biology: Models, Enabling Technologies, and Case Studies,1st ed., ser. Wiley Series on Parallel and Distributed Computing. WileyInterscience, 2006.
Related Documents


