MISSION POSSIBLE: CAPTURING GROWTH IN THE GLOBAL MARKET DRIED FRUIT & TREE NUTS DFA OF CALIFORNIA AND SPECIALTY CROP TRADE COUNCIL 2014 ANNUAL CONFERENCE: MISSION POSSIBLE

Welcome message from author
This document is posted to help you gain knowledge. Please leave a comment to let me know what you think about it! Share it to your friends and learn new things together.
Transcript
© Euromonitor International
1
MISSION POSSIBLE: CAPTURING GROWTH IN THE GLOBAL MARKET DRIED FRUIT & TREE NUTS DFA OF CALIFORNIA AND SPECIALTY CROP TRADE COUNCIL 2014 ANNUAL
CONFERENCE: MISSION POSSIBLE
© Euromonitor International
2
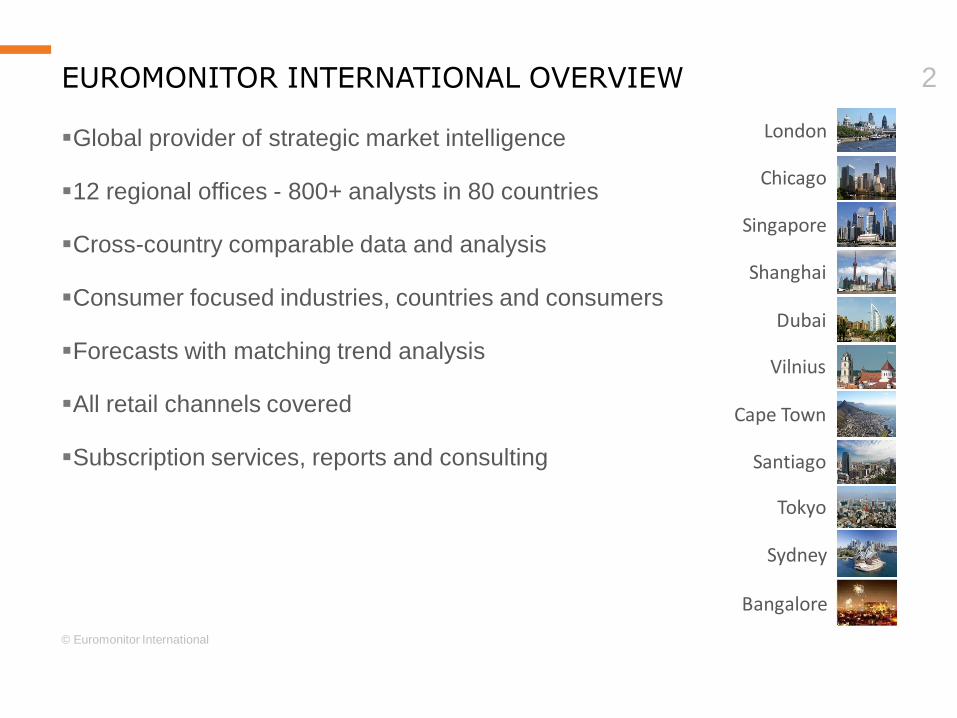
EUROMONITOR INTERNATIONAL OVERVIEW
Global provider of strategic market intelligence
12 regional offices - 800+ analysts in 80 countries
Cross-country comparable data and analysis
Consumer focused industries, countries and consumers
Forecasts with matching trend analysis
All retail channels covered
Subscription services, reports and consulting
London
Singapore
Shanghai
Dubai
Vilnius
Cape Town
Santiago
Tokyo
Sydney
Chicago
Bangalore
GLOBAL MERCHANDISE TRADE
DRIVERS, CONSTRAINTS & TRENDS
TREE NUT & DRIED FRUIT EXPORTS
FOOD CONSUMPTION TRENDS
RIDING THE GROWTH TRACK
© Euromonitor International
4
WHAT’S HAPPENED IN GLOBAL TRADE IN THE LAST YEAR? TRADE INSIGHTS…
© Euromonitor International
5
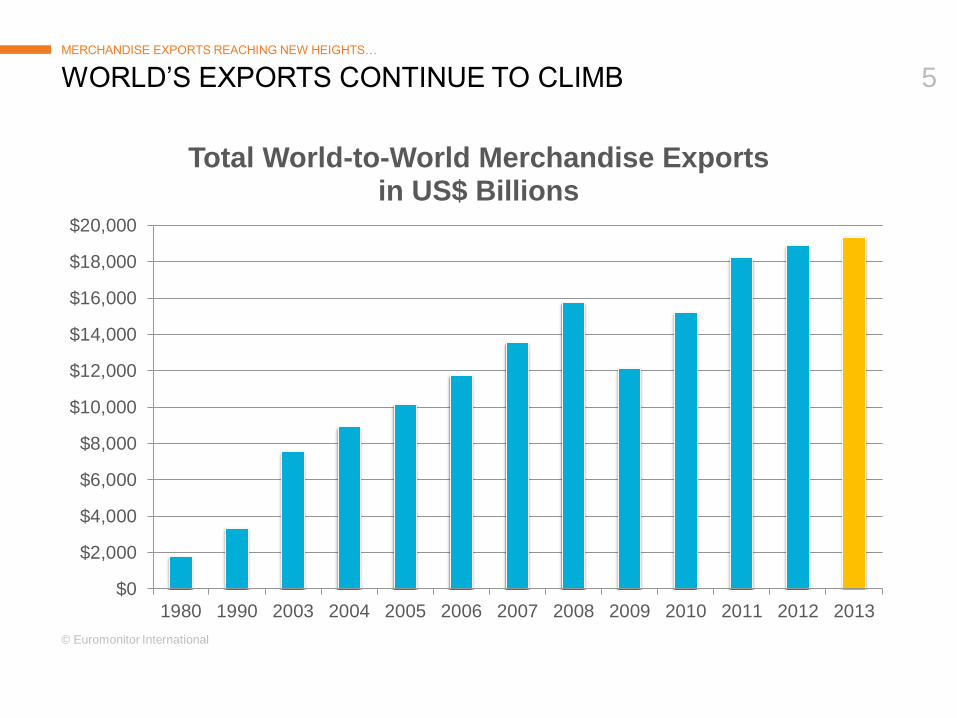
WORLD’S EXPORTS CONTINUE TO CLIMB MERCHANDISE EXPORTS REACHING NEW HEIGHTS…
$0
$2,000
$4,000
$6,000
$8,000
$10,000
$12,000
$14,000
$16,000
$18,000
$20,000
1980 1990 2003 2004 2005 2006 2007 2008 2009 2010 2011 2012 2013
Total World-to-World Merchandise Exports in US$ Billions
© Euromonitor International
6
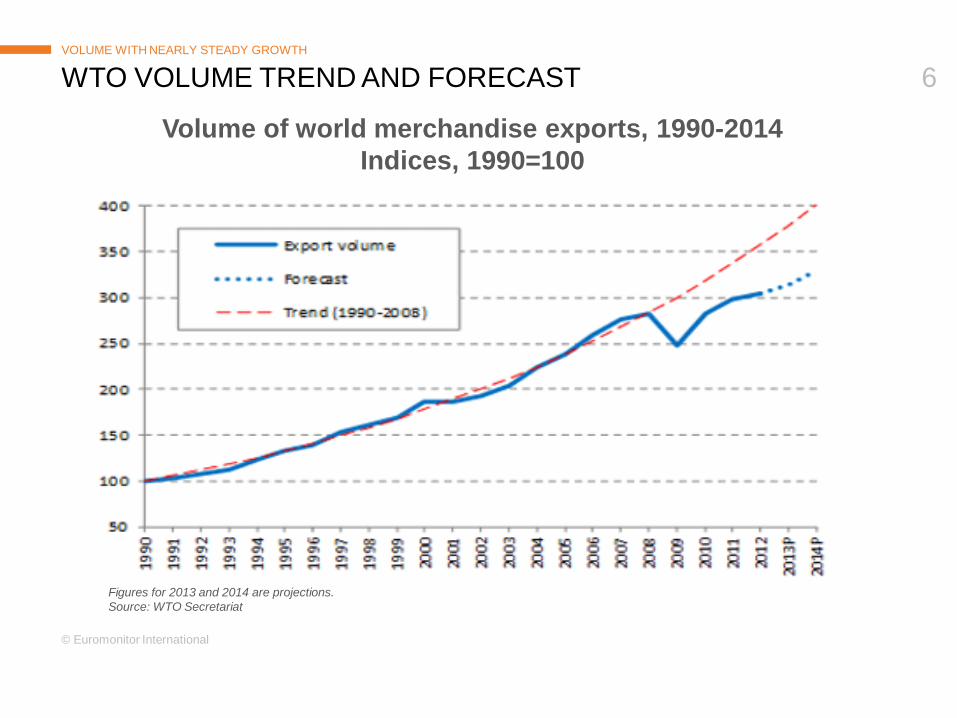
WTO VOLUME TREND AND FORECAST VOLUME WITH NEARLY STEADY GROWTH
Volume of world merchandise exports, 1990-2014
Indices, 1990=100
Figures for 2013 and 2014 are projections.
Source: WTO Secretariat
© Euromonitor International
7
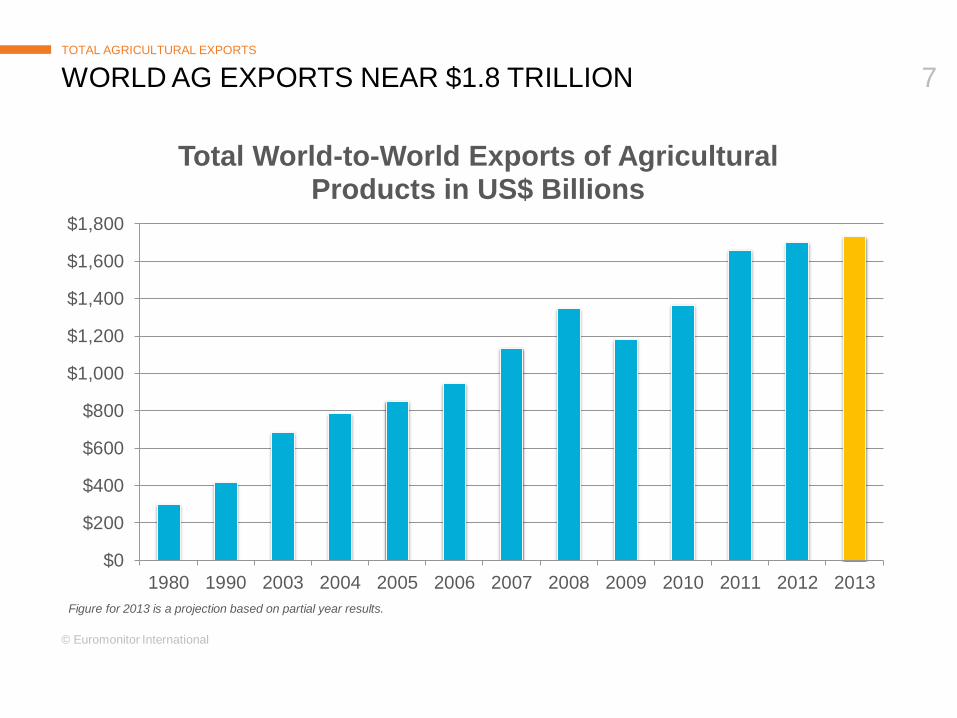
WORLD AG EXPORTS NEAR $1.8 TRILLION
TOTAL AGRICULTURAL EXPORTS
$0
$200
$400
$600
$800
$1,000
$1,200
$1,400
$1,600
$1,800
1980 1990 2003 2004 2005 2006 2007 2008 2009 2010 2011 2012 2013
Total World-to-World Exports of Agricultural Products in US$ Billions
Figure for 2013 is a projection based on partial year results.
© Euromonitor International
8
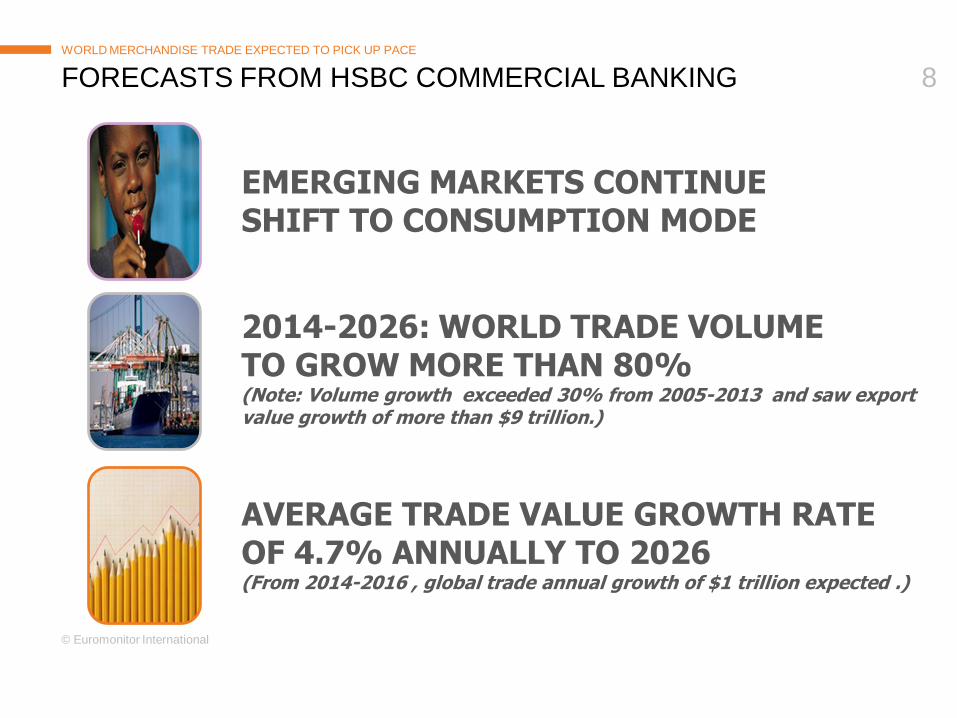
FORECASTS FROM HSBC COMMERCIAL BANKING WORLD MERCHANDISE TRADE EXPECTED TO PICK UP PACE
EMERGING MARKETS CONTINUE SHIFT TO CONSUMPTION MODE
AVERAGE TRADE VALUE GROWTH RATE OF 4.7% ANNUALLY TO 2026 (From 2014-2016 , global trade annual growth of $1 trillion expected .)
2014-2026: WORLD TRADE VOLUME TO GROW MORE THAN 80% (Note: Volume growth exceeded 30% from 2005-2013 and saw export value growth of more than $9 trillion.)
GLOBAL MERCHANDISE TRADE
DRIVERS, CONSTRAINTS & TRENDS
TREE NUT & DRIED FRUIT EXPORTS
FOOD CONSUMPTION TRENDS
RIDING THE GROWTH TRACK
© Euromonitor International
10
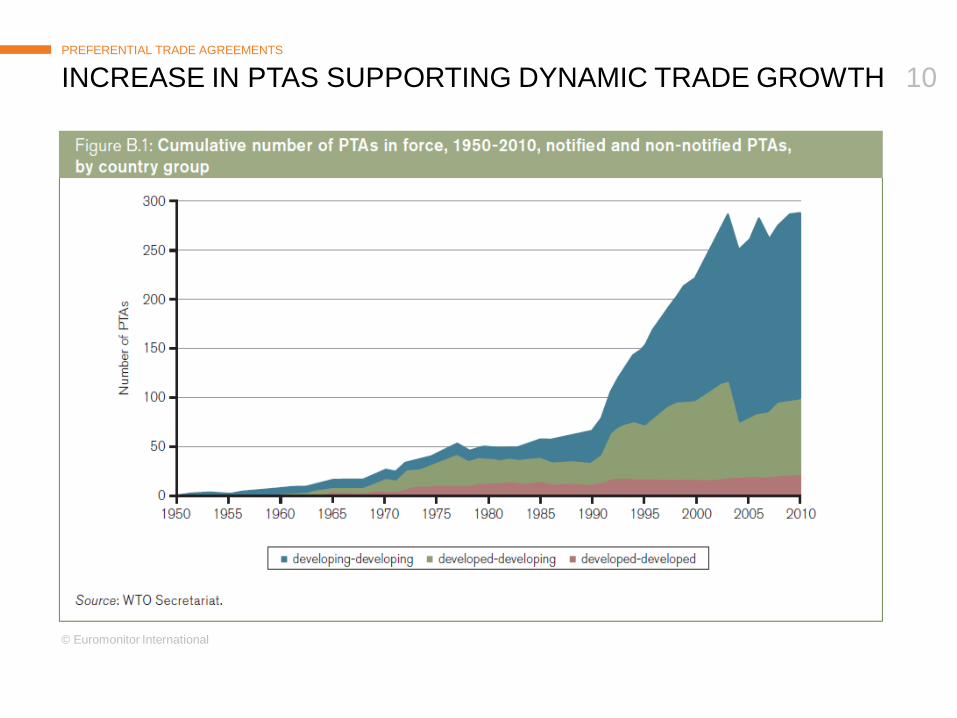
INCREASE IN PTAS SUPPORTING DYNAMIC TRADE GROWTH PREFERENTIAL TRADE AGREEMENTS
© Euromonitor International
11
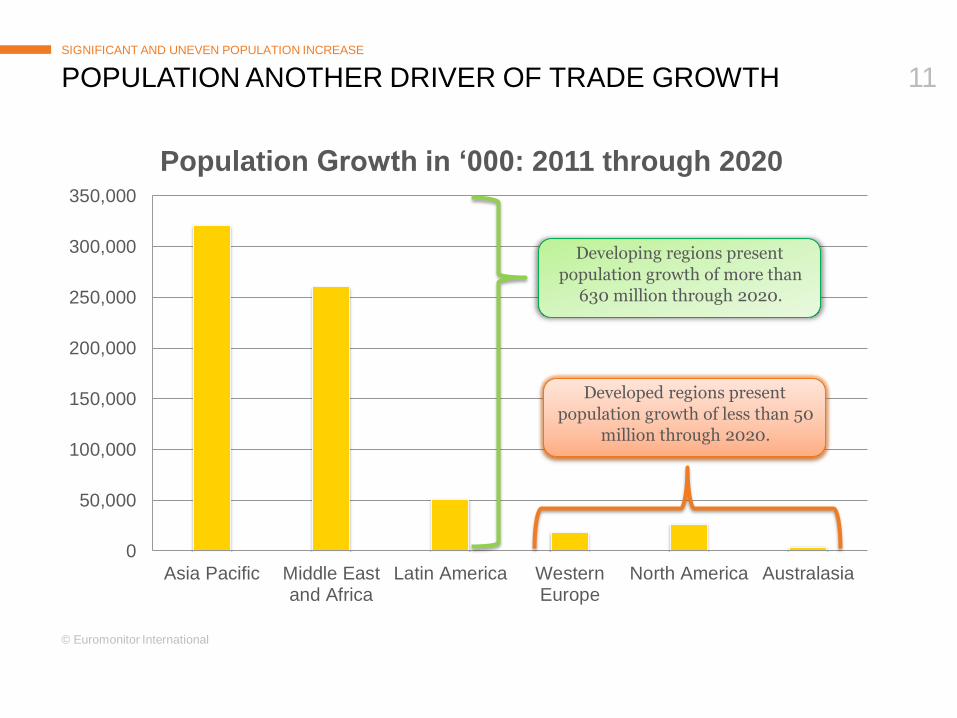
POPULATION ANOTHER DRIVER OF TRADE GROWTH SIGNIFICANT AND UNEVEN POPULATION INCREASE
0
50,000
100,000
150,000
200,000
250,000
300,000
350,000
Asia Pacific Middle Eastand Africa
Latin America WesternEurope
North America Australasia
Population Growth in ‘000: 2011 through 2020
Developed regions present
population growth of less than 50
million through 2020.
Developing regions present
population growth of more than
630 million through 2020.
© Euromonitor International
12
-50
0
50
100
150
200
250
300
350
Millio
ns o
f p
eo
ple
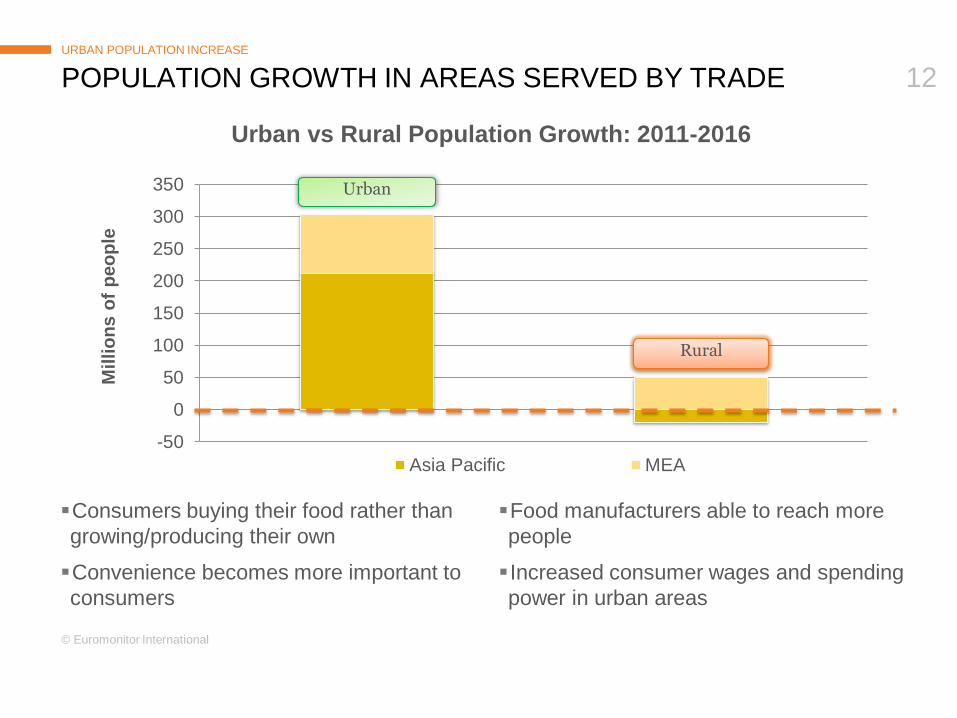
Urban vs Rural Population Growth: 2011-2016
Asia Pacific MEA
Consumers buying their food rather than
growing/producing their own
Convenience becomes more important to
consumers
Food manufacturers able to reach more
people
Increased consumer wages and spending
power in urban areas
POPULATION GROWTH IN AREAS SERVED BY TRADE
URBAN POPULATION INCREASE
Rural
Urban
© Euromonitor International
13
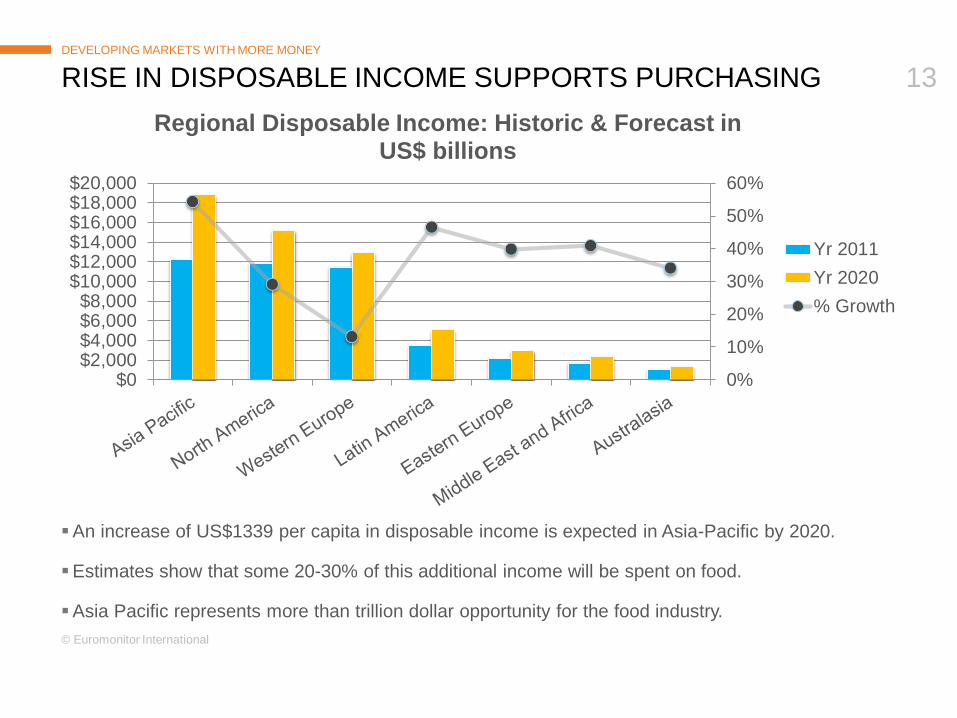
RISE IN DISPOSABLE INCOME SUPPORTS PURCHASING DEVELOPING MARKETS WITH MORE MONEY
An increase of US$1339 per capita in disposable income is expected in Asia-Pacific by 2020.
Estimates show that some 20-30% of this additional income will be spent on food.
Asia Pacific represents more than trillion dollar opportunity for the food industry.
0%
10%
20%
30%
40%
50%
60%
$0$2,000$4,000$6,000$8,000
$10,000$12,000$14,000$16,000$18,000$20,000
Regional Disposable Income: Historic & Forecast in US$ billions
Yr 2011
Yr 2020
% Growth
© Euromonitor International
14
PTAs, DEMAND, PURCHASING POWER, POPULATION…
NEW-WORLD BUSINESS ENVIRONMENT.
THE GLOBAL SUPERMARKET IS EXPANDING BUT NOT WITHOUT CHALLENGES
© Euromonitor International
15
WHAT’S THE IMPACT TO THE U.S. AND CALIFORNIA? HOW HAS THIS AFFECTED EXPORTS…
© Euromonitor International
16
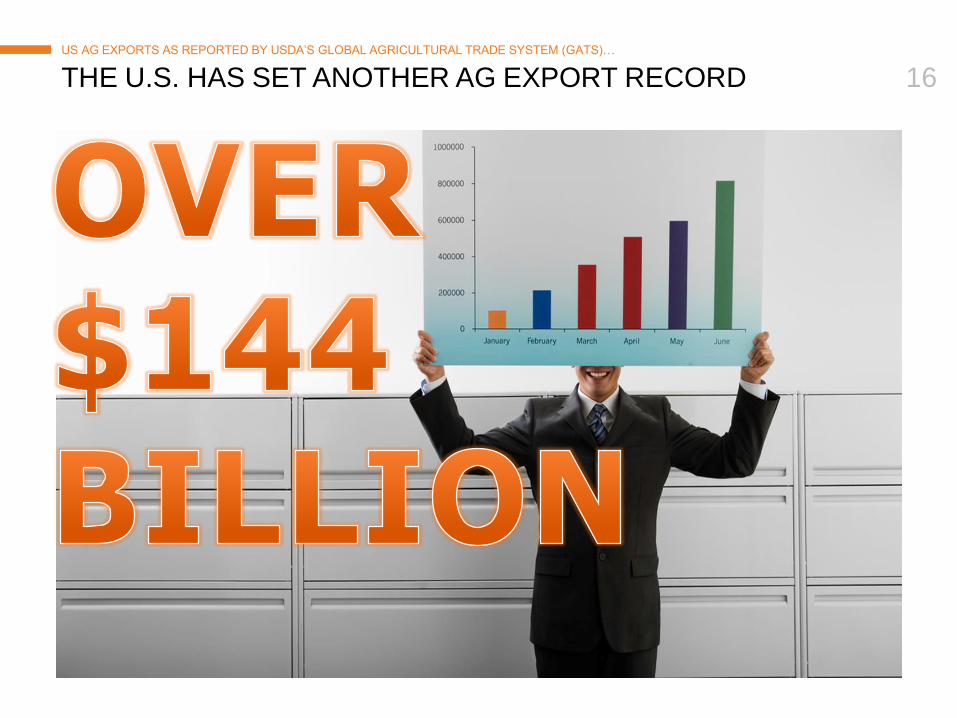
THE U.S. HAS SET ANOTHER AG EXPORT RECORD
US AG EXPORTS AS REPORTED BY USDA’S GLOBAL AGRICULTURAL TRADE SYSTEM (GATS)…
© Euromonitor International
17
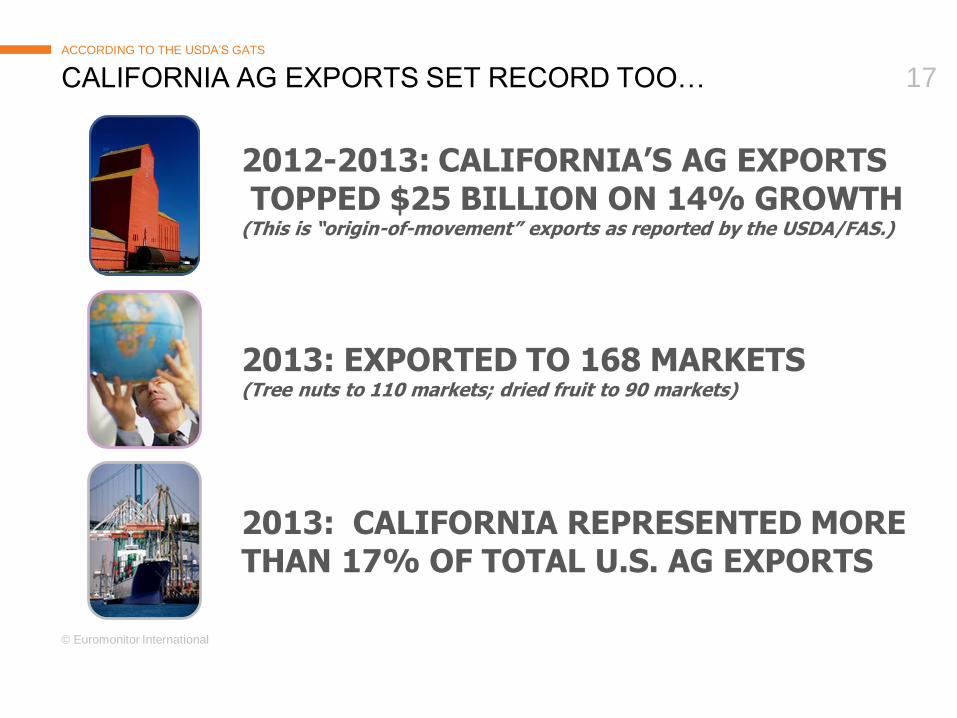
CALIFORNIA AG EXPORTS SET RECORD TOO…
ACCORDING TO THE USDA’S GATS
2013: EXPORTED TO 168 MARKETS (Tree nuts to 110 markets; dried fruit to 90 markets)
2012-2013: CALIFORNIA’S AG EXPORTS TOPPED $25 BILLION ON 14% GROWTH
(This is “origin-of-movement” exports as reported by the USDA/FAS.)
2013: CALIFORNIA REPRESENTED MORE THAN 17% OF TOTAL U.S. AG EXPORTS
GLOBAL MERCHANDISE TRADE
DRIVERS, CONSTRAINTS & TRENDS
TREE NUT & DRIED FRUIT EXPORTS
FOOD CONSUMPTION TRENDS
RIDING THE GROWTH TRACK
© Euromonitor International
19
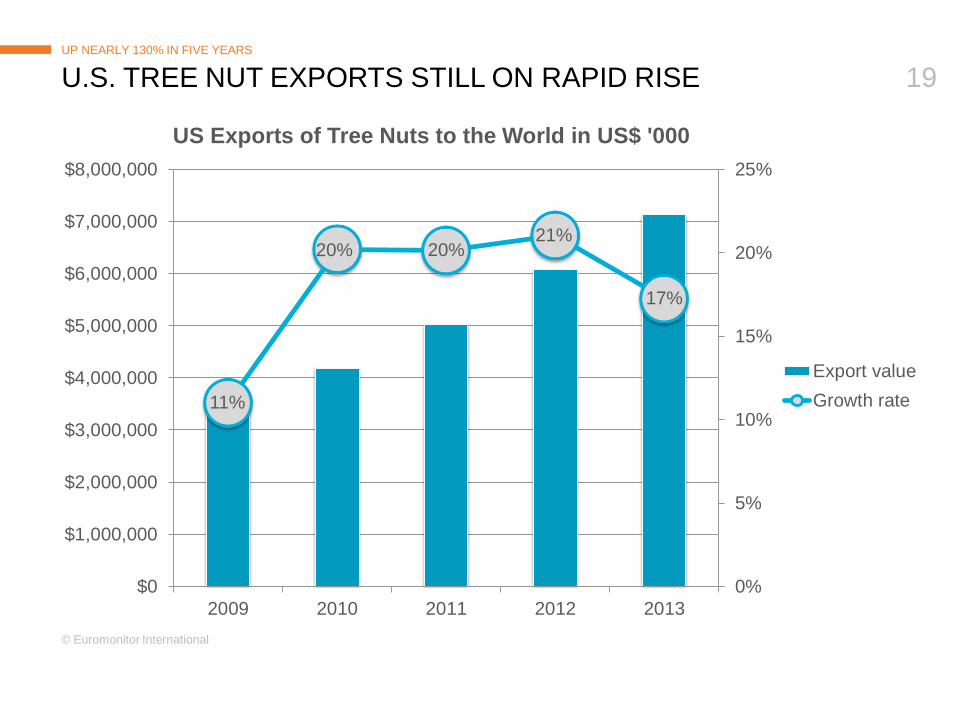
U.S. TREE NUT EXPORTS STILL ON RAPID RISE
UP NEARLY 130% IN FIVE YEARS
11%
20% 20% 21%
17%
0%
5%
10%
15%
20%
25%
$0
$1,000,000
$2,000,000
$3,000,000
$4,000,000
$5,000,000
$6,000,000
$7,000,000
$8,000,000
2009 2010 2011 2012 2013
US Exports of Tree Nuts to the World in US$ '000
Export value
Growth rate
© Euromonitor International
20
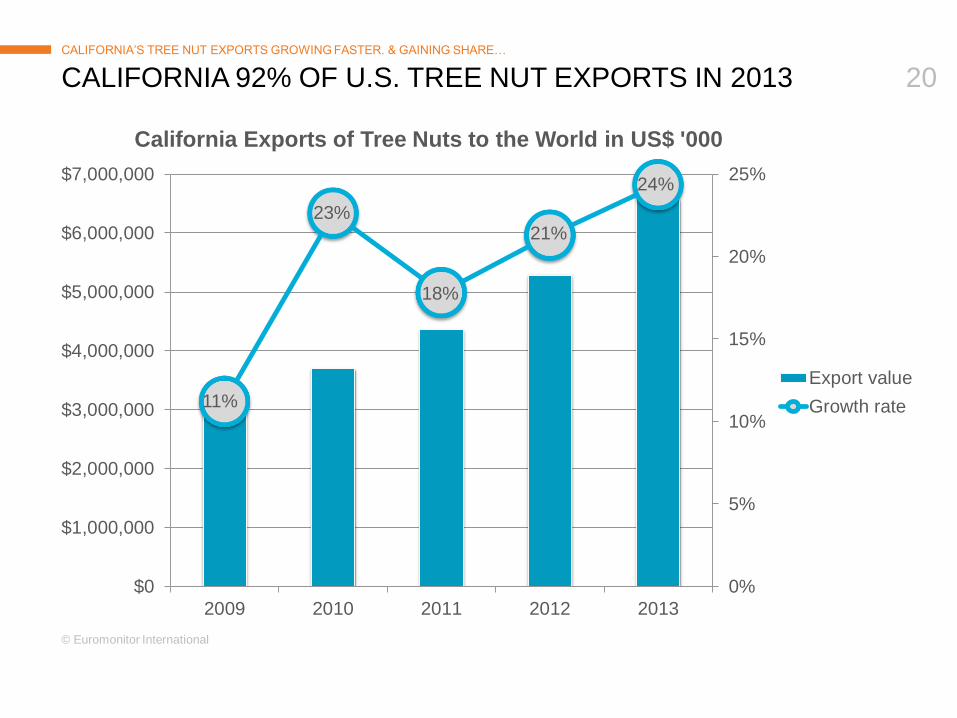
CALIFORNIA 92% OF U.S. TREE NUT EXPORTS IN 2013
CALIFORNIA’S TREE NUT EXPORTS GROWING FASTER. & GAINING SHARE…
11%
23%
18%
21%
24%
0%
5%
10%
15%
20%
25%
$0
$1,000,000
$2,000,000
$3,000,000
$4,000,000
$5,000,000
$6,000,000
$7,000,000
2009 2010 2011 2012 2013
California Exports of Tree Nuts to the World in US$ '000
Export value
Growth rate
© Euromonitor International
21
CALIFORNIA TREE NUTS WITH ANOTHER RECORD
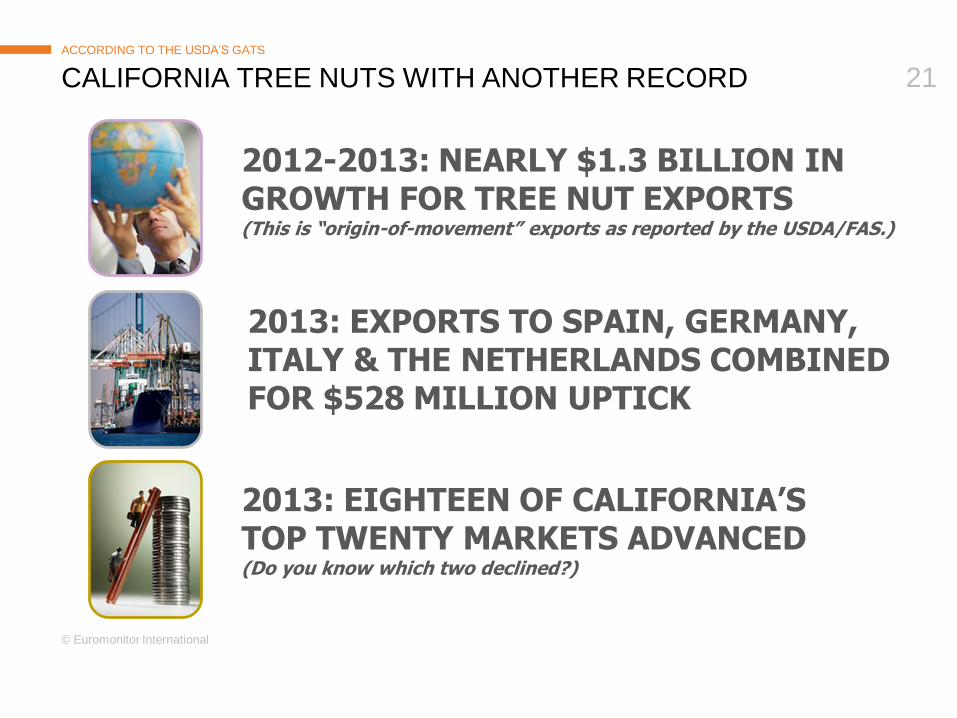
ACCORDING TO THE USDA’S GATS
2013: EXPORTS TO SPAIN, GERMANY, ITALY & THE NETHERLANDS COMBINED FOR $528 MILLION UPTICK
2012-2013: NEARLY $1.3 BILLION IN GROWTH FOR TREE NUT EXPORTS (This is “origin-of-movement” exports as reported by the USDA/FAS.)
2013: EIGHTEEN OF CALIFORNIA’S TOP TWENTY MARKETS ADVANCED (Do you know which two declined?)
© Euromonitor International
22
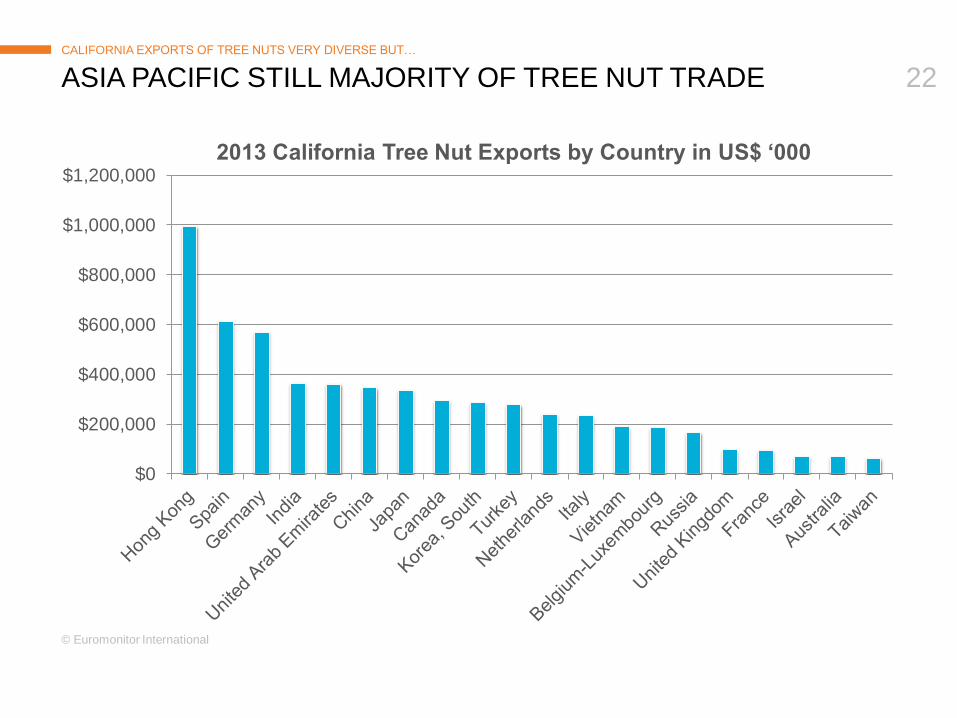
ASIA PACIFIC STILL MAJORITY OF TREE NUT TRADE
CALIFORNIA EXPORTS OF TREE NUTS VERY DIVERSE BUT…
$0
$200,000
$400,000
$600,000
$800,000
$1,000,000
$1,200,000
2013 California Tree Nut Exports by Country in US$ ‘000
© Euromonitor International
23
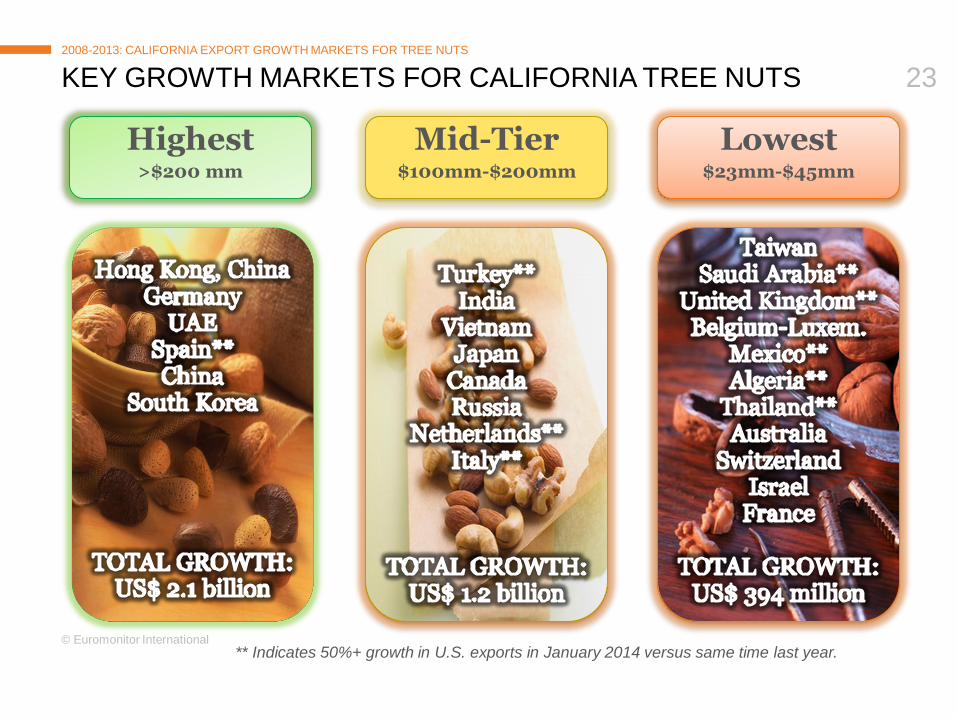
KEY GROWTH MARKETS FOR CALIFORNIA TREE NUTS
2008-2013: CALIFORNIA EXPORT GROWTH MARKETS FOR TREE NUTS
Mid-Tier $100mm-$200mm
Highest >$200 mm
Lowest $23mm-$45mm
** Indicates 50%+ growth in U.S. exports in January 2014 versus same time last year.
© Euromonitor International
24
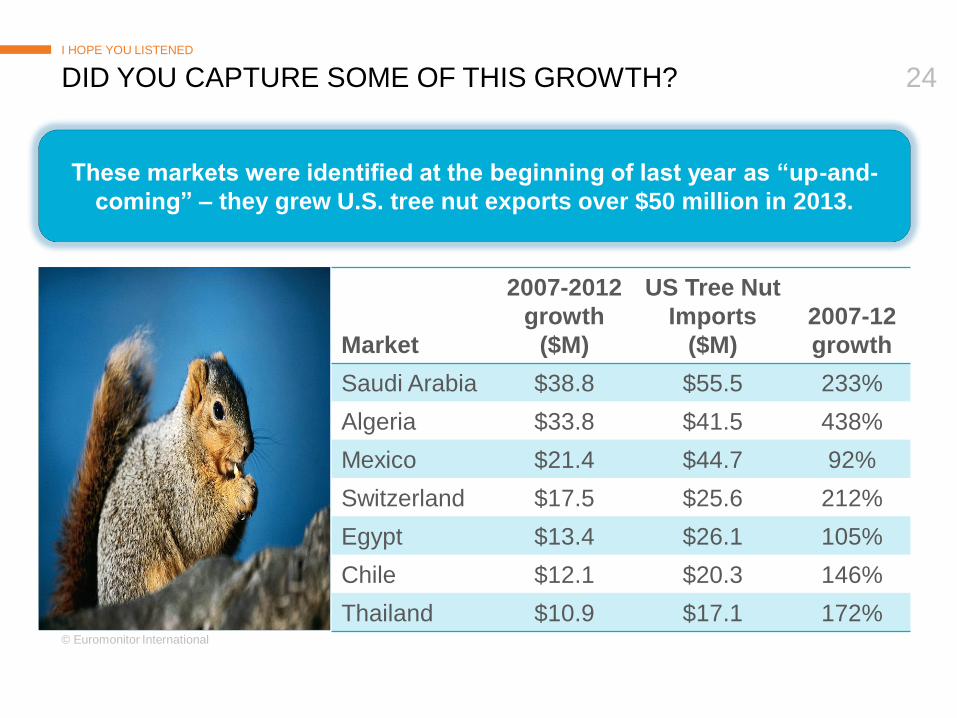
DID YOU CAPTURE SOME OF THIS GROWTH?
I HOPE YOU LISTENED
Market
2007-2012
growth
($M)
US Tree Nut
Imports
($M)
2007-12
growth
Saudi Arabia $38.8 $55.5 233%
Algeria $33.8 $41.5 438%
Mexico $21.4 $44.7 92%
Switzerland $17.5 $25.6 212%
Egypt $13.4 $26.1 105%
Chile $12.1 $20.3 146%
Thailand $10.9 $17.1 172%
These markets were identified at the beginning of last year as “up-and-
coming” – they grew U.S. tree nut exports over $50 million in 2013.
© Euromonitor International
25
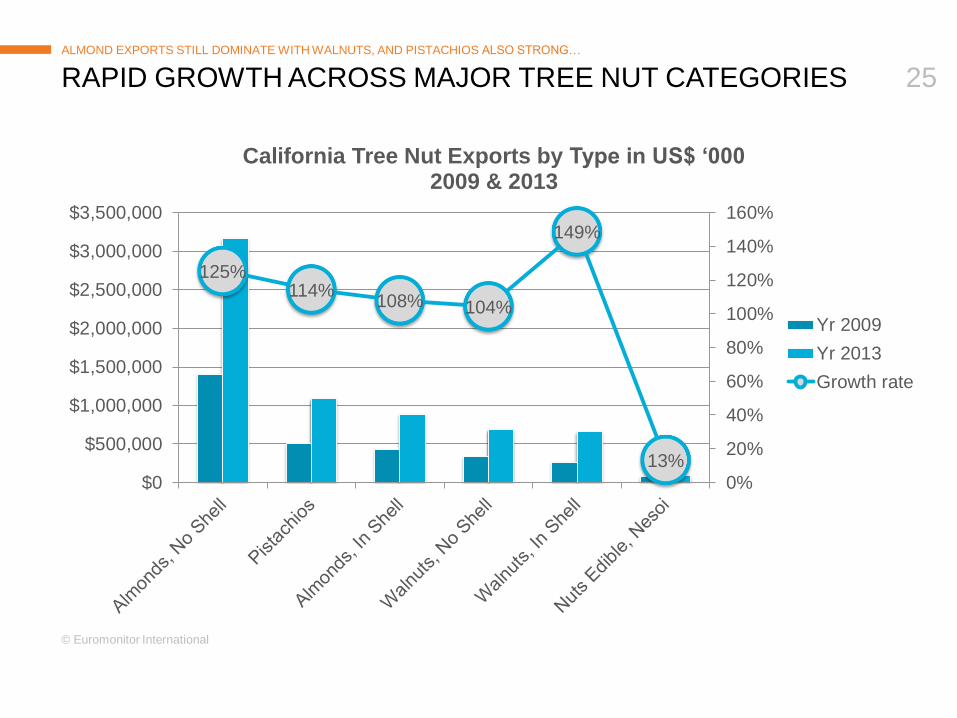
RAPID GROWTH ACROSS MAJOR TREE NUT CATEGORIES
ALMOND EXPORTS STILL DOMINATE WITH WALNUTS, AND PISTACHIOS ALSO STRONG…
125% 114%
108% 104%
149%
13%
0%
20%
40%
60%
80%
100%
120%
140%
160%
$0
$500,000
$1,000,000
$1,500,000
$2,000,000
$2,500,000
$3,000,000
$3,500,000
California Tree Nut Exports by Type in US$ ‘000 2009 & 2013
Yr 2009
Yr 2013
Growth rate
© Euromonitor International
26
WHAT’S HAPPENING IN DRIED FRUIT EXPORTS? PERFORMANCE OVERVIEW
© Euromonitor International
27
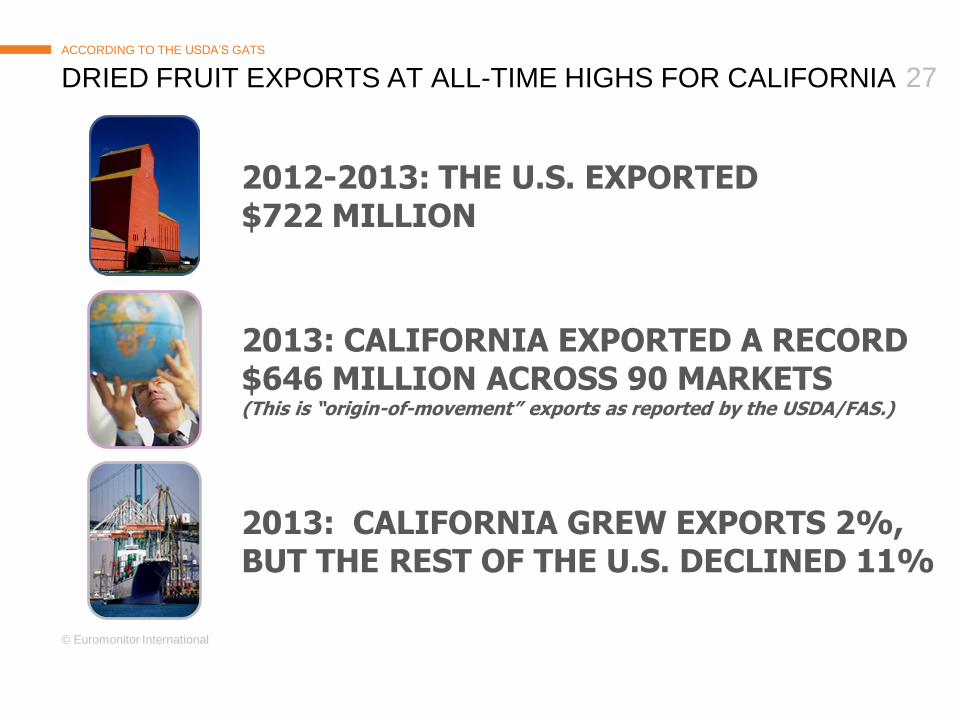
DRIED FRUIT EXPORTS AT ALL-TIME HIGHS FOR CALIFORNIA
ACCORDING TO THE USDA’S GATS
2013: CALIFORNIA EXPORTED A RECORD $646 MILLION ACROSS 90 MARKETS (This is “origin-of-movement” exports as reported by the USDA/FAS.)
2012-2013: THE U.S. EXPORTED $722 MILLION
2013: CALIFORNIA GREW EXPORTS 2%, BUT THE REST OF THE U.S. DECLINED 11%
© Euromonitor International
28
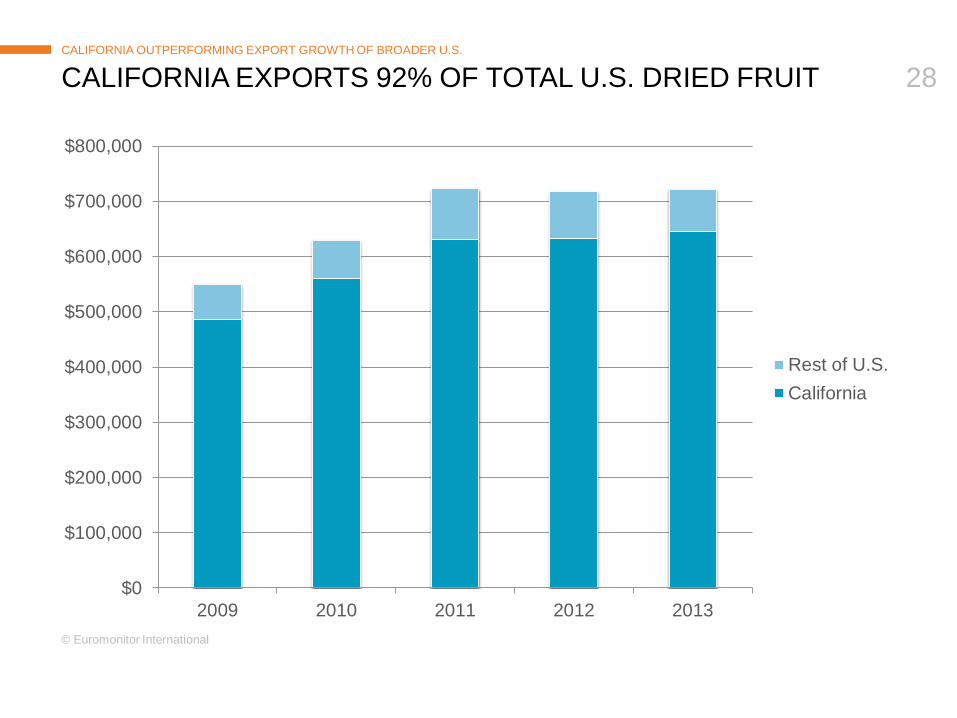
CALIFORNIA EXPORTS 92% OF TOTAL U.S. DRIED FRUIT
CALIFORNIA OUTPERFORMING EXPORT GROWTH OF BROADER U.S.
$0
$100,000
$200,000
$300,000
$400,000
$500,000
$600,000
$700,000
$800,000
2009 2010 2011 2012 2013
Rest of U.S.
California
© Euromonitor International
29
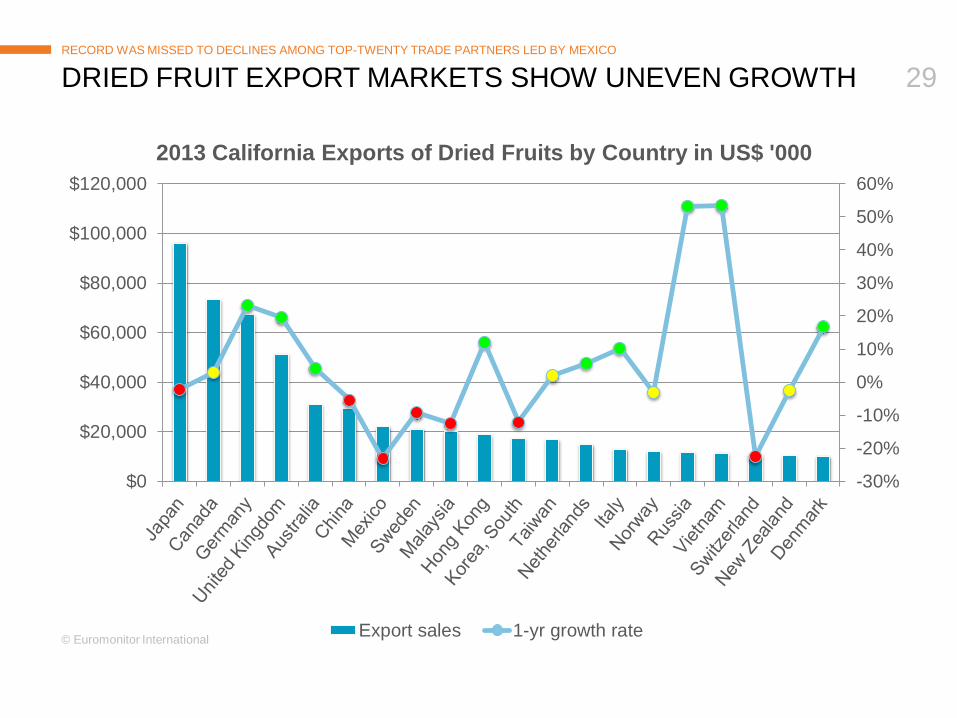
DRIED FRUIT EXPORT MARKETS SHOW UNEVEN GROWTH
RECORD WAS MISSED TO DECLINES AMONG TOP-TWENTY TRADE PARTNERS LED BY MEXICO
-30%
-20%
-10%
0%
10%
20%
30%
40%
50%
60%
$0
$20,000
$40,000
$60,000
$80,000
$100,000
$120,000
2013 California Exports of Dried Fruits by Country in US$ '000
Export sales 1-yr growth rate
© Euromonitor International
30
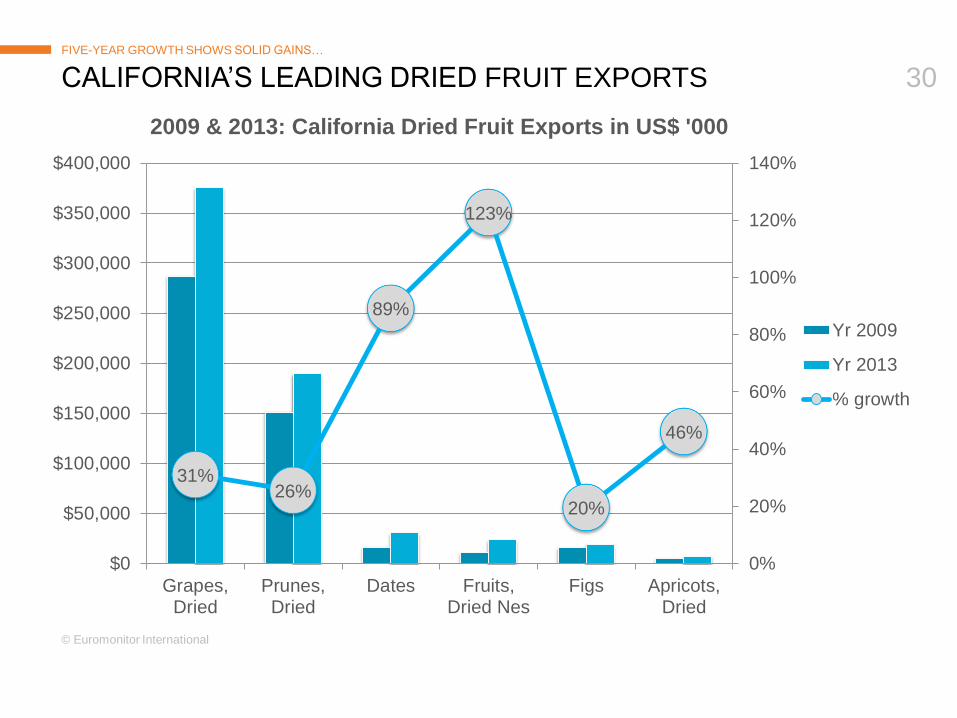
CALIFORNIA’S LEADING DRIED FRUIT EXPORTS FIVE-YEAR GROWTH SHOWS SOLID GAINS…
31% 26%
89%
123%
20%
46%
0%
20%
40%
60%
80%
100%
120%
140%
$0
$50,000
$100,000
$150,000
$200,000
$250,000
$300,000
$350,000
$400,000
Grapes,Dried
Prunes,Dried
Dates Fruits,Dried Nes
Figs Apricots,Dried
2009 & 2013: California Dried Fruit Exports in US$ '000
Yr 2009
Yr 2013
% growth
© Euromonitor International
31
WHAT ARE THE SIMILARITIES IN EXPORT PATTERNS? COMMONALITIES OF CALIFORNIA TREE NUTS AND DRIED FRUITS
© Euromonitor International
32
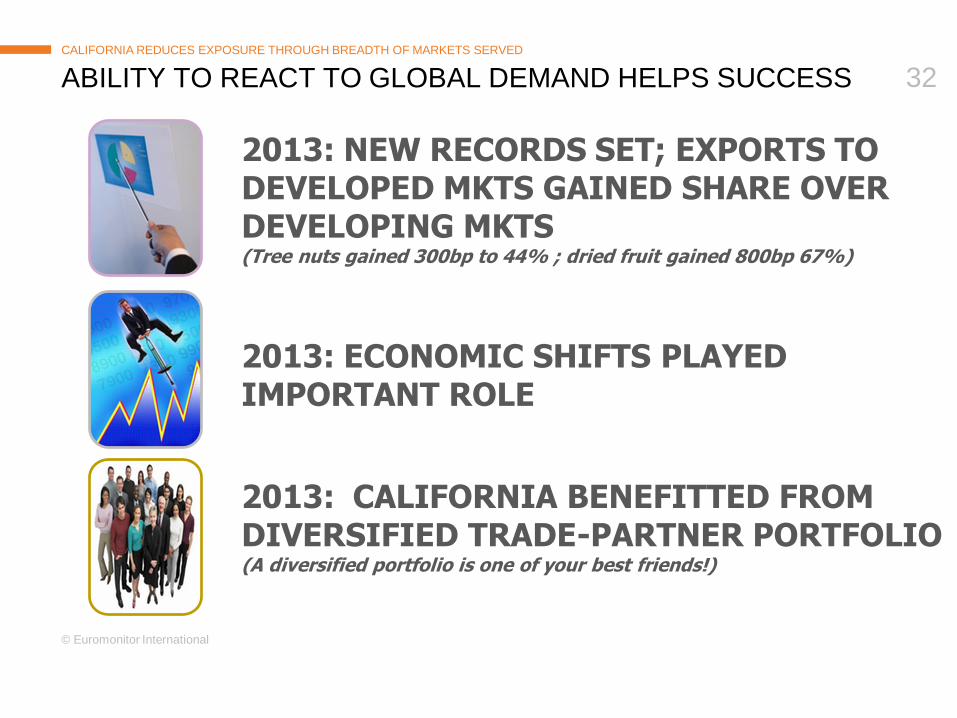
ABILITY TO REACT TO GLOBAL DEMAND HELPS SUCCESS
CALIFORNIA REDUCES EXPOSURE THROUGH BREADTH OF MARKETS SERVED
2013: CALIFORNIA BENEFITTED FROM DIVERSIFIED TRADE-PARTNER PORTFOLIO (A diversified portfolio is one of your best friends!)
2013: NEW RECORDS SET; EXPORTS TO DEVELOPED MKTS GAINED SHARE OVER DEVELOPING MKTS (Tree nuts gained 300bp to 44% ; dried fruit gained 800bp 67%)
2013: ECONOMIC SHIFTS PLAYED IMPORTANT ROLE
GLOBAL MERCHANDISE TRADE
DRIVERS, CONSTRAINTS & TRENDS
TREE NUT & DRIED FRUIT EXPORTS
FOOD CONSUMPTION TRENDS
RIDING THE GROWTH TRACK

© Euromonitor International
34
WHAT FOLLOWS IS AN IMPORTANT REMINDER A BRIEF FEW WORDS…
© Euromonitor International
35
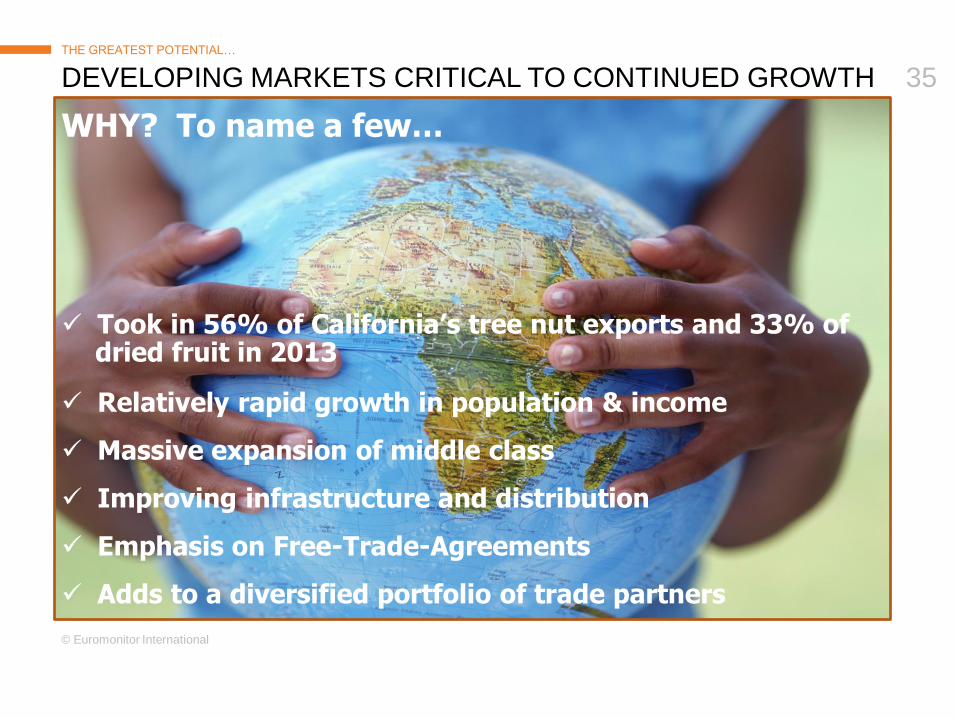
DEVELOPING MARKETS CRITICAL TO CONTINUED GROWTH THE GREATEST POTENTIAL…
WHY? To name a few…
Took in 56% of California’s tree nut exports and 33% of dried fruit in 2013
Relatively rapid growth in population & income
Massive expansion of middle class
Improving infrastructure and distribution
Emphasis on Free-Trade-Agreements
Adds to a diversified portfolio of trade partners
© Euromonitor International
36
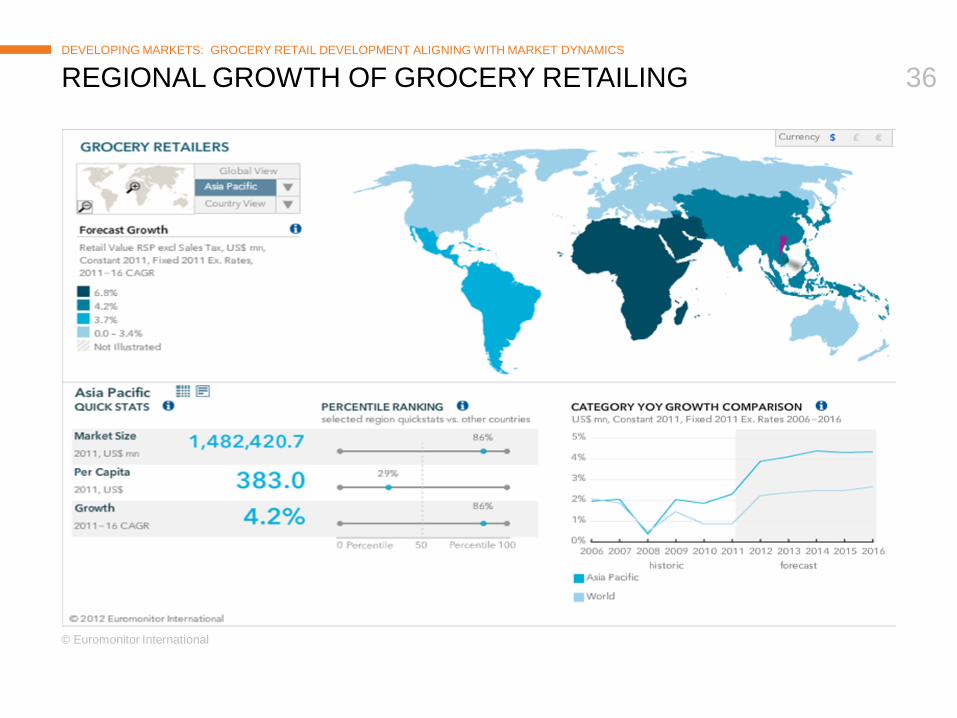
REGIONAL GROWTH OF GROCERY RETAILING
DEVELOPING MARKETS: GROCERY RETAIL DEVELOPMENT ALIGNING WITH MARKET DYNAMICS
© Euromonitor International
37
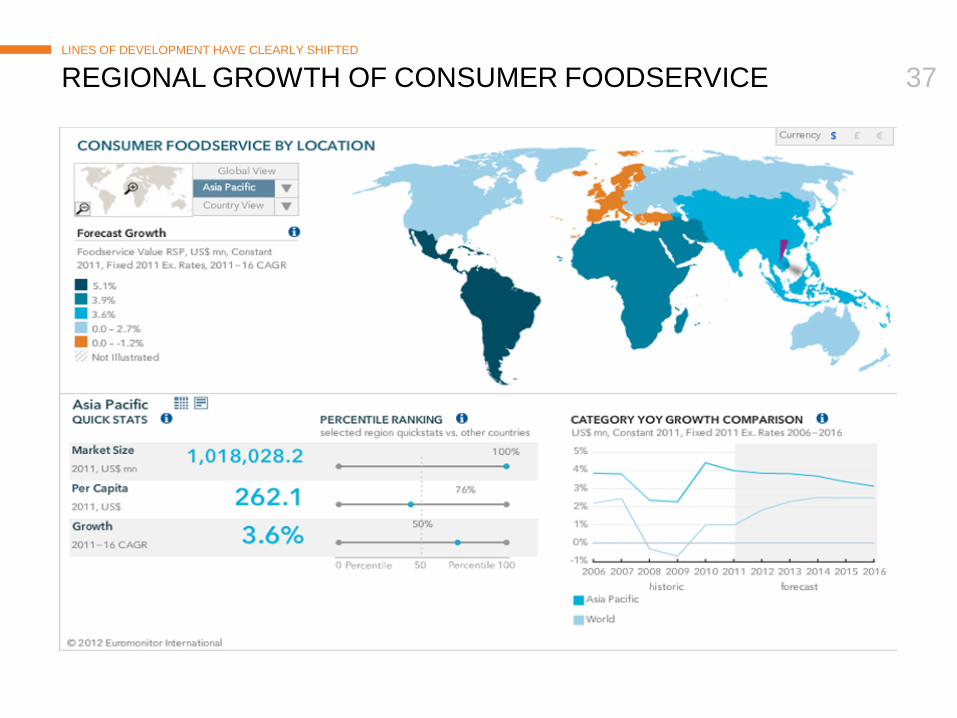
REGIONAL GROWTH OF CONSUMER FOODSERVICE
LINES OF DEVELOPMENT HAVE CLEARLY SHIFTED
© Euromonitor International
38
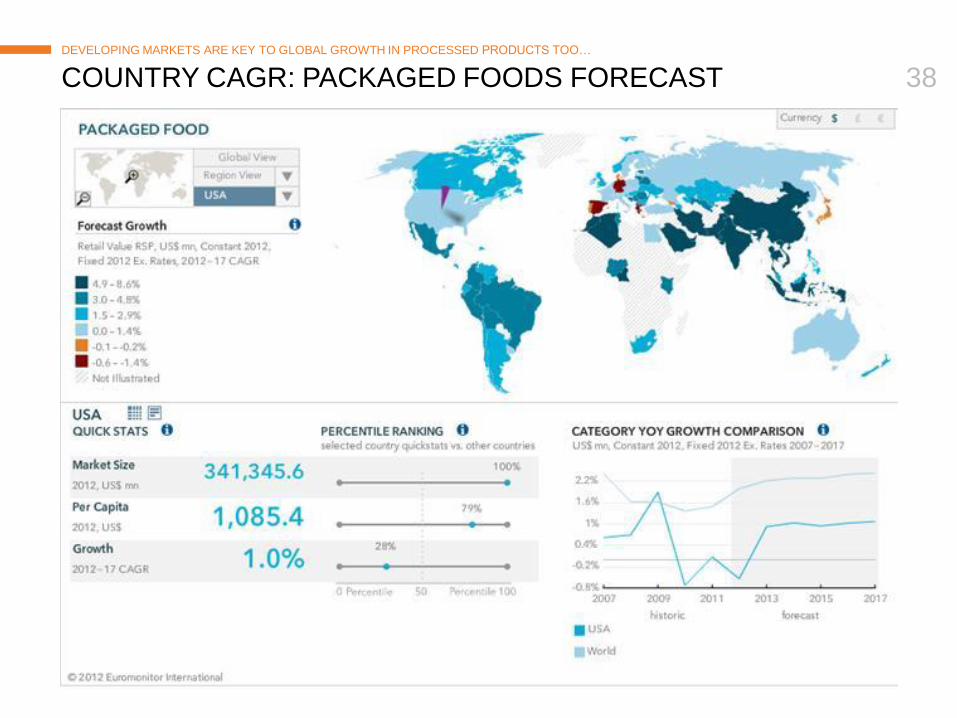
COUNTRY CAGR: PACKAGED FOODS FORECAST DEVELOPING MARKETS ARE KEY TO GLOBAL GROWTH IN PROCESSED PRODUCTS TOO…
© Euromonitor International
39
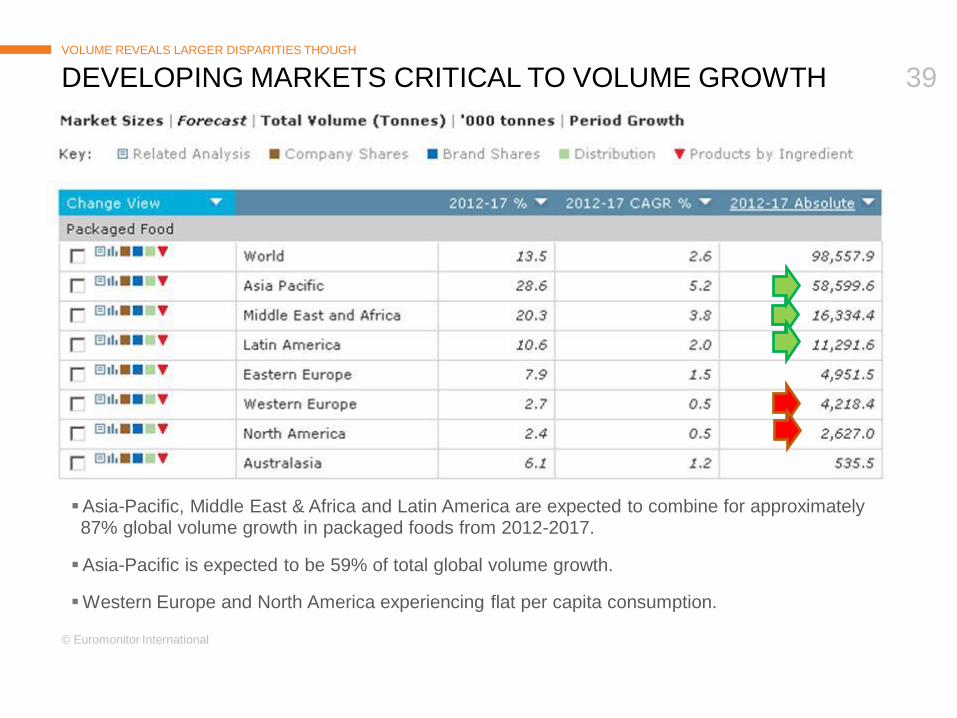
DEVELOPING MARKETS CRITICAL TO VOLUME GROWTH VOLUME REVEALS LARGER DISPARITIES THOUGH
Asia-Pacific, Middle East & Africa and Latin America are expected to combine for approximately 87% global volume growth in packaged foods from 2012-2017.
Asia-Pacific is expected to be 59% of total global volume growth.
Western Europe and North America experiencing flat per capita consumption.
© Euromonitor International
40
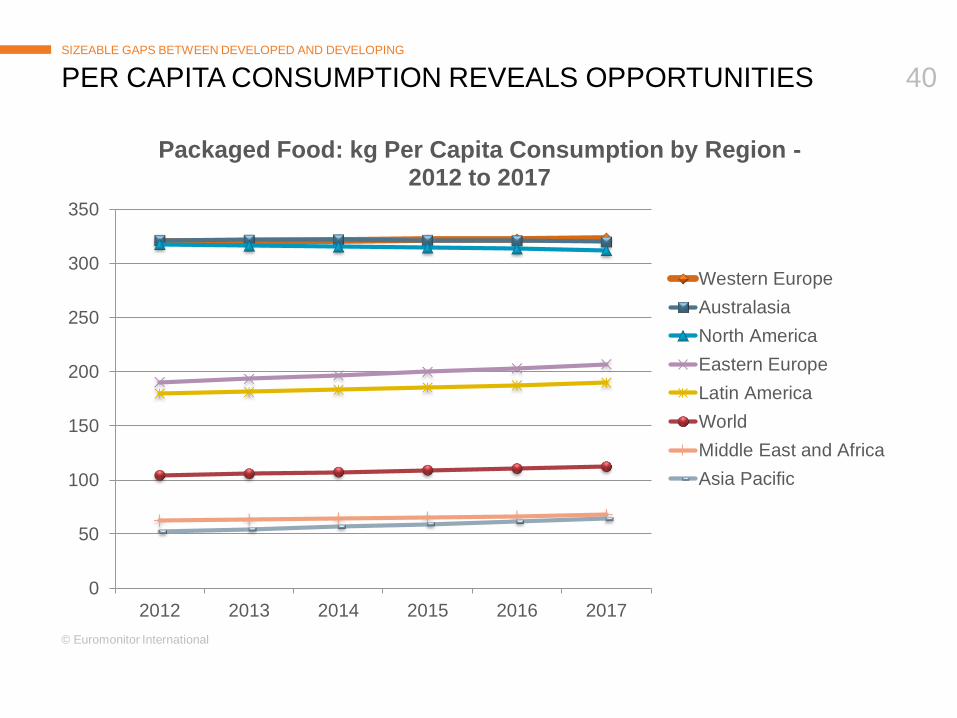
PER CAPITA CONSUMPTION REVEALS OPPORTUNITIES
SIZEABLE GAPS BETWEEN DEVELOPED AND DEVELOPING
0
50
100
150
200
250
300
350
2012 2013 2014 2015 2016 2017
Packaged Food: kg Per Capita Consumption by Region - 2012 to 2017
Western Europe
Australasia
North America
Eastern Europe
Latin America
World
Middle East and Africa
Asia Pacific
© Euromonitor International
41
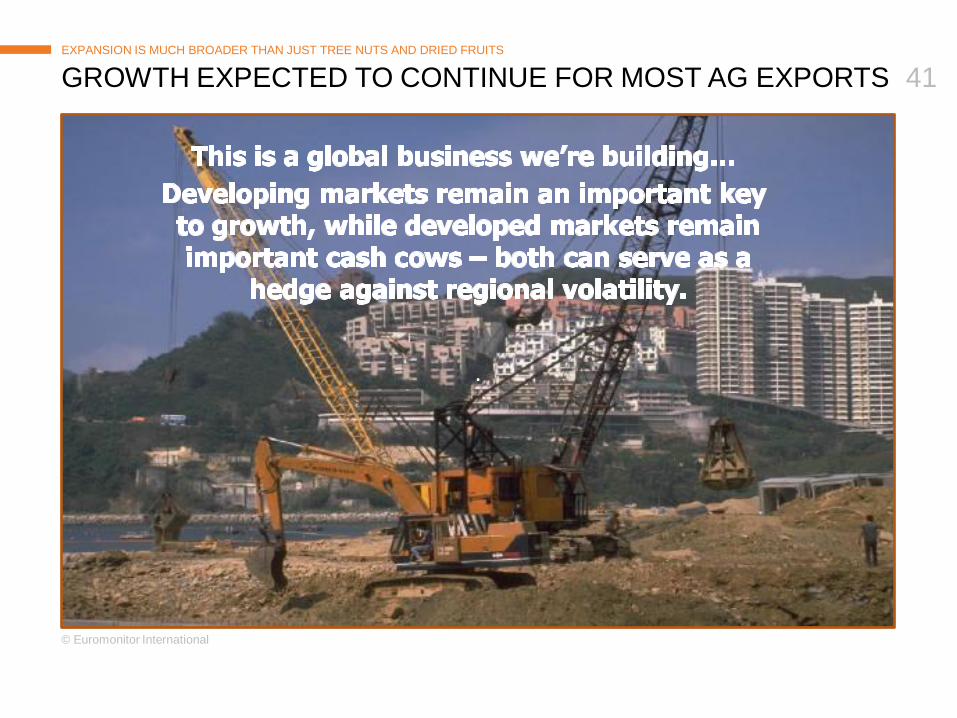
GROWTH EXPECTED TO CONTINUE FOR MOST AG EXPORTS EXPANSION IS MUCH BROADER THAN JUST TREE NUTS AND DRIED FRUITS
.

GLOBAL MERCHANDISE TRADE
DRIVERS, CONSTRAINTS & TRENDS
TREE NUT & DRIED FRUIT EXPORTS
FOOD CONSUMPTION TRENDS
RIDING THE GROWTH TRACK
© Euromonitor International
43
RISKS AND MITIGATION…
LET’S TALK…
Supply/service disruptions (we need water or a better way forward…preferably both)
Tariff and non-tariff trade barriers
Food safety
Maximizing return to growers / producers
© Euromonitor International
44
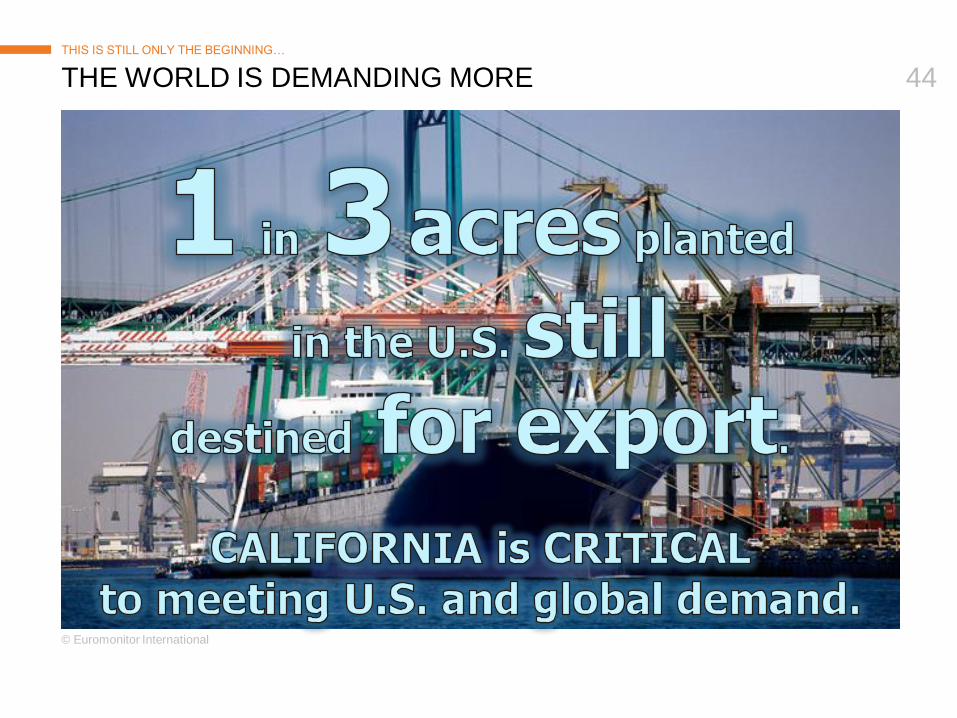
THE WORLD IS DEMANDING MORE
THIS IS STILL ONLY THE BEGINNING…

© Euromonitor International
45
CAPTURING GREATER GROWTH
KEY STEPS
EXPLORE & EXPAND EXPORTING
KEEP MOVING FORWARD
DON’T GO IT ALONE – GET HELP TO AVOID MISTAKES
© Euromonitor International
46
PARTNERS & RESOURCES IMPORTANT GROUPS TO KNOW…
These resources are here to help. Contact them to understand the
services they offer to support your business and export growth.

© Euromonitor International
47
THANK YOU FOR LISTENING
Matt Tripodi Government & Trade Relations Manager Tel: +1 312-922-1115 ext. 8205 Email: [email protected]
Related Documents