CapitalVue Research Analytics China A Shares Recap and Sector Performance – 2Q2013 A Shares 2Q13 recap: industrials, financials tumble; health care and tech outperform Tech-heavy Chinext Index rose 17% in 2Q, while CSI 300 fell 12%. Stock market turnover fell in Shanghai but rose in Shenzhen. P/E ratios in Shanghai hit historic low; Shenzhen down slightly. Aggregate stock market performance and valuations for 84 industries Key Data : SSE, SZSE, CSI, CapitalVue 1 A select sample brought to you by [email protected] Authors: Sean Li, Elias Glenn

CapitalVue China Stock Market Wrap - 2Q2013
Jul 18, 2015
Welcome message from author
This document is posted to help you gain knowledge. Please leave a comment to let me know what you think about it! Share it to your friends and learn new things together.
Transcript

CapitalVue Research Analytics
China A Shares Recap and Sector Performance – 2Q2013
A Shares 2Q13 recap: industrials, financials tumble;
health care and tech outperform
Tech-heavy Chinext Index rose 17% in 2Q, while CSI 300 fell 12%.
Stock market turnover fell in Shanghai but rose in Shenzhen.
P/E ratios in Shanghai hit historic low; Shenzhen down slightly.
Aggregate stock market performance and valuations for 84 industries
Key Data : SSE, SZSE, CSI, CapitalVue
1
A select sample brought to you by [email protected]
Authors: Sean Li, Elias Glenn
7/9/2013 [email protected] 2
June Chg from March
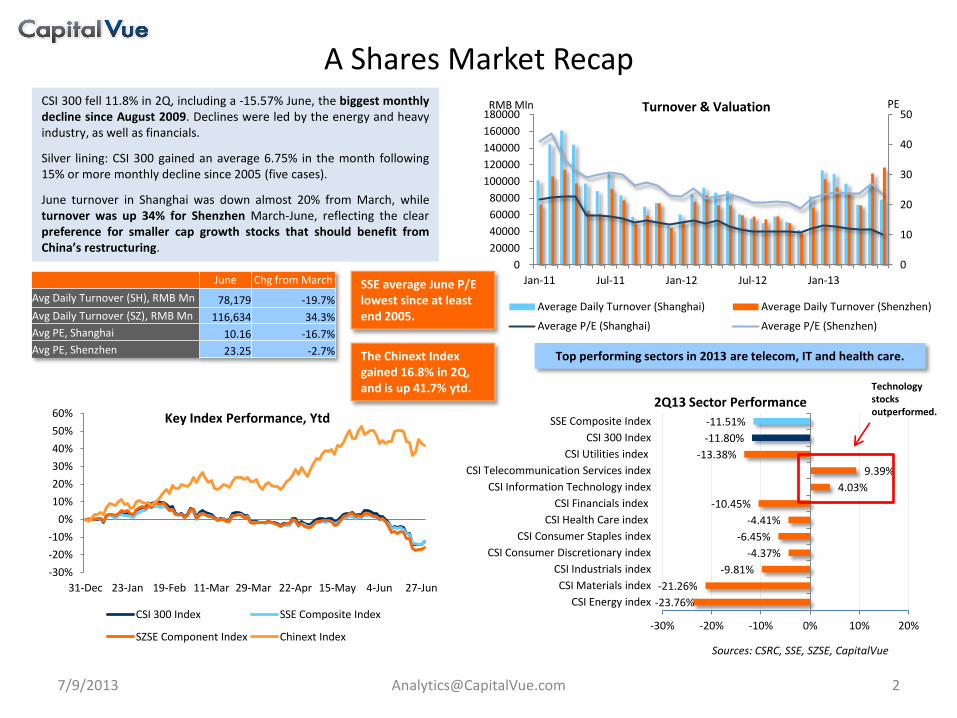
Avg Daily Turnover (SH), RMB Mn 78,179 -19.7%
Avg Daily Turnover (SZ), RMB Mn 116,634 34.3%
Avg PE, Shanghai 10.16 -16.7%
Avg PE, Shenzhen 23.25 -2.7%
CSI 300 fell 11.8% in 2Q, including a -15.57% June, the biggest monthly decline since August 2009. Declines were led by the energy and heavy industry, as well as financials.
Silver lining: CSI 300 gained an average 6.75% in the month following 15% or more monthly decline since 2005 (five cases).
June turnover in Shanghai was down almost 20% from March, while turnover was up 34% for Shenzhen March-June, reflecting the clear preference for smaller cap growth stocks that should benefit from China’s restructuring.
Sources: CSRC, SSE, SZSE, CapitalVue
A Shares Market Recap
0
10
20
30
40
50
0
20000
40000
60000
80000
100000
120000
140000
160000
180000
Jan-11 Jul-11 Jan-12 Jul-12 Jan-13
Turnover & Valuation
Average Daily Turnover (Shanghai) Average Daily Turnover (Shenzhen)
Average P/E (Shanghai) Average P/E (Shenzhen)
RMB Mln PE
-23.76%
-21.26%
-9.81%
-4.37%
-6.45%
-4.41%
-10.45%
4.03%
9.39%
-13.38%
-11.80%
-11.51%
-30% -20% -10% 0% 10% 20%
CSI Energy index
CSI Materials index
CSI Industrials index
CSI Consumer Discretionary index
CSI Consumer Staples index
CSI Health Care index
CSI Financials index
CSI Information Technology index
CSI Telecommunication Services index
CSI Utilities index
CSI 300 Index
SSE Composite Index
2Q13 Sector Performance
SSE average June P/E lowest since at least end 2005.
Technology stocks outperformed.
Top performing sectors in 2013 are telecom, IT and health care.
-30%
-20%
-10%
0%
10%
20%
30%
40%
50%
60%
31-Dec 23-Jan 19-Feb 11-Mar 29-Mar 22-Apr 15-May 4-Jun 27-Jun
Key Index Performance, Ytd
CSI 300 Index SSE Composite Index
SZSE Component Index Chinext Index
The Chinext Index gained 16.8% in 2Q, and is up 41.7% ytd.

7/9/2013 [email protected] 3
Notes to sector performance tables: 1. Sub-industries are shown indented from their parent industry. 3. Stock market performance is for 2Q13. PE and PB are based on 1Q13 earnings and 2Q closing stock price.
Consumer discretionary stocks have outperformed the broad market, led by a 22.3% gain for media stocks in 2Q. The Chinese government has made development of media industries a major pillar in its restructuring strategy.
Consumer Discretionary
Sector Co.(#) 2Q13 Chg Gainers Decliners 2Q13 Market Cap (RMB Bln) PE (end of 2Q13) PB (end of 2Q13)
Consumer Discretionary 428 -4.13% 111 310 2,260.16 18.01 1.95
Automobiles & Components 100 -3.51% 32 66 780.77 13.79 1.63
Auto Components 72 -9.05% 22 49 264.28 16.41 1.76
Automobiles 28 -0.40% 10 17 516.49 12.60 1.56
Consumer Durables & Apparel 184 -7.34% 40 142 737.92 20.89 2.13
Household Durables 66 -4.66% 20 45 372.88 16.06 2.26
Leisure Equipment & Products 18 5.79% 5 12 50.63 68.11 3.90
Textiles, Apparel & Luxury Goods 100 -12.04% 15 85 314.41 30.64 1.87
Consumer Services 34 -9.02% 6 27 163.45 16.66 2.66
Hotels, Restaurants & Leisure 30 -13.13% 4 26 135.27 15.89 2.61
Diversified Consumer Services 4 17.71% 2 1 28.18 28.95 3.23
Media 30 22.29% 23 6 272.89 37.58 3.05
Retailing 80 -12.59% 10 69 305.14 17.12 1.66
Distributors 20 -10.00% 1 19 76.48 19.51 1.55
Multiline Retail 45 -13.37% 7 37 135.05 16.43 1.91
Specialty Retail 15 -13.51% 2 13 93.61 16.06 1.44
7/9/2013 [email protected] 4
Consumer Staples, Energy
Sector Co.(#) 2Q13 Chg Gainers Decliners 2Q13 Market Cap (RMB Bln) PE (end of 2Q13) PB (end of 2Q13)
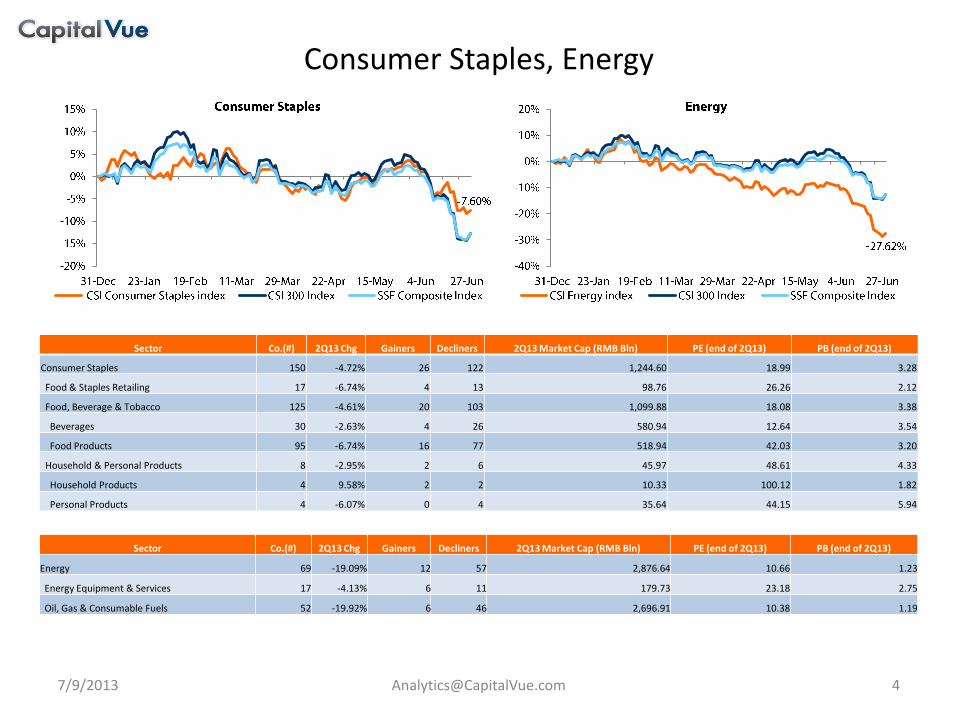
Consumer Staples 150 -4.72% 26 122 1,244.60 18.99 3.28
Food & Staples Retailing 17 -6.74% 4 13 98.76 26.26 2.12
Food, Beverage & Tobacco 125 -4.61% 20 103 1,099.88 18.08 3.38
Beverages 30 -2.63% 4 26 580.94 12.64 3.54
Food Products 95 -6.74% 16 77 518.94 42.03 3.20
Household & Personal Products 8 -2.95% 2 6 45.97 48.61 4.33
Household Products 4 9.58% 2 2 10.33 100.12 1.82
Personal Products 4 -6.07% 0 4 35.64 44.15 5.94
Sector Co.(#) 2Q13 Chg Gainers Decliners 2Q13 Market Cap (RMB Bln) PE (end of 2Q13) PB (end of 2Q13)
Energy 69 -19.09% 12 57 2,876.64 10.66 1.23
Energy Equipment & Services 17 -4.13% 6 11 179.73 23.18 2.75
Oil, Gas & Consumable Fuels 52 -19.92% 6 46 2,696.91 10.38 1.19

7/9/2013 [email protected] 5
Financials, Health Care
Sector Co.(#) 2Q13 Chg Gainers Decliners 2Q13 Market Cap (RBM Bln) PE (end of 2Q13) PB (end of 2Q13)
Financials 174 -9.42% 38 132 8,091.69 7.42 1.20
Commercial Banks 16 -8.46% 1 15 5,689.82 5.40 1.02
Capital Markets 21 -13.25% 3 18 655.17 32.87 1.64
Insurance 4 -15.81% 1 3 883.55 19.00 1.63
Real Estate Management & Development 133 -5.36% 33 96 863.15 12.43 1.66
Sector Co.(#) 2Q13 Chg Gainers Decliners 2Q13 Total Market Cap PE (end of 2Q13) PB (end of 2Q13)
Health Care 188 -2.83% 69 117 1,326.46 35.21 3.94
Health Care Equipment & Services 28 0.37% 14 14 174.40 36.24 3.18
Health Care Equipment & Supplies 21 4.94% 10 11 102.29 44.27 4.65
Health Care Providers & Services 6 -8.64% 3 3 59.45 24.31 1.94
Pharmaceuticals, Biotechnology & Life Sciences 160 -3.30% 55 103 1,152.06 35.08 4.06
Biotechnology 29 -4.58% 12 16 119.13 50.30 4.70
Pharmaceuticals 131 -3.15% 43 87 1,032.93 33.91 4.00

7/9/2013 [email protected] 6
Industrials
The CSI Industrials Index fell 10.51% in 2Q13, in line with the broader market. Transportation stocks, a bellwether for the overall economy, fell 15.9%, including 19% decline for airline stocks.
Sector Co.(#) 2Q13 Chg Gainers Decliners 2Q13 Market Cap (RMB Bln) PE (end of 2Q13) PB (end of 2Q13)
Industrials 570 -9.26% 148 419 3,539.10 19.66 1.54
Capital Goods 448 -7.97% 128 318 2,577.80 20.43 1.69
Aerospace & Defense 10 -6.01% 2 8 88.91 63.58 3.00
Building Products 22 -6.40% 6 16 77.99 33.62 2.04
Construction & Engineering 51 -8.81% 11 40 638.47 11.48 1.19
Electrical Equipment 146 -2.65% 56 90 627.34 41.29 2.08
Industrial Conglomerates 36 -3.00% 9 27 229.59 26.47 2.82
Machinery 179 -12.34% 42 135 894.40 20.96 1.64
Trading Companies & Distributors 4 -1.88% 2 2 21.11 -252.95 2.57
Commercial & Professional Services 39 2.55% 14 25 204.04 43.75 3.95
Commercial Services & Supplies 37 2.27% 13 24 196.02 43.54 3.99
Professional Services 2 9.81% 1 1 8.02 54.14 2.91
Transportation 83 -15.90% 6 76 757.25 15.92 1.10
Air Freight & Logistics 7 -6.73% 1 6 17.44 19.27 1.75
Airlines 4 -18.85% 0 4 140.22 11.14 1.03
Marine 16 -20.09% 0 15 123.89 -11.98 1.08
Road & Rail 15 -16.99% 3 12 162.79 9.82 1.23
Transportation Infrastructure 41 -12.54% 2 39 312.91 11.00 1.04

7/9/2013 [email protected] 7
Information Technology, Materials
Sector Co.(#) 2Q13 Chg Gainers Decliners 2Q13 Total Market Cap PE (end of 2Q13) PB (end of 2Q13)
Materials 440 -15.85% 73 364 2,384.41 55.64 1.51
Chemicals 215 -9.30% 41 174 893.80 50.35 2.06
Construction Materials 51 -16.11% 8 43 284.53 23.42 1.68
Containers & Packaging 23 -1.93% 7 16 77.70 35.83 1.67
Metals & Mining 120 -22.00% 11 107 1,040.23 93.42 1.24
Paper & Forest Products 31 -8.22% 6 24 88.16 88.03 1.57
Sector Co.(#) 2Q13 Chg Gainers Decliners 2Q13 Market Cap (RMB Bln) PE (end of 2Q13) PB (end of 2Q13)
Information Technology 365 8.46% 196 164 1,685.49 65.90 3.12
Software & Services 104 17.94% 70 32 432.11 46.36 3.86
Internet Software & Services 16 48.29% 15 1 94.86 58.72 5.23
IT Services 36 11.16% 23 11 133.13 46.25 3.13
Software 52 11.75% 32 20 204.12 43.19 4.23
Technology Hardware & Equipment 234 5.11% 113 118 1,143.11 58.54 2.97
Communications Equipment 57 7.79% 31 25 229.71 138.56 2.44
Computers & Peripherals 17 -3.09% 7 10 86.68 30.63 1.82
Electronic Equipment, Instruments & Components 158 5.31% 74 82 824.63 54.78 3.48
Office Electronics 2 5.90% 1 1 2.09 27.83 1.71
Semiconductors & Semiconductor Equipment 27 10.23% 13 14 110.27 -39.93 2.58
7/9/2013 [email protected] 8
Telecom, Utilities
Sector Co.(#) 2Q13 Chg Gainers Decliners 2Q13 Market Cap (RMB Bln) PE at the end of 2Q13 PB at the end of 2Q13
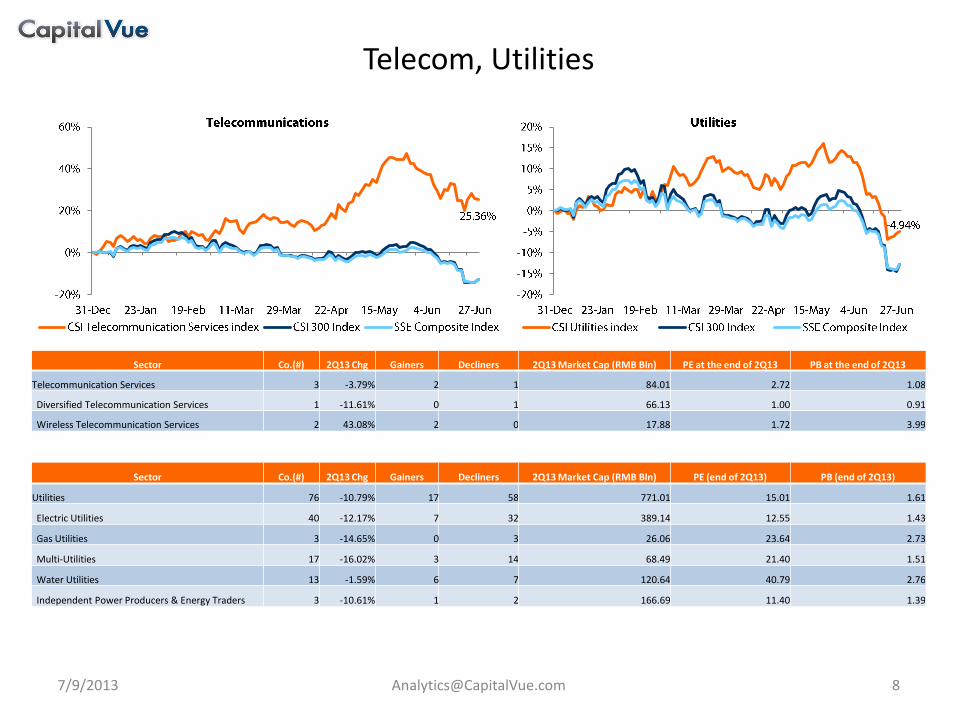
Telecommunication Services 3 -3.79% 2 1 84.01 2.72 1.08
Diversified Telecommunication Services 1 -11.61% 0 1 66.13 1.00 0.91
Wireless Telecommunication Services 2 43.08% 2 0 17.88 1.72 3.99
Sector Co.(#) 2Q13 Chg Gainers Decliners 2Q13 Market Cap (RMB Bln) PE (end of 2Q13) PB (end of 2Q13)
Utilities 76 -10.79% 17 58 771.01 15.01 1.61
Electric Utilities 40 -12.17% 7 32 389.14 12.55 1.43
Gas Utilities 3 -14.65% 0 3 26.06 23.64 2.73
Multi-Utilities 17 -16.02% 3 14 68.49 21.40 1.51
Water Utilities 13 -1.59% 6 7 120.64 40.79 2.76
Independent Power Producers & Energy Traders 3 -10.61% 1 2 166.69 11.40 1.39

Click to access related data on CapitalVue Terminal (subscription required)
9
For more information:
www.capitalvue.com
CSI 300 Index: link Shanghai Composite Index: link Shenzhen Component Index: link A shares trading volume: link A shares turnover: link Average daily A shares turnover: link Average daily turnover (Shanghai): link Average P/E (Shanghai): link Average daily turnover (Shenzhen): link Average P/E (Shenzhen): link Total A shares market cap: link IPO fundraising: link Follow-on fundraising: link Private placement fundraising: link
Sector summary pages: Consumer Discretionary: link Consumer Staples: link Energy: link Financials: link Health Care: link Industrials: link Information Technology: link Materials: link Telecommunication Services: link Utilities: link
Related Documents