Capitals What are the “capitals” which sustain our business?

Welcome message from author
This document is posted to help you gain knowledge. Please leave a comment to let me know what you think about it! Share it to your friends and learn new things together.
Transcript

CapitalsWhat are the “capitals” which sustain our business?

Manufactured Capital – our assets and investments
CLP’s manufactured capital comprises the generating plant and transmission network in which we have invested and which is
available to produce and carry electricity to our off-takers and customers. These assets, owned entirely by CLP or in joint venture,
are held through the Group structure outlined below. In the following pages we describe the physical assets themselves.
Wind
CLP 100%
Conventional Generation atJhajjar and Paguthan
CLP 100%
CLP Power Hong KongTransmission, Distribution andCustomer Service
CLP 100%
CAPCO
ExxonMobil EnergyLimited
Nuclear Power at Daya Bay
CLP25%
Guangdong Nuclear Investment Company, Ltd. 75%
Coal-�red Ho-Ping in Taiwan
CLP20%
Mitsubishi Corporation andTaiwan Cement Corporation 80%
Solar Power in Thailand
CLP33%
Mitsubishi Corporationand EGCO 67%
Chinese Mainland IndiaAustralia Southeast Asia and TaiwanHong Kong
CLP Holdings
EnergyAustralia Generation, Electricity and Gas Retail, Gas Storage
CLP 100%
Wind
Wholly-owned
Minority JointVentures
CGN Wind Joint Ventures
CLP 32%*
*15.75% as from January 2013
CGN Wind Energy Ltd 68%
Coal-�red Generation
Minority Joint Ventures
Coal-�red Fangchenggang
Majority owned
Hydro and Biomass
Majority owned
60%CLP40%
CLP Holdings 2012 Annual Report 65

66 CLP Holdings 2012 Annual Report
On31December2012CLPcomprisedover70assets,...
Assets in which CLP has a majority shareholding and / or operational control
Assets in which CLP has no majority shareholding and / or operational control
Tallawarra
Iona
Hallett
Shenzhen – China
Castle Peak
Penny’s Bay
Kowloon
Black PointCLP PowerHong Kong
Lantau Island
New Territories
Samana I
Samana II
Mahidad
Khandke
HarapanahalliTheni I
Theni II
India
Jhajjar
Laizhou
Shandong Huaneng
Shandong Guohua
HPC
Jiangbian
Yang_er
Shenmu
PSDC
Huaiji
Nanao II & IIIFangchenggang
GNPJVC
SZPC
Boxing
Penglai I
Changling II
Shanghai Chongming
CLP–CWP
Jilin Datang
CSEC Guohua
CGN
NEDPaguthan
Qian’an I & II
29
23
1
4
17
3
2
7
14
Cathedral Rocks
NewportYallourn
Narrabri
Queensland coal seammethane tenements
Delta Western GenTrader
Waterloo
Jeeralang
Andhra Lake
Saundatti
China
Thailand
Australia
Taiwan
Wind power
Hydro power
Biomass power
Nuclear power
Coal power
Gas power
Solar power
100%
40%
Equity Interest
Australia Investments Gross / Equity MW
Hong Kong Investments
Equity Interest
100%
Equity Interest
Southeast Asia and Taiwan Investments Gross / Equity MW
India Investments Gross / Equity MW
Equity Interest
100%
79%
100%
17
18
19
20
21
22
23
24
25
26
27
28
29
30
3149%
84.9%
30
25
26
26
Bhakrani
Tejuva
Sipla
26
26
26
28
25
26
26
2726
24
Yermala2626
29 29
29
Pine Dale2929
Wilga Park
29
29
2929
29
29
20
18
5
19
9 20%
33.3%
100%
100%
100%
100%
100%
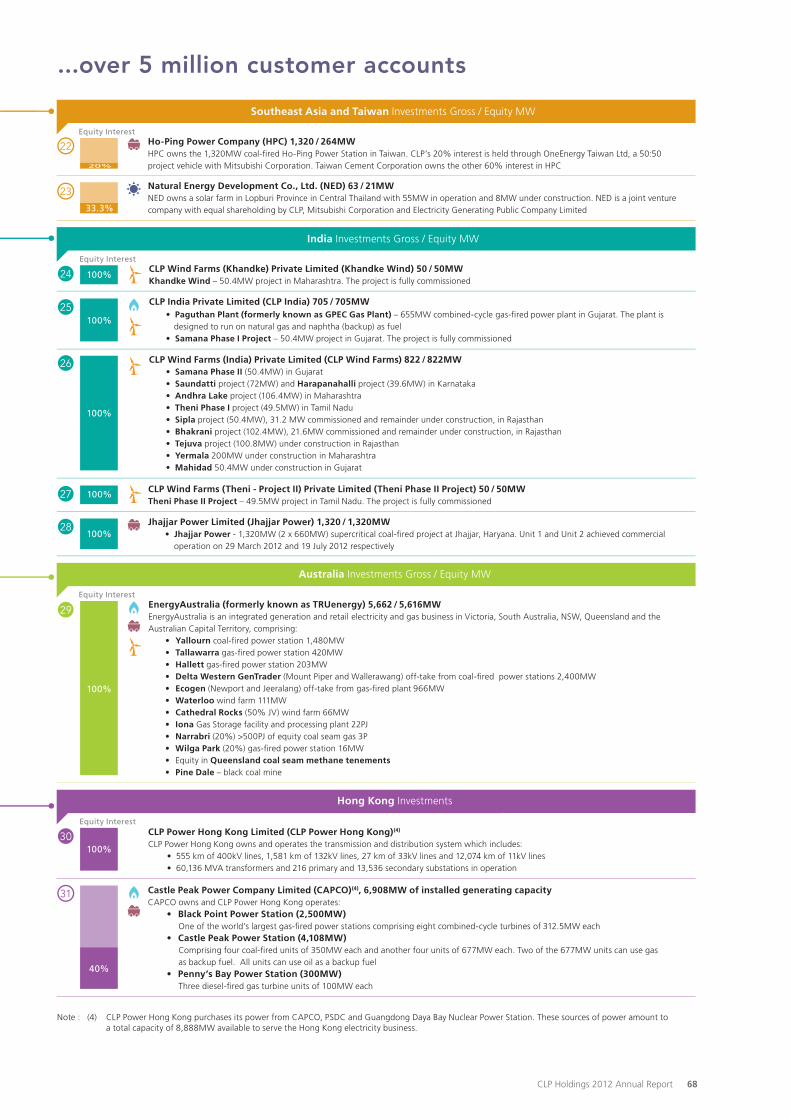
CLP Power Hong Kong Limited (CLP Power Hong Kong)(4)
CLP Power Hong Kong owns and operates the transmission and distribution system which includes:• 555 km of 400kV lines, 1,581 km of 132kV lines, 27 km of 33kV lines and 12,074 km of 11kV lines• 60,136 MVA transformers and 216 primary and 13,536 secondary substations in operation
Castle Peak Power Company Limited (CAPCO)(4), 6,908MW of installed generating capacityCAPCO owns and CLP Power Hong Kong operates:
• Black Point Power Station (2,500MW)One of the world’s largest gas-�red power stations comprising eight combined-cycle turbines of 312.5MW each
• Castle Peak Power Station (4,108MW)Comprising four coal-�red units of 350MW each and another four units of 677MW each. Two of the 677MW units can use gas as backup fuel. All units can use oil as a backup fuel
• Penny’s Bay Power Station (300MW)Three diesel-�red gas turbine units of 100MW each
Note : (4) CLP Power Hong Kong purchases its power from CAPCO, PSDC and Guangdong Daya Bay Nuclear Power Station. These sources of power amount to a total capacity of 8,888MW available to serve the Hong Kong electricity business.
EnergyAustralia (formerly known as TRUenergy) 5,662 / 5,616MWEnergyAustralia is an integrated generation and retail electricity and gas business in Victoria, South Australia, NSW, Queensland and the Australian Capital Territory, comprising:
• Yallourn coal-�red power station 1,480MW• Tallawarra gas-�red power station 420MW• Hallett gas-�red power station 203MW • Delta Western GenTrader (Mount Piper and Wallerawang) off-take from coal-�red power stations 2,400MW • Ecogen (Newport and Jeeralang) off-take from gas-�red plant 966MW• Waterloo wind farm 111MW • Cathedral Rocks (50% JV) wind farm 66MW • Iona Gas Storage facility and processing plant 22PJ• Narrabri (20%) >500PJ of equity coal seam gas 3P• Wilga Park (20%) gas-�red power station 16MW• Equity in Queensland coal seam methane tenements• Pine Dale – black coal mine
CLP India Private Limited (CLP India) 705 / 705MW• Paguthan Plant (formerly known as GPEC Gas Plant) – 655MW combined-cycle gas-fired power plant in Gujarat. The plant is designed to run on natural gas and naphtha (backup) as fuel• Samana Phase I Project – 50.4MW project in Gujarat. The project is fully commissioned
CLP Wind Farms (Khandke) Private Limited (Khandke Wind) 50 / 50MWKhandke Wind – 50.4MW project in Maharashtra. The project is fully commissioned
CLP Wind Farms (India) Private Limited (CLP Wind Farms) 822 / 822MW• Samana Phase II (50.4MW) in Gujarat• Saundatti project (72MW) and Harapanahalli project (39.6MW) in Karnataka• Andhra Lake project (106.4MW) in Maharashtra• Theni Phase I project (49.5MW) in Tamil Nadu• Sipla project (50.4MW), 31.2 MW commissioned and remainder under construction, in Rajasthan • Bhakrani project (102.4MW), 21.6MW commissioned and remainder under construction, in Rajasthan• Tejuva project (100.8MW) under construction in Rajasthan• Yermala 200MW under construction in Maharashtra• Mahidad 50.4MW under construction in Gujarat
Jhajjar Power Limited (Jhajjar Power) 1,320 / 1,320MW• Jhajjar Power - 1,320MW (2 x 660MW) supercritical coal-fired project at Jhajjar, Haryana. Unit 1 and Unit 2 achieved commercial
operation on 29 March 2012 and 19 July 2012 respectively
CLP Wind Farms (Theni - Project II) Private Limited (Theni Phase II Project) 50 / 50MWTheni Phase II Project – 49.5MW project in Tamil Nadu. The project is fully commissioned
Ho-Ping Power Company (HPC) 1,320 / 264MWHPC owns the 1,320MW coal-fired Ho-Ping Power Station in Taiwan. CLP’s 20% interest is held through OneEnergy Taiwan Ltd, a 50:50 project vehicle with Mitsubishi Corporation. Taiwan Cement Corporation owns the other 60% interest in HPC
Natural Energy Development Co., Ltd. (NED) 63 / 21MWNED owns a solar farm in Lopburi Province in Central Thailand with 55MW in operation and 8MW under construction. NED is a joint venture company with equal shareholding by CLP, Mitsubishi Corporation and Electricity Generating Public Company Limited
CLP Sichuan (Jiangbian) Power Company Limited (Jiangbian Hydro) 330 / 330MWOwns and operates Jiangbian hydro power station (330MW) in Sichuan (四川)
CLP Huanyu (Shandong) Biomass Heat and Power Company Limited (Boxing Biomass) Equivalent of 15 / 12MWOwns and operates Boxing biomass combined heat and power plant (15MW + 75 tonnes / hour steam) in Shandong
Dali Yang_er Hydropower Development Co., Ltd. (Yang_er Hydro) 50 / 50MWOwns and operates Yang_er hydro power station (50MW) in Yunnan (雲南)
Huaiji Hydropower Stations (Huaiji Hydro) 125 / 106MWOwns and operates 12 small hydro power stations (125MW) in Guangdong
Hong Kong Pumped Storage Development Company, Limited (PSDC) 1,200 / 600MWPSDC (of which ExxonMobil Energy Limited holds 51%) may use half of the 1,200MW pumped storage capacity of Phase 1 of the Guangzhou Pumped Storage Power Station until 2034
6
10
12
11
8
16
21
13
15 22
31
31
31
29
Chinese Mainland Investments Gross / Equity MW
25%
Equity Interest
30%
1
2
3
4
5
6
7
8
10
11
12
14
15
16
13
9
49%
29.4%
70%
49%
49%
100%
45%
100%
50%
CSEC Guohua International Power Company Limited (CSEC Guohua) 7,650 / 1,333MW(1)
Ownership interests in �ve coal-�red power stations with China Shenhua Energy:
• 100% of Beijing Yire (400MW)• 65% of Panshan in Tianjin (天津) (1,030MW)• 55% of Sanhe I and II in Hebei (河北) (1,300MW)• 50% of Suizhong I and Suizhong II in Liaoning (遼寧) (3,600MW) • 65% of Zhungeer II and III in Inner Mongolia Autonomous Region (內蒙古自治區) (1,320MW)
Guangdong Nuclear Power Joint Venture Company, Limited (GNPJVC) 1,968 / 492MWGNPJVC constructed the Guangdong Daya Bay Nuclear Power Station (GNPS) at Daya Bay. GNPS is equipped with two 984MW Pressurised Water Reactors incorporating equipment from France and the United Kingdom. 70% of electricity generated is supplied to Hong Kong, with the remaining 30% sold to Guangdong Province (廣東省)
CLP Guohua Shenmu Power Company Limited (Shenmu) 220 / 108MWOwns and operates Shenmu Power Station in Shaanxi (陝西) (220MW) in joint venture with China Shenhua Energy
CLP Guangxi Fangchenggang Power Company Limited (Fangchenggang) 1,260 / 882MWOwns and operates two 630MW supercritical coal-�red units at Fangchenggang (防城港), Guangxi (廣西) with Guangxi Water & Power Engineering (Group) Co., Ltd.
Shandong Zhonghua Power Company, Ltd. (SZPC) 3,060 / 900MWOwns four coal-�red power stations in Shandong (山東) with China Guodian Corporation and EDF International:
• Shiheng I and II (1,260MW)• Liaocheng I (1,200MW)• Heze II (600MW)
Shandong Guohua Wind Joint Ventures (Shandong Guohua Wind) 445 / 218MWOwns nine wind farms in Shandong:
• Rongcheng I (48.8MW)• Rongcheng II (49.5MW)• Rongcheng III (49.5MW)• Dongying Hekou (49.5MW)• Lijin I (49.5MW)• Lijin II (49.5MW)• Zhanhua I (49.5MW)• Zhanhua II (49.5MW)• Haifang (49.5MW), under development
Jilin Datang Wind Joint Ventures (Jilin Datang Wind) 148 / 73MWOwns three wind farms in Jilin (吉林): Datong (49.5MW), Shuangliao I (49.3MW) and Shuangliao II (49.5MW)
Shandong Huaneng Wind Joint Ventures (Shandong Huaneng Wind) 96 / 43MWOwns three wind farms in Shandong: Changdao (27.2MW), Weihai I (19.5MW) and Weihai II (49.5MW)
Qian’an IW Power Company Limited (Qian’an I Wind) 50 / 50MW (Qian’an II Wind) 50 / 50MWOwns and operates Qian’an I (49.5MW) and Qian’an II (49.5MW) wind farms in Jilin
Sinohydro CLP Wind Power Company Limited (Changling II Wind) 50 / 22MWOwns Changling II wind farm (49.5MW) in Jilin
CLP-CWP Wind Power Investment Limited (CLP-CWP Wind) 99 / 24MW(2)
Owns two wind farms in Liaoning: 49% of Qujiagou (49.5MW) and 49% of Mazongshan (49.5MW)
Huadian Laizhou Wind Power Company Limited (Laizhou Wind) 41 / 18MWOwns Laizhou wind farm (40.5MW) in Shandong
CLP (Penglai) Wind Power Ltd. (Penglai I Wind) 48 / 48MWOwns and operates Penglai I wind farm (48MW) in Shandong
Huaneng Shantou Wind Power Company Limited (Nanao II Wind) 45 / 11MW (Nanao III Wind) 15 / 4MWOwns two wind farms in Guangdong: Nanao II (45MW) and Nanao III (15MW)
Shanghai Chongming Beiyan Wind Power Generation Company Limited (Shanghai Chongming Wind) 48 / 14MWOwns Chongming wind farm (48MW) in Shanghai (上海)
CGN Wind Power Company Limited (CGN Wind) 2,001 / 524MW(3)
Owns and operates 1,878MW of wind projects in various parts of China
Notes: (1) The 1,333 equity MW attributed to CLP, through its 30% equity interest in CSEC Guohua, takes into account that CSEC Guohua holds varying equity interests in the generating assets included in the 7,650 gross MW. (2) The 24 equity MW attributed to CLP, through its 50% equity interest in CLP-CWP Wind, takes into account that CLP-CWP Wind holds varying equity interests in the generating assets included in the 99 gross MW. (3) The 524 equity MW attributed to CLP, through its 32% equity interest in CGN Wind, takes into account that CGN Wind holds varying equity interests in the generating assets included in the 2,001 gross MW. CGN Wind completed its restructuring in January 2013 whereby its gross capacity under operation and construction was reduced to 1,794MW, and CLP’s equity stake was diluted to about 15.75%, with corresponding equity capacity reduced to 232 equity MW.
45%
45%
25%
29%
32%

...morethan21,000MW,7differentenergysources,...over5millioncustomeraccounts
Assets in which CLP has a majority shareholding and / or operational control
Assets in which CLP has no majority shareholding and / or operational control
Tallawarra
Iona
Hallett
Shenzhen – China
Castle Peak
Penny’s Bay
Kowloon
Black PointCLP PowerHong Kong
Lantau Island
New Territories
Samana I
Samana II
Mahidad
Khandke
HarapanahalliTheni I
Theni II
India
Jhajjar
Laizhou
Shandong Huaneng
Shandong Guohua
HPC
Jiangbian
Yang_er
Shenmu
PSDC
Huaiji
Nanao II & IIIFangchenggang
GNPJVC
SZPC
Boxing
Penglai I
Changling II
Shanghai Chongming
CLP–CWP
Jilin Datang
CSEC Guohua
CGN
NEDPaguthan
Qian’an I & II
29
23
1
4
17
3
2
7
14
Cathedral Rocks
NewportYallourn
Narrabri
Queensland coal seammethane tenements
Delta Western GenTrader
Waterloo
Jeeralang
Andhra Lake
Saundatti
China
Thailand
Australia
Taiwan
Wind power
Hydro power
Biomass power
Nuclear power
Coal power
Gas power
Solar power
100%
40%
Equity Interest
Australia Investments Gross / Equity MW
Hong Kong Investments
Equity Interest
100%
Equity Interest
Southeast Asia and Taiwan Investments Gross / Equity MW
India Investments Gross / Equity MW
Equity Interest
100%
79%
100%
17
18
19
20
21
22
23
24
25
26
27
28
29
30
3149%
84.9%
30
25
26
26
Bhakrani
Tejuva
Sipla
26
26
26
28
25
26
26
2726
24
Yermala2626
29 29
29
Pine Dale2929
Wilga Park
29
29
2929
29
29
20
18
5
19
9 20%
33.3%
100%
100%
100%
100%
100%
CLP Power Hong Kong Limited (CLP Power Hong Kong)(4)
CLP Power Hong Kong owns and operates the transmission and distribution system which includes:• 555 km of 400kV lines, 1,581 km of 132kV lines, 27 km of 33kV lines and 12,074 km of 11kV lines• 60,136 MVA transformers and 216 primary and 13,536 secondary substations in operation
Castle Peak Power Company Limited (CAPCO)(4), 6,908MW of installed generating capacityCAPCO owns and CLP Power Hong Kong operates:
• Black Point Power Station (2,500MW)One of the world’s largest gas-�red power stations comprising eight combined-cycle turbines of 312.5MW each
• Castle Peak Power Station (4,108MW)Comprising four coal-�red units of 350MW each and another four units of 677MW each. Two of the 677MW units can use gas as backup fuel. All units can use oil as a backup fuel
• Penny’s Bay Power Station (300MW)Three diesel-�red gas turbine units of 100MW each
Note : (4) CLP Power Hong Kong purchases its power from CAPCO, PSDC and Guangdong Daya Bay Nuclear Power Station. These sources of power amount to a total capacity of 8,888MW available to serve the Hong Kong electricity business.
EnergyAustralia (formerly known as TRUenergy) 5,662 / 5,616MWEnergyAustralia is an integrated generation and retail electricity and gas business in Victoria, South Australia, NSW, Queensland and the Australian Capital Territory, comprising:
• Yallourn coal-�red power station 1,480MW• Tallawarra gas-�red power station 420MW• Hallett gas-�red power station 203MW • Delta Western GenTrader (Mount Piper and Wallerawang) off-take from coal-�red power stations 2,400MW • Ecogen (Newport and Jeeralang) off-take from gas-�red plant 966MW• Waterloo wind farm 111MW • Cathedral Rocks (50% JV) wind farm 66MW • Iona Gas Storage facility and processing plant 22PJ• Narrabri (20%) >500PJ of equity coal seam gas 3P• Wilga Park (20%) gas-�red power station 16MW• Equity in Queensland coal seam methane tenements• Pine Dale – black coal mine
CLP India Private Limited (CLP India) 705 / 705MW• Paguthan Plant (formerly known as GPEC Gas Plant) – 655MW combined-cycle gas-fired power plant in Gujarat. The plant is designed to run on natural gas and naphtha (backup) as fuel• Samana Phase I Project – 50.4MW project in Gujarat. The project is fully commissioned
CLP Wind Farms (Khandke) Private Limited (Khandke Wind) 50 / 50MWKhandke Wind – 50.4MW project in Maharashtra. The project is fully commissioned
CLP Wind Farms (India) Private Limited (CLP Wind Farms) 822 / 822MW• Samana Phase II (50.4MW) in Gujarat• Saundatti project (72MW) and Harapanahalli project (39.6MW) in Karnataka• Andhra Lake project (106.4MW) in Maharashtra• Theni Phase I project (49.5MW) in Tamil Nadu• Sipla project (50.4MW), 31.2 MW commissioned and remainder under construction, in Rajasthan • Bhakrani project (102.4MW), 21.6MW commissioned and remainder under construction, in Rajasthan• Tejuva project (100.8MW) under construction in Rajasthan• Yermala 200MW under construction in Maharashtra• Mahidad 50.4MW under construction in Gujarat
Jhajjar Power Limited (Jhajjar Power) 1,320 / 1,320MW• Jhajjar Power - 1,320MW (2 x 660MW) supercritical coal-fired project at Jhajjar, Haryana. Unit 1 and Unit 2 achieved commercial
operation on 29 March 2012 and 19 July 2012 respectively
CLP Wind Farms (Theni - Project II) Private Limited (Theni Phase II Project) 50 / 50MWTheni Phase II Project – 49.5MW project in Tamil Nadu. The project is fully commissioned
Ho-Ping Power Company (HPC) 1,320 / 264MWHPC owns the 1,320MW coal-fired Ho-Ping Power Station in Taiwan. CLP’s 20% interest is held through OneEnergy Taiwan Ltd, a 50:50 project vehicle with Mitsubishi Corporation. Taiwan Cement Corporation owns the other 60% interest in HPC
Natural Energy Development Co., Ltd. (NED) 63 / 21MWNED owns a solar farm in Lopburi Province in Central Thailand with 55MW in operation and 8MW under construction. NED is a joint venture company with equal shareholding by CLP, Mitsubishi Corporation and Electricity Generating Public Company Limited
CLP Sichuan (Jiangbian) Power Company Limited (Jiangbian Hydro) 330 / 330MWOwns and operates Jiangbian hydro power station (330MW) in Sichuan (四川)
CLP Huanyu (Shandong) Biomass Heat and Power Company Limited (Boxing Biomass) Equivalent of 15 / 12MWOwns and operates Boxing biomass combined heat and power plant (15MW + 75 tonnes / hour steam) in Shandong
Dali Yang_er Hydropower Development Co., Ltd. (Yang_er Hydro) 50 / 50MWOwns and operates Yang_er hydro power station (50MW) in Yunnan (雲南)
Huaiji Hydropower Stations (Huaiji Hydro) 125 / 106MWOwns and operates 12 small hydro power stations (125MW) in Guangdong
Hong Kong Pumped Storage Development Company, Limited (PSDC) 1,200 / 600MWPSDC (of which ExxonMobil Energy Limited holds 51%) may use half of the 1,200MW pumped storage capacity of Phase 1 of the Guangzhou Pumped Storage Power Station until 2034
6
10
12
11
8
16
21
13
15 22
31
31
31
29
Chinese Mainland Investments Gross / Equity MW
25%
Equity Interest
30%
1
2
3
4
5
6
7
8
10
11
12
14
15
16
13
9
49%
29.4%
70%
49%
49%
100%
45%
100%
50%
CSEC Guohua International Power Company Limited (CSEC Guohua) 7,650 / 1,333MW(1)
Ownership interests in �ve coal-�red power stations with China Shenhua Energy:
• 100% of Beijing Yire (400MW)• 65% of Panshan in Tianjin (天津) (1,030MW)• 55% of Sanhe I and II in Hebei (河北) (1,300MW)• 50% of Suizhong I and Suizhong II in Liaoning (遼寧) (3,600MW) • 65% of Zhungeer II and III in Inner Mongolia Autonomous Region (內蒙古自治區) (1,320MW)
Guangdong Nuclear Power Joint Venture Company, Limited (GNPJVC) 1,968 / 492MWGNPJVC constructed the Guangdong Daya Bay Nuclear Power Station (GNPS) at Daya Bay. GNPS is equipped with two 984MW Pressurised Water Reactors incorporating equipment from France and the United Kingdom. 70% of electricity generated is supplied to Hong Kong, with the remaining 30% sold to Guangdong Province (廣東省)
CLP Guohua Shenmu Power Company Limited (Shenmu) 220 / 108MWOwns and operates Shenmu Power Station in Shaanxi (陝西) (220MW) in joint venture with China Shenhua Energy
CLP Guangxi Fangchenggang Power Company Limited (Fangchenggang) 1,260 / 882MWOwns and operates two 630MW supercritical coal-�red units at Fangchenggang (防城港), Guangxi (廣西) with Guangxi Water & Power Engineering (Group) Co., Ltd.
Shandong Zhonghua Power Company, Ltd. (SZPC) 3,060 / 900MWOwns four coal-�red power stations in Shandong (山東) with China Guodian Corporation and EDF International:
• Shiheng I and II (1,260MW)• Liaocheng I (1,200MW)• Heze II (600MW)
Shandong Guohua Wind Joint Ventures (Shandong Guohua Wind) 445 / 218MWOwns nine wind farms in Shandong:
• Rongcheng I (48.8MW)• Rongcheng II (49.5MW)• Rongcheng III (49.5MW)• Dongying Hekou (49.5MW)• Lijin I (49.5MW)• Lijin II (49.5MW)• Zhanhua I (49.5MW)• Zhanhua II (49.5MW)• Haifang (49.5MW), under development
Jilin Datang Wind Joint Ventures (Jilin Datang Wind) 148 / 73MWOwns three wind farms in Jilin (吉林): Datong (49.5MW), Shuangliao I (49.3MW) and Shuangliao II (49.5MW)
Shandong Huaneng Wind Joint Ventures (Shandong Huaneng Wind) 96 / 43MWOwns three wind farms in Shandong: Changdao (27.2MW), Weihai I (19.5MW) and Weihai II (49.5MW)
Qian’an IW Power Company Limited (Qian’an I Wind) 50 / 50MW (Qian’an II Wind) 50 / 50MWOwns and operates Qian’an I (49.5MW) and Qian’an II (49.5MW) wind farms in Jilin
Sinohydro CLP Wind Power Company Limited (Changling II Wind) 50 / 22MWOwns Changling II wind farm (49.5MW) in Jilin
CLP-CWP Wind Power Investment Limited (CLP-CWP Wind) 99 / 24MW(2)
Owns two wind farms in Liaoning: 49% of Qujiagou (49.5MW) and 49% of Mazongshan (49.5MW)
Huadian Laizhou Wind Power Company Limited (Laizhou Wind) 41 / 18MWOwns Laizhou wind farm (40.5MW) in Shandong
CLP (Penglai) Wind Power Ltd. (Penglai I Wind) 48 / 48MWOwns and operates Penglai I wind farm (48MW) in Shandong
Huaneng Shantou Wind Power Company Limited (Nanao II Wind) 45 / 11MW (Nanao III Wind) 15 / 4MWOwns two wind farms in Guangdong: Nanao II (45MW) and Nanao III (15MW)
Shanghai Chongming Beiyan Wind Power Generation Company Limited (Shanghai Chongming Wind) 48 / 14MWOwns Chongming wind farm (48MW) in Shanghai (上海)
CGN Wind Power Company Limited (CGN Wind) 2,001 / 524MW(3)
Owns and operates 1,878MW of wind projects in various parts of China
Notes: (1) The 1,333 equity MW attributed to CLP, through its 30% equity interest in CSEC Guohua, takes into account that CSEC Guohua holds varying equity interests in the generating assets included in the 7,650 gross MW. (2) The 24 equity MW attributed to CLP, through its 50% equity interest in CLP-CWP Wind, takes into account that CLP-CWP Wind holds varying equity interests in the generating assets included in the 99 gross MW. (3) The 524 equity MW attributed to CLP, through its 32% equity interest in CGN Wind, takes into account that CGN Wind holds varying equity interests in the generating assets included in the 2,001 gross MW. CGN Wind completed its restructuring in January 2013 whereby its gross capacity under operation and construction was reduced to 1,794MW, and CLP’s equity stake was diluted to about 15.75%, with corresponding equity capacity reduced to 232 equity MW.
45%
45%
25%
29%
32%
67 CLP Holdings 2012 Annual Report
...morethan21,000MW,7differentenergysources,...over5millioncustomeraccounts
CLP Holdings 2012 Annual Report 68
Assets in which CLP has a majority shareholding and / or operational control
Assets in which CLP has no majority shareholding and / or operational control
Tallawarra
Iona
Hallett
Shenzhen – China
Castle Peak
Penny’s Bay
Kowloon
Black PointCLP PowerHong Kong
Lantau Island
New Territories
Samana I
Samana II
Mahidad
Khandke
HarapanahalliTheni I
Theni II
India
Jhajjar
Laizhou
Shandong Huaneng
Shandong Guohua
HPC
Jiangbian
Yang_er
Shenmu
PSDC
Huaiji
Nanao II & IIIFangchenggang
GNPJVC
SZPC
Boxing
Penglai I
Changling II
Shanghai Chongming
CLP–CWP
Jilin Datang
CSEC Guohua
CGN
NEDPaguthan
Qian’an I & II
29
23
1
4
17
3
2
7
14
Cathedral Rocks
NewportYallourn
Narrabri
Queensland coal seammethane tenements
Delta Western GenTrader
Waterloo
Jeeralang
Andhra Lake
Saundatti
China
Thailand
Australia
Taiwan
Wind power
Hydro power
Biomass power
Nuclear power
Coal power
Gas power
Solar power
100%
40%
Equity Interest
Australia Investments Gross / Equity MW
Hong Kong Investments
Equity Interest
100%
Equity Interest
Southeast Asia and Taiwan Investments Gross / Equity MW
India Investments Gross / Equity MW
Equity Interest
100%
79%
100%
17
18
19
20
21
22
23
24
25
26
27
28
29
30
3149%
84.9%
30
25
26
26
Bhakrani
Tejuva
Sipla
26
26
26
28
25
26
26
2726
24
Yermala2626
29 29
29
Pine Dale2929
Wilga Park
29
29
2929
29
29
20
18
5
19
9 20%
33.3%
100%
100%
100%
100%
100%
CLP Power Hong Kong Limited (CLP Power Hong Kong)(4)
CLP Power Hong Kong owns and operates the transmission and distribution system which includes:• 555 km of 400kV lines, 1,581 km of 132kV lines, 27 km of 33kV lines and 12,074 km of 11kV lines• 60,136 MVA transformers and 216 primary and 13,536 secondary substations in operation
Castle Peak Power Company Limited (CAPCO)(4), 6,908MW of installed generating capacityCAPCO owns and CLP Power Hong Kong operates:
• Black Point Power Station (2,500MW)One of the world’s largest gas-�red power stations comprising eight combined-cycle turbines of 312.5MW each
• Castle Peak Power Station (4,108MW)Comprising four coal-�red units of 350MW each and another four units of 677MW each. Two of the 677MW units can use gas as backup fuel. All units can use oil as a backup fuel
• Penny’s Bay Power Station (300MW)Three diesel-�red gas turbine units of 100MW each
Note : (4) CLP Power Hong Kong purchases its power from CAPCO, PSDC and Guangdong Daya Bay Nuclear Power Station. These sources of power amount to a total capacity of 8,888MW available to serve the Hong Kong electricity business.
EnergyAustralia (formerly known as TRUenergy) 5,662 / 5,616MWEnergyAustralia is an integrated generation and retail electricity and gas business in Victoria, South Australia, NSW, Queensland and the Australian Capital Territory, comprising:
• Yallourn coal-�red power station 1,480MW• Tallawarra gas-�red power station 420MW• Hallett gas-�red power station 203MW • Delta Western GenTrader (Mount Piper and Wallerawang) off-take from coal-�red power stations 2,400MW • Ecogen (Newport and Jeeralang) off-take from gas-�red plant 966MW• Waterloo wind farm 111MW • Cathedral Rocks (50% JV) wind farm 66MW • Iona Gas Storage facility and processing plant 22PJ• Narrabri (20%) >500PJ of equity coal seam gas 3P• Wilga Park (20%) gas-�red power station 16MW• Equity in Queensland coal seam methane tenements• Pine Dale – black coal mine
CLP India Private Limited (CLP India) 705 / 705MW• Paguthan Plant (formerly known as GPEC Gas Plant) – 655MW combined-cycle gas-fired power plant in Gujarat. The plant is designed to run on natural gas and naphtha (backup) as fuel• Samana Phase I Project – 50.4MW project in Gujarat. The project is fully commissioned
CLP Wind Farms (Khandke) Private Limited (Khandke Wind) 50 / 50MWKhandke Wind – 50.4MW project in Maharashtra. The project is fully commissioned
CLP Wind Farms (India) Private Limited (CLP Wind Farms) 822 / 822MW• Samana Phase II (50.4MW) in Gujarat• Saundatti project (72MW) and Harapanahalli project (39.6MW) in Karnataka• Andhra Lake project (106.4MW) in Maharashtra• Theni Phase I project (49.5MW) in Tamil Nadu• Sipla project (50.4MW), 31.2 MW commissioned and remainder under construction, in Rajasthan • Bhakrani project (102.4MW), 21.6MW commissioned and remainder under construction, in Rajasthan• Tejuva project (100.8MW) under construction in Rajasthan• Yermala 200MW under construction in Maharashtra• Mahidad 50.4MW under construction in Gujarat
Jhajjar Power Limited (Jhajjar Power) 1,320 / 1,320MW• Jhajjar Power - 1,320MW (2 x 660MW) supercritical coal-fired project at Jhajjar, Haryana. Unit 1 and Unit 2 achieved commercial
operation on 29 March 2012 and 19 July 2012 respectively
CLP Wind Farms (Theni - Project II) Private Limited (Theni Phase II Project) 50 / 50MWTheni Phase II Project – 49.5MW project in Tamil Nadu. The project is fully commissioned
Ho-Ping Power Company (HPC) 1,320 / 264MWHPC owns the 1,320MW coal-fired Ho-Ping Power Station in Taiwan. CLP’s 20% interest is held through OneEnergy Taiwan Ltd, a 50:50 project vehicle with Mitsubishi Corporation. Taiwan Cement Corporation owns the other 60% interest in HPC
Natural Energy Development Co., Ltd. (NED) 63 / 21MWNED owns a solar farm in Lopburi Province in Central Thailand with 55MW in operation and 8MW under construction. NED is a joint venture company with equal shareholding by CLP, Mitsubishi Corporation and Electricity Generating Public Company Limited
CLP Sichuan (Jiangbian) Power Company Limited (Jiangbian Hydro) 330 / 330MWOwns and operates Jiangbian hydro power station (330MW) in Sichuan (四川)
CLP Huanyu (Shandong) Biomass Heat and Power Company Limited (Boxing Biomass) Equivalent of 15 / 12MWOwns and operates Boxing biomass combined heat and power plant (15MW + 75 tonnes / hour steam) in Shandong
Dali Yang_er Hydropower Development Co., Ltd. (Yang_er Hydro) 50 / 50MWOwns and operates Yang_er hydro power station (50MW) in Yunnan (雲南)
Huaiji Hydropower Stations (Huaiji Hydro) 125 / 106MWOwns and operates 12 small hydro power stations (125MW) in Guangdong
Hong Kong Pumped Storage Development Company, Limited (PSDC) 1,200 / 600MWPSDC (of which ExxonMobil Energy Limited holds 51%) may use half of the 1,200MW pumped storage capacity of Phase 1 of the Guangzhou Pumped Storage Power Station until 2034
6
10
12
11
8
16
21
13
15 22
31
31
31
29
Chinese Mainland Investments Gross / Equity MW
25%
Equity Interest
30%
1
2
3
4
5
6
7
8
10
11
12
14
15
16
13
9
49%
29.4%
70%
49%
49%
100%
45%
100%
50%
CSEC Guohua International Power Company Limited (CSEC Guohua) 7,650 / 1,333MW(1)
Ownership interests in �ve coal-�red power stations with China Shenhua Energy:
• 100% of Beijing Yire (400MW)• 65% of Panshan in Tianjin (天津) (1,030MW)• 55% of Sanhe I and II in Hebei (河北) (1,300MW)• 50% of Suizhong I and Suizhong II in Liaoning (遼寧) (3,600MW) • 65% of Zhungeer II and III in Inner Mongolia Autonomous Region (內蒙古自治區) (1,320MW)
Guangdong Nuclear Power Joint Venture Company, Limited (GNPJVC) 1,968 / 492MWGNPJVC constructed the Guangdong Daya Bay Nuclear Power Station (GNPS) at Daya Bay. GNPS is equipped with two 984MW Pressurised Water Reactors incorporating equipment from France and the United Kingdom. 70% of electricity generated is supplied to Hong Kong, with the remaining 30% sold to Guangdong Province (廣東省)
CLP Guohua Shenmu Power Company Limited (Shenmu) 220 / 108MWOwns and operates Shenmu Power Station in Shaanxi (陝西) (220MW) in joint venture with China Shenhua Energy
CLP Guangxi Fangchenggang Power Company Limited (Fangchenggang) 1,260 / 882MWOwns and operates two 630MW supercritical coal-�red units at Fangchenggang (防城港), Guangxi (廣西) with Guangxi Water & Power Engineering (Group) Co., Ltd.
Shandong Zhonghua Power Company, Ltd. (SZPC) 3,060 / 900MWOwns four coal-�red power stations in Shandong (山東) with China Guodian Corporation and EDF International:
• Shiheng I and II (1,260MW)• Liaocheng I (1,200MW)• Heze II (600MW)
Shandong Guohua Wind Joint Ventures (Shandong Guohua Wind) 445 / 218MWOwns nine wind farms in Shandong:
• Rongcheng I (48.8MW)• Rongcheng II (49.5MW)• Rongcheng III (49.5MW)• Dongying Hekou (49.5MW)• Lijin I (49.5MW)• Lijin II (49.5MW)• Zhanhua I (49.5MW)• Zhanhua II (49.5MW)• Haifang (49.5MW), under development
Jilin Datang Wind Joint Ventures (Jilin Datang Wind) 148 / 73MWOwns three wind farms in Jilin (吉林): Datong (49.5MW), Shuangliao I (49.3MW) and Shuangliao II (49.5MW)
Shandong Huaneng Wind Joint Ventures (Shandong Huaneng Wind) 96 / 43MWOwns three wind farms in Shandong: Changdao (27.2MW), Weihai I (19.5MW) and Weihai II (49.5MW)
Qian’an IW Power Company Limited (Qian’an I Wind) 50 / 50MW (Qian’an II Wind) 50 / 50MWOwns and operates Qian’an I (49.5MW) and Qian’an II (49.5MW) wind farms in Jilin
Sinohydro CLP Wind Power Company Limited (Changling II Wind) 50 / 22MWOwns Changling II wind farm (49.5MW) in Jilin
CLP-CWP Wind Power Investment Limited (CLP-CWP Wind) 99 / 24MW(2)
Owns two wind farms in Liaoning: 49% of Qujiagou (49.5MW) and 49% of Mazongshan (49.5MW)
Huadian Laizhou Wind Power Company Limited (Laizhou Wind) 41 / 18MWOwns Laizhou wind farm (40.5MW) in Shandong
CLP (Penglai) Wind Power Ltd. (Penglai I Wind) 48 / 48MWOwns and operates Penglai I wind farm (48MW) in Shandong
Huaneng Shantou Wind Power Company Limited (Nanao II Wind) 45 / 11MW (Nanao III Wind) 15 / 4MWOwns two wind farms in Guangdong: Nanao II (45MW) and Nanao III (15MW)
Shanghai Chongming Beiyan Wind Power Generation Company Limited (Shanghai Chongming Wind) 48 / 14MWOwns Chongming wind farm (48MW) in Shanghai (上海)
CGN Wind Power Company Limited (CGN Wind) 2,001 / 524MW(3)
Owns and operates 1,878MW of wind projects in various parts of China
Notes: (1) The 1,333 equity MW attributed to CLP, through its 30% equity interest in CSEC Guohua, takes into account that CSEC Guohua holds varying equity interests in the generating assets included in the 7,650 gross MW. (2) The 24 equity MW attributed to CLP, through its 50% equity interest in CLP-CWP Wind, takes into account that CLP-CWP Wind holds varying equity interests in the generating assets included in the 99 gross MW. (3) The 524 equity MW attributed to CLP, through its 32% equity interest in CGN Wind, takes into account that CGN Wind holds varying equity interests in the generating assets included in the 2,001 gross MW. CGN Wind completed its restructuring in January 2013 whereby its gross capacity under operation and construction was reduced to 1,794MW, and CLP’s equity stake was diluted to about 15.75%, with corresponding equity capacity reduced to 232 equity MW.
45%
45%
25%
29%
32%

2012 saw unprecedented low levels of yields in the financial markets. The modest economic recovery in the United States
and the bleak economic outlook in the Euro-zone countries prompted major central banks to use aggressive monetary
policy to safeguard employment and ward off deflation. As a result, interest rates remained low across North America,
Europe and Asia. They have been low for a number of years, and may remain “lower-for-longer”.
The search for yield became more intensive towards the second half of the year. With interest rates and bond yields at
painfully low levels (or negative in real terms after taxes and inflation), investors resorted to a variety of ways to enhance
investment returns. Some opted to extend the tenor of their holdings. Others chose more aggressive strategies, including
lowering their credit rating thresholds or including more structured products (e.g. hybrids, linked products) in their
portfolio.
The low interest rate environment and investors’ action to push out maturity and be more tolerant to higher risk,
significantly impacted the markets, and at the same time provided opportunities to CLP. On the one hand, the cost
of borrowing in the bond markets, notably for debt maturities of ten years or longer, fell to historically low levels. On
the other hand, yield-seeking investors pursued high quality utility shares for certainty of return. This financial market
backdrop enabled CLP to take two strategic actions in the second half of 2012 – a 5% share placement by CLP Holdings
to enhance firepower for forthcoming investments in Hong Kong and overseas; and US$600 million 10.5 and 15-year
public bond issues by CLP Power Hong Kong to meet funding needs in 2013.
These and other major financing activities in the CLP Group are discussed in the following sections with a view to
providing an insight into the quality of the financial capital which the Group possesses.
Enhancing Financial Strength and FlexibilityIn the “Financing” section of last year’s Annual Report, we outlined our funding model and major financing and risk
management philosophies. These guide CLP to raise timely, cost effective external finance to expand in the extremely
capital intensive power industry. Our adherence to prudent, effective financial policies is not confined to a short-term
horizon. We look well ahead in our plans to optimise our capital structure and debt portfolio.
These plans included two steps, the share placing and CLP Power Hong Kong bond issues, which were implemented in
supportive market conditions.
First, whilst the Group’s debt gearing ratio (net debt to total capital) remained at a relatively low level (31 December
2011: 43.1%, 31 December 2012: 36.8%) vis-a-vis other leading power companies, Management was aware that future
investment opportunities would require a sizeable equity commitment. Instead of raising third party debt to fund this
capital expenditure, which could further increase the Group’s gearing ratio and tighten our credit metrics, we believed
a 5% share placement was the most beneficial course for shareholders. An additional point of context is that, in recent
years, CLP Holdings has largely funded its business expansion through debt and internal cash flow, and effected on-
market share repurchases representing 5.45% of its pre-placement share capital between 1998 and 2008 at an average
price of HK$30.92. This share placement not only allowed CLP Holdings to raise HK$7.56 billion cash with tightly-
monitored execution risk, but also enabled the company to broaden its investor base and strengthen its balance sheet to
Financial Capital – our funding resources and capability
CLP Holdings 2012 Annual Report 69

Financial Capital
support future growth. The share placement was completed at a price of HK$63.25 per share, a tight discount of 5.88% to the
12 December closing price. The subsequent trading of CLP Holdings shares above that level demonstrated the share placement
was well received by the market. This share placement enhanced CLP’s balance sheet strength and reduced the gearing ratio by
approximately 5%.
Secondly, CLP Power Hong Kong issued US$300 million 10.5-year and US$300 million 15-year Regulation S public bonds in
October 2012. The proceeds will pre-fund prospective expenditure of the Company in 2013. This step was possible due to issuer-
friendly market sentiment and the significant reduction of “negative carry” that sometimes challenges the concept of pre-funding.
The bonds received an overwhelming response of 10 times subscription and were issued at 2.88% coupon (U.S. Treasury plus
1.2%) and 3.38% coupon (U.S. Treasury plus 1.65%) respectively. We understand this was the first time a company in the Asia-
Pacific region ex-Japan was able to issue such a dual tranche and that these are the lowest coupon public U.S. dollar bonds ever
issued by a private Hong Kong company in their respective tenors. Together with other debt tranches which the company raised
in the third quarter, CLP Power Hong Kong has already completed the majority of its funding requirements for 2013.
In Australia, EnergyAustralia issued US$400 million 5 to 15 years Regulation D private bonds in March 2012 to lengthen the
maturity profile and reduce reliance on the bank market. EnergyAustralia also completed A$750 million 4 and 5-year syndicated
bank facilities with 15 banks in December 2012 to retire a A$350 million bank loan originally maturing in 2013 and to procure
additional liquidity.
Ability to obtainfunding in a timely and
cost-effectivemanner
StrongFinancial Matrix
Diversi�edDebt Pro�le
IntangibleAssets
Non-recourse
project loans at
subsidiary and
af�liate
companies
Good investment
grade credit ratings
and good track
record in
�nancial markets
Diversi�ed
funding sources
and investors base
Diversi�ed debt
maturities and
instruments
Longstanding,
good relationships
with a balanced
mix of lenders that have
strong funding capability
and local market
knowledge
Disciplined
investment,
�nancing and
risk management
strategies
Our Funding Model
70 CLP Holdings 2012 Annual Report

These diversified funding sources can help CLP manage geo-political market risks and minimise the impact of Basel III and other
banking regulations that might cause a spike in funding costs.
Ratio of Bond Funding to Total Debt
40
45
50
55
60
Dec 12Dec 11Dec 10Dec 09Dec 08
%
Firepower
10,000
20,000
30,000
40,000
50,000
Dec 12Dec 11Dec 10Dec 09Dec 08
HK$M
Note: Firepower comprises undrawn facilities plus bank balances, cash and other liquid funds.
HKDUSDJPYAUD
0
10
20
30
40
50
60
27%
7%
17%
25%
5%5%
14%
Number of Banks
22%
7%
18%
27%
7%5%
14%
Indian based
U.K. and European based
Chinese mainland based
Australian basedOthers
U.S. based
Japanese based
Dec 2011 Dec 2012
Currency of Bond Funding
0
4,000
8,000
12,000
16,000
20,000
24,000
28,000
CLP PowerHong Kong
46%
40%
12%
44%
5%
95%
42%
41%
59%
2%11%
3%
EnergyAustralia
HK$M
Dec 2011 Dec 2012
CLP PowerHong Kong
EnergyAustralia
CLP Banking Relationships – A Balanced Mix of Lending Financial Institutions
AMoreDiversifiedFundingBaseWe retain strong relationships with long-term financing partners. At the same time, we cultivate new business opportunities
with quality, financially strong debt providers. For instance, CLP Power Hong Kong and EnergyAustralia have expanded their
debt portfolio to cover bond investors and lending banks based in different parts of the world. Currently CLP Power Hong Kong
has an outstanding 42 tranches of bonds (denominated in U.S. dollar, H.K. dollar, Japanese yen and Australian dollar) while
EnergyAustralia has 11 tranches (in Australian dollar and U.S. dollar) placed with bond investors. As at 31 December 2012,
the Group had relationships with 56 financial institutions (2011: 59, the refinancing of Jhajjar’s Indian rupee loan reduced
the number of Indian lenders). About 80% of financial institutions we had business with a decade ago are still working in
partnership with us. We have also further spread out our debt funding to bond investors from commercial banks since the
global financial crisis first arrived in 2008 / 2009. Nowadays, about 43% and 42% of debt funding at CLP Power Hong Kong and
EnergyAustralia comes from bond investors based outside Hong Kong or Australia respectively.
CLP Holdings 2012 Annual Report 71
Financial Capital
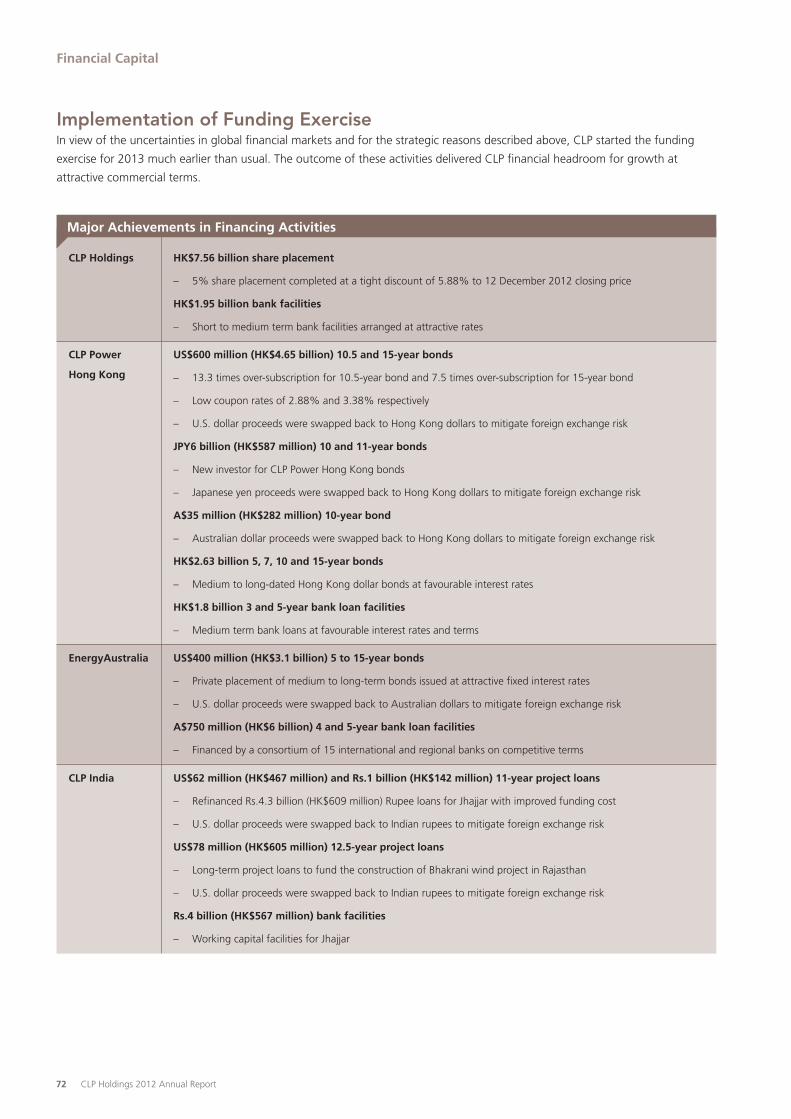
CLP Holdings HK$7.56 billion share placement
– 5% share placement completed at a tight discount of 5.88% to 12 December 2012 closing price
HK$1.95 billion bank facilities
– Short to medium term bank facilities arranged at attractive rates
CLP Power
Hong Kong
US$400 million (HK$3.1 billion) 5 to 15-year bonds
– Private placement of medium to long-term bonds issued at attractive fixed interest rates
– U.S. dollar proceeds were swapped back to Australian dollars to mitigate foreign exchange risk
A$750 million (HK$6 billion) 4 and 5-year bank loan facilities
– Financed by a consortium of 15 international and regional banks on competitive terms
US$62 million (HK$467 million) and Rs.1 billion (HK$142 million) 11-year project loans
– Refinanced Rs.4.3 billion (HK$609 million) Rupee loans for Jhajjar with improved funding cost
– U.S. dollar proceeds were swapped back to Indian rupees to mitigate foreign exchange risk
US$78 million (HK$605 million) 12.5-year project loans
– Long-term project loans to fund the construction of Bhakrani wind project in Rajasthan
– U.S. dollar proceeds were swapped back to Indian rupees to mitigate foreign exchange risk
Rs.4 billion (HK$567 million) bank facilities
– Working capital facilities for Jhajjar
EnergyAustralia
CLP India
Major Achievements in Financing Activities
Implementation of Funding ExerciseIn view of the uncertainties in global financial markets and for the strategic reasons described above, CLP started the funding
exercise for 2013 much earlier than usual. The outcome of these activities delivered CLP financial headroom for growth at
attractive commercial terms.
US$600 million (HK$4.65 billion) 10.5 and 15-year bonds
– 13.3 times over-subscription for 10.5-year bond and 7.5 times over-subscription for 15-year bond
– Low coupon rates of 2.88% and 3.38% respectively
– U.S. dollar proceeds were swapped back to Hong Kong dollars to mitigate foreign exchange risk
JPY6 billion (HK$587 million) 10 and 11-year bonds
– New investor for CLP Power Hong Kong bonds
– Japanese yen proceeds were swapped back to Hong Kong dollars to mitigate foreign exchange risk
A$35 million (HK$282 million) 10-year bond
– Australian dollar proceeds were swapped back to Hong Kong dollars to mitigate foreign exchange risk
HK$2.63 billion 5, 7, 10 and 15-year bonds
– Medium to long-dated Hong Kong dollar bonds at favourable interest rates
HK$1.8 billion 3 and 5-year bank loan facilities
– Medium term bank loans at favourable interest rates and terms
72 CLP Holdings 2012 Annual Report

CLP Power Hong Kong and EnergyAustralia can tap into debt capital markets to issue their functional currencies and foreign
currencies bonds under their Medium Term Note (MTN) Programmes for an aggregated amount of up to US$3.5 billion and A$2
billion respectively. As at 31 December 2012, bonds totalling about HK$26.1 billion and A$50 million were issued by CLP Power
Hong Kong and EnergyAustralia respectively under their MTN Programmes. In 2012, interest cover (which equals profit before
income tax and interest divided by the sum of interest charges and capitalised interest) was 4 times (2011: 4 times). The financial
obligations of the Group, CAPCO and PSDC, and the Group’s share of the financial obligations of jointly controlled entities and
associated companies as at 31 December 2012 are shown on page 36.
DebtProfileasat31December2012
Notes:
1. Mainly relates to EnergyAustralia and subsidiaries in India.
2. For the MTN Programmes, only the amounts of the bonds issued as at 31 December 2012 were included in the total amount of Available Facility. The Available Facility in EnergyAustralia excludes a facility set aside for guarantees.
CLP Power Other Group + CLP Holdings Hong Kong Subsidiaries 1 Group CAPCO
HK$M HK$M HK$M HK$M HK$M
Available Facility 2 16,600 38,974 43,697 99,271 106,400
Loan Balance 2,900 33,435 29,863 66,198 72,377
Undrawn Facility 13,700 5,539 13,834 33,073 34,023
Loan Balance – Type
CLP Group CLP Group + CAPCO
Term Loans
Medium Term Notes / Private Placement
Money Market Line
0
10,000
20,000
30,000
40,000
50,000
60,000
70,000
80,000
51%
47%48%
1%
47%
6%
HK$M
0
10,000
20,000
30,000
40,000
50,000
60,000
70,000
80,000
28%
18%
10%
25%
10%
10%
52%47%
HK$M
Loan Balance – Maturity
CLP Group CLP Group + CAPCO
2-5 yearsBeyond 5 years 1-2 years Within 1 year
Note: Loan balance between two to �ve years includes loan drawdown with current tenor less than one year under revolving facility with maturity falling beyond one year.
CLP Holdings 2012 Annual Report 73

Financial Capital
CLP Holdings
Moody’s: Re-affirmed the A2 credit rating with stable outlook in March 2012
Negatives
• Soundliquidityprofileandgoodoperatingtrackrecord
• Prudentandgradualapproachinpursuingoverseasexpansion
• StrongandpredictablecashflowsfromCLPPowerHongKong,
which operates in a stable regulatory environment
• Abilitytoaccessthedomesticandinternationalbankand
capital markets
• Availabilityofsizeablecommittedbankfacilities
• Wellmanageddebtmaturityprofile
• Weakenedfinancialprofileduetodebt-fundedoverseas
expansion, albeit still appropriate for the rating
• Expansioninriskier,non-regulatedmerchantenergyandretail
businesses
• NSWacquisitionputpressureontheGroup’sfinancialswitha
temporary weakening in 2011, but expected to improve in 2012
and then onwards as a result of increased earnings from NSW
business and Jhajjar project in India
Positives
Standard & Poor’s (S&P): Re-affirmed the A- credit rating with stable outlook in March and September 2012
Negatives
• Expectfinancialstrengthtoimprovemeaningfullyfrom2013
due to: (1) higher returns from Hong Kong operations due
to the tariff increase, further capital expenditure and stable
local electricity demand; (2) higher earnings from Australia
operations with Yallourn power station expected to revert to
full capacity and after integration of the NSW assets in 2013;
(3) fuel supply problems at the Jhajjar project to be resolved;
and (4) growing earnings from renewable energy investments
• Adequateliquiditysupportedbystrongoperatingcashflow
from Hong Kong operations and its strong financial flexibility
• Strongcommitmenttodeleveraginganditsrecordofdisposing
assets to optimise the portfolio
• Expansionintounregulatedpowergenerationassetsinthe
Asia-Pacific could weaken its strong business profile
• HigherleveragehasweakenedtheGroup’sfinancialhealthand
put pressure on its modest financial risk profile
• NewgenerationfacilitiesunderconstructioninAustralia,India
and China carry higher operating risks and are potentially subject
to increasing supervision and costs relating to carbon emission
and environmental issues
Positives
Credit RatingsCLP’s commitment to prudent financial and risk management, along with disciplined investment strategy, have enabled the
Group to maintain good investment grade credit ratings throughout the previous decades. CLP’s ability to maintain a good credit
standing and access the financial markets at cost-effective terms is crucial to meeting our business needs and objectives.
Standard & Poor’s
BBB+
BBB-
BBB
A-
A
A+
AA-
AA
AA+
AAA
CLP Holdings CLP Power Hong Kong EnergyAustralia Holdings (formerly TRUenergy Holdings)
Jun 08
Apr 08
May 09 Jul 10
Moody’s
Baa1
Baa3
Baa2
A3
A2
A1
Aa3
Aa2
Aa1
Aaa
Apr 08
Jan 08 Jan 09 Jan 13Jan 12Jan 11Jan 10Jan 08 Jan 09 Jan 13Jan 12Jan 11Jan 10
HKSAR Government rating as at 31 December 2012
Long-term Credit Ratings – Foreign Currency and Local Currency
74 CLP Holdings 2012 Annual Report

CLP Power Hong Kong
Moody’s: Re-affirmed the A1 credit rating with stable outlook in March 2012
Negatives
• StrongandhighlypredictablecashflowgeneratedfromSoC
operations
• Regulatoryframework,transparenttariffsystemand100%
cost pass-through
• Goodtrackrecordinaccessingdomesticandinternationalbank
and capital markets
• Wellmanageddebtmaturityprofile
• Liquidityprofilemaybepressuredbyitsdividendpaymentsto
CLP Holdings and its long-term capital expenditure plan
• RatingconstrainedbyCLPHoldings’continuousexpansioninto
the more risky non-regulated energy and retail businesses in the
region
Positives
S&P: Re-affirmed the A credit rating with stable outlook in March and September 2012
Negatives
• Excellentbusinessriskprofile,favourableregulatoryregime
protects CLP Power Hong Kong from rising fuel costs and
ensures stable operating cash flows
• Soundbankrelationshipsandgoodreputationinthecapital
market
• Goodliabilitymanagementwithdiversifieddebtsourcesand
tenors
• Liquidityremainsadequate
• SoCAgreementallowsapermittedrateofreturnandan
operating costs pass-through mechanism until 2018
• UncertaintysurroundingtheexpansionofCLPHoldingsin
unregulated businesses outside Hong Kong partly offset the
strengths of CLP Power Hong Kong
• TheGovernment’senvironmentregulationscouldresultinsome
uncertainty in mid to long-term operations and financing needs
• Securinglong-termreplacementnaturalgassupplyand
constructing related pipeline infrastructure could be an
operational challenge although CLP Power Hong Kong has made
progress in securing a new gas supply
Positives
EnergyAustralia
S&P:Re-affirmedtheBBBcreditratingwithstableoutlookinMayandNovember2012
Negatives
• Benefitfromahigherratedowner,CLPHoldings
• Strongliquidityprofileandcontinuedprudentriskmanagement
practices
• Verticallyintegratedelectricitygenerationandretailing
components of the business
• Operationalflexibilityderivedfromtheplantportfoliobyfuel
and dispatch merit order
• ExpecttheintegrationprocessofNSWassetsandassociated
costs will be managed without significant impact on the
business risk profile
• RiskofintegratingtheretailbusinessandDeltaWestern
GenTrader assets
• Challengestomanagepotentialportfoliochangestomitigate
its exposure to the government’s carbon abatement scheme
• Exposuretothecompetitiveelectricitywholesaleandretail
market
• Risksassociatedwiththeintroductionofthenewbillingsystem
Positives
CLP Holdings 2012 Annual Report 75

Financial Capital
Financial Risk ManagementThe objectives of our financial risk management are simple and straightforward. From a shareholder’s perspective, we maintain
a healthy capital structure and protect our earnings / cash flows so that we can create value to shareholders. From a customer’s
perspective, we avoid undue volatility of tariffs. We achieve these objectives by applying risk management policies and guidelines
which are easy to understand, comprehensive and can apply throughout our subsidiaries and majority-owned entities.
We look for cost-efficient, plain vanilla and HKAS 39 hedge-effective derivative instruments when we enter into hedging. The
reason is simple – at CLP we transact financial derivatives only for hedging economic exposures. We expect such hedging to
cover our genuine economic obligations, without undue profit and loss impact.
From time to time we review our risk management policies and guidelines to ensure they meet financial market challenges and
our latest business requirements. These risk management policies and guidelines play a key role in delivering shareholder value,
through the monitoring of capital reserve level, retained earnings, debt gearing level and risk and return thresholds as a key
discipline in CLP’s investment and financing decisions.
LiquidityCLP is risk averse. We are careful in using new debt to fund business expansion and set rigid debt limits to guard against over-
expansion. We practice just-in-time financing to minimise financing costs. However, we will act promptly to secure financing on
favourable terms when there are requirements or benefits to doing so. In that regard CLP Holdings’ share placement and CLP
Power Hong Kong’s strategic bond issues have strengthened our liquidity position for 2013 and beyond.
Foreign Exchange and Interest RateCLP hedges a high percentage of committed exposure and a reasonable portion of high probability exposure. All hedging is
carried out with pre-approved financial institutions with strong financial standing (credit rating, balance sheet) and capability
in managing such risks on our behalf so that we have confidence that these financial institutions will be able to perform their
obligations throughout the entire tenor of our economic exposure. Each of the financial risks and the associated mitigation
measures are discussed in detail under “Financial Risk Management” in the Financial Statements at page 211.
A capital intensive business – the capital cost of a 50MW wind farm in the Chinese mainland can exceed HK$480 million, of which about two-thirds will be funded by project finance
76 CLP Holdings 2012 Annual Report

Ratio of Debt with Maturity Beyond Five Years to Total Debt
%
20
30
40
50
60
Dec 12Dec 11Dec 10Dec 09Dec 08
How does CLP evaluate the use of different types of debt financing and how does the financing decision affect investment return and overall cost of debt to the Group?
We take a holistic, long-term and pragmatic view when we plan for and execute financing. We keep track of global financial market developments and maintain a dialogue with global / regional financial institutions and investors to identify financing opportunities. We compare various financing options with regard to regulation, documentation, commercial terms and execution risk. We will convert non-functional currency financing proposals into functional currencies (e.g. H.K. dollar for CLP Holdings and CLP Power Hong Kong, Australian dollar for EnergyAustralia) to mitigate foreign currency risk. When it comes to debt portfolio management, we prefer to use long tenured financing (notably public and private bonds) to match long-term capital spending; and apply short to medium-term financing (mostly revolving and money market loans) to pay for working capital and fuel cost. We also diversify to avoid concentration risk (investor base, tenor, currency) so long as it is commercially viable to do so.
In Hong Kong and Australia, our investment grade credit ratings, integrated business model and good asset size have enabled us to borrow in the most cost effective corporate finance segment (both in form of bank loans and bonds). For projects outside Hong Kong (Chinese mainland, Taiwan, India, Southeast Asia) we follow a more prudent approach to raise non-recourse, long-term project level debt based on the project structure and financials. This requires lenders to critically review the business / financial integrity of those investments but the due diligence process can ensure those projects can stand on their own feet without CLP Holdings’ financial support or guarantee.
Mitigating Refinancing Risk in the Longer TermWhile we exercise prudence in maintaining liquidity, we continue to monitor our debt gearing ratio, diversify funding, manage
financial risks (foreign exchange, interest rate, refinancing, counterparty) and maintain long-term relationships with lenders and
investors. We also remain vigilant in spreading out debt tenors to the fullest extent possible to reduce refinancing risk. This is
particularly important for the power industry, as the payback period for investments is exceptionally long. The extremely low
level of interest rates in these years, the good investment grade credit rating of CLP’s subsidiaries and the pursuit of yield by
investors have enabled us to significantly extend debt maturities to five years and longer, occasionally up to 30 years, without
compromising on the major terms of borrowing.
Mark TakahashiGroup Director & Chief Financial Officer
Mr. Hidekazu HorikoshiExecutive OfficerRegional Head for Hong KongGeneral ManagerThe Bank of Tokyo-Mitsubishi UFJ, Ltd.Hong Kong Branch
CLP Holdings 2012 Annual Report 77
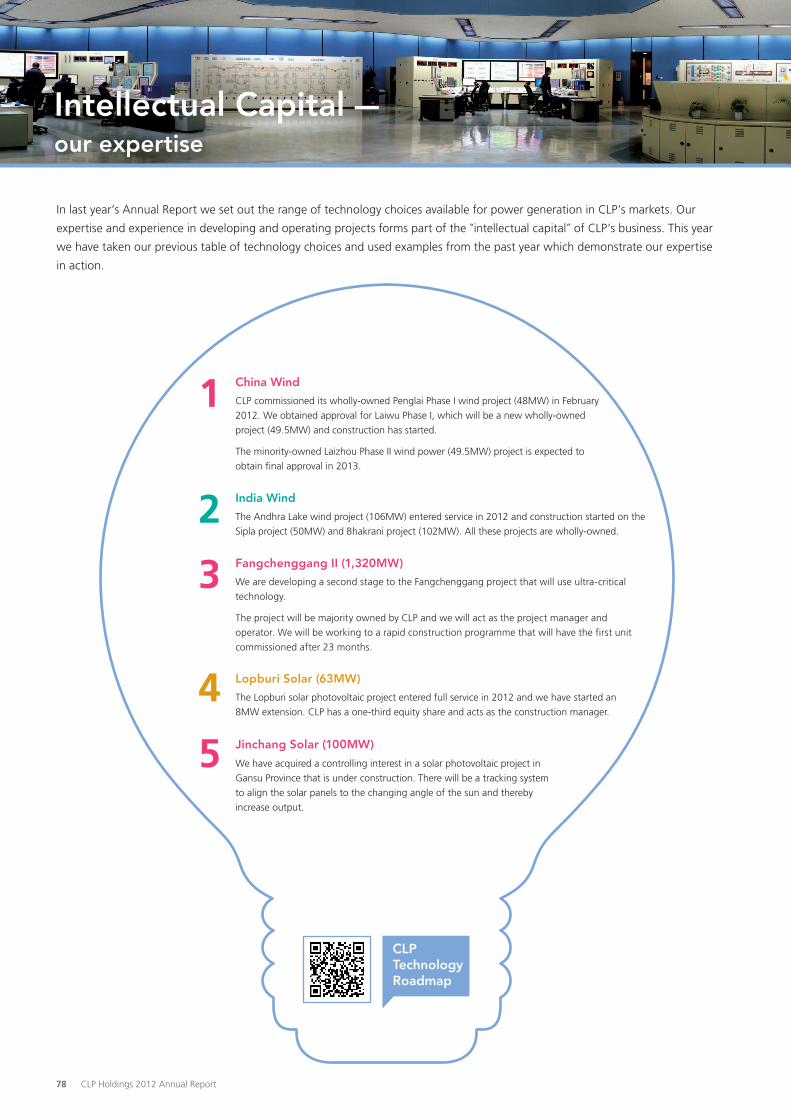
In last year’s Annual Report we set out the range of technology choices available for power generation in CLP’s markets. Our
expertise and experience in developing and operating projects forms part of the “intellectual capital” of CLP’s business. This year
we have taken our previous table of technology choices and used examples from the past year which demonstrate our expertise
in action.
China Wind
CLP commissioned its wholly-owned Penglai Phase I wind project (48MW) in February
2012. We obtained approval for Laiwu Phase I, which will be a new wholly-owned
project (49.5MW) and construction has started.
The minority-owned Laizhou Phase II wind power (49.5MW) project is expected to
obtain final approval in 2013.
1
Lopburi Solar (63MW)
The Lopburi solar photovoltaic project entered full service in 2012 and we have started an
8MW extension. CLP has a one-third equity share and acts as the construction manager.4
Jinchang Solar (100MW)
We have acquired a controlling interest in a solar photovoltaic project in
Gansu Province that is under construction. There will be a tracking system
to align the solar panels to the changing angle of the sun and thereby
increase output.
5
India Wind
The Andhra Lake wind project (106MW) entered service in 2012 and construction started on the
Sipla project (50MW) and Bhakrani project (102MW). All these projects are wholly-owned.2
Fangchenggang II (1,320MW)
We are developing a second stage to the Fangchenggang project that will use ultra-critical
technology.
The project will be majority owned by CLP and we will act as the project manager and
operator. We will be working to a rapid construction programme that will have the first unit
commissioned after 23 months.
3
Intellectual Capital – our expertise
CLP Technology Roadmap
78 CLP Holdings 2012 Annual Report

1980
Advanced Small Medium ThermalSub-critical
Supercritical
Ultra-critical
FirstGeneration
SecondGeneration
ThirdGeneration
Photo-voltaic
Onshore Offshore
Renewables
Low Carbon
Gas SolarWindHydroCoal Nuclear
Fossil Fuels
Power Generation
1990
2000
CLP’s ChoicesFor The Future
CastlePeak BHongKong
Ho-PingTaiwan
BLCPThailand
Future Future Future Future
JhajjarIndia
Fang-cheng-gangChina
HuaijiChina
Yang_erChina
Jiang-bian
China
Future
DayaBay
China
Yang-jiangChina
Future
LopburiThailand
PaguthanIndia
BlackPointHongKong
Talla-warra
Australia
Future
AdvancedGas
Ultra-criticalCoal
Third Generation
Nuclear
MediumHydro
SolarPhoto-voltaic
SolarThermal
OnshoreWind
OffshoreWind
Australia
China
India
20102
CastlePeak AHongKong
3
1
Future
5
4
CLP’s Choices of Technology – Past, Present and Future
CLP Holdings 2012 Annual Report 79

Strong values and high standards contribute to building and protecting CLP’s reputation, supporting key relationships and
earning the trust and loyalty of our stakeholders. Our reputation and the quality of the relationships we have with government,
regulators, decision-makers, customers and communities help establish and safeguard our “social franchise” – the acceptance by
society of CLP as a provider of an essential public service.
CLP’s values are expressed in a formal “Value Framework” which we first published in 2003 and have periodically updated to
reflect the developments in our business and feedback from stakeholders. This Value Framework expresses our vision, mission,
core values, commitments, policies and our Code of Conduct. It covers all areas of our operation and applies to everyone in the
CLP Group. It is a continuing statement of where and what CLP wants to be, the standards which we expect of ourselves and
which stakeholders can expect from us.
Relationship Capital – our values, reputation and community involvement
Vision
CLP’s vision is to be the leading responsible energy provider in the
Asia-Pacific region, from one generation to the next.
Mission
In a changing world, our mission is to produce and supply energy with
minimal environmental impact to create value for shareholders, employees
and the wider community.
Values
Our values guide us in fulfilling our mission and turning CLP’s vision into reality.
Commitments
Our commitments are the promises that we make to our stakeholders about the
way in which we will uphold our values.
Policies & Codes
CLP’s policy statements aid in the articulation and incorporation of our values
and commitments into our everyday operations and practices.
80 CLP Holdings 2012 Annual Report

CLP Holdings 2012 Annual Report 81
Throughout this Annual Report we describe the different ways in which these values are brought to all of our activities in all
of the markets in which we operate. In this section of the Annual Report we briefly explain how our community investment
activities also serve as an opportunity to put our values into action and the contribution this can make to our reputation and the
quality of our relationships with local communities.
Through the provision of electricity, CLP’s business powers the social and economic development of the communities we serve.
Our community investment activities complement the way in which our core business contributes to society, by improving the
quality of life for communities through donation of our skills, expertise and resources and through working in partnerships with
local, regional and international organisations. The four focus areas of our community investment initiatives are: climate change
and the environment; youth education and development; community health and wellness; and arts and culture. These initiatives
are more extensively described in our Sustainability Report. In this Annual Report, we give an outline of these activities by taking
an example of one initiative which is pursued at a Group level and then a selected example from each of our major business
streams. Together, these illustrate the range and variety of such initiatives and the way they are built around the four focus
areas.
2012 marks the final year of the CLP Group’s 5-Year Regional Tree-Planting Programme. Launched in 2008, this Group
programme was intended to enhance awareness of CLP’s Climate Vision 2050, address local environmental challenges, and
create platforms for stakeholder engagement. At all sites we have used a science-based approach to design and implement
the tree-planting programme. For example, subject to approval of local forestry or agricultural departments, a majority of
trees planted were native species, with non-natives planted to serve as fire barriers. In addition to the planting, CLP assumed
responsibility for the maintenance of the site for two years, and engaged horticultural experts to monitor the growth of the
seedlings and track changes in soil quality. Each project was designed to address a local environmental challenge:
• 250,010treeswereplantedatasitenearTuenMunintheNewTerritorieswhichhadbeendamagedbyhillfires,withthe
goal to improve soil quality and reforest the area.
• 593,060treeswereplantedatthreesitesintheMainland.Thisincluded503,100treestopreservethewaterqualityofthe
Dongjiang (East River), a major source of water for Hong Kong, as well as 59,960 trees to reduce soil erosion in Sichuan. In
Jilin Province over 30,000 Russian Olives were planted to mitigate the effects of desertification near our Qian’an Wind Farm
and to yield fruit which could generate additional income for the local community.
• InAustraliawehavesupportedtherestorationofanaturereserveattheecologicallysensitiveWerribeeGorgethrough
the planting of 68,310 trees and shrubs. Restoring the site through the planting programme will protect native vegetation,
including four endangered plant species, and support native animals such as eastern grey kangaroos and swamp wallabies to
continue to live and breed in the area.
• 63,467treeswereplantedinGujarat,including50,031treesandplantswithcommercialvaluetoprovideanadditional
source of livelihood to residents of 70 villages in a semi-arid fragile area.
• 55,420mangroveswereplantedatPhetchaburiProvinceinThailandwiththeintentionofcreatinganaturalprotectivebarrier
for marine life. Due to the low plant survival rate, we decided to replace this programme with that at Qian’an in China. We
are realistic and recognise that not all our community activities are wholly successful. In those cases, we need to reallocate
our resources to reinforce success rather than continue with failure.
In addition to replacing trees that are affected by the CLP Group’s operations, we will continue to plant trees to support
communities’ needs. Through our 5-Year Programme, we have learned the importance of matters such as partner selection, the
need for regular audits and monitoring survival rates. We will apply this experience as we continue to engage in environmental
programmes across the Group.
In Hong Kong, with the Savannah College of Arts and Design Hong Kong (SCAD) and with support from Swire Properties, CLP
staged an exhibit “The Power of Transformation – Machine Becomes Art” at the Pacific Place Mall. This was the culmination of
a year-long collaboration between CLP and SCAD. Instead of selling the retired switchgears for scrap, seven students gave 28
retired switchgears a second life by transforming them into art pieces. The students’ talent exceeded our expectations. As one
CLP colleague observed “As an engineer, I cannot imagine a piece of cold metal can be turned into such amazing artwork”. The
ten-day exhibit was visited by 2,815 individuals, with tens of thousands viewing it every day as they walked pass the exhibit.
Public feedback was highly positive. One visitor noted that the exhibit “brings awareness of how art can be combined with
corporate objectives to promote sustainability”.

82 CLP Holdings 2012 Annual Report
Relationship Capital
In the Chinese mainland we continue our “Support-a-Student” Programme. School children around our assets in Sichuan,
Guangdong and Guangxi receive sponsorship donated by CLP employees, which is then matched by the Company on a 1:1
basis. The schools are selected on the recommendation of local governments and the beneficiaries are students from rural areas
or those whose family income is around or below the local poverty line. In 2012, 354 students benefited from the programme
with much of the support being used to pay dormitory fees so that students need not spend hours walking to school. Whilst
CLP’s support might be small, the improvement to the students’ learning environment is quite visible. As one student noted
“this is really a tremendous help to us”. Others indicated that, with CLP’s support, they would study hard as they recognised
that “studying can help to improve my parents’ quality of life, it can also change my destiny”. Given the positive response to this
programme from our employees and the recipients, CLP will expand the programme to include schools near our operations in
Yunnan Province in the 2012-2013 academic year. We will also strengthen the governance of this programme to ensure that
students receive the assistance in a manner which addresses their learning needs.
In India much of our work is focused on community health, youth education and development. Our initiatives are based on the
“Extension Volunteers” concept. These volunteers from local villages help identify social needs and liaise between CLP and the
villages neighbouring our assets to choose and develop programmes that are relevant and meaningful to their communities.
For example, one problem in rural areas is a high school drop-out rate as children are expected by their families to work on the
land or at home, and neither parents nor children may appreciate the value of formal education. Our colleagues and extension
volunteers monitor school attendance registers. They visit homes, often in the evenings, to encourage parents to support their
child’s return to regular education. Currently 250 children participate in this programme which also educates children on matters
such as health and hygiene.
Given the geographical diversity of our assets in Australia, we take a site-specific or tailored approach to engagements. Most
sites run regular community liaison and environmental review committee meetings. Members of the groups consist of local
EnergyAustralia employees, council representatives, community groups, contractors and residents. These groups decide and
discuss issues of mutual importance, including construction, operation, environmental and social matters. They also provide a
channel through which EnergyAustralia can provide financial and in-kind support for issues important to local communities.
For example, the Yallourn Power Station supported the Moe Dance Eisteddfod, the EnergyAustralia and Rotary Club of Moe
Fun Run / Walk along the Moe-Yallourn Rail Trail to raise funds for the Rotary Club and the 2012 Baw Baw Local Learning and
Employment Network jobs expo, which attracts secondary school students from across the wider Gippsland area.
EnergyAustralia also initiated a number of new engagement activities focusing on education and charitable / non-profit support
in 2012, including:
• The“Inspired by Business” pilot project with Schools Connect and Alkira Secondary College where EnergyAustralia partnered
with a teacher to co-design a more engaging and relevant curriculum unit for students by integrating industry-based
experiences into the teaching of science and mathematics. The project aims to strengthen the real world relevance of the
science and mathematics curriculum in schools.
• A$150,000donationtoStVincentdePaulSocietysothattheSocietycanpurchasetwonewsoupvansfortheirMelbourne
and Moe (Latrobe Valley) nightly provision of food to the homeless.
• TheEnergyAustraliacharityone-on-oneBasketballChallengeandRegatta.Forbothevents,staffwereabletotakepartas
participants or spectators and make a donation to one of the following charities, the Starlight Foundation, Melbourne City
Mission or Smith Family.
As with any investment that CLP makes, we need to be careful that our resources are allocated to community initiatives in a
disciplined and systematic way and that this leads to positive, sustainable outcomes as opposed to having a disruptive effect
on a community or the local environment. In addition, we are aware that we do not hold a licence to be charitable with other
people’s money – namely that of our customers and shareholders. It is in this spirit that we decided to review and update our
Community Investment, Sponsorship and Donation Policy in 2012 to strengthen the design, implementation and measurement
of programmes across the CLP Group to be more accountable to our shareholders and stakeholders. The updated policy is
scheduled to be introduced in early 2013. We are confident that selected community initiatives, carefully chosen, thoroughly
implemented and carefully monitored, do enhance CLP’s reputation and relationships and do enjoy the support of our
shareholders and other stakeholders.
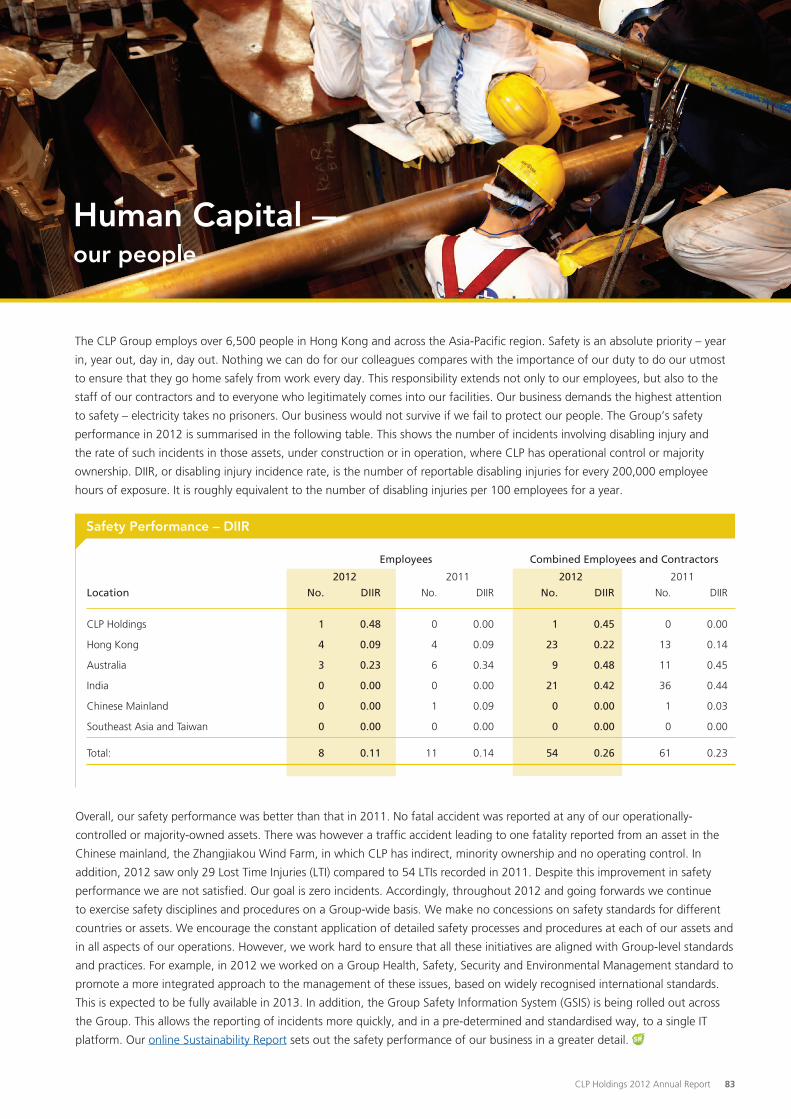
The CLP Group employs over 6,500 people in Hong Kong and across the Asia-Pacific region. Safety is an absolute priority – year
in, year out, day in, day out. Nothing we can do for our colleagues compares with the importance of our duty to do our utmost
to ensure that they go home safely from work every day. This responsibility extends not only to our employees, but also to the
staff of our contractors and to everyone who legitimately comes into our facilities. Our business demands the highest attention
to safety – electricity takes no prisoners. Our business would not survive if we fail to protect our people. The Group’s safety
performance in 2012 is summarised in the following table. This shows the number of incidents involving disabling injury and
the rate of such incidents in those assets, under construction or in operation, where CLP has operational control or majority
ownership. DIIR, or disabling injury incidence rate, is the number of reportable disabling injuries for every 200,000 employee
hours of exposure. It is roughly equivalent to the number of disabling injuries per 100 employees for a year.
Human Capital – our people
Employees Combined Employees and Contractors 2012 2011 2012 2011
Location No. DIIR No. DIIR No. DIIR No. DIIR
CLP Holdings 1 0.48 0 0.00 1 0.45 0 0.00
Hong Kong 4 0.09 4 0.09 23 0.22 13 0.14
Australia 3 0.23 6 0.34 9 0.48 11 0.45
India 0 0.00 0 0.00 21 0.42 36 0.44
Chinese Mainland 0 0.00 1 0.09 0 0.00 1 0.03
Southeast Asia and Taiwan 0 0.00 0 0.00 0 0.00 0 0.00
Total: 8 0.11 11 0.14 54 0.26 61 0.23
SafetyPerformance–DIIR
Overall, our safety performance was better than that in 2011. No fatal accident was reported at any of our operationally-
controlled or majority-owned assets. There was however a traffic accident leading to one fatality reported from an asset in the
Chinese mainland, the Zhangjiakou Wind Farm, in which CLP has indirect, minority ownership and no operating control. In
addition, 2012 saw only 29 Lost Time Injuries (LTI) compared to 54 LTIs recorded in 2011. Despite this improvement in safety
performance we are not satisfied. Our goal is zero incidents. Accordingly, throughout 2012 and going forwards we continue
to exercise safety disciplines and procedures on a Group-wide basis. We make no concessions on safety standards for different
countries or assets. We encourage the constant application of detailed safety processes and procedures at each of our assets and
in all aspects of our operations. However, we work hard to ensure that all these initiatives are aligned with Group-level standards
and practices. For example, in 2012 we worked on a Group Health, Safety, Security and Environmental Management standard to
promote a more integrated approach to the management of these issues, based on widely recognised international standards.
This is expected to be fully available in 2013. In addition, the Group Safety Information System (GSIS) is being rolled out across
the Group. This allows the reporting of incidents more quickly, and in a pre-determined and standardised way, to a single IT
platform. Our online Sustainability Report sets out the safety performance of our business in a greater detail.
CLP Holdings 2012 Annual Report 83
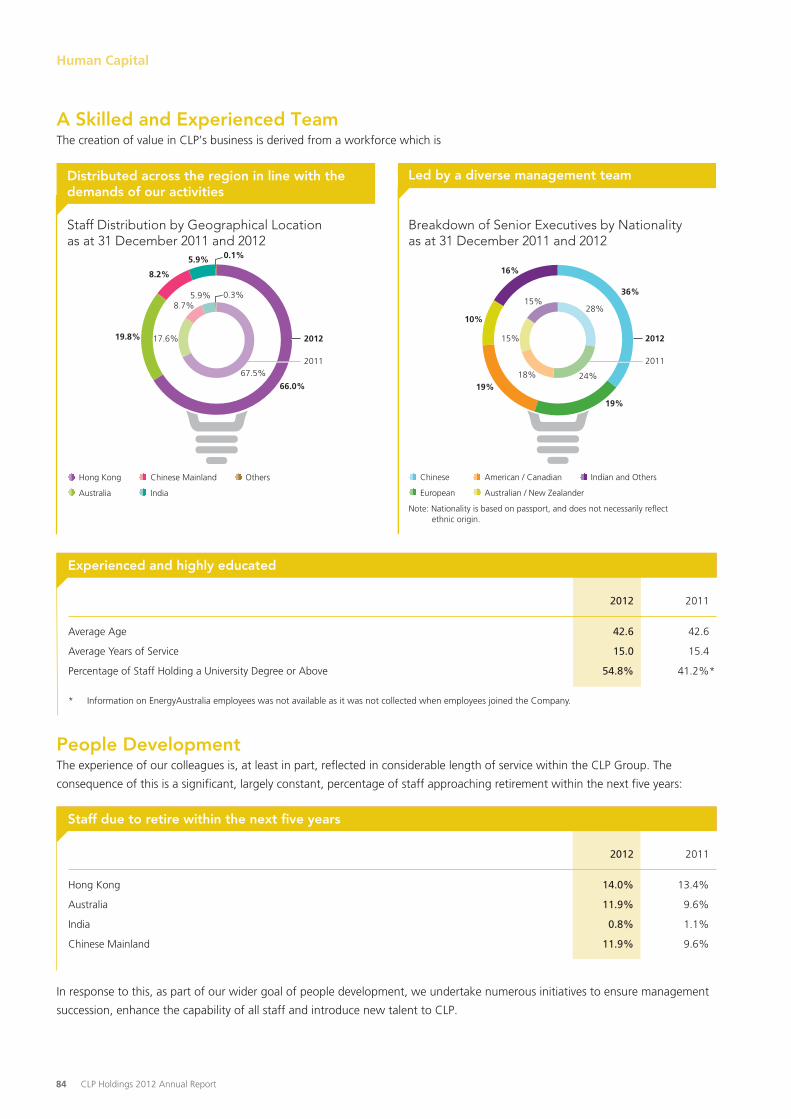
Human Capital
A Skilled and Experienced TeamThe creation of value in CLP’s business is derived from a workforce which is
2012 2011
Average Age 42.6 42.6
Average Years of Service 15.0 15.4
Percentage of Staff Holding a University Degree or Above 54.8% 41.2%*
* Information on EnergyAustralia employees was not available as it was not collected when employees joined the Company.
Experienced and highly educated
PeopleDevelopmentThe experience of our colleagues is, at least in part, reflected in considerable length of service within the CLP Group. The
consequence of this is a significant, largely constant, percentage of staff approaching retirement within the next five years:
2012 2011
Hong Kong 14.0% 13.4%
Australia 11.9% 9.6%
India 0.8% 1.1%
Chinese Mainland 11.9% 9.6%
Staff due to retire within the next five years
In response to this, as part of our wider goal of people development, we undertake numerous initiatives to ensure management
succession, enhance the capability of all staff and introduce new talent to CLP.
Distributed across the region in line with the demands of our activities
Staff Distribution by Geographical Location as at 31 December 2011 and 2012
Breakdown of Senior Executives by Nationalityas at 31 December 2011 and 2012
2012
201167.5%
5.9% 0.3%
0.1%
8.2%
5.9%
8.7%
17.6%19.8%
66.0%
Led by a diverse management team
2012
2011
24%
28%
16%
15%
15%
18%19%
10%
36%
19%
Hong Kong
Australia
Chinese Mainland Others
India
Chinese
European
American / Canadian Indian and Others
Australian / New Zealander
Note: Nationality is based on passport, and does not necessarily re�ect ethnic origin.
84 CLP Holdings 2012 Annual Report

Many of the initiatives are organised on a Group-wide basis such as:
• theAcceleratedLeadershipAssessmentandDevelopmentProgramme,wherebyninecolleagueswithhighleadership
potential undertook a comprehensive process of individual assessment, career discussion and personal development planning.
• 20highpotentialstaffcompletedtheRichardIveyBusinessSchoolConsortiumManagementProgrammeinHongKong.
• 11CLPcolleaguesjoinedtheExecutiveConsortiumProgrammeruninconjunctionwithTsinghuaUniversity’sSchoolof
Economics and Management.
The Group-wide initiatives are supported by particular programmes and actions in each of our business units, of which only a
few examples are given below:
• InHongKong,87%ofthestaffmovementwehadplannedaspartofourManagementDevelopmentandSuccession
Planning cycle were achieved. In addition, four development centres were organised to assess the leadership capability and
future potential of 31 of our younger managers.
• 40CraftApprentices,TechnicianTraineesandGraduateTraineesjoinedCLPPowerinAugust2012asoneofourmeasures
to ensure the ongoing supply of technical talent.
• OurPRCHumanResourcesForumallowedparticipantsfromacrossourfacilitiesinbothHongKongandtheMainlandto
share best HR practices, as well as incorporating a learning programme to help colleagues to enhance personal and team
effectiveness.
• 95managersattendedFocusedEnergyLeadershipProgrammesinAustralia.Towardstheendof2012theHRfunction
in EnergyAustralia was redesigned and renamed “People and Culture”. This sharpened our focus on talent management
and organisational effectiveness to build our capability in support of the organisation’s strategy, strengthen our employee
engagement and improve the overall effectiveness of the organisation.
• InIndia,ourpeoplepracticeswereaimedatretainingourbesttalentandcontributingtotheirprofessionalandpersonal
growth. For example, a “Competency Framework” detailing five behavioural compentencies expected of employees was
rolled out. This was integrated with the Performance Management System.
• Wecontinuedwiththedevelopmentofhome-growntechnicaltalentinIndiathroughthehiringandtrainingofengineers
under the Graduate Engineer Trainee (GET) Programme. As part of this programme, 19 engineers took up assignments
at Jhajjar and Paguthan in 2012 on completion of their classroom and on-the-job training. Nine engineers are currently
undergoing classroom training at the National Power Training Institute under this programme.
Total formal training man-days across the CLP Group amounted to an average of 5.6 training days per employee in 2012
(compared to 5.4 training days in 2011). All of this training is intended to enhance CLP’s “Human Capital” for the benefit of the
business, and the individuals concerned, by enhancing their performance in their current roles or preparing them for further
career advancement.
The current SoC Agreement is due to expire in 2018 if Government decides not to exercise the option to extend it for another five years. Do you think there will be big impact to the staff, either in terms of changes in the remuneration and benefits, or the manpower level?
Whatever the regulatory arrangements in place after 2018, it is always our fundamental aim to ensure that we have the right number and mix of staff and skills for the business and market environment in which we are operating. Given the need to rejuvenate our workforce in the next few years, the Company will continue to offer market competitive remuneration and benefits so that we can attract, retain and motivate high performing employees.
Mr. Chiu Ka WaiSenior Tradesman (Special) – Engineering Assistant, CLP Power
Richard LancasterGroup Director –
Managing Director Hong Kong
CLP Holdings 2012 Annual Report 85

Environmental Capital
At first glance it might seem odd for a power company to speak of “environmental capital” rather than to consider
environmental issues more as costs, liabilities or risks. However, we regard the efficient and reliable delivery of electricity within
our region as a positive contribution to the environment, especially since electricity is clean at the point of use. We also think
that conducting our business in an environmentally responsible way creates value for CLP – we can distinguish ourselves from
our competitors, manage our liabilities to environmental penalties, mitigate the future impact of tightened environmental
regulation on the assets we build, own or operate, and earn greater acceptance from governments and communities.
In this section we highlight core aspects of our environmental performance. These are described in much greater detail in our
online Sustainability Report.
ClimateVision2050In 2007 we announced CLP’s Climate Vision 2050. We committed ourselves to playing our role in the collective response to the
threat of global warming by setting specific targets and commitments to reduce the CO2 intensity of our generating portfolio.
Our Climate Vision 2050 started a journey towards reducing CO2 emissions by expressing our commitment to decarbonise our
generation portfolio by 75% (from 0.84 kg to 0.2 kg CO2 / kWh) by 2050 and setting targets for increasing the percentage
of non-carbon emitting generation in our portfolio. This decision to reduce the carbon intensity of our generation portfolio
involved a fundamental change in the way we do business and measure our performance. In 2010, we revised our Group’s
intermediate target for carbon intensity by 2020 from 0.7 kg CO2 / kWh to 0.6 kg CO2 / kWh. This was because the progress we
had already made and the commercial and technological environment allowed CLP to move more quickly on its journey to a
low-carbon future.
Our Climate Vision 2050, including the targets we have set, is based on reducing the proportion of coal in our generation
portfolio while increasing the use of natural gas, nuclear power and renewable energy. We will continue to push for energy
efficiency within our operations, and to support our customers to increase their own energy efficiency. As of 31 December 2012:
• ThetotalCO2e emissions from CLP operationally controlled facilities in 2012 was 38,464 kilotonnes (kT), a decrease of 13.5%
compared to 44,450kT in 2011.
• Thecarbonintensityofourgenerationportfolio(equitybased)was0.77kgCO2 / kWh, a decrease of 3.8% compared to 0.8
kg CO2 / kWh in 2011.
Since 2007, we have invested close to US$3 billion in renewable energy assets, aligning our investments with the emergence
of policies and incentives across our regional portfolio which have supported zero and low-emissions generation. Our target to
have 20% of our generating capacity in non-carbon emitting sources by 2020 was met on 31 December 2010, 10 years ahead
of schedule. We have, therefore, raised our non-carbon emitting target to 30% by 2020. At the start of 2012, renewable energy
accounted for 18.3% (equity based) of CLP Group’s generation portfolio. To give an idea of the pace of our efforts, in 2004
renewable energy accounted for less than 1% of CLP’s generation portfolio.
Environmental Capital –our contribution to the environment
86 CLP Holdings 2012 Annual Report

As of 31 December 2012, CLP’s progress towards our Climate Vision 2050 targets (equity based) was 20.2% renewable energy
(2020 Target: 20%) and 23.8% non-carbon emitting generation (2020 Target: 30%).
3.6%
0.1%
16.3%
3.6%
0.2%
CLP’s Generation Portfolio – Energy Sources
23.8%
58.5%
16.8%
0.9%
Oil Non-carbon emitting Coal Gas Biomass Solar Nuclear Wind Hydro
In 2012, we undertook Climate Change Adaptation Assessments for three power plants (Fangchenggang, Jhajjar and Tallawarra)
to judge their readiness to adapt to the consequences of climate change. This is a continuation of the pilot study completed in
2010 for Paguthan and Ho-Ping Power Stations.
Air QualityCLP measures air emissions at our facilities. We maintain operations within regulatory and permit limits and track emissions
across the Group through an online data management system. Where regulations are lacking, we apply the best available
technologies and follow international best practices, wherever possible. We also try to use lower emitting types of fuels and
to diversify our fuel mix towards cleaner fuel and renewable energy sources. In 2012, we continued our efforts to reduce our
emissions across our generation assets. By the end of the year, we had achieved reductions of emissions of sulphur dioxide (SO2),
nitrogen oxides (NOx) and total suspended particulates (TSP) by 2%, 11% and 24% respectively, compared to 2011.
Verifying our environmental data – our laboratory at Fangchenggang
CLP Holdings 2012 Annual Report 87
Environmental Capital
Water UseConventional power plants require a substantial amount of cooling and process water. And, of course, water availability directly
affects the performance of our hydroelectric power stations.
In 2012, facilities under CLP’s operational control used a total of about 4,690Mm3 (2011: 4,732Mm3) of water, mainly for cooling
purposes at our thermal power facilities. About 99% of the water came from sea water sources. Less than 1% was withdrawn
from freshwater sources (municipal and groundwater). The total water discharged in 2012 from these facilities was 4,666Mm3
(2011: 4,710Mm3) with the majority of the discharge returned to the sea.
In light of the importance of water resources to electricity generation, we initiated a Group-wide Water Use Study in 2012 to
map the water use at our facilities and to compare this against industry benchmarks. The study, when completed, will provide
the basis on which we will pursue future water efficiency and water saving measures.
WasteWe work hard both to reduce the amount of waste produced from the construction, demolition and operation of our power
generation facilities and to increase the amount recycled. While following local regulations on treatment and disposal of waste
as a minimum standard, we work with qualified parties and partners to reuse and recycle waste and by-products, whenever
opportunities to do so are available.
In 2012, facilities under our operational control generated a total of 11,092 tonnes and 1,521 kilolitres of solid and liquid waste
respectively (excluding ash and gypsum by-products). This compared to 7,100 tonnes and 912 kilolitres respectively in 2011.
Total ash and gypsum produced and recycled was 777 kT and 214 kT respectively, while 495 kT of ash and 210 kT of gypsum
produced was recycled or sold. At Castle Peak Power Station, most of the ash is sold as a direct replacement for cement in
concrete production. Lower quality ash, such as furnace bottom ash, raw pulverised fuel ash (PFA) and reject PFA is sold to a
local cement plant.
BiodiversityBiodiversity and the healthy functioning of eco-systems are important for our business. This is particularly so for renewable
projects as these tend to be located in relatively undeveloped locations. The design of CLP facilities takes into account the
avoidance, minimisation and mitigation of potential biodiversity impacts of our facilities from construction and operation
through to the decommissioning stages.
In 2012, we developed a new Group-level Biodiversity Policy Statement and Guidelines, as well as a tool to incorporate the
assessment of biodiversity risks into our internal Pre-Investment Environmental Risk Assessment process. The aim of this tool is to
help evaluate and address significant biodiversity impacts of new projects and major retrofits. This initiative has been developed
according to the principles laid out in the latest International Finance Corporation Performance Standard 6.
EnvironmentalRegulation:ComplianceandBeyondAs of 31 December 2012, we had no environmental regulatory non-compliance incidents that resulted in fines or prosecutions.
However, compliance is only the minimum standard – we treat it as the floor to our environmental performance. We are
committed to the responsible management of both the short and long-term impacts of our business on the environment.
This commitment goes beyond compliance and applies to all stages of our business – from planning, building, operation,
maintenance to the decommissioning of our facilities and equipment.
88 CLP Holdings 2012 Annual Report
Related Documents