CapitaLand Limited Presentation For Debt Investor Non-Deal Roadshow 6 March 2015

Welcome message from author
This document is posted to help you gain knowledge. Please leave a comment to let me know what you think about it! Share it to your friends and learn new things together.
Transcript
CapitaLand Limited
Presentation For Debt Investor
Non-Deal Roadshow
6 March 2015
2
Disclaimer
This presentation may contain forward-looking statements that involve risks and uncertainties.
Actual future performance, outcomes and results may differ materially from those expressed in
forward-looking statements as a result of a number of risks, uncertainties and assumptions.
Representative examples of these factors include (without limitation) general industry and
economic conditions, interest rate trends, cost of capital and capital availability, availability of real
estate properties, competition from other companies and venues for the sale/distribution of goods
and services, shifts in customer demands, customers and partners, changes in operating expenses,
including employee wages, benefits and training, governmental and public policy changes and
the continued availability of financing in the amounts and the terms necessary to support future
business. You are cautioned not to place undue reliance on these forward looking statements,
which are based on current view of management on future events.
3
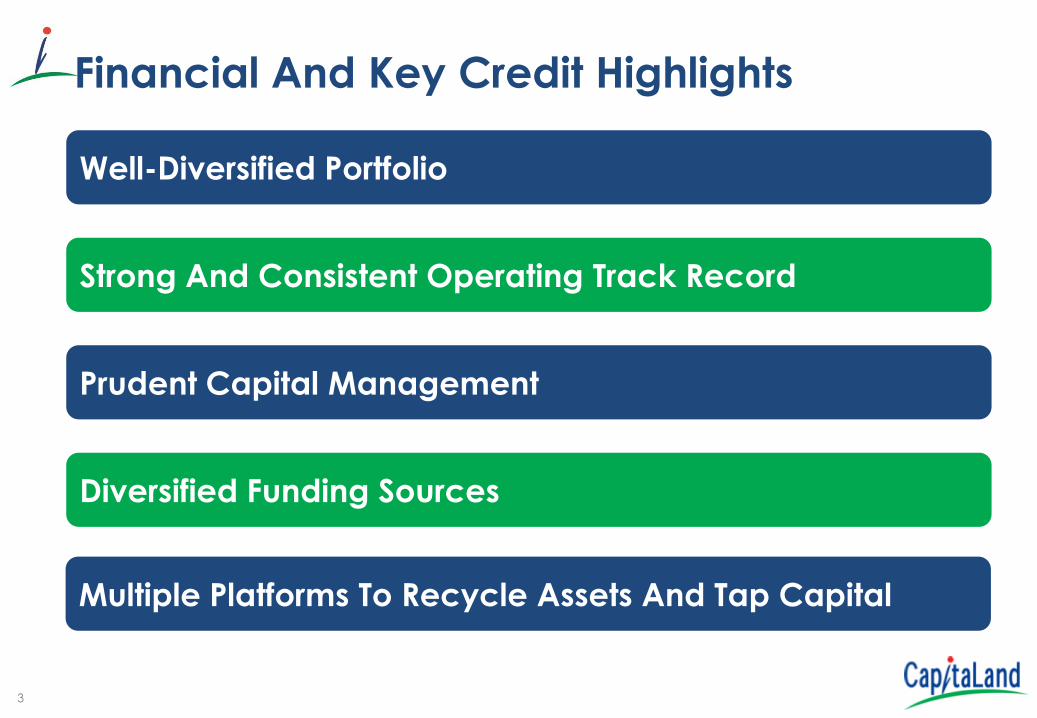
Well-Diversified Portfolio
Strong And Consistent Operating Track Record
Prudent Capital Management
Diversified Funding Sources
Financial And Key Credit Highlights
Multiple Platforms To Recycle Assets And Tap Capital
4 CapitaLand Limited 1Q2014 Results
ION Orchard, Singapore
Well-diversified Portfolio
5
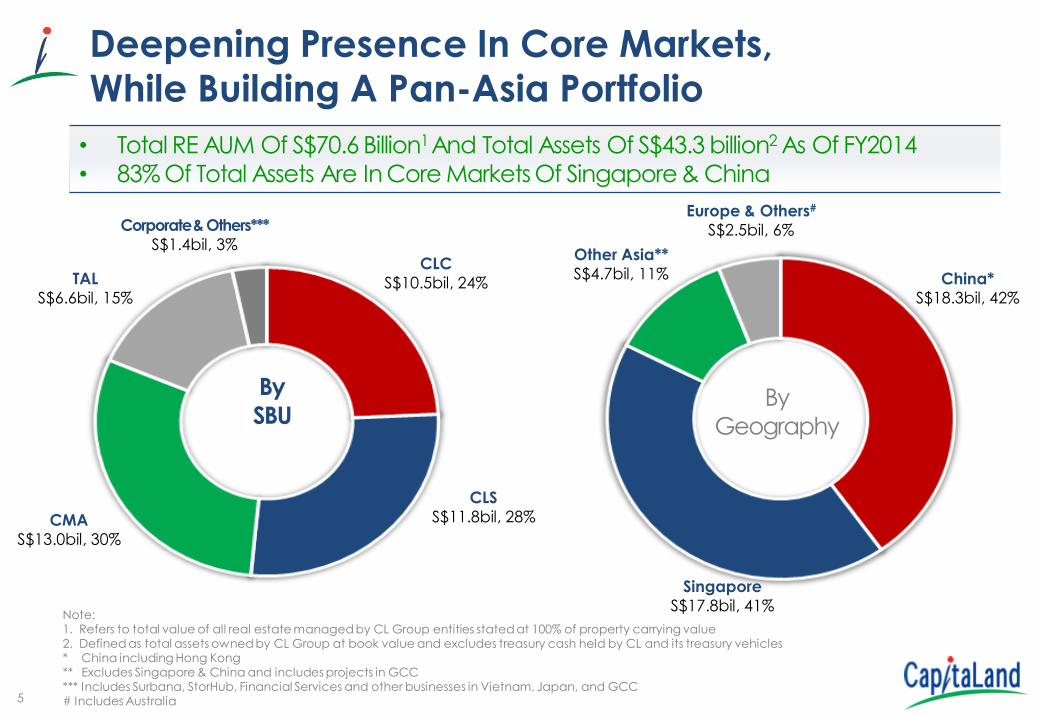
Europe & Others#
S$2.5bil, 6%
By
Geography
China*
S$18.3bil, 42%
Singapore
S$17.8bil, 41%
Other Asia**
S$4.7bil, 11%
• Total RE AUM Of S$70.6 Billion1 And Total Assets Of S$43.3 billion2 As Of FY2014
• 83% Of Total Assets Are In Core Markets Of Singapore & China
Note: 1. Refers to total value of all real estate managed by CL Group entities stated at 100% of property carrying value 2. Defined as total assets owned by CL Group at book value and excludes treasury cash held by CL and its treasury vehicles * China including Hong Kong ** Excludes Singapore & China and includes projects in GCC *** Includes Surbana, StorHub, Financial Services and other businesses in Vietnam, Japan, and GCC # Includes Australia
By
SBU
Deepening Presence In Core Markets, While Building A Pan-Asia Portfolio
CMA
S$13.0bil, 30%
Corporate & Others***
S$1.4bil, 3%
CLC
S$10.5bil, 24%
CLS
S$11.8bil, 28%
TAL
S$6.6bil, 15%
6
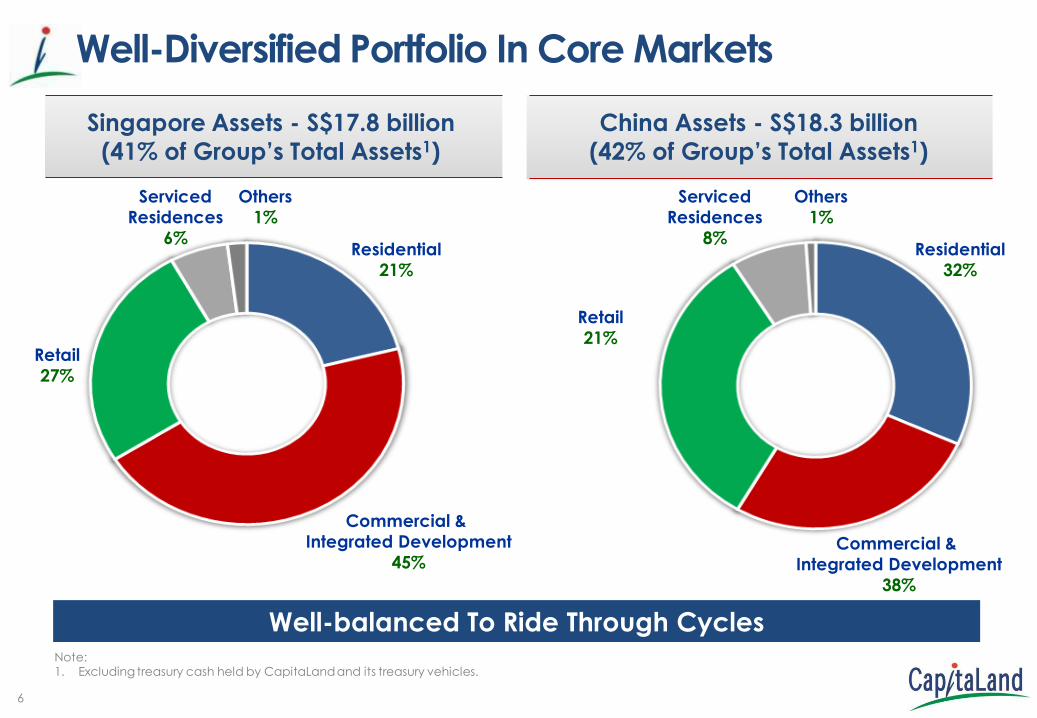
Commercial &
Integrated Development
45%
Residential
21%
Retail
27%
Serviced
Residences
6%
Others
1%
Singapore Assets - S$17.8 billion
(41% of Group’s Total Assets1)
China Assets - S$18.3 billion
(42% of Group’s Total Assets1)
Well-Diversified Portfolio In Core Markets
Well-balanced To Ride Through Cycles
Others
1%
Residential
32%
Commercial &
Integrated Development
38%
Retail
21%
Serviced
Residences
8%
Note: 1. Excluding treasury cash held by CapitaLand and its treasury vehicles.

7
Residential
26%
Retail
29%
Optimal Portfolio Mix
Majority or ~3/4 Of Total Assets Contribute To Recurring Income; ~1/4 Of
Total Assets Are Trading Income
Others 2%
Serviced Residence
13%
Total Assets By Effective
Stake: S$33.1B(1)
Commercial & Integrated
Developments(2) 30%
2012 2013 (Restated) 2014
Others 2% Serviced
Residence 15%
Total Assets By Effective
Stake: S$28.9B
Commercial & Integrated
Developments(2) 28%
Others 2%
Serviced Residence
12%
Total Assets By Effective
Stake: S$26.8B
Commercial & Integrated
Developments(2) 29%
Note: 1. Refers to total asset by effective stake , excluding Treasury Cash. 2. Excluding residential component. 3. Includes strata office
(3)

8 CapitaLand Limited FY2013 Results CapitaLand Presentation May 2013
Capital Tower, Singapore
Strong And Consistent
Operating Track
Record
9 CapitaLand Limited FY2014 Results
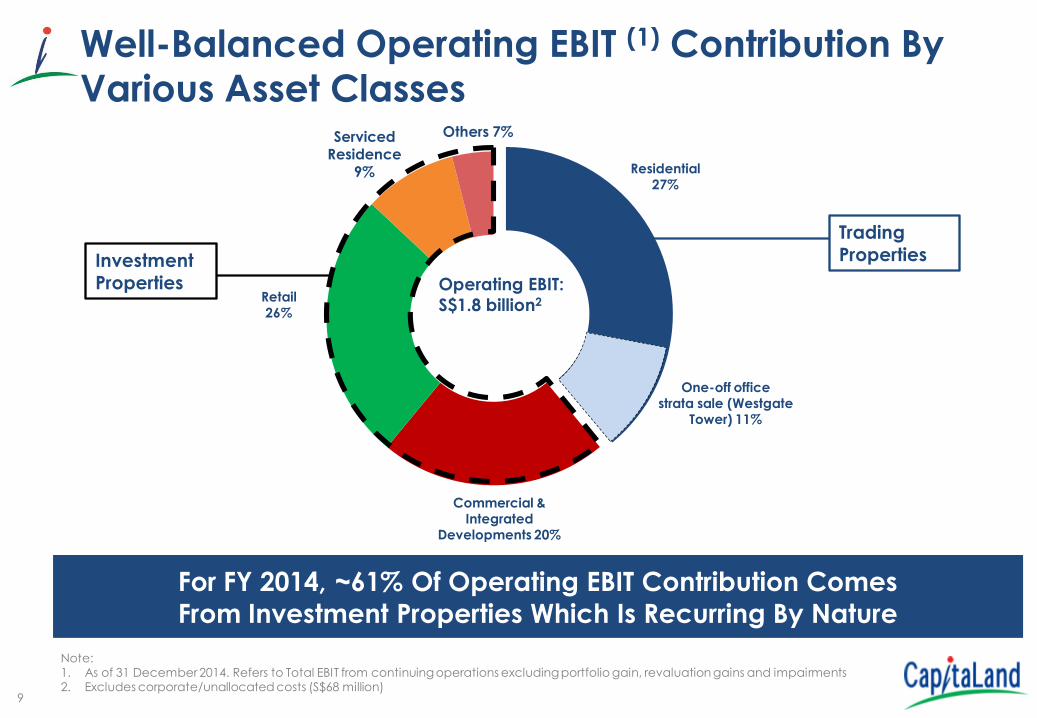
Well-Balanced Operating EBIT (1) Contribution By Various Asset Classes
For FY 2014, ~61% Of Operating EBIT Contribution Comes
From Investment Properties Which Is Recurring By Nature
Others 7% Serviced Residence
9%
Operating EBIT:
S$1.8 billion2
Note: 1. As of 31 December 2014. Refers to Total EBIT from continuing operations excluding portfolio gain, revaluation gains and impairments 2. Excludes corporate/unallocated costs (S$68 million)
One-off office strata sale (Westgate
Tower) 11%
Residential 27%
Commercial & Integrated
Developments 20%
Retail 26%
Investment
Properties
Trading
Properties
10
0
200
400
600
800
1,000
1,200
1,400
Operating Profit Portfolio Gains/ (Losses) Revaluation Gains Impairment PATMI
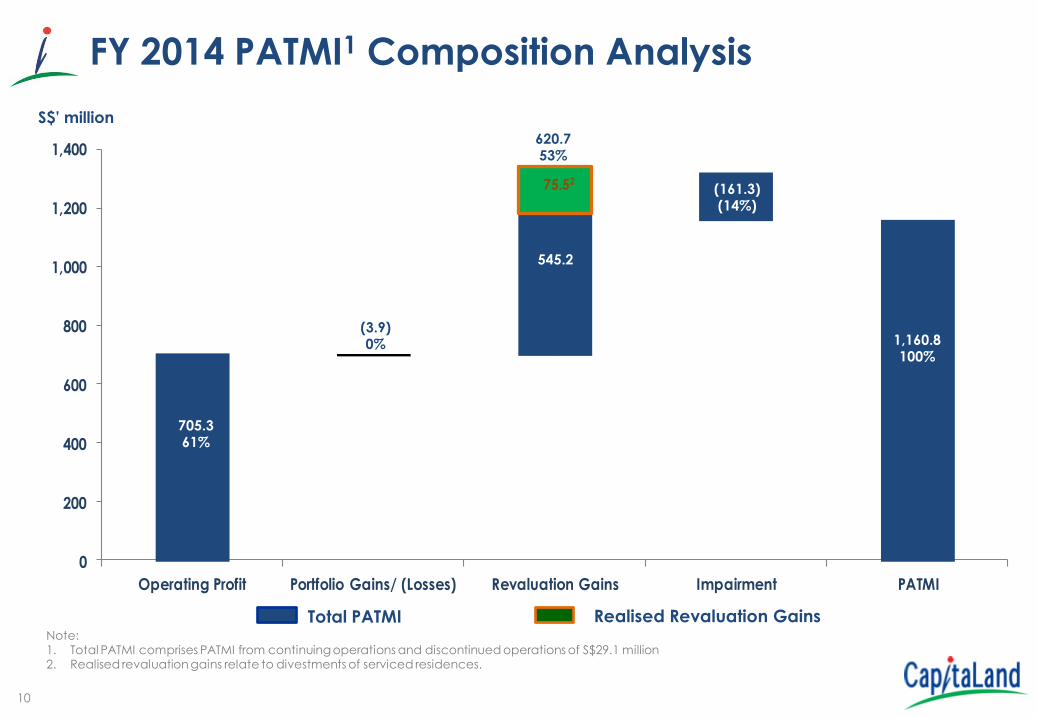
75.52
29.1
12.8
FY 2014 PATMI1 Composition Analysis
S$’ million
705.3 61%
Total PATMI Note: 1. Total PATMI comprises PATMI from continuing operations and discontinued operations of S$29.1 million 2. Realised revaluation gains relate to divestments of serviced residences.
620.7 53%
(3.9) 0%
(161.3) (14%)
1,160.8 100%
545.2
Realised Revaluation Gains
11
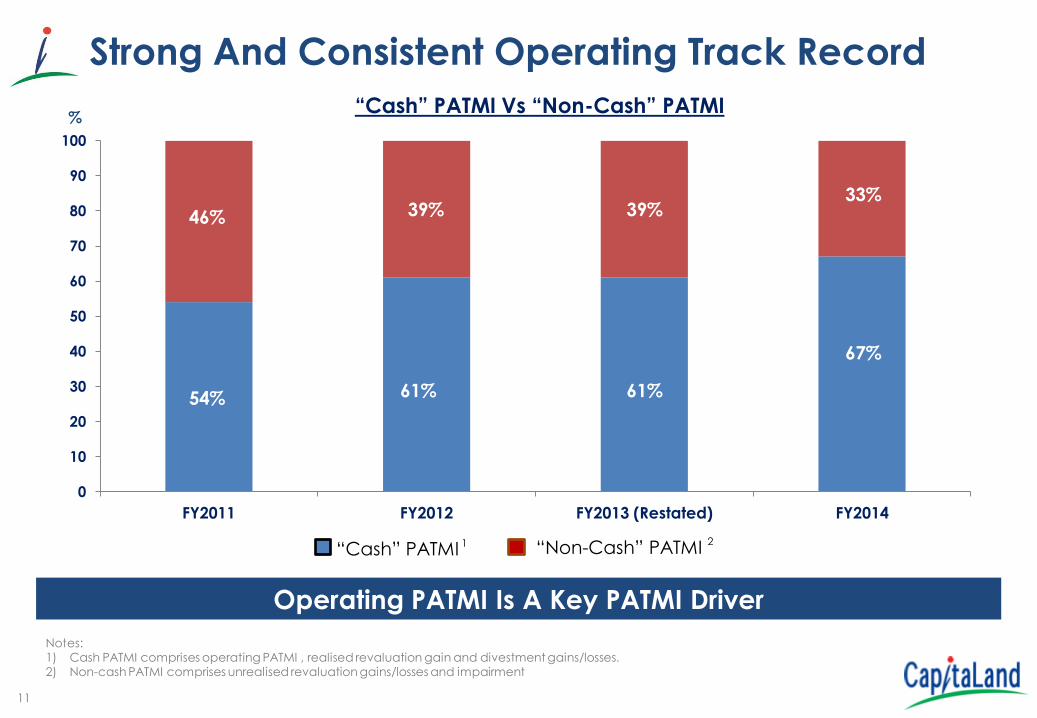
Strong And Consistent Operating Track Record
Operating PATMI Is A Key PATMI Driver
Notes: 1) Cash PATMI comprises operating PATMI , realised revaluation gain and divestment gains/losses. 2) Non-cash PATMI comprises unrealised revaluation gains/losses and impairment
1
2
1
“Cash” PATMI Vs “Non-Cash” PATMI
2
“Cash” PATMI “Non-Cash” PATMI 1 2
0
10
20
30
40
50
60
70
80
90
100
FY2011 FY2012 FY2013 (Restated) FY2014
54% 61% 61%
67%
46% 39% 39% 33%
%
12 CapitaLand Presentation May 2013
Raffles City Beijing, China
Prudent Capital
Management
13
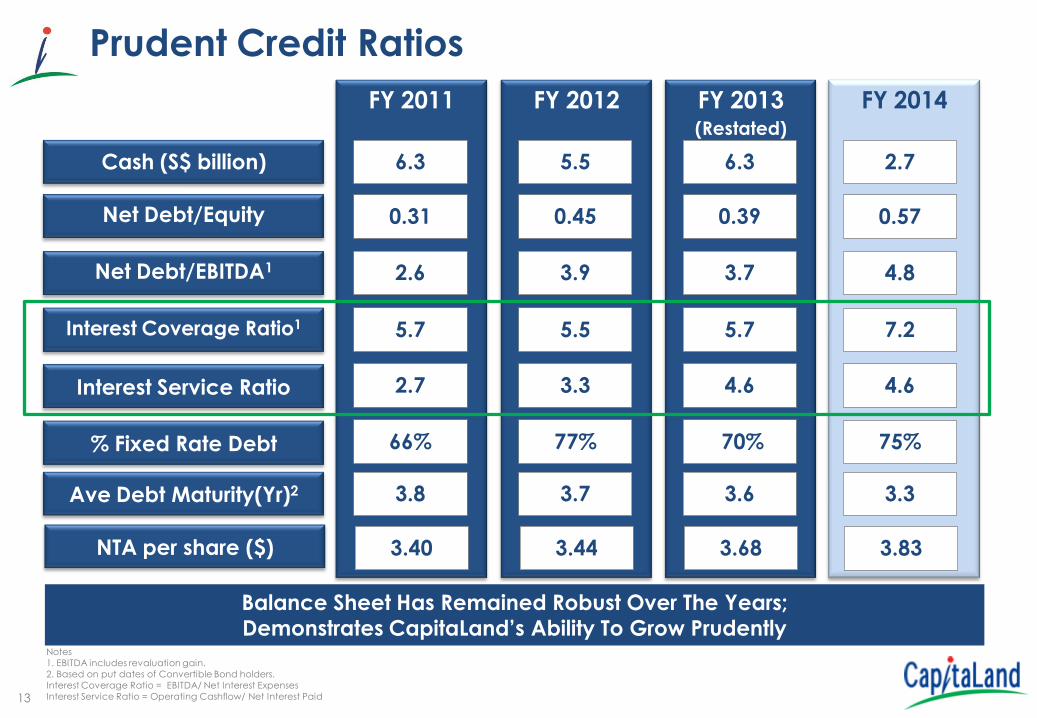
Prudent Credit Ratios
Notes
1. EBITDA includes revaluation gain.
2. Based on put dates of Convertible Bond holders.
Interest Coverage Ratio = EBITDA/ Net Interest Expenses
Interest Service Ratio = Operating Cashflow/ Net Interest Paid
Net Debt/EBITDA1
Interest Service Ratio
Net Debt/Equity
Cash (S$ billion)
% Fixed Rate Debt
Interest Coverage Ratio1
FY 2014
2.7
0.57
4.8
4.6
75%
7.2
FY 2013 (Restated)
6.3
0.39
3.7
4.6
70%
5.7
Ave Debt Maturity(Yr)2 3.3 3.6
Balance Sheet Has Remained Robust Over The Years; Demonstrates CapitaLand’s Ability To Grow Prudently
NTA per share ($) 3.83 3.68
FY 2012
5.5
0.45
3.9
3.3
77%
5.5
3.7
3.44
FY 2011
6.3
0.31
2.6
2.7
66%
5.7
3.8
3.40
14
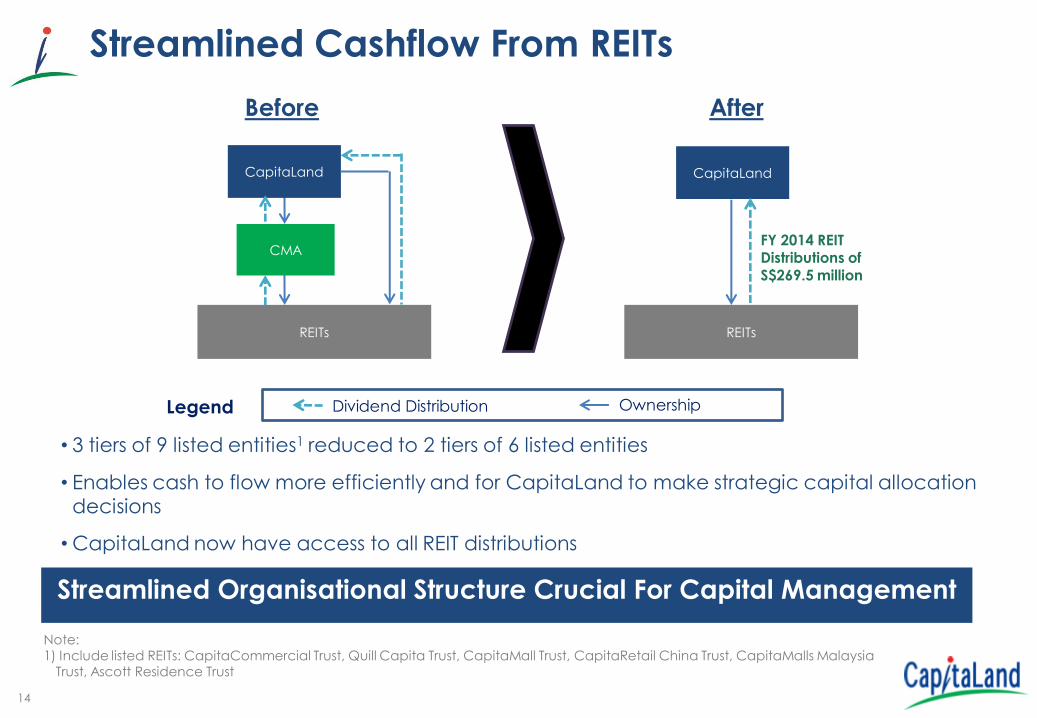
Streamlined Cashflow From REITs
CapitaLand
REITs
FY 2014 REIT Distributions of S$269.5 million
After
• 3 tiers of 9 listed entities1 reduced to 2 tiers of 6 listed entities
• Enables cash to flow more efficiently and for CapitaLand to make strategic capital allocation decisions
• CapitaLand now have access to all REIT distributions
Streamlined Organisational Structure Crucial For Capital Management
CapitaLand
CMA
REITs
Before
Note: 1) Include listed REITs: CapitaCommercial Trust, Quill Capita Trust, CapitaMall Trust, CapitaRetail China Trust, CapitaMalls Malaysia
Trust, Ascott Residence Trust
Dividend Distribution Ownership Legend

15
Well-Managed Maturity Profile (As at 31 December 2014)
Note:
1. Ascott Residence Trust, CapitaCommercial Trust and CapitaMalls Malaysia Trust
2. Based on the put dates of the convertible bonds
76% Of The Group Debt Maturing In 2015 Relates To REIT Level Debt And Project Debt To
Be Repaid With Sales Proceeds/Refinanced
0.8
2.1
0.6
3.5
2.2
2.6 2.9
1.1 1.5
0.5
1.2
0.7
0.0
1.0
2.0
3.0
4.0
5.0
6.0
2015 2016 2017 2018 2019 2020 2021 2022 2023+
Project debt to be repaid with sales proceeds or refinanced as planned
REIT level debt (Existing, separate funding platforms)
S$' billion Total Group cash balances and available undrawn facilities by CL’s treasury vehicles = ~S$5.7bil
Refinancing plans on track for debt due in 2015
1
16
0
5
10
15
20
25
30
35
40
45
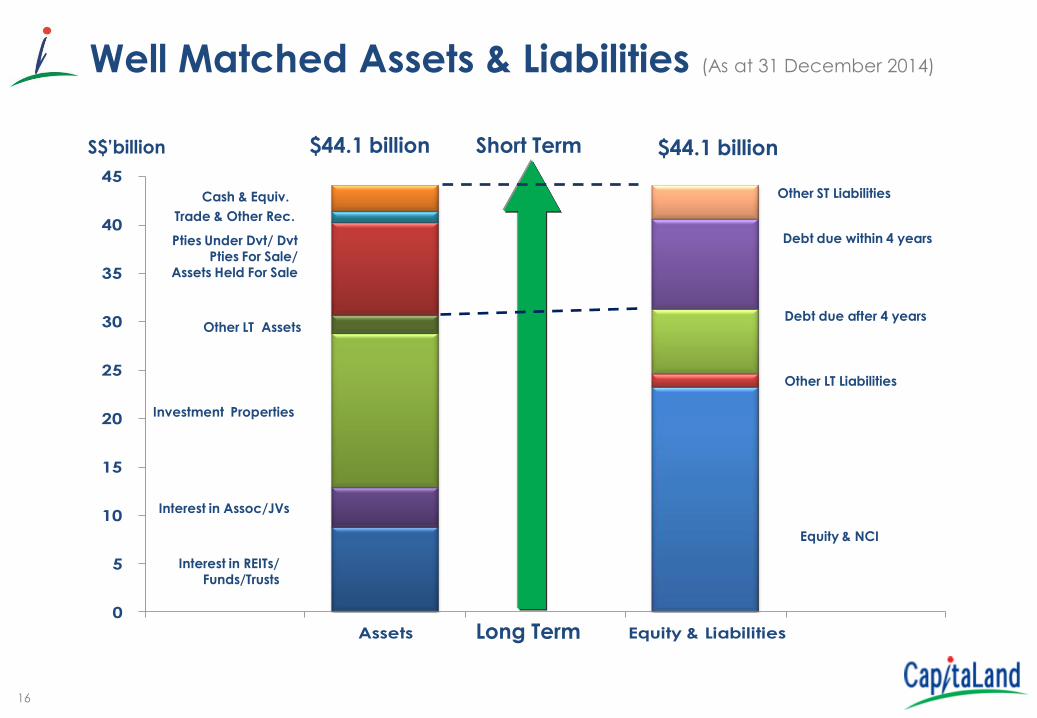
Assets Equity & Liabilities
Well Matched Assets & Liabilities (As at 31 December 2014)
S$’billion $44.1 billion $44.1 billion Short Term
Pties Under Dvt/ Dvt Pties For Sale/
Assets Held For Sale
Interest in REITs/ Funds/Trusts
Other LT Assets
Interest in Assoc/JVs
Investment Properties
Trade & Other Rec.
Cash & Equiv.
Long Term
Other ST Liabilities
Other LT Liabilities
Equity & NCI
Debt due within 4 years
Debt due after 4 years

17
6.8 7.5 8.0
10.9 11.1 11.9
3.52.9
4.2
3.3
4.84.1
0%
10%
20%
30%
40%
50%
60%
70%
80%
90%
100%
0.0
2.0
4.0
6.0
8.0
10.0
12.0
14.0
16.0
18.0
2009 2010 2011 2012 2013 2014
Fixed Floating
S$’ billion
$10.3b $10.4b $12.2b $14.2b $15.9b $16.0b
Good Mix Of Fixed And Floating Interest Rates
34% 28%
34%
23%
30%
66%
72%
66%
77%
70%
% of total debt
25%
75%
Well-Mitigated Against Any Interest Rate Increase
1
Note: 1) Restated balance to take into account the retrospective adjustments arising from FRS 110.
18
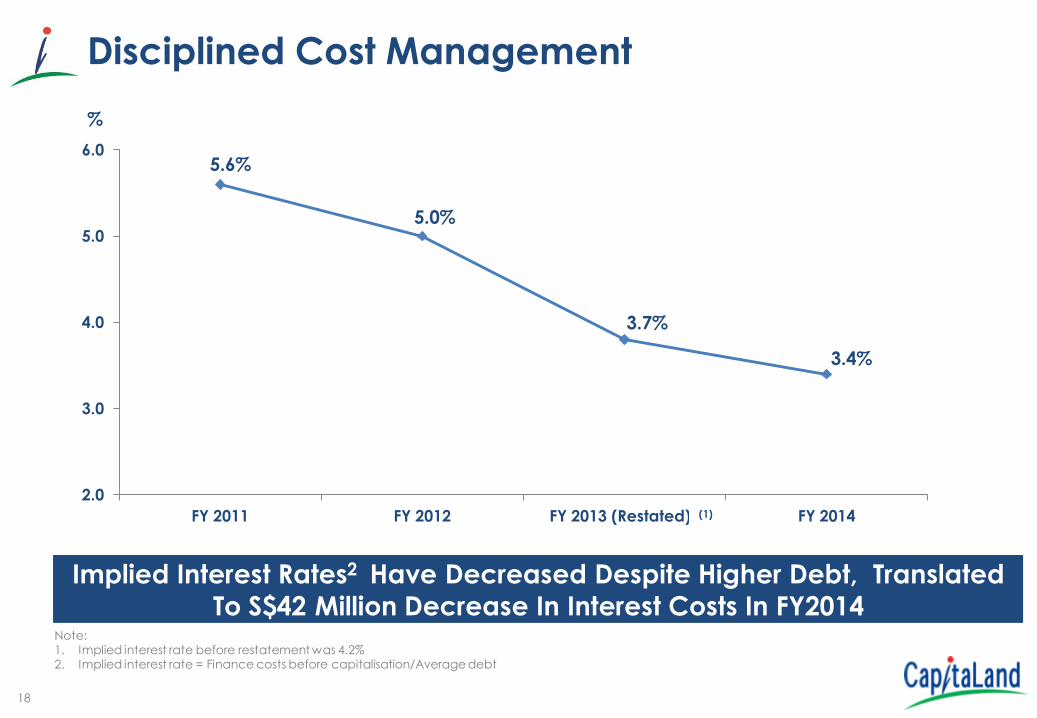
Disciplined Cost Management
2.0
3.0
4.0
5.0
6.0
FY 2011 FY 2012 FY 2013 (Restated)1 FY 2014
%
3.4%
3.7%
5.0%
5.6%
Implied Interest Rates2 Have Decreased Despite Higher Debt, Translated
To S$42 Million Decrease In Interest Costs In FY2014 Note: 1. Implied interest rate before restatement was 4.2% 2. Implied interest rate = Finance costs before capitalisation/Average debt
(1)

19 CapitaLand Presentation May 2013
Plaza Singapura, Singapore
Diversified Funding Sources

20
Successfully Tapped Capital From Multiple Sources1
Bo
nd
s
• ART : JPY5b 5-year bond due 2018
• ART : JPY7b 6-year bond due 2020
• ART : SGD150m perpetual securities
• ART : EUR80m 10-year bond due 2024
• CCT : SGD50m 7-year bond due 2021
• CCT : JPY6.3b 7-year bond due 2021
• CCT : JPY8.6b 8-year bond due 2023
• CMMT: MYR200m 3-year bond due 2017
Ba
nk
Lo
an
s2
• CTL : SGD800m bank facilities
• CTL : HKD770m bank facility
• CTL : SGD200m bank facility
• CTL : SGD150m bank facility
• CTL : SGD100m bank facility
• CTL : SGD150m bank facility
• CTL : SGD200m bank facility
• CTL : SGD95m bank facility
• ART : SGD150m equity placement
• ART : SGD254m equity placement
• CL : SGD650m 7-year convertible bonds
due 2020
• CL : SGD800m 10-year convertible
bonds due 2023
• CRCT : SGD59m preferential offering
Note: 1) Tables include major financing/loans raised within the Group between 2013 – February 2015. 2) Major bank loans at CL corporate level, excluding bank loans obtained by strategic business units.
Eq
uity
/ Eq
uity
Lin
ke
d
• CMT : SGD300m 10-year bond due 2024
• CMT : JPY5b 7-year bond due 2021
• CMT : SGD350m 7-year bond due 2021
• CMT : JPY10b 7-year bond due 2020
• CMT : SGD100m 7-year bond due 2020
• CMT : HKD650m 10.5-year bond due 2025
• CMT : HKD1,104m 12-year bond due 2027
• CMT : JPY8.6b 8-year bond due 2023
• CTL : SGD500m 10-year bond due 2024
21
0%
10%
20%
30%
40%
50%
60%
70%
80%
90%
100%
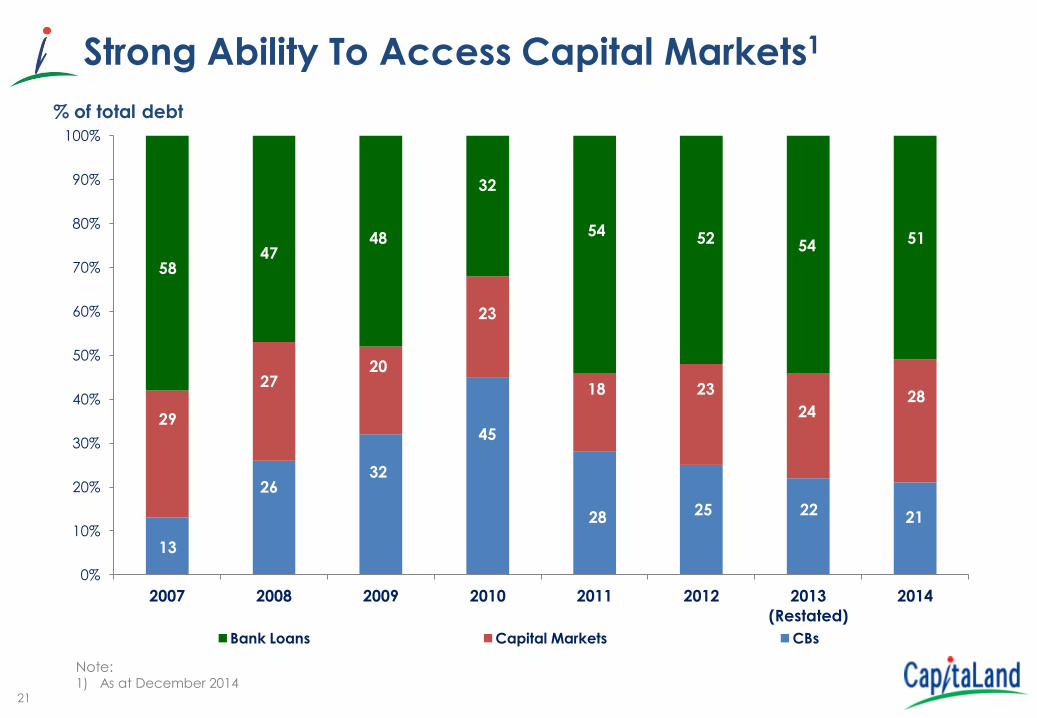
2007 2008 2009 2010 2011 2012 2013
(Restated)
2014
Bank Loans Capital Markets CBs
Strong Ability To Access Capital Markets1
% of total debt
Note: 1) As at December 2014
13
58
29
47
27
26
48
20
32
32
23
45
28
18
54 52
23
25 22
24
54 51
28
21
22
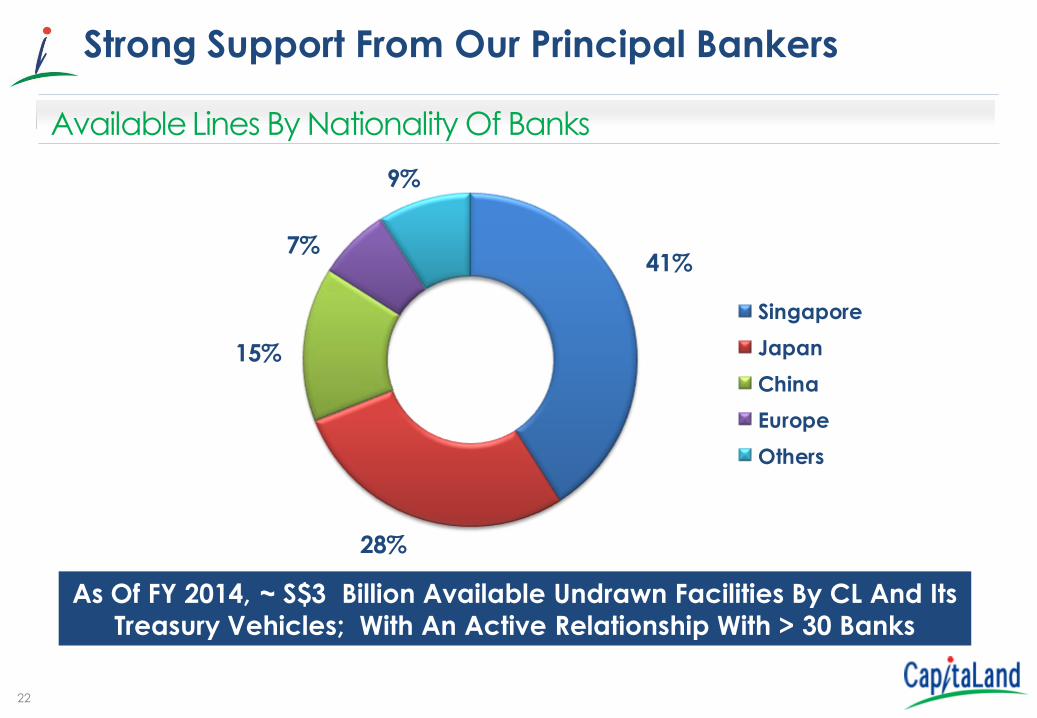
Strong Support From Our Principal Bankers
41%
28%
15%
7%
9%
Singapore
Japan
China
Europe
Others
Available Lines By Nationality Of Banks
As Of FY 2014, ~ S$3 Billion Available Undrawn Facilities By CL And Its
Treasury Vehicles; With An Active Relationship With > 30 Banks
23
One George Street, Singapore
Multiple Platforms To Recycle Assets
& Tap Capital
24
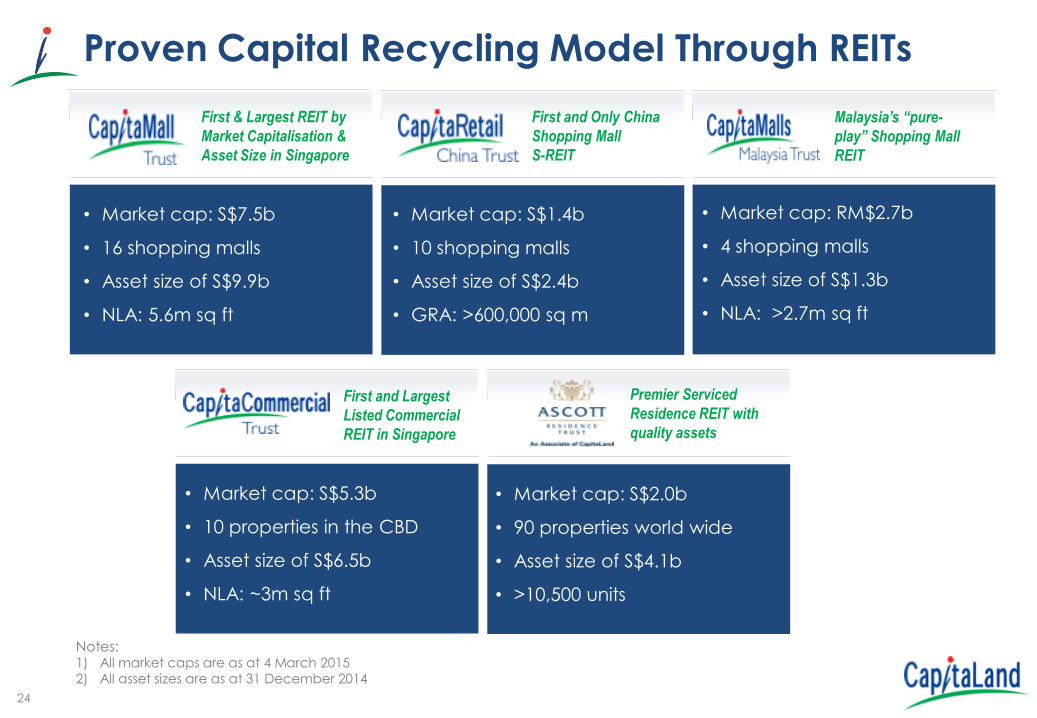
Proven Capital Recycling Model Through REITs
• Market cap: S$5.3b
• 10 properties in the CBD
• Asset size of S$6.5b
• NLA: ~3m sq ft
• Market cap: S$2.0b
• 90 properties world wide
• Asset size of S$4.1b
• >10,500 units
First and Largest
Listed Commercial
REIT in Singapore
Premier Serviced
Residence REIT with
quality assets
First and Only China
Shopping Mall
S-REIT
Malaysia’s “pure-
play” Shopping Mall
REIT
First & Largest REIT by
Market Capitalisation &
Asset Size in Singapore
• Market cap: S$7.5b
• 16 shopping malls
• Asset size of S$9.9b
• NLA: 5.6m sq ft
• Market cap: S$1.4b
• 10 shopping malls
• Asset size of S$2.4b
• GRA: >600,000 sq m
• Market cap: RM$2.7b
• 4 shopping malls
• Asset size of S$1.3b
• NLA: >2.7m sq ft
Notes: 1) All market caps are as at 4 March 2015 2) All asset sizes are as at 31 December 2014
25
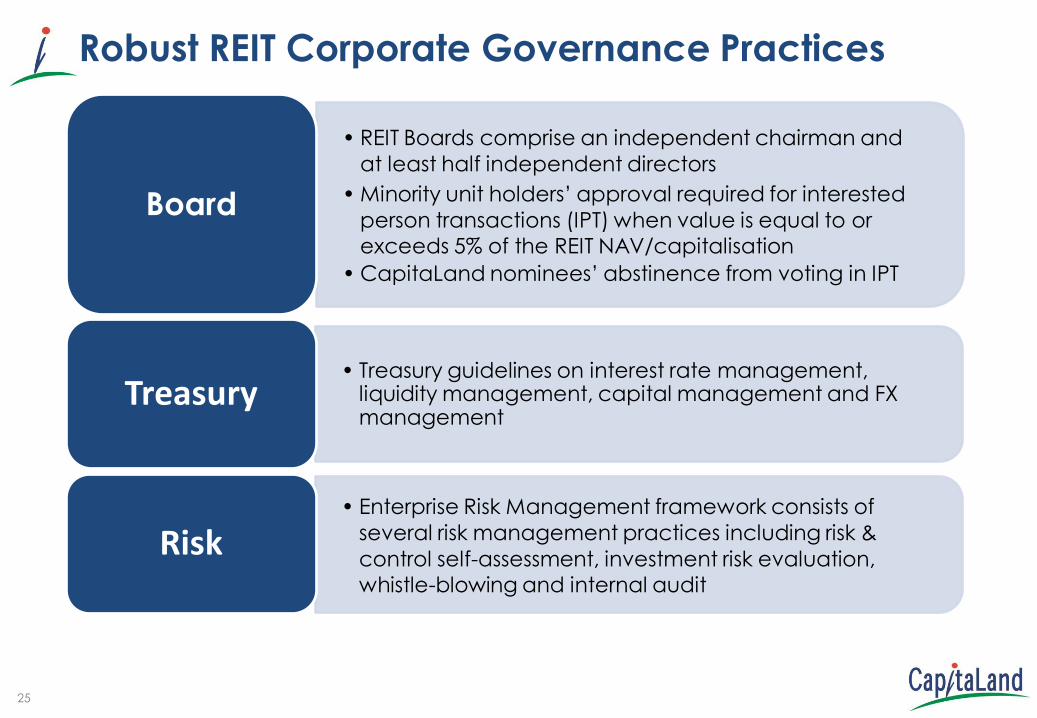
Robust REIT Corporate Governance Practices
• REIT Boards comprise an independent chairman and
at least half independent directors
• Minority unit holders’ approval required for interested
person transactions (IPT) when value is equal to or
exceeds 5% of the REIT NAV/capitalisation
• CapitaLand nominees’ abstinence from voting in IPT
Board
• Treasury guidelines on interest rate management, liquidity management, capital management and FX management
Treasury
• Enterprise Risk Management framework consists of
several risk management practices including risk &
control self-assessment, investment risk evaluation,
whistle-blowing and internal audit
Risk

26
Our Real Estate Private Equity Funds*
• Fund Size: US$239.8million
• Closed in Jul 2008
CapitaLand China Development Fund II China
CapitaLand China Development Fund China
• Fund Size: US$400million
• Closed in Oct 2005
Vietnam Joint Venture Fund Hanoi & Ho Chi Minh City
• Fund Size: US$200million
• Closed in Nov 2010
*Fund size as at respective fund closing date.
CapitaLand Township Development Fund I China
• Fund Size: US$250million
• Closed in Dec 2008
CapitaLand Township Development Fund II China
• Fund Size: US$200million
• Closed in Mar 2013
ARC CapitaLand Residences Japan Fund Key Cities in Japan
• Fund Size: JPY12.6 billion
• Closed in Sep 2005
Residential/Rental Apartments/Mixed Developments
Raffles City Changning JV China
Raffles City China Fund China
• Fund Size: US$1.18billion
• Closed in Jul 2008
• Fund Size: S$1.03billion
• Closed in Dec 2010
CTM Property Trust
Chongqing, China
• Fund Size: S$1.12billion
• Closed in Nov 2011

27
Our Real Estate Private Equity Funds* (Con’t)
• Fund Size: US$1billion
• Closed in Jun 2012
CapitaMalls China Development Fund III China
CapitaMalls Japan Fund Key Cities in Japan
• Fund Size: JYP$44.1billion
• Closed in Apr 2005
CapitaMalls India Development Fund India
• Fund Size: S$880 million
• Closed in Nov 2007
Shopping Malls/Serviced Residences
Ascott Serviced Residence (China) Fund China
• Fund Size: US$500 million
• Closed in Jun 2007
CapitaMalls China Income Fund1 China
CapitaMalls China Income Fund II2
China
• Fund Size: US$900million
• Closed in May 2011
• Fund Size: US$425million
• Closed in Jun 2006
CapitaMalls China Income Fund III3 China
Notes: 1. CapitaMalls China Income Fund was converted from CapitaRetail China Development
Fund closed in Jun 2006 and was upsized by US$300 million in May 2011 2. CapitaMalls China Incubator Fund was renamed CapitaMalls China Income Fund II with
effect from 6 June 2013 3. China Development Fund II was renamed CapitaMalls China Income Fund III with effect
from 31 July 2013
• Fund Size: S$900million
• Closed in Sep 2007
*Fund size as at respective fund closing date.
28
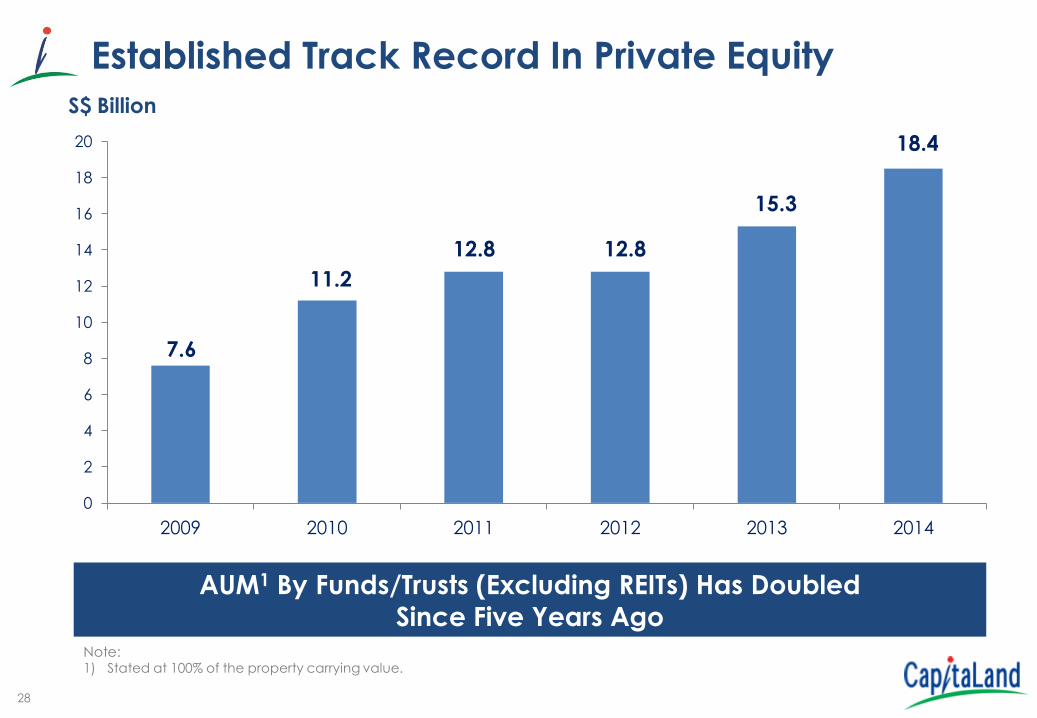
Established Track Record In Private Equity S$ Billion
AUM1 By Funds/Trusts (Excluding REITs) Has Doubled
Since Five Years Ago
Note: 1) Stated at 100% of the property carrying value.
0
2
4
6
8
10
12
14
16
18
20
2009 2010 2011 2012 2013 2014
7.6
11.2
12.8 12.8
15.3
18.4
29 CapitaLand Presentation May 2013
Six Battery Road, Singapore
Conclusion

30
Conclusion
• Well-balanced portfolio enables the Group to ride through property cycles
• Prudent capital management ensures sustainable future
growth • Able to tap on diversified sources for funds help to
preserve financial flexibility • Able to access multiple platforms to recycle assets
Thank You
Related Documents