Staff Working Paper 2017-2 Capital Requirements in Supervisory Stress Tests and their Adverse Impact on Small Business Lending Francisco Covas August 2017 Staff Working Papers describe research in progress by the author(s) and are published to elicit comments and to further debate. Any views expressed are solely those of the author(s) and so cannot be taken to represent those of The Clearing House or its owner banks. The Clearing House is a banking association and payments company that is owned by the largest commercial banks and dates back to 1853. The Clearing House Association L.L.C., is a nonpartisan organization that engages in research, analysis, advocacy and litigation focused on financial regulation that supports a safe, sound and competitive banking system.

Welcome message from author
This document is posted to help you gain knowledge. Please leave a comment to let me know what you think about it! Share it to your friends and learn new things together.
Transcript
Staff Working Paper 2017-2
Capital Requirements in Supervisory Stress
Tests and their Adverse Impact on Small
Business Lending
Francisco Covas
August 2017
Staff Working Papers describe research in progress by the author(s) and are published to elicit comments
and to further debate. Any views expressed are solely those of the author(s) and so cannot be taken to
represent those of The Clearing House or its owner banks. The Clearing House is a banking association
and payments company that is owned by the largest commercial banks and dates back to 1853. The
Clearing House Association L.L.C., is a nonpartisan organization that engages in research, analysis,
advocacy and litigation focused on financial regulation that supports a safe, sound and competitive
banking system.
2
Capital Requirements in Supervisory Stress Tests and their
Adverse Impact on Small Business Lending
Francisco Covas1
August 10, 2017
Abstract
This paper estimates the implicit capital requirements in the U.S. supervisory stress
tests. Our results show that stress tests are imposing dramatically higher capital
requirements on certain asset classes – most notably, small business loans and
residential mortgages – than bank internal models and Basel standardized
models. By imposing higher capital requirements on loans to small businesses
and mortgage loans, stress tests are likely curtailing credit availability for the
types of borrowers that lack alternative sources of finance. In addition, we
identify the impact of supervisory stress tests on the availability of credit to
small businesses by analyzing differences in small business loan growth at
banks subject to stress tests versus those that are not. Our results indicate that
the U.S. stress tests are constraining the availability of small business loans
secured by nonfarm nonresidential properties, which accounts for
approximately half of small business loans on banks’ books.
Key words: Capital requirements, supervisory stress tests, bank lending, small business lending.
JEL classifications: G18, G21, G28.
1 The Clearing House, [email protected].
The views expressed in this paper are those of the author and do not necessarily reflect the views of The Clearing
House or its owner banks. The author thanks Greg Baer, Liz Ewing, Beverly Hirtle, Bill Nelson, Jeremy Newell for
useful comments and suggestions. Any remaining errors are the sole responsibility of the author.
3
1. Introduction
In the aftermath of the global financial crisis, a series of key capital and other regulations have been
enacted in the United States and elsewhere, including the Basel III capital and liquidity frameworks
and the Federal Reserve’s stress testing program. These regulations have made banks significantly
more resilient, but the design and calibration of the regulations may have altered the incentives of
banks to hold various assets and originate different types of loans. In particular, the Federal
Reserve’s Comprehensive Capital Adequacy Review (CCAR) stress tests attempt to measure the
ability of banks to withstand a very severe economic downturn. The macroeconomic supervisory
scenarios designed by the Federal Reserve assume a recession that includes a rise in the
unemployment rate that is considerably more sudden than the increase observed during the 2007-
2009 financial crisis. By more severely stressing unemployment rate changes, the Federal Reserve’s
scenarios are likely to discourage lending whose performance is especially sensitive to the behavior
of the unemployment rate, such as certain types of household lending as well as small business
lending.
In this paper, we attempt to identify which specific capital requirements are most likely to be
“binding” for large banks and the implications of binding regulatory constraints for banks’ capital
allocation decisions. Despite the large number of different capital requirements to which large U.S.
banks are subject, the Federal Reserve’s CCAR stress tests generally are the most stringent capital
requirements, and therefore are mostly likely to constrain large banks in deciding how to allocate
capital. Under those stress tests, large banks also provide their own estimates of post-stress
4
regulatory capital ratios, but those tend to be generally less binding than the post-stress capital ratios
resulting from the Federal Reserve’s CCAR models and assumptions.2
Although the opacity of the Federal Reserve’s CCAR models and assumptions makes it
difficult to precisely identify CCAR’s implicit capital requirements for different assets at any
detailed level, we are able to estimate the implicit risk weights in U.S. stress tests using the post-
stress capital ratios published by the Federal Reserve under CCAR and banks’ own Dodd-Frank Act
Stress Tests (DFAST) results over the past three stress testing cycles, 2014 through 2016.
Specifically, for each major loan portfolio and for trading assets, we estimate the risk-weights that
would best describe banks’ post-stress regulatory capital ratios under the severely adverse scenario,
controlling for differences in equity distributions. Our results show that stress tests are imposing
dramatically higher capital requirements on certain asset classes – most notably, small business loans
and residential mortgages – than bank internal models and Basel standardized models.3 By imposing
higher capital requirements on loans to small businesses and mortgage loans, stress tests are likely
curtailing credit availability for the types of borrowers that lack alternative sources of finance.
In the second half of the paper, we identify the impact of supervisory stress tests on the
availability of credit to small businesses by analyzing differences in small business loan growth
at banks subject to stress tests versus those that are not. Because smaller banks are exempted
from stress tests, they can act as a “control” group in assessing the impact of new regulations on
the supply of credit. Our results indicate that the U.S. stress tests are constraining the availability
2 For example, the Federal Reserve assumes the estimated model parameters are the same for all bank holding
companies due to the challenge of estimating a separate model for each bank and to avoid historical bank-specific
results prevailing in future stress episodes. This approach implies, for example, that loss given default of a
particular type of loan – a key determinant of expected losses - is the same across all banks despite demonstrated
differences in banks’ ability to recover the principal of a defaulted loan. 3 See The Clearing House, The Capital Allocation Inherent in the Federal Reserve’s Capital Stress Tests (January
2017), available at
www.theclearinghouse.org/~/media/TCH/Documents/TCH%20WEEKLY/2017/20170130_WP_Implicit_Risk_Wei
ghts_in_CCAR.pdf.
5
of small business loans secured by nonfarm nonresidential (NFNR) properties, which account for
approximately half of small business loans on banks’ books. Moreover, the estimated impact is
economically very important. According to the results of our empirical model, subjecting a bank
to the U.S. supervisory stress tests leads to a reduction of more than 4 percentage points in the
annual growth rate of small business loans secured by NFNR properties, which translates to a
$2.7 billion decrease in the aggregate holdings of these small business loans at stress-tested
banks each year on average.
The remainder of the paper is organized as follows. Section 2 provides a brief literature
review. Section 3 estimates the capital surplus at large U.S. bank holding companies. Section 4
estimates the capital requirements under the U.S. supervisory stress tests. Section 5 assesses the
impact of stress tests on the availability of credit for small businesses. Section 6 concludes.
2. Literature Review
Following the height of the past financial crisis the Supervisory Capital Assessment Program
implemented by the Federal Reserve in the first half of 2009 was critical to restoring the
confidence among market participants and depositors in the health of the U.S. banking system.
Since that time, annual supervisory stress testing exercises have become a key component of
how the Federal Reserve attempts to ensure that banks subject to the exercise are sufficiently
resilient to survive and continue to support economic activity even if another set of severe
financial and economic shocks were to affect the financial system (Schuermann, 2014). As
documented by Hirtle and Lehnert (2014), the U.S. stress tests have several macroprudential
features. First, stress tests macroeconomic supervisory scenarios are countercyclical, meaning
that the severity of the supervisory scenarios increases in good times. Second, by providing
6
projections for total assets and other balance sheet components, which tend to increase over the
9-quarter planning horizon, the Federal Reserve assumes banks continue to lend to creditworthy
borrowers even in stressful conditions. As noted by Schuermann (2016), supervisory stress tests
also provide an horizontal perspective across all banks subject to the exercise as it consists in a
system-wide stress testing, which allows supervisors to compare exposures, vulnerabilities,
models and the resilience to aggregate shocks across all banks.
The Federal Reserve's supervisory models play a central role in the U.S.’s supervisory
stress tests and drive capital requirements at banks, but there are some potential problems with
the Federal Reserve's “model monoculture” approach. As pointed out by Gallardo, Schuermann
and Duane (2016), the Federal Reserve’s models guide bank behavior which may lead to an
increase in systemic risk as it doesn't allow a diversity of modeling approaches. In particular, if
the Federal Reserve's models are vulnerable to a particular source of risk, the entire banking
system could be undercapitalized during a period of financial stress. A good example of
vulnerabilities in models that may arise is evident in top-down models used for stress-testing, of
the type described in Hirtle, Kovner, Vickery and Bhanot (2016) which tend to exhibit a lower
sensitivity of losses and revenues to macroeconomic conditions. Guerrieri and Welch (2012)
show that although the macroeconomic variables included in the supervisory stress scenarios are
helpful in forecasting loan losses, revenues and capital measures, the best performing models
have large bands around the uncertainty of those forecasts. Specifically, Bolotnyy, Edge and
Guerrieri (2016) show that top-down models used to project net interest income – an important
component of bank revenues - perform poorly. As a result, the paths of net interest margins
implied by extreme interest rate scenarios are statistically indistinguishable from those implied in
baseline scenarios. Even under the so called “bottom-up approaches”, macroeconomic variables
7
improve model fit only slightly as shown by Wu and Zhao (2016) in their examination of the
determinants of auto loan defaults. However, since the severity of the Federal Reserve's
supervisory macroeconomic stress scenarios is considerable more extreme than the 2007-2009
financial crisis (see, The Clearing House, March 2016), the macroeconomic variables still show a
strong impact on auto loan defaults. Acharya, Engle and Pierret (2014) report that losses in
supervisory stress tests correlate well with market implied losses, however the capital shortfall
obtained using market-implied measures is higher than the capital shortfall obtained from the
stress tests, suggesting that differences could arise from the use of regulatory risk weights in the
stress tests or inaccuracies in the Federal Reserve’s revenue projections. Finally, Kupiec (2017)
presents evidence that indicates there large inaccuracies in stress test model forecasts and the use
of regulatory stress tests should be curtailed until supervisory models meet verifiable minimum
accuracy standards.
The negative impact of higher capital requirements on bank lending is well established in
the literature. Peek and Rosengreen (1995, 1996) have seminal papers documenting the impact
of higher capital requirements and regulatory enforcement actions in reducing availability of
bank loans. If most of the lending occurs in portfolios containing mainly bank dependent
borrowers, such as small businesses, the reduced lending can have a significant impact on
economic growth because new small firms account for a disproportionate share of new job
creation. Martynova (2015) provides a survey of the estimates provided by the academic
literature on the impact of higher capital requirements on economic growth.
8
There is an increasing number of papers documenting the impact of stress tests on the
availability of credit.4 Acharya, Berger and Roman (2017) have the most comprehensive study
on the impact of the U.S. supervisory stress tests on the supply of credit. They find that banks
subject to the stress tests have reduced the supply of credit to relatively risky borrowers, such as
large corporate borrowers that are rated below investment grade, and commercial real estate,
credit card and small business borrowers. According to Chen, Hanson and Stein (2017) the
largest four U.S. banks cut back significantly small business loan originations relative to the rest
of the banking sector. The paper finds that the decline in small business loan originations at
those banks is consistent with a contraction in credit supply likely associated with post-crisis
changes in financial regulation, including the U.S. stress tests and the capital surcharges for
systemically important institutions. Lambertini and Mukherjee (2015) report that the pricing of
syndicated loans rose after the start of stress tests and in particular they estimate that each
percentage point increase in capital requirements increased syndicated loan pricing by 15 to 20
basis points. On the residential mortgage side, Calem, Correa and Lee (2016) show that the
CCAR 2011 stress test exercise had a negative impact on the originations of jumbo mortgages
and approval rates at banks subject to the stress tests. The paper by Morris-Levenson, Sarama
and Ungerer (2017), also finds that stress testing helped less regulated banks and nonbanks to
increase their share in the mortgage origination market, although they document that counties
most dependent on lending from the most heavily regulated banks didn’t experience lower
originations of mortgages, or smaller increases in house prices. In contrast, Flannery, Hirtle and
4 The Clearing House released three short research briefs: (i) documenting the impact of the Federal Reserve’s
supervisory scenarios on credit supply; (ii) estimating the implicit capital requirements in the U.S. supervisory stress
tests; and (iii) on the impact of stress tests in small business loan growth. This paper relies heavily on the
methodologies and results presented across those three research notes.
9
Kovner (2017) don’t find an impact of stress testing on lending or the portfolio composition of
banks, but since they only look at banks subject to the stress tests, their results may be impacted
by small sample issues.
3. Banks’ capital surplus
The current framework to assess the capital adequacy of large U.S. banks is vast and complex.
Under the Basel III standardized capital requirement, banks are subject to three risk-based capital
ratios (the common equity tier 1 capital ratio, the tier 1 capital ratio and the total capital ratio); and a
non-risk-based capital ratio, the tier 1 leverage ratio. In addition to the standardized approach
regulatory capital ratios, thirteen advanced approaches bank holding companies are required to
calculate their risk-based capital ratios under the so called Advanced Approaches and are also
subject to a supplementary leverage ratio which treats both on- and off-balance sheet exposures with
an equal risk weight.5 Banks having at least $50 billion in total assets – which includes the banks
analyzed in the paper – are also subject to U.S. stress tests in which banks’ capital adequacy is
assessed using five hypothetical stress scenarios (three supervisory scenarios and two bank own
scenarios), although only two adverse supervisory macroeconomic scenarios and one bank own
scenario are likely to reduce banks’ post-stress regulatory capital ratios. After these stress scenarios
are applied, capital adequacy is assessed using four different regulatory capital ratios – three of
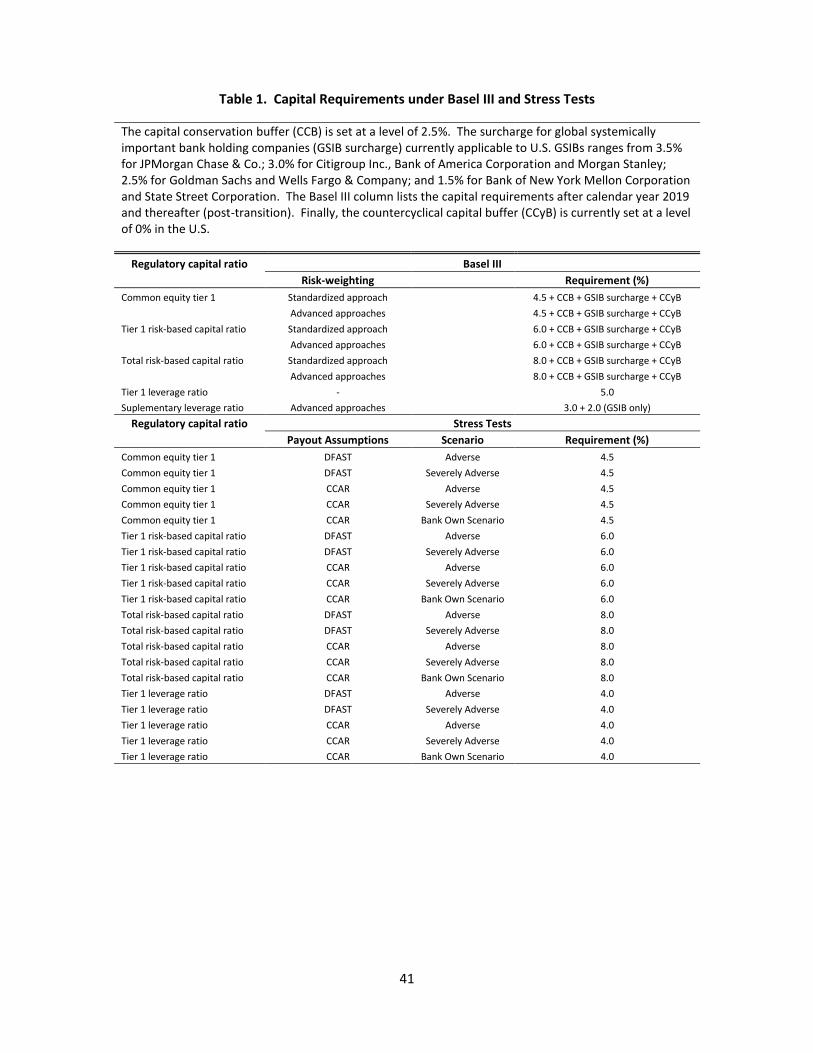
which are risk-based and one of which is leveraged-based. Table 1 lists all capital requirements
under Basel III and in stress tests.
5 In the U.S., the thirteen bank holding companies subject to the Advanced Capital Adequacy Framework
(Advanced Approaches) are American Express Company, Bank of America Corporation, Bank of New York Mellon
Corporation, Capital One Financial Corporation, Citigroup, Inc., Goldman Sachs Group, Inc., JPMorgan Chase &
Co., Morgan Stanley, Northern Trust Corporation, PNC Financial Services Group, Inc., State Street Corporation,
U.S. Bancorp, and Well Fargo & Company.
10
Broadly, there are two types of U.S. stress tests – DFAST and CCAR. The resulting post-
stress capital ratios under each stress test depend on three inputs: (i) the stringency of the
macroeconomic stress scenarios; (ii) the models used to project losses and revenues, and (iii) equity
distributions. The supervisory macroeconomic scenarios for each stress test are identical. The first
major difference between DFAST and CCAR is in the use of the models to project losses and
revenues. Under DFAST, both Federal Reserve’s and banks’ own models are used, while CCAR
uses only Federal Reserve’s own models. Another key difference is the assumptions governing
equity distributions under DFAST and CCAR. Under CCAR, equity distributions follow banks’
equity payout forward-looking assumptions under their baseline scenarios, while under DFAST, the
assumptions on dividend payouts and based on past distributions and share repurchases are assumed
to be zero. This paper focuses on the post-stress capital ratios resulting from the use of the Federal
Reserve’s models under CCAR and banks’ own models under DFAST.
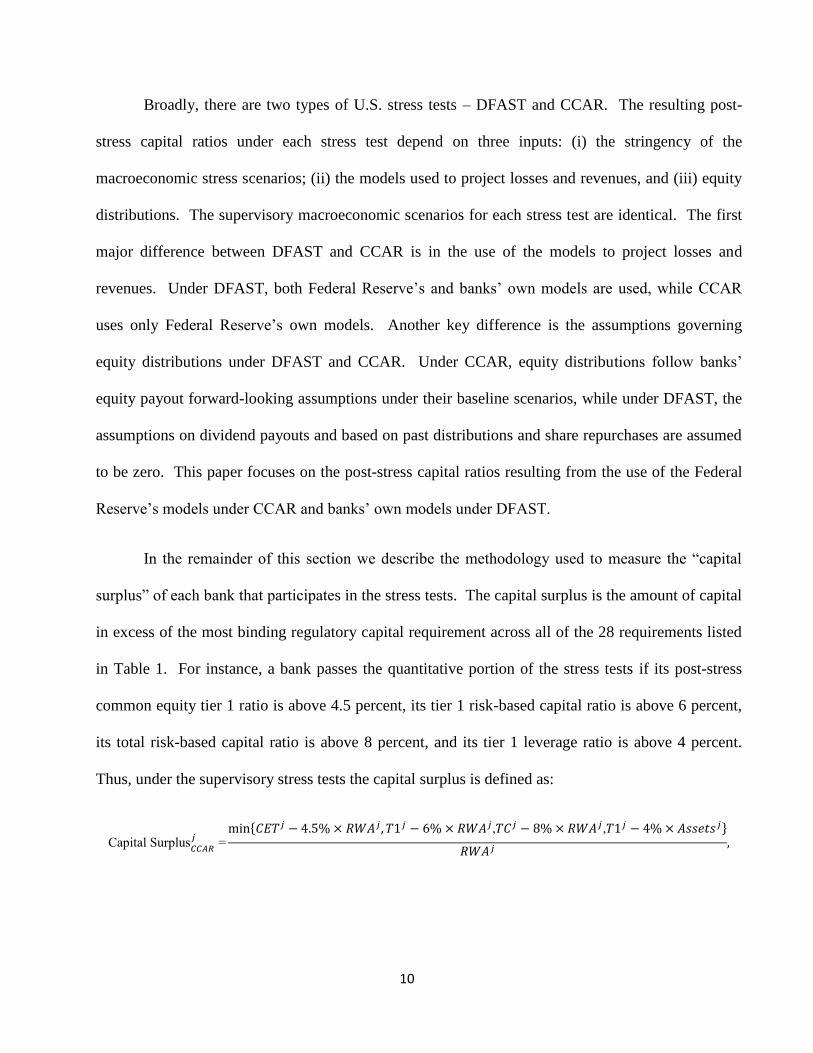
In the remainder of this section we describe the methodology used to measure the “capital
surplus” of each bank that participates in the stress tests. The capital surplus is the amount of capital
in excess of the most binding regulatory capital requirement across all of the 28 requirements listed
in Table 1. For instance, a bank passes the quantitative portion of the stress tests if its post-stress
common equity tier 1 ratio is above 4.5 percent, its tier 1 risk-based capital ratio is above 6 percent,
its total risk-based capital ratio is above 8 percent, and its tier 1 leverage ratio is above 4 percent.
Thus, under the supervisory stress tests the capital surplus is defined as:
Capital Surplus𝐶𝐶𝐴𝑅𝑗
=min{𝐶𝐸𝑇𝑗 − 4.5% × 𝑅𝑊𝐴𝑗, 𝑇1𝑗 − 6% × 𝑅𝑊𝐴𝑗,𝑇𝐶𝑗 − 8% × 𝑅𝑊𝐴𝑗,𝑇1𝑗 − 4% × 𝐴𝑠𝑠𝑒𝑡𝑠𝑗}
𝑅𝑊𝐴𝑗,
11
where j = DFAST/Adverse, DFAST/Severely Adverse, CCAR/Adverse, CCAR/Severely Adverse.
We also normalize the capital surplus by risk-weighted assets for convenience.6
In addition, we calculate the capital surplus under Basel III and stress tests separately to
assess the extent to which the capital requirements under each regulatory framework are binding.
The capital surplus under Basel III is defined in a similar way, except that the capital thresholds
change as follows:
1. Common equity tier 1 ratio req. = 4.5% (reg. min. ) + 2.5 % (CCB) +
0% (CCyB) + GSIB Surcharge (varies across banks)
2. Tier 1 capital ratio req. = 6.0% (reg. min. ) + 2.5 % (CCB) + 0% (CCyB) +
GSIB Surcharge (varies across banks)
3. Total capital ratio req. = 8.0% (reg. min. ) + 2.5 % (CCB) + 0% (CCyB) +
GSIB Surcharge (varies across banks)
4. Tier 1 leverage ratio = 5.0% (well-capitalized requirement).
For the advanced approaches institutions, all ratios are calculated using both banks’ internal
models and the standardized approach. The capital surplus is then defined using the regulatory
capital ratio that yields the lowest amount of excess capital above its requirement. Lastly, we also
collected data on total leverage exposure for the advanced approaches institutions and include the
enhanced supplementary leverage ratio in the calculation of the capital surplus for the GSIBs, but
only at the end of 2015, the first year the information is available for such institutions.
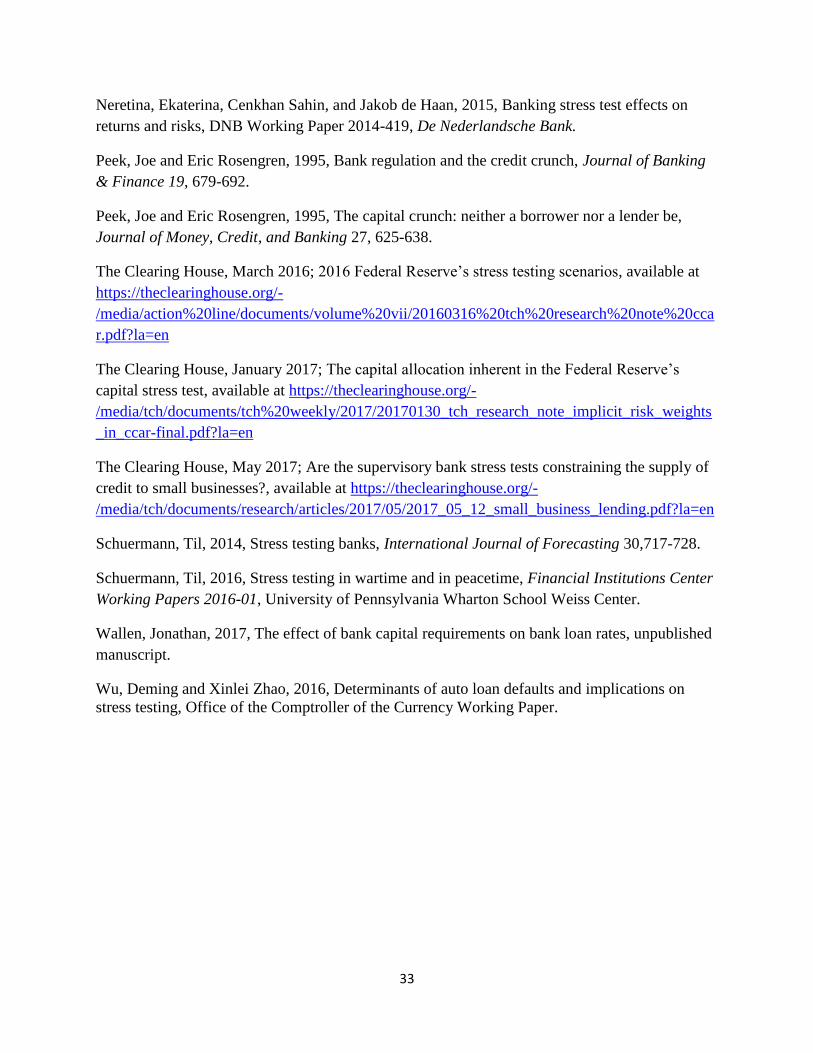
The top panel of Figure 1 shows the capital surplus for large banks over the past 3 years
under Basel III and CCAR stress tests, respectively.7 The capital surplus under the stress tests was
6 Since information on the post-stress capital ratios derived from the stress scenario designed by each BHC is not
publicly available, the capital surplus under the stress tests excludes those results.
12
roughly half of the capital surplus under Basel III up to 2015, and that difference was halved in 2016
due to an increase in capital surplus under the stress tests. Notably, the capital surplus under the
stress tests increased in CCAR 2016 as compared to prior CCAR exercises, largely as a result of
higher net revenues under stress, reportedly due to a fall in expenses associated with mortgage
related settlements and a lower decline in fee income during stress as a result of negative short-term
interest rates.8 As shown in the bottom panel of Figure 1, the post-stress leverage ratio yields the
lowest capital surplus for about half of the banks that participate in the stress tests. In contrast, under
Basel III, the risk-based capital ratios are generally the binding requirement, although the inclusion
of the enhanced supplementary leverage ratio in our sample in 2015 raised slightly the incidence of a
binding leverage ratio under the current Basel III rules.
Interestingly, the post-stress tier 1 leverage ratio is the requirement within the stress tests
most likely to bind for approximately half of the banks that participate in such exercise. The
leverage ratio as a post-stress minimum requirement operates in a significantly more risk-sensitive
manner than does the point-in-time leverage ratio. Under the stress tests, banks with exposures that
are very sensitive to business cycle fluctuations experience very high losses under the Federal
Reserve’s supervisory scenarios. Thus a bank that expanded its balance sheet by increasing its
holdings of risky assets would experience a large decline in its tier 1 capital over the stress tests’
nine-quarter planning horizon. For these reasons, the leverage ratio requirement under stress tests
behaves similarly to a risk-based capital requirement. The reason why it binds for approximately
7 For clarity, the year referenced is with regard to the previous quarter of the applicable CCAR cycle. For instance,
2016 refers to data as of December 31, 2015. 8 See, “Dodd-Frank Act Stress Test 2016: Supervisory Stress Test Methodology and Results,” box 2 on page 20,
available at
https://www.federalreserve.gov/newsevents/press/bcreg/bcreg20160623a1.pdf.
13
half of the banks is because the point-in-time requirement is closer to the stress test hurdle for the
leverage ratio than for the risk-based measures.
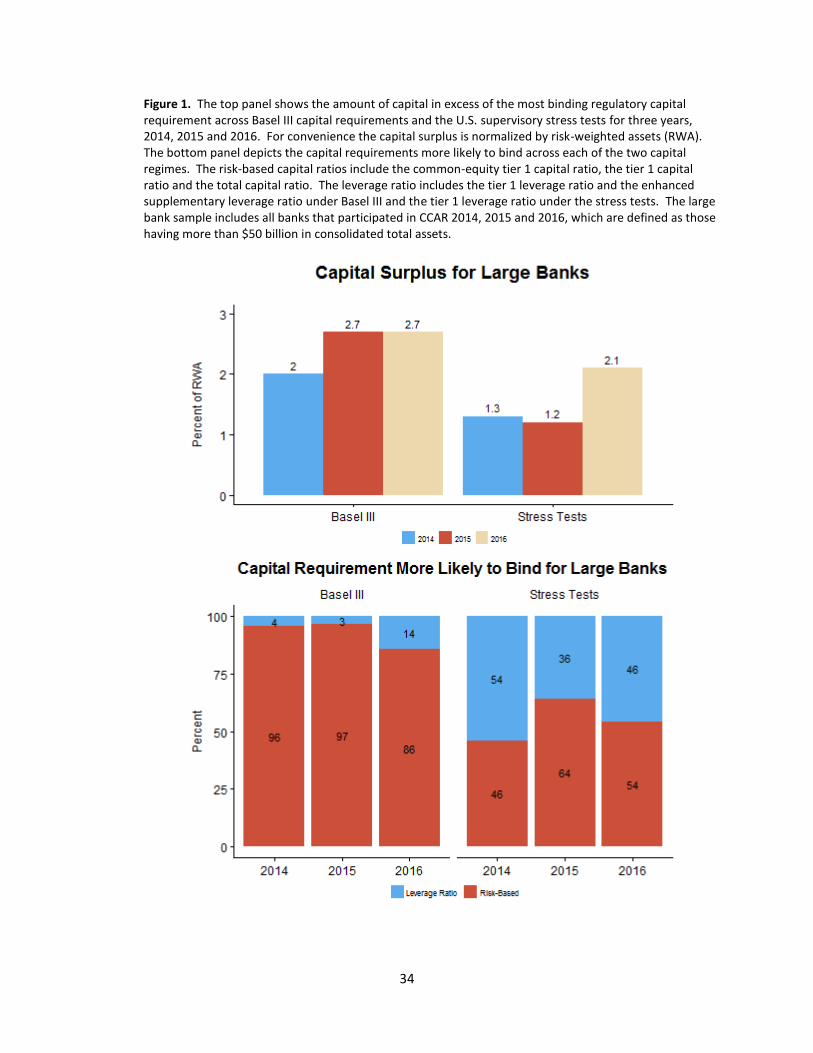
The charts in Figure 2 depict the aggregate capital surplus for large banks across Basel III
and stress tests. The capital surplus shown is equal to the lowest capital surplus across the Basel III
and stress tests for each bank. As a result, the capital surplus shown in Figure 2 (1.8%) is lower than
the capital surpluses under Basel III and stress tests individually depicted in Figure 1 (2.7% and
2.1%, respectively). Over the past three years the capital surplus at large banks approximately
doubled. Currently, the capital surplus is at 1.8 percent of risk-weighted assets, in part due to the
better than expected projected net revenues under CCAR 2016 explained above. As shown in the
bottom panel of Figure 2, the post-stress risk-based capital requirements (in blue) remain the
regulatory capital ratios with the highest likelihood of being breached for large banks. For more
than half of the banks in the sample, the post-stress capital requirements are those more likely to
bind for large banks (the sum of the blue and white bars).
4. Estimating capital requirements under the supervisory stress tests
The previous section demonstrates that CCAR post-stress capital requirements are the binding
requirement for the majority of large banks. The stress tests map a bank’s balance sheet into post-
stress regulatory capital ratios, and so can also be viewed as a process that generates risk-weights
which can then be applied to exposures on the balance sheet, just like standardized or advanced
approaches risk weights. In an ideal world, the Federal Reserve would publish the (average) risk-
weights consistent with the projections for expected losses under the severely adverse scenario.
However, the risk-weights under the severely adverse scenario are not provided and, moreover, the
14
models used by the Federal Reserve are not disclosed to the banks or the public. Thus, in this
section we estimate the implicit risk weights in stress tests using the Federal Reserve’s projection of
banks’ post-stress test regulatory capital ratios as well as information on banks’ balance sheets.
Specifically, we use a model to estimate the risk-weights that would best describe banks’ post-stress
regulatory capital ratios under the severely adverse scenario, controlling for differences in equity
distributions across banks. We also repeated the analysis using banks’ own DFAST submissions to
report the differences between the risk-weights implicit in the Federal Reserve’s estimates and
banks’ own stress test estimates.
In the second part of the analysis, we use the estimated risk-weights to calculate the amount
of capital banks are required to hold for various types of loans, on average, while satisfying the
minimum capital requirements imposed by the stress tests. Specifically, using the estimation results,
we are able to calculate capital requirements under stress tests and compare them to requirements
under the Basel III standardized approach.
Before we describe the statistical model, it is useful to provide some intuition on how the
stress test results can be used to estimate the implicit risk weights under CCAR and DFAST. In the
stress tests, the Federal Reserve assesses the impact of a severe macroeconomic scenario on the
numerator of banks’ regulatory capital ratios. This analysis requires projecting banks’ loan losses
and revenues over a nine-quarter planning horizon, and takes as given banks’ proposed capital
actions (dividends and share repurchases). In particular, as economic conditions deteriorate
significantly under the severely adverse supervisory scenario, loan loss provisions rise and pre-
provision net revenues decline, causing a deterioration of a bank’s capital over the nine-quarter
planning horizon. In contrast, the denominator of the risk-based capital ratios – risk-weighted assets
15
– is essentially unchanged over the planning horizon.9 Thus, stress tests leave risk-weighted assets
roughly unchanged, and all losses reduce capital levels directly; in effect, a bank must hold dollar-
for-dollar post-stress capital against all such losses. Although there is no straightforward way of
obtaining exact estimates of the stress test risk-weights using publicly available data, we use a model
to estimate the risk-weights that would best describe banks’ post-stress regulatory capital ratios.
Estimates of the implicit risk-weights associated with the post-stress capital ratios allow a
meaningful comparison to Basel III risk-weights under the standardized approach. This approach in
turn yields an estimate of the risk weights for a granular range of exposures in the loan book and
trading book, as well as operational risk. In particular, the estimated model is as follows:
𝐶𝑖𝑗
𝑅𝑊𝐴𝑖|
𝑝𝑜𝑠𝑡−𝑠𝑡𝑟𝑒𝑠𝑠
=𝐶𝑖0
𝑗
∑ 𝛽𝑛𝑗𝑥𝑖𝑛
𝑁𝑛=1
+ 𝜀𝑖 (1)
where 𝑖 indexes each bank, 𝑗 indexes each of the risk-based capital ratios in stress tests; 𝛽𝑛
represents the implied risk-weights and 𝑥𝑖𝑛denotes the various exposures that are subject to a non-
zero risk weight under Basel III. The specification estimated in equation (1) immediately above has
the following 11 subcomponents: (i) commercial and industrial (C&I) loans; (ii) commercial real
estate (CRE) loans; (iii) small business loans; (iv) first-lien residential real estate loans; (v) other
residential real estate loans (vi) credit card loans; (vii) other consumer loans; (viii) other loans; (ix)
trading assets; (x) operational risk; and (xi) securities. The estimate uses the post-stress risk-based
capital ratios under CCAR, and the set of explanatory variables also includes total payouts to control
for differences in equity distributions across banks. Specifically, under DFAST equity payouts are
9 Risk-weighted assets are weakly tied to the increase in the risk of the exposures or changes in the composition of
banks’ portfolios. For instance, market risk weighted assets are assumed to increase as the volatility of the
portfolio’s underlying assets rises under the severe macroeconomic scenarios. Credit risk weighted assets are
calculated using the standardized approach, thus the risk-weights are invariant to the macroeconomic scenario.
However, exposures on loans and securities are assumed to increase at average industry rate for total loans and non-
loan assets, respectively.
16
assumed to equal dividends and repurchases paid over the previous year while under CCAR equity
payouts are assumed to equal banks’ proposed payouts under their own baseline scenarios. Since the
relationship between post-stress capital ratios and subcomponents of risk-weighted assets is
nonlinear, the model is estimated using nonlinear least squares.10
Lastly, the implicit risk-weights
vary modestly across the three post-stress regulatory capital requirements because the maximum
decline in a bank’s regulatory capital requirements varies across the definitions of capital used in
each measure. We do not include the tier 1 leverage ratio because our model requires the
denominator of the regulatory capital ratio to be risk-weighted assets.11
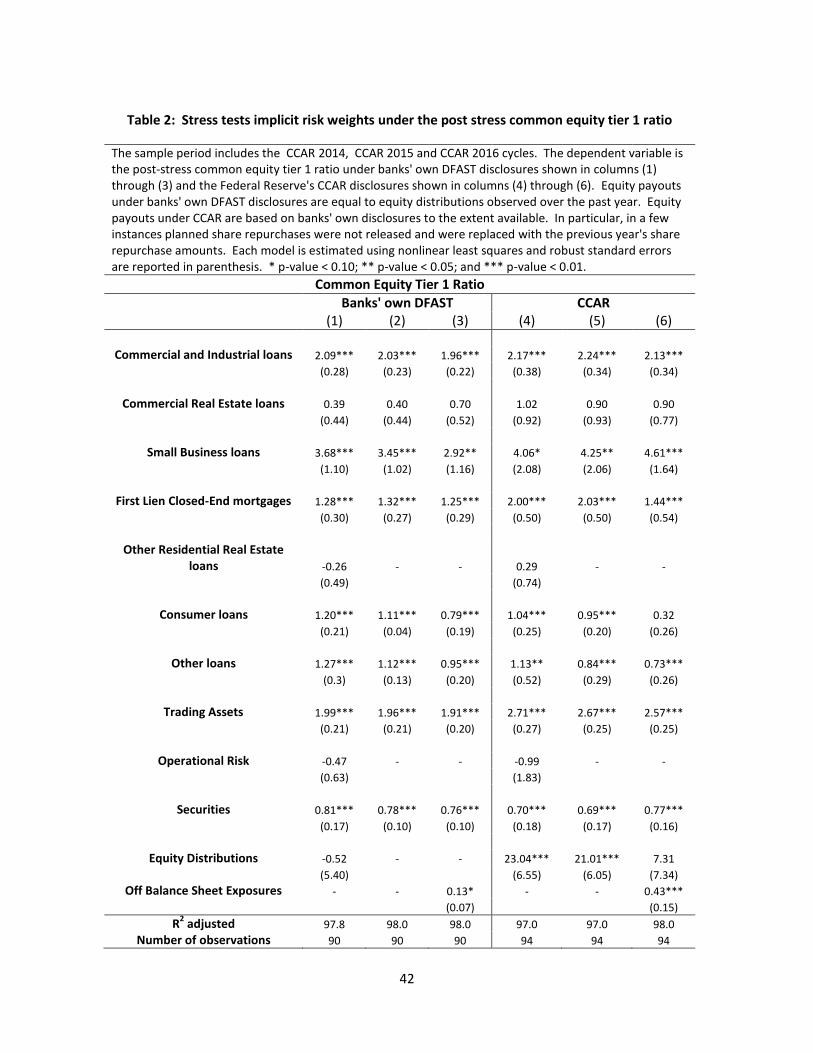
Table 2 presents the estimates of our model for the post-stress common equity tier 1 ratio.
The table reports the estimated implicit risk-weights using two different estimates for the post-stress
regulatory capital ratios –banks’ own DFAST results shown in columns (1) through (3) and the
Federal Reserve’s CCAR results, shown in columns (4) through (6).12
According to the entries in
Table 2, almost all coefficients on the various portfolios have economically intuitive signs and are
statistically significant at conventional levels. In a few cases where the coefficients are not
statistically different from zero, the model is re-estimated setting those coefficients to zero, and those
results are shown in columns (2) and (5) of the table for banks’ own DFAST and Fed’s CCAR
results, respectively.13
Columns (3) and (6) show that the results are robust to including a proxy for
the size of off-balance sheet exposures, measured as the total amount of unused commitments and
letters of credit. Table 3 presents similar results using the post-stress tier 1 capital ratio and Table 4
shows the results using the post-stress total capital ratio. Since the results are generally similar
10
We have only included post-stress capital ratios under CCAR after 2014 (inclusive) even if Federal Reserve’s own
DFAST post-stress regulatory capital ratios were lower. 11
Under the leverage ratio definition all risk-weights should be equal to 100 percent. 12
We were unable to find banks’ own DFAST results for 5 bank-year observations so the sample size is slightly
different. 13
The analysis shown on Table 2 combines all the data points for the past 3 CCAR cycles. The results are not
significantly different if the analysis is conducted separately for each year.
17
across the three definitions of post-stress regulatory capital ratios, the remainder of this section
provides an interpretation of our results using the post-stress tier 1 capital ratio.
Across all specifications in Table 3, the estimated implicit risk-weights under CCAR are
higher than risk-weights under banks’ own DFAST results for the following portfolios:
For C&I loans, implicit risk-weights are estimated to be between 206 and 215 percent
under banks’ own DFAST submissions across the three post-stress regulatory capital
ratios, while they are estimated to be between 246 and 260 percent under CCAR – so,
20 percent higher;
For small business loans, implicit risk-weights are estimated to be between 208 and
216 percent under banks’ own DFAST submissions across the three post-stress
regulatory capital ratios, while they are estimated to be between 494 and 504 percent
under CCAR – so, 140 percent higher;
For first-lien mortgage loans, implicit risk-weights are estimated to be between 104
and 107 percent under banks’ own DFAST submissions across the three post-stress
regulatory capital ratios, while are estimated to be between 126 and 158 percent under
CCAR – so, 35 percent higher;
For consumer loans, implicit risk-weights are estimated to be between 105 and 115
percent under banks’ own DFAST submissions across the three post-stress regulatory
capital ratios, while are estimated to be between 101 and 128 percent under CCAR –
so, 5 percent higher;
Lastly, for trading assets, implicit risk-weights are estimated to be between 213 and
215 percent under banks’ own DFAST submissions across the three post-stress
18
regulatory capital ratios, while are estimated to be between 270 and 275 percent under
CCAR – so, approximately 25 percent higher.
In contrast, for commercial real estate loans and other loans, the estimated implicit risk-
weights using the data from banks’ own DFAST submissions are typically higher than the implicit
risk-weights under CCAR. Thus, it is not always the case that banks’ own implicit risk-weights are
lower than the implicit risk-weights estimated using CCAR results based on the Federal Reserve’s
own models. In particular,
For commercial real estate loans, implicit risk-weights are estimated to be about 110
percent under banks’ own DFAST submissions across the three post-stress regulatory
capital ratios, while they are estimated to be between 70 and 80 percent under CCAR
– so, 30 percent lower;
Finally, for other loans, implicit risk-weights are estimated to be between 120 and
130 percent under banks’ own DFAST submissions across the three post-stress
regulatory capital ratios, while they are estimated to be between 75 and 100 percent
under CCAR – so, 30 percent lower.
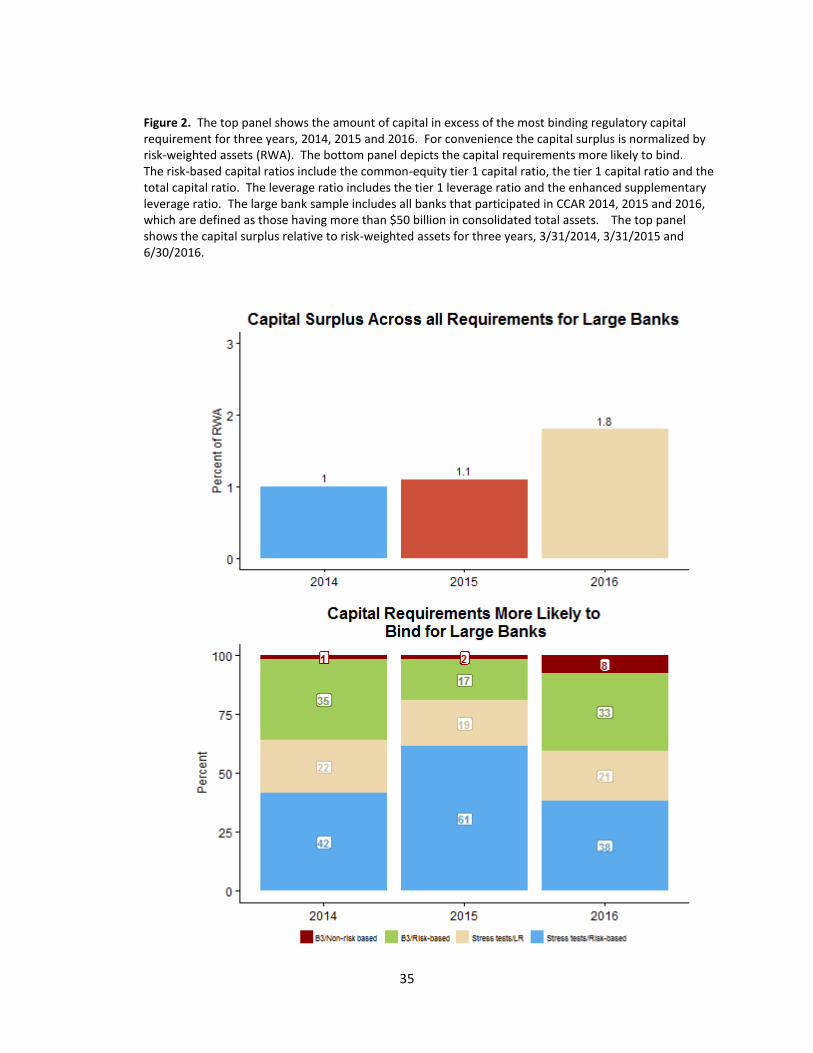
As evidenced by the relatively high adjusted-R2s, all nonlinear specifications fit the data
quite well in our sample. As shown in Figure 3, the reported post-stress CCAR tier 1 capital ratio
(x-axis) and the predicted post-stress CCAR tier 1 capital ratio (y-axis) are close to the 45 degree
line, suggesting that the model in equation (1) is a reasonable one. Specifically, for banks close to
the 45 degree line – denoted by the green dots - the projected post-stress tier 1 capital ratios using
our model are about the same as the post-stress tier 1 capital ratios published by the Federal Reserve.
19
In contrast, the yellow dots illustrate three cases in which the predicted post-stress tier 1 capital
ratios are significantly higher than the ones published by the Federal Reserve. Conversely, the red
dots also show three cases in which the predicted post-stress tier 1 capital ratios are significantly
lower than the ones published by the Federal Reserve.
We now turn to the implications of these results to the capital allocation decisions of a typical
large bank in our sample. In this analysis we assume that a bank is bound by the post-stress tier 1
capital ratio under CCAR. (The post-stress tier 1 capital ratio is the requirement most likely to bind
in CCAR 2016). Figure 4 shows the average amount of required capital for different types of loans
under the Basel III standardized approach, banks’ own DFAST submissions and CCAR. The
average amount of capital required to hold a particular loan-type is derived as follows: Under the
standardized approach, the average risk-weight for C&I loans is 100% and, a G-SIB’s Basel III Tier
1 capital requirement is 11% (minimum tier 1 capital requirement of 6.0%, plus capital conservation
buffer of 2.5% plus GSIB surcharge of 3.5%); thus the average amount of tier 1 capital required to
hold a $100 C&I loan is equal to
kC&IBasel III
=11%×100%×$100=$11.
Since Basel III capital requirements vary across banks because of the GSIB surcharge, the
average amount of capital required to hold a $100 C&I loan across all banks in our sample is $10,
and this is the height of the left-most bar in the top panel of Figure 4. Similarly, under banks’ own
DFAST and under CCAR, the amount of capital required to originate a $100 C&I loan for a U.S.
GSIB is, respectively:
kC&IDFAST
=6%×210%×$100=$12.6, and
20
kC&ICCAR
=6%×253%×$100=$15.2.
where 210% and 253% are the average estimated implicit C&I risk-weights coefficients presented in
Table 3 using the post-stress tier 1 capital ratio under banks’ own DFAST and under CCAR,
respectively. Note that capital requirements under stress already take into account the lower post-
stress tier 1 capital threshold of 6%, versus an average of 10% under banks’ tier 1 capital point-in-
time capital requirements.
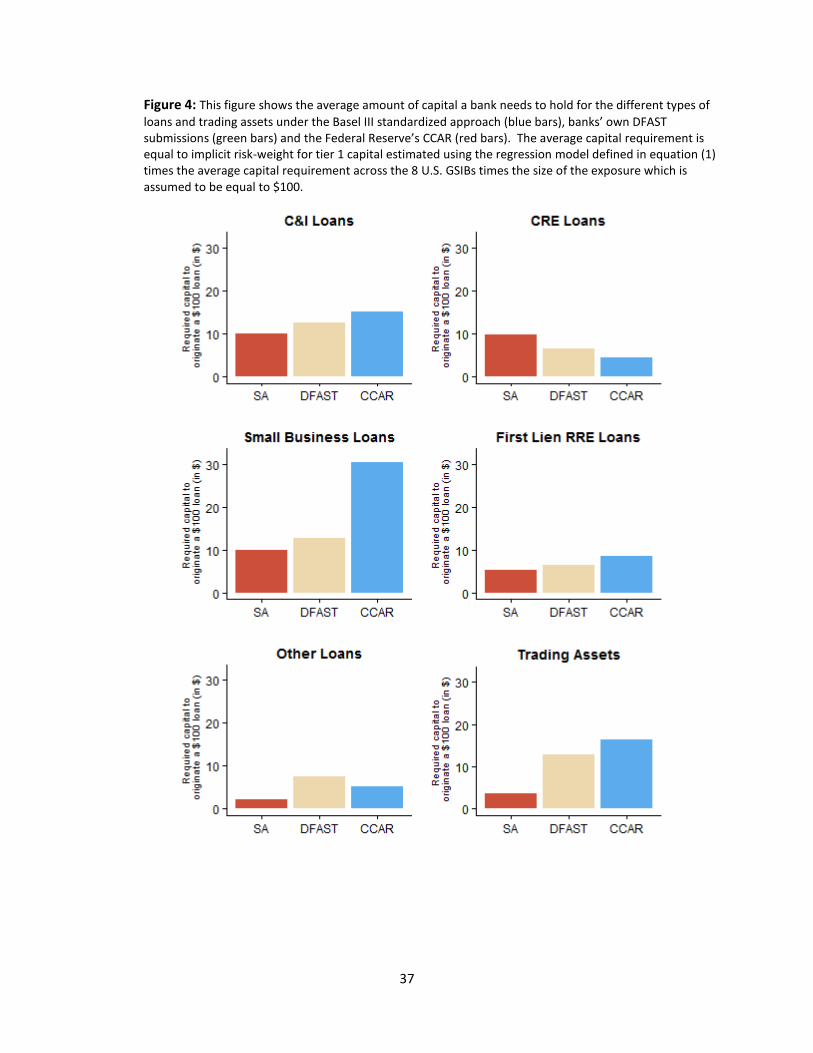
For the C&I loan portfolio we can make the following two observations: (i) the amount of
capital required to originate a C&I loan is about 50 percent higher under CCAR relative to the Basel
III standardized approach; and (ii) the required capital for C&I loans is higher under CCAR
reflecting the higher likelihood of default of such exposures under stress. All of the above
calculations are depicted in the top left panel of Figure 4.
We redo these calculations for the remaining five major portfolios included in our analysis.
The chart in the top right panel of Figure 4 represents the amount of capital required to originate a
CRE loan. The estimated capital requirement for CRE loans is lower under the stress tests than
under Basel III standardized approach. This likely reflects the relatively high quality of CRE loans
that are being originated by large banks, typically loans to finance nonfarm nonresidential properties
(e.g., offices) in supply-constrained markets. As shown in the middle left panel of Figure 4, small
business loans have the same capital requirements as C&I loans under the standardized approach;
however under the stress tests the implicit capital requirement for small business loans is thirty
percent higher under banks’ own DFAST submissions and it is three times higher under CCAR. The
significantly higher capital requirements under CCAR are consistent with the stress test scenarios

21
assuming a recession that includes an increase in the unemployment rate that is very sudden and
abrupt.
The middle right panel and lower panels of Figure 4 depict the capital requirements for first-
lien mortgage loans, other loans and trading assets, respectively. For mortgage loans, the capital
requirements are 23 percent and 70 percent higher under DFAST and CCAR, respectively, than
under the Basel III standardized approach. For mortgage loans, the significantly higher capital
requirements under CCAR likely reflects the severity of the macroeconomic scenario in the stress
tests which includes a sizable decline in house prices, augmented by the fact that some banks still
hold legacy mortgage loans. That said, the 50 percent difference in capital requirements between
CCAR and DFAST is still significant, so part of the difference in capital requirements must also be
driven by more stringent assumptions in the Federal Reserve’s models. For trading assets, capital
requirements are 3.5 times higher under DFAST and 4.5 times higher under CCAR, which is driven
by the global market shock that is part of the supervisory scenarios.
Despite the large and sudden increase in the unemployment rate in the severely adverse
scenario in stress tests, capital requirements for consumer loans are not higher under the stress tests
relative to the Basel III standardized approach. This likely reflects the very high quality of such
loans currently on banks’ balance sheets, namely loans to borrowers with pristine credit scores and
which have a very low likelihood of default, even under a recession that is worse than the one
experienced during the past global financial crisis.
5. Stress tests and the supply of credit to small businesses
In this section we examine if the stress-test risk weights actually affect bank behavior – that is,
whether they are incentivizing affected banks to deploy less capital to segments with higher implicit
22
risk weights and more capital toward segments with lower risk weights. Specifically, we study the
potential impact of tighter capital requirements on the availability of credit to small businesses. In
particular, we analyze differences in small business loan growth at banks subject to stress tests
versus those that are not, to more clearly identify shifts in the supply of credit due to stress tests from
changes in demand for credit. Because smaller banks are exempted from stress tests they can act as
a control group in assessing the impact of new regulations on the supply of credit. Thus, differences
in small business loan growth at large versus smaller banks are attributed to factors driving credit
availability at banks.
To study the impact of more stringent capital requirements on small business lending, we use
aggregate small business loan data from the Consolidated Reports of Condition and Income (FFIEC
031/041 form) for commercial banks published by the Federal Deposit Insurance Corporation to
construct an unbalanced panel of banks, covering the period from 2001:Q2 to 2016:Q2. Starting
with our initial set of banks, which includes all bank holding companies and all stand-alone
commercial banks, we split our sample into two groups: (1) banks subject to CCAR; and (2) banks
not required to participate in CCAR. For the non-CCAR sample, we then eliminated banks that have
a relatively small share of loans on their books, since these banks likely operate under a very
different business model compared to the bank holding companies subject to the supervisory stress
tests.
On the Call Reports, a small business loan is defined as a loan with an original amount of
$1M or less. This is not a perfect proxy for a small business loan since some small businesses have
borrowed more than $1M at a given point in time and some large businesses have borrowed less than
$1M on occasion, but this is how small business loans are defined on the regulatory reports.
Additionally, between 2001 and 2009 data on small business loans is only collected from banks once
23
a year (namely at the end of the second quarter of each year). Starting in the second quarter of 2010,
data on small business lending is available at a quarterly frequency. To use the full span of data, all
of our empirical specifications use data at an annual frequency since data at a quarterly frequency is
not available prior to 2010. In terms of the variables used as the dependent variable in our loan
growth regressions, the data on small business loans is available for two loan types and three
different loan sizes. The two loan types are: (1) loans secured by nonfarm nonresidential properties
(NFNR) and also known as small business CRE loans; and (2) commercial and industrial (C&I)
loans. The three loan sizes are as follows: (1) loans with original amounts less than $100K; (2) loans
with original amounts greater than $100K through $250K; and (3) loans with original amounts
greater than $250K through $1M.
Table 5 contains selected summary statistics for small business loans held at CCAR and non-
CCAR banks. Banks subject to CCAR account for approximately 35 percent of all small business
loans and slightly less than 50 percent of C&I small business loans.14
The share of small business
loans secured by NFNR properties held by CCAR banks is just 23 percent, but it was approximately
29 percent at the end of 2010 as CCAR banks have been reducing their holdings of such loans since
the introduction of the Dodd-Frank Act. Interestingly, CCAR banks hold the majority of C&I loans
with original amounts of $100K or less, which likely includes corporate credit card loans and the
unguaranteed portion of loan securitized to the Small Business Administration.
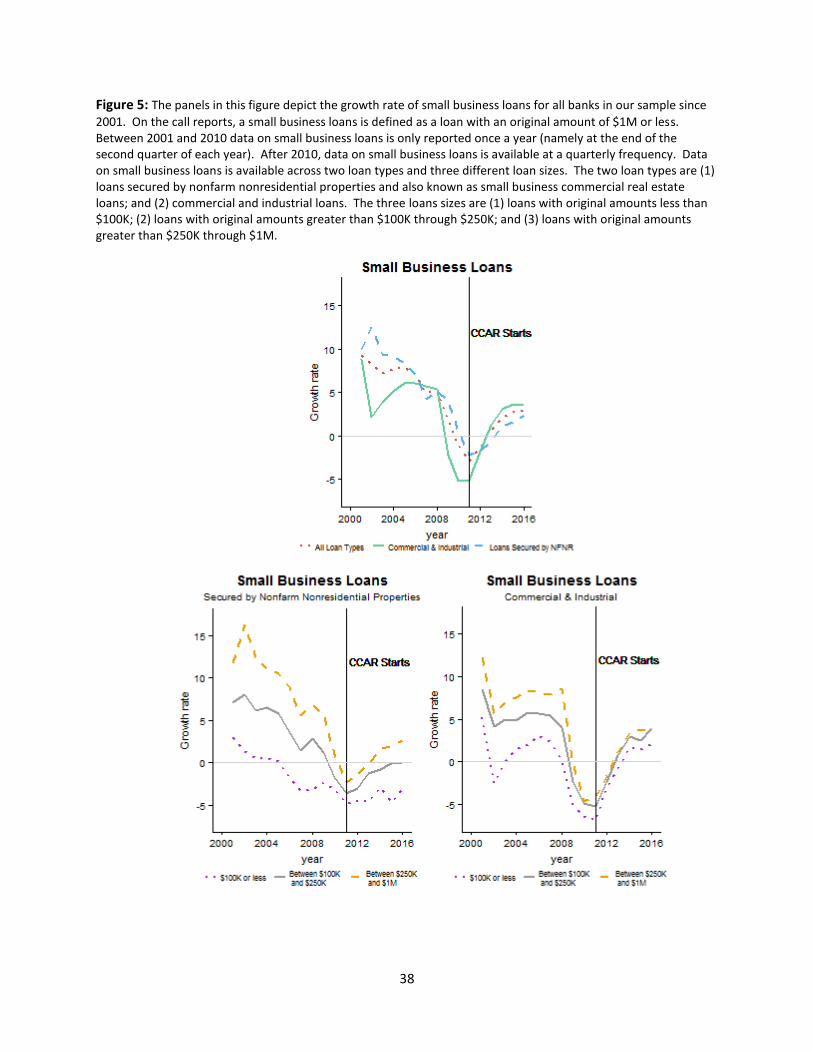
The three panels in Figure 5 illustrate the growth rate of small business loans for all the
banks in our sample since 2001. Prior to the crisis, small business loans were growing at a solid
pace of about 5 percent on average. The growth rate of small business loans fell significantly during
14
The Call Reports likely understate holdings of small business loans by large banks because these banks are more
likely to securitize the loans with loan guarantees from the Small Business Administration and only the
unguaranteed portion of the loan is reported on the Call Reports.
24
the 2007-2009 financial crisis but started to recover in 2011, although small business loans were still
running off banks’ books until the end of 2012. Moreover, the recovery of small business lending at
banks has been uneven with small business C&I loans recovering at a faster pace relative to small
business loans secured by NFNR properties. Indeed the growth rate of the smallest of small business
loans secured by NFNR properties – shown by the blue line in the bottom left panel of Figure 5 –
was still negative at the end of 2016.
To assess the impact of stress testing on the credit availability to small businesses we start by
reporting differences in loan growth between banks subject to CCAR and those that are exempted
from stress tests. Because banks that are not required to participate in stress tests face less stringent
capital requirements, they can act as a control group in assessing the impact of stress tests on the
growth rate of small business loans. Namely, this assumption implies that the demand for small
business loans facing banks subject to CCAR and those that are exempted from stress tests is
roughly the same, and therefore differences in loan growth between these two bank groups can be
explained by the heightened capital requirements generated by the U.S. stress tests.
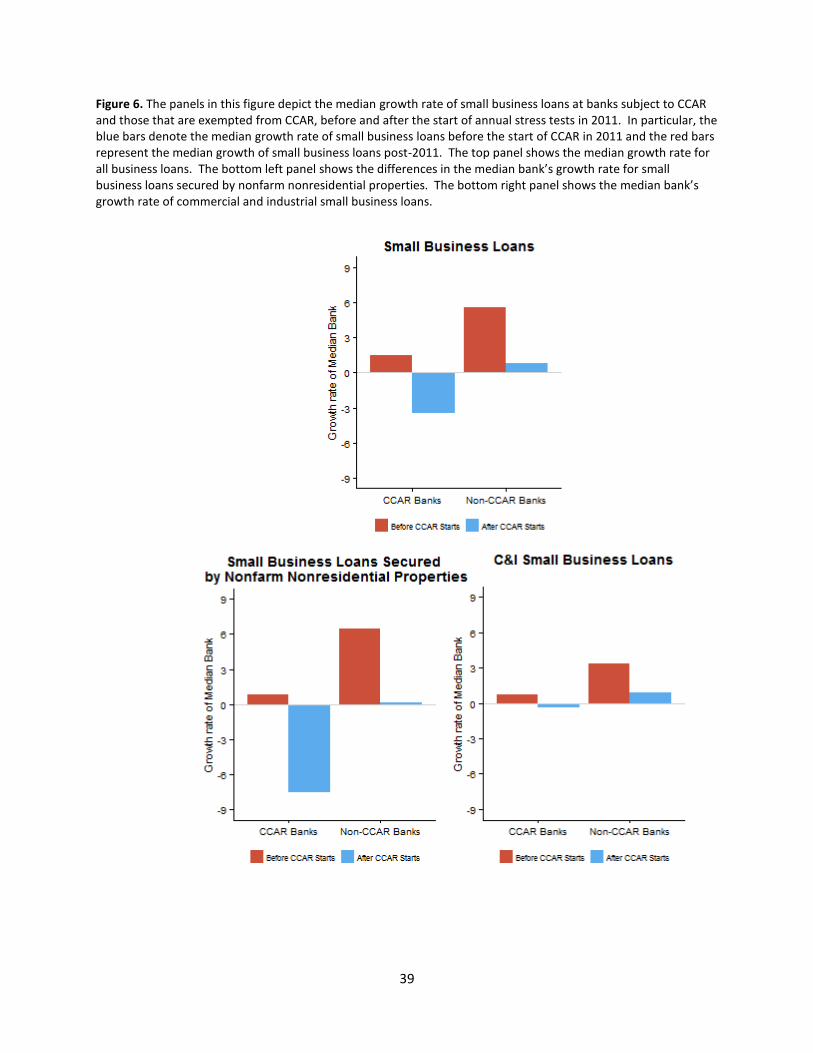
Figure 6 depicts the median growth rate of small business loans at banks subject to CCAR
and those that are exempted from CCAR, before and after the start of annual stress tests in 2011.
Specifically, the blue bars in the charts of Figure 6 denote the median growth rate of small business
loans before the start of CCAR in 2011 and the red bars represent the median growth rate of small
business loans post-2011. For all small business loans – shown in the top panel of Figure 6 – the
median annual growth rate declined 5.0 percentage points at CCAR banks and 4.7 percentage points
at non-CCAR banks after the start of start of stress tests in 2011. The slightly more pronounced
decline in holdings of small business loans at CCAR banks suggests that banks subject to more
25
stringent capital requirements reduced holdings of such loans by more than banks not subject to the
stress tests, albeit the aggregate differences appear to be relatively small.
The difference in the growth rate of small business loans is much more accentuated for small
business loans secured by NFNR properties, shown in the bottom left panel of Figure 6. In
particular, banks subject to CCAR reported a 8.4 percentage point decline in the median annual
growth rate of small business loans secured by NFNR properties after 2011. In contrast, the decline
in the median annual growth rate at non-CCAR banks was 6.4 percentage points, or two percentage
point lower than the decline observed at CCAR banks. As shown in the bottom right panel of Figure
6, the decline in the median annual growth rate of C&I small business loans was 1 percentage point
at CCAR banks post-CCAR, while it was 2.5 percentage points for non-CCAR banks, thus CCAR
appears to have had a small imprint in the growth rate of such loans at large banks.
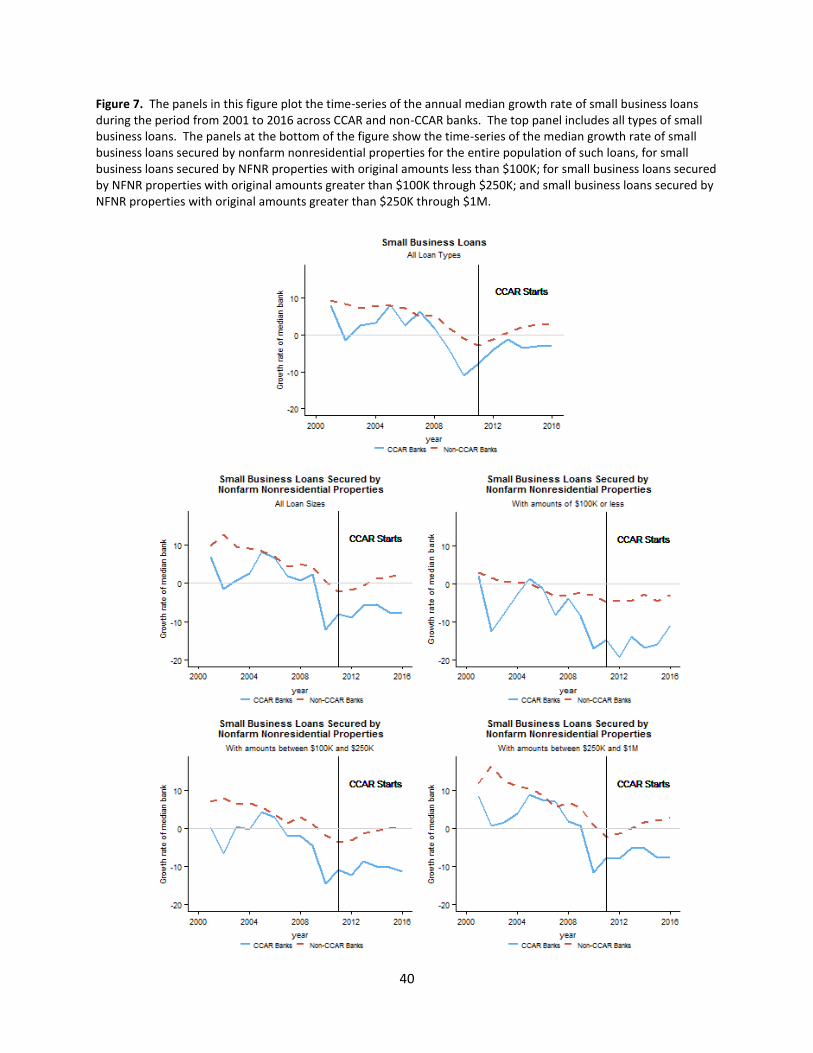
We also show the time-series of the growth rates of small business loans before and post-
CCAR for two bank groups: (1) CCAR banks; (2) non-CCAR banks. Figure 7 shows the median
growth rate on small business loans during the period from 2001 to 2016, based on annual Call
Report data. The growth rate of small business loans was quite robust at both the CCAR and non-
CCAR banks prior to the start of the 2007-2009 financial crisis. During the crisis, it fell sharply at
the CCAR banks, likely reflecting the fact that large banks experienced the steepest capital shortfalls
that culminated with the failure of Lehman Brothers at the end of 2008. The growth of small
business loans started to recover at the CCAR banks prior to 2011, which is denoted by the vertical
line in the top panel of Figure 7. Despite the recovery, small business loans on the balance sheet of
CCAR banks continued to exhibit negative growth rates as shown by the growth rate -2.8 percent in
2016, while small business loans have been growing at non-CCAR banks since 2013.
26
As shown in the lower panels of Figure 7, the run-off in small business loans at CCAR banks
is driven by the behavior of small business loans secured by NFNR properties, or small business
CRE loans. Although the sharp decline in the growth rate of small business loans occurred at the
onset of the past financial crisis, the recovery of small business CRE loans never occurred at CCAR
banks in the post-crisis period. Across all small business loan sizes, small business CRE loans have
continued to run-off at CCAR banks, while they have generally exhibited positive growth rates at
non-CCAR banks.
5.1 Econometric results
This section describes the econometric methodology. We investigate the impact of CCAR on
banks’ holdings of small business loans using panel regression models based on annual data from
2001 to 2016 for the set of more than 8,000 banks. The empirical strategy studies holdings of small
business loans before and after the introduction of CCAR and examines the change in loan growth
across banks depending on whether the banks are required to participate in the U.S. stress tests. The
visual evidence presented in the previous section suggests that CCAR is having an impact on banks’
holding of small business loans, particularly those secured by NFNR properties.
The introduction of CCAR is represented with a dummy variable defined as
𝐶𝐶𝐴𝑅𝑡 = {1 if 𝑡 ≥ 20110 otherwise.
The objective is to quantify the impact of CCAR on the growth rate of small business loans,
for the two loan types and three loan sizes defined earlier. The introduction of stress tests is
expected to impact only the banks that are required to participate in the stress tests, represented with
a bank-specific dummy variable, 𝐶𝐶𝐴𝑅 𝐵𝑎𝑛𝑘𝑖𝑡, which takes the value of 1 if bank 𝑖 participated in
27
CCAR in year 𝑡 and 0 otherwise. The impact of CCAR on the growth of small business loans is
identified using the coefficient associated with the variable 𝐶𝐶𝐴𝑅𝑡 × 𝐶𝐶𝐴𝑅 𝐵𝑎𝑛𝑘𝑖𝑡, the interaction
between a bank being required to participate in CCAR after the start of annual stress tests. In
addition, we have also included several variables from the Call Reports that may affect the
willingness of a bank to hold small business loans. In particular, in our main specification we
included measures of bank profitability, capital, bank risk, funding costs and the share of noninterest
income in total revenues (listed under the vector “CALL” below). The set of macroeconomic and
financial variables used in the regression analysis below includes the following ten quarterly series
(“MACRO”): (1) real gross domestic product; (2) unemployment rate; (3) real disposable income;
(4) commercial real estate price index; (5) the CoreLogic house price index; (6) Dow Jones total
stock market index; (7) 3-month Treasury rate; (8) 10-year Treasury yield; (9) 10-year yield on
BBB-rated corporate bonds; (10) the Chicago Board Options Exchange market volatility index.
Each model also includes a fixed effect (“𝛼𝑖”) to control for unobserved bank characteristics that
remained constant over time and may correlate with the explanatory variables.
Let i=1,...,N and t=1,...,T index the cross-sectional and time-series dimensions of the panel,
respectively. In particular, we consider the following fixed effects panel regression specification:
∆𝐿𝑖𝑡 = 𝛼𝑖 + 𝛽0𝐶𝐶𝐴𝑅𝑡 + 𝛽1𝐶𝐶𝐴𝑅𝑡 × 𝐶𝐶𝐴𝑅 𝐵𝑎𝑛𝑘𝑖𝑡 + 𝛽𝑐′𝐶𝐴𝐿𝐿𝑖𝑡−1 + 𝛽𝑀
′ 𝑀𝐴𝐶𝑅𝑂𝑖𝑡 + 𝜖𝑖𝑡
In the context of our model, ∆𝐿𝑖𝑡 could denote, for example, the growth rate of loans secured by
NFNR properties with original amounts less than $100K, expressed in percent terms.
Table 6 contains selected summary statistics for the bank-specific variables used in the
empirical analysis below, separately for the CCAR bank and non-CCAR bank samples. On average,
holdings of small business loans on the books’ of CCAR banks have contracted, with the exception
28
of C&I loans with original amounts less than $100K. The opposite is true for non-CCAR banks. In
addition, CCAR banks have a lower amount of capital above regulatory requirements, are more
profitable, have a higher ratio of risk-weighted assets to total assets, slightly lower funding costs and
a higher share of noninterest income to revenues.
Table 7 presents the results in which the dependent variable is the annual growth rate of
small business loans secured by NFNR properties. According to the entries on the first two rows of
Table 7, loan growth has been lower in the post-CCAR period, and significantly more so at banks
subject to CCAR. The reduction in loan growth of small business CRE loans is slightly statistically
stronger for loans with original amounts of more than $250K through $1M, followed by loans with
original amounts less than $100K. In addition, the effect is also economically very important. For
instance, in specification (14) which includes both bank-specific and macroeconomic controls,
subjecting a bank to participate in CCAR would reduce small business CRE loan growth by more
than 4 percentage points on an annual basis.
The coefficients on the remaining bank-specific controls have the economically intuitive
signs and are almost always statistically significant at conventional levels. The coefficient on excess
capital is greater than zero, consistent with the fact that banks with higher levels of capital above
minimum requirements are more willing to lend. Similarly, more profitable banks, as evidenced by
higher return-on-equity and banks’ with a lower ratio of risk-weighted assets to total assets, are also
associated with a higher growth rate of small business CRE loans.
Table 8 presents the results for the growth rate of small commercial and industrial loans.
According to the entries of the first row, the growth rate of small C&I loans declines post-2011, but
with the exception of the smallest C&I loans, there isn’t a further decline in loan growth at CCAR
29
banks as shown in the second row of the table across most of the 15 panel regressions. While the
majority of coefficients have a negative sign they aren’t statistically different from zero at
conventional levels. As was the case of small business CRE loans, banks with a higher capital
surplus and that are more profitable exhibit higher growth rates of small C&I loans on average.
An available topic for future research is gaining a better understanding of causes underlying
the differences on the impact of supervisory stress tests on the supply of credit to small businesses
across the two loan types. As pointed out previously, the definition of small business loans on the
Call Reports is only a proxy for a loan to a small business. In particular, a small business loan is
defined as a loan with an original amount of $1M or less on the Call Reports. This is not a perfect
proxy for a small business loan since some large businesses may have borrowed less than $1M and
such loans would be misclassified as a small business loan. It seems plausible to assume that this
misclassification issue is more prevalent for C&I loans, which likely includes larger and more
mature businesses. This could explain the difference in our results between small business CRE and
C&I loans.
6. Conclusions
The role of supervisory stress tests in banking supervision has increased dramatically since the
aftermath of the 2007–2009 financial crisis. In this paper we have shown that the Federal Reserve’s
stress tests are a key driver of large U.S. banks’ capital requirements. Moreover, this paper estimates
the implicit capital requirements for various asset classes implicit in the supervisory stress tests by
examining the post-stress regulatory capital ratios produced by the stress tests controlling for
differences in portfolio composition and equity distributions across banks. The results show that the
Federal Reserve’s CCAR stress test is imposing dramatically higher capital requirements on certain

30
asset classes – most notably, small business loans and residential mortgages – than bank internal
models and Basel standardized models.
In the second part of the paper, we find that stress tests accentuated the decline in holdings of
small business loans secured by NFNR properties at banks subject to CCAR after 2011. These loans
account for about half of small business loans held by banks. Thus, by curtailing credit to this key
sector of the U.S. economy, stress tests may be having an adverse impact on economic growth. In
particular, small businesses account for more than 40 percent of private nonfarm gross domestic
product, and the formation of new businesses contribute substantially to the creation of new jobs.
Lastly, these findings have implications for the design of supervisory stress test scenarios
and the almost exclusive use of the Fed’s own models to generate the projections of banks’ post-
stress regulatory capital ratios. Regarding the scenarios, the Federal Reserve should reduce the
severity of the change in the unemployment rate used in the severely adverse scenario to
ameliorate some of the negative consequences of stress tests on credit availability. On the use of
the Fed’s models, the opaqueness and imprecision of such models leads to uncertainty among
institutions as to what level of capital they will be required to hold, and thus, may cause banks to
reduce credit availability or prevent them from making loans in anticipation of knowing the
results of the stress tests. Therefore, the efficient allocation of credit in the U.S. financial system
could be improved significantly by having banks’ own models play a greater role in determining
banks’ post-stress regulatory capital ratios and having the Fed’s models used only to ensure the
consistency of stress-test results across banks, similar to the current approach employed by the
Bank of England (BoE).
31
References
Acharya, Viral V., Allen N. Berger, and Raluca A. Roman, Lending Implications of U.S. Bank
Stress Tests: Costs or Benefits?, unpublished manuscript, May 2017.
Acharya, Viral V., Robert Engle, and Diane Pierret, 2014, Testing macroprudential stress tests:
The risk of regulatory risk weights, Journal of Monetary Economics 65, 36-53.
Aiyar, Shekhar, Charles W. Calomiris, and Tomasz Wieladek, 2014, Does macro-prudential
regulation leak? Evidence from a UK policy experiment, Journal of Money, Credit and Banking
46 (s1), 181-214.
Basel Committee on Banking Supervision, 2010, An assessment of long-term economic impact
of stronger capital and liquidity requirements. Bank for International Settlements.
Berger, Allen N. and Gregory F. Udell, 1994, Did risk-based capital allocate bank credit and
cause a “credit crunch” in the United States? Journal of Money, Credit and Banking 26, 585-628.
Bolotnyy, Valentin, Rochelle M. Edge, and Luca Guerrieri, 2015, Revenue forecasts, capital
adequacy, and the uncertainty of stress test results, FEDS Working Paper.
Calem, Paul S., Ricardo Correa, and Seung Jung Lee, 2016, Prudential policies and their impact
on credit in the United States, International Finance Discussion Papers 1186, Board of Governors
of the Federal Reserve System (U.S.).
Chen, Brian, Samuel Hanson, and Jeremy Stein, The decline of big-bank lending to small
business: Dynamics impacts on local credit and labor markets, unpublished manuscript, March
2017.
Covas, Francisco, Ben Rump, and Egon Zakrajsek, 2013, Stress testing U.S. bank holding
companies: A dynamic panel quantile regression approach, International Journal of Forecasting
30, 691-713.
Eber, Maximilian and Camelia Minoiu, 2016, How do banks adjust to stricter supervision?
Harvard University working paper.
Flannery, Mark J., 2016, Some effects of capital regulation when there are competing nonbank
lenders, The New International Financial System, 495-509.
Flannery ,Mark, Beverly Hirtle, and Anna Kovner,2017, Evaluating the information in the
federal reserve stress tests, Journal of Financial Intermediation 29,1-18.
Frame, Scott, Kristopher Gerardi, and Paul S. Willen, 2015, The failure of supervisory stress
testing: Fannie Mae, Freddie Mac, and OFHEO, Federal Reserve Bank of Atlanta Working Paper
Series.
32
Gallardo, German Gutierrez, Til Schuermann, and Michael Duane, 2016, Stress testing
convergence, Journal of Risk Management in Financial Institutions 9, 32-45.
Goldstein, Itay and Haresh Sapra, 2014, Should banks’ stress test results be disclosed? An
analysis of the costs and benefits, Foundations and Trends in Finance 8, 1-54.
Goldstein, Itay and Yaron Leitner, 2015, Stress tests and information disclosure. Working papers
2015-10, Federal Reserve Bank of Philadelphia.
Gross, Marco and Javier Población, 2017, Implications of model uncertainty for bank stress
testing, Journal of Financial Services Research 51, 1-28.
Guerrieri, Luca and Michelle Welch, 2012, Can macro variables used in stress testing forecast
the performance of banks? Finance and Economics Discussion Series 2012-49, Board of
Governors of the Federal Reserve System (U.S.).
Hirtle, Beverly and Andreas Lehnert, 2015, Supervisory stress tests, Annual Review of Financial
Economics 7,339-355.
Hirtle, Beverly, Anna Kovner, James Vickery, and Meru Bhanot, 2016, Assessing financial
stability: The capital and loss assessment under stress scenarios (CLASS) model, Journal of
Banking & Finance 69,S35-S55.
Kapinos, Pavel and Oscar A. Mitnik, 2015, A top-down approach to stress testing banks, Journal
of Financial Services Research 2, 229-264.
Kiser,Elizabeth K., Robin A. Prager, and Jason R. Scott, 2016, Supervisory ratings and bank
lending to small businesses during the financial crisis and great recession, Journal of Financial
Services Research 50,163-186.
Kupiec, Paul H., 2017, Inside the black box: The accuracy of alternative stress test models, AEI
Economics Working Paper Series 2017.
Lambertini, Luisa and Abhik Mukherjee, 2016, Is bank capital regulation costly for firms?
Evidence from syndicated loans.
Martynova, Natalya, 2015, Effect of bank capital requirements on economic growth: A survey,
DNB Working Paper 2015-467, De Nederlandsche Bank.
Peristiani, Stravos, Donald P. Morgan, and Vanessa Savino, 2014, The information value of the
stress test and bank opacity, Journal of Money Credit and Banking 46, no. 7, 1479-500.
Morris-Levenson, Joshua A., Robert F. Sarama, Christoph Ungerer, 2017, Does tighter bank
regulation affect mortgage originations?
33
Neretina, Ekaterina, Cenkhan Sahin, and Jakob de Haan, 2015, Banking stress test effects on
returns and risks, DNB Working Paper 2014-419, De Nederlandsche Bank.
Peek, Joe and Eric Rosengren, 1995, Bank regulation and the credit crunch, Journal of Banking
& Finance 19, 679-692.
Peek, Joe and Eric Rosengren, 1995, The capital crunch: neither a borrower nor a lender be,
Journal of Money, Credit, and Banking 27, 625-638.
The Clearing House, March 2016; 2016 Federal Reserve’s stress testing scenarios, available at
https://theclearinghouse.org/-
/media/action%20line/documents/volume%20vii/20160316%20tch%20research%20note%20cca
r.pdf?la=en
The Clearing House, January 2017; The capital allocation inherent in the Federal Reserve’s
capital stress test, available at https://theclearinghouse.org/-
/media/tch/documents/tch%20weekly/2017/20170130_tch_research_note_implicit_risk_weights
_in_ccar-final.pdf?la=en
The Clearing House, May 2017; Are the supervisory bank stress tests constraining the supply of
credit to small businesses?, available at https://theclearinghouse.org/-
/media/tch/documents/research/articles/2017/05/2017_05_12_small_business_lending.pdf?la=en
Schuermann, Til, 2014, Stress testing banks, International Journal of Forecasting 30,717-728.
Schuermann, Til, 2016, Stress testing in wartime and in peacetime, Financial Institutions Center
Working Papers 2016-01, University of Pennsylvania Wharton School Weiss Center.
Wallen, Jonathan, 2017, The effect of bank capital requirements on bank loan rates, unpublished
manuscript.
Wu, Deming and Xinlei Zhao, 2016, Determinants of auto loan defaults and implications on
stress testing, Office of the Comptroller of the Currency Working Paper.
34
Figure 1. The top panel shows the amount of capital in excess of the most binding regulatory capital requirement across Basel III capital requirements and the U.S. supervisory stress tests for three years, 2014, 2015 and 2016. For convenience the capital surplus is normalized by risk-weighted assets (RWA). The bottom panel depicts the capital requirements more likely to bind across each of the two capital regimes. The risk-based capital ratios include the common-equity tier 1 capital ratio, the tier 1 capital ratio and the total capital ratio. The leverage ratio includes the tier 1 leverage ratio and the enhanced supplementary leverage ratio under Basel III and the tier 1 leverage ratio under the stress tests. The large bank sample includes all banks that participated in CCAR 2014, 2015 and 2016, which are defined as those having more than $50 billion in consolidated total assets.
35
Figure 2. The top panel shows the amount of capital in excess of the most binding regulatory capital requirement for three years, 2014, 2015 and 2016. For convenience the capital surplus is normalized by risk-weighted assets (RWA). The bottom panel depicts the capital requirements more likely to bind. The risk-based capital ratios include the common-equity tier 1 capital ratio, the tier 1 capital ratio and the total capital ratio. The leverage ratio includes the tier 1 leverage ratio and the enhanced supplementary leverage ratio. The large bank sample includes all banks that participated in CCAR 2014, 2015 and 2016, which are defined as those having more than $50 billion in consolidated total assets. The top panel shows the capital surplus relative to risk-weighted assets for three years, 3/31/2014, 3/31/2015 and 6/30/2016.
36
Figure 3. The figure depicts the released post-stress tier 1 capital ratio under CCAR’s severely adverse
scenario (shown in the x-axis) versus the predicted post-stress tier 1 capital ratio under CCAR’s severely adverse scenario (shown in the y-axis). The green dots denote instances where the projected post-stress tier 1 capital ratios are very close to the projected post-stress tier 1 capital ratios obtained using the model defined in equation (1). The yellow dots illustrate three cases in which the predicted post-stress tier 1 capital ratios are significantly higher than the post-stress tier 1 capital ratios published by the Federal Reserve. Conversely, the red dots also show three cases in which the predicted post-stress tier 1 capital ratios are significantly lower than the post-stress tier 1 capital ratios published by the Federal Reserve.
37
Figure 4: This figure shows the average amount of capital a bank needs to hold for the different types of
loans and trading assets under the Basel III standardized approach (blue bars), banks’ own DFAST submissions (green bars) and the Federal Reserve’s CCAR (red bars). The average capital requirement is equal to implicit risk-weight for tier 1 capital estimated using the regression model defined in equation (1) times the average capital requirement across the 8 U.S. GSIBs times the size of the exposure which is assumed to be equal to $100.
38
Figure 5: The panels in this figure depict the growth rate of small business loans for all banks in our sample since
2001. On the call reports, a small business loans is defined as a loan with an original amount of $1M or less. Between 2001 and 2010 data on small business loans is only reported once a year (namely at the end of the second quarter of each year). After 2010, data on small business loans is available at a quarterly frequency. Data on small business loans is available across two loan types and three different loan sizes. The two loan types are (1) loans secured by nonfarm nonresidential properties and also known as small business commercial real estate loans; and (2) commercial and industrial loans. The three loans sizes are (1) loans with original amounts less than $100K; (2) loans with original amounts greater than $100K through $250K; and (3) loans with original amounts greater than $250K through $1M.
39
Figure 6. The panels in this figure depict the median growth rate of small business loans at banks subject to CCAR and those that are exempted from CCAR, before and after the start of annual stress tests in 2011. In particular, the blue bars denote the median growth rate of small business loans before the start of CCAR in 2011 and the red bars represent the median growth of small business loans post-2011. The top panel shows the median growth rate for all business loans. The bottom left panel shows the differences in the median bank’s growth rate for small business loans secured by nonfarm nonresidential properties. The bottom right panel shows the median bank’s growth rate of commercial and industrial small business loans.
40
Figure 7. The panels in this figure plot the time-series of the annual median growth rate of small business loans during the period from 2001 to 2016 across CCAR and non-CCAR banks. The top panel includes all types of small business loans. The panels at the bottom of the figure show the time-series of the median growth rate of small business loans secured by nonfarm nonresidential properties for the entire population of such loans, for small business loans secured by NFNR properties with original amounts less than $100K; for small business loans secured by NFNR properties with original amounts greater than $100K through $250K; and small business loans secured by NFNR properties with original amounts greater than $250K through $1M.
41
Table 1. Capital Requirements under Basel III and Stress Tests
The capital conservation buffer (CCB) is set at a level of 2.5%. The surcharge for global systemically important bank holding companies (GSIB surcharge) currently applicable to U.S. GSIBs ranges from 3.5% for JPMorgan Chase & Co.; 3.0% for Citigroup Inc., Bank of America Corporation and Morgan Stanley; 2.5% for Goldman Sachs and Wells Fargo & Company; and 1.5% for Bank of New York Mellon Corporation and State Street Corporation. The Basel III column lists the capital requirements after calendar year 2019 and thereafter (post-transition). Finally, the countercyclical capital buffer (CCyB) is currently set at a level of 0% in the U.S.
Regulatory capital ratio Basel III
Risk-weighting Requirement (%)
Common equity tier 1 Standardized approach 4.5 + CCB + GSIB surcharge + CCyB
Advanced approaches 4.5 + CCB + GSIB surcharge + CCyB
Tier 1 risk-based capital ratio Standardized approach 6.0 + CCB + GSIB surcharge + CCyB
Advanced approaches 6.0 + CCB + GSIB surcharge + CCyB
Total risk-based capital ratio Standardized approach 8.0 + CCB + GSIB surcharge + CCyB
Advanced approaches 8.0 + CCB + GSIB surcharge + CCyB
Tier 1 leverage ratio - 5.0
Suplementary leverage ratio Advanced approaches 3.0 + 2.0 (GSIB only)
Regulatory capital ratio Stress Tests
Payout Assumptions Scenario Requirement (%)
Common equity tier 1 DFAST Adverse 4.5
Common equity tier 1 DFAST Severely Adverse 4.5
Common equity tier 1 CCAR Adverse 4.5
Common equity tier 1 CCAR Severely Adverse 4.5
Common equity tier 1 CCAR Bank Own Scenario 4.5
Tier 1 risk-based capital ratio DFAST Adverse 6.0
Tier 1 risk-based capital ratio DFAST Severely Adverse 6.0
Tier 1 risk-based capital ratio CCAR Adverse 6.0
Tier 1 risk-based capital ratio CCAR Severely Adverse 6.0
Tier 1 risk-based capital ratio CCAR Bank Own Scenario 6.0
Total risk-based capital ratio DFAST Adverse 8.0
Total risk-based capital ratio DFAST Severely Adverse 8.0
Total risk-based capital ratio CCAR Adverse 8.0
Total risk-based capital ratio CCAR Severely Adverse 8.0
Total risk-based capital ratio CCAR Bank Own Scenario 8.0
Tier 1 leverage ratio DFAST Adverse 4.0
Tier 1 leverage ratio DFAST Severely Adverse 4.0
Tier 1 leverage ratio CCAR Adverse 4.0
Tier 1 leverage ratio CCAR Severely Adverse 4.0
Tier 1 leverage ratio CCAR Bank Own Scenario 4.0
42
Table 2: Stress tests implicit risk weights under the post stress common equity tier 1 ratio
The sample period includes the CCAR 2014, CCAR 2015 and CCAR 2016 cycles. The dependent variable is the post-stress common equity tier 1 ratio under banks' own DFAST disclosures shown in columns (1) through (3) and the Federal Reserve's CCAR disclosures shown in columns (4) through (6). Equity payouts under banks' own DFAST disclosures are equal to equity distributions observed over the past year. Equity payouts under CCAR are based on banks' own disclosures to the extent available. In particular, in a few instances planned share repurchases were not released and were replaced with the previous year's share repurchase amounts. Each model is estimated using nonlinear least squares and robust standard errors are reported in parenthesis. * p-value < 0.10; ** p-value < 0.05; and *** p-value < 0.01.
Common Equity Tier 1 Ratio
Banks' own DFAST CCAR (1) (2) (3) (4) (5) (6) Commercial and Industrial loans 2.09*** 2.03*** 1.96*** 2.17*** 2.24*** 2.13***
(0.28) (0.23) (0.22) (0.38) (0.34) (0.34)
Commercial Real Estate loans 0.39 0.40 0.70 1.02 0.90 0.90
(0.44) (0.44) (0.52) (0.92) (0.93) (0.77)
Small Business loans 3.68*** 3.45*** 2.92** 4.06* 4.25** 4.61***
(1.10) (1.02) (1.16) (2.08) (2.06) (1.64)
First Lien Closed-End mortgages 1.28*** 1.32*** 1.25*** 2.00*** 2.03*** 1.44***
(0.30) (0.27) (0.29) (0.50) (0.50) (0.54)
Other Residential Real Estate loans -0.26 - - 0.29 - -
(0.49) (0.74)
Consumer loans 1.20*** 1.11*** 0.79*** 1.04*** 0.95*** 0.32
(0.21) (0.04) (0.19) (0.25) (0.20) (0.26)
Other loans 1.27*** 1.12*** 0.95*** 1.13** 0.84*** 0.73***
(0.3) (0.13) (0.20) (0.52) (0.29) (0.26)
Trading Assets 1.99*** 1.96*** 1.91*** 2.71*** 2.67*** 2.57***
(0.21) (0.21) (0.20) (0.27) (0.25) (0.25)
Operational Risk -0.47 - - -0.99 - -
(0.63) (1.83)
Securities 0.81*** 0.78*** 0.76*** 0.70*** 0.69*** 0.77***
(0.17) (0.10) (0.10) (0.18) (0.17) (0.16)
Equity Distributions -0.52 - - 23.04*** 21.01*** 7.31
(5.40) (6.55) (6.05) (7.34)
Off Balance Sheet Exposures - - 0.13* - - 0.43***
(0.07) (0.15)
R2 adjusted 97.8 98.0 98.0 97.0 97.0 98.0
Number of observations 90 90 90 94 94 94
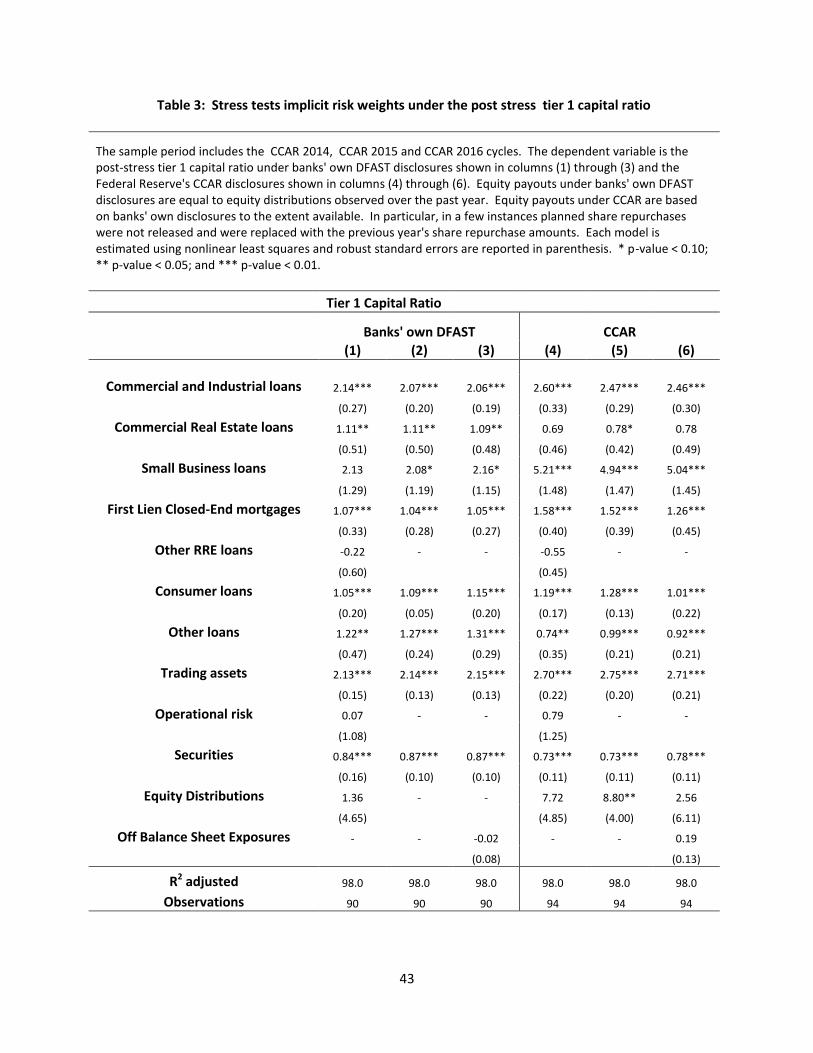
43
Table 3: Stress tests implicit risk weights under the post stress tier 1 capital ratio
The sample period includes the CCAR 2014, CCAR 2015 and CCAR 2016 cycles. The dependent variable is the post-stress tier 1 capital ratio under banks' own DFAST disclosures shown in columns (1) through (3) and the Federal Reserve's CCAR disclosures shown in columns (4) through (6). Equity payouts under banks' own DFAST disclosures are equal to equity distributions observed over the past year. Equity payouts under CCAR are based on banks' own disclosures to the extent available. In particular, in a few instances planned share repurchases were not released and were replaced with the previous year's share repurchase amounts. Each model is estimated using nonlinear least squares and robust standard errors are reported in parenthesis. * p-value < 0.10; ** p-value < 0.05; and *** p-value < 0.01.
Tier 1 Capital Ratio
Banks' own DFAST CCAR
(1) (2) (3) (4) (5) (6)
Commercial and Industrial loans 2.14*** 2.07*** 2.06*** 2.60*** 2.47*** 2.46***
(0.27) (0.20) (0.19) (0.33) (0.29) (0.30)
Commercial Real Estate loans 1.11** 1.11** 1.09** 0.69 0.78* 0.78
(0.51) (0.50) (0.48) (0.46) (0.42) (0.49)
Small Business loans 2.13 2.08* 2.16* 5.21*** 4.94*** 5.04***
(1.29) (1.19) (1.15) (1.48) (1.47) (1.45)
First Lien Closed-End mortgages 1.07*** 1.04*** 1.05*** 1.58*** 1.52*** 1.26***
(0.33) (0.28) (0.27) (0.40) (0.39) (0.45)
Other RRE loans -0.22 - - -0.55 - -
(0.60) (0.45)
Consumer loans 1.05*** 1.09*** 1.15*** 1.19*** 1.28*** 1.01***
(0.20) (0.05) (0.20) (0.17) (0.13) (0.22)
Other loans 1.22** 1.27*** 1.31*** 0.74** 0.99*** 0.92***
(0.47) (0.24) (0.29) (0.35) (0.21) (0.21)
Trading assets 2.13*** 2.14*** 2.15*** 2.70*** 2.75*** 2.71***
(0.15) (0.13) (0.13) (0.22) (0.20) (0.21)
Operational risk 0.07 - - 0.79 - -
(1.08) (1.25)
Securities 0.84*** 0.87*** 0.87*** 0.73*** 0.73*** 0.78***
(0.16) (0.10) (0.10) (0.11) (0.11) (0.11)
Equity Distributions 1.36 - - 7.72 8.80** 2.56
(4.65) (4.85) (4.00) (6.11)
Off Balance Sheet Exposures - - -0.02 - - 0.19
(0.08) (0.13)
R2 adjusted 98.0 98.0 98.0 98.0 98.0 98.0
Observations 90 90 90 94 94 94
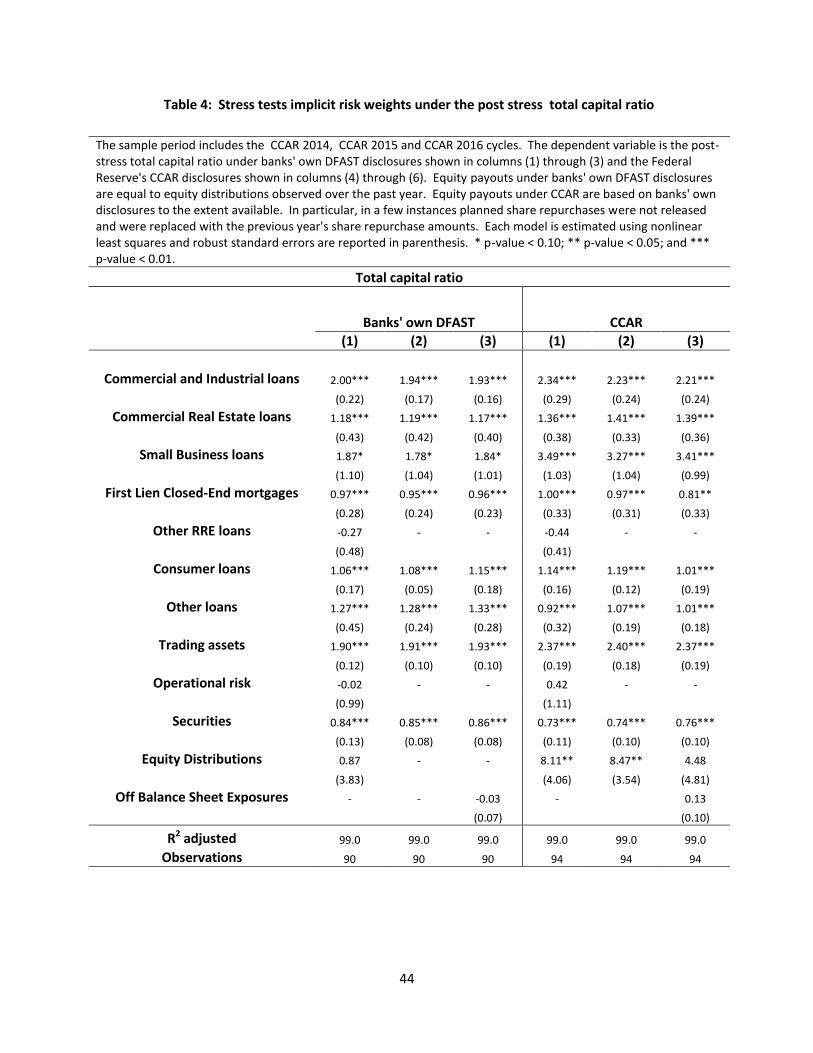
44
Table 4: Stress tests implicit risk weights under the post stress total capital ratio
The sample period includes the CCAR 2014, CCAR 2015 and CCAR 2016 cycles. The dependent variable is the post-stress total capital ratio under banks' own DFAST disclosures shown in columns (1) through (3) and the Federal Reserve's CCAR disclosures shown in columns (4) through (6). Equity payouts under banks' own DFAST disclosures are equal to equity distributions observed over the past year. Equity payouts under CCAR are based on banks' own disclosures to the extent available. In particular, in a few instances planned share repurchases were not released and were replaced with the previous year's share repurchase amounts. Each model is estimated using nonlinear least squares and robust standard errors are reported in parenthesis. * p-value < 0.10; ** p-value < 0.05; and *** p-value < 0.01.
Total capital ratio
Banks' own DFAST CCAR
(1) (2) (3) (1) (2) (3)
Commercial and Industrial loans 2.00*** 1.94*** 1.93*** 2.34*** 2.23*** 2.21***
(0.22) (0.17) (0.16) (0.29) (0.24) (0.24)
Commercial Real Estate loans 1.18*** 1.19*** 1.17*** 1.36*** 1.41*** 1.39***
(0.43) (0.42) (0.40) (0.38) (0.33) (0.36)
Small Business loans 1.87* 1.78* 1.84* 3.49*** 3.27*** 3.41***
(1.10) (1.04) (1.01) (1.03) (1.04) (0.99)
First Lien Closed-End mortgages 0.97*** 0.95*** 0.96*** 1.00*** 0.97*** 0.81**
(0.28) (0.24) (0.23) (0.33) (0.31) (0.33)
Other RRE loans -0.27 - - -0.44 - -
(0.48) (0.41)
Consumer loans 1.06*** 1.08*** 1.15*** 1.14*** 1.19*** 1.01***
(0.17) (0.05) (0.18) (0.16) (0.12) (0.19)
Other loans 1.27*** 1.28*** 1.33*** 0.92*** 1.07*** 1.01***
(0.45) (0.24) (0.28) (0.32) (0.19) (0.18)
Trading assets 1.90*** 1.91*** 1.93*** 2.37*** 2.40*** 2.37***
(0.12) (0.10) (0.10) (0.19) (0.18) (0.19)
Operational risk -0.02 - - 0.42 - -
(0.99) (1.11)
Securities 0.84*** 0.85*** 0.86*** 0.73*** 0.74*** 0.76***
(0.13) (0.08) (0.08) (0.11) (0.10) (0.10)
Equity Distributions 0.87 - - 8.11** 8.47** 4.48
(3.83) (4.06) (3.54) (4.81)
Off Balance Sheet Exposures - - -0.03 - 0.13
(0.07) (0.10)
R2 adjusted 99.0 99.0 99.0 99.0 99.0 99.0
Observations 90 90 90 94 94 94
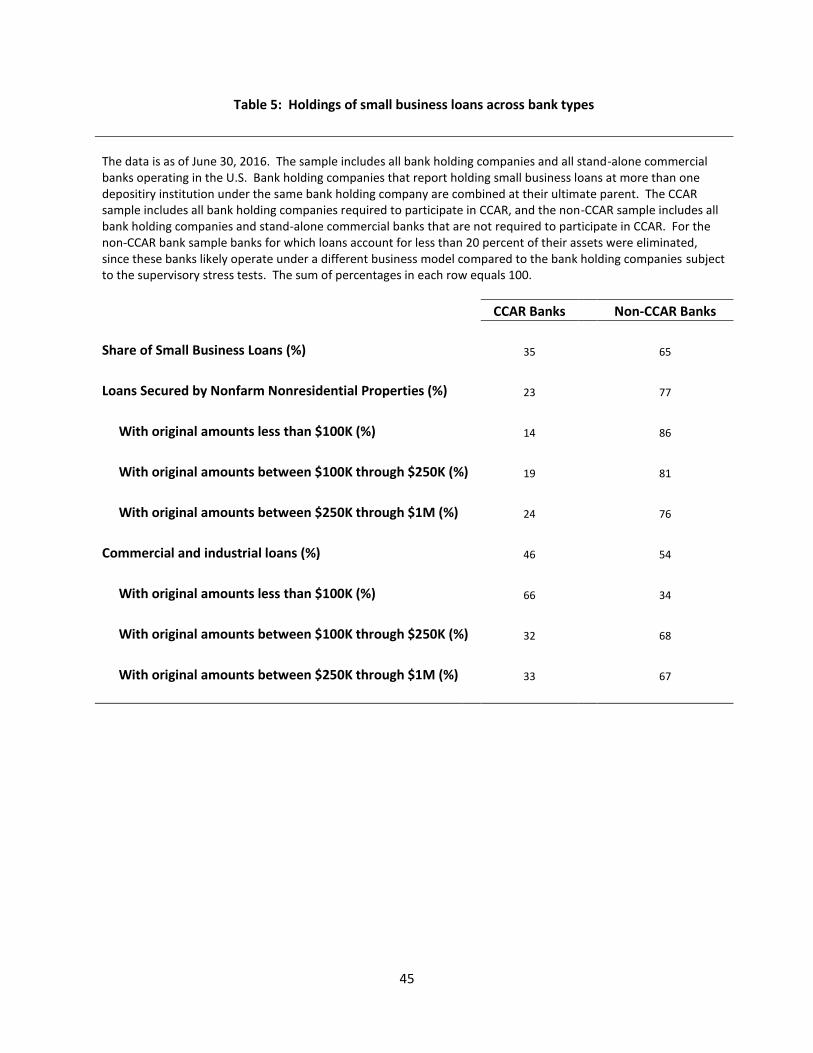
45
Table 5: Holdings of small business loans across bank types
The data is as of June 30, 2016. The sample includes all bank holding companies and all stand-alone commercial banks operating in the U.S. Bank holding companies that report holding small business loans at more than one depositiry institution under the same bank holding company are combined at their ultimate parent. The CCAR sample includes all bank holding companies required to participate in CCAR, and the non-CCAR sample includes all bank holding companies and stand-alone commercial banks that are not required to participate in CCAR. For the non-CCAR bank sample banks for which loans account for less than 20 percent of their assets were eliminated, since these banks likely operate under a different business model compared to the bank holding companies subject to the supervisory stress tests. The sum of percentages in each row equals 100.
CCAR Banks Non-CCAR Banks
Share of Small Business Loans (%) 35 65
Loans Secured by Nonfarm Nonresidential Properties (%) 23 77
With original amounts less than $100K (%) 14 86
With original amounts between $100K through $250K (%) 19 81
With original amounts between $250K through $1M (%) 24 76
Commercial and industrial loans (%) 46 54
With original amounts less than $100K (%) 66 34
With original amounts between $100K through $250K (%) 32 68
With original amounts between $250K through $1M (%) 33 67
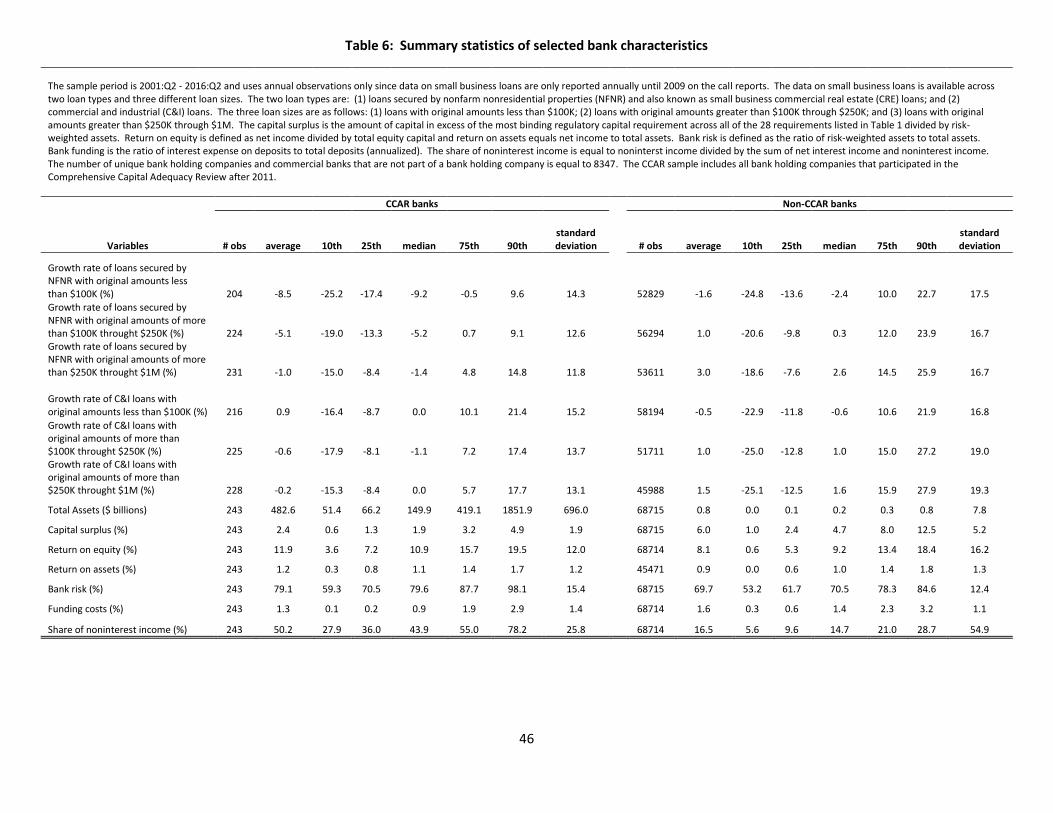
46
Table 6: Summary statistics of selected bank characteristics
The sample period is 2001:Q2 - 2016:Q2 and uses annual observations only since data on small business loans are only reported annually until 2009 on the call reports. The data on small business loans is available across two loan types and three different loan sizes. The two loan types are: (1) loans secured by nonfarm nonresidential properties (NFNR) and also known as small business commercial real estate (CRE) loans; and (2) commercial and industrial (C&I) loans. The three loan sizes are as follows: (1) loans with original amounts less than $100K; (2) loans with original amounts greater than $100K through $250K; and (3) loans with original amounts greater than $250K through $1M. The capital surplus is the amount of capital in excess of the most binding regulatory capital requirement across all of the 28 requirements listed in Table 1 divided by risk-weighted assets. Return on equity is defined as net income divided by total equity capital and return on assets equals net income to total assets. Bank risk is defined as the ratio of risk-weighted assets to total assets. Bank funding is the ratio of interest expense on deposits to total deposits (annualized). The share of noninterest income is equal to noninterst income divided by the sum of net interest income and noninterest income. The number of unique bank holding companies and commercial banks that are not part of a bank holding company is equal to 8347. The CCAR sample includes all bank holding companies that participated in the Comprehensive Capital Adequacy Review after 2011.
CCAR banks Non-CCAR banks
Variables # obs average 10th 25th median 75th 90th standard deviation # obs average 10th 25th median 75th 90th
standard deviation
Growth rate of loans secured by NFNR with original amounts less than $100K (%) 204 -8.5 -25.2 -17.4 -9.2 -0.5 9.6 14.3 52829 -1.6 -24.8 -13.6 -2.4 10.0 22.7 17.5
Growth rate of loans secured by NFNR with original amounts of more than $100K throught $250K (%) 224 -5.1 -19.0 -13.3 -5.2 0.7 9.1 12.6 56294 1.0 -20.6 -9.8 0.3 12.0 23.9 16.7 Growth rate of loans secured by NFNR with original amounts of more than $250K throught $1M (%) 231 -1.0 -15.0 -8.4 -1.4 4.8 14.8 11.8 53611 3.0 -18.6 -7.6 2.6 14.5 25.9 16.7
Growth rate of C&I loans with original amounts less than $100K (%) 216 0.9 -16.4 -8.7 0.0 10.1 21.4 15.2 58194 -0.5 -22.9 -11.8 -0.6 10.6 21.9 16.8
Growth rate of C&I loans with original amounts of more than $100K throught $250K (%) 225 -0.6 -17.9 -8.1 -1.1 7.2 17.4 13.7 51711 1.0 -25.0 -12.8 1.0 15.0 27.2 19.0 Growth rate of C&I loans with original amounts of more than $250K throught $1M (%) 228 -0.2 -15.3 -8.4 0.0 5.7 17.7 13.1 45988 1.5 -25.1 -12.5 1.6 15.9 27.9 19.3
Total Assets ($ billions) 243 482.6 51.4 66.2 149.9 419.1 1851.9 696.0 68715 0.8 0.0 0.1 0.2 0.3 0.8 7.8
Capital surplus (%) 243 2.4 0.6 1.3 1.9 3.2 4.9 1.9 68715 6.0 1.0 2.4 4.7 8.0 12.5 5.2
Return on equity (%) 243 11.9 3.6 7.2 10.9 15.7 19.5 12.0 68714 8.1 0.6 5.3 9.2 13.4 18.4 16.2
Return on assets (%) 243 1.2 0.3 0.8 1.1 1.4 1.7 1.2 45471 0.9 0.0 0.6 1.0 1.4 1.8 1.3
Bank risk (%) 243 79.1 59.3 70.5 79.6 87.7 98.1 15.4 68715 69.7 53.2 61.7 70.5 78.3 84.6 12.4
Funding costs (%) 243 1.3 0.1 0.2 0.9 1.9 2.9 1.4 68714 1.6 0.3 0.6 1.4 2.3 3.2 1.1
Share of noninterest income (%) 243 50.2 27.9 36.0 43.9 55.0 78.2 25.8 68714 16.5 5.6 9.6 14.7 21.0 28.7 54.9
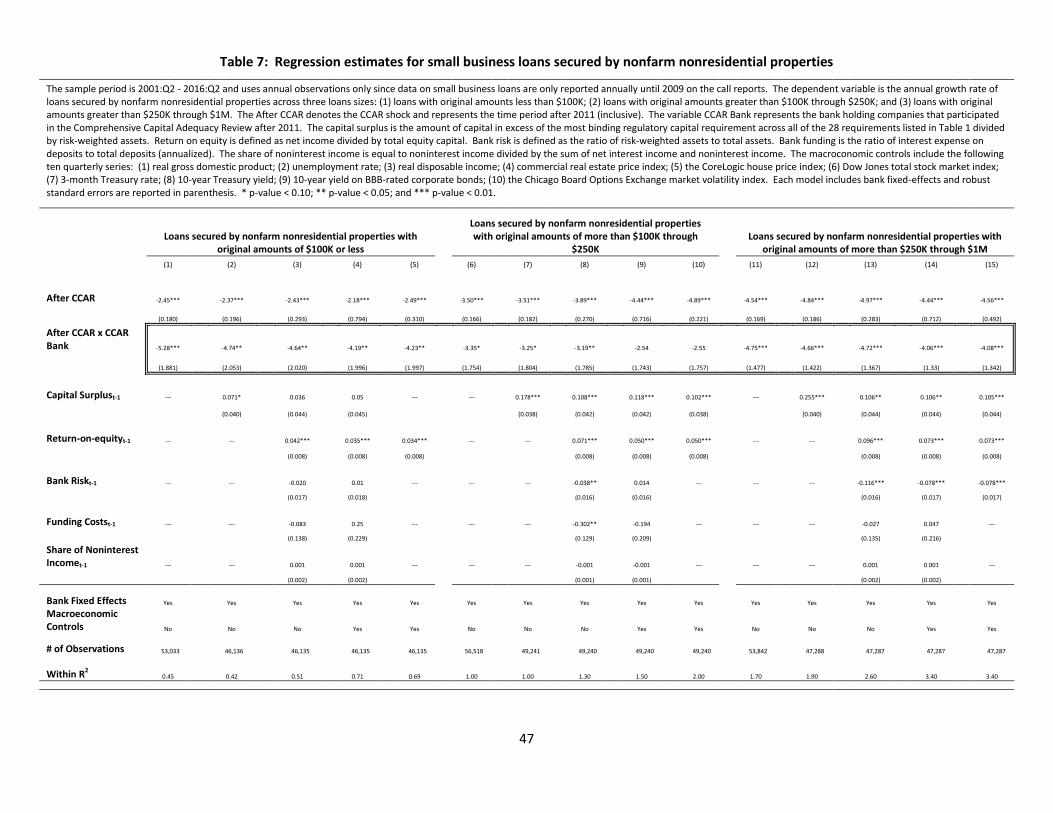
47
Table 7: Regression estimates for small business loans secured by nonfarm nonresidential properties
The sample period is 2001:Q2 - 2016:Q2 and uses annual observations only since data on small business loans are only reported annually until 2009 on the call reports. The dependent variable is the annual growth rate of loans secured by nonfarm nonresidential properties across three loans sizes: (1) loans with original amounts less than $100K; (2) loans with original amounts greater than $100K through $250K; and (3) loans with original amounts greater than $250K through $1M. The After CCAR denotes the CCAR shock and represents the time period after 2011 (inclusive). The variable CCAR Bank represents the bank holding companies that participated in the Comprehensive Capital Adequacy Review after 2011. The capital surplus is the amount of capital in excess of the most binding regulatory capital requirement across all of the 28 requirements listed in Table 1 divided by risk-weighted assets. Return on equity is defined as net income divided by total equity capital. Bank risk is defined as the ratio of risk-weighted assets to total assets. Bank funding is the ratio of interest expense on deposits to total deposits (annualized). The share of noninterest income is equal to noninterest income divided by the sum of net interest income and noninterest income. The macroconomic controls include the following ten quarterly series: (1) real gross domestic product; (2) unemployment rate; (3) real disposable income; (4) commercial real estate price index; (5) the CoreLogic house price index; (6) Dow Jones total stock market index; (7) 3-month Treasury rate; (8) 10-year Treasury yield; (9) 10-year yield on BBB-rated corporate bonds; (10) the Chicago Board Options Exchange market volatility index. Each model includes bank fixed-effects and robust standard errors are reported in parenthesis. * p-value < 0.10; ** p-value < 0.05; and *** p-value < 0.01.
Loans secured by nonfarm nonresidential properties with
original amounts of $100K or less
Loans secured by nonfarm nonresidential properties with original amounts of more than $100K through
$250K Loans secured by nonfarm nonresidential properties with
original amounts of more than $250K through $1M
(1) (2) (3) (4) (5) (6) (7) (8) (9) (10) (11) (12) (13) (14) (15)
After CCAR -2.45*** -2.37*** -2.43*** -2.18*** -2.49*** -3.50*** -3.51*** -3.89*** -4.44*** -4.89*** -4.54*** -4.84*** -4.97*** -4.44*** -4.56***
(0.180) (0.196) (0.293) (0.794) (0.310) (0.166) (0.182) (0.270) (0.716) (0.221) (0.169) (0.186) (0.283) (0.712) (0.492)
After CCAR x CCAR Bank -5.28*** -4.74** -4.64** -4.19** -4.23** -3.35* -3.25* -3.19** -2.54 -2.55 -4.75*** -4.66*** -4.72*** -4.06*** -4.08***
(1.881) (2.053) (2.020) (1.996) (1.997) (1.754) (1.804) (1.785) (1.743) (1.757) (1.477) (1.422) (1.367) (1.33) (1.342)
Capital Surplust-1 --- 0.071* 0.036 0.05 --- --- 0.178*** 0.108*** 0.118*** 0.102*** --- 0.255*** 0.106** 0.106** 0.105***
(0.040) (0.044) (0.045) (0.038) (0.042) (0.042) (0.038) (0.040) (0.044) (0.044) (0.044)
Return-on-equityt-1 --- --- 0.042*** 0.035*** 0.034*** --- --- 0.071*** 0.050*** 0.050*** --- --- 0.096*** 0.073*** 0.073***
(0.008) (0.008) (0.008) (0.008) (0.008) (0.008) (0.008) (0.008) (0.008)
Bank Riskt-1 --- --- -0.020 0.01 --- --- --- -0.038** 0.014 --- --- --- -0.116*** -0.078*** -0.078***
(0.017) (0.018) (0.016) (0.016) (0.016) (0.017) (0.017)
Funding Costst-1 --- --- -0.083 0.25 --- --- --- -0.302** -0.194 --- --- --- -0.027 0.047 ---
(0.138) (0.229) (0.129) (0.209) (0.135) (0.216)
Share of Noninterest Incomet-1 --- --- 0.001 0.001 --- --- --- -0.001 -0.001 --- --- --- 0.001 0.001 ---
(0.002) (0.002) (0.001) (0.001) (0.002) (0.002)
Bank Fixed Effects Yes Yes Yes Yes Yes Yes Yes Yes Yes Yes Yes Yes Yes Yes Yes
Macroeconomic Controls No No No Yes Yes No No No Yes Yes No No No Yes Yes
# of Observations 53,033 46,136 46,135 46,135 46,135 56,518 49,241 49,240 49,240 49,240 53,842 47,288 47,287 47,287 47,287
Within R2 0.45 0.42 0.51 0.71 0.69 1.00 1.00 1.30 1.50 2.00 1.70 1.90 2.60 3.40 3.40
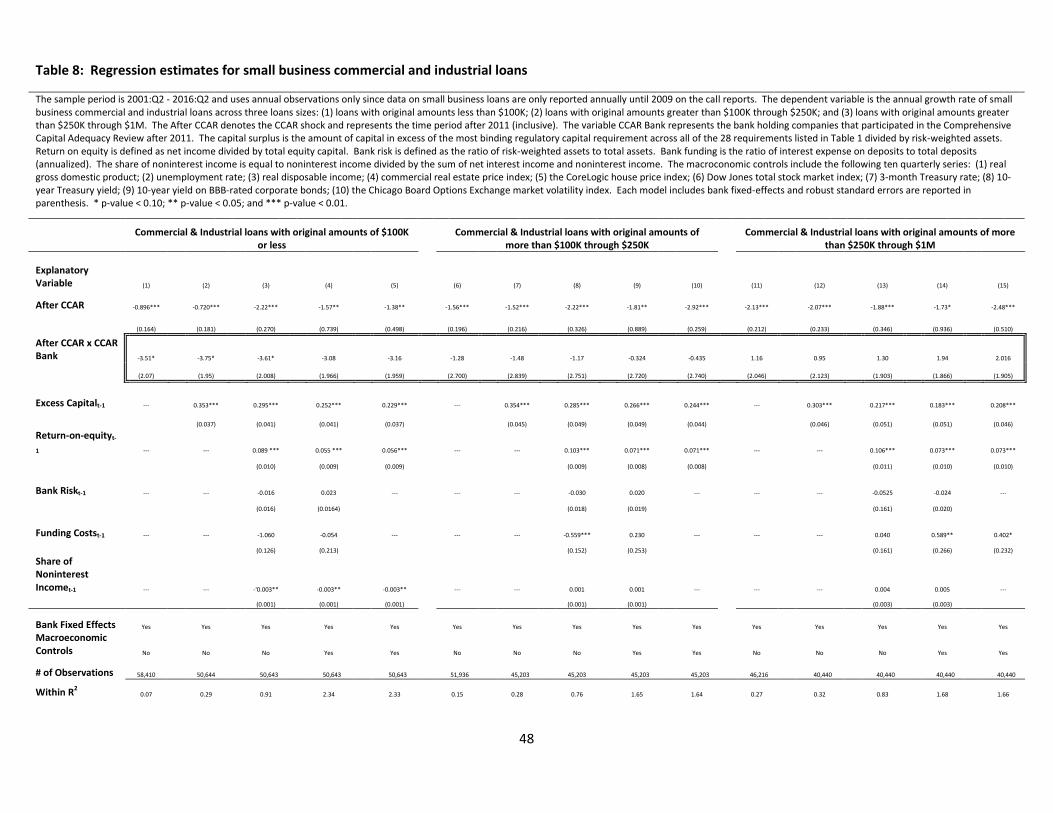
48
Table 8: Regression estimates for small business commercial and industrial loans
The sample period is 2001:Q2 - 2016:Q2 and uses annual observations only since data on small business loans are only reported annually until 2009 on the call reports. The dependent variable is the annual growth rate of small business commercial and industrial loans across three loans sizes: (1) loans with original amounts less than $100K; (2) loans with original amounts greater than $100K through $250K; and (3) loans with original amounts greater than $250K through $1M. The After CCAR denotes the CCAR shock and represents the time period after 2011 (inclusive). The variable CCAR Bank represents the bank holding companies that participated in the Comprehensive Capital Adequacy Review after 2011. The capital surplus is the amount of capital in excess of the most binding regulatory capital requirement across all of the 28 requirements listed in Table 1 divided by risk-weighted assets. Return on equity is defined as net income divided by total equity capital. Bank risk is defined as the ratio of risk-weighted assets to total assets. Bank funding is the ratio of interest expense on deposits to total deposits (annualized). The share of noninterest income is equal to noninterest income divided by the sum of net interest income and noninterest income. The macroconomic controls include the following ten quarterly series: (1) real gross domestic product; (2) unemployment rate; (3) real disposable income; (4) commercial real estate price index; (5) the CoreLogic house price index; (6) Dow Jones total stock market index; (7) 3-month Treasury rate; (8) 10-year Treasury yield; (9) 10-year yield on BBB-rated corporate bonds; (10) the Chicago Board Options Exchange market volatility index. Each model includes bank fixed-effects and robust standard errors are reported in parenthesis. * p-value < 0.10; ** p-value < 0.05; and *** p-value < 0.01.
Commercial & Industrial loans with original amounts of $100K
or less Commercial & Industrial loans with original amounts of
more than $100K through $250K Commercial & Industrial loans with original amounts of more
than $250K through $1M
Explanatory Variable (1) (2) (3) (4) (5) (6) (7) (8) (9) (10) (11) (12) (13) (14) (15)
After CCAR -0.896*** -0.720*** -2.22*** -1.57** -1.38** -1.56*** -1.52*** -2.22*** -1.81** -2.92*** -2.13*** -2.07*** -1.88*** -1.73* -2.48***
(0.164) (0.181) (0.270) (0.739) (0.498) (0.196) (0.216) (0.326) (0.889) (0.259) (0.212) (0.233) (0.346) (0.936) (0.510)
After CCAR x CCAR Bank -3.51* -3.75* -3.61* -3.08 -3.16 -1.28 -1.48 -1.17 -0.324 -0.435 1.16 0.95 1.30 1.94 2.016
(2.07) (1.95) (2.008) (1.966) (1.959) (2.700) (2.839) (2.751) (2.720) (2.740) (2.046) (2.123) (1.903) (1.866) (1.905)
Excess Capitalt-1 --- 0.353*** 0.295*** 0.252*** 0.229*** --- 0.354*** 0.285*** 0.266*** 0.244*** --- 0.303*** 0.217*** 0.183*** 0.208***
(0.037) (0.041) (0.041) (0.037) (0.045) (0.049) (0.049) (0.044) (0.046) (0.051) (0.051) (0.046)
Return-on-equityt-
1 --- --- 0.089 *** 0.055 *** 0.056*** --- --- 0.103*** 0.071*** 0.071*** --- --- 0.106*** 0.073*** 0.073***
(0.010) (0.009) (0.009) (0.009) (0.008) (0.008) (0.011) (0.010) (0.010)
Bank Riskt-1 --- --- -0.016 0.023 --- --- --- -0.030 0.020 --- --- --- -0.0525 -0.024 ---
(0.016) (0.0164) (0.018) (0.019) (0.161) (0.020)
Funding Costst-1 --- --- -1.060 -0.054 --- --- --- -0.559*** 0.230 --- --- --- 0.040 0.589** 0.402*
(0.126) (0.213) (0.152) (0.253) (0.161) (0.266) (0.232)
Share of Noninterest Incomet-1 --- --- -'0.003** -0.003** -0.003** --- --- 0.001 0.001 --- --- --- 0.004 0.005 ---
(0.001) (0.001) (0.001) (0.001) (0.001) (0.003) (0.003)
Bank Fixed Effects Yes Yes Yes Yes Yes Yes Yes Yes Yes Yes Yes Yes Yes Yes Yes
Macroeconomic Controls No No No Yes Yes No No No Yes Yes No No No Yes Yes
# of Observations
58,410
50,644 50,643 50,643 50,643 51,936 45,203
45,203 45,203 45,203 46,216 40,440 40,440 40,440 40,440
Within R2 0.07 0.29 0.91 2.34 2.33 0.15 0.28 0.76 1.65 1.64 0.27 0.32 0.83 1.68 1.66
Related Documents