Table of Contents UNITED STATES SECURITIES AND EXCHANGE COMMISSION Washington, D.C. 20549 FORM 10-Q ☒ QUARTERLY REPORT PURSUANT TO SECTION 13 OR 15(d) OF THE SECURITIES EXCHANGE ACT OF 1934 For the quarterly period ended March 31, 2010 OR ☐ TRANSITION REPORT PURSUANT TO SECTION 13 OR 15(d) OF THE SECURITIES EXCHANGE ACT OF 1934 For the transition period from to Commission File No. 1-13300 CAPITAL ONE FINANCIAL CORPORATION (Exact name of registrant as specified in its charter) Delaware 54-1719854 (State or Other Jurisdiction of Incorporation or Organization) (I.R.S. Employer Identification No.) 1680 Capital One Drive McLean, Virginia 22102 (Address of Principal Executive Offices) (Zip Code) Registrant’s telephone number, including area code: (703) 720-1000 (Not applicable) (Former name, former address and former fiscal year, if changed since last report) Indicate by check mark whether the registrant (1) has filed all reports required to be filed by Section 13 or 15(d) of the Securities Exchange Act of 1934 during the preceding 12 months (or for such shorter period that the registrant was required to file such reports), and (2) has been subject to such filing requirements for the past 90 days. Yes ☒ No ☐ Indicate by check mark whether the registrant has submitted electronically and posted on its corporate Web site, if any, every Interactive Data File required to be submitted and posted pursuant to Rule 405 of Regulation S-T (§232.405 of this chapter) during the preceding 12 months (or for such shorter period that the registrant was required to submit and post such files). Yes ☒ No ☐ Indicate by check mark whether the registrant is a large accelerated filer, an accelerated filer, a non-accelerated filer, or a smaller reporting company. See the definitions of “large accelerated filer,” “accelerated filer” and “smaller reporting company” in Rule 12b-2 of the Exchange Act. Large accelerated filer ☒ Accelerated filer ☐ Non-accelerated filer ☐ Smaller reporting company ☐ Indicate by check mark whether the registrant is a Shell Company (as defined in Rule 12b-2 of the Exchange Act) Yes ☐ No ☒ As of April 30, 2010, there were 456,534,936 shares of the registrant’s Common Stock, par value $.01 per share, outstanding.

Welcome message from author
This document is posted to help you gain knowledge. Please leave a comment to let me know what you think about it! Share it to your friends and learn new things together.
Transcript
Table of Contents
UNITED STATES
SECURITIES AND EXCHANGE COMMISSIONWashington, D.C. 20549
FORM 10-Q
☒ QUARTERLY REPORT PURSUANT TO SECTION 13 OR 15(d) OF THE SECURITIES EXCHANGE ACT OF
1934
For the quarterly period ended March 31, 2010
OR ☐ TRANSITION REPORT PURSUANT TO SECTION 13 OR 15(d) OF THE SECURITIES EXCHANGE ACT OF
1934
For the transition period from to
Commission File No. 1-13300
CAPITAL ONE FINANCIAL CORPORATION(Exact name of registrant as specified in its charter)
Delaware 54-1719854
(State or Other Jurisdiction ofIncorporation or Organization)
(I.R.S. EmployerIdentification No.)
1680 Capital One Drive McLean, Virginia 22102(Address of Principal Executive Offices) (Zip Code)
Registrant’s telephone number, including area code:(703) 720-1000
(Not applicable)(Former name, former address and former fiscal year, if changed since last report)
Indicate by check mark whether the registrant (1) has filed all reports required to be filed by Section 13 or 15(d) of the Securities Exchange Act of 1934 duringthe preceding 12 months (or for such shorter period that the registrant was required to file such reports), and (2) has been subject to such filing requirements forthe past 90 days. Yes ☒ No ☐
Indicate by check mark whether the registrant has submitted electronically and posted on its corporate Web site, if any, every Interactive Data File required to besubmitted and posted pursuant to Rule 405 of Regulation S-T (§232.405 of this chapter) during the preceding 12 months (or for such shorter period that theregistrant was required to submit and post such files). Yes ☒ No ☐
Indicate by check mark whether the registrant is a large accelerated filer, an accelerated filer, a non-accelerated filer, or a smaller reporting company. See thedefinitions of “large accelerated filer,” “accelerated filer” and “smaller reporting company” in Rule 12b-2 of the Exchange Act. Large accelerated filer ☒ Accelerated filer ☐
Non-accelerated filer ☐ Smaller reporting company ☐
Indicate by check mark whether the registrant is a Shell Company (as defined in Rule 12b-2 of the Exchange Act) Yes ☐ No ☒
As of April 30, 2010, there were 456,534,936 shares of the registrant’s Common Stock, par value $.01 per share, outstanding.

Table of Contents
TABLE OF CONTENTS PART I—FINANCIAL INFORMATION 1
Item 1. Financial Statements 54 Consolidated Balance Sheets 54 Consolidated Statements of Income 55 Consolidated Statements of Changes in Stockholders’ Equity 56 Consolidated Statements of Cash Flows 57 Notes to Consolidated Financial Statements 58 Note 1 — Summary of Significant Accounting Policies 58 Note 2 — Loans Acquired in a Transfer 61 Note 3 — Discontinued Operations 62 Note 4 — Business Segments 63 Note 5 — Securities Available for Sale 65 Note 6 — Loans Held for Investment, Allowance for Loan and Lease Losses and Unfunded Lending Commitments 72 Note 7 — Fair Value of Financial Instruments 73 Note 8 — Goodwill and Other Intangible Assets 80 Note 9 — Deposits and Borrowings 82 Note 10 — Shareholders’ Equity, Other Comprehensive Income and Earnings Per Common Share 84 Note 11 — Mortgage Servicing Rights 85 Note 12 — Derivative Instruments and Heding Activities 86 Note 13 — Securitizations 92 Note 14 — Commitments, Contingencies and Guarantees 102 Note 15 — Other Variable Interest Entities 105 Note 16 — Subsequent Events 106
Item 2. Management’s Discussion and Analysis of Financial Condition and Results of Operations 1 I. Introduction 1 II. Impact from Adoption of New Consolidation Accounting Standards 2 III. Executive Summary and Business Outlook 3 IV. Critical Accounting Policies and Estimates 8 V. Recent Accounting Pronouncements 9 VI. Off-Balance Sheet Arrangements and Variable Interest Entities 9 VII. Consolidated Financial Performance 10 VIII. Consolidated Balance Sheet Analysis and Credit Performance 15 IX. Business Segment Financial Performance 24 X. Liquidity and Funding 31 XI. Market Risk Management 36 XII. Capital 38 XIV. Supervision and Regulation 39 XV. Enterprise Risk Management 43 XVI. Forward-Looking Statements 44 XVII. Supplemental Statistical Tables 46
Item 3. Quantitative and Qualitative Disclosures about Market Risk 107Item 4. Controls and Procedures 107
PART II—Other Information 107Item 1. Legal Proceedings 107Item 1A. Risk Factors 107Item 2. Unregistered Sales of Equity Securities and Use of Proceeds 107Item 3. Defaults upon Senior Securities 108Item 4. (Removed and Reserved) 108Item 5. Other Information 108Item 6. Exhibits 108
SIGNATURES 109INDEX TO EXHIBITS E-1
i
Table of Contents
INDEX OF MD&A AND SUPPLEMENTAL TABLES
Table Description Page— MD&A Tables: 1 Consolidated Corporate Financial Summary and Selected Metrics 102 Net Interest Income 123 Non-Interest Income 134 Non-Interest Expense 145 Securities Available for Sale 156 Loan Portfolio Composition 167 30+ Day Performing Delinquencies 178 Nonperforming Loans 189 Net Charge-Offs 1910 Loan Modifications and Restructurings 2011 Summary of Allowance for Loan and Lease Losses 2112 Allocation of the Allowance for Loan and Lease Losses 2213 Credit Card Business 2514 Commercial Banking Business 2815 Consumer Banking Business 2916 Liquidity Reserves 3217 Deposits 3318 Deposit Composition and Average Deposit Rates 3419 Borrowing Capacity 3520 Senior Unsecured Debt Credit Ratings 3621 Interest Rate Sensitivity Analysis 3722 Capital Ratios 38
— Supplemental Statistical Tables: A Statements of Average Balances, Income and Expense, Yields and Rates 46B Interest Variance Analysis 48C Managed Loan Portfolio 49D Composition of Reported Loan Portfolio 51E Delinquencies 51F Net Charge-Offs 52G Nonperforming Assets 52
ii
Table of Contents
PART I—FINANCIAL INFORMATION
Item 2. Management’s Discussion and Analysis of Financial Condition and Results of Operations
You should read this Management’s Discussion and Analysis of Financial Condition and Results of Operations (“MD&A”) in conjunction with our unauditedcondensed consolidated financial statements and related notes, and the more detailed information contained in our 2009 Annual Report on Form 10-K (“2009Form 10-K”). This discussion contains forward-looking statements that are based upon management’s current expectations and are subject to significantuncertainties and changes in circumstances. Our actual results may differ materially from those included in these forward-looking statements due to a variety offactors including, but not limited to, those described in this report in “Part II —Item 1A. Risk Factors” and in our 2009 Form 10-K in “Part I—Item 1A. RiskFactors.” I. INTRODUCTION Capital One Financial Corporation (the “Corporation”) is a diversified financial services company with banking and non-banking subsidiaries that market avariety of financial products and services. We continue to deliver on our strategy of combining the power of national scale lending and local scale banking. Ourprincipal subsidiaries include:
• Capital One Bank (USA), National Association (“COBNA”) which currently offers credit and debit card products, other lending products and depositproducts.
• Capital One, National Association (“CONA”) which offers a broad spectrum of banking products and financial services to consumers, small businesses andcommercial clients. On July 30, 2009, we merged Chevy Chase Bank, F.S.B. (“Chevy Chase Bank”) into CONA.
Our revenues are primarily driven by lending to consumers and commercial customers and by deposit-taking activities which generate net interest income, and byactivities that generate non-interest income, including the sale and servicing of loans and providing fee-based services to customers. Customer usage and paymentpatterns, credit quality, levels of marketing expense and operating efficiency all affect our profitability. Our expenses primarily consist of the cost of funding ourassets, our provision for loan and lease losses, operating expenses (including associate salaries and benefits, infrastructure maintenance and enhancements, andbranch operations and expansion costs), marketing expenses, and income taxes. We had $130.1 billion in total loans outstanding and $117.8 billion in deposits asof March 31, 2010, compared with $136.8 billion in total managed loans outstanding and $115.8 billion in deposits as of December 31, 2009.
We evaluate our financial performance and report our results through three operating segments: Credit Card, Commercial Banking and Consumer Banking.
• Credit Card: Consists of our domestic consumer and small business card lending, domestic national small business lending, national closed end installmentlending and the international card lending businesses in Canada and the United Kingdom.
• Commercial Banking: Consists of our lending, deposit gathering and treasury management services to commercial real estate and middle market customers.Our Commercial Banking business results also include the results of a national portfolio of small ticket commercial real-estate loans that are in run-offmode.
• Consumer Banking: Consists of our branch-based lending and deposit gathering activities for small business customers, as well as branch-based consumerdeposit gathering and lending activities, national deposit gathering, national automobile lending, consumer mortgage lending and servicing activities.
1
Table of Contents
II. IMPACT FROM ADOPTION OF NEW CONSOLIDATION ACCOUNTING STANDARDS Impact on Reported Financial Information
Effective January 1, 2010, we prospectively adopted two new accounting standards that have a significant impact on our accounting for entities previouslyconsidered to be off-balance sheet arrangements. The adoption of these new accounting standards resulted in the consolidation of our credit card securitizationtrusts, one of our installment loan trusts and certain option-ARM mortgage loan trusts originated by Chevy Chase Bank. Prior to January 1, 2010, transfers of ourcredit card receivables, installment loans and certain option-adjustable rate mortgage loans to our securitization trusts were accounted for as sales and treated asoff-balance sheet. At adoption of these new accounting standards on January 1, 2010, we added to our reported consolidated balance sheet approximately $41.9billion of assets, consisting primarily of credit card loan receivables underlying the consolidated securitization trusts, along with approximately $44.3 billion ofrelated debt issued by these trusts to third-party investors. We also recorded an after-tax charge to retained earnings on January 1, 2010 of $2.9 billion, reflectingthe net cumulative effect of adopting these new accounting standards. This charge primarily related to the addition of $4.3 billion to our allowance for loan andlease losses for the newly consolidated loans and the recording of $1.6 billion in related deferred tax assets. The initial recording of these amounts on our reportedbalance sheet as of January 1, 2010 had no impact on our reported results of operations. We provide additional information on the impact on our financialstatements from the adoption of these new accounting standards in “Note 1—Summary of Significant Accounting Policies” and “Note 13—Securitizations.” Wediscuss the impact on our capital ratios below in “Capital.”
Although the adoption of these new accounting standards does not change the economic risk to our business, specifically Capital One’s exposure to liquidity,credit, and interest rate risks, the prospective adoption of these rules has a significant impact on our capital ratios and the presentation of our reportedconsolidated financial statements, including changes in the classification of specific income statement line items. The most significant changes to our reportedconsolidated financial statements are outlined below: Financial Statement Accounting and Presentation ChangesBalance Sheet
• Significant increase in restricted cash, securitized loans and securitized debt resulting from the consolidation ofsecuritization trusts.
• Significant increase in the allowance for loan and lease losses resulting from the establishment of a loan loss reservefor the loans underlying the consolidated securitization trusts.
• Significant reduction in accounts receivable from securitizations resulting from the reversal of retained interests heldin securitization trusts that have been consolidated.
Statement of Income
• Significant increase in interest income and interest expense attributable to the securitized loans and debt underlyingthe consolidated securitization trusts.
• Provision for loan and lease losses reflects the impact of the establishment of an allowance for loan and lease lossesfor the loans underlying the consolidated securitization trusts.
• Amounts previously recorded as servicing and securitization income are now classified in our results of operations inthe same manner as the earnings on loans not held in securitization trusts.
Statement of Cash Flows • Significant change in the amounts of cash flows from investing and financing activities.
Beginning with the first quarter of 2010, our reported consolidated income statements no longer reflect securitization and servicing income related to newlyconsolidated loans. Instead, we report interest income, net charge-offs and certain other income associated with securitized loan receivables and interest expenseassociated with the debt securities issued from the trust to third party investors in the same income statement categories as loan receivables and corporate debt.Additionally, we no longer record initial gains on new securitization activity since the majority of our securitized loans will no longer receive sale accountingtreatment. Because our securitization transactions are being accounted for under the new consolidation accounting rules as secured borrowings rather than assetsales, the cash flows from these transactions
2
Table of Contents
are presented as cash flows from financing activities rather than as cash flows from operating or investing activities. Notwithstanding this change in accounting,our securitization transactions are structured to legally isolate the receivables from Capital One, and we do not expect to be able to access the assets of oursecuritization trusts. We do, however, continue to have the rights associated with our retained interests in the assets of these trusts.
Because we prospectively adopted the new consolidation accounting standards, our historical reported results and consolidated financial statements for periodsprior to January 1, 2010 reflect our securitization trusts as off-balance sheet in accordance with the applicable accounting guidance in effect during this period.Accordingly, our reported results and consolidated financial statements subsequent to January 1, 2010 are not presented on a basis consistent with our reportedresults and consolidated financial statements for periods prior to January 1, 2010. This inconsistency limits the comparability of our post-January 1, 2010 reportedresults to our prior period results.
Impact on Non-GAAP Managed Financial Information
In addition to analyzing our results on a reported basis, management historically evaluated our total company and business segment results on a non-GAAP“managed” basis. Our managed presentations reflected the results from both our on-balance sheet loans and off-balance-sheet loans, and excluded the impact ofcard securitization activity. Our managed presentations assumed that our securitized loans had not been sold and that the earnings from securitized loans wereclassified in our results of operations in the same manner as the earnings on loans that we owned. Our managed results also reflected differences in accounting forthe valuation of retained interests and the recognition of gains and losses on the sale interest-only strips. Our managed results did not include the addition of anallowance for loan and lease losses for the loans underlying our off-balance securitization trusts. Prior to January 1, 2010, we used our supplemental non-GAAPmanaged basis presentation to evaluate the credit performance and overall financial performance of our entire managed loan portfolio because the sameunderwriting standards and ongoing risk monitoring are used for both securitized loans and loans that we own. In addition, we used the managed presentation asthe basis for making decisions about funding our operations and allocating resources, such as employees and capital. Because management used our managedbasis presentation to evaluate our performance, we also provided this information to investors. We believed that our managed basis information was useful toinvestors because it portrayed the results of both on- and off-balance sheet loans that we managed, which enabled investors to understand the credit risksassociated with the portfolio of loans reported on our consolidated balance sheet and our retained interests in securitized loans.
In periods prior to January 1, 2010, certain of our non-GAAP managed measures differed from the comparable reported measures. The adoption on January 1,2010 of the new consolidation accounting standards resulted in accounting for the loans in our securitization trusts in our reported financial statements in amanner similar to how we account for these loans on a managed basis. As a result, our reported and managed basis presentations are generally comparable forperiods beginning after January 1, 2010.
We believe that investors will be able to better understand our financial results and evaluate trends in our business if our period-over-period data are reflected on amore comparable basis. Accordingly, unless otherwise noted, this MD&A compares our reported GAAP financial information as of and for the three monthsended March 31, 2010 with our non-GAAP managed based financial information as of and for the three months ended March 31, 2009 and as of December 31,2009. We provide a reconciliation of our non-GAAP managed based information for periods prior to January 1, 2010 to the most comparable reported GAAPinformation in “Exhibit 99.3— Reconciliation to GAAP Financial Measures.” III. EXECUTIVE SUMMARY AND BUSINESS OUTLOOK First Quarter 2010 Financial Highlights
We reported net income of $636.3 million, or $1.40 per diluted share, for the first quarter of 2010. In comparison, we had a net loss of $172.3 million, or $(0.44)per diluted share, on both a reported and managed basis for the first quarter of 2009. As noted above, the presentation of our results on a non-GAAP managedbasis prior to January 1, 2010 assumed that our securitized loans had not been sold and that the earnings from securitized loans were classified in our results ofoperations in the same manner as the earnings on loans that we owned. These classification differences resulted in differences in certain revenue and expensecomponents of our results of operations on a reported basis and our results of operations on a managed basis, although net income was the same.
3
Table of Contents
Our acquisition of Chevy Chase Bank on February 27, 2009 also has a significant impact on the comparability of our results between the first quarter of 2010 andthe first quarter of 2009. Our results for the first quarter of 2010 include a full quarter impact from Chevy Chase Bank, whereas our results for the first quarter of2009 include only a partial quarter impact from Chevy Chase Bank.
The primary factors contributing to the improvement in our reported results for the first quarter of 2010 compared with our reported and managed results for thefirst quarter of 2009 were an increase in revenues, attributable to an expansion of our net interest margin, and a reduction in our provision for loan and leaselosses. Our net interest margin reflected the benefit of lower funding costs and higher asset yields. We continued to see our mix of funding shift from higher-costwholesale sources to lower-cost consumer and commercial banking deposits. In addition, lower interest rates and disciplined pricing drove a decrease in ouraverage deposit interest rate. The decrease in our provision for loan and lease losses reflected the positive impact of improved credit performance, as economicconditions began to reflect signs of stabilization and improvement. If we excluded the impact from the adoption of the new consolidation accounting standards onour provision for loan and lease losses in the first quarter of 2010, the decrease in our provision would have been lower because the population of loans includedin determining our allowance for loan and lease losses would not have included loans held in our securitization trusts that were previously off-balance sheet. Incomparison, we recorded an incremental build to our allowance for loan and lease losses in the first quarter of 2009 and a higher provision for loan and leaselosses due to deterioration in overall credit performance as a result of a trend of continued and severe economic weakness.
Below are additional highlights of our first quarter 2010 performance. The highlights of our results of operations are generally based on a comparison of ourreported results for the first quarter of 2010 with our managed results for the first quarter of 2009. The highlights of changes in our financial condition and creditperformance are generally based on our reported financial condition and credit statistics as of March 31, 2010, compared with our financial condition and creditperformance on a managed basis as of December 31, 2009. We provide a more detailed discussion of our results of operation, financial condition and creditperformance in “Consolidated Corporate Financial Performance,” “Consolidated Balance Sheet Analysis and Credit Performance” and “Business SegmentPerformance.”
• Credit Card: Our Credit Card business generated net income of $489.6 million in the first quarter of 2010, up from $3.3 million in the first quarter of 2009.The primary drivers of the improvement in our Credit Card business results were an increase in the net interest margin and a significant decrease in theprovision for loan and lease losses. The increase in the net interest margin was attributable to the combined impact of higher asset yields and lower fundingcosts. The increase in the average yield on our credit card loan portfolio reflected the benefit of pricing changes that we implemented during 2009, whilethe decrease in our funding costs reflected the continued shift in the mix of our funding to lower cost consumer deposits from higher cost wholesalesources. The decrease in the provision for loan and lease losses was due to more favorable credit quality trends and a decline in outstanding loan balances.As indicated above, the decrease in our provision was higher than it otherwise would have been due to the adoption of the new consolidation accountingstandards.
• Commercial Banking: Our Commercial Banking business generated a net loss of $49.5 million in the first quarter of 2010, compared with net income of$17.9 million in the first quarter of 2009. The stress on our commercial real estate portfolio from the weak economy continued to have an adverse impacton our Commercial Banking business, although we are seeing some signs that commercial real-estate values are beginning to stabilize.
• Consumer Banking: Our Consumer Banking business generated net income of $305.4 million in the first quarter of 2010, up from $25.3 million in the firstquarter of 2009. The strong profitability in our Consumer Banking business was attributable to improved credit conditions and consumer creditperformance, particularly within our auto loan portfolio. Although our mortgage portfolio includes the stressed portfolio we acquired from Chevy ChaseBank, the fair value that we recorded for this portfolio at the date of acquisition already includes an estimate of credit losses expected to be realized overthe remaining lives of the loans. The credit performance of these loans has been fairly consistent with our estimate of credit losses at the acquisition date;therefore, no impairment has been recognized on these loans.
4
Table of Contents
• Charge-off and Delinquency Statistics: Although net charge-off and delinquency rates remain elevated, these rates showed signs of improvement in the firstquarter of 2010. The net charge-off rate decreased to 6.01%, from 6.33% in the fourth quarter of 2009, and the 30+ day performing delinquency ratedecreased to 4.22%, from 4.73% in the fourth quarter of 2009. In comparison, the net charge-off rate was 5.41% in the first quarter of 2009 and the 30+ dayperforming delinquency rate was 4.10%.
• Allowance for Loan and Lease Losses: As a result of the adoption of the new consolidation accounting guidance, we increased our allowance for loan andlease losses by $4.3 billion to $8.4 billion on January 1, 2010. The initial recording of this amount on our reported balance sheet as of January 1, 2010reduced our stockholders’ equity but had no impact on our reported results of operations. We reduced the amount of our allowance for loan and lease lossesas of January 1, 2010, excluding the impact of deconsolidated trusts, by $565.9 million during the first quarter of 2010, to $7.8 billion as of March 31,2010. The decrease in our allowance during the quarter reflected an improvement in overall credit quality, as well as a decrease in the balance of our loanportfolio.
• Total Loans: Total loans held for investment decreased by $6.7 billion, or 5%, during the first quarter of 2010 to $130.1 billion as of March 31, 2010 from$136.8 billion as of December 31, 2009. This decrease was primarily due to charge-offs and run-off of loans in our Credit Card and Consumer Bankingbusinesses.
• Deconsolidation of Securitization Trusts: We sold certain interest-only mortgage bonds in the first quarter of 2010, which resulted in the deconsolidation ofthe related option-ARM mortgage trusts, which had an outstanding unpaid principal balance of $1.5 billion as of the date of the deconsolidation. Our resultsof operations for the first quarter of 2010 include a net gain of $127.6 million from the sale of these bonds and deconsolidation of the securitization trusts.
• Capital Adequacy: Our Tier 1 risk-based capital ratio was 9.6% as of March 31, 2010, well above the regulatory well-capitalized minimum ratio. Ourreported Tier 1 risk-based capital ratio was 13.8% as of December 31, 2009. Our Tier 1 risk-based capital ratio, including the January 1, 2010 impact fromthe adoption of the new consolidation accounting standards, would have been 9.9% as of December 31, 2009. The decline in our Tier 1 ratio in the firstquarter of 2010 reflected the impact of regulatory rules that allow us to phase-in, for regulatory capital purposes, the new consolidation accounting rulesover the course of 2010. The decline also reflects the disallowance, for purposes of calculating our Tier 1 ratio, of some of the deferred tax assets associatedwith the incremental allowance for loan and lease losses we recorded as a result of the adoption of the new consolidation accounting standards. See“Capital” below for additional information on the capital phase-in requirements related to the impact from the adoption of the new consolidation accountingstandards.
Our ratio of tangible common equity to tangible assets (“TCE ratio”) was 5.5% as of March 31, 2010, down from 6.3% as of December 31, 2009. Our TCEratio, including the January 1, 2010 impact from the adoption of the new consolidation accounting standards, would have been 4.8% as of December 31,2009. The 70 basis point increase in our TCE ratio in the first quarter of 2010 over the pro forma ratio of 4.8% as of December 31, 2009 was driven bystrong earnings in the first quarter, coupled with the $11.7 billion decline in managed assets.
• Adoption of New Consolidation Accounting Standards: As indicated above, we added approximately $41.9 billion of assets, consisting primarily of creditcard loan receivables underlying the consolidated securitization trusts, along with approximately $44.3 billion of related debt issued by these trusts to third-party investors to our balance sheet on January 1, 2010 as a result of the adoption of the new consolidation accounting standards.
Business Environment and Significant Developments
Economic conditions, while still challenging, continued to show signs of stabilization and improvement in the first quarter of 2010. Although the unemploymentrate remained high at 9.7% in March 2010 and is likely to remain elevated for some time, it is down from a high of 10.1% in October 2009. The fundamentals ofthe labor market, which is a driving force in the economic recovery, appear to be moving in the right direction with signs of a slowdown in layoffs and a pick upin hiring. Consumer spending improved during the first quarter of 2010, but spending remains soft due to pressure from the weak labor and housing markets,which impacts our purchase volume and growth outlook for 2010.
5
Table of Contents
Business Outlook
The statements contained in this section are based on our current expectations regarding the Company’s outlook for its financial results and business strategies.Certain statements are forward looking statements within the meaning of the Private Securities Litigation Reform Act of 1995. Actual results could differmaterially from those in our forward looking statements. See “Forward Looking Statements” and “Item 1A. Risk Factors” of our 2009 Form 10-K for factors thatcould materially influence our results.
Business Segment Expectations
We discuss below our current expectations regarding the performance of each of our business segments over the near-term based on current market conditions, theregulatory environment and our business strategies. Following this discussion, we summarize how the expected performance of our business segments will impactour overall near-term corporate financial performance.
Credit Card Business
For the remainder of 2010 and into early 2011, we expect that quarterly Domestic Card revenue margin will decline, as credit trends, seasonality, and consumerand competitor responses to the Credit CARD Act play out. Several factors drive the expected decline, including the following:
• The credit-related benefit to revenue we experienced in the first quarter of 2010 is likely to diminish. As the company was able to recognize a greaterportion of the finance charges and fees it billed in the first quarter as revenue, it will have a smaller backlog of first quarter billings currently deemeduncollectible that could be recognized in future quarters as credit improves.
• Beginning in the second quarter, we expect to experience an additional modest decline in overlimit fee revenue resulting from the February 22, 2010implementation of Credit CARD Act regulations.
• We expect that the August 22, 2010 implementation of “reasonable and proportional” fee regulations will reduce revenue margin in the Domestic Cardbusiness. We expect a “half-quarter” revenue impact in the third quarter of 2010, and a “full quarter” effect in the fourth quarter of 2010.
• As Domestic Card originations grow for the remainder of 2010, the percentage of total Domestic Card loan balances at promotional interest rates is likelyto increase, reducing weighted average annual percentage rates for the Domestic Card portfolio.
By the end of 2010 or early in 2011, we expect that the quarterly Domestic Card revenue margin will be around 15%. We expect non-interest expense as apercentage of loans to increase in the near-term, largely due to the impact of the declining loan balances and the expected increase in marketing expenses. Weexpect that marketing expenses will increase to more normal levels over the next several quarters. The pace and extent of the expected increase in marketingexpense will depend upon consumer demand and the competitive landscape. We expect that our marketing efforts, coupled with reduced charge-offs, willgenerate modest growth in our revolving card balances over the remainder of 2010. However, we expect that Domestic Card loan balances will be relatively flatfor the remaining quarters of 2010, as growth in revolving credit cards is offset by elevated charge-offs and the continuing run-off of installment loans.
We expect the provision for loan and lease losses for our Domestic Card business to decline over the next several quarters. We believe that credit losses for ourDomestic Card business peaked in the first quarter of 2010. As a result, we expect a modest reduction in charge-offs beginning in the second quarter of 2010. Webelieve that further reductions in the Domestic Card allowance for loan and lease losses are possible for the remainder of 2010.
As a result of these revenue and expense trends, we believe that it is likely that the pre-provision earnings as a percentage of loans for our Domestic Card businesswill decline through 2010 and perhaps into early 2011. We expect that this decline will be cushioned by an expected reduction in the provision for loan and leaselosses for our Domestic Card business. We believe that the long-term overall economics of our Domestic Card business will continue to be very attractive.
6

Table of Contents
Commercial Banking Business
Although the commercial banking portfolio remained relatively flat in the first quarter of 2010, attractive lending opportunities are beginning to emerge. Based onthese opportunities, we expect modest growth in our commercial banking portfolio over the course of 2010. Nonperforming loans and charge-offs will likelyremain elevated across our Commercial Banking business due to continued stress on our commercial loan portfolio from the decline in commercial real estatevalues and continued deterioration in our commercial loan portfolio, although the pace of deterioration has slowed. We continue to believe that our commercialbanking loan portfolio is well positioned to weather the downturn in commercial real estate.
Consumer Banking Business
We continue to expect an overall decline in the balance of loans in our Consumer Banking business, attributable to our auto and mortgage loan portfolios. Ourauto loan balances have been declining as a result of our decision to retrench and reposition our origination volume in 2008. We expect the balance of loans in ourauto finance business to continue to decline by approximately $1.5 billion; however, we are beginning to approach a point where our new auto loan originationsare close to offsetting the run-offs from our previous business. We expect the balance of loans in our mortgage portfolio, which largely remains in a run-off mode,to decline by approximately $2.5 billion during 2010.
Total Company Earnings Expectations
Over the next several quarters, we expect our quarterly margins to decline to more normal historical levels, driven by an expected decrease in Domestic Cardrevenue margin, as well as the stabilization of funding costs. We expect that the balance of total loans will continue to decline over the next few quarters beforereaching a bottom at the end of 2010 or early in 2011. We expect the continuing run-off of businesses that we exited or repositioned during the economicrecession to drive the decline in total outstanding loans. We expect expenses to increase during this period, as we ramp up marketing expenses to more normalhistorical levels and continue to make investments in our banking infrastructure to support future growth. We expect that total operating expenses, excludingmarketing expense, will remain near current levels, with modest quarterly variability, as continuing infrastructure investments are offset by continuing operatingefficiency improvements. We believe the combined impact of these expected trends will result in lower quarterly “pre-provision” earnings (earnings excludingour provision for loan and lease losses) into 2011. We expect pre-provision earnings to establish a positive trend over the course of 2011.
We anticipate a continued reduction in the level of charge-offs, resulting in a decline in our provision expense for loan and lease losses. We expect the decliningprovision for loan and lease losses to cushion the bottom-line impact of the expected decline in pre-provision earnings.
Balance Sheet Expectations
We have discontinued the origination of national installment loans within our Domestic Card business, stopped national mortgage loan and small-ticketcommercial real estate loan originations and repositioned and retrenched our auto finance business. As a result of the run-off of these businesses, which we exitedor repositioned during the recession, we expect total loans to decline by approximately $7.0 billion from year-end 2009 to year-end 2010. Approximately $2.6billion of the expected decline occurred in the first quarter of 2010. Therefore, we expect an additional decline for the remainder of 2010 of approximately $4.4billion, which includes expected declines of approximately $2.0 billion in installment loans, $1.5 billion in mortgages, and $500 million in auto loans.
We expect that the impact of run-off portfolios will be partially offset by modest growth in revolving credit card loans in our Domestic Card business andcommercial loans in the Commercial Banking business. As a result of the ongoing attrition related to businesses that we exited or repositioned during therecession, we continue to expect a mid-single digit percentage decline in total ending loan balances in 2010. Based on the rapid shrinkage in our loan balancesduring 2009, we expect a high-single digit percentage decline in average loan balances in 2010 compared with 2009.
Given the historically high levels of coverage, and underlying business and economic trends, further reduction in the allowance for loan and lease losses ispossible over the remainder of 2010. The combination of declining outstanding loan balances and more favorable credit trends may create the potential forsignificant allowance releases. We expect the
7
Table of Contents
balance of securitized loans, which decreased by approximately $9.0 billion in the first quarter of 2010, to decrease by an additional $11 billion over theremainder of 2010. Assuming this level of decline, the balance of securitized loans at the end of 2010 would be approximately 43% lower than the balance at theend of 2009.
We previously indicated that trends in our Tier 1 capital and TCE ratios would diverge in 2010 and early 2011 as a result of our adoption of the new consolidationaccounting standards. The change in these ratios during the first quarter of 2010 reflected this expectation. As permitted under the capital rules issued by bankingregulators in January 2010, we elected to phase in the impact from the adoption of the new consolidation accounting standards on risk-based capital over 2010and the first quarter of 2011. During the phase in period, we expect that our Tier 1 ratios will continue to be adversely affected by a decrease in the numeratorresulting from the disallowance of a portion of the deferred tax assets associated with the increase in our allowance for loan and lease losses from consolidationand an increase in the denominator through the first quarter of 2011 due in part to the new consolidation accounting standards. We expect, however, that our Tier1 capital ratios will remain above well capitalized minimum levels throughout the regulatory capital phase-in period for the new consolidation standards. Becauseregulatory capital ratios are more pro-cyclical than the TCE ratio, we expect that as credit loss levels begin to normalize, our Tier 1 ratios will more thanproportionately follow the fundamental upward trajectory of the TCE ratios. IV. CRITICAL ACCOUNTING POLICIES AND ESTIMATES The preparation of financial statements in accordance with GAAP requires management to make a number of judgments, estimates and assumptions that affectthe reported amount of assets, liabilities, income and expenses in the consolidated financial statements. Understanding our accounting policies and the extent towhich we use management judgment and estimates in applying these policies is integral to understanding our financial statements. We describe our mostsignificant accounting policies in “Note 1—Significant Accounting Policies” of our 2009 Form 10-K.
The use of fair value to measure our financial instruments is fundamental to the preparation of our consolidated financial statements because we account for andrecord a substantial portion of our assets and liabilities at fair value. The fair value accounting rules provide a three-level fair value hierarchy for classifyingfinancial instruments. This hierarchy is based on whether the inputs to the valuation techniques used to measure fair value are observable or unobservable. Eachasset or liability is assigned to a level based on the lowest level of any input that is significant to the fair value measurement. The three levels of the fair valuehierarchy are described below:
Level 1: Quoted prices (unadjusted) in active markets for identical assets or liabilities.
Level 2: Observable market-based inputs, other than quoted prices in active markets for identical assets or liabilities.
Level 3: Unobservable inputs.
8
Table of Contents
In the determination of the classification of financial instruments in Level 2 or Level 3 of the fair value hierarchy, we consider all available information, includingobservable market data, indications of market liquidity and orderliness, and our understanding of the valuation techniques and significant inputs used. Based uponthe specific facts and circumstances of each instrument or instrument category, judgments are made regarding the significance of the Level 3 inputs to theinstruments’ fair value measurement in its entirety. If Level 3 inputs are considered significant, the instrument is classified as Level 3. The process fordetermining fair value using unobservable inputs is generally more subjective and involves a high degree of management judgment and assumptions.
Our financial instruments recorded at fair value on a recurring basis represented approximately 20% of our total reported assets of $200.7 billion as of March 31,2010, compared with 26% of our total reported assets of $169.6 billion as of December 31, 2009. Financial assets for which fair values were measured usingsignificant Level 3 inputs represented approximately 4% of these financial instruments (1% of total assets) as of March 31, 2010, and approximately 14% (4% oftotal assets) as of December 31, 2009. The decreases in the percentage of financial instruments measured at a fair value on a recurring basis and the percentage offinancial instruments measured using Level 3 inputs were primarily attributable to the increase in our assets from the adoption of the new consolidationaccounting standards, as the consolidated loans are generally classified as held for investment and are therefore not measured at fair value on a recurring basis.We discuss changes in the valuation inputs and assumptions used in determining the fair value of our financial instruments, including the extent to which we haverelied on significant unobservable inputs to estimate fair value and our process for corroborating these inputs, in “Note 7—Fair Value of Financial Instruments.”
We provide additional information on our critical accounting policies and estimates in our 2009 Form 10-K in “Item 7. MD&A—Critical Accounting Policies.” V. RECENT ACCOUNTING PRONOUNCEMENTS New accounting pronouncements or changes in existing accounting pronouncements may have a significant effect on our results of operations, financialcondition, stockholders’ equity, capital ratios or business operations. As discussed above, effective January 1, 2010, we adopted two new accounting standardsthat had a significant impact on the manner in which we account for our securitization transactions, our consolidated financial statements and our capital ratios.These new accounting standards eliminated the concept of qualified special purpose entities (“QSPEs”), revised the accounting for transfers of financial assetsand changed the consolidation criteria for VIEs. Under the new accounting guidance, the determination to consolidate a VIE is based on a qualitative assessmentof which party to the VIE has “power” combined with potentially significant benefits or losses, instead of the previous quantitative risks and rewards model.Consolidation is required when an entity has the power to direct matters which significantly impact the economic performance of the VIE, together with either theobligation to absorb losses or the rights to receive benefits that could be significant to the VIE. The prospective adoption of this new accounting guidance resultedin our consolidating substantially all our existing securitization trusts that had previously been off-balance sheet and eliminated sales treatment for new transfersof loans to securitization trusts. We provide additional information on the impact of these new accounting standards above in “Impact from Adoption of NewConsolidation Accounting Standards” and in “Note 1—Summary of Significant Accounting Policies.” We also identify and discuss the impact of other significantrecently issued accounting pronouncements, including those not yet adopted, in “Note 1—Summary of Significant Accounting Policies.” VI. OFF-BALANCE SHEET ARRANGEMENTS AND VARIABLE INTEREST ENTITIES In the ordinary course of business, we are involved in various types of transactions with limited liability companies, partnerships or trusts that often involvespecial purpose entities (“SPEs”) and variable interest entities (“VIEs”). Some of these arrangements are not recorded on our consolidated balance sheets or maybe recorded in amounts different from the full contract or notional amount of the transaction, depending on the nature or structure of, and accounting required tobe applied to, the arrangement. Because these arrangements involve separate legal entities that have significant limitations on their activities, they are commonlyreferred to as “off-balance sheet arrangements.” These arrangements may expose us to potential losses in excess of the amounts recorded in the consolidatedbalance sheets. Our involvement in these arrangements can take many forms, including securitization and servicing activities, the purchase or sale of mortgage-backed or other asset-backed securities in connection with our mortgage portfolio, and loans to VIEs that hold debt, equity, real estate or other assets. Underprevious accounting guidance, we were not required to consolidate the majority of our securitization trusts because they were QSPEs. Accordingly, we consideredthese trusts to be off-balance sheet arrangements.
9
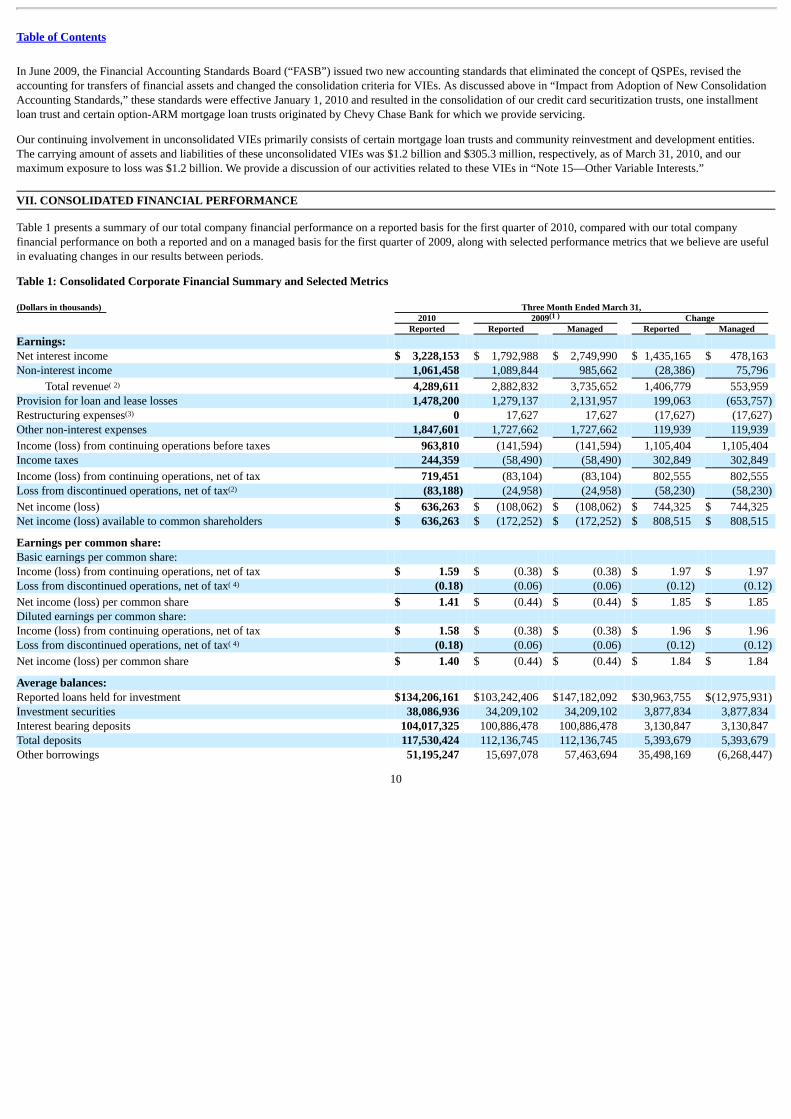
Table of Contents
In June 2009, the Financial Accounting Standards Board (“FASB”) issued two new accounting standards that eliminated the concept of QSPEs, revised theaccounting for transfers of financial assets and changed the consolidation criteria for VIEs. As discussed above in “Impact from Adoption of New ConsolidationAccounting Standards,” these standards were effective January 1, 2010 and resulted in the consolidation of our credit card securitization trusts, one installmentloan trust and certain option-ARM mortgage loan trusts originated by Chevy Chase Bank for which we provide servicing.
Our continuing involvement in unconsolidated VIEs primarily consists of certain mortgage loan trusts and community reinvestment and development entities.The carrying amount of assets and liabilities of these unconsolidated VIEs was $1.2 billion and $305.3 million, respectively, as of March 31, 2010, and ourmaximum exposure to loss was $1.2 billion. We provide a discussion of our activities related to these VIEs in “Note 15—Other Variable Interests.” VII. CONSOLIDATED FINANCIAL PERFORMANCE Table 1 presents a summary of our total company financial performance on a reported basis for the first quarter of 2010, compared with our total companyfinancial performance on both a reported and on a managed basis for the first quarter of 2009, along with selected performance metrics that we believe are usefulin evaluating changes in our results between periods.
Table 1: Consolidated Corporate Financial Summary and Selected Metrics (Dollars in thousands) Three Month Ended March 31, 2010 2009 Change Reported Reported Managed Reported Managed Earnings: Net interest income $ 3,228,153 $ 1,792,988 $ 2,749,990 $ 1,435,165 $ 478,163 Non-interest income 1,061,458 1,089,844 985,662 (28,386) 75,796
Total revenue 4,289,611 2,882,832 3,735,652 1,406,779 553,959 Provision for loan and lease losses 1,478,200 1,279,137 2,131,957 199,063 (653,757) Restructuring expenses 0 17,627 17,627 (17,627) (17,627) Other non-interest expenses 1,847,601 1,727,662 1,727,662 119,939 119,939
Income (loss) from continuing operations before taxes 963,810 (141,594) (141,594) 1,105,404 1,105,404 Income taxes 244,359 (58,490) (58,490) 302,849 302,849
Income (loss) from continuing operations, net of tax 719,451 (83,104) (83,104) 802,555 802,555 Loss from discontinued operations, net of tax (83,188) (24,958) (24,958) (58,230) (58,230)
Net income (loss) $ 636,263 $ (108,062) $ (108,062) $ 744,325 $ 744,325 Net income (loss) available to common shareholders $ 636,263 $ (172,252) $ (172,252) $ 808,515 $ 808,515
Earnings per common share: Basic earnings per common share: Income (loss) from continuing operations, net of tax $ 1.59 $ (0.38) $ (0.38) $ 1.97 $ 1.97 Loss from discontinued operations, net of tax (0.18) (0.06) (0.06) (0.12) (0.12)
Net income (loss) per common share $ 1.41 $ (0.44) $ (0.44) $ 1.85 $ 1.85 Diluted earnings per common share: Income (loss) from continuing operations, net of tax $ 1.58 $ (0.38) $ (0.38) $ 1.96 $ 1.96 Loss from discontinued operations, net of tax (0.18) (0.06) (0.06) (0.12) (0.12)
Net income (loss) per common share $ 1.40 $ (0.44) $ (0.44) $ 1.84 $ 1.84
Average balances: Reported loans held for investment $134,206,161 $103,242,406 $147,182,092 $30,963,755 $(12,975,931) Investment securities 38,086,936 34,209,102 34,209,102 3,877,834 3,877,834 Interest bearing deposits 104,017,325 100,886,478 100,886,478 3,130,847 3,130,847 Total deposits 117,530,424 112,136,745 112,136,745 5,393,679 5,393,679 Other borrowings 51,195,247 15,697,078 57,463,694 35,498,169 (6,268,447)
10
(1 )
( 2)
(3)
(2)
( 4)
( 4)
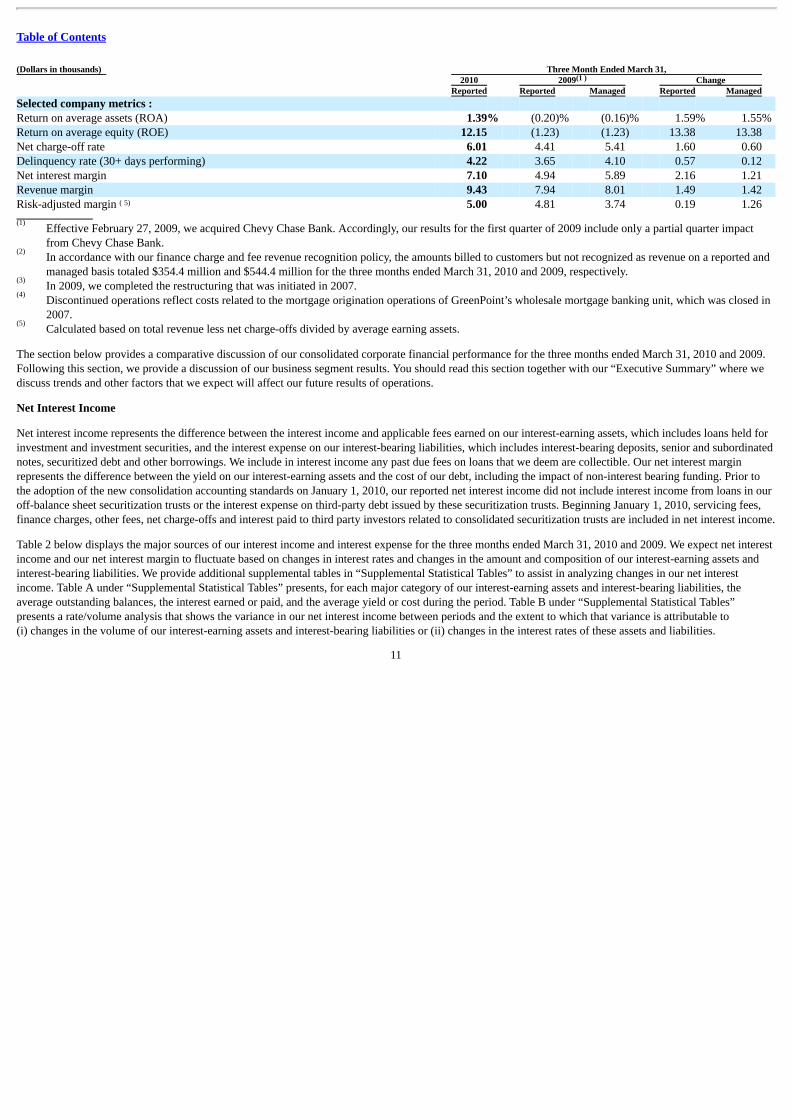
Table of Contents
(Dollars in thousands) Three Month Ended March 31, 2010 2009 Change Reported Reported Managed Reported Managed Selected company metrics : Return on average assets (ROA) 1.39% (0.20)% (0.16)% 1.59% 1.55% Return on average equity (ROE) 12.15 (1.23) (1.23) 13.38 13.38 Net charge-off rate 6.01 4.41 5.41 1.60 0.60 Delinquency rate (30+ days performing) 4.22 3.65 4.10 0.57 0.12 Net interest margin 7.10 4.94 5.89 2.16 1.21 Revenue margin 9.43 7.94 8.01 1.49 1.42 Risk-adjusted margin 5.00 4.81 3.74 0.19 1.26
Effective February 27, 2009, we acquired Chevy Chase Bank. Accordingly, our results for the first quarter of 2009 include only a partial quarter impactfrom Chevy Chase Bank.In accordance with our finance charge and fee revenue recognition policy, the amounts billed to customers but not recognized as revenue on a reported andmanaged basis totaled $354.4 million and $544.4 million for the three months ended March 31, 2010 and 2009, respectively.In 2009, we completed the restructuring that was initiated in 2007.Discontinued operations reflect costs related to the mortgage origination operations of GreenPoint’s wholesale mortgage banking unit, which was closed in2007.Calculated based on total revenue less net charge-offs divided by average earning assets.
The section below provides a comparative discussion of our consolidated corporate financial performance for the three months ended March 31, 2010 and 2009.Following this section, we provide a discussion of our business segment results. You should read this section together with our “Executive Summary” where wediscuss trends and other factors that we expect will affect our future results of operations.
Net Interest Income
Net interest income represents the difference between the interest income and applicable fees earned on our interest-earning assets, which includes loans held forinvestment and investment securities, and the interest expense on our interest-bearing liabilities, which includes interest-bearing deposits, senior and subordinatednotes, securitized debt and other borrowings. We include in interest income any past due fees on loans that we deem are collectible. Our net interest marginrepresents the difference between the yield on our interest-earning assets and the cost of our debt, including the impact of non-interest bearing funding. Prior tothe adoption of the new consolidation accounting standards on January 1, 2010, our reported net interest income did not include interest income from loans in ouroff-balance sheet securitization trusts or the interest expense on third-party debt issued by these securitization trusts. Beginning January 1, 2010, servicing fees,finance charges, other fees, net charge-offs and interest paid to third party investors related to consolidated securitization trusts are included in net interest income.
Table 2 below displays the major sources of our interest income and interest expense for the three months ended March 31, 2010 and 2009. We expect net interestincome and our net interest margin to fluctuate based on changes in interest rates and changes in the amount and composition of our interest-earning assets andinterest-bearing liabilities. We provide additional supplemental tables in “Supplemental Statistical Tables” to assist in analyzing changes in our net interestincome. Table A under “Supplemental Statistical Tables” presents, for each major category of our interest-earning assets and interest-bearing liabilities, theaverage outstanding balances, the interest earned or paid, and the average yield or cost during the period. Table B under “Supplemental Statistical Tables”presents a rate/volume analysis that shows the variance in our net interest income between periods and the extent to which that variance is attributable to(i) changes in the volume of our interest-earning assets and interest-bearing liabilities or (ii) changes in the interest rates of these assets and liabilities.
11
(1 )
( 5)
(1)
(2)
(3)
(4)
(5)
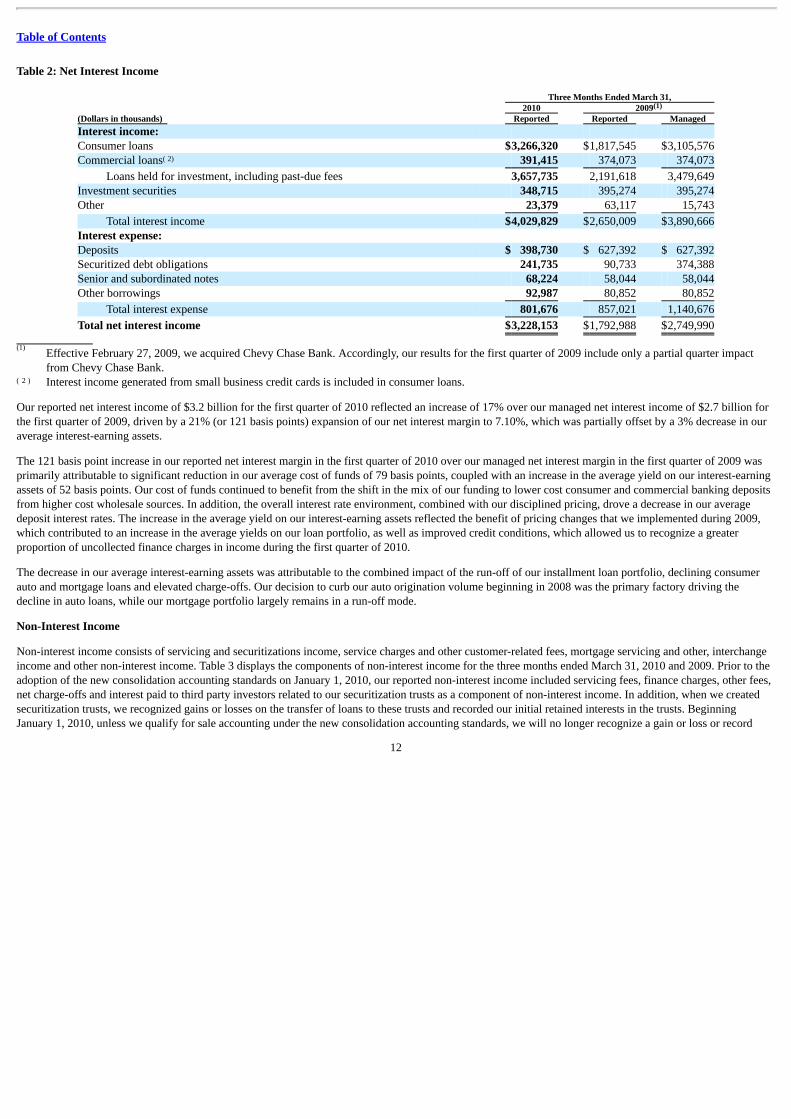
Table of Contents
Table 2: Net Interest Income
Three Months Ended March 31, 2010 2009(Dollars in thousands) Reported Reported ManagedInterest income: Consumer loans $3,266,320 $1,817,545 $3,105,576Commercial loans 391,415 374,073 374,073
Loans held for investment, including past-due fees 3,657,735 2,191,618 3,479,649Investment securities 348,715 395,274 395,274Other 23,379 63,117 15,743
Total interest income $4,029,829 $2,650,009 $3,890,666Interest expense: Deposits $ 398,730 $ 627,392 $ 627,392Securitized debt obligations 241,735 90,733 374,388Senior and subordinated notes 68,224 58,044 58,044Other borrowings 92,987 80,852 80,852
Total interest expense 801,676 857,021 1,140,676
Total net interest income $3,228,153 $1,792,988 $2,749,990
Effective February 27, 2009, we acquired Chevy Chase Bank. Accordingly, our results for the first quarter of 2009 include only a partial quarter impactfrom Chevy Chase Bank.
Interest income generated from small business credit cards is included in consumer loans.
Our reported net interest income of $3.2 billion for the first quarter of 2010 reflected an increase of 17% over our managed net interest income of $2.7 billion forthe first quarter of 2009, driven by a 21% (or 121 basis points) expansion of our net interest margin to 7.10%, which was partially offset by a 3% decrease in ouraverage interest-earning assets.
The 121 basis point increase in our reported net interest margin in the first quarter of 2010 over our managed net interest margin in the first quarter of 2009 wasprimarily attributable to significant reduction in our average cost of funds of 79 basis points, coupled with an increase in the average yield on our interest-earningassets of 52 basis points. Our cost of funds continued to benefit from the shift in the mix of our funding to lower cost consumer and commercial banking depositsfrom higher cost wholesale sources. In addition, the overall interest rate environment, combined with our disciplined pricing, drove a decrease in our averagedeposit interest rates. The increase in the average yield on our interest-earning assets reflected the benefit of pricing changes that we implemented during 2009,which contributed to an increase in the average yields on our loan portfolio, as well as improved credit conditions, which allowed us to recognize a greaterproportion of uncollected finance charges in income during the first quarter of 2010.
The decrease in our average interest-earning assets was attributable to the combined impact of the run-off of our installment loan portfolio, declining consumerauto and mortgage loans and elevated charge-offs. Our decision to curb our auto origination volume beginning in 2008 was the primary factory driving thedecline in auto loans, while our mortgage portfolio largely remains in a run-off mode.
Non-Interest Income
Non-interest income consists of servicing and securitizations income, service charges and other customer-related fees, mortgage servicing and other, interchangeincome and other non-interest income. Table 3 displays the components of non-interest income for the three months ended March 31, 2010 and 2009. Prior to theadoption of the new consolidation accounting standards on January 1, 2010, our reported non-interest income included servicing fees, finance charges, other fees,net charge-offs and interest paid to third party investors related to our securitization trusts as a component of non-interest income. In addition, when we createdsecuritization trusts, we recognized gains or losses on the transfer of loans to these trusts and recorded our initial retained interests in the trusts. BeginningJanuary 1, 2010, unless we qualify for sale accounting under the new consolidation accounting standards, we will no longer recognize a gain or loss or record
12
(1)
( 2)
(1)
( 2 )
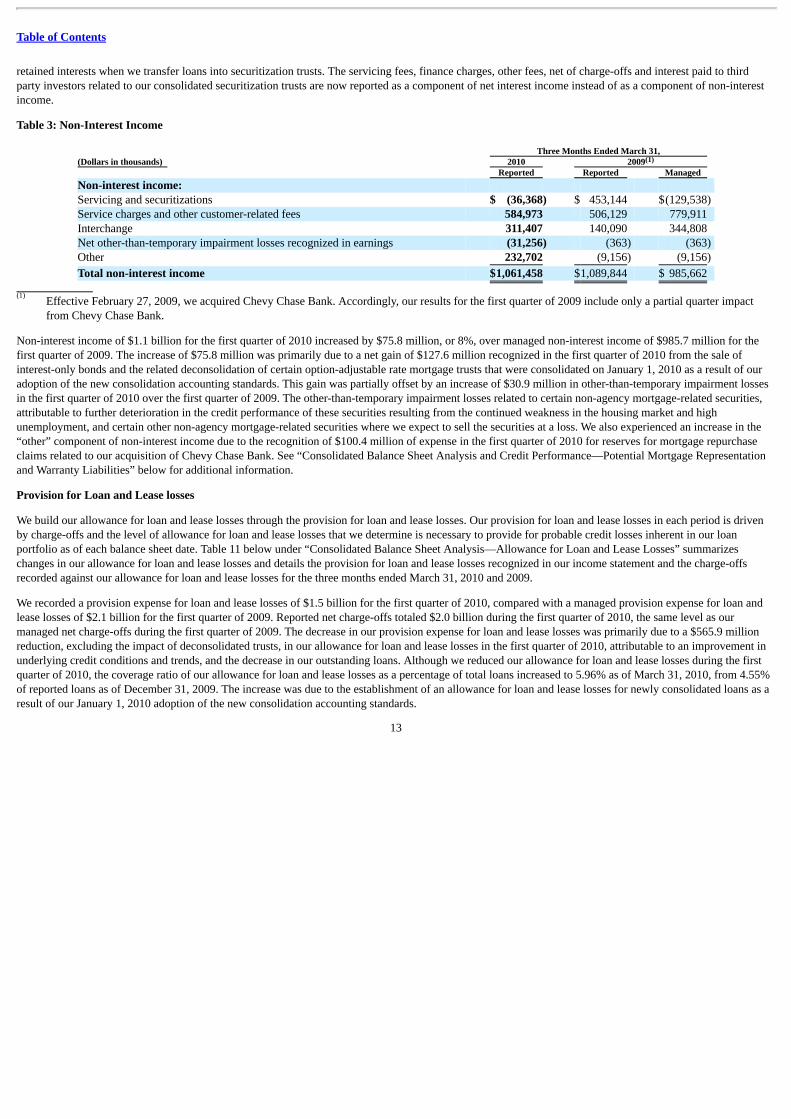
Table of Contents
retained interests when we transfer loans into securitization trusts. The servicing fees, finance charges, other fees, net of charge-offs and interest paid to thirdparty investors related to our consolidated securitization trusts are now reported as a component of net interest income instead of as a component of non-interestincome.
Table 3: Non-Interest Income
Three Months Ended March 31, (Dollars in thousands) 2010 2009 Reported Reported Managed Non-interest income: Servicing and securitizations $ (36,368) $ 453,144 $(129,538) Service charges and other customer-related fees 584,973 506,129 779,911 Interchange 311,407 140,090 344,808 Net other-than-temporary impairment losses recognized in earnings (31,256) (363) (363) Other 232,702 (9,156) (9,156)
Total non-interest income $1,061,458 $1,089,844 $ 985,662
Effective February 27, 2009, we acquired Chevy Chase Bank. Accordingly, our results for the first quarter of 2009 include only a partial quarter impactfrom Chevy Chase Bank.
Non-interest income of $1.1 billion for the first quarter of 2010 increased by $75.8 million, or 8%, over managed non-interest income of $985.7 million for thefirst quarter of 2009. The increase of $75.8 million was primarily due to a net gain of $127.6 million recognized in the first quarter of 2010 from the sale ofinterest-only bonds and the related deconsolidation of certain option-adjustable rate mortgage trusts that were consolidated on January 1, 2010 as a result of ouradoption of the new consolidation accounting standards. This gain was partially offset by an increase of $30.9 million in other-than-temporary impairment lossesin the first quarter of 2010 over the first quarter of 2009. The other-than-temporary impairment losses related to certain non-agency mortgage-related securities,attributable to further deterioration in the credit performance of these securities resulting from the continued weakness in the housing market and highunemployment, and certain other non-agency mortgage-related securities where we expect to sell the securities at a loss. We also experienced an increase in the“other” component of non-interest income due to the recognition of $100.4 million of expense in the first quarter of 2010 for reserves for mortgage repurchaseclaims related to our acquisition of Chevy Chase Bank. See “Consolidated Balance Sheet Analysis and Credit Performance—Potential Mortgage Representationand Warranty Liabilities” below for additional information.
Provision for Loan and Lease losses
We build our allowance for loan and lease losses through the provision for loan and lease losses. Our provision for loan and lease losses in each period is drivenby charge-offs and the level of allowance for loan and lease losses that we determine is necessary to provide for probable credit losses inherent in our loanportfolio as of each balance sheet date. Table 11 below under “Consolidated Balance Sheet Analysis—Allowance for Loan and Lease Losses” summarizeschanges in our allowance for loan and lease losses and details the provision for loan and lease losses recognized in our income statement and the charge-offsrecorded against our allowance for loan and lease losses for the three months ended March 31, 2010 and 2009.
We recorded a provision expense for loan and lease losses of $1.5 billion for the first quarter of 2010, compared with a managed provision expense for loan andlease losses of $2.1 billion for the first quarter of 2009. Reported net charge-offs totaled $2.0 billion during the first quarter of 2010, the same level as ourmanaged net charge-offs during the first quarter of 2009. The decrease in our provision expense for loan and lease losses was primarily due to a $565.9 millionreduction, excluding the impact of deconsolidated trusts, in our allowance for loan and lease losses in the first quarter of 2010, attributable to an improvement inunderlying credit conditions and trends, and the decrease in our outstanding loans. Although we reduced our allowance for loan and lease losses during the firstquarter of 2010, the coverage ratio of our allowance for loan and lease losses as a percentage of total loans increased to 5.96% as of March 31, 2010, from 4.55%of reported loans as of December 31, 2009. The increase was due to the establishment of an allowance for loan and lease losses for newly consolidated loans as aresult of our January 1, 2010 adoption of the new consolidation accounting standards.
13
(1)
(1)
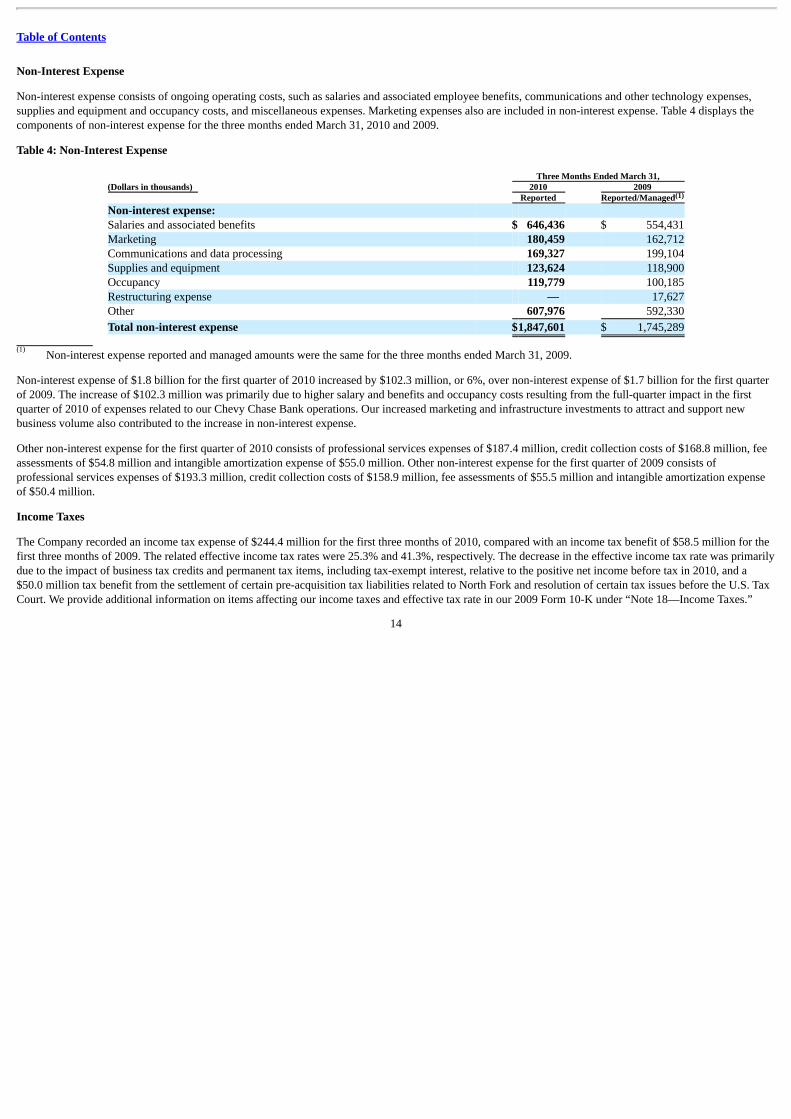
Table of Contents
Non-Interest Expense
Non-interest expense consists of ongoing operating costs, such as salaries and associated employee benefits, communications and other technology expenses,supplies and equipment and occupancy costs, and miscellaneous expenses. Marketing expenses also are included in non-interest expense. Table 4 displays thecomponents of non-interest expense for the three months ended March 31, 2010 and 2009.
Table 4: Non-Interest Expense
Three Months Ended March 31,(Dollars in thousands) 2010 2009 Reported Reported/ManagedNon-interest expense: Salaries and associated benefits $ 646,436 $ 554,431Marketing 180,459 162,712Communications and data processing 169,327 199,104Supplies and equipment 123,624 118,900Occupancy 119,779 100,185Restructuring expense — 17,627Other 607,976 592,330
Total non-interest expense $1,847,601 $ 1,745,289
Non-interest expense reported and managed amounts were the same for the three months ended March 31, 2009.
Non-interest expense of $1.8 billion for the first quarter of 2010 increased by $102.3 million, or 6%, over non-interest expense of $1.7 billion for the first quarterof 2009. The increase of $102.3 million was primarily due to higher salary and benefits and occupancy costs resulting from the full-quarter impact in the firstquarter of 2010 of expenses related to our Chevy Chase Bank operations. Our increased marketing and infrastructure investments to attract and support newbusiness volume also contributed to the increase in non-interest expense.
Other non-interest expense for the first quarter of 2010 consists of professional services expenses of $187.4 million, credit collection costs of $168.8 million, feeassessments of $54.8 million and intangible amortization expense of $55.0 million. Other non-interest expense for the first quarter of 2009 consists ofprofessional services expenses of $193.3 million, credit collection costs of $158.9 million, fee assessments of $55.5 million and intangible amortization expenseof $50.4 million.
Income Taxes
The Company recorded an income tax expense of $244.4 million for the first three months of 2010, compared with an income tax benefit of $58.5 million for thefirst three months of 2009. The related effective income tax rates were 25.3% and 41.3%, respectively. The decrease in the effective income tax rate was primarilydue to the impact of business tax credits and permanent tax items, including tax-exempt interest, relative to the positive net income before tax in 2010, and a$50.0 million tax benefit from the settlement of certain pre-acquisition tax liabilities related to North Fork and resolution of certain tax issues before the U.S. TaxCourt. We provide additional information on items affecting our income taxes and effective tax rate in our 2009 Form 10-K under “Note 18—Income Taxes.”
14
(1)
(1)
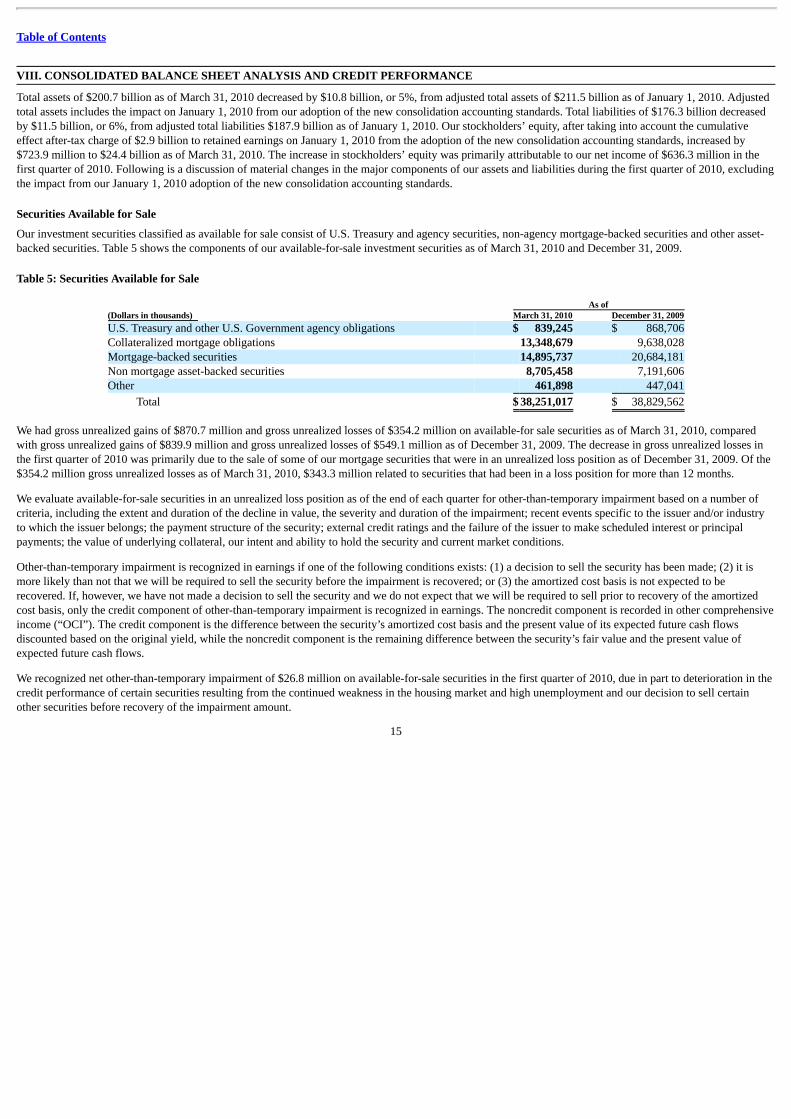
Table of Contents
VIII. CONSOLIDATED BALANCE SHEET ANALYSIS AND CREDIT PERFORMANCE Total assets of $200.7 billion as of March 31, 2010 decreased by $10.8 billion, or 5%, from adjusted total assets of $211.5 billion as of January 1, 2010. Adjustedtotal assets includes the impact on January 1, 2010 from our adoption of the new consolidation accounting standards. Total liabilities of $176.3 billion decreasedby $11.5 billion, or 6%, from adjusted total liabilities $187.9 billion as of January 1, 2010. Our stockholders’ equity, after taking into account the cumulativeeffect after-tax charge of $2.9 billion to retained earnings on January 1, 2010 from the adoption of the new consolidation accounting standards, increased by$723.9 million to $24.4 billion as of March 31, 2010. The increase in stockholders’ equity was primarily attributable to our net income of $636.3 million in thefirst quarter of 2010. Following is a discussion of material changes in the major components of our assets and liabilities during the first quarter of 2010, excludingthe impact from our January 1, 2010 adoption of the new consolidation accounting standards.
Securities Available for Sale
Our investment securities classified as available for sale consist of U.S. Treasury and agency securities, non-agency mortgage-backed securities and other asset-backed securities. Table 5 shows the components of our available-for-sale investment securities as of March 31, 2010 and December 31, 2009.
Table 5: Securities Available for Sale
As of(Dollars in thousands) March 31, 2010 December 31, 2009U.S. Treasury and other U.S. Government agency obligations $ 839,245 $ 868,706Collateralized mortgage obligations 13,348,679 9,638,028Mortgage-backed securities 14,895,737 20,684,181Non mortgage asset-backed securities 8,705,458 7,191,606Other 461,898 447,041
Total $ 38,251,017 $ 38,829,562
We had gross unrealized gains of $870.7 million and gross unrealized losses of $354.2 million on available-for sale securities as of March 31, 2010, comparedwith gross unrealized gains of $839.9 million and gross unrealized losses of $549.1 million as of December 31, 2009. The decrease in gross unrealized losses inthe first quarter of 2010 was primarily due to the sale of some of our mortgage securities that were in an unrealized loss position as of December 31, 2009. Of the$354.2 million gross unrealized losses as of March 31, 2010, $343.3 million related to securities that had been in a loss position for more than 12 months.
We evaluate available-for-sale securities in an unrealized loss position as of the end of each quarter for other-than-temporary impairment based on a number ofcriteria, including the extent and duration of the decline in value, the severity and duration of the impairment; recent events specific to the issuer and/or industryto which the issuer belongs; the payment structure of the security; external credit ratings and the failure of the issuer to make scheduled interest or principalpayments; the value of underlying collateral, our intent and ability to hold the security and current market conditions.
Other-than-temporary impairment is recognized in earnings if one of the following conditions exists: (1) a decision to sell the security has been made; (2) it ismore likely than not that we will be required to sell the security before the impairment is recovered; or (3) the amortized cost basis is not expected to berecovered. If, however, we have not made a decision to sell the security and we do not expect that we will be required to sell prior to recovery of the amortizedcost basis, only the credit component of other-than-temporary impairment is recognized in earnings. The noncredit component is recorded in other comprehensiveincome (“OCI”). The credit component is the difference between the security’s amortized cost basis and the present value of its expected future cash flowsdiscounted based on the original yield, while the noncredit component is the remaining difference between the security’s fair value and the present value ofexpected future cash flows.
We recognized net other-than-temporary impairment of $26.8 million on available-for-sale securities in the first quarter of 2010, due in part to deterioration in thecredit performance of certain securities resulting from the continued weakness in the housing market and high unemployment and our decision to sell certainother securities before recovery of the impairment amount.
15
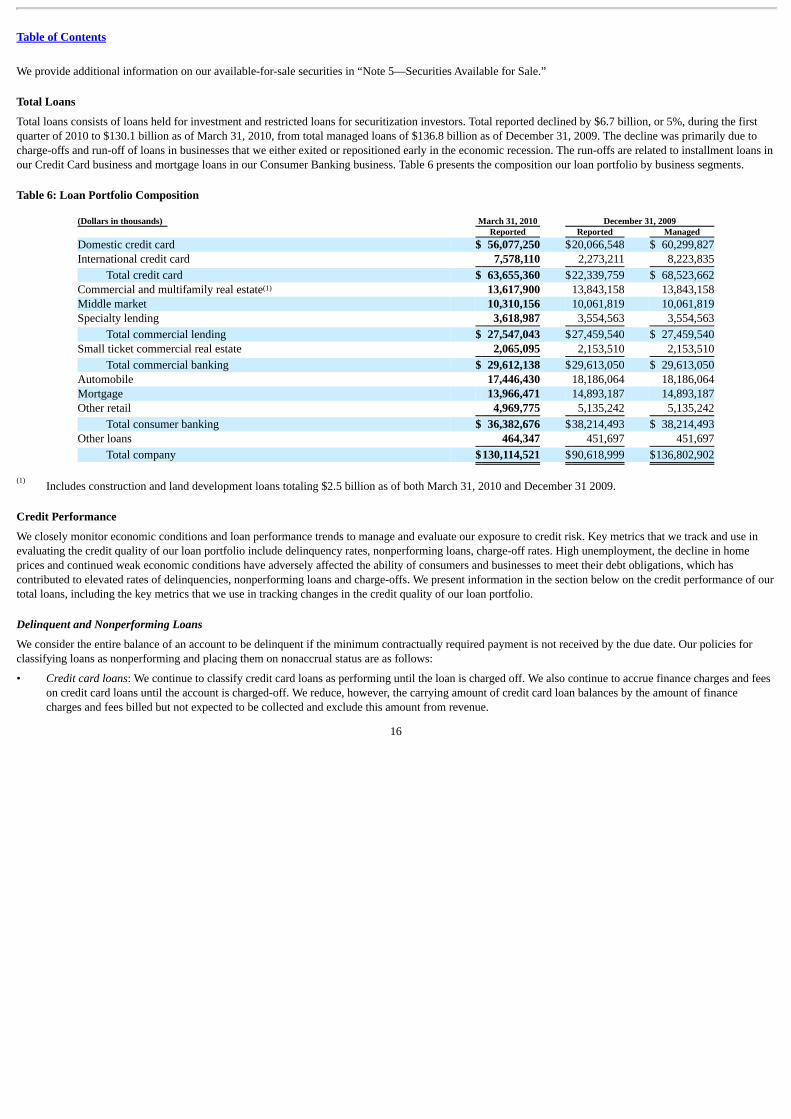
Table of Contents
We provide additional information on our available-for-sale securities in “Note 5—Securities Available for Sale.”
Total Loans
Total loans consists of loans held for investment and restricted loans for securitization investors. Total reported declined by $6.7 billion, or 5%, during the firstquarter of 2010 to $130.1 billion as of March 31, 2010, from total managed loans of $136.8 billion as of December 31, 2009. The decline was primarily due tocharge-offs and run-off of loans in businesses that we either exited or repositioned early in the economic recession. The run-offs are related to installment loans inour Credit Card business and mortgage loans in our Consumer Banking business. Table 6 presents the composition our loan portfolio by business segments.
Table 6: Loan Portfolio Composition
(Dollars in thousands) March 31, 2010 December 31, 2009 Reported Reported ManagedDomestic credit card $ 56,077,250 $20,066,548 $ 60,299,827International credit card 7,578,110 2,273,211 8,223,835
Total credit card $ 63,655,360 $22,339,759 $ 68,523,662Commercial and multifamily real estate 13,617,900 13,843,158 13,843,158Middle market 10,310,156 10,061,819 10,061,819Specialty lending 3,618,987 3,554,563 3,554,563
Total commercial lending $ 27,547,043 $27,459,540 $ 27,459,540Small ticket commercial real estate 2,065,095 2,153,510 2,153,510
Total commercial banking $ 29,612,138 $29,613,050 $ 29,613,050Automobile 17,446,430 18,186,064 18,186,064Mortgage 13,966,471 14,893,187 14,893,187Other retail 4,969,775 5,135,242 5,135,242
Total consumer banking $ 36,382,676 $38,214,493 $ 38,214,493Other loans 464,347 451,697 451,697
Total company $130,114,521 $90,618,999 $136,802,902
Includes construction and land development loans totaling $2.5 billion as of both March 31, 2010 and December 31 2009.
Credit Performance
We closely monitor economic conditions and loan performance trends to manage and evaluate our exposure to credit risk. Key metrics that we track and use inevaluating the credit quality of our loan portfolio include delinquency rates, nonperforming loans, charge-off rates. High unemployment, the decline in homeprices and continued weak economic conditions have adversely affected the ability of consumers and businesses to meet their debt obligations, which hascontributed to elevated rates of delinquencies, nonperforming loans and charge-offs. We present information in the section below on the credit performance of ourtotal loans, including the key metrics that we use in tracking changes in the credit quality of our loan portfolio.
Delinquent and Nonperforming Loans
We consider the entire balance of an account to be delinquent if the minimum contractually required payment is not received by the due date. Our policies forclassifying loans as nonperforming and placing them on nonaccrual status are as follows:
• Credit card loans: We continue to classify credit card loans as performing until the loan is charged off. We also continue to accrue finance charges and feeson credit card loans until the account is charged-off. We reduce, however, the carrying amount of credit card loan balances by the amount of financecharges and fees billed but not expected to be collected and exclude this amount from revenue.
16
(1)
(1)
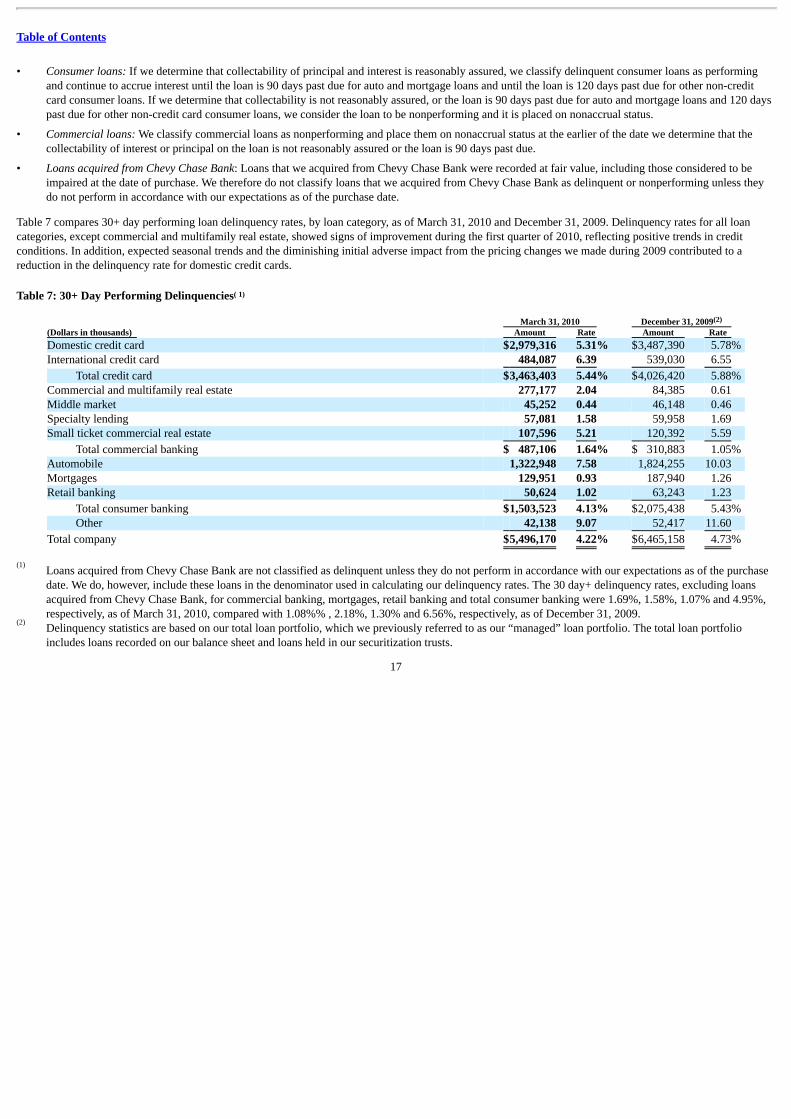
Table of Contents
• Consumer loans: If we determine that collectability of principal and interest is reasonably assured, we classify delinquent consumer loans as performingand continue to accrue interest until the loan is 90 days past due for auto and mortgage loans and until the loan is 120 days past due for other non-creditcard consumer loans. If we determine that collectability is not reasonably assured, or the loan is 90 days past due for auto and mortgage loans and 120 dayspast due for other non-credit card consumer loans, we consider the loan to be nonperforming and it is placed on nonaccrual status.
• Commercial loans: We classify commercial loans as nonperforming and place them on nonaccrual status at the earlier of the date we determine that thecollectability of interest or principal on the loan is not reasonably assured or the loan is 90 days past due.
• Loans acquired from Chevy Chase Bank: Loans that we acquired from Chevy Chase Bank were recorded at fair value, including those considered to beimpaired at the date of purchase. We therefore do not classify loans that we acquired from Chevy Chase Bank as delinquent or nonperforming unless theydo not perform in accordance with our expectations as of the purchase date.
Table 7 compares 30+ day performing loan delinquency rates, by loan category, as of March 31, 2010 and December 31, 2009. Delinquency rates for all loancategories, except commercial and multifamily real estate, showed signs of improvement during the first quarter of 2010, reflecting positive trends in creditconditions. In addition, expected seasonal trends and the diminishing initial adverse impact from the pricing changes we made during 2009 contributed to areduction in the delinquency rate for domestic credit cards.
Table 7: 30+ Day Performing Delinquencies
March 31, 2010 December 31, 2009 (Dollars in thousands) Amount Rate Amount Rate Domestic credit card $2,979,316 5.31% $3,487,390 5.78% International credit card 484,087 6.39 539,030 6.55
Total credit card $3,463,403 5.44% $4,026,420 5.88% Commercial and multifamily real estate 277,177 2.04 84,385 0.61 Middle market 45,252 0.44 46,148 0.46 Specialty lending 57,081 1.58 59,958 1.69 Small ticket commercial real estate 107,596 5.21 120,392 5.59
Total commercial banking $ 487,106 1.64% $ 310,883 1.05% Automobile 1,322,948 7.58 1,824,255 10.03 Mortgages 129,951 0.93 187,940 1.26 Retail banking 50,624 1.02 63,243 1.23
Total consumer banking $1,503,523 4.13% $2,075,438 5.43% Other 42,138 9.07 52,417 11.60
Total company $5,496,170 4.22% $6,465,158 4.73%
Loans acquired from Chevy Chase Bank are not classified as delinquent unless they do not perform in accordance with our expectations as of the purchasedate. We do, however, include these loans in the denominator used in calculating our delinquency rates. The 30 day+ delinquency rates, excluding loansacquired from Chevy Chase Bank, for commercial banking, mortgages, retail banking and total consumer banking were 1.69%, 1.58%, 1.07% and 4.95%,respectively, as of March 31, 2010, compared with 1.08%% , 2.18%, 1.30% and 6.56%, respectively, as of December 31, 2009.Delinquency statistics are based on our total loan portfolio, which we previously referred to as our “managed” loan portfolio. The total loan portfolioincludes loans recorded on our balance sheet and loans held in our securitization trusts.
17
( 1)
(2)
(1)
(2)
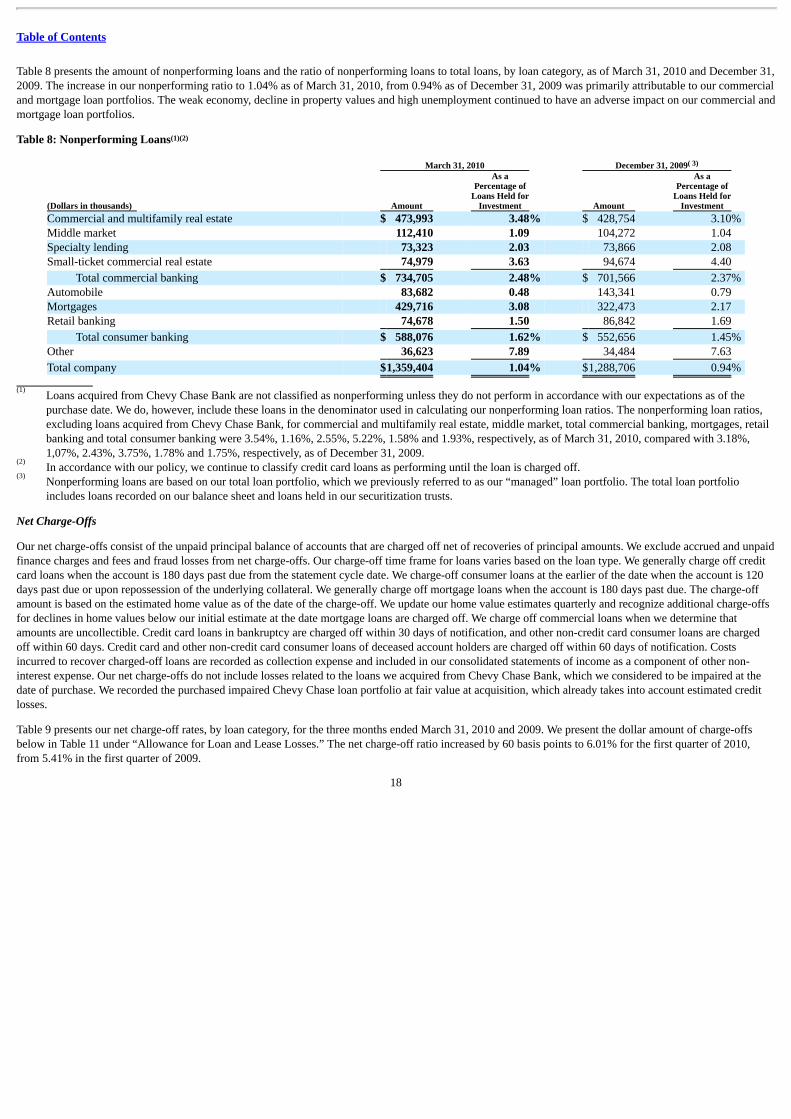
Table of Contents
Table 8 presents the amount of nonperforming loans and the ratio of nonperforming loans to total loans, by loan category, as of March 31, 2010 and December 31,2009. The increase in our nonperforming ratio to 1.04% as of March 31, 2010, from 0.94% as of December 31, 2009 was primarily attributable to our commercialand mortgage loan portfolios. The weak economy, decline in property values and high unemployment continued to have an adverse impact on our commercial andmortgage loan portfolios.
Table 8: Nonperforming Loans
March 31, 2010 December 31, 2009
(Dollars in thousands) Amount
As aPercentage of
Loans Held forInvestment Amount
As aPercentage of
Loans Held forInvestment
Commercial and multifamily real estate $ 473,993 3.48% $ 428,754 3.10% Middle market 112,410 1.09 104,272 1.04 Specialty lending 73,323 2.03 73,866 2.08 Small-ticket commercial real estate 74,979 3.63 94,674 4.40
Total commercial banking $ 734,705 2.48% $ 701,566 2.37% Automobile 83,682 0.48 143,341 0.79 Mortgages 429,716 3.08 322,473 2.17 Retail banking 74,678 1.50 86,842 1.69
Total consumer banking $ 588,076 1.62% $ 552,656 1.45% Other 36,623 7.89 34,484 7.63
Total company $1,359,404 1.04% $1,288,706 0.94%
Loans acquired from Chevy Chase Bank are not classified as nonperforming unless they do not perform in accordance with our expectations as of thepurchase date. We do, however, include these loans in the denominator used in calculating our nonperforming loan ratios. The nonperforming loan ratios,excluding loans acquired from Chevy Chase Bank, for commercial and multifamily real estate, middle market, total commercial banking, mortgages, retailbanking and total consumer banking were 3.54%, 1.16%, 2.55%, 5.22%, 1.58% and 1.93%, respectively, as of March 31, 2010, compared with 3.18%,1,07%, 2.43%, 3.75%, 1.78% and 1.75%, respectively, as of December 31, 2009.In accordance with our policy, we continue to classify credit card loans as performing until the loan is charged off.Nonperforming loans are based on our total loan portfolio, which we previously referred to as our “managed” loan portfolio. The total loan portfolioincludes loans recorded on our balance sheet and loans held in our securitization trusts.
Net Charge-Offs
Our net charge-offs consist of the unpaid principal balance of accounts that are charged off net of recoveries of principal amounts. We exclude accrued and unpaidfinance charges and fees and fraud losses from net charge-offs. Our charge-off time frame for loans varies based on the loan type. We generally charge off creditcard loans when the account is 180 days past due from the statement cycle date. We charge-off consumer loans at the earlier of the date when the account is 120days past due or upon repossession of the underlying collateral. We generally charge off mortgage loans when the account is 180 days past due. The charge-offamount is based on the estimated home value as of the date of the charge-off. We update our home value estimates quarterly and recognize additional charge-offsfor declines in home values below our initial estimate at the date mortgage loans are charged off. We charge off commercial loans when we determine thatamounts are uncollectible. Credit card loans in bankruptcy are charged off within 30 days of notification, and other non-credit card consumer loans are chargedoff within 60 days. Credit card and other non-credit card consumer loans of deceased account holders are charged off within 60 days of notification. Costsincurred to recover charged-off loans are recorded as collection expense and included in our consolidated statements of income as a component of other non-interest expense. Our net charge-offs do not include losses related to the loans we acquired from Chevy Chase Bank, which we considered to be impaired at thedate of purchase. We recorded the purchased impaired Chevy Chase loan portfolio at fair value at acquisition, which already takes into account estimated creditlosses.
Table 9 presents our net charge-off rates, by loan category, for the three months ended March 31, 2010 and 2009. We present the dollar amount of charge-offsbelow in Table 11 under “Allowance for Loan and Lease Losses.” The net charge-off ratio increased by 60 basis points to 6.01% for the first quarter of 2010,from 5.41% in the first quarter of 2009.
18
(1)(2)
( 3)
(1)
(2)
(3)
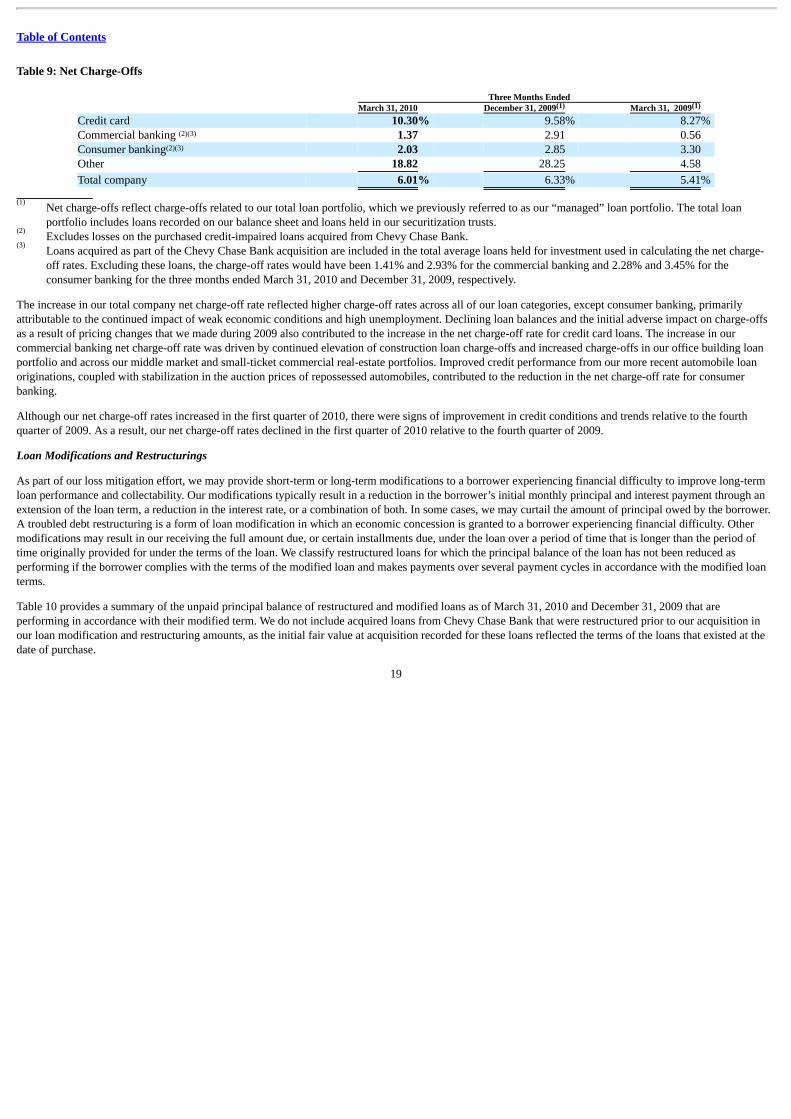
Table of Contents
Table 9: Net Charge-Offs
Three Months Ended March 31, 2010 December 31, 2009 March 31, 2009 Credit card 10.30% 9.58% 8.27% Commercial banking 1.37 2.91 0.56 Consumer banking 2.03 2.85 3.30 Other 18.82 28.25 4.58
Total company 6.01% 6.33% 5.41%
Net charge-offs reflect charge-offs related to our total loan portfolio, which we previously referred to as our “managed” loan portfolio. The total loanportfolio includes loans recorded on our balance sheet and loans held in our securitization trusts.Excludes losses on the purchased credit-impaired loans acquired from Chevy Chase Bank.Loans acquired as part of the Chevy Chase Bank acquisition are included in the total average loans held for investment used in calculating the net charge-off rates. Excluding these loans, the charge-off rates would have been 1.41% and 2.93% for the commercial banking and 2.28% and 3.45% for theconsumer banking for the three months ended March 31, 2010 and December 31, 2009, respectively.
The increase in our total company net charge-off rate reflected higher charge-off rates across all of our loan categories, except consumer banking, primarilyattributable to the continued impact of weak economic conditions and high unemployment. Declining loan balances and the initial adverse impact on charge-offsas a result of pricing changes that we made during 2009 also contributed to the increase in the net charge-off rate for credit card loans. The increase in ourcommercial banking net charge-off rate was driven by continued elevation of construction loan charge-offs and increased charge-offs in our office building loanportfolio and across our middle market and small-ticket commercial real-estate portfolios. Improved credit performance from our more recent automobile loanoriginations, coupled with stabilization in the auction prices of repossessed automobiles, contributed to the reduction in the net charge-off rate for consumerbanking.
Although our net charge-off rates increased in the first quarter of 2010, there were signs of improvement in credit conditions and trends relative to the fourthquarter of 2009. As a result, our net charge-off rates declined in the first quarter of 2010 relative to the fourth quarter of 2009.
Loan Modifications and Restructurings
As part of our loss mitigation effort, we may provide short-term or long-term modifications to a borrower experiencing financial difficulty to improve long-termloan performance and collectability. Our modifications typically result in a reduction in the borrower’s initial monthly principal and interest payment through anextension of the loan term, a reduction in the interest rate, or a combination of both. In some cases, we may curtail the amount of principal owed by the borrower.A troubled debt restructuring is a form of loan modification in which an economic concession is granted to a borrower experiencing financial difficulty. Othermodifications may result in our receiving the full amount due, or certain installments due, under the loan over a period of time that is longer than the period oftime originally provided for under the terms of the loan. We classify restructured loans for which the principal balance of the loan has not been reduced asperforming if the borrower complies with the terms of the modified loan and makes payments over several payment cycles in accordance with the modified loanterms.
Table 10 provides a summary of the unpaid principal balance of restructured and modified loans as of March 31, 2010 and December 31, 2009 that areperforming in accordance with their modified term. We do not include acquired loans from Chevy Chase Bank that were restructured prior to our acquisition inour loan modification and restructuring amounts, as the initial fair value at acquisition recorded for these loans reflected the terms of the loans that existed at thedate of purchase.
19
(1) (1)
(2)(3)
(2)(3)
(1)
(2)
(3)
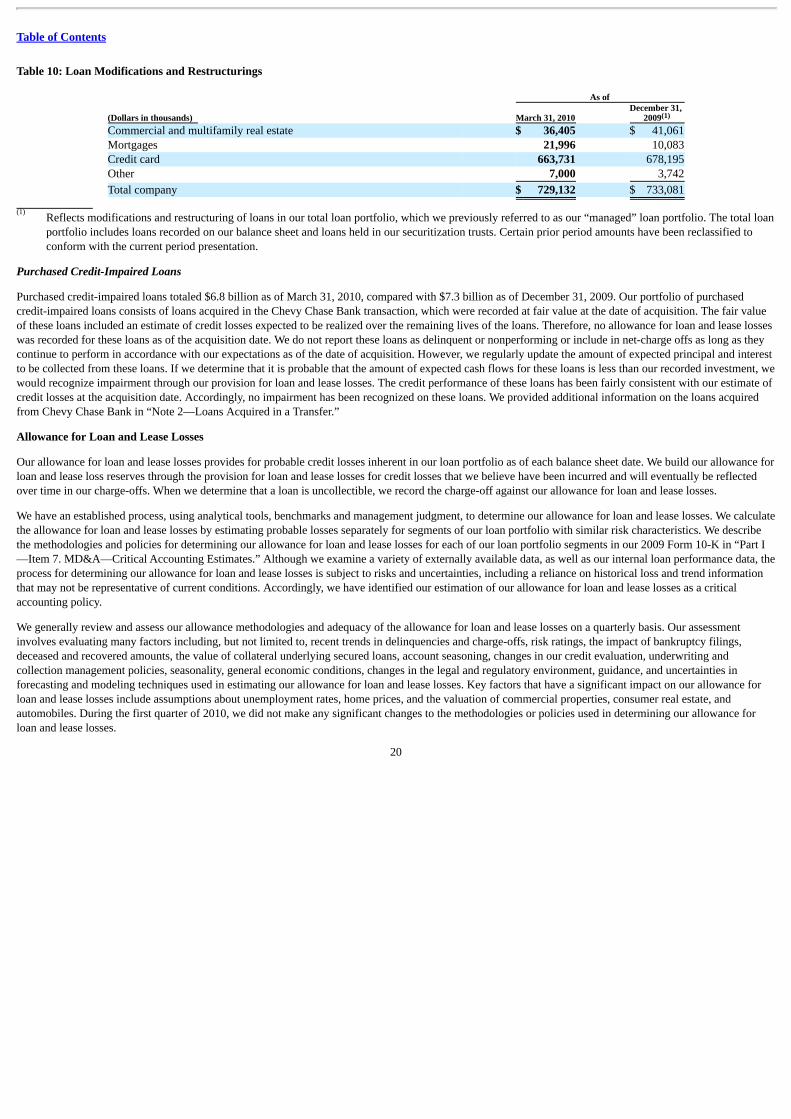
Table of Contents
Table 10: Loan Modifications and Restructurings
As of
(Dollars in thousands) March 31, 2010 December 31,
2009Commercial and multifamily real estate $ 36,405 $ 41,061Mortgages 21,996 10,083Credit card 663,731 678,195Other 7,000 3,742
Total company $ 729,132 $ 733,081
Reflects modifications and restructuring of loans in our total loan portfolio, which we previously referred to as our “managed” loan portfolio. The total loanportfolio includes loans recorded on our balance sheet and loans held in our securitization trusts. Certain prior period amounts have been reclassified toconform with the current period presentation.
Purchased Credit-Impaired Loans
Purchased credit-impaired loans totaled $6.8 billion as of March 31, 2010, compared with $7.3 billion as of December 31, 2009. Our portfolio of purchasedcredit-impaired loans consists of loans acquired in the Chevy Chase Bank transaction, which were recorded at fair value at the date of acquisition. The fair valueof these loans included an estimate of credit losses expected to be realized over the remaining lives of the loans. Therefore, no allowance for loan and lease losseswas recorded for these loans as of the acquisition date. We do not report these loans as delinquent or nonperforming or include in net-charge offs as long as theycontinue to perform in accordance with our expectations as of the date of acquisition. However, we regularly update the amount of expected principal and interestto be collected from these loans. If we determine that it is probable that the amount of expected cash flows for these loans is less than our recorded investment, wewould recognize impairment through our provision for loan and lease losses. The credit performance of these loans has been fairly consistent with our estimate ofcredit losses at the acquisition date. Accordingly, no impairment has been recognized on these loans. We provided additional information on the loans acquiredfrom Chevy Chase Bank in “Note 2—Loans Acquired in a Transfer.”
Allowance for Loan and Lease Losses
Our allowance for loan and lease losses provides for probable credit losses inherent in our loan portfolio as of each balance sheet date. We build our allowance forloan and lease loss reserves through the provision for loan and lease losses for credit losses that we believe have been incurred and will eventually be reflectedover time in our charge-offs. When we determine that a loan is uncollectible, we record the charge-off against our allowance for loan and lease losses.
We have an established process, using analytical tools, benchmarks and management judgment, to determine our allowance for loan and lease losses. We calculatethe allowance for loan and lease losses by estimating probable losses separately for segments of our loan portfolio with similar risk characteristics. We describethe methodologies and policies for determining our allowance for loan and lease losses for each of our loan portfolio segments in our 2009 Form 10-K in “Part I—Item 7. MD&A—Critical Accounting Estimates.” Although we examine a variety of externally available data, as well as our internal loan performance data, theprocess for determining our allowance for loan and lease losses is subject to risks and uncertainties, including a reliance on historical loss and trend informationthat may not be representative of current conditions. Accordingly, we have identified our estimation of our allowance for loan and lease losses as a criticalaccounting policy.
We generally review and assess our allowance methodologies and adequacy of the allowance for loan and lease losses on a quarterly basis. Our assessmentinvolves evaluating many factors including, but not limited to, recent trends in delinquencies and charge-offs, risk ratings, the impact of bankruptcy filings,deceased and recovered amounts, the value of collateral underlying secured loans, account seasoning, changes in our credit evaluation, underwriting andcollection management policies, seasonality, general economic conditions, changes in the legal and regulatory environment, guidance, and uncertainties inforecasting and modeling techniques used in estimating our allowance for loan and lease losses. Key factors that have a significant impact on our allowance forloan and lease losses include assumptions about unemployment rates, home prices, and the valuation of commercial properties, consumer real estate, andautomobiles. During the first quarter of 2010, we did not make any significant changes to the methodologies or policies used in determining our allowance forloan and lease losses.
20
(1)
(1)
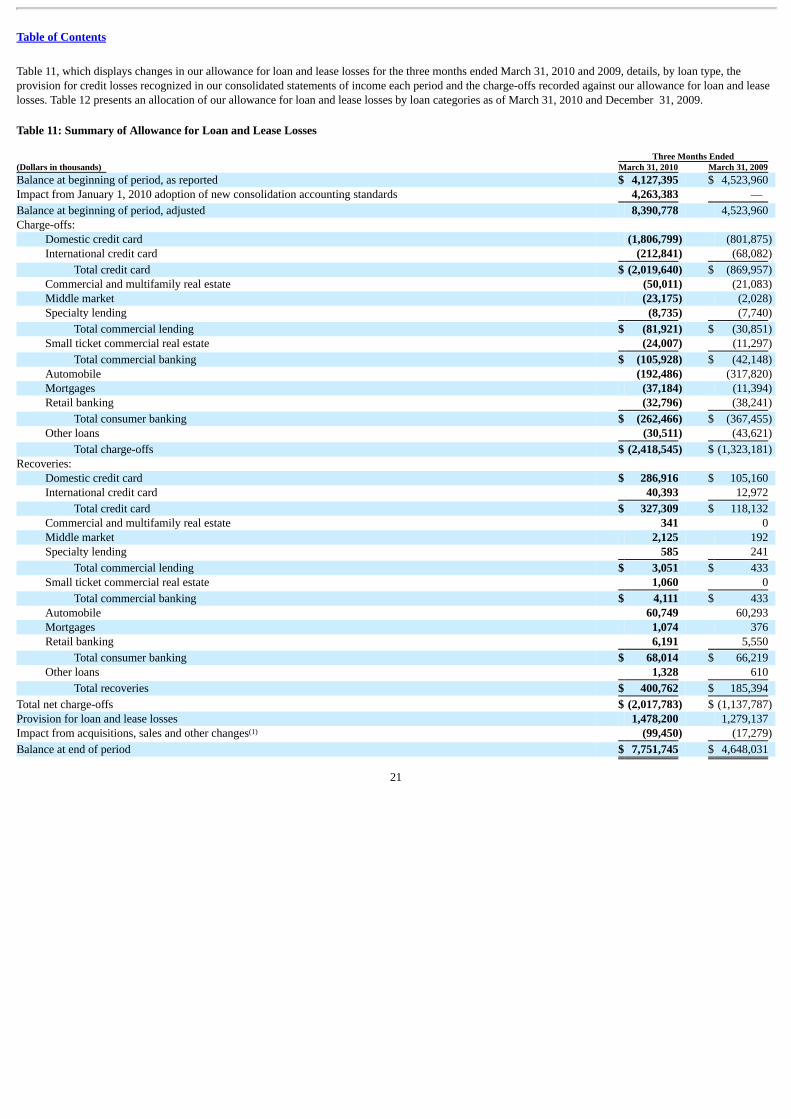
Table of Contents
Table 11, which displays changes in our allowance for loan and lease losses for the three months ended March 31, 2010 and 2009, details, by loan type, theprovision for credit losses recognized in our consolidated statements of income each period and the charge-offs recorded against our allowance for loan and leaselosses. Table 12 presents an allocation of our allowance for loan and lease losses by loan categories as of March 31, 2010 and December 31, 2009.
Table 11: Summary of Allowance for Loan and Lease Losses Three Months Ended (Dollars in thousands) March 31, 2010 March 31, 2009 Balance at beginning of period, as reported $ 4,127,395 $ 4,523,960 Impact from January 1, 2010 adoption of new consolidation accounting standards 4,263,383 —
Balance at beginning of period, adjusted 8,390,778 4,523,960 Charge-offs:
Domestic credit card (1,806,799) (801,875) International credit card (212,841) (68,082)
Total credit card $ (2,019,640) $ (869,957) Commercial and multifamily real estate (50,011) (21,083) Middle market (23,175) (2,028) Specialty lending (8,735) (7,740)
Total commercial lending $ (81,921) $ (30,851) Small ticket commercial real estate (24,007) (11,297)
Total commercial banking $ (105,928) $ (42,148) Automobile (192,486) (317,820) Mortgages (37,184) (11,394) Retail banking (32,796) (38,241)
Total consumer banking $ (262,466) $ (367,455) Other loans (30,511) (43,621)
Total charge-offs $ (2,418,545) $ (1,323,181) Recoveries:
Domestic credit card $ 286,916 $ 105,160 International credit card 40,393 12,972
Total credit card $ 327,309 $ 118,132 Commercial and multifamily real estate 341 0 Middle market 2,125 192 Specialty lending 585 241
Total commercial lending $ 3,051 $ 433 Small ticket commercial real estate 1,060 0
Total commercial banking $ 4,111 $ 433 Automobile 60,749 60,293 Mortgages 1,074 376 Retail banking 6,191 5,550
Total consumer banking $ 68,014 $ 66,219 Other loans 1,328 610
Total recoveries $ 400,762 $ 185,394
Total net charge-offs $ (2,017,783) $ (1,137,787) Provision for loan and lease losses 1,478,200 1,279,137 Impact from acquisitions, sales and other changes (99,450) (17,279)
Balance at end of period $ 7,751,745 $ 4,648,031
21
(1)
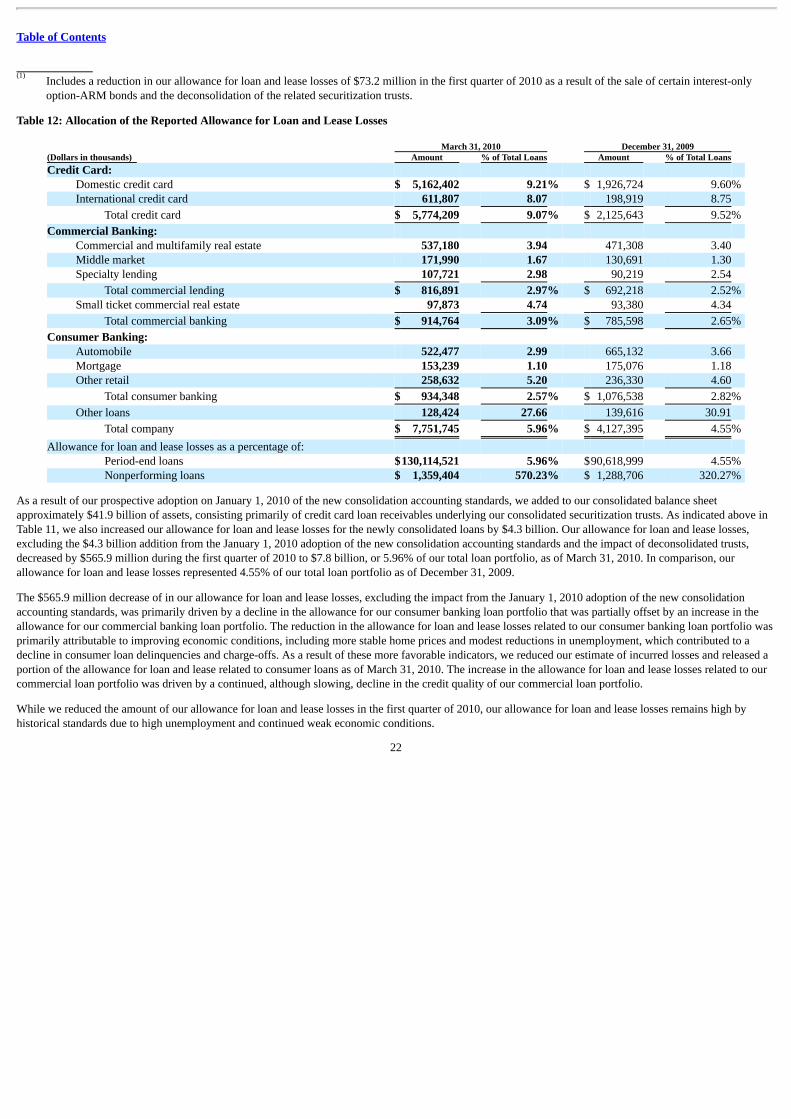
Table of Contents
Includes a reduction in our allowance for loan and lease losses of $73.2 million in the first quarter of 2010 as a result of the sale of certain interest-onlyoption-ARM bonds and the deconsolidation of the related securitization trusts.
Table 12: Allocation of the Reported Allowance for Loan and Lease Losses
March 31, 2010 December 31, 2009 (Dollars in thousands) Amount % of Total Loans Amount % of Total Loans Credit Card:
Domestic credit card $ 5,162,402 9.21% $ 1,926,724 9.60% International credit card 611,807 8.07 198,919 8.75
Total credit card $ 5,774,209 9.07% $ 2,125,643 9.52%
Commercial Banking: Commercial and multifamily real estate 537,180 3.94 471,308 3.40 Middle market 171,990 1.67 130,691 1.30 Specialty lending 107,721 2.98 90,219 2.54
Total commercial lending $ 816,891 2.97% $ 692,218 2.52% Small ticket commercial real estate 97,873 4.74 93,380 4.34
Total commercial banking $ 914,764 3.09% $ 785,598 2.65%
Consumer Banking: Automobile 522,477 2.99 665,132 3.66 Mortgage 153,239 1.10 175,076 1.18 Other retail 258,632 5.20 236,330 4.60
Total consumer banking $ 934,348 2.57% $ 1,076,538 2.82%
Other loans 128,424 27.66 139,616 30.91
Total company $ 7,751,745 5.96% $ 4,127,395 4.55%
Allowance for loan and lease losses as a percentage of: Period-end loans $130,114,521 5.96% $90,618,999 4.55% Nonperforming loans $ 1,359,404 570.23% $ 1,288,706 320.27%
As a result of our prospective adoption on January 1, 2010 of the new consolidation accounting standards, we added to our consolidated balance sheetapproximately $41.9 billion of assets, consisting primarily of credit card loan receivables underlying our consolidated securitization trusts. As indicated above inTable 11, we also increased our allowance for loan and lease losses for the newly consolidated loans by $4.3 billion. Our allowance for loan and lease losses,excluding the $4.3 billion addition from the January 1, 2010 adoption of the new consolidation accounting standards and the impact of deconsolidated trusts,decreased by $565.9 million during the first quarter of 2010 to $7.8 billion, or 5.96% of our total loan portfolio, as of March 31, 2010. In comparison, ourallowance for loan and lease losses represented 4.55% of our total loan portfolio as of December 31, 2009.
The $565.9 million decrease of in our allowance for loan and lease losses, excluding the impact from the January 1, 2010 adoption of the new consolidationaccounting standards, was primarily driven by a decline in the allowance for our consumer banking loan portfolio that was partially offset by an increase in theallowance for our commercial banking loan portfolio. The reduction in the allowance for loan and lease losses related to our consumer banking loan portfolio wasprimarily attributable to improving economic conditions, including more stable home prices and modest reductions in unemployment, which contributed to adecline in consumer loan delinquencies and charge-offs. As a result of these more favorable indicators, we reduced our estimate of incurred losses and released aportion of the allowance for loan and lease related to consumer loans as of March 31, 2010. The increase in the allowance for loan and lease losses related to ourcommercial loan portfolio was driven by a continued, although slowing, decline in the credit quality of our commercial loan portfolio.
While we reduced the amount of our allowance for loan and lease losses in the first quarter of 2010, our allowance for loan and lease losses remains high byhistorical standards due to high unemployment and continued weak economic conditions.
22
(1)
Table of Contents
Deposits
Our deposits have become our largest source of funding our operations and asset growth. Total deposits increased by $2.0 billion in the first quarter of 2010 to$117.8 billion as of March 31, 2010. The increase in deposits was primarily driven by an increase of $5.2 billion in savings account and money market deposits,which was partially offset by a decrease of $3.3 billion in other consumer time deposits and certificate of deposits $100,000 or more, reflecting our shift to morerelationship driven, lower cost liquid savings and transaction accounts. We provide additional information on deposits, including the composition of our deposits,average outstanding balances, interest expense and yields, below in “Liquidity and Funding.”
Senior and Subordinated Notes and Other Borrowings
Senior and subordinated notes and other borrowings totaled $14.8 billion as of March 31, 2010, down from $17.0 billion as of December 31, 2009. The $2.2billion decrease was primarily attributable to a reduction in Federal Home Loan Bank (“FHLB”) advances. Because of the decrease in our loan portfolio duringthe first quarter of 2010, our funding needs were lower which provided us with an opportunity to reduce outstanding borrowings. We provide additionalinformation on our borrowings in “Note 9—Deposits and Borrowings.”
Securitized Debt Obligations
Borrowings owed to securitization investors increased to $37.8 billion as of March 31, 2010, from $4.0 billion as of December 31, 2009. The increase wasattributable to our January 1, 2010 adoption of the new consolidation accounting standards, which resulted in our recording on our balance sheet as of January 1,2010, debt issued to third-party investors by securitization trusts that we were required to consolidate totaling $44.3 billion.
Potential Mortgage Representation and Warranty Liabilities
As part of broader acquisitions, the Company acquired three subsidiaries that originated residential mortgage loans and sold them to various purchasers, includingsecuritization trusts. These subsidiaries are Capital One Home Loans, which was acquired in February 2005; GreenPoint, which was acquired in December 2006as part of the North Fork acquisition; and Chevy Chase Bank, which was acquired in February 2009 and subsequently merged into CONA. In connection withtheir sales of mortgage loans, the subsidiaries entered into agreements containing representations and warranties about, among other things, the mortgage loansand the origination process. Each subsidiary may be required to repurchase mortgage loans in the event of certain breaches of these representations andwarranties. In the event of a repurchase, the subsidiary is typically required to pay the then unpaid principal balance of the loan together with interest and certainexpenses (including, in certain cases, legal costs incurred by the purchaser and/or others), and the subsidiary then recovers the underlying collateral. Eachsubsidiary is exposed to any losses on the repurchased loans after giving effect to recoveries on the collateral. Each subsidiary may also be required to indemnifycertain purchasers and others against losses they incur in the event of breaches of representations and warranties and in various other circumstances, and theamount of such losses could exceed the repurchase amount of the related loans. These subsidiaries, in total, originated and sold an aggregate of approximately$121.9 billion original principal balance of mortgage loans between 2005 and 2008, the years with respect to which most of the repurchase requests and otherclaims relate. Some of this original principal balance has been repaid, but we believe a significant amount of it remains outstanding.
At March 31, 2010, the subsidiaries had open repurchase requests relating to approximately $1.2 billion original principal balance of mortgage loans (up from$699 million at March 31, 2009 and $966 million at December 31, 2009). The Company considers open requests to be requests with respect to mortgage loansreceived within the past 24 months that are in the process of being paid, are under review, or have been denied by the subsidiary but not rescinded by the partyrequesting repurchase, as well as specifically identified mortgage loans currently subject to actual or threatened litigation. In addition to the foregoing loan-specific open repurchase requests, GreenPoint is also a defendant in a lawsuit seeking, among other things, to require it to repurchase an entire portfolio ofapproximately 30,000 mortgage loans with an aggregate principal balance of $1.8 billion within a certain securitization trust based on alleged breaches ofrepresentations and warranties relating to a limited sampling of loans in the portfolio. See discussion within the Litigation section below for a discussion relatedto U.S. Bank. GreenPoint has also received requests for indemnification in connection with a number of lawsuits in which GreenPoint is not a party, includingboth representation and warranty litigation and securities class actions brought on behalf of investors in securitization trusts that in the aggregate hold a
23
Table of Contents
significant principal balance of mortgage loans for which GreenPoint was identified as the originator. The Company believes that a significant number ofmortgage loans at issue in the litigations referred to above as well as a significant number of mortgage loans sold by the subsidiaries as to which no repurchase orindemnification requests have been received are currently delinquent or already foreclosed on.
The Company has established reserves in its consolidated financial statements for inherent losses that are considered to be both probable and estimable related tothe mortgage loans sold by each subsidiary. The adequacy of each reserve is evaluated on a quarterly basis and changes in the reserves are reported in non-interestexpense. Factors considered in the evaluation process for establishing the reserves include identity of counterparty, amount of open repurchase requests, currentlevel of loan losses, estimated success rate of claimants, estimated recoveries by the subsidiary on the underlying collateral, and whether there is actual orthreatened litigation. For counterparties other than actual or threatened litigants, factors considered in the evaluation process also include an estimated amount ofprobable repurchase requests to be received over the next 12 months based on the historical relationship between mortgage loan performance and repurchaserequests and the estimated level of future mortgage loan performance. The Company expects that both the delinquency rates on subsidiary-originated mortgageloans and the severity of losses on collateral recoveries will continue to be high, but the reserve setting process does not include an attempt to predict lifetimelosses on the loans. The reserves also do not include amounts for the portfolio-wide repurchase claim at issue in the U.S. Bank litigation or for theindemnification requests with respect to securities class actions, in each case as referred to above, because neither exposure, if any, is currently considered to beboth probable and estimable. The reserves do include amounts for the loan-by-loan theory of recovery alleged in the U.S. Bank litigation, in the indemnificationrequests with respect to third-party representation and warranty litigation, and in various other actual or threatened litigation matters
The adequacy of the reserves and the ultimate amount of losses incurred will depend on, among other things, the actual future mortgage loan performance, theactual level of future repurchase and indemnification requests, the actual success rates of claimants, developments in litigation, actual recoveries on the collateral,and macroeconomic conditions (including unemployment levels and housing prices).
At March 31, 2010, the aggregate reserve for all three subsidiaries was $454 million, compared to $238 million at December 31, 2009. The $216 million changein the reserve from December 31, 2009 was the result of $8 million in repurchase claims settlements in the quarter that were applied against the reserve and anexpense of $224 million resulting primarily from updated estimates related to actual and threatened litigation. Due to the uncertainties discussed above, theCompany cannot reasonably estimate the total amount of losses that will actually be incurred as a result of each subsidiary’s repurchase and indemnificationobligations, and there can be no assurance that the Company’s current reserves will be adequate or that the total amount of losses incurred will not have a materialadverse effect upon the Company’s financial condition or results of operations. We provide additional information on the representation and warranty andlitigation claims related to GreenPoint in “Note 14—Commitments, Contingencies and Guarantees.” IX. BUSINESS SEGMENT FINANCIAL PERFORMANCE During the third quarter of 2009, we realigned our business segment reporting structure based on changes in how management evaluates financial performance.As a result of this change, we evaluate our financial performance and report our results through three operating segments. We have recast prior period segmentresults to reflect this change. Our three segments consist of the following: Credit Card, Commercial Banking and Consumer Banking.
• Credit Card: Consists of our domestic consumer and small business card lending, domestic national small business lending, national closed end installmentlending and the international card lending businesses in Canada and the United Kingdom.
• Commercial Banking: Consists of our lending, deposit gathering and treasury management services to commercial real estate and middle market customers.Our Commercial Banking business results also include the results of a national portfolio of small ticket commercial real-estate loans that are in run-offmode.
• Consumer Banking: Consists of our branch-based lending and deposit gathering activities for small business customers, as well as branch-based consumerdeposit gathering and lending activities, national deposit gathering, national automobile lending, consumer mortgage lending and servicing activities.
24
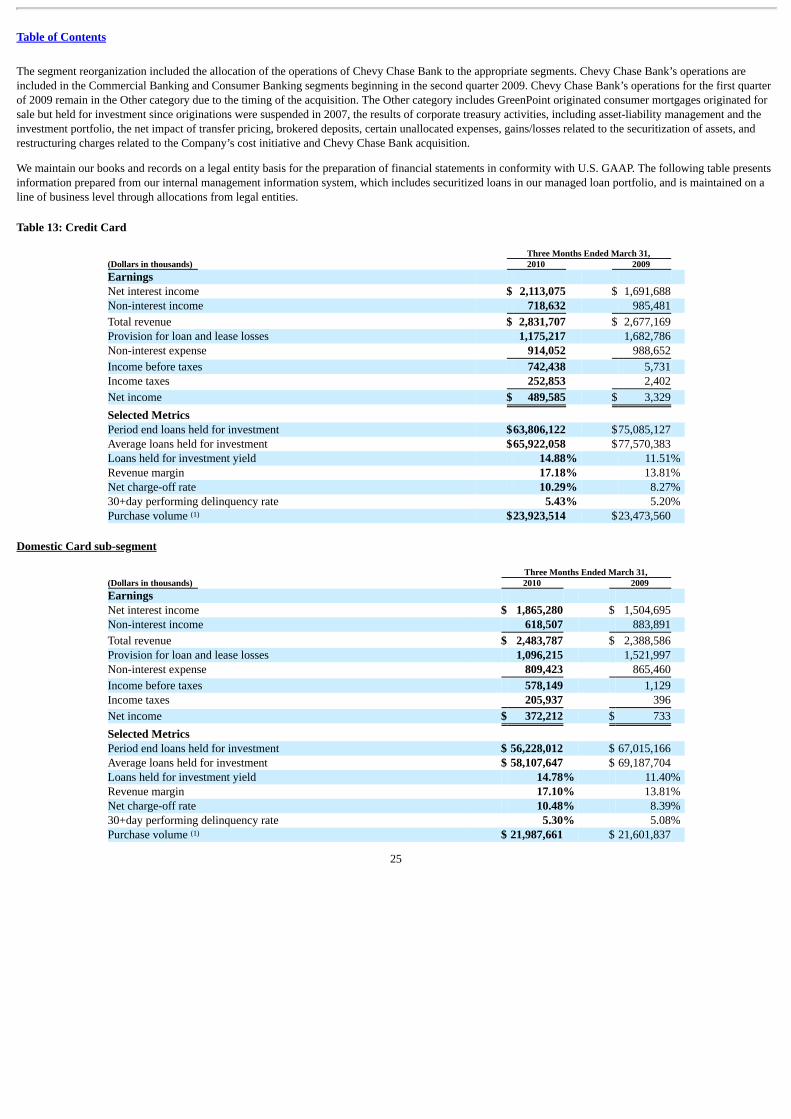
Table of Contents
The segment reorganization included the allocation of the operations of Chevy Chase Bank to the appropriate segments. Chevy Chase Bank’s operations areincluded in the Commercial Banking and Consumer Banking segments beginning in the second quarter 2009. Chevy Chase Bank’s operations for the first quarterof 2009 remain in the Other category due to the timing of the acquisition. The Other category includes GreenPoint originated consumer mortgages originated forsale but held for investment since originations were suspended in 2007, the results of corporate treasury activities, including asset-liability management and theinvestment portfolio, the net impact of transfer pricing, brokered deposits, certain unallocated expenses, gains/losses related to the securitization of assets, andrestructuring charges related to the Company’s cost initiative and Chevy Chase Bank acquisition.
We maintain our books and records on a legal entity basis for the preparation of financial statements in conformity with U.S. GAAP. The following table presentsinformation prepared from our internal management information system, which includes securitized loans in our managed loan portfolio, and is maintained on aline of business level through allocations from legal entities.
Table 13: Credit Card
Three Months Ended March 31, (Dollars in thousands) 2010 2009 Earnings Net interest income $ 2,113,075 $ 1,691,688 Non-interest income 718,632 985,481
Total revenue $ 2,831,707 $ 2,677,169 Provision for loan and lease losses 1,175,217 1,682,786 Non-interest expense 914,052 988,652
Income before taxes 742,438 5,731 Income taxes 252,853 2,402
Net income $ 489,585 $ 3,329
Selected Metrics Period end loans held for investment $63,806,122 $75,085,127 Average loans held for investment $65,922,058 $77,570,383 Loans held for investment yield 14.88% 11.51% Revenue margin 17.18% 13.81% Net charge-off rate 10.29% 8.27% 30+day performing delinquency rate 5.43% 5.20% Purchase volume $23,923,514 $23,473,560
Domestic Card sub-segment
Three Months Ended March 31, (Dollars in thousands) 2010 2009 Earnings Net interest income $ 1,865,280 $ 1,504,695 Non-interest income 618,507 883,891
Total revenue $ 2,483,787 $ 2,388,586 Provision for loan and lease losses 1,096,215 1,521,997 Non-interest expense 809,423 865,460
Income before taxes 578,149 1,129 Income taxes 205,937 396
Net income $ 372,212 $ 733
Selected Metrics Period end loans held for investment $ 56,228,012 $ 67,015,166 Average loans held for investment $ 58,107,647 $ 69,187,704 Loans held for investment yield 14.78% 11.40% Revenue margin 17.10% 13.81% Net charge-off rate 10.48% 8.39% 30+day performing delinquency rate 5.30% 5.08% Purchase volume $ 21,987,661 $ 21,601,837
25
(1)
(1)
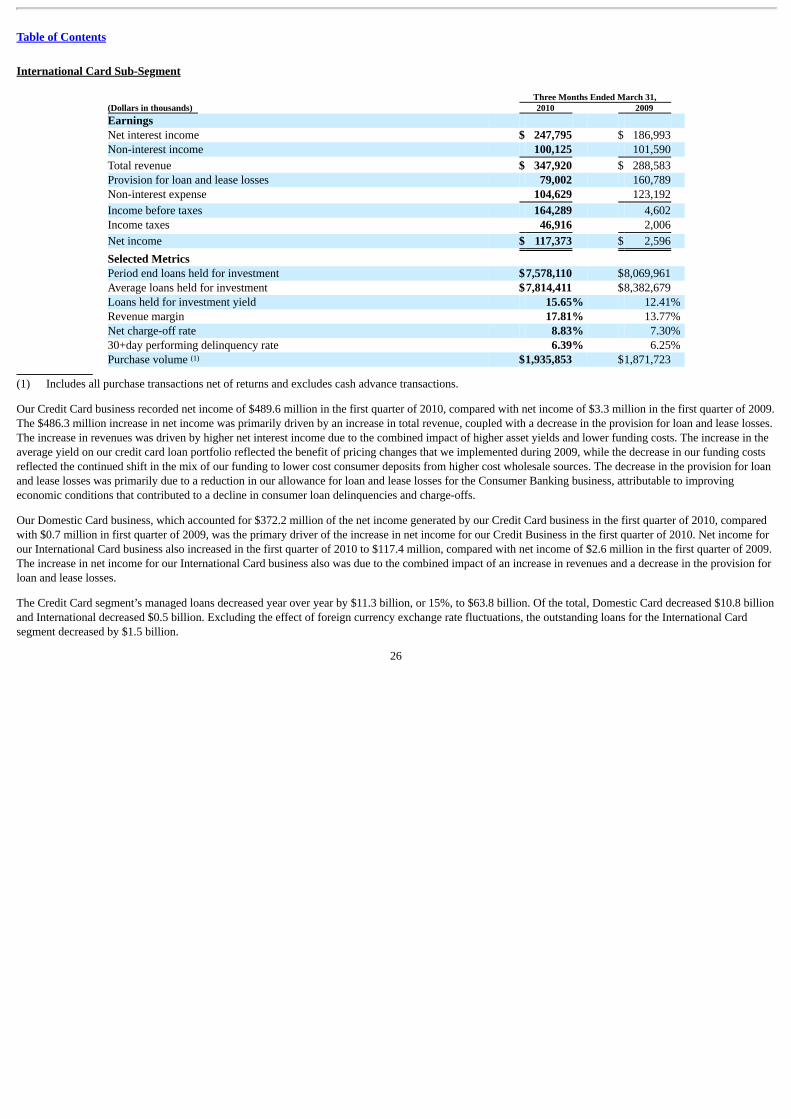
Table of Contents
International Card Sub-Segment
Three Months Ended March 31, (Dollars in thousands) 2010 2009 Earnings Net interest income $ 247,795 $ 186,993 Non-interest income 100,125 101,590
Total revenue $ 347,920 $ 288,583 Provision for loan and lease losses 79,002 160,789 Non-interest expense 104,629 123,192
Income before taxes 164,289 4,602 Income taxes 46,916 2,006
Net income $ 117,373 $ 2,596
Selected Metrics Period end loans held for investment $7,578,110 $8,069,961 Average loans held for investment $7,814,411 $8,382,679 Loans held for investment yield 15.65% 12.41% Revenue margin 17.81% 13.77% Net charge-off rate 8.83% 7.30% 30+day performing delinquency rate 6.39% 6.25% Purchase volume $1,935,853 $1,871,723
(1) Includes all purchase transactions net of returns and excludes cash advance transactions.
Our Credit Card business recorded net income of $489.6 million in the first quarter of 2010, compared with net income of $3.3 million in the first quarter of 2009.The $486.3 million increase in net income was primarily driven by an increase in total revenue, coupled with a decrease in the provision for loan and lease losses.The increase in revenues was driven by higher net interest income due to the combined impact of higher asset yields and lower funding costs. The increase in theaverage yield on our credit card loan portfolio reflected the benefit of pricing changes that we implemented during 2009, while the decrease in our funding costsreflected the continued shift in the mix of our funding to lower cost consumer deposits from higher cost wholesale sources. The decrease in the provision for loanand lease losses was primarily due to a reduction in our allowance for loan and lease losses for the Consumer Banking business, attributable to improvingeconomic conditions that contributed to a decline in consumer loan delinquencies and charge-offs.
Our Domestic Card business, which accounted for $372.2 million of the net income generated by our Credit Card business in the first quarter of 2010, comparedwith $0.7 million in first quarter of 2009, was the primary driver of the increase in net income for our Credit Business in the first quarter of 2010. Net income forour International Card business also increased in the first quarter of 2010 to $117.4 million, compared with net income of $2.6 million in the first quarter of 2009.The increase in net income for our International Card business also was due to the combined impact of an increase in revenues and a decrease in the provision forloan and lease losses.
The Credit Card segment’s managed loans decreased year over year by $11.3 billion, or 15%, to $63.8 billion. Of the total, Domestic Card decreased $10.8 billionand International decreased $0.5 billion. Excluding the effect of foreign currency exchange rate fluctuations, the outstanding loans for the International Cardsegment decreased by $1.5 billion.
26
(1)
Table of Contents
The British pound sterling appreciated 6% against the U.S. dollar from March 31, 2009 to March 31, 2010, while the Canadian dollar appreciated 24%.
As noted above, the Domestic Card loan portfolio decreased by $10.8 billion, or 16%, ending the quarter at $56.2 billion. The marketing cut backs during 2009,the high level of charge-offs, as well as the general de-leveraging of the consumer caused the decrease. In addition, as has been the case in previous quarters, theclosed-end installment loan business is in run off and contributed 40% of the decrease. Despite declining loan balances, purchase volume increased in the firstquarter of 2010 by $0.4 billion, or 2%, over the first quarter of 2009.
The International Card loan portfolio decreased by $0.5 billion or 6% to $7.6 billion. Excluding the impact of foreign currency exchange rate fluctuations, theInternational Card portfolio decreased by $1.5 billion. As with Domestic Card, both our U.K. and Canadian businesses significantly decreased marketingexpenditures in 2009. This decrease was a primary driver of the decrease in the loan portfolio; however, purchase volume increased in the first quarter of 2010over the first quarter of 2009 by $64.1 million, or 3%, to $1.9 billion.
Total revenue of $2.8 billion in the first quarter of 2010 for the Credit Card segment was up $154.5 million, or 6%, over the first quarter of 2009. Net interestincome was $421.4 million or 25% higher, while non-interest income was $266.8 million or 27% lower.
Total revenue of $2.5 billion in the first quarter of 2010 for the Domestic Card segment was up $95.2 million, or 4%, over the first quarter of 2009. Net interestincome increased $360.6 million or 24% to $1.9 billion. Improved margins resulted from 2009 pricing actions and a lower portion of the portfolio having teaserpricing as our origination levels were low throughout 2009. Non-interest income was down $265.4 million or 30% to $618.5 million. The lower number of loanaccounts on file along with the partial-quarter impact of the implementation of the Credit CARD Act was the cause of the declining non-interest income
For International, total revenue increased $59.3 million or 21% to $347.9 million from the prior year quarter. Over $37.2 million of the increase was due toexchange rate movements. Similar to Domestic Card, the underlying increase in revenue was a result of actions taken to enhance margins during the previousyear.
The Credit Card segment’s net provision decreased $507.6 million to $1.2 billion in the first quarter in 2010. Net adjusted charge-offs increased by $91.1 million,or 6%, from the first quarter of 2009 to the first quarter of 2010. The net adjusted charge-off rate increased to 10.29% from 8.27% due to both the increase indollars charged off as well as the denominator impact of a shrinking loan book, as average loans decreased by $11.6 billion from first quarter 2009. The decreasein the net provision in the first quarter of 2010 was attributable to a reduction in the allowance for loan and lease losses due to improved credit performance,coupled with a reduction in outstanding loans. In contrast, we increased the allowance for loan and lease losses in the first quarter of 2009 due to the significantdeterioration in economic conditions and credit performance. Excluding the impact from the adoption of the new consolidation accounting standards on ourprovision for loan and lease losses in the first quarter of 2010, would have reduced the decrease in our provision for loan because the population of loans includedin determining our allowance for loan and lease losses would not have included loans held in our securitization trusts that were previously off-balance sheet.
On the Domestic Card side, the stabilizing credit environment caused net adjusted charge-offs to increase by $71.3 million, or 5%, from the first quarter of 2009to the same quarter in 2010. The net adjusted charge-off rate increased to 10.48% from 8.39% during the same time period. We reduced the allowance for loanand lease losses by $426.9 million in the first quarter of 2010, compared with an increase of $70.3 million in the first quarter of 2009. The reduction in theallowance for loan and lease losses in the first quarter of 2010 was primarily driven by the decline in total loans, coupled with improved economic conditions andcredit performance of the loans in our Domestic Card portfolio. The increase in net adjusted charge offs and release of allowance resulted in a $1.1 billion netprovision for loan and lease losses in the first quarter of 2010, a decrease of $425.8 million, or 28%, over the same quarter of 2009.
International experienced an increase in net adjusted charge-offs of $19.5 million, or 13%, from first quarter 2009 to first quarter 2010. All but $2.0 million of thisincrease was due to a weakening U.S. Dollar versus the Pound Sterling and Canadian Dollar. The net adjusted charge-off rate increased from 7.30% to 8.83%. Inthe first quarter of 2010, the allowance for loan and lease losses experienced a release of $93.4 million versus a build of $8.1 million in the same quarter of 2009.The release was mainly due to the impact of improved credit performance, which more than offset the increase in net adjusted charge offs resulting in the netprovision for loan and lease losses decreasing by $81.8 million or
27
Table of Contents
50.9% to $79.0 million. Excluding the impact from the adoption of the new consolidation accounting standards on our provision for loan and lease losses in thefirst quarter of 2010, would have reduced the decrease in our provision for loan relative to the first quarter of 2009 because the population of loans included indetermining our allowance for loan and lease losses would not have included loans held in our securitization trusts that were previously off-balance sheet.
Non-interest expense for the Credit Card business was $914.1 million for the quarter which is a decline of $74.6 million, or 8%, from the same quarter last year.
Non-interest expense in Domestic Card, non-interest expense of $809.4 million in the first quarter of 2010 reflected a decline of $56.0 million, or 7%, from thefirst quarter of 2009. The decline was attributable to improved operating efficiencies, which were partially offset by a moderate increase in marketingexpenditures.
International’s non-interest expense declined by $18.6 million, or 15%, to $104.6 million. Excluding the impact of foreign currency exchange rate fluctuations,non-interest expense declined by $33.9 million. In addition to the expense reduction as a result of a smaller loan portfolio, the International Card division hascontinued to reduce its marketing expenditures.
Table 14: Commercial Banking
Three Months Ended March 31, (Dollars in thousands) 2010 2009 Earnings: Net interest income $ 311,401 $ 245,459 Non-interest income 42,375 41,214
Total revenue $ 353,776 $ 286,673 Provision for loan and lease losses 238,209 117,304 Non-interest expense 192,420 141,805
Income (loss) before taxes (76,853) 27,564 Income taxes (benefit) (27,375) 9,647
Net income (loss) $ (49,478) $ 17,917
Selected Metrics: Period end loans held for investment
Commercial and multifamily real estate $13,617,900 $13,522,154 Middle market 10,310,156 9,850,735 Specialty lending 3,618,987 3,489,813
Total commercial lending $27,547,043 $26,862,702 Small-ticket commercial real estate 2,065,095 2,568,395
Total commercial banking $29,612,138 $29,431,097 Average loans held for investment
Commercial and multifamily real estate $13,716,376 $13,437,351 Middle market 10,323,528 10,003,213 Specialty lending 3,609,231 3,504,544
Total commercial lending $27,649,135 $26,945,108 Small ticket commercial real estate 2,073,539 2,600,169
Total commercial banking $29,722,674 $29,545,277 Loans held for investment yield 5.03% 4.92% Period end deposits $21,605,482 $15,691,679 Average deposits $21,858,792 $16,045,943 Deposit interest expense rate 0.72% 0.92% Core deposit intangible amortization $ 14,389 $ 9,092 Net charge-off rate 1.37% 0.56% Nonperforming loans as a percentage of loans held for investment 2.48% 1.85% Nonperforming asset rate 2.64% 1.95%
28
(1)
( 2)
( 2)
( 2)
Table of Contents
(1) The operations of Chevy Chase Bank, which we acquired on February 27, 2009, were not reflected in our Consumer or Commercial Banking segments
until the second quarter of 2009. The operations of Chevy Chase Bank were reflected in the “Other category” in the first quarter of 2009.(2) The denominator used in calculating these rates for the first quarter of 2009 excludes loans acquired from Chevy Chase Bank, as these loans were not
classified as part of our Consumer or Commercial Banking segments until the second quarter of 2009. Loans acquired from Chevy Chase Bank wereincluded in the “Other category” in the first quarter of 2009.
The Commercial Banking segment includes the financial results of small-ticket commercial real estate portfolio, which is a $2.1 billion portfolio of nationalbroker-originated real estate loans that we acquired in the North Fork Bank acquisition. We exited this business in 2007.
The Commercial Banking business reported a net loss of $49.5 million in the first quarter of 2010, compared with net income of $17.9 million in the first quarterof 2009.
Total revenue increased by $67.1 million, or 23%, over the first quarter of 2009 to $353.8 million. Excluding the impact from Chevy Chase Bank, total revenueincreased by $41.1 million, or 14%. The increase in revenues was driven by a $41.0 million increase in net interest income, attributable to a widening of the netinterest margin due to the combined impact of an increase in average asset yields and a decrease in the average cost of deposits.
In the first quarter of 2010, the Commercial Banking segment’s ending balance for loans held for investment was $29.6 billion, an increase of $0.2 billion, or 1%,from the first quarter of 2009. Excluding the impact from Chevy Chase Bank, the ending balance of loans held for investment declined $1.2 billion, or 4%, fromthe first quarter of 2009, driven by a decline in loan originations and the continued expected run-off of the small-ticket commercial real estate loan portfolio.
Average deposits for the Commercial Banking of $21.9 billion in the first quarter of 2010 increased by $5.8 billion, or 36%, from the first quarter of 2009.Excluding the impact from Chevy Chase Bank, average deposits increased by $4.3 billion, or 27%, driven by increases in direct-deposit accounts, NOW accountsand money-market accounts. The growth in our deposit business was due in part to our focused efforts on managing core relationships while maintaining adisciplined approach to pricing. Deposit interest expense declined 20 basis points in the first quarter of 2010 from the first quarter of 2009, reflecting themovement in short-term interest rates, coupled with a series of targeted price cuts that we implemented during 2009.
In the first quarter of 2010, the Commercial Banking segment total provision for loans and lease losses was $238.2 million, an increase of $120.9 million, or103% from the first quarter of 2009. The increase was driven by an incremental increase in the allowance for loan and lease losses due to increases innonperforming loans and net charge-offs, which reflected deterioration in the credit quality of the commercial loan portfolio. The net charge-off rate was 1.37% inthe first quarter of 2010, an increase of 81 basis points from the first quarter of 2009. Non-performing loans as a percentage of loans held for investment was2.48% for the first quarter of 2010, increasing 63 basis points from the first quarter of 2009.
In the first quarter of 2010, total non-interest expense was $192.4 million, an increasing of $50.6 million, or 36%, over the first quarter of 2009. The primarydrivers were the addition of Chevy Chase Bank, increased investment in risk mitigation, continued investment in our bank infrastructure, and higher core depositintangible amortization as a result of the Chevy Chase acquisition.
Table 15: Consumer Banking
Three Months Ended March 31,(Dollars in thousands) 2010 2009 Earnings: Net interest income $ 896,588 $ 723,654Non-interest income 315,612 163,257
Total revenue $ 1,212,200 $ 886,911Provision for loan and lease losses 49,526 268,233Non-interest expense 688,381 579,724
Income (loss) before taxes $ 474,293 $ 38,954Income taxes (benefit) 168,943 13,634
Net income (loss) $ 305,350 $ 25,320
29
(1)
Table of Contents
Three Months Ended March 31, (Dollars in thousands) 2010 2009 Selected Metrics: Period end loans held for investment
Automobile $17,446,430 $20,795,291 Mortgages 13,966,471 9,648,271 Retail banking 4,969,775 5,499,070
Total consumer banking $36,382,676 $35,942,632 Average loans held for investment
Automobile $17,768,721 $21,123,000 Mortgages 15,433,825 9,860,646 Retail banking 5,042,814 5,559,451
Total consumer banking $38,245,360 $36,543,097 Loans held for investment yield 8.96% 9.43% Auto loan originations $ 1,343,463 $ 1,463,402 Period end deposits $76,883,450 $63,422,760 Average deposits $ 75,115,342 $62,730,380 Deposit interest expense rate 1.27% 2.04% Core deposit intangible amortization $ 37,735 $ 35,593 Net charge-off rate 2.03% 3.30% Nonperforming loans as a percentage of loans held for investment 1.62% 0.98% Nonperforming asset rate 1.76% 1.16% 30+ day performing delinquency rate 4.13% 5.01% Period end loans serviced for others $26,777,607 $22,270,797
(1) The operations of Chevy Chase Bank, which we acquired on February 27, 2009, were not reflected in our Consumer or Commercial Banking segments
until the second quarter of 2009. The operations of Chevy Chase Bank were reflected in the “other category” in the first quarter of 2009.(2) The denominator used in calculating these rates for the first quarter of 2009 excludes loans acquired from Chevy Chase Bank, as these loans were not
classified as part of our Consumer or Commercial Banking segments until the second quarter of 2009. Loans acquired from Chevy Chase Bank wereincluded in the “other category” in the first quarter of 2009.
The Consumer Banking segment recognized net income of $305.4 million in the first quarter of 2010 compared to net income of $25.3 million in the same quarterof 2009. Stronger revenue and improved credit caused the increase in net income.
Average deposits of $75.1 billion in the first quarter of 2010 were up by $12.4 billion, or 19.7%, over the first quarter of 2009, driven by growth in savings andmoney market deposits and the inclusion of Chevy Chase Bank deposits in the first quarter of 2010. Period end loans held for investment of $36.4 billion as ofMarch 31, 2010 reflected an increase of $0.4 billion, or 1.2%.
Auto loans held for investment decreased $3.3 billion or 16.1% to $17.4 billion. The auto line of business continues to have higher run off of loans thanoriginations as beginning in early 2008 the auto business tightened credit and shifted the portfolio towards better credit quality assets.
Retail Banking loans held for investment fell $0.5 billion or 9.6% to $5.0 billion. The decrease was from the small business portfolio as the consumer portfoliogrew slightly.
Mortgage loans held for investment totaled $14.0 billion at the end of the first quarter of 2010, $4.3 billion or 44.8% higher than the first quarter of 2009. Theincrease was driven by the inclusion of Chevy Chase Bank loans in the first quarter of 2010, as these loans were included in the “Other” category in the firstquarter of 2009.
30
(1)
( 2)
( 2)
2 )
( 2)
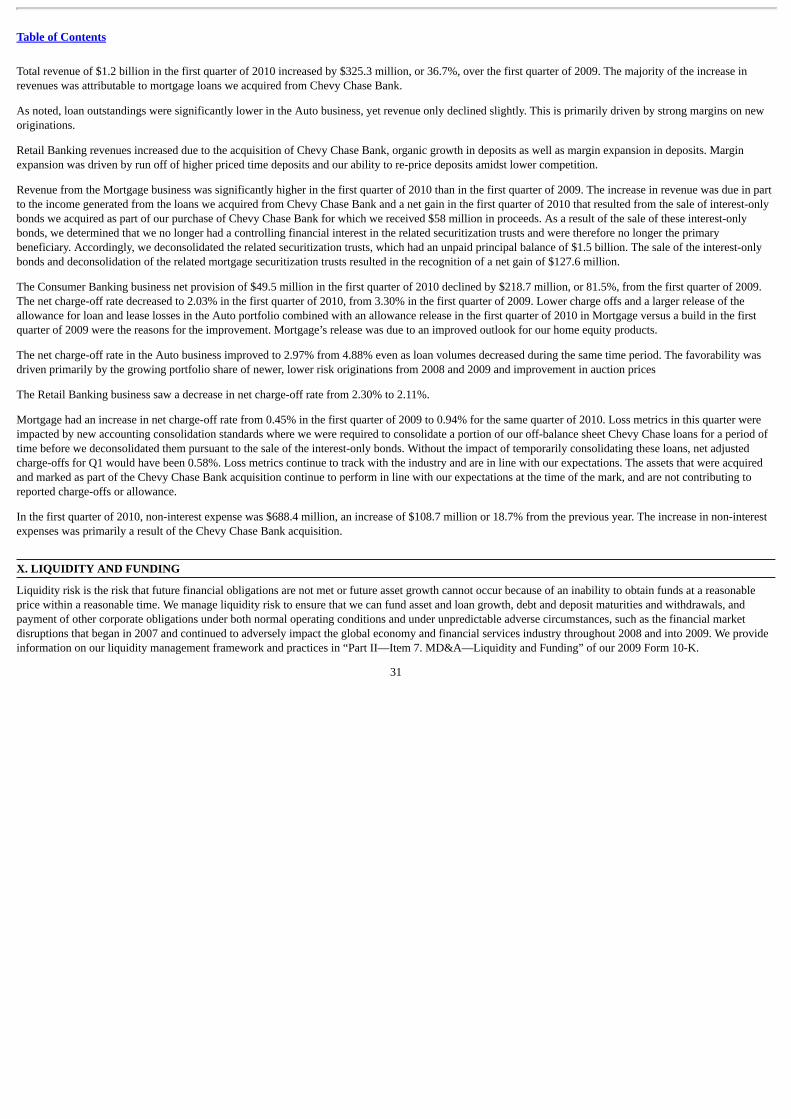
Table of Contents
Total revenue of $1.2 billion in the first quarter of 2010 increased by $325.3 million, or 36.7%, over the first quarter of 2009. The majority of the increase inrevenues was attributable to mortgage loans we acquired from Chevy Chase Bank.
As noted, loan outstandings were significantly lower in the Auto business, yet revenue only declined slightly. This is primarily driven by strong margins on neworiginations.
Retail Banking revenues increased due to the acquisition of Chevy Chase Bank, organic growth in deposits as well as margin expansion in deposits. Marginexpansion was driven by run off of higher priced time deposits and our ability to re-price deposits amidst lower competition.
Revenue from the Mortgage business was significantly higher in the first quarter of 2010 than in the first quarter of 2009. The increase in revenue was due in partto the income generated from the loans we acquired from Chevy Chase Bank and a net gain in the first quarter of 2010 that resulted from the sale of interest-onlybonds we acquired as part of our purchase of Chevy Chase Bank for which we received $58 million in proceeds. As a result of the sale of these interest-onlybonds, we determined that we no longer had a controlling financial interest in the related securitization trusts and were therefore no longer the primarybeneficiary. Accordingly, we deconsolidated the related securitization trusts, which had an unpaid principal balance of $1.5 billion. The sale of the interest-onlybonds and deconsolidation of the related mortgage securitization trusts resulted in the recognition of a net gain of $127.6 million.
The Consumer Banking business net provision of $49.5 million in the first quarter of 2010 declined by $218.7 million, or 81.5%, from the first quarter of 2009.The net charge-off rate decreased to 2.03% in the first quarter of 2010, from 3.30% in the first quarter of 2009. Lower charge offs and a larger release of theallowance for loan and lease losses in the Auto portfolio combined with an allowance release in the first quarter of 2010 in Mortgage versus a build in the firstquarter of 2009 were the reasons for the improvement. Mortgage’s release was due to an improved outlook for our home equity products.
The net charge-off rate in the Auto business improved to 2.97% from 4.88% even as loan volumes decreased during the same time period. The favorability wasdriven primarily by the growing portfolio share of newer, lower risk originations from 2008 and 2009 and improvement in auction prices
The Retail Banking business saw a decrease in net charge-off rate from 2.30% to 2.11%.
Mortgage had an increase in net charge-off rate from 0.45% in the first quarter of 2009 to 0.94% for the same quarter of 2010. Loss metrics in this quarter wereimpacted by new accounting consolidation standards where we were required to consolidate a portion of our off-balance sheet Chevy Chase loans for a period oftime before we deconsolidated them pursuant to the sale of the interest-only bonds. Without the impact of temporarily consolidating these loans, net adjustedcharge-offs for Q1 would have been 0.58%. Loss metrics continue to track with the industry and are in line with our expectations. The assets that were acquiredand marked as part of the Chevy Chase Bank acquisition continue to perform in line with our expectations at the time of the mark, and are not contributing toreported charge-offs or allowance.
In the first quarter of 2010, non-interest expense was $688.4 million, an increase of $108.7 million or 18.7% from the previous year. The increase in non-interestexpenses was primarily a result of the Chevy Chase Bank acquisition. X. LIQUIDITY AND FUNDING Liquidity risk is the risk that future financial obligations are not met or future asset growth cannot occur because of an inability to obtain funds at a reasonableprice within a reasonable time. We manage liquidity risk to ensure that we can fund asset and loan growth, debt and deposit maturities and withdrawals, andpayment of other corporate obligations under both normal operating conditions and under unpredictable adverse circumstances, such as the financial marketdisruptions that began in 2007 and continued to adversely impact the global economy and financial services industry throughout 2008 and into 2009. We provideinformation on our liquidity management framework and practices in “Part II—Item 7. MD&A—Liquidity and Funding” of our 2009 Form 10-K.
31
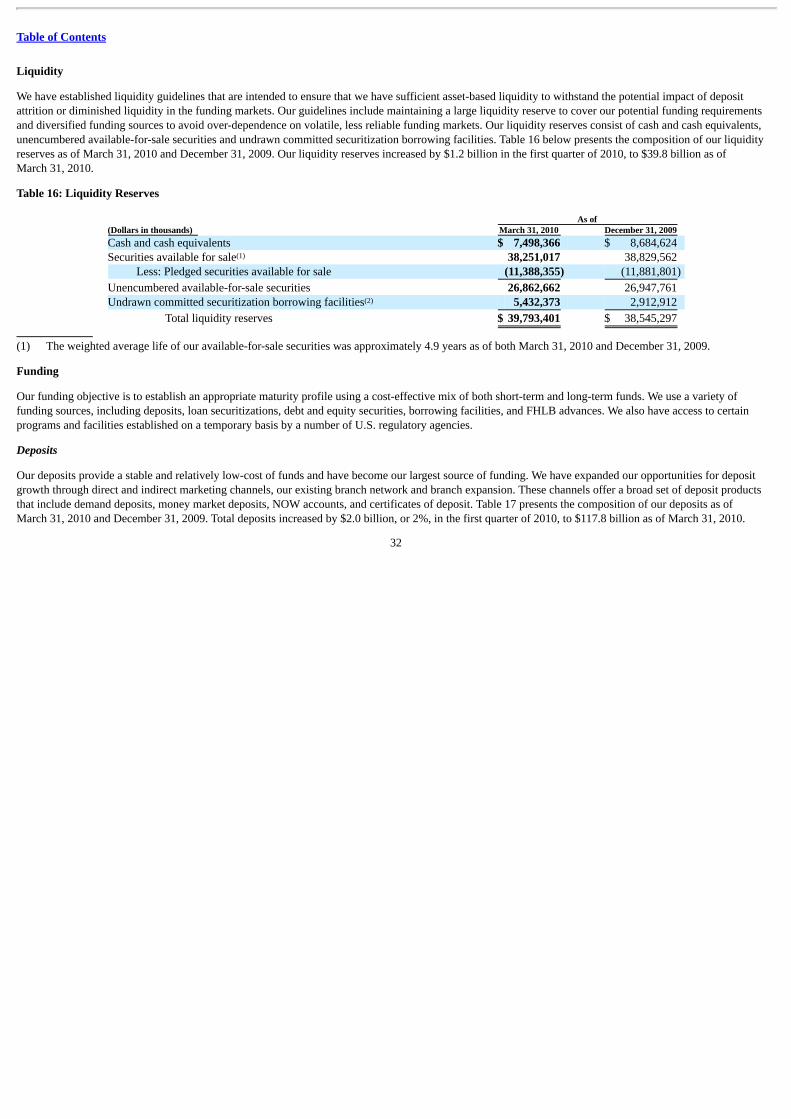
Table of Contents
Liquidity
We have established liquidity guidelines that are intended to ensure that we have sufficient asset-based liquidity to withstand the potential impact of depositattrition or diminished liquidity in the funding markets. Our guidelines include maintaining a large liquidity reserve to cover our potential funding requirementsand diversified funding sources to avoid over-dependence on volatile, less reliable funding markets. Our liquidity reserves consist of cash and cash equivalents,unencumbered available-for-sale securities and undrawn committed securitization borrowing facilities. Table 16 below presents the composition of our liquidityreserves as of March 31, 2010 and December 31, 2009. Our liquidity reserves increased by $1.2 billion in the first quarter of 2010, to $39.8 billion as ofMarch 31, 2010.
Table 16: Liquidity Reserves
As of (Dollars in thousands) March 31, 2010 December 31, 2009 Cash and cash equivalents $ 7,498,366 $ 8,684,624 Securities available for sale 38,251,017 38,829,562
Less: Pledged securities available for sale (11,388,355) (11,881,801)
Unencumbered available-for-sale securities 26,862,662 26,947,761 Undrawn committed securitization borrowing facilities 5,432,373 2,912,912
Total liquidity reserves $ 39,793,401 $ 38,545,297
(1) The weighted average life of our available-for-sale securities was approximately 4.9 years as of both March 31, 2010 and December 31, 2009.
Funding
Our funding objective is to establish an appropriate maturity profile using a cost-effective mix of both short-term and long-term funds. We use a variety offunding sources, including deposits, loan securitizations, debt and equity securities, borrowing facilities, and FHLB advances. We also have access to certainprograms and facilities established on a temporary basis by a number of U.S. regulatory agencies.
Deposits
Our deposits provide a stable and relatively low-cost of funds and have become our largest source of funding. We have expanded our opportunities for depositgrowth through direct and indirect marketing channels, our existing branch network and branch expansion. These channels offer a broad set of deposit productsthat include demand deposits, money market deposits, NOW accounts, and certificates of deposit. Table 17 presents the composition of our deposits as ofMarch 31, 2010 and December 31, 2009. Total deposits increased by $2.0 billion, or 2%, in the first quarter of 2010, to $117.8 billion as of March 31, 2010.
32
(1)
(2)

Table of Contents
Table 17: Deposits
As of(Dollars in thousands) March 31, 2010 December 31, 2009Non-interest bearing $ 13,773,082 $ 13,438,659NOW accounts 11,764,598 12,077,480Savings accounts 20,147,356 17,019,187Money market deposit accounts 40,195,535 38,094,228Other consumer time deposits 22,687,064 25,455,636
Total core deposits $108,567,635 $ 106,085,190Public fund certificates of deposit $100,000 or more 269,108 578,536Certificates of deposit $100,000 or more 7,968,962 8,248,008Foreign time deposits 980,854 897,362
Total company deposits $117,786,559 $ 115,809,096
Of our total deposits, approximately $980.9 million and $897.4 million were held in foreign banking offices as of March 31, 2010 and December 31, 2009,respectively. Large domestic denomination certificates of deposits of $100,000 or more represented $8.2 billion and $8.8 billion of our total deposits as ofMarch 31, 2010 and December 31, 2009, respectively. Our funding and liquidity strategy takes into consideration the scheduled maturities of large denominationtime deposits. Of the $8.2 billion in large domestic denomination certificates of deposit as of March 31, 2010, $1.4 billion is scheduled to mature within the nextthree months; $2.4 billion is scheduled to mature over three to 12 months; and $4.4 billion is scheduled to mature over 12 months. Based on past activity, weexpect to retain a portion of these deposits as they mature.
We have some brokered deposits, which we obtained through the use of a third-party intermediary, that are included above in Table 17 in money market depositaccounts and other consumer time deposits. The Federal Deposit Insurance Corporation Improvement Act of 1991 limits the use of brokered deposits to “well-capitalized” insured depository institutions and, with a waiver from the Federal Deposit Insurance Corporation, to “adequately capitalized” institutions. TheBanks and the Corporation were “well-capitalized,” as defined under the federal banking regulatory guidelines, as of March 31, 2010, and therefore permitted tomaintain brokered deposits. Our brokered deposits totaled $17.4 billion, or 15% of total deposits, as of March 31, 2010. Brokered deposits totaled $18.8 billion,or 16% of total deposits, as of December 31, 2009. Based on our historical access to the brokered deposit market, we expect to replace maturing brokered depositswith new brokered deposits or direct deposits and branch deposits. If our brokered deposits do not renew at maturity, we would use our liquidity reserves oralternative funding to meet our liquidity needs.
Table 18 displays, by deposit type, the average balances, interest expense, and average rates on our deposits for the three months ended March 31, 2010 and 2009.
33
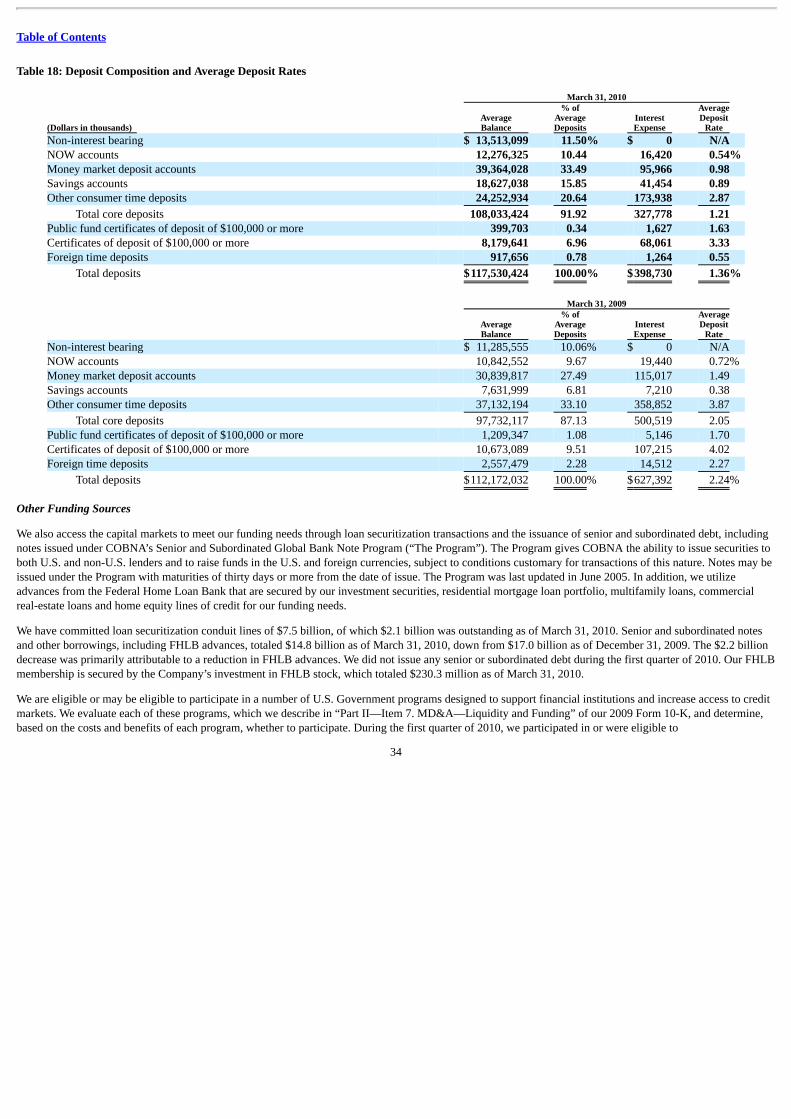
Table of Contents
Table 18: Deposit Composition and Average Deposit Rates
March 31, 2010
(Dollars in thousands) AverageBalance
% ofAverageDeposits
InterestExpense
AverageDeposit
Rate Non-interest bearing $ 13,513,099 11.50% $ 0 N/A NOW accounts 12,276,325 10.44 16,420 0.54% Money market deposit accounts 39,364,028 33.49 95,966 0.98 Savings accounts 18,627,038 15.85 41,454 0.89 Other consumer time deposits 24,252,934 20.64 173,938 2.87
Total core deposits 108,033,424 91.92 327,778 1.21 Public fund certificates of deposit of $100,000 or more 399,703 0.34 1,627 1.63 Certificates of deposit of $100,000 or more 8,179,641 6.96 68,061 3.33 Foreign time deposits 917,656 0.78 1,264 0.55
Total deposits $117,530,424 100.00% $398,730 1.36%
March 31, 2009
AverageBalance
% ofAverageDeposits
InterestExpense
AverageDeposit
Rate Non-interest bearing $ 11,285,555 10.06% $ 0 N/A NOW accounts 10,842,552 9.67 19,440 0.72% Money market deposit accounts 30,839,817 27.49 115,017 1.49 Savings accounts 7,631,999 6.81 7,210 0.38 Other consumer time deposits 37,132,194 33.10 358,852 3.87
Total core deposits 97,732,117 87.13 500,519 2.05 Public fund certificates of deposit of $100,000 or more 1,209,347 1.08 5,146 1.70 Certificates of deposit of $100,000 or more 10,673,089 9.51 107,215 4.02 Foreign time deposits 2,557,479 2.28 14,512 2.27
Total deposits $112,172,032 100.00% $627,392 2.24%
Other Funding Sources
We also access the capital markets to meet our funding needs through loan securitization transactions and the issuance of senior and subordinated debt, includingnotes issued under COBNA’s Senior and Subordinated Global Bank Note Program (“The Program”). The Program gives COBNA the ability to issue securities toboth U.S. and non-U.S. lenders and to raise funds in the U.S. and foreign currencies, subject to conditions customary for transactions of this nature. Notes may beissued under the Program with maturities of thirty days or more from the date of issue. The Program was last updated in June 2005. In addition, we utilizeadvances from the Federal Home Loan Bank that are secured by our investment securities, residential mortgage loan portfolio, multifamily loans, commercialreal-estate loans and home equity lines of credit for our funding needs.
We have committed loan securitization conduit lines of $7.5 billion, of which $2.1 billion was outstanding as of March 31, 2010. Senior and subordinated notesand other borrowings, including FHLB advances, totaled $14.8 billion as of March 31, 2010, down from $17.0 billion as of December 31, 2009. The $2.2 billiondecrease was primarily attributable to a reduction in FHLB advances. We did not issue any senior or subordinated debt during the first quarter of 2010. Our FHLBmembership is secured by the Company’s investment in FHLB stock, which totaled $230.3 million as of March 31, 2010.
We are eligible or may be eligible to participate in a number of U.S. Government programs designed to support financial institutions and increase access to creditmarkets. We evaluate each of these programs, which we describe in “Part II—Item 7. MD&A—Liquidity and Funding” of our 2009 Form 10-K, and determine,based on the costs and benefits of each program, whether to participate. During the first quarter of 2010, we participated in or were eligible to
34
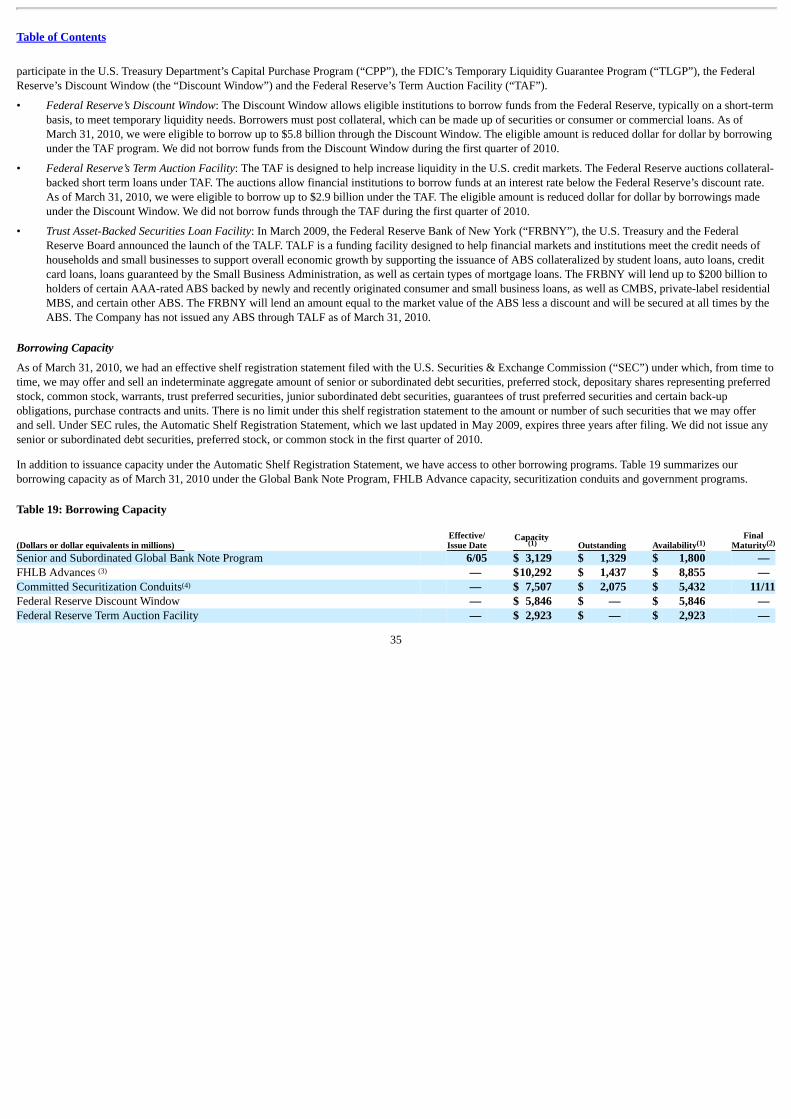
Table of Contents
participate in the U.S. Treasury Department’s Capital Purchase Program (“CPP”), the FDIC’s Temporary Liquidity Guarantee Program (“TLGP”), the FederalReserve’s Discount Window (the “Discount Window”) and the Federal Reserve’s Term Auction Facility (“TAF”).
• Federal Reserve’s Discount Window: The Discount Window allows eligible institutions to borrow funds from the Federal Reserve, typically on a short-termbasis, to meet temporary liquidity needs. Borrowers must post collateral, which can be made up of securities or consumer or commercial loans. As ofMarch 31, 2010, we were eligible to borrow up to $5.8 billion through the Discount Window. The eligible amount is reduced dollar for dollar by borrowingunder the TAF program. We did not borrow funds from the Discount Window during the first quarter of 2010.
• Federal Reserve’s Term Auction Facility: The TAF is designed to help increase liquidity in the U.S. credit markets. The Federal Reserve auctions collateral-backed short term loans under TAF. The auctions allow financial institutions to borrow funds at an interest rate below the Federal Reserve’s discount rate.As of March 31, 2010, we were eligible to borrow up to $2.9 billion under the TAF. The eligible amount is reduced dollar for dollar by borrowings madeunder the Discount Window. We did not borrow funds through the TAF during the first quarter of 2010.
• Trust Asset-Backed Securities Loan Facility: In March 2009, the Federal Reserve Bank of New York (“FRBNY”), the U.S. Treasury and the FederalReserve Board announced the launch of the TALF. TALF is a funding facility designed to help financial markets and institutions meet the credit needs ofhouseholds and small businesses to support overall economic growth by supporting the issuance of ABS collateralized by student loans, auto loans, creditcard loans, loans guaranteed by the Small Business Administration, as well as certain types of mortgage loans. The FRBNY will lend up to $200 billion toholders of certain AAA-rated ABS backed by newly and recently originated consumer and small business loans, as well as CMBS, private-label residentialMBS, and certain other ABS. The FRBNY will lend an amount equal to the market value of the ABS less a discount and will be secured at all times by theABS. The Company has not issued any ABS through TALF as of March 31, 2010.
Borrowing Capacity
As of March 31, 2010, we had an effective shelf registration statement filed with the U.S. Securities & Exchange Commission (“SEC”) under which, from time totime, we may offer and sell an indeterminate aggregate amount of senior or subordinated debt securities, preferred stock, depositary shares representing preferredstock, common stock, warrants, trust preferred securities, junior subordinated debt securities, guarantees of trust preferred securities and certain back-upobligations, purchase contracts and units. There is no limit under this shelf registration statement to the amount or number of such securities that we may offerand sell. Under SEC rules, the Automatic Shelf Registration Statement, which we last updated in May 2009, expires three years after filing. We did not issue anysenior or subordinated debt securities, preferred stock, or common stock in the first quarter of 2010.
In addition to issuance capacity under the Automatic Shelf Registration Statement, we have access to other borrowing programs. Table 19 summarizes ourborrowing capacity as of March 31, 2010 under the Global Bank Note Program, FHLB Advance capacity, securitization conduits and government programs.
Table 19: Borrowing Capacity
(Dollars or dollar equivalents in millions) Effective/Issue Date
Capacity Outstanding Availability
FinalMaturity
Senior and Subordinated Global Bank Note Program 6/05 $ 3,129 $ 1,329 $ 1,800 — FHLB Advances — $10,292 $ 1,437 $ 8,855 — Committed Securitization Conduits — $ 7,507 $ 2,075 $ 5,432 11/11Federal Reserve Discount Window — $ 5,846 $ — $ 5,846 — Federal Reserve Term Auction Facility — $ 2,923 $ — $ 2,923 —
35
(1) (1) (2)
(3)
(4)
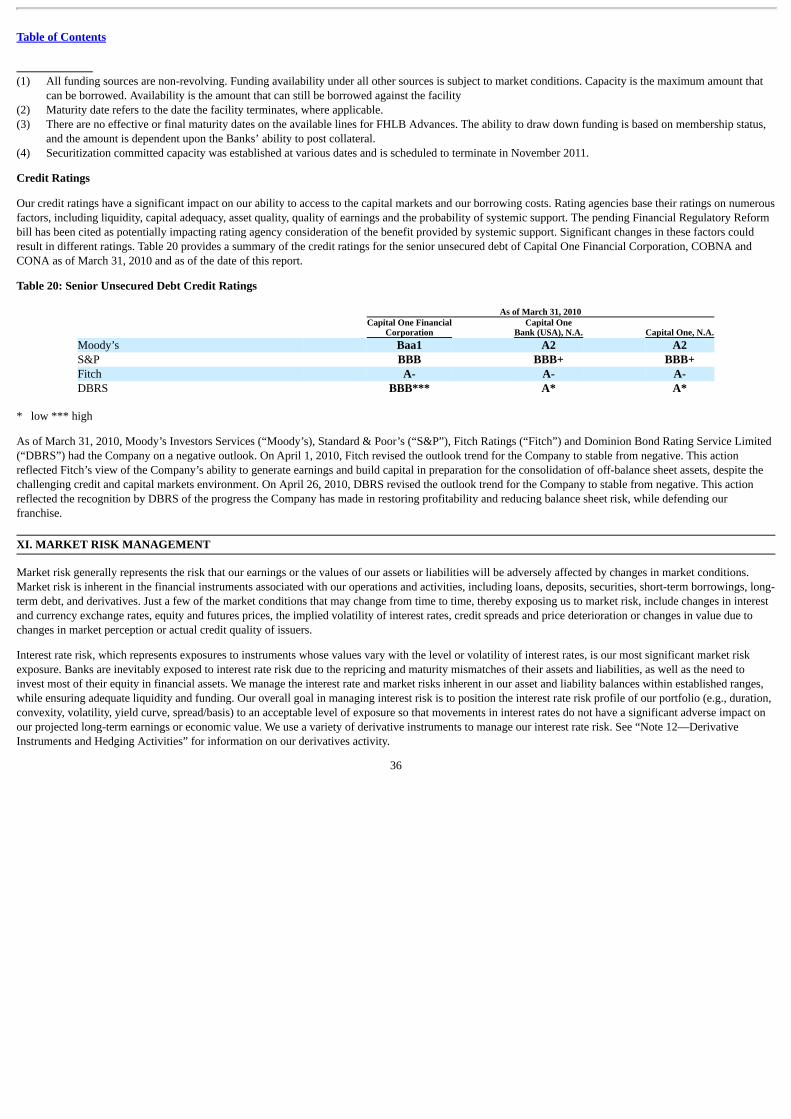
Table of Contents
(1) All funding sources are non-revolving. Funding availability under all other sources is subject to market conditions. Capacity is the maximum amount that
can be borrowed. Availability is the amount that can still be borrowed against the facility(2) Maturity date refers to the date the facility terminates, where applicable.(3) There are no effective or final maturity dates on the available lines for FHLB Advances. The ability to draw down funding is based on membership status,
and the amount is dependent upon the Banks’ ability to post collateral.(4) Securitization committed capacity was established at various dates and is scheduled to terminate in November 2011.
Credit Ratings
Our credit ratings have a significant impact on our ability to access to the capital markets and our borrowing costs. Rating agencies base their ratings on numerousfactors, including liquidity, capital adequacy, asset quality, quality of earnings and the probability of systemic support. The pending Financial Regulatory Reformbill has been cited as potentially impacting rating agency consideration of the benefit provided by systemic support. Significant changes in these factors couldresult in different ratings. Table 20 provides a summary of the credit ratings for the senior unsecured debt of Capital One Financial Corporation, COBNA andCONA as of March 31, 2010 and as of the date of this report.
Table 20: Senior Unsecured Debt Credit Ratings
As of March 31, 2010
Capital One Financial
Corporation Capital One
Bank (USA), N.A. Capital One, N.A.Moody’s Baa1 A2 A2S&P BBB BBB+ BBB+Fitch A- A- A-DBRS BBB*** A* A*
* low *** high
As of March 31, 2010, Moody’s Investors Services (“Moody’s), Standard & Poor’s (“S&P”), Fitch Ratings (“Fitch”) and Dominion Bond Rating Service Limited(“DBRS”) had the Company on a negative outlook. On April 1, 2010, Fitch revised the outlook trend for the Company to stable from negative. This actionreflected Fitch’s view of the Company’s ability to generate earnings and build capital in preparation for the consolidation of off-balance sheet assets, despite thechallenging credit and capital markets environment. On April 26, 2010, DBRS revised the outlook trend for the Company to stable from negative. This actionreflected the recognition by DBRS of the progress the Company has made in restoring profitability and reducing balance sheet risk, while defending ourfranchise. XI. MARKET RISK MANAGEMENT Market risk generally represents the risk that our earnings or the values of our assets or liabilities will be adversely affected by changes in market conditions.Market risk is inherent in the financial instruments associated with our operations and activities, including loans, deposits, securities, short-term borrowings, long-term debt, and derivatives. Just a few of the market conditions that may change from time to time, thereby exposing us to market risk, include changes in interestand currency exchange rates, equity and futures prices, the implied volatility of interest rates, credit spreads and price deterioration or changes in value due tochanges in market perception or actual credit quality of issuers.
Interest rate risk, which represents exposures to instruments whose values vary with the level or volatility of interest rates, is our most significant market riskexposure. Banks are inevitably exposed to interest rate risk due to the repricing and maturity mismatches of their assets and liabilities, as well as the need toinvest most of their equity in financial assets. We manage the interest rate and market risks inherent in our asset and liability balances within established ranges,while ensuring adequate liquidity and funding. Our overall goal in managing interest risk is to position the interest rate risk profile of our portfolio (e.g., duration,convexity, volatility, yield curve, spread/basis) to an acceptable level of exposure so that movements in interest rates do not have a significant adverse impact onour projected long-term earnings or economic value. We use a variety of derivative instruments to manage our interest rate risk. See “Note 12—DerivativeInstruments and Hedging Activities” for information on our derivatives activity.
36
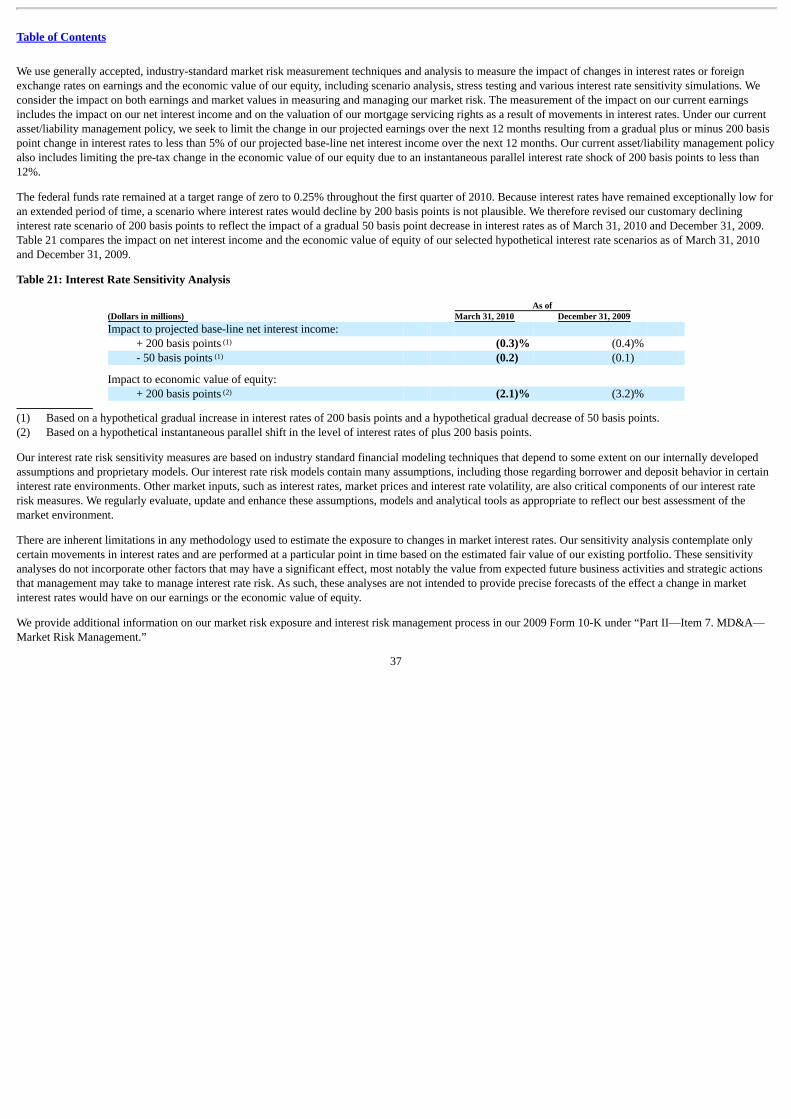
Table of Contents
We use generally accepted, industry-standard market risk measurement techniques and analysis to measure the impact of changes in interest rates or foreignexchange rates on earnings and the economic value of our equity, including scenario analysis, stress testing and various interest rate sensitivity simulations. Weconsider the impact on both earnings and market values in measuring and managing our market risk. The measurement of the impact on our current earningsincludes the impact on our net interest income and on the valuation of our mortgage servicing rights as a result of movements in interest rates. Under our currentasset/liability management policy, we seek to limit the change in our projected earnings over the next 12 months resulting from a gradual plus or minus 200 basispoint change in interest rates to less than 5% of our projected base-line net interest income over the next 12 months. Our current asset/liability management policyalso includes limiting the pre-tax change in the economic value of our equity due to an instantaneous parallel interest rate shock of 200 basis points to less than12%.
The federal funds rate remained at a target range of zero to 0.25% throughout the first quarter of 2010. Because interest rates have remained exceptionally low foran extended period of time, a scenario where interest rates would decline by 200 basis points is not plausible. We therefore revised our customary declininginterest rate scenario of 200 basis points to reflect the impact of a gradual 50 basis point decrease in interest rates as of March 31, 2010 and December 31, 2009.Table 21 compares the impact on net interest income and the economic value of equity of our selected hypothetical interest rate scenarios as of March 31, 2010and December 31, 2009.
Table 21: Interest Rate Sensitivity Analysis
As of (Dollars in millions) March 31, 2010 December 31, 2009 Impact to projected base-line net interest income:
+ 200 basis points (0.3)% (0.4)% - 50 basis points (0.2) (0.1)
Impact to economic value of equity: + 200 basis points (2.1)% (3.2)%
(1) Based on a hypothetical gradual increase in interest rates of 200 basis points and a hypothetical gradual decrease of 50 basis points.(2) Based on a hypothetical instantaneous parallel shift in the level of interest rates of plus 200 basis points.
Our interest rate risk sensitivity measures are based on industry standard financial modeling techniques that depend to some extent on our internally developedassumptions and proprietary models. Our interest rate risk models contain many assumptions, including those regarding borrower and deposit behavior in certaininterest rate environments. Other market inputs, such as interest rates, market prices and interest rate volatility, are also critical components of our interest raterisk measures. We regularly evaluate, update and enhance these assumptions, models and analytical tools as appropriate to reflect our best assessment of themarket environment.
There are inherent limitations in any methodology used to estimate the exposure to changes in market interest rates. Our sensitivity analysis contemplate onlycertain movements in interest rates and are performed at a particular point in time based on the estimated fair value of our existing portfolio. These sensitivityanalyses do not incorporate other factors that may have a significant effect, most notably the value from expected future business activities and strategic actionsthat management may take to manage interest rate risk. As such, these analyses are not intended to provide precise forecasts of the effect a change in marketinterest rates would have on our earnings or the economic value of equity.
We provide additional information on our market risk exposure and interest risk management process in our 2009 Form 10-K under “Part II—Item 7. MD&A—Market Risk Management.”
37
(1)
(1)
(2)
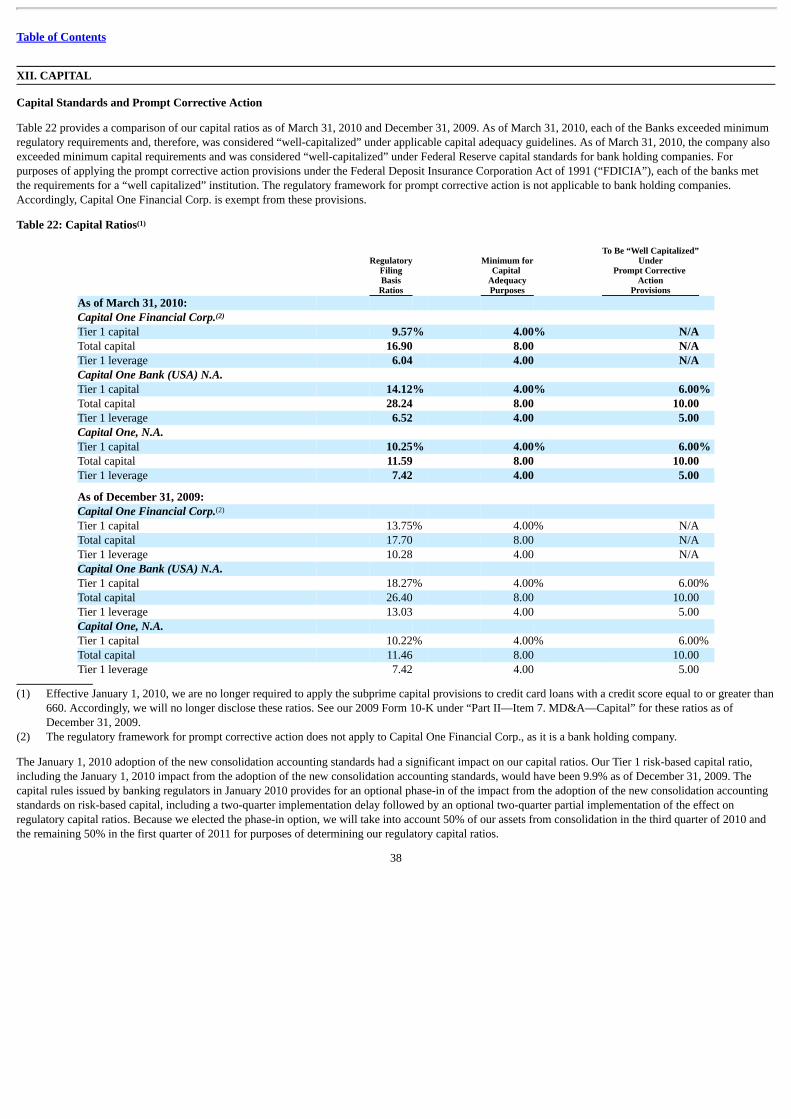
Table of Contents
XII. CAPITAL Capital Standards and Prompt Corrective Action
Table 22 provides a comparison of our capital ratios as of March 31, 2010 and December 31, 2009. As of March 31, 2010, each of the Banks exceeded minimumregulatory requirements and, therefore, was considered “well-capitalized” under applicable capital adequacy guidelines. As of March 31, 2010, the company alsoexceeded minimum capital requirements and was considered “well-capitalized” under Federal Reserve capital standards for bank holding companies. Forpurposes of applying the prompt corrective action provisions under the Federal Deposit Insurance Corporation Act of 1991 (“FDICIA”), each of the banks metthe requirements for a “well capitalized” institution. The regulatory framework for prompt corrective action is not applicable to bank holding companies.Accordingly, Capital One Financial Corp. is exempt from these provisions.
Table 22: Capital Ratios
RegulatoryFilingBasis
Ratios
Minimum forCapital
AdequacyPurposes
To Be “Well Capitalized”Under
Prompt Corrective Action
Provisions As of March 31, 2010: Capital One Financial Corp. Tier 1 capital 9.57% 4.00% N/A Total capital 16.90 8.00 N/A Tier 1 leverage 6.04 4.00 N/A Capital One Bank (USA) N.A. Tier 1 capital 14.12% 4.00% 6.00% Total capital 28.24 8.00 10.00 Tier 1 leverage 6.52 4.00 5.00 Capital One, N.A. Tier 1 capital 10.25% 4.00% 6.00% Total capital 11.59 8.00 10.00 Tier 1 leverage 7.42 4.00 5.00
As of December 31, 2009: Capital One Financial Corp. Tier 1 capital 13.75% 4.00% N/A Total capital 17.70 8.00 N/A Tier 1 leverage 10.28 4.00 N/A Capital One Bank (USA) N.A. Tier 1 capital 18.27% 4.00% 6.00% Total capital 26.40 8.00 10.00 Tier 1 leverage 13.03 4.00 5.00 Capital One, N.A. Tier 1 capital 10.22% 4.00% 6.00% Total capital 11.46 8.00 10.00 Tier 1 leverage 7.42 4.00 5.00
(1) Effective January 1, 2010, we are no longer required to apply the subprime capital provisions to credit card loans with a credit score equal to or greater than
660. Accordingly, we will no longer disclose these ratios. See our 2009 Form 10-K under “Part II—Item 7. MD&A—Capital” for these ratios as ofDecember 31, 2009.
(2) The regulatory framework for prompt corrective action does not apply to Capital One Financial Corp., as it is a bank holding company.
The January 1, 2010 adoption of the new consolidation accounting standards had a significant impact on our capital ratios. Our Tier 1 risk-based capital ratio,including the January 1, 2010 impact from the adoption of the new consolidation accounting standards, would have been 9.9% as of December 31, 2009. Thecapital rules issued by banking regulators in January 2010 provides for an optional phase-in of the impact from the adoption of the new consolidation accountingstandards on risk-based capital, including a two-quarter implementation delay followed by an optional two-quarter partial implementation of the effect onregulatory capital ratios. Because we elected the phase-in option, we will take into account 50% of our assets from consolidation in the third quarter of 2010 andthe remaining 50% in the first quarter of 2011 for purposes of determining our regulatory capital ratios.
38
(1)
(2)
(2)
Table of Contents
The regulatory capital ratios as of March 31, 2010 reflect the benefit of the phase-in of the regulatory capital rules. As a result of the phase-in option, we expectthat our regulatory capital ratios will be higher than they otherwise would be had we not elected the phase-in option for each quarter of 2010. The benefit from thephase-in election will be reduced in the third quarter and eliminated by the end of the first quarter of 2011 when the phase-in is completed.
Dividend Policy
The declaration and payment of dividends to the Capital One’s stockholders, as well as the amount thereof, are subject to the discretion of the our Board ofDirectors and will depend upon our results of operations, financial condition, cash requirements, future prospects and other factors deemed relevant by the Boardof Directors. As a holding company, our ability to pay dividends is largely dependent upon the receipt of dividends or other payments from our subsidiaries.Regulatory restrictions exist that limit the ability of the Banks to transfer funds to the Company. As of March 31, 2010, funds available for dividend paymentsfrom COBNA and CONA were $801 million and zero, respectively. The funds of COBNA are available for payment as dividends to the Corporation withoutprior approval of the OCC while a dividend payment by CONA would require prior approval of the OCC. Additionally, applicable provisions that may becontained in our borrowing agreements or the borrowing agreements of our subsidiaries may limit our subsidiaries’ ability to pay dividends to us or our ability topay dividends to our stockholders. There can be no assurance that we will declare and pay any dividends.
We provide additional information on capital in our 2009 Form 10-K in “Part I—Item 7. MD&A—Capital.” XIV. SUPERVISION AND REGULATION New Regulations of Consumer Lending Activities
On March 3, 2010 the Federal Reserve released its proposed rule for the two remaining provisions of the Credit CARD Act. These provisions, effective onAugust 22, 2010, require the amount of any penalty fee or charge to be “reasonable and proportional to the omission or violation” and require issuers to reviewinterest rates increased since January 1, 2009 for possible reductions on a rolling six-month basis. Under the proposal, issuers will be limited to charging penaltyfee amounts that do not exceed the dollar amount of the violation. Penalty fee amounts also may not exceed an amount justified on a cost or deterrence basis orpermissible under a proposed safe harbor. For rates increased on or after January 1, 2009, every six months issuers must consider changes in either the factorsused to increase the rate or the current factors used to determine rates. If a decrease is merited on such bases, it must take effect no later than 30 days fromcompletion of the review; a decrease by a specific amount or a return to the original rate is not required. We are awaiting the final rule, including clarification of“reasonable and proportional” fee or charges, among other things, contemplated by the proposed rule.
Deposits and Deposit Insurance
On October 14, 2008, the FDIC announced its Temporary Liquidity Guarantee Program (“TLGP”), which included the Transaction Account Guarantee Program(“TAGP”). The TAGP provides unlimited deposit insurance coverage for non-interest bearing transaction accounts (including accounts swept from a non-interestbearing transaction account into a non-interest bearing savings deposit account) and certain interest-bearing accounts (negotiable order of withdrawal (NOW)accounts with interest rates of 0.5 percent or less and lawyers trust accounts) at FDIC-insured depository institutions. The TAGP was originally scheduled toexpire on December 31, 2009, but was extended through June 30, 2010 for those institutions that choose to participate. The Banks are participating in that TAGPextension. Extension assessment costs are an annualized 15 basis point fee on the balance of each covered account in excess of the current FDIC insurance limitof $250,000. The FDIC recently extended the TAGP until December 31, 2010. We do not anticipate participating in TAGP. The FDIC also recently proposedsignificant changes in how deposit insurance assessments would be calculated for insured depository institutions with $10 billion or more of assets. Whenfinalized, these provisions could result in an increase in the amount of assessments paid by each of the Banks.
39
Table of Contents
Legislation
Preamble
The information contained in this section is current as of April 29, 2010.
Credit Card
In May 2009, the President signed the Credit CARD Act into law. Certain provisions of this legislation became effective in August 2009 and February 2010, andother provisions become effective on August 22, 2010. For further information on the Credit CARD Act, see “New Regulations of Consumer Lending Activities”in our Annual Report on Form 10-K for the year ended December 31, 2009, Part I, Item 1 “Supervision and Regulation.”
The Credit CARD Act also requires the Government Accountability Office (GAO) to conduct a study on interchange fees. The GAO released their report, “CreditCards: Rising Interchange Fees Have Increased Costs for Merchants, but Options for Reducing Fees Pose Challenges” on November 19, 2009.
In 2009, legislation to regulate interchange fees was also introduced in the U.S. House and the U.S. Senate. House Judiciary Chairman John Conyers (D-MI) andCongressman Bill Shuster (R-PA) have introduced legislation in the U.S. House and Senator Dick Durbin (D-IL) has introduced legislation in the U.S. Senate thatprovides an antitrust exemption to allow merchants to collectively bargain with the networks and the banks regarding the rates (including merchant discount) andterms (including rules) for payment card acceptance. The Senate bill also includes a three judge panel who would determine the rates and terms if an agreement isnot reached under the antitrust exemption. This legislation is under the jurisdiction of the Judiciary Committees. The House Judiciary Committee held a hearingon the legislation on April 28, 2010.
In addition, Congressman Peter Welch (D-VT) has also introduced a bill that attempts to change many of the fundamental rules of the networks and focuses on:(i) honoring all cards: (ii) minimum/maximum transaction amounts; and (iii) premium card pricing, among other issues. To date, a companion bill has not beenintroduced in the Senate. A legislative hearing was held on October 8, 2009 in the House Financial Services Committee; however, no additional action iscurrently scheduled.
It is expected that attempts to regulate interchange fees will continue at the state level as well.
Financial Regulatory Reform
In June 2009, the Treasury Department released the Administration’s proposal for Financial Regulatory Reform. This proposal overhauls the financial regulatorystructure in several significant respects. Among other changes, the proposal would give authority to the Federal Reserve Board to serve as the nation’s financialservices systemic risk regulator, with new enhanced scrutiny over financial institutions that are deemed “too big to fail.”
The Administration’s proposal would also establish a Consumer Financial Protection Agency (CFPA), a new government agency with sole rule writing authorityfor consumer financial protection statutes. As proposed, the CFPA’s authority would cover all consumer financial products including any loan, deposit account orother financial product. The proposal would also give states the authority to enforce federal laws regardless of a bank’s charter, and it would abolish federalpreemption of conflicting state consumer protection laws, requiring national banks to meet up to 50 separate sets of standards.
In January 2010, the President also proposed implementing “Volcker Rule” limitations that would prohibit insured depository institutions and certain otherfinancial entities from engaging in proprietary trading and place new restrictions on the size and scope of banks and other financial institutions. Specifically, nobank would be permitted to “own, invest in or sponsor a hedge fund or a private equity fund, or proprietary trading operations unrelated to serving customers forits own profit” and broader limits would be placed on increases in the market share of liabilities at the largest financial firms to supplement existing limitationswith respect to the market share of deposits.
On December 11, 2009, the House passed the Wall Street Reform and Consumer Protection Act (the “Wall Street Reform Act”). The legislation would create theCFPA and the new agency would have oversight over most consumer protection
40
Table of Contents
laws (except the Community Reinvestment Act) 180 days after the bill is enacted into law. The Wall Street Reform Act allows for federal preemption of stateconsumer protection laws only in cases where the state laws “prevent, significantly interfere with, or materially impair” the ability of national banks to engage inthe business of banking.
Additionally, the Wall Street Reform Act addresses systemic risk and resolution authority in a number of ways. First, it would create an inter-agency FinancialServices Oversight Council (FSOC) that would identify and regulate financial institutions that pose systemic risks, and these institutions would be subject toheightened oversight and regulation. The Wall Street Reform Act also establishes a process for dismantling failing, systemically risky firms and requiresassessments of financial companies with over $50 billion in assets to pay for a Systemic Dissolution Fund.
The Wall Street Reform Act would also make certain changes to the manner in which fees are assessed against financial institutions by the FDIC. First, theamount of the FDIC’s assessment would be determined based on average total assets less average tangible equity as opposed to total domestic deposits. Second,the considerations that the FDIC utilizes in its risk-based assessment formula would be modified to include the risks to the deposit insurance fund posed by theuninsured affiliates of the depository institution. Third, the FDIC would be required to consider off-balance sheet exposures when setting its rates. The FDIC’scurrent authority to establish separate assessment systems for large and small institutions would be eliminated. Furthermore, regulatory agencies would berequired to adopt joint regulations requiring creditors and securitizers to retain at least five percent of the credit risk with respect to such credit or security andprohibit the hedge or transfer of such risk. The agencies could reduce or increase the five percent requirement depending on the circumstances.
The Wall Street Reform Act also addresses shareholder measures, including requiring public companies to provide shareholders with a non-binding vote withrespect to executive compensation and to have a compensation committee comprised solely of independent directors. Additionally, the federal banking regulators,the Securities and Exchange Commission (SEC), and the Federal Housing Finance Agency (FHFA) would be required to jointly issue regulations prohibiting anycompensation package that encourages executives to take risks that could seriously affect the economy or threaten a financial institution’s safety and soundness.The act also includes substantial portions of H.R. 1728, the Mortgage Reform and Anti-Predatory Lending Act, which the House passed in May 2009 (anddiscussed below in “Housing and Mortgage Lending”).
On March 24, 2010, the Senate Banking Committee passed the Wall Street Transparency and Accountability Act of 2010 (the “Wall Street Transparency andAccountability Act”). The Senate legislation as passed by the Senate Banking Committee also includes a Consumer Financial Protection Bureau (CFBP) in placeof the House CFPA model. The CFPB would be housed within the Federal Reserve but is autonomous under the statute. Similar to the House legislation asdiscussed above, the Wall Street Transparency and Accountability Act, if passed by the Senate, would create a FSOC to oversee systemic risk in the system, placea five percent risk retention requirement, and add corporate governance standards. The Wall Street Transparency and Accountability Act does not include themortgage reform title; however, “Volcker Rule” prohibitions on proprietary trading and various limitations on the use of derivatives, including required centralclearing and/or imposing new margin and capital requirements, were included. The full Senate began debate on the Wall Street Transparency and AccountabilityAct on Thursday, April 29, 2010, and the components of the legislation remain fluid as many amendments are contemplated. It is believed that the Senate willspend several weeks considering the legislation. It is too early to reliably assess the impact of the various measures outlined in the Wall Street Transparency andAccountability Act or the Wall Street Reform Act.
Proposed TARP Assessment
In January 2010, the President announced additional proposals that would impact financial institutions. The first proposal would levy a new tax on institutionswithin the financial sector to recoup the benefits certain institutions have received under government assistance programs, including TARP. The annual fee wouldbe assessed at a rate of 15 basis points of “covered liabilities” for financial firms with more than $50 billion in consolidated assets (excluding Tier 1 capital,FDIC-assessed deposits and insurance policy reserves). To date, Congress has not put forth legislation on this issue. If the proposal is enacted as described above,the impact to the Company is estimated to be approximately $154 million.
Housing and Mortgage Lending
Since 2008, Congress has also focused on the housing market, looking at both retrospective and prospective solutions. In July 2008, legislation was enacted tocreate additional federal backstops and strengthen regulation of the Government
41

Table of Contents
Sponsored Enterprises (“GSEs”), including an overhaul of the Federal Housing Administration (“FHA”) programs. In May 2009, H.R. 1728, the “MortgageReform and Anti-Predatory Lending Act” was passed in the House. The legislation would place a federal duty of care on mortgage originators, lower thethreshold for loans covered under the Home Ownership and Equity Protection Act (HOEPA), as well as address assignee liability and require that securitizersretain access to all loans packaged and sold. As discussed above, in December 2009, this legislation was included in the Wall Street Reform Act that passed theU.S. House.
In May 2009, the President signed the “Helping Families Save Their Homes Act” which provides various types of foreclosure relief and changes to the mortgagemarketplace. Among other things, the law would require the OCC, OTS and HUD to report to Congress on the number and type of loan modifications made byentities under their supervision; provide a limited safe harbor for any mortgage loan servicer that enters into a “qualified loss mitigation plan” with a borrowerwhose loan is held in a securitization vehicle; make various changes to the HOPE for Homeowners Act of 2008 (H4H) by providing greater incentives formortgage servicers to engage in modifications and reducing administrative burdens on loan underwriters; require new owners of mortgage loans to give notice toborrowers of the sale, transfer or assignment of the loan within 30 days of such sale, transfer or assignment and to provide certain information; and require 90days notice to terminate the lease of a bona fide tenant of a foreclosed-upon dwelling.
Bankruptcy
There have been several proposals in Congress to modify the bankruptcy laws to permit homeowners at risk of foreclosure to receive a modification of theirprimary mortgages. On October 20, 2008, President Bush signed the “National Guard and Reservists Debt Relief Act of 2008,” making bankruptcy filings easierfor national guardsmen and reservists.
Broad bankruptcy legislation that could be seen as creating incentives for consumers to choose Chapter 13 bankruptcy as a primary remedy for mortgage relatedproblems was also introduced in 2009. This legislation passed the U.S. House in March 2009; however, when it was offered as an amendment to a separate bill inthe U.S. Senate, it was defeated. The Senate sponsor, Senator Dick Durbin, has stated he intends to continue working to enact the legislation and will use otheravailable legislative vehicles, including reintroducing the amendment at a later date. During the House consideration of the comprehensive regulatory reform billin December 2009, the bankruptcy amendment was offered, but failed. Finally, Senators Whitehouse (D-RI) and Durbin have introduced legislation to disallowclaims arising from “high cost consumer credit” in bankruptcy proceedings. The Senate Judiciary Committee has yet to take action on the bill; however, the billwas placed on the Committee calendar for consideration but has not been brought up for debate and vote.
Please see “Compliance With New and Existing Laws and Regulations May Increase Our Costs, Reduce Our Revenue, Limit Our Ability To Pursue BusinessOpportunities, And Increase Compliance Challenges” under Item 1A. Risk Factors in our 2009 Form 10-K for a discussion of the risks posed to the Company as aresult of the current legislative environment.
Regulation of International Business by Non—U.S. Authorities
COBNA is subject to regulation in foreign jurisdictions where it currently operates. In the United Kingdom, COBNA operates through the U.K. Bank, which wasestablished in 2000. The U.K. Bank is regulated by the Financial Services Authority (“FSA”) and licensed by the Office of Fair Trading (“OFT”). The U.K. Bankis an “authorized deposit taker” and thus is able to take consumer deposits in the U.K. However, the U.K Bank no longer takes deposits following the sale of itsdeposits business in 2009. The U.K. Bank also has been granted a full license by the OFT to issue consumer credit under the U.K.’s Consumer Credit Act. TheFSA requires the U.K. Bank to maintain certain regulatory capital ratios at all times and it may modify those requirements at any time. Effective January 1, 2008,the U.K. Bank became subject to new capital adequacy requirements implemented by the FSA as a result of the U.K.’s adoption of the European CapitalRequirements Directive, itself an implementation of the Basel II Accord. The U.K. Bank obtains capital through earnings or through capital infusion fromCOBNA, subject to prior notice requirements under Regulation K of the rules administered by the Federal Reserve. If the U.K. Bank is unable to generate ormaintain sufficient capital on favorable terms, it may choose to restrict its growth to reduce the regulatory capital required. Following the introduction of theCapital Requirements Directive, the U.K. Bank continues to have a capital surplus and the impact of the new capital regime has been fully factored into the U.K.Bank’s financial and capital planning. In addition, the U.K. Bank is limited by the U.K. Companies Act in its distribution of dividends to COBNA via itsimmediate parent undertakings, Capital One Investment Limited and Capital One Holdings Limited, since dividends may only be paid out of the U.K. Bank’s“distributable profits.”
42
Table of Contents
In July 2009, the U.K. government published “Review of the Regulation of Credit and Store Cards,” a report on the credit card industry, and issued a formalconsultation in October 2009. The report and consultation focus on the allocation of payments, minimum payment increases, unsolicited credit limit increases,and repricing. The U.K. government is soliciting comments from consumers and the credit card industry, and is expected to propose legislative changes in thesecond quarter of 2010.
In addition, the U.K. government has proposed a Financial Services Bill which is currently before Parliament that would restrict the issuance of unsolicited creditcard checks. If passed as proposed, credit card issuers would not be able to issue credit card checks unless requested by a cardholder and each request would belimited to up to three checks.
Following the passing of the Consumer Credit Directive (the “CCD”) by the European Commission (the “EC”), the U.K consumer credit regime, including thelaws and regulations with respect to the marketing of consumer credit products and the design of and disclosure in consumer credit agreements, is due to changesignificantly. The CCD is also introducing new regulations requiring that certain information be provided to consumers before a credit agreement is entered intoand explicit requirements to ensure that any such consumer is creditworthy. The CCD is required to be implemented into U.K law by June 11, 2010, althoughthere are indications that there may be a delay in this implementation timeframe.
The OFT is investigating Visa and MasterCard’s current methods of setting interchange fees applicable to U.K. domestic transactions. Cross-border interchangefees are also coming under scrutiny from the European Commission, which in December 2007 issued a decision notice stating that MasterCard’s interchange feesapplicable to cross border transactions are in breach of European Competition Law. MasterCard has appealed this decision. A similar decision is expected inrelation to Visa’s cross border interchange fees. The timing of any final resolution of the matter by EC or OFT is uncertain and it is unlikely that there will be anydetermination before the end of 2011. However, it is likely that interchange fees will be reduced, which could adversely affect the yield on U.K. credit cardportfolios.
Following a referral by the OFT, the Competition Commission (the “CC”) launched a market investigation into the supply of Payment Protection Insurance(“PPI”) in the U.K. PPI on mortgages, credit cards, unsecured loans (personal loans, motor loans and hire purchase) and secured loans is included. The CCpublished its final report on remedies on January 29, 2009, which included point of sale changes and the introduction of an annual PPI statement to customers. Atthe end of 2009, Barclays Bank successfully challenged the remedies package at the Competition Appeals Tribunal and the CC is currently revisiting itsproposals. The new provisional remedies package is expected to be delivered in May 2010, followed by a consultation period at which point the U.K Bank will beable to assess the impact of the proposed new remedies. The U.K. Bank is now expecting the remedies will not be implemented until 2011.
As in the U.S., in non-U.S. jurisdictions where we operate, we face a risk that the laws and regulations that are applicable to us (or the interpretations of existinglaws by relevant regulators) may change in ways that adversely impact our business.
For additional information on our Supervision and Regulation activities, see our 2009 Form 10-K “Part I—Item 1. Business—Supervision and Regulation. Wediscuss the risks to the company resulting from the current legislative environment in our 2009 Form 10-K in “Part I—Item 1A. Risk Factors.” XV. ENTERPRISE RISK MANAGEMENT Our business activities expose us to four major categories of risks: liquidity risk, credit risk, reputational risk and capital adequacy. We also are exposed to marketrisk, strategic risk, operational risk, compliance risk and legal risk. Our risk management framework is intended to identify, assess, and mitigate risks that affector have the potential to affect our business, to target financial returns commensurate with our risk appetite, and to avoid excessive risk-taking. We follow threekey principles related to this policy.
1. Individual businesses take and manage risk in pursuit of strategic, financial, and other business objectives.
2. Independent risk management organizations support individual businesses by providing risk management tools and policies, and by aggregating risks; insome cases, risks are managed centrally.
43
Table of Contents
3. The Board of Directors and top management review our aggregate risk position and establish the risk appetite.
We provide additional information on our enterprise risk management framework and activities in our 2009 Form 10-K in “Part I—Item 1. Business—EnterpriseRisk Management.” XVI. FORWARD-LOOKING STATEMENTS From time to time, we have made and will make forward-looking statements, including those that discuss, among other things, strategies, goals, outlook or othernon-historical matters; projections, revenues, income, returns, earnings per share or other financial measures for Capital One; future financial and operatingresults; and Capital One’s plans, objectives, expectations and intentions; and the assumptions that underlie these matters. To the extent that any such informationis forward-looking, it is intended to fit within the safe harbor for forward-looking information provided by the Private Securities Litigation Reform Act of 1995.Numerous factors could cause our actual results to differ materially from those described in such forward-looking statements, including, among other things:
• general economic and business conditions in the U.S., the U.K., or Capital One’s local markets, including conditions affecting employment levels, interestrates, consumer income and confidence, spending and savings that may affect consumer bankruptcies, defaults, charge-offs and deposit activity;
• an increase or decrease in credit losses (including increases due to a worsening of general economic conditions in the credit environment);
• financial, legal, regulatory, tax or accounting changes or actions, including with respect to any litigation matter involving Capital One;
• increases or decreases in interest rates;
• the success of our marketing efforts in attracting and retaining customers;
• the ability of the company to continue to securitize its credit cards and consumer loans and to otherwise access the capital markets at attractive rates andterms to capitalize and fund its operations and future growth;
• with respect to financial and other products, increases or decreases in our aggregate loan balances and/or the number of customers and the growth rate andcomposition thereof, including increases or decreases resulting from factors such as shifting product mix, amount of actual marketing expenses made byCapital One and attrition of loan balances;
• the amount and rate of deposit growth;
• our ability to control costs;
• changes in the reputation of or expectations regarding the financial services industry and/or Capital One with respect to practices, products or financialcondition;
• any significant disruption in our operations or technology platform;
• our ability to maintain a compliance infrastructure suitable for its size and complexity;
• the amount of, and rate of growth in, our expenses as our business develops or changes or as it expands into new market areas;
• our ability to execute on its strategic and operational plans;
• any significant disruption of, or loss of public confidence in, the United States Mail service affecting our response rates and consumer payments;
• our ability to recruit and retain experienced personnel to assist in the management and operations of new products and services;
• changes in the labor and employment markets;
• the risk that cost savings and any other synergies from our acquisitions may not be fully realized or may take longer to realize than expected;
44

Table of Contents
• disruptions from our acquisitions negatively impacting our ability to maintain relationships with customers, employees or suppliers;
• competition from providers of products and services that compete with our businesses; and
• other risk factors listed from time to time in reports that Capital One files with the Securities and Exchange Commission (the “SEC”), including, but notlimited to, our 2009 Form 10-K.
• Any forward-looking statements made by or on behalf of Capital One speak only as of the date they are made or as of the date indicated, and Capital Onedoes not undertake any obligation to update forward-looking statements as a result of new information, future events or otherwise. You should carefullyconsider the factors discussed above in evaluating these forward-looking statements. For additional information on factors that could materially influenceforward-looking statements included in this report, see the risk factors in this report in “Part II —Item 1A. Risk Factors” and in our 2009 Form 10-K in“Part I—Item 1A. Risk Factors.”
45
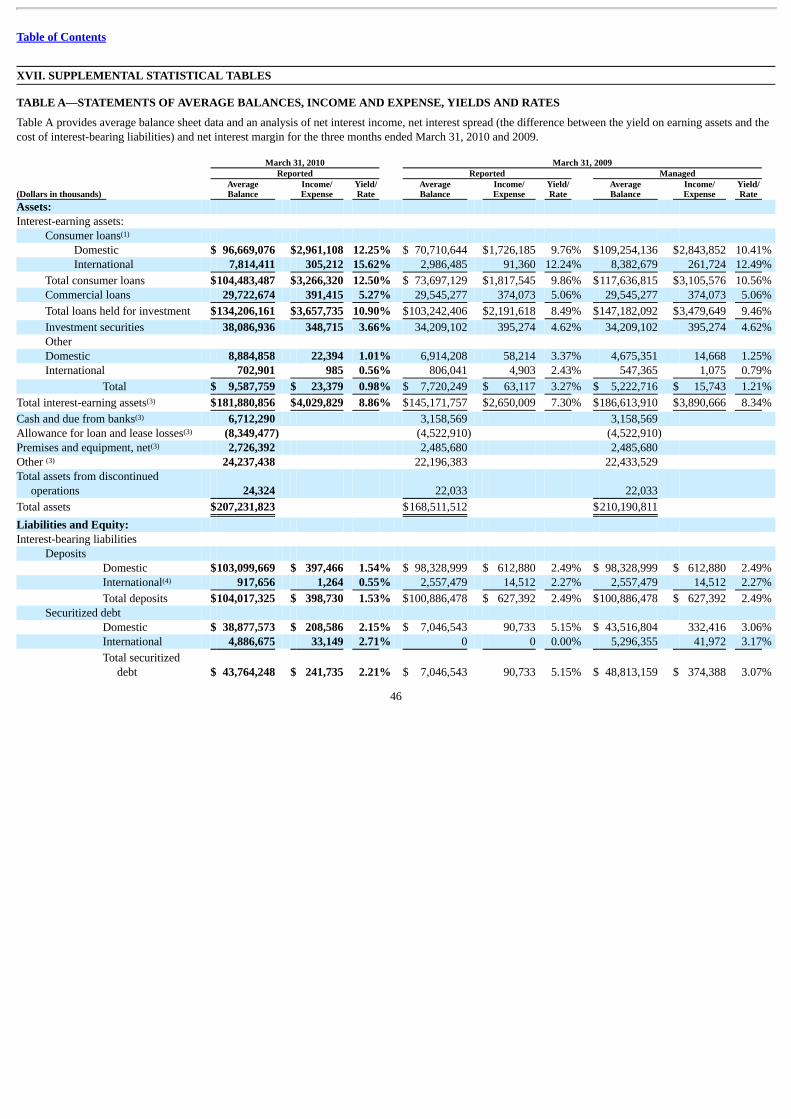
Table of Contents
XVII. SUPPLEMENTAL STATISTICAL TABLES TABLE A—STATEMENTS OF AVERAGE BALANCES, INCOME AND EXPENSE, YIELDS AND RATES
Table A provides average balance sheet data and an analysis of net interest income, net interest spread (the difference between the yield on earning assets and thecost of interest-bearing liabilities) and net interest margin for the three months ended March 31, 2010 and 2009. March 31, 2010 March 31, 2009 Reported Reported Managed
(Dollars in thousands) AverageBalance
Income/Expense
Yield/Rate
AverageBalance
Income/Expense
Yield/Rate
AverageBalance
Income/Expense
Yield/Rate
Assets: Interest-earning assets:
Consumer loans Domestic $ 96,669,076 $2,961,108 12.25% $ 70,710,644 $1,726,185 9.76% $109,254,136 $2,843,852 10.41% International 7,814,411 305,212 15.62% 2,986,485 91,360 12.24% 8,382,679 261,724 12.49%
Total consumer loans $104,483,487 $3,266,320 12.50% $ 73,697,129 $1,817,545 9.86% $117,636,815 $3,105,576 10.56% Commercial loans 29,722,674 391,415 5.27% 29,545,277 374,073 5.06% 29,545,277 374,073 5.06%
Total loans held for investment $134,206,161 $3,657,735 10.90% $103,242,406 $2,191,618 8.49% $147,182,092 $3,479,649 9.46%
Investment securities 38,086,936 348,715 3.66% 34,209,102 395,274 4.62% 34,209,102 395,274 4.62% Other Domestic 8,884,858 22,394 1.01% 6,914,208 58,214 3.37% 4,675,351 14,668 1.25% International 702,901 985 0.56% 806,041 4,903 2.43% 547,365 1,075 0.79%
Total $ 9,587,759 $ 23,379 0.98% $ 7,720,249 $ 63,117 3.27% $ 5,222,716 $ 15,743 1.21%
Total interest-earning assets $181,880,856 $4,029,829 8.86% $145,171,757 $2,650,009 7.30% $186,613,910 $3,890,666 8.34%
Cash and due from banks 6,712,290 3,158,569 3,158,569 Allowance for loan and lease losses (8,349,477) (4,522,910) (4,522,910) Premises and equipment, net 2,726,392 2,485,680 2,485,680 Other 24,237,438 22,196,383 22,433,529 Total assets from discontinued
operations 24,324 22,033 22,033
Total assets $207,231,823 $168,511,512 $210,190,811
Liabilities and Equity: Interest-bearing liabilities
Deposits Domestic $103,099,669 $ 397,466 1.54% $ 98,328,999 $ 612,880 2.49% $ 98,328,999 $ 612,880 2.49% International 917,656 1,264 0.55% 2,557,479 14,512 2.27% 2,557,479 14,512 2.27%
Total deposits $104,017,325 $ 398,730 1.53% $100,886,478 $ 627,392 2.49% $100,886,478 $ 627,392 2.49% Securitized debt
Domestic $ 38,877,573 $ 208,586 2.15% $ 7,046,543 90,733 5.15% $ 43,516,804 332,416 3.06% International 4,886,675 33,149 2.71% 0 0 0.00% 5,296,355 41,972 3.17%
Total securitizeddebt $ 43,764,248 $ 241,735 2.21% $ 7,046,543 90,733 5.15% $ 48,813,159 $ 374,388 3.07%
46
(1)
(3)
(3)
(3)
(3)
(3)
(4)
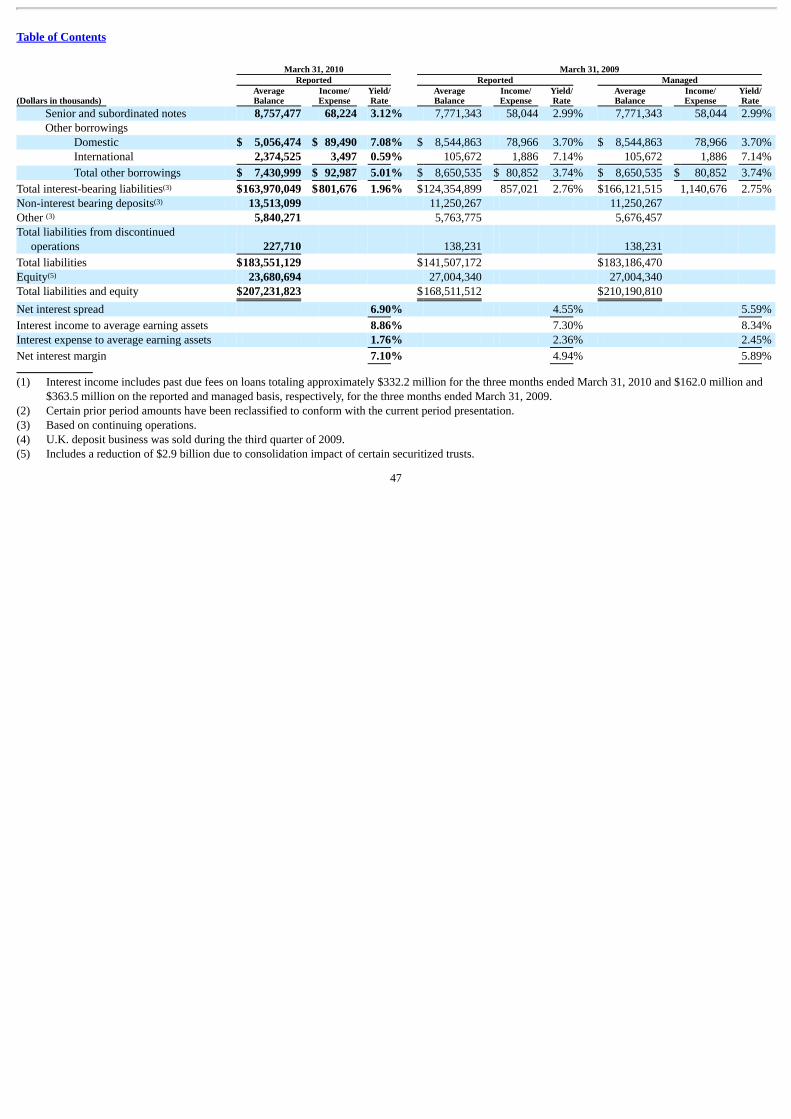
Table of Contents
March 31, 2010 March 31, 2009 Reported Reported Managed
(Dollars in thousands) AverageBalance
Income/Expense
Yield/Rate
AverageBalance
Income/Expense
Yield/Rate
AverageBalance
Income/Expense
Yield/Rate
Senior and subordinated notes 8,757,477 68,224 3.12% 7,771,343 58,044 2.99% 7,771,343 58,044 2.99% Other borrowings
Domestic $ 5,056,474 $ 89,490 7.08% $ 8,544,863 78,966 3.70% $ 8,544,863 78,966 3.70% International 2,374,525 3,497 0.59% 105,672 1,886 7.14% 105,672 1,886 7.14%
Total other borrowings $ 7,430,999 $ 92,987 5.01% $ 8,650,535 $ 80,852 3.74% $ 8,650,535 $ 80,852 3.74%
Total interest-bearing liabilities $163,970,049 $801,676 1.96% $124,354,899 857,021 2.76% $166,121,515 1,140,676 2.75% Non-interest bearing deposits 13,513,099 11,250,267 11,250,267 Other 5,840,271 5,763,775 5,676,457 Total liabilities from discontinued
operations 227,710 138,231 138,231
Total liabilities $183,551,129 $141,507,172 $183,186,470 Equity 23,680,694 27,004,340 27,004,340 Total liabilities and equity $207,231,823 $168,511,512 $210,190,810
Net interest spread 6.90% 4.55% 5.59%
Interest income to average earning assets 8.86% 7.30% 8.34% Interest expense to average earning assets 1.76% 2.36% 2.45%
Net interest margin 7.10% 4.94% 5.89%
(1) Interest income includes past due fees on loans totaling approximately $332.2 million for the three months ended March 31, 2010 and $162.0 million and
$363.5 million on the reported and managed basis, respectively, for the three months ended March 31, 2009.(2) Certain prior period amounts have been reclassified to conform with the current period presentation.(3) Based on continuing operations.(4) U.K. deposit business was sold during the third quarter of 2009.(5) Includes a reduction of $2.9 billion due to consolidation impact of certain securitized trusts.
47
(3)
(3)
(3)
(5)
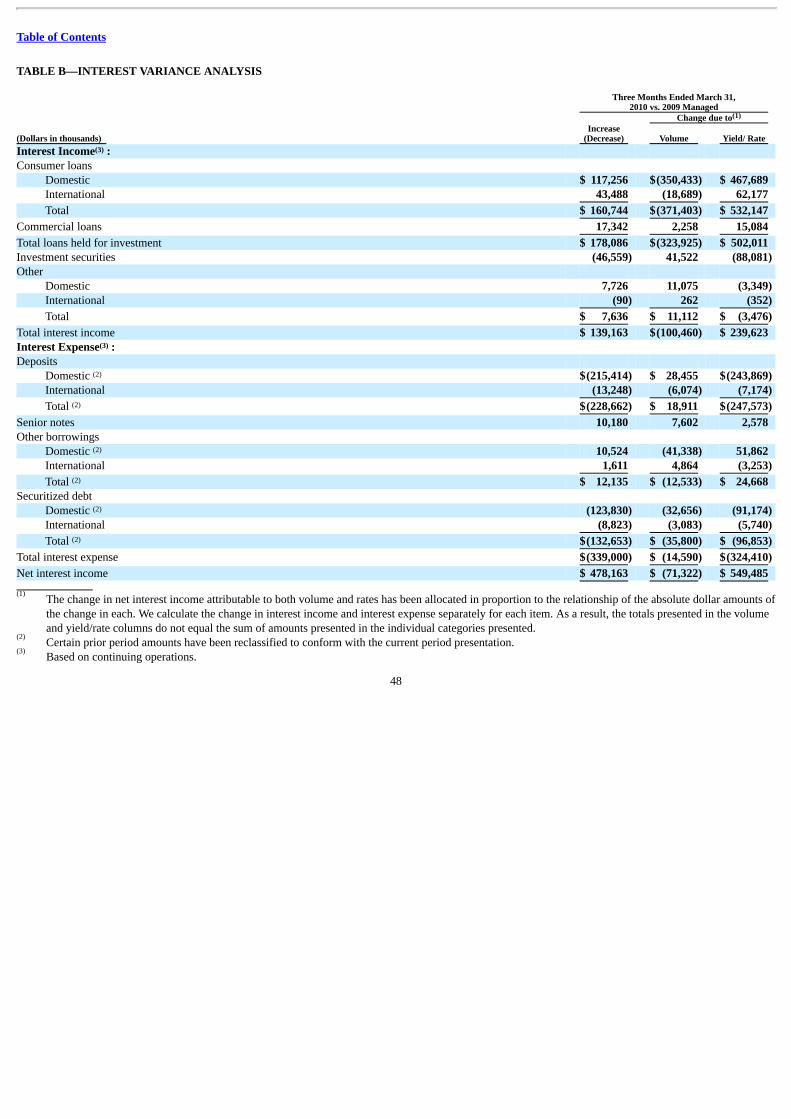
Table of Contents
TABLE B—INTEREST VARIANCE ANALYSIS
Three Months Ended March 31,
2010 vs. 2009 Managed Change due to
(Dollars in thousands) Increase
(Decrease) Volume Yield/ Rate Interest Income : Consumer loans
Domestic $ 117,256 $(350,433) $ 467,689 International 43,488 (18,689) 62,177
Total $ 160,744 $(371,403) $ 532,147
Commercial loans 17,342 2,258 15,084
Total loans held for investment $ 178,086 $(323,925) $ 502,011 Investment securities (46,559) 41,522 (88,081) Other
Domestic 7,726 11,075 (3,349) International (90) 262 (352)
Total $ 7,636 $ 11,112 $ (3,476)
Total interest income $ 139,163 $(100,460) $ 239,623 Interest Expense : Deposits
Domestic $(215,414) $ 28,455 $(243,869) International (13,248) (6,074) (7,174)
Total $(228,662) $ 18,911 $(247,573)
Senior notes 10,180 7,602 2,578 Other borrowings
Domestic 10,524 (41,338) 51,862 International 1,611 4,864 (3,253)
Total $ 12,135 $ (12,533) $ 24,668 Securitized debt
Domestic (123,830) (32,656) (91,174) International (8,823) (3,083) (5,740)
Total $(132,653) $ (35,800) $ (96,853)
Total interest expense $(339,000) $ (14,590) $(324,410)
Net interest income $ 478,163 $ (71,322) $ 549,485
The change in net interest income attributable to both volume and rates has been allocated in proportion to the relationship of the absolute dollar amounts ofthe change in each. We calculate the change in interest income and interest expense separately for each item. As a result, the totals presented in the volumeand yield/rate columns do not equal the sum of amounts presented in the individual categories presented.Certain prior period amounts have been reclassified to conform with the current period presentation.Based on continuing operations.
48
(1)
(3)
(3)
(2)
(2)
(2)
(2)
(2)
(2)
(1)
(2)
(3)
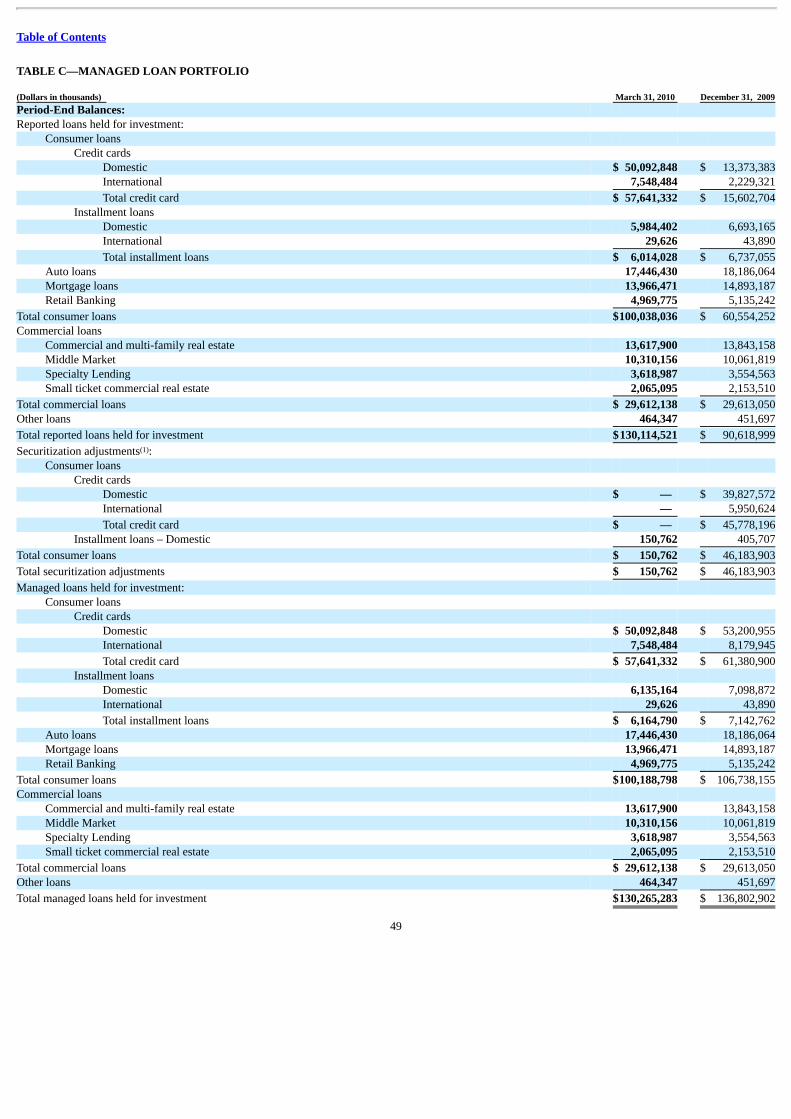
Table of Contents
TABLE C—MANAGED LOAN PORTFOLIO (Dollars in thousands) March 31, 2010 December 31, 2009Period-End Balances: Reported loans held for investment:
Consumer loans Credit cards
Domestic $ 50,092,848 $ 13,373,383International 7,548,484 2,229,321
Total credit card $ 57,641,332 $ 15,602,704Installment loans
Domestic 5,984,402 6,693,165International 29,626 43,890
Total installment loans $ 6,014,028 $ 6,737,055Auto loans 17,446,430 18,186,064Mortgage loans 13,966,471 14,893,187Retail Banking 4,969,775 5,135,242
Total consumer loans $100,038,036 $ 60,554,252Commercial loans
Commercial and multi-family real estate 13,617,900 13,843,158Middle Market 10,310,156 10,061,819Specialty Lending 3,618,987 3,554,563Small ticket commercial real estate 2,065,095 2,153,510
Total commercial loans $ 29,612,138 $ 29,613,050Other loans 464,347 451,697
Total reported loans held for investment $130,114,521 $ 90,618,999
Securitization adjustments : Consumer loans
Credit cards Domestic $ — $ 39,827,572International — 5,950,624
Total credit card $ — $ 45,778,196Installment loans – Domestic 150,762 405,707
Total consumer loans $ 150,762 $ 46,183,903
Total securitization adjustments $ 150,762 $ 46,183,903
Managed loans held for investment: Consumer loans
Credit cards Domestic $ 50,092,848 $ 53,200,955International 7,548,484 8,179,945
Total credit card $ 57,641,332 $ 61,380,900Installment loans
Domestic 6,135,164 7,098,872International 29,626 43,890
Total installment loans $ 6,164,790 $ 7,142,762Auto loans 17,446,430 18,186,064Mortgage loans 13,966,471 14,893,187Retail Banking 4,969,775 5,135,242
Total consumer loans $100,188,798 $ 106,738,155Commercial loans
Commercial and multi-family real estate 13,617,900 13,843,158Middle Market 10,310,156 10,061,819Specialty Lending 3,618,987 3,554,563Small ticket commercial real estate 2,065,095 2,153,510
Total commercial loans $ 29,612,138 $ 29,613,050Other loans 464,347 451,697
Total managed loans held for investment $130,265,283 $ 136,802,902
49
(1)
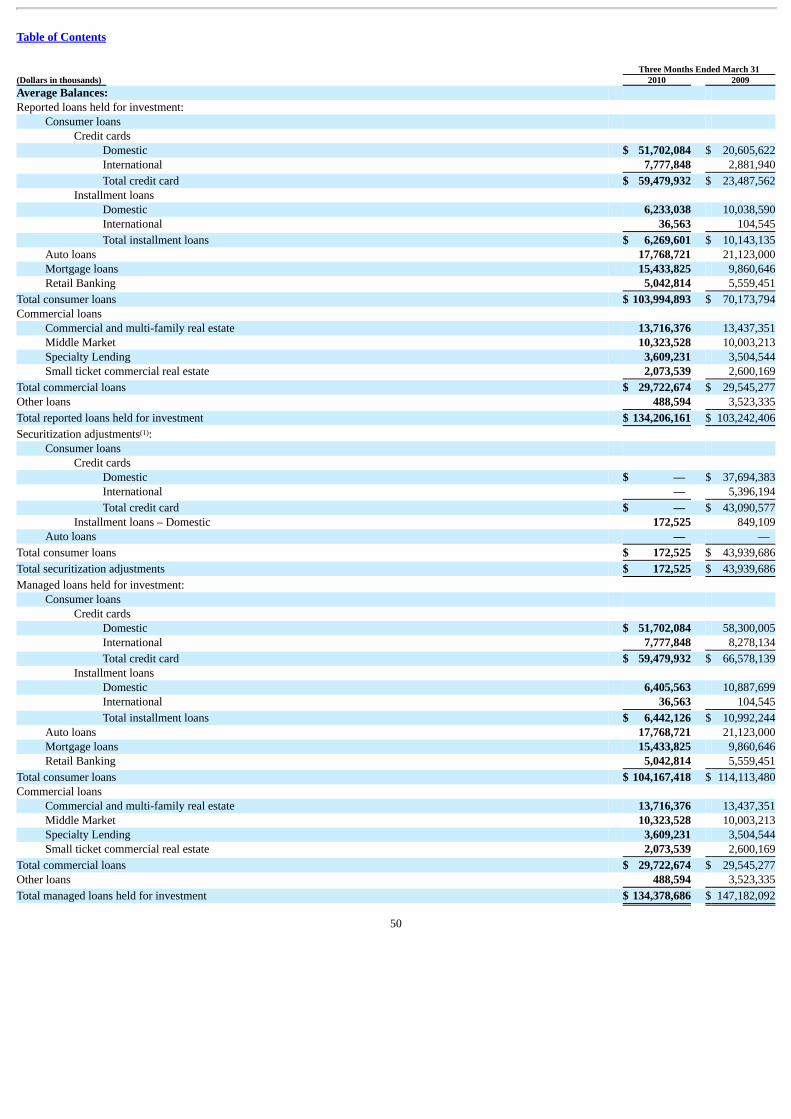
Table of Contents
Three Months Ended March 31(Dollars in thousands) 2010 2009Average Balances: Reported loans held for investment:
Consumer loans Credit cards
Domestic $ 51,702,084 $ 20,605,622International 7,777,848 2,881,940
Total credit card $ 59,479,932 $ 23,487,562Installment loans
Domestic 6,233,038 10,038,590International 36,563 104,545
Total installment loans $ 6,269,601 $ 10,143,135Auto loans 17,768,721 21,123,000Mortgage loans 15,433,825 9,860,646Retail Banking 5,042,814 5,559,451
Total consumer loans $ 103,994,893 $ 70,173,794Commercial loans
Commercial and multi-family real estate 13,716,376 13,437,351Middle Market 10,323,528 10,003,213Specialty Lending 3,609,231 3,504,544Small ticket commercial real estate 2,073,539 2,600,169
Total commercial loans $ 29,722,674 $ 29,545,277Other loans 488,594 3,523,335
Total reported loans held for investment $ 134,206,161 $ 103,242,406
Securitization adjustments : Consumer loans
Credit cards Domestic $ — $ 37,694,383International — 5,396,194
Total credit card $ — $ 43,090,577Installment loans – Domestic 172,525 849,109
Auto loans — —
Total consumer loans $ 172,525 $ 43,939,686
Total securitization adjustments $ 172,525 $ 43,939,686
Managed loans held for investment: Consumer loans
Credit cards Domestic $ 51,702,084 58,300,005International 7,777,848 8,278,134
Total credit card $ 59,479,932 $ 66,578,139Installment loans
Domestic 6,405,563 10,887,699International 36,563 104,545
Total installment loans $ 6,442,126 $ 10,992,244Auto loans 17,768,721 21,123,000Mortgage loans 15,433,825 9,860,646Retail Banking 5,042,814 5,559,451
Total consumer loans $ 104,167,418 $ 114,113,480Commercial loans
Commercial and multi-family real estate 13,716,376 13,437,351Middle Market 10,323,528 10,003,213Specialty Lending 3,609,231 3,504,544Small ticket commercial real estate 2,073,539 2,600,169
Total commercial loans $ 29,722,674 $ 29,545,277Other loans 488,594 3,523,335
Total managed loans held for investment $ 134,378,686 $ 147,182,092
50
(1)
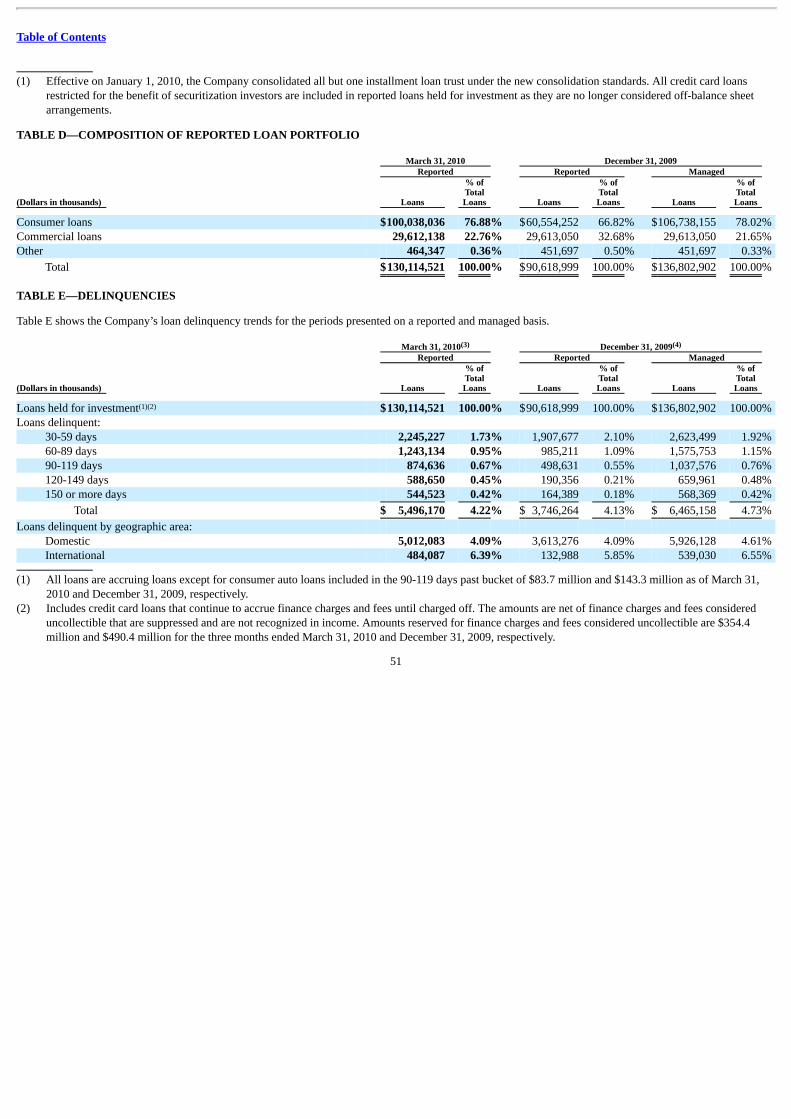
Table of Contents
(1) Effective on January 1, 2010, the Company consolidated all but one installment loan trust under the new consolidation standards. All credit card loans
restricted for the benefit of securitization investors are included in reported loans held for investment as they are no longer considered off-balance sheetarrangements.
TABLE D—COMPOSITION OF REPORTED LOAN PORTFOLIO March 31, 2010 December 31, 2009 Reported Reported Managed
(Dollars in thousands) Loans
% ofTotalLoans Loans
% ofTotalLoans Loans
% ofTotalLoans
Consumer loans $100,038,036 76.88% $60,554,252 66.82% $106,738,155 78.02% Commercial loans 29,612,138 22.76% 29,613,050 32.68% 29,613,050 21.65% Other 464,347 0.36% 451,697 0.50% 451,697 0.33%
Total $130,114,521 100.00% $90,618,999 100.00% $136,802,902 100.00%
TABLE E—DELINQUENCIES
Table E shows the Company’s loan delinquency trends for the periods presented on a reported and managed basis. March 31, 2010 December 31, 2009 Reported Reported Managed
(Dollars in thousands) Loans
% ofTotalLoans Loans
% ofTotalLoans Loans
% ofTotalLoans
Loans held for investment $130,114,521 100.00% $90,618,999 100.00% $136,802,902 100.00% Loans delinquent:
30-59 days 2,245,227 1.73% 1,907,677 2.10% 2,623,499 1.92% 60-89 days 1,243,134 0.95% 985,211 1.09% 1,575,753 1.15% 90-119 days 874,636 0.67% 498,631 0.55% 1,037,576 0.76% 120-149 days 588,650 0.45% 190,356 0.21% 659,961 0.48% 150 or more days 544,523 0.42% 164,389 0.18% 568,369 0.42%
Total $ 5,496,170 4.22% $ 3,746,264 4.13% $ 6,465,158 4.73%
Loans delinquent by geographic area: Domestic 5,012,083 4.09% 3,613,276 4.09% 5,926,128 4.61% International 484,087 6.39% 132,988 5.85% 539,030 6.55%
(1) All loans are accruing loans except for consumer auto loans included in the 90-119 days past bucket of $83.7 million and $143.3 million as of March 31,
2010 and December 31, 2009, respectively.(2) Includes credit card loans that continue to accrue finance charges and fees until charged off. The amounts are net of finance charges and fees considered
uncollectible that are suppressed and are not recognized in income. Amounts reserved for finance charges and fees considered uncollectible are $354.4million and $490.4 million for the three months ended March 31, 2010 and December 31, 2009, respectively.
51
(3) (4)
(1)(2)
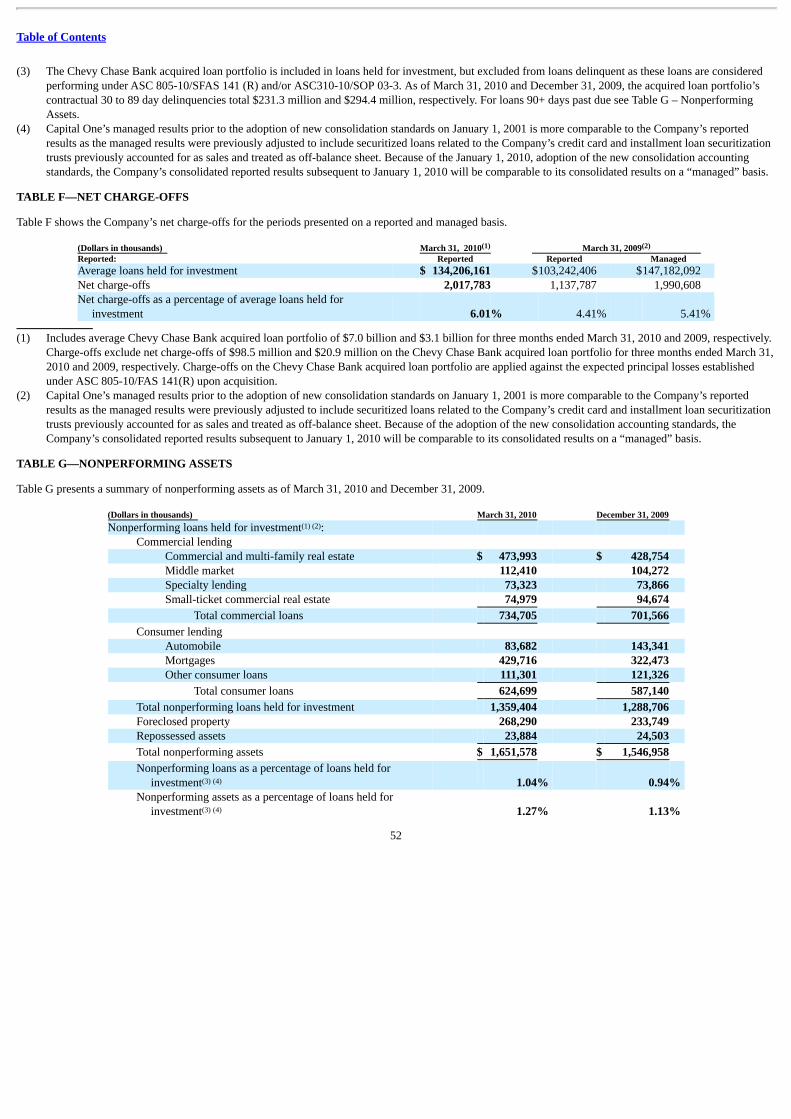
Table of Contents
(3) The Chevy Chase Bank acquired loan portfolio is included in loans held for investment, but excluded from loans delinquent as these loans are consideredperforming under ASC 805-10/SFAS 141 (R) and/or ASC310-10/SOP 03-3. As of March 31, 2010 and December 31, 2009, the acquired loan portfolio’scontractual 30 to 89 day delinquencies total $231.3 million and $294.4 million, respectively. For loans 90+ days past due see Table G – NonperformingAssets.
(4) Capital One’s managed results prior to the adoption of new consolidation standards on January 1, 2001 is more comparable to the Company’s reportedresults as the managed results were previously adjusted to include securitized loans related to the Company’s credit card and installment loan securitizationtrusts previously accounted for as sales and treated as off-balance sheet. Because of the January 1, 2010, adoption of the new consolidation accountingstandards, the Company’s consolidated reported results subsequent to January 1, 2010 will be comparable to its consolidated results on a “managed” basis.
TABLE F—NET CHARGE-OFFS
Table F shows the Company’s net charge-offs for the periods presented on a reported and managed basis.
(Dollars in thousands) March 31, 2010 March 31, 2009 Reported: Reported Reported Managed Average loans held for investment $ 134,206,161 $103,242,406 $147,182,092 Net charge-offs 2,017,783 1,137,787 1,990,608 Net charge-offs as a percentage of average loans held for
investment 6.01% 4.41% 5.41% (1) Includes average Chevy Chase Bank acquired loan portfolio of $7.0 billion and $3.1 billion for three months ended March 31, 2010 and 2009, respectively.
Charge-offs exclude net charge-offs of $98.5 million and $20.9 million on the Chevy Chase Bank acquired loan portfolio for three months ended March 31,2010 and 2009, respectively. Charge-offs on the Chevy Chase Bank acquired loan portfolio are applied against the expected principal losses establishedunder ASC 805-10/FAS 141(R) upon acquisition.
(2) Capital One’s managed results prior to the adoption of new consolidation standards on January 1, 2001 is more comparable to the Company’s reportedresults as the managed results were previously adjusted to include securitized loans related to the Company’s credit card and installment loan securitizationtrusts previously accounted for as sales and treated as off-balance sheet. Because of the adoption of the new consolidation accounting standards, theCompany’s consolidated reported results subsequent to January 1, 2010 will be comparable to its consolidated results on a “managed” basis.
TABLE G—NONPERFORMING ASSETS
Table G presents a summary of nonperforming assets as of March 31, 2010 and December 31, 2009.
(Dollars in thousands) March 31, 2010 December 31, 2009 Nonperforming loans held for investment :
Commercial lending Commercial and multi-family real estate $ 473,993 $ 428,754 Middle market 112,410 104,272 Specialty lending 73,323 73,866 Small-ticket commercial real estate 74,979 94,674
Total commercial loans 734,705 701,566
Consumer lending Automobile 83,682 143,341 Mortgages 429,716 322,473 Other consumer loans 111,301 121,326
Total consumer loans 624,699 587,140
Total nonperforming loans held for investment 1,359,404 1,288,706 Foreclosed property 268,290 233,749 Repossessed assets 23,884 24,503
Total nonperforming assets $ 1,651,578 $ 1,546,958
Nonperforming loans as a percentage of loans held forinvestment 1.04% 0.94%
Nonperforming assets as a percentage of loans held forinvestment 1.27% 1.13%
52
(1) (2)
(1) (2)
(3) (4)
(3) (4)

Table of Contents
(1) Our policy is not to classify credit card loans as nonperforming loans. We present loans that we continue to accrue interest on that are contractually past due
90 days in “Table E—Delinquencies.”(2) Excludes $1.2 billion of loans we acquired from Chevy Chase Bank as of March 31, 2010 and December 31, 2009 that were previously considered
nonperforming, as we recorded these loans at fair value at acquisition.(3) The denominator includes loans acquired from our Chevy Chase Bank acquisition totaling $6.8 billion and $7.3 billion as of March 31, 2010 and
December 31, 2009, respectively.(4) Nonperforming loans are based on our total loan portfolio, which we previously referred to as our “managed” loan portfolio. The total loan portfolio
includes loans recorded on our balance sheet and loans held in our securitization trusts.
53
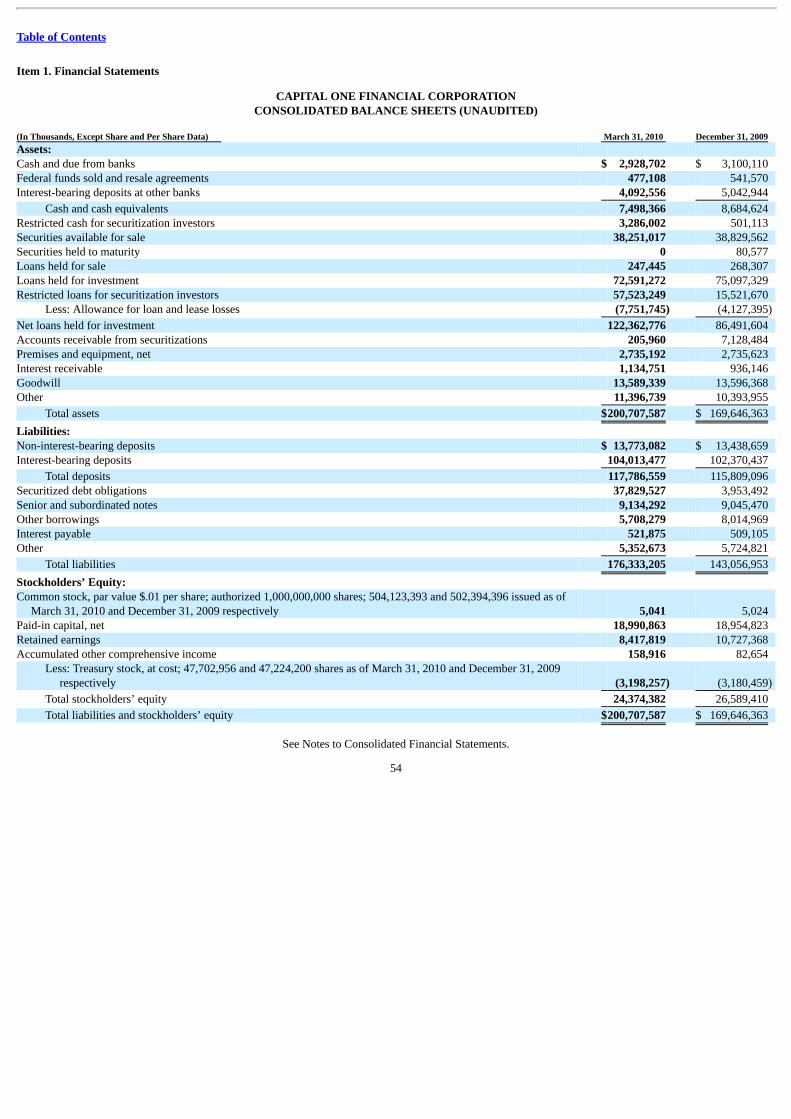
Table of Contents
Item 1. Financial Statements
CAPITAL ONE FINANCIAL CORPORATIONCONSOLIDATED BALANCE SHEETS (UNAUDITED)
(In Thousands, Except Share and Per Share Data) March 31, 2010 December 31, 2009 Assets: Cash and due from banks $ 2,928,702 $ 3,100,110 Federal funds sold and resale agreements 477,108 541,570 Interest-bearing deposits at other banks 4,092,556 5,042,944
Cash and cash equivalents 7,498,366 8,684,624 Restricted cash for securitization investors 3,286,002 501,113 Securities available for sale 38,251,017 38,829,562 Securities held to maturity 0 80,577 Loans held for sale 247,445 268,307 Loans held for investment 72,591,272 75,097,329 Restricted loans for securitization investors 57,523,249 15,521,670
Less: Allowance for loan and lease losses (7,751,745) (4,127,395)
Net loans held for investment 122,362,776 86,491,604 Accounts receivable from securitizations 205,960 7,128,484 Premises and equipment, net 2,735,192 2,735,623 Interest receivable 1,134,751 936,146 Goodwill 13,589,339 13,596,368 Other 11,396,739 10,393,955
Total assets $200,707,587 $ 169,646,363
Liabilities: Non-interest-bearing deposits $ 13,773,082 $ 13,438,659 Interest-bearing deposits 104,013,477 102,370,437
Total deposits 117,786,559 115,809,096 Securitized debt obligations 37,829,527 3,953,492 Senior and subordinated notes 9,134,292 9,045,470 Other borrowings 5,708,279 8,014,969 Interest payable 521,875 509,105 Other 5,352,673 5,724,821
Total liabilities 176,333,205 143,056,953
Stockholders’ Equity: Common stock, par value $.01 per share; authorized 1,000,000,000 shares; 504,123,393 and 502,394,396 issued as of
March 31, 2010 and December 31, 2009 respectively 5,041 5,024 Paid-in capital, net 18,990,863 18,954,823 Retained earnings 8,417,819 10,727,368 Accumulated other comprehensive income 158,916 82,654
Less: Treasury stock, at cost; 47,702,956 and 47,224,200 shares as of March 31, 2010 and December 31, 2009respectively (3,198,257) (3,180,459)
Total stockholders’ equity 24,374,382 26,589,410
Total liabilities and stockholders’ equity $200,707,587 $ 169,646,363
See Notes to Consolidated Financial Statements.
54
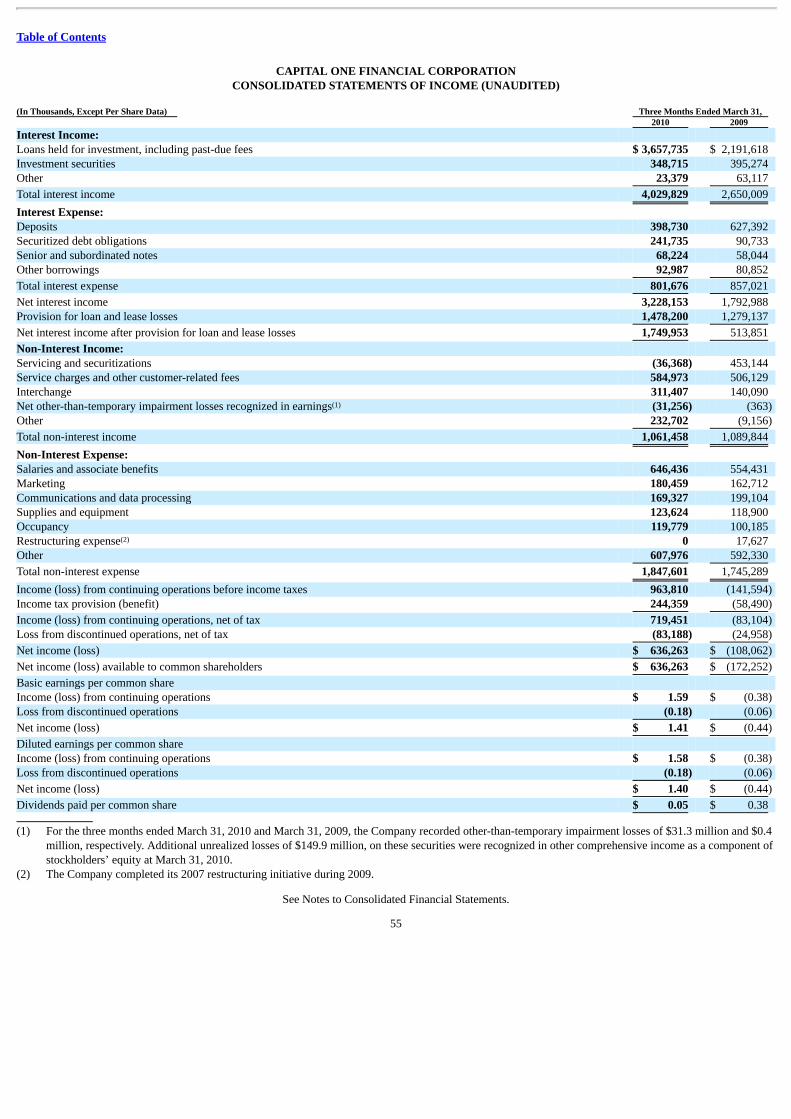
Table of Contents
CAPITAL ONE FINANCIAL CORPORATIONCONSOLIDATED STATEMENTS OF INCOME (UNAUDITED)
(In Thousands, Except Per Share Data) Three Months Ended March 31, 2010 2009 Interest Income: Loans held for investment, including past-due fees $ 3,657,735 $ 2,191,618 Investment securities 348,715 395,274 Other 23,379 63,117
Total interest income 4,029,829 2,650,009
Interest Expense: Deposits 398,730 627,392 Securitized debt obligations 241,735 90,733 Senior and subordinated notes 68,224 58,044 Other borrowings 92,987 80,852
Total interest expense 801,676 857,021
Net interest income 3,228,153 1,792,988 Provision for loan and lease losses 1,478,200 1,279,137
Net interest income after provision for loan and lease losses 1,749,953 513,851
Non-Interest Income: Servicing and securitizations (36,368) 453,144 Service charges and other customer-related fees 584,973 506,129 Interchange 311,407 140,090 Net other-than-temporary impairment losses recognized in earnings (31,256) (363) Other 232,702 (9,156)
Total non-interest income 1,061,458 1,089,844
Non-Interest Expense: Salaries and associate benefits 646,436 554,431 Marketing 180,459 162,712 Communications and data processing 169,327 199,104 Supplies and equipment 123,624 118,900 Occupancy 119,779 100,185 Restructuring expense 0 17,627 Other 607,976 592,330
Total non-interest expense 1,847,601 1,745,289
Income (loss) from continuing operations before income taxes 963,810 (141,594) Income tax provision (benefit) 244,359 (58,490)
Income (loss) from continuing operations, net of tax 719,451 (83,104) Loss from discontinued operations, net of tax (83,188) (24,958)
Net income (loss) $ 636,263 $ (108,062)
Net income (loss) available to common shareholders $ 636,263 $ (172,252)
Basic earnings per common share Income (loss) from continuing operations $ 1.59 $ (0.38) Loss from discontinued operations (0.18) (0.06)
Net income (loss) $ 1.41 $ (0.44)
Diluted earnings per common share Income (loss) from continuing operations $ 1.58 $ (0.38) Loss from discontinued operations (0.18) (0.06)
Net income (loss) $ 1.40 $ (0.44)
Dividends paid per common share $ 0.05 $ 0.38
(1) For the three months ended March 31, 2010 and March 31, 2009, the Company recorded other-than-temporary impairment losses of $31.3 million and $0.4
million, respectively. Additional unrealized losses of $149.9 million, on these securities were recognized in other comprehensive income as a component ofstockholders’ equity at March 31, 2010.
(2) The Company completed its 2007 restructuring initiative during 2009.
See Notes to Consolidated Financial Statements.
55
(1)
(2)
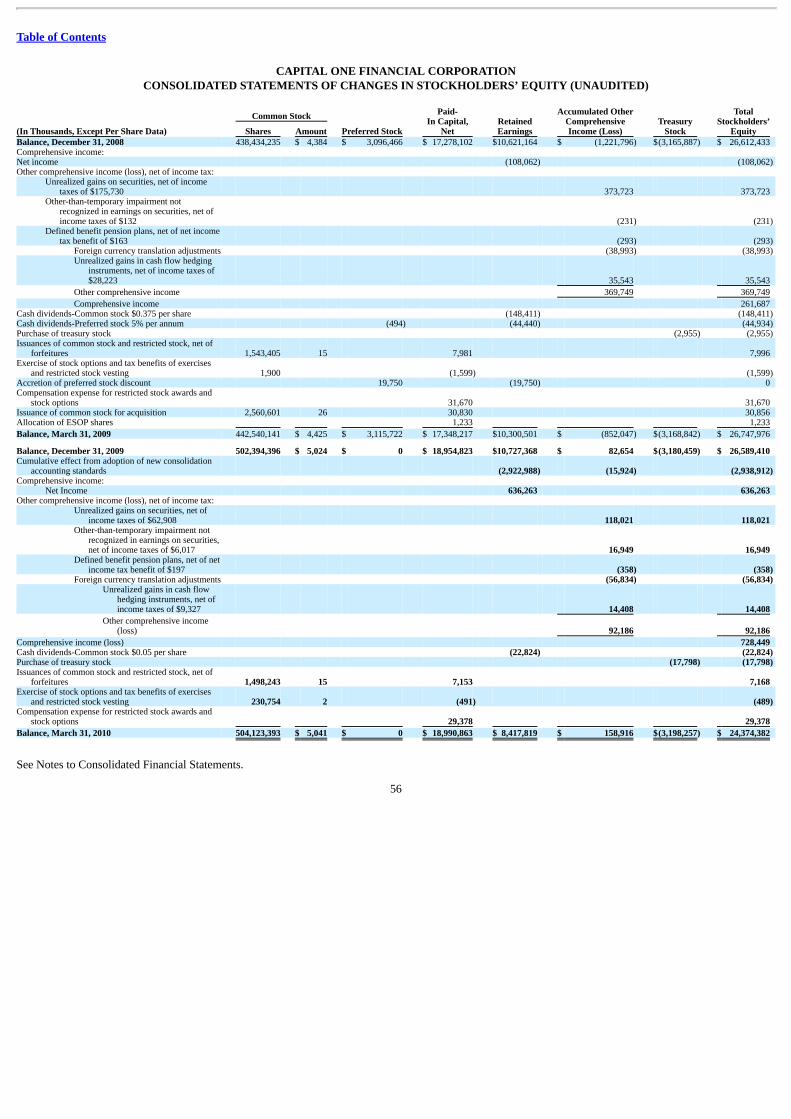
Table of Contents
CAPITAL ONE FINANCIAL CORPORATIONCONSOLIDATED STATEMENTS OF CHANGES IN STOCKHOLDERS’ EQUITY (UNAUDITED)
Common Stock
Preferred Stock
Paid-In Capital,
Net
RetainedEarnings
Accumulated OtherComprehensiveIncome (Loss)
TreasuryStock
TotalStockholders’
Equity (In Thousands, Except Per Share Data) Shares Amount Balance, December 31, 2008 438,434,235 $ 4,384 $ 3,096,466 $ 17,278,102 $10,621,164 $ (1,221,796) $(3,165,887) $ 26,612,433 Comprehensive income: Net income (108,062) (108,062) Other comprehensive income (loss), net of income tax:
Unrealized gains on securities, net of incometaxes of $175,730 373,723 373,723
Other-than-temporary impairment notrecognized in earnings on securities, net ofincome taxes of $132 (231) (231)
Defined benefit pension plans, net of net incometax benefit of $163 (293) (293)
Foreign currency translation adjustments (38,993) (38,993) Unrealized gains in cash flow hedging
instruments, net of income taxes of$28,223 35,543 35,543
Other comprehensive income 369,749 369,749
Comprehensive income 261,687 Cash dividends-Common stock $0.375 per share (148,411) (148,411) Cash dividends-Preferred stock 5% per annum (494) (44,440) (44,934) Purchase of treasury stock (2,955) (2,955) Issuances of common stock and restricted stock, net of
forfeitures 1,543,405 15 7,981 7,996 Exercise of stock options and tax benefits of exercises
and restricted stock vesting 1,900 (1,599) (1,599) Accretion of preferred stock discount 19,750 (19,750) 0 Compensation expense for restricted stock awards and
stock options 31,670 31,670 Issuance of common stock for acquisition 2,560,601 26 30,830 30,856 Allocation of ESOP shares 1,233 1,233
Balance, March 31, 2009 442,540,141 $ 4,425 $ 3,115,722 $ 17,348,217 $10,300,501 $ (852,047) $(3,168,842) $ 26,747,976
Balance, December 31, 2009 502,394,396 $ 5,024 $ 0 $ 18,954,823 $10,727,368 $ 82,654 $(3,180,459) $ 26,589,410 Cumulative effect from adoption of new consolidation
accounting standards (2,922,988) (15,924) (2,938,912) Comprehensive income:
Net Income 636,263 636,263 Other comprehensive income (loss), net of income tax:
Unrealized gains on securities, net ofincome taxes of $62,908 118,021 118,021
Other-than-temporary impairment notrecognized in earnings on securities,net of income taxes of $6,017 16,949 16,949
Defined benefit pension plans, net of netincome tax benefit of $197 (358) (358)
Foreign currency translation adjustments (56,834) (56,834) Unrealized gains in cash flow
hedging instruments, net ofincome taxes of $9,327 14,408 14,408
Other comprehensive income(loss) 92,186 92,186
Comprehensive income (loss) 728,449 Cash dividends-Common stock $0.05 per share (22,824) (22,824) Purchase of treasury stock (17,798) (17,798) Issuances of common stock and restricted stock, net of
forfeitures 1,498,243 15 7,153 7,168 Exercise of stock options and tax benefits of exercises
and restricted stock vesting 230,754 2 (491) (489) Compensation expense for restricted stock awards and
stock options 29,378 29,378
Balance, March 31, 2010 504,123,393 $ 5,041 $ 0 $ 18,990,863 $ 8,417,819 $ 158,916 $(3,198,257) $ 24,374,382
See Notes to Consolidated Financial Statements.
56
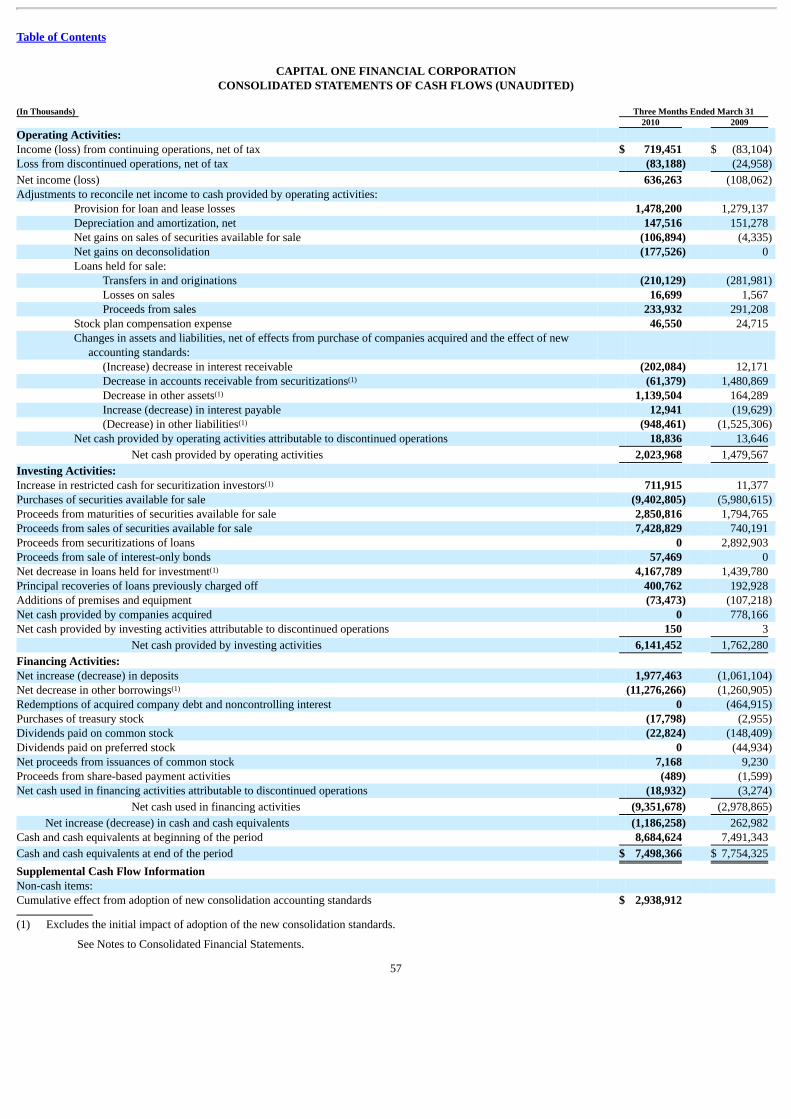
Table of Contents
CAPITAL ONE FINANCIAL CORPORATIONCONSOLIDATED STATEMENTS OF CASH FLOWS (UNAUDITED)
(In Thousands) Three Months Ended March 31 2010 2009 Operating Activities: Income (loss) from continuing operations, net of tax $ 719,451 $ (83,104) Loss from discontinued operations, net of tax (83,188) (24,958)
Net income (loss) 636,263 (108,062) Adjustments to reconcile net income to cash provided by operating activities:
Provision for loan and lease losses 1,478,200 1,279,137 Depreciation and amortization, net 147,516 151,278 Net gains on sales of securities available for sale (106,894) (4,335) Net gains on deconsolidation (177,526) 0 Loans held for sale:
Transfers in and originations (210,129) (281,981) Losses on sales 16,699 1,567 Proceeds from sales 233,932 291,208
Stock plan compensation expense 46,550 24,715 Changes in assets and liabilities, net of effects from purchase of companies acquired and the effect of new
accounting standards: (Increase) decrease in interest receivable (202,084) 12,171 Decrease in accounts receivable from securitizations (61,379) 1,480,869 Decrease in other assets 1,139,504 164,289 Increase (decrease) in interest payable 12,941 (19,629) (Decrease) in other liabilities (948,461) (1,525,306)
Net cash provided by operating activities attributable to discontinued operations 18,836 13,646
Net cash provided by operating activities 2,023,968 1,479,567
Investing Activities: Increase in restricted cash for securitization investors 711,915 11,377 Purchases of securities available for sale (9,402,805) (5,980,615) Proceeds from maturities of securities available for sale 2,850,816 1,794,765 Proceeds from sales of securities available for sale 7,428,829 740,191 Proceeds from securitizations of loans 0 2,892,903 Proceeds from sale of interest-only bonds 57,469 0 Net decrease in loans held for investment 4,167,789 1,439,780 Principal recoveries of loans previously charged off 400,762 192,928 Additions of premises and equipment (73,473) (107,218) Net cash provided by companies acquired 0 778,166 Net cash provided by investing activities attributable to discontinued operations 150 3
Net cash provided by investing activities 6,141,452 1,762,280
Financing Activities: Net increase (decrease) in deposits 1,977,463 (1,061,104) Net decrease in other borrowings (11,276,266) (1,260,905) Redemptions of acquired company debt and noncontrolling interest 0 (464,915) Purchases of treasury stock (17,798) (2,955) Dividends paid on common stock (22,824) (148,409) Dividends paid on preferred stock 0 (44,934) Net proceeds from issuances of common stock 7,168 9,230 Proceeds from share-based payment activities (489) (1,599) Net cash used in financing activities attributable to discontinued operations (18,932) (3,274)
Net cash used in financing activities (9,351,678) (2,978,865)
Net increase (decrease) in cash and cash equivalents (1,186,258) 262,982 Cash and cash equivalents at beginning of the period 8,684,624 7,491,343
Cash and cash equivalents at end of the period $ 7,498,366 $ 7,754,325
Supplemental Cash Flow Information Non-cash items: Cumulative effect from adoption of new consolidation accounting standards $ 2,938,912 (1) Excludes the initial impact of adoption of the new consolidation standards.
See Notes to Consolidated Financial Statements.
57
(1)
(1)
(1)
(1)
(1)
(1)
Table of Contents
CAPITAL ONE FINANCIAL CORPORATIONNOTES TO CONSOLIDATED STATEMENTS (UNAUDITED)
NOTE 1—SUMMARY OF SIGNIFICANT ACCOUNTING POLICIES Business
Capital One Financial Corporation (the “Corporation”) is a diversified financial services company with banking and non-banking subsidiaries that market avariety of financial products and services. Our principal subsidiaries include:
• Capital One Bank (USA), National Association (“COBNA”) which currently offers credit and debit card products, other lending products and depositproducts.
• Capital One, National Association (“CONA”) which offers a broad spectrum of banking products and financial services to consumers, small businesses andcommercial clients.
Our revenues are primarily driven by lending to consumers and commercial customers and by deposit-taking activities which generate net interest income, and byactivities that generate non-interest income, including the sale and servicing of loans and providing fee-based services to customers. Customer usage and paymentpatterns, credit quality, levels of marketing expense and operating efficiency all affect our profitability. Our expenses primarily consist of the cost of funding ourassets, our provision for loan and lease losses, operating expenses (including associate salaries and benefits, infrastructure maintenance and enhancements, andbranch operations and expansion costs), marketing expenses, and income taxes.
On February 27, 2009, the Corporation acquired Chevy Chase Bank, F.S.B. (“Chevy Chase Bank”) for $475.9 million comprised of cash of $445.0 million and2.56 million shares of common stock valued at $30.9 million. Chevy Chase Bank has the largest retail branch presence in the Washington D.C. region. OnJuly 30, 2009, the Company merged Chevy Chase Bank with and into CONA.
The Corporation and its subsidiaries are hereafter collectively referred to as the “Company” or “We.” CONA and COBNA are hereafter collectively referred to asthe “Banks.”
We report the results of our business through three operating segments: Credit Card, Commercial Banking and Consumer Banking.
Credit Card: Consists of our domestic consumer and small business card lending, domestic national small business lending, national closed end installmentlending and the international card lending businesses in Canada and the United Kingdom.
Commercial Banking: Consists of our lending, deposit gathering and treasury management services to commercial real estate and middle market customers.Our Commercial Banking business results also include the results of a national portfolio of small ticket commercial real-estate loans that are in run-offmode.
Consumer Banking: Consists of our branch-based lending and deposit gathering activities for small business customers, as well as branch-based consumerdeposit gathering and lending activities, national deposit gathering, national automobile lending, consumer mortgage lending and servicing activities.
Chevy Chase Bank’s operations are included in the Commercial Banking and Consumer Banking segments beginning in the second quarter of 2009 but remainedin Other for the first quarter due to the short duration since acquisition. The Other category includes GreenPoint originated consumer mortgages originated forsale but held for investment since originations were suspended in 2007, the results of corporate treasury activities, including asset-liability management and theinvestment portfolio, the net impact of transfer pricing, brokered deposits, certain unallocated expenses, gains/losses related to the securitization of assets, andrestructuring charges related to the Company’s cost initiative and to the Chevy Chase Bank acquisition.
Basis of Presentation
The accompanying consolidated financial statements have been prepared in accordance with accounting principles generally accepted in the United States(“GAAP”) for interim financial information. Accordingly, certain financial information that is normally included in annual financial statements prepared inaccordance with GAAP, but is not required for interim reporting purposes, has been condensed or omitted. These consolidated financial statements are
58

Table of Contents
unaudited and should be read in conjunction with the audited consolidated financial statements and related notes thereto included in the Company’s AnnualReport on Form 10-K for the year ended December 31, 2009, as filed with the U.S. Securities and Exchange Commission (“2009 Form 10-K”).
The preparation of these consolidated financial statements in accordance with GAAP requires management to make estimates and assumptions that affectreported amounts and disclosures. While management makes its best judgment, actual results could differ from these estimates. In the opinion of management, alladjustments, consisting only of normal recurring adjustments, which are necessary for a fair presentation, of the interim period consolidated financial statementshave been made. Results for any interim period, however, are not necessarily indicative of the results to be expected for the full year.
The consolidated financial statements include the accounts of the Company in which it has a controlling financial interest. Investments in unconsolidated entitieswhere we have the ability to exercise significant influence over the operations of the investee are accounted for using the equity method of accounting. Thisincludes interests in variable interest entities (“VIEs”) where we are not the primary beneficiary. Investments not meeting the criteria for equity methodaccounting are accounted for using the cost method of accounting. Investments in unconsolidated entities are included in other assets, and our share of income orloss is recorded in other non-interest income. All significant intercompany balances and transactions have been eliminated.
Certain prior period amounts have been revised to conform to current presentation. All amounts in the following notes, excluding per share data, are presented inthousands unless noted otherwise.
Recent Accounting Pronouncements
In March 2010, the FASB issued ASU 2010-11, Scope Exception Related to Embedded Credit Derivatives, which addresses application of the embeddedderivative scope exception in ASC 815-15-15-8 and 15-9. The ASU is effective on the first day of the first fiscal quarter beginning after June 15, 2010. We do notexpect the adoption of ASU 2010-11 to have a material impact on consolidated earnings or financial position of the Company.
In February 2010, the FASB issued ASU 2010-09, Amendments to Certain Recognition and Disclosure Requirements which amends ASC 855 – SubsequentEvents to address certain implementation issues related to an entity’s requirement to perform and disclose subsequent-events procedures. The ASU requires SECfilers to evaluate subsequent events through the date the financial statements are issued and also exempts SEC filers from disclosing the date through whichsubsequent events have been evaluated. The ASU is effective immediately for financial statements that are issued or available to be issued and the Companyadopted these requirements in February 2010.
In January 2010, the FASB issued ASU 2010-06, Improving Disclosures About Fair Value Measurements, which amends ASC 820 – Fair Value Measurementsand Disclosures to add new disclosure requirements about transfers into and out of Levels 1 and 2 and separate disclosures about purchases, sales, issuances, andsettlements relating to Level 3 measurements. The ASU 2010-06 requires disclosure of Level 3 activity of purchases, sales, issuances, and settlements on a grossbasis.
Significant Accounting Policies
Except for accounting policies that have been modified or recently adopted as described below, there have been no significant changes to the Company’saccounting policies as disclosed in the 2009 Form 10-K
Special Purpose Entities and Variable Interest Entities
In June 2009, the FASB issued new guidance on Accounting for Transfers of Financial Assets and Consolidations which was effective for periods starting as ofJanuary 1, 2010.
The new accounting consolidation guidance, which removed the concept of a QSPE, resulted in the consolidation of the Company’s credit card trusts, oneinstallment loan trust and certain mortgage trusts. The Company was considered to be the primary beneficiary of these trusts due to the combination of powerover the activities that most significantly impact the economic performance of the trusts through the right to service the securitized loans and the obligation toabsorb losses or the right to receive benefits that could potentially be significant to the trusts through its retained interests. The assets and liabilities of the creditcard and installment loan trusts were consolidated on our balance sheet at their carrying values and the assets and liabilities of the mortgage trusts wereconsolidated at their unpaid principal balances using the practicable expedient provisions permitted upon adoption.
The table below reflects the financial impacts as of January 1, 2010.
59
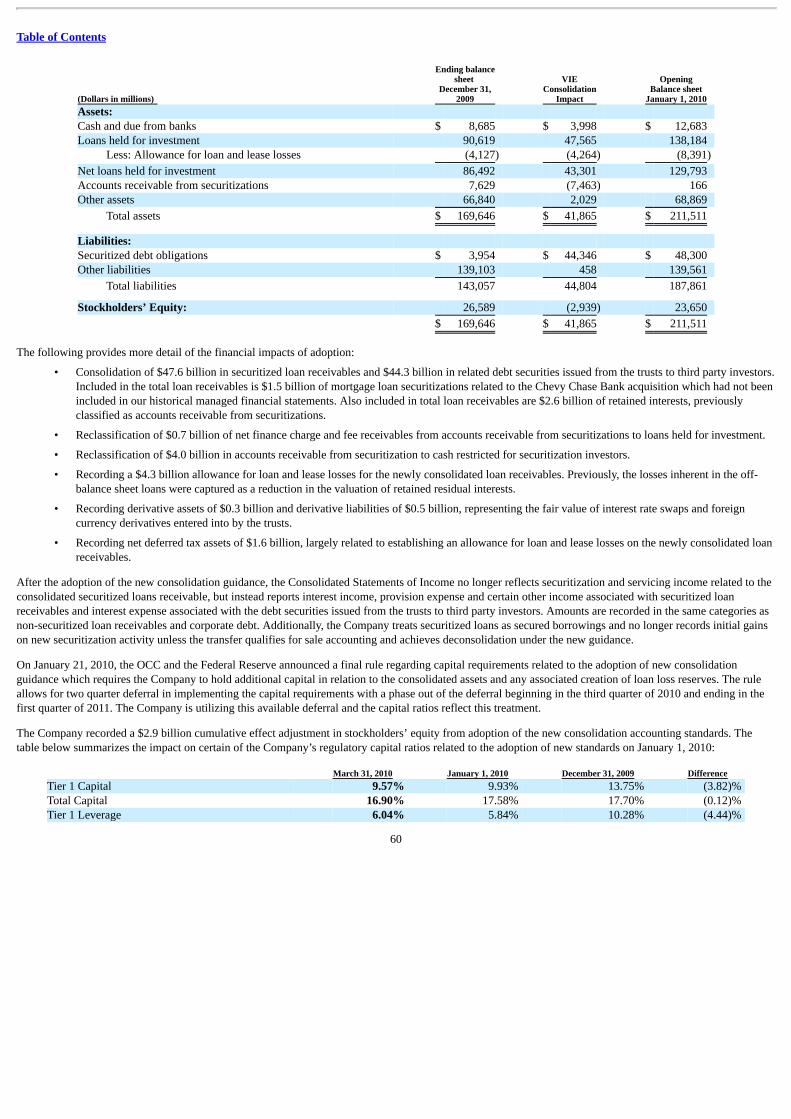
Table of Contents
(Dollars in millions)
Ending balancesheet
December 31,2009
VIEConsolidation
Impact
OpeningBalance sheet
January 1, 2010 Assets: Cash and due from banks $ 8,685 $ 3,998 $ 12,683 Loans held for investment 90,619 47,565 138,184
Less: Allowance for loan and lease losses (4,127) (4,264) (8,391)
Net loans held for investment 86,492 43,301 129,793 Accounts receivable from securitizations 7,629 (7,463) 166 Other assets 66,840 2,029 68,869
Total assets $ 169,646 $ 41,865 $ 211,511
Liabilities: Securitized debt obligations $ 3,954 $ 44,346 $ 48,300 Other liabilities 139,103 458 139,561
Total liabilities 143,057 44,804 187,861
Stockholders’ Equity: 26,589 (2,939) 23,650
$ 169,646 $ 41,865 $ 211,511
The following provides more detail of the financial impacts of adoption:
• Consolidation of $47.6 billion in securitized loan receivables and $44.3 billion in related debt securities issued from the trusts to third party investors.Included in the total loan receivables is $1.5 billion of mortgage loan securitizations related to the Chevy Chase Bank acquisition which had not beenincluded in our historical managed financial statements. Also included in total loan receivables are $2.6 billion of retained interests, previouslyclassified as accounts receivable from securitizations.
• Reclassification of $0.7 billion of net finance charge and fee receivables from accounts receivable from securitizations to loans held for investment.
• Reclassification of $4.0 billion in accounts receivable from securitization to cash restricted for securitization investors.
• Recording a $4.3 billion allowance for loan and lease losses for the newly consolidated loan receivables. Previously, the losses inherent in the off-
balance sheet loans were captured as a reduction in the valuation of retained residual interests.
• Recording derivative assets of $0.3 billion and derivative liabilities of $0.5 billion, representing the fair value of interest rate swaps and foreign
currency derivatives entered into by the trusts.
• Recording net deferred tax assets of $1.6 billion, largely related to establishing an allowance for loan and lease losses on the newly consolidated loan
receivables.
After the adoption of the new consolidation guidance, the Consolidated Statements of Income no longer reflects securitization and servicing income related to theconsolidated securitized loans receivable, but instead reports interest income, provision expense and certain other income associated with securitized loanreceivables and interest expense associated with the debt securities issued from the trusts to third party investors. Amounts are recorded in the same categories asnon-securitized loan receivables and corporate debt. Additionally, the Company treats securitized loans as secured borrowings and no longer records initial gainson new securitization activity unless the transfer qualifies for sale accounting and achieves deconsolidation under the new guidance.
On January 21, 2010, the OCC and the Federal Reserve announced a final rule regarding capital requirements related to the adoption of new consolidationguidance which requires the Company to hold additional capital in relation to the consolidated assets and any associated creation of loan loss reserves. The ruleallows for two quarter deferral in implementing the capital requirements with a phase out of the deferral beginning in the third quarter of 2010 and ending in thefirst quarter of 2011. The Company is utilizing this available deferral and the capital ratios reflect this treatment.
The Company recorded a $2.9 billion cumulative effect adjustment in stockholders’ equity from adoption of the new consolidation accounting standards. Thetable below summarizes the impact on certain of the Company’s regulatory capital ratios related to the adoption of new standards on January 1, 2010:
March 31, 2010 January 1, 2010 December 31, 2009 Difference Tier 1 Capital 9.57% 9.93% 13.75% (3.82)% Total Capital 16.90% 17.58% 17.70% (0.12)% Tier 1 Leverage 6.04% 5.84% 10.28% (4.44)%
60
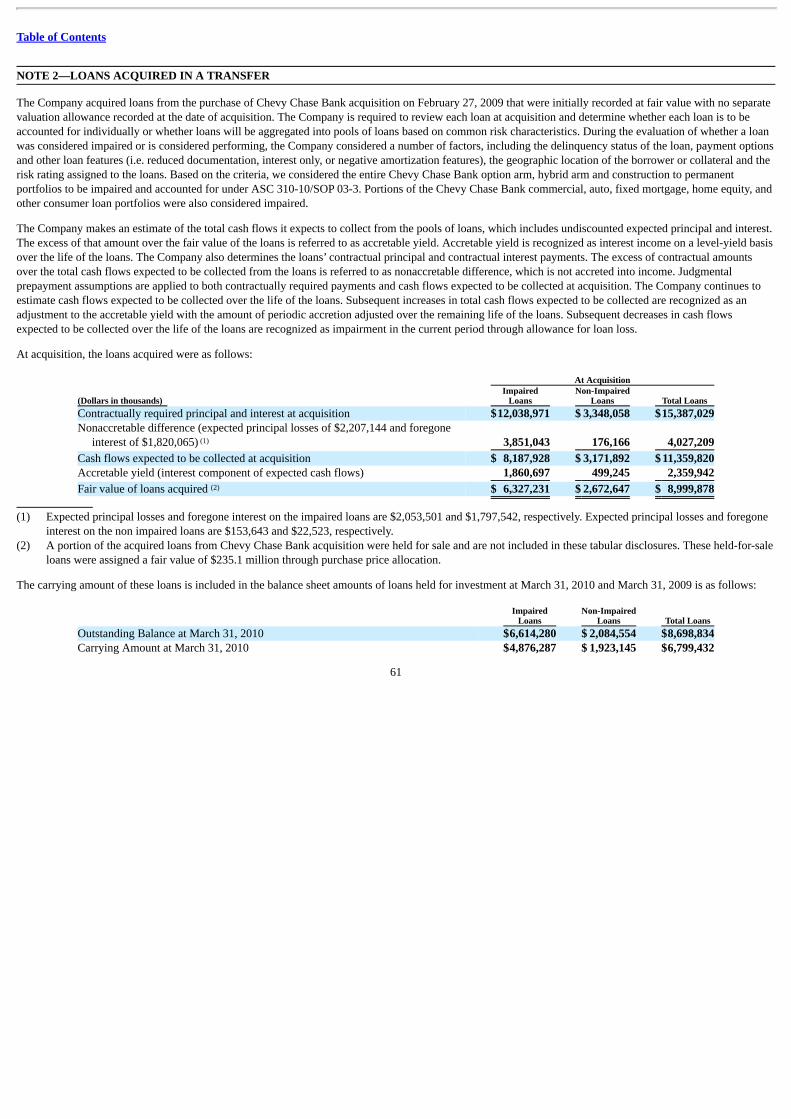
Table of Contents
NOTE 2—LOANS ACQUIRED IN A TRANSFER The Company acquired loans from the purchase of Chevy Chase Bank acquisition on February 27, 2009 that were initially recorded at fair value with no separatevaluation allowance recorded at the date of acquisition. The Company is required to review each loan at acquisition and determine whether each loan is to beaccounted for individually or whether loans will be aggregated into pools of loans based on common risk characteristics. During the evaluation of whether a loanwas considered impaired or is considered performing, the Company considered a number of factors, including the delinquency status of the loan, payment optionsand other loan features (i.e. reduced documentation, interest only, or negative amortization features), the geographic location of the borrower or collateral and therisk rating assigned to the loans. Based on the criteria, we considered the entire Chevy Chase Bank option arm, hybrid arm and construction to permanentportfolios to be impaired and accounted for under ASC 310-10/SOP 03-3. Portions of the Chevy Chase Bank commercial, auto, fixed mortgage, home equity, andother consumer loan portfolios were also considered impaired.
The Company makes an estimate of the total cash flows it expects to collect from the pools of loans, which includes undiscounted expected principal and interest.The excess of that amount over the fair value of the loans is referred to as accretable yield. Accretable yield is recognized as interest income on a level-yield basisover the life of the loans. The Company also determines the loans’ contractual principal and contractual interest payments. The excess of contractual amountsover the total cash flows expected to be collected from the loans is referred to as nonaccretable difference, which is not accreted into income. Judgmentalprepayment assumptions are applied to both contractually required payments and cash flows expected to be collected at acquisition. The Company continues toestimate cash flows expected to be collected over the life of the loans. Subsequent increases in total cash flows expected to be collected are recognized as anadjustment to the accretable yield with the amount of periodic accretion adjusted over the remaining life of the loans. Subsequent decreases in cash flowsexpected to be collected over the life of the loans are recognized as impairment in the current period through allowance for loan loss.
At acquisition, the loans acquired were as follows:
At Acquisition
(Dollars in thousands) Impaired
Loans Non-Impaired
Loans Total LoansContractually required principal and interest at acquisition $12,038,971 $ 3,348,058 $15,387,029Nonaccretable difference (expected principal losses of $2,207,144 and foregone
interest of $1,820,065) 3,851,043 176,166 4,027,209
Cash flows expected to be collected at acquisition $ 8,187,928 $ 3,171,892 $ 11,359,820Accretable yield (interest component of expected cash flows) 1,860,697 499,245 2,359,942
Fair value of loans acquired $ 6,327,231 $ 2,672,647 $ 8,999,878
(1) Expected principal losses and foregone interest on the impaired loans are $2,053,501 and $1,797,542, respectively. Expected principal losses and foregoneinterest on the non impaired loans are $153,643 and $22,523, respectively.
(2) A portion of the acquired loans from Chevy Chase Bank acquisition were held for sale and are not included in these tabular disclosures. These held-for-saleloans were assigned a fair value of $235.1 million through purchase price allocation.
The carrying amount of these loans is included in the balance sheet amounts of loans held for investment at March 31, 2010 and March 31, 2009 is as follows:
Impaired
Loans Non-Impaired
Loans Total LoansOutstanding Balance at March 31, 2010 $6,614,280 $ 2,084,554 $8,698,834Carrying Amount at March 31, 2010 $4,876,287 $ 1,923,145 $6,799,432
61
(1)
(2)
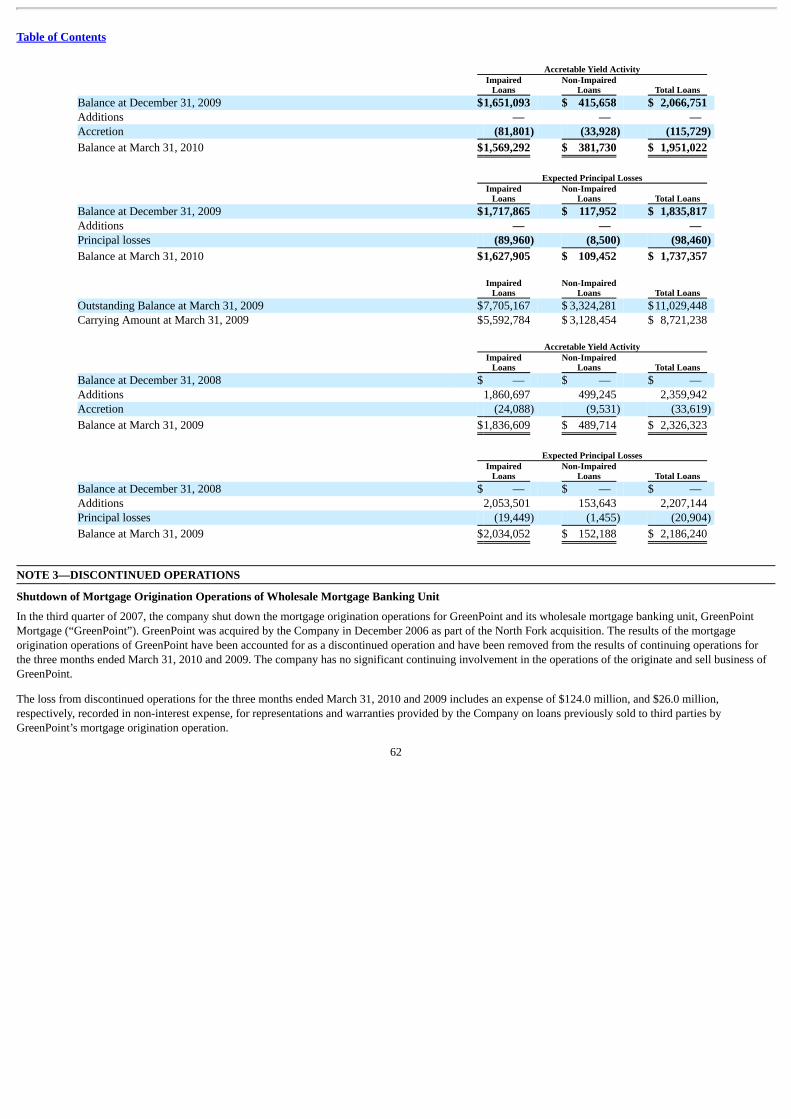
Table of Contents
Accretable Yield Activity
Impaired
Loans Non-Impaired
Loans Total Loans Balance at December 31, 2009 $1,651,093 $ 415,658 $ 2,066,751 Additions — — — Accretion (81,801) (33,928) (115,729)
Balance at March 31, 2010 $1,569,292 $ 381,730 $ 1,951,022
Expected Principal Losses
Impaired
Loans Non-Impaired
Loans Total Loans Balance at December 31, 2009 $1,717,865 $ 117,952 $ 1,835,817 Additions — — — Principal losses (89,960) (8,500) (98,460)
Balance at March 31, 2010 $1,627,905 $ 109,452 $ 1,737,357
Impaired
Loans Non-Impaired
Loans Total Loans Outstanding Balance at March 31, 2009 $7,705,167 $ 3,324,281 $11,029,448 Carrying Amount at March 31, 2009 $5,592,784 $ 3,128,454 $ 8,721,238
Accretable Yield Activity
Impaired
Loans Non-Impaired
Loans Total Loans Balance at December 31, 2008 $ — $ — $ — Additions 1,860,697 499,245 2,359,942 Accretion (24,088) (9,531) (33,619)
Balance at March 31, 2009 $1,836,609 $ 489,714 $ 2,326,323
Expected Principal Losses
Impaired
Loans Non-Impaired
Loans Total Loans Balance at December 31, 2008 $ — $ — $ — Additions 2,053,501 153,643 2,207,144 Principal losses (19,449) (1,455) (20,904)
Balance at March 31, 2009 $2,034,052 $ 152,188 $ 2,186,240
NOTE 3—DISCONTINUED OPERATIONS Shutdown of Mortgage Origination Operations of Wholesale Mortgage Banking Unit
In the third quarter of 2007, the company shut down the mortgage origination operations for GreenPoint and its wholesale mortgage banking unit, GreenPointMortgage (“GreenPoint”). GreenPoint was acquired by the Company in December 2006 as part of the North Fork acquisition. The results of the mortgageorigination operations of GreenPoint have been accounted for as a discontinued operation and have been removed from the results of continuing operations forthe three months ended March 31, 2010 and 2009. The company has no significant continuing involvement in the operations of the originate and sell business ofGreenPoint.
The loss from discontinued operations for the three months ended March 31, 2010 and 2009 includes an expense of $124.0 million, and $26.0 million,respectively, recorded in non-interest expense, for representations and warranties provided by the Company on loans previously sold to third parties byGreenPoint’s mortgage origination operation.
62
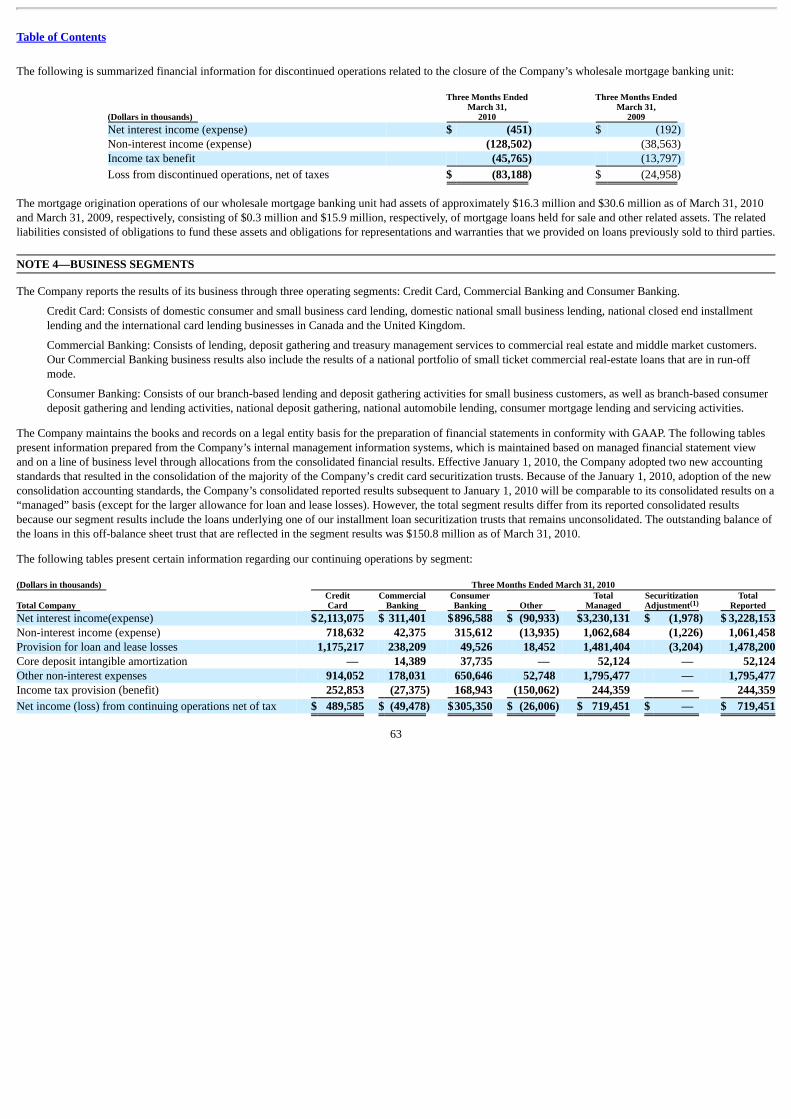
Table of Contents
The following is summarized financial information for discontinued operations related to the closure of the Company’s wholesale mortgage banking unit:
(Dollars in thousands)
Three Months EndedMarch 31,
2010
Three Months EndedMarch 31,
2009 Net interest income (expense) $ (451) $ (192) Non-interest income (expense) (128,502) (38,563) Income tax benefit (45,765) (13,797)
Loss from discontinued operations, net of taxes $ (83,188) $ (24,958)
The mortgage origination operations of our wholesale mortgage banking unit had assets of approximately $16.3 million and $30.6 million as of March 31, 2010and March 31, 2009, respectively, consisting of $0.3 million and $15.9 million, respectively, of mortgage loans held for sale and other related assets. The relatedliabilities consisted of obligations to fund these assets and obligations for representations and warranties that we provided on loans previously sold to third parties. NOTE 4—BUSINESS SEGMENTS The Company reports the results of its business through three operating segments: Credit Card, Commercial Banking and Consumer Banking.
Credit Card: Consists of domestic consumer and small business card lending, domestic national small business lending, national closed end installmentlending and the international card lending businesses in Canada and the United Kingdom.
Commercial Banking: Consists of lending, deposit gathering and treasury management services to commercial real estate and middle market customers.Our Commercial Banking business results also include the results of a national portfolio of small ticket commercial real-estate loans that are in run-offmode.
Consumer Banking: Consists of our branch-based lending and deposit gathering activities for small business customers, as well as branch-based consumerdeposit gathering and lending activities, national deposit gathering, national automobile lending, consumer mortgage lending and servicing activities.
The Company maintains the books and records on a legal entity basis for the preparation of financial statements in conformity with GAAP. The following tablespresent information prepared from the Company’s internal management information systems, which is maintained based on managed financial statement viewand on a line of business level through allocations from the consolidated financial results. Effective January 1, 2010, the Company adopted two new accountingstandards that resulted in the consolidation of the majority of the Company’s credit card securitization trusts. Because of the January 1, 2010, adoption of the newconsolidation accounting standards, the Company’s consolidated reported results subsequent to January 1, 2010 will be comparable to its consolidated results on a“managed” basis (except for the larger allowance for loan and lease losses). However, the total segment results differ from its reported consolidated resultsbecause our segment results include the loans underlying one of our installment loan securitization trusts that remains unconsolidated. The outstanding balance ofthe loans in this off-balance sheet trust that are reflected in the segment results was $150.8 million as of March 31, 2010.
The following tables present certain information regarding our continuing operations by segment: (Dollars in thousands) Three Months Ended March 31, 2010
Total Company CreditCard
CommercialBanking
ConsumerBanking Other
TotalManaged
SecuritizationAdjustment
TotalReported
Net interest income(expense) $2,113,075 $ 311,401 $896,588 $ (90,933) $3,230,131 $ (1,978) $ 3,228,153Non-interest income (expense) 718,632 42,375 315,612 (13,935) 1,062,684 (1,226) 1,061,458Provision for loan and lease losses 1,175,217 238,209 49,526 18,452 1,481,404 (3,204) 1,478,200Core deposit intangible amortization — 14,389 37,735 — 52,124 — 52,124Other non-interest expenses 914,052 178,031 650,646 52,748 1,795,477 — 1,795,477Income tax provision (benefit) 252,853 (27,375) 168,943 (150,062) 244,359 — 244,359
Net income (loss) from continuing operations net of tax $ 489,585 $ (49,478) $305,350 $ (26,006) $ 719,451 $ — $ 719,451
63
(1)
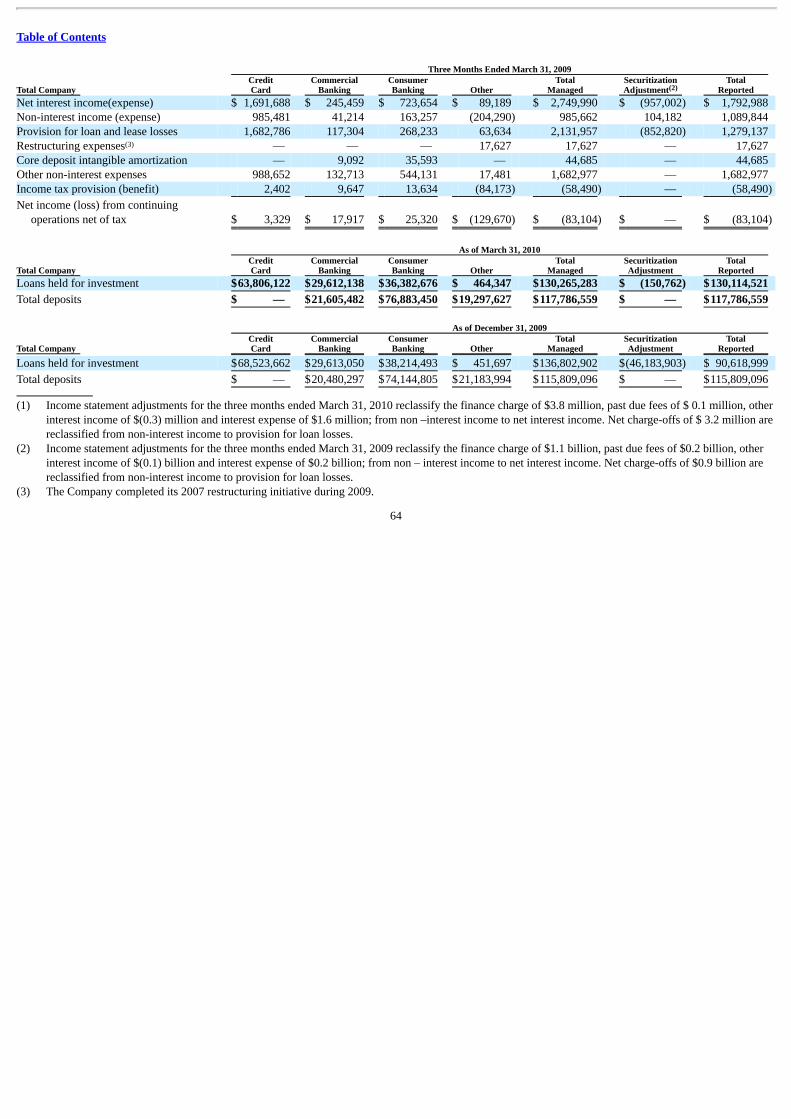
Table of Contents
Three Months Ended March 31, 2009
Total Company CreditCard
CommercialBanking
ConsumerBanking Other
TotalManaged
SecuritizationAdjustment
TotalReported
Net interest income(expense) $ 1,691,688 $ 245,459 $ 723,654 $ 89,189 $ 2,749,990 $ (957,002) $ 1,792,988 Non-interest income (expense) 985,481 41,214 163,257 (204,290) 985,662 104,182 1,089,844 Provision for loan and lease losses 1,682,786 117,304 268,233 63,634 2,131,957 (852,820) 1,279,137 Restructuring expenses — — — 17,627 17,627 — 17,627 Core deposit intangible amortization — 9,092 35,593 — 44,685 — 44,685 Other non-interest expenses 988,652 132,713 544,131 17,481 1,682,977 — 1,682,977 Income tax provision (benefit) 2,402 9,647 13,634 (84,173) (58,490) — (58,490)
Net income (loss) from continuingoperations net of tax $ 3,329 $ 17,917 $ 25,320 $ (129,670) $ (83,104) $ — $ (83,104)
As of March 31, 2010
Total Company CreditCard
CommercialBanking
ConsumerBanking Other
TotalManaged
SecuritizationAdjustment
TotalReported
Loans held for investment $63,806,122 $29,612,138 $36,382,676 $ 464,347 $130,265,283 $ (150,762) $130,114,521
Total deposits $ — $21,605,482 $76,883,450 $19,297,627 $117,786,559 $ — $117,786,559
As of December 31, 2009
Total Company CreditCard
CommercialBanking
ConsumerBanking Other
TotalManaged
SecuritizationAdjustment
TotalReported
Loans held for investment $68,523,662 $29,613,050 $38,214,493 $ 451,697 $136,802,902 $(46,183,903) $ 90,618,999
Total deposits $ — $20,480,297 $74,144,805 $21,183,994 $115,809,096 $ — $115,809,096
(1) Income statement adjustments for the three months ended March 31, 2010 reclassify the finance charge of $3.8 million, past due fees of $ 0.1 million, other
interest income of $(0.3) million and interest expense of $1.6 million; from non –interest income to net interest income. Net charge-offs of $ 3.2 million arereclassified from non-interest income to provision for loan losses.
(2) Income statement adjustments for the three months ended March 31, 2009 reclassify the finance charge of $1.1 billion, past due fees of $0.2 billion, otherinterest income of $(0.1) billion and interest expense of $0.2 billion; from non – interest income to net interest income. Net charge-offs of $0.9 billion arereclassified from non-interest income to provision for loan losses.
(3) The Company completed its 2007 restructuring initiative during 2009.
64
(2)
(3)
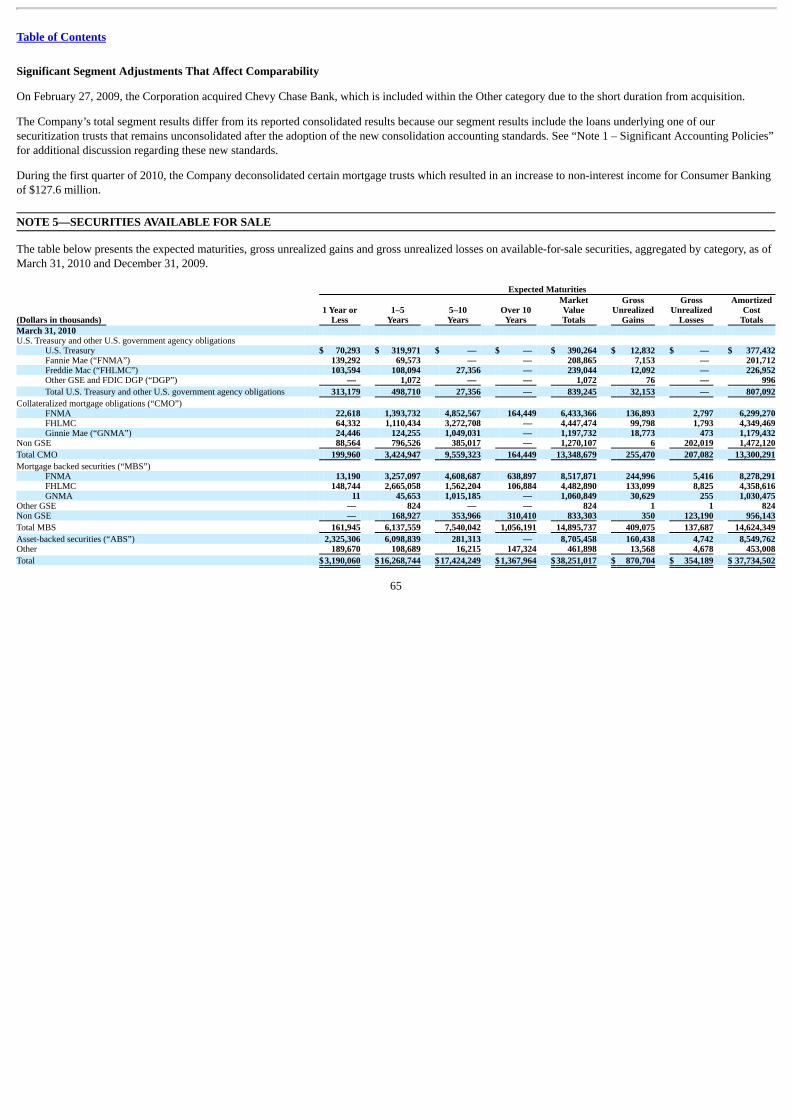
Table of Contents
Significant Segment Adjustments That Affect Comparability
On February 27, 2009, the Corporation acquired Chevy Chase Bank, which is included within the Other category due to the short duration from acquisition.
The Company’s total segment results differ from its reported consolidated results because our segment results include the loans underlying one of oursecuritization trusts that remains unconsolidated after the adoption of the new consolidation accounting standards. See “Note 1 – Significant Accounting Policies”for additional discussion regarding these new standards.
During the first quarter of 2010, the Company deconsolidated certain mortgage trusts which resulted in an increase to non-interest income for Consumer Bankingof $127.6 million. NOTE 5—SECURITIES AVAILABLE FOR SALE The table below presents the expected maturities, gross unrealized gains and gross unrealized losses on available-for-sale securities, aggregated by category, as ofMarch 31, 2010 and December 31, 2009. Expected Maturities
(Dollars in thousands) 1 Year or
Less 1–5
Years 5–10Years
Over 10Years
MarketValueTotals
GrossUnrealized
Gains
GrossUnrealized
Losses
AmortizedCost
TotalsMarch 31, 2010 U.S. Treasury and other U.S. government agency obligations
U.S. Treasury $ 70,293 $ 319,971 $ — $ — $ 390,264 $ 12,832 $ — $ 377,432Fannie Mae (“FNMA”) 139,292 69,573 — — 208,865 7,153 — 201,712Freddie Mac (“FHLMC”) 103,594 108,094 27,356 — 239,044 12,092 — 226,952Other GSE and FDIC DGP (“DGP”) — 1,072 — — 1,072 76 — 996
Total U.S. Treasury and other U.S. government agency obligations 313,179 498,710 27,356 — 839,245 32,153 — 807,092
Collateralized mortgage obligations (“CMO”) FNMA 22,618 1,393,732 4,852,567 164,449 6,433,366 136,893 2,797 6,299,270FHLMC 64,332 1,110,434 3,272,708 — 4,447,474 99,798 1,793 4,349,469Ginnie Mae (“GNMA”) 24,446 124,255 1,049,031 — 1,197,732 18,773 473 1,179,432
Non GSE 88,564 796,526 385,017 — 1,270,107 6 202,019 1,472,120
Total CMO 199,960 3,424,947 9,559,323 164,449 13,348,679 255,470 207,082 13,300,291
Mortgage backed securities (“MBS”) FNMA 13,190 3,257,097 4,608,687 638,897 8,517,871 244,996 5,416 8,278,291FHLMC 148,744 2,665,058 1,562,204 106,884 4,482,890 133,099 8,825 4,358,616GNMA 11 45,653 1,015,185 — 1,060,849 30,629 255 1,030,475
Other GSE — 824 — — 824 1 1 824Non GSE — 168,927 353,966 310,410 833,303 350 123,190 956,143
Total MBS 161,945 6,137,559 7,540,042 1,056,191 14,895,737 409,075 137,687 14,624,349
Asset-backed securities (“ABS”) 2,325,306 6,098,839 281,313 — 8,705,458 160,438 4,742 8,549,762Other 189,670 108,689 16,215 147,324 461,898 13,568 4,678 453,008
Total $3,190,060 $16,268,744 $17,424,249 $1,367,964 $38,251,017 $ 870,704 $ 354,189 $ 37,734,502
65
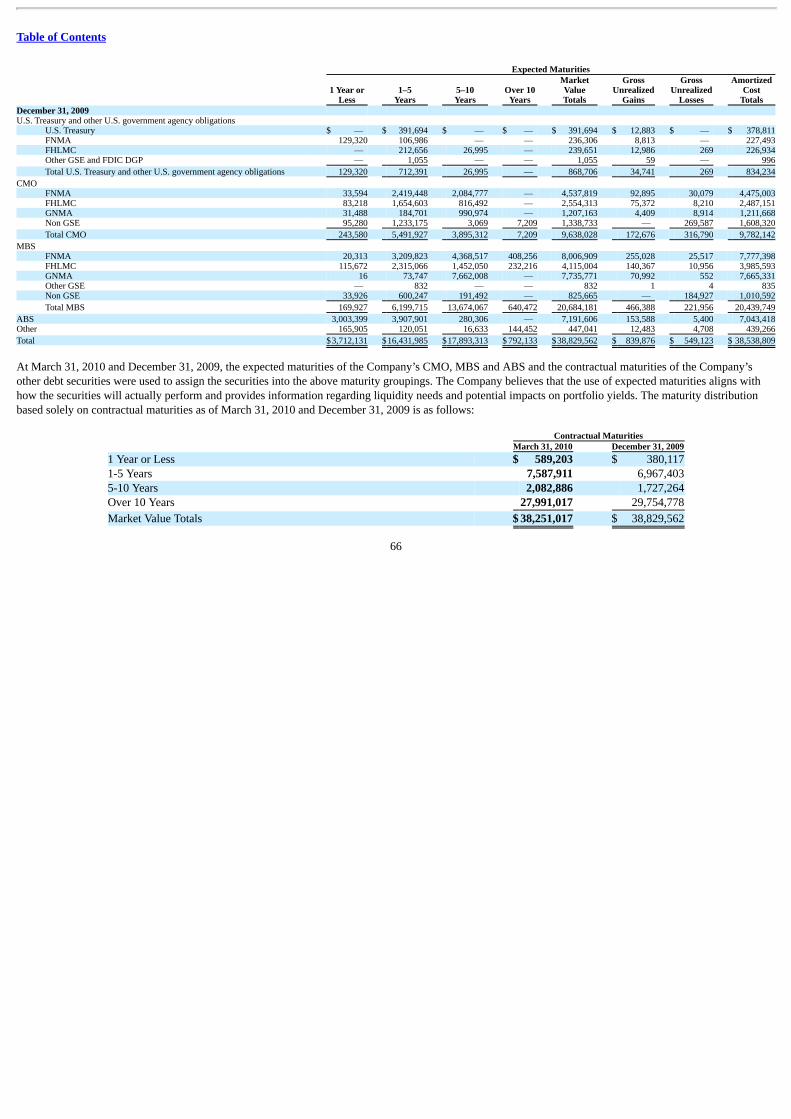
Table of Contents
Expected Maturities
1 Year or
Less 1–5
Years 5–10Years
Over 10Years
MarketValueTotals
GrossUnrealized
Gains
GrossUnrealized
Losses
AmortizedCost
TotalsDecember 31, 2009 U.S. Treasury and other U.S. government agency obligations
U.S. Treasury $ — $ 391,694 $ — $ — $ 391,694 $ 12,883 $ — $ 378,811FNMA 129,320 106,986 — — 236,306 8,813 — 227,493FHLMC — 212,656 26,995 — 239,651 12,986 269 226,934Other GSE and FDIC DGP — 1,055 — — 1,055 59 — 996
Total U.S. Treasury and other U.S. government agency obligations 129,320 712,391 26,995 — 868,706 34,741 269 834,234
CMO FNMA 33,594 2,419,448 2,084,777 — 4,537,819 92,895 30,079 4,475,003FHLMC 83,218 1,654,603 816,492 — 2,554,313 75,372 8,210 2,487,151GNMA 31,488 184,701 990,974 — 1,207,163 4,409 8,914 1,211,668Non GSE 95,280 1,233,175 3,069 7,209 1,338,733 — 269,587 1,608,320
Total CMO 243,580 5,491,927 3,895,312 7,209 9,638,028 172,676 316,790 9,782,142
MBS FNMA 20,313 3,209,823 4,368,517 408,256 8,006,909 255,028 25,517 7,777,398FHLMC 115,672 2,315,066 1,452,050 232,216 4,115,004 140,367 10,956 3,985,593GNMA 16 73,747 7,662,008 — 7,735,771 70,992 552 7,665,331Other GSE — 832 — — 832 1 4 835Non GSE 33,926 600,247 191,492 — 825,665 — 184,927 1,010,592
Total MBS 169,927 6,199,715 13,674,067 640,472 20,684,181 466,388 221,956 20,439,749
ABS 3,003,399 3,907,901 280,306 — 7,191,606 153,588 5,400 7,043,418Other 165,905 120,051 16,633 144,452 447,041 12,483 4,708 439,266
Total $3,712,131 $16,431,985 $17,893,313 $ 792,133 $38,829,562 $ 839,876 $ 549,123 $ 38,538,809
At March 31, 2010 and December 31, 2009, the expected maturities of the Company’s CMO, MBS and ABS and the contractual maturities of the Company’sother debt securities were used to assign the securities into the above maturity groupings. The Company believes that the use of expected maturities aligns withhow the securities will actually perform and provides information regarding liquidity needs and potential impacts on portfolio yields. The maturity distributionbased solely on contractual maturities as of March 31, 2010 and December 31, 2009 is as follows:
Contractual Maturities March 31, 2010 December 31, 20091 Year or Less $ 589,203 $ 380,1171-5 Years 7,587,911 6,967,4035-10 Years 2,082,886 1,727,264Over 10 Years 27,991,017 29,754,778
Market Value Totals $ 38,251,017 $ 38,829,562
66
Table of Contents
Actual maturities may differ from the contractual or expected maturities since borrowers may have the right to prepay obligations with or without prepaymentpenalties.
The available-for-sale portfolio continues to be heavily concentrated in high credit quality assets like government-sponsored enterprise (“GSE”) mortgage-backedsecurities and AAA rated asset-backed securities. In addition to debt securities held in the investment portfolio, the Company reports certain equity securitiesrelated to Community Reinvestment Act (“CRA”) investments as available for sale securities within the Other category above.
At March 31, 2010, the portfolio was 90% rated AAA, 4% rated other investment grade (AA to BBB), and 6% non-investment grade or not rated. AtDecember 31, 2009, the portfolio was 90% rated AAA, 5% rated other investment grade (AA to BBB), and 5% non-investment grade or not rated.
As part of our portfolio management and asset liability management activities, the Company sold many of its GNMA MBS securities and replaced them withFNMA and FHLMC CMO securities, adding protection against increases in interest rates.
The following tables show the weighted average yields by investment category for expected maturities as of March 31, 2010 and December 31, 2009.
Weighted Average Yields
1 Yearor Less
1–5Years
5–10Years
Over 10Years
March 31, 2010 U.S. Treasury and other U.S. government agency obligations
U.S. Treasury 0.81% 2.73% — % — % FNMA 4.44 4.40 — — FHMLC 4.67 4.59 3.29 — Other GSE and FDIC DGP — 5.44 — —
Total U.S. Treasury and other U.S. government agency obligations 3.69 3.36 3.29 —
CMO FNMA 5.02 5.64 4.48 4.32 FHLMC 5.19 5.45 4.54 — GNMA 4.56 4.56 4.25 — Non GSE 5.68 5.44 5.88 —
Total CMO 5.34 5.49 4.54 4.32
MBS FNMA 5.48 4.89 4.79 5.18 FHMLC 5.56 4.26 5.08 5.56 GNMA 6.63 6.21 5.02 — Other GSE — 3.44 — — Non GSE — 5.60 6.07 6.04
Total MBS 5.53 4.65 4.95 5.50
ABS 3.25 3.58 4.87 — Other 2.59 4.21 4.60 0.56
Total 3.43% 4.39% 4.72% 5.38%
67
Table of Contents
Weighted Average Yields
1 Yearor Less
1–5Years
5–10Years
Over 10Years
December 31, 2009 U.S. Treasury and other U.S. government agency obligations
U.S. Treasury — % 2.37% — % — % FNMA 4.34 4.51 — — FHLMC — 4.63 3.29 — Other GSE and FDIC DGP — 5.44 — —
Total U.S. Treasury and other U.S. government agency obligations 4.34 3.36 3.29 —
CMO FNMA 4.99 5.13 4.73 — FHLMC 5.16 5.25 5.35 — GNMA 4.57 4.37 4.27 — Non GSE 5.75 5.58 5.13 6.58
Total CMO 5.31 5.26 4.74 6.58
MBS FNMA 5.34 4.98 4.95 5.12 FHLMC 5.55 4.32 5.26 5.23 GNMA 6.71 6.17 4.86 — Other GSE — 3.44 — — Non GSE 5.89 5.95 5.99 —
Total MBS 5.40 5.06 4.91 5.18
ABS 3.36 4.00 4.87 — Other 2.71 4.19 4.60 0.56
Total 3.56% 4.74% 4.90% 5.04%
The following table shows the fair value of investments and amount of unrealized losses segregated by those investments that have been in a continuousunrealized loss position for less than twelve months and those that have been in a continuous unrealized loss position for twelve months or longer as of March 31,2010 and December 31, 2009. Less than 12 Months Greater than 12 Months Total
Fair Value Unrealized
Losses Fair Value Unrealized
Losses Fair Value Unrealized
LossesMarch 31, 2010 U.S. Treasury and other U.S. government agency obligations
FHMLC $ — $ — $ — $ — $ — $ —
Total U.S. Treasury and other U.S. government agency obligations — — — — — — CMO
FNMA 254,038 1,157 283,405 1,640 537,443 2,797FHLMC 15,128 32 324,409 1,761 339,537 1,793GNMA 147,946 449 835 24 148,781 473Non GSE 124 1 1,232,813 202,018 1,232,937 202,019
Total CMO 417,236 1,639 1,841,462 205,443 2,258,698 207,082
MBS FNMA 1,203,026 5,399 2,325 17 1,205,351 5,416FHLMC 276,003 3,134 265,210 5,691 541,213 8,825GNMA 747 8 10,688 247 11,435 255Other GSE — — 791 1 791 1Non GSE — — 773,105 123,190 773,105 123,190
Total MBS 1,479,776 8,541 1,052,119 129,146 2,531,895 137,687
ABS 643,947 466 48,381 4,276 692,328 4,742Other 70,442 201 113,231 4,477 183,673 4,678
Total $2,611,401 $ 10,847 $3,055,193 $343,342 $5,666,594 $ 354,189
68
Table of Contents
Less than 12 Months Greater than 12 Months Total
Fair Value Unrealized
Losses Fair Value Unrealized
Losses Fair Value Unrealized
LossesDecember 31, 2009 U.S. Treasury and other U.S. government agency obligations
FHMLC $ 26,995 $ 269 $ — $ — $ 26,995 $ 269
Total U.S. Treasury and other U.S. government agency obligations 26,995 269 — — 26,995 269
CMO FNMA 971,437 25,036 317,058 5,043 1,288,495 30,079FHMLC 174,575 4,280 369,621 3,930 544,196 8,210GNMA 1,041,686 8,845 2,833 69 1,044,519 8,914Non GSE 2,809 326 1,312,949 269,261 1,315,758 269,587
Total CMO 2,190,507 38,487 2,002,461 278,303 4,192,968 316,790
MBS FNMA 1,928,274 25,476 3,623 41 1,931,897 25,517FHLMC 391,452 4,550 309,475 6,406 700,927 10,956GNMA 200,739 305 10,720 247 211,459 552Other GSE — — 798 4 798 4Non GSE — — 810,053 184,927 810,053 184,927
Total MBS 2,520,465 30,331 1,134,669 191,625 3,655,134 221,956
ABS 489,415 957 56,208 4,443 545,623 5,400Other 30,639 101 114,559 4,607 145,198 4,708
Total $5,258,021 $ 70,145 $3,307,897 $478,978 $8,565,918 $ 549,123
The Company monitors securities in its available-for-sale investment portfolio for other-than-temporary impairment based on a number of criteria, including thesize of the unrealized loss position, the duration for which each security has been in a loss position, credit rating, and current market conditions. For debtsecurities, the Company also considers any intent to sell the security and the likelihood it will be required to sell the security before its anticipated recovery. TheCompany continually monitors the ratings of its security holdings and conducts regular reviews of the Company’s credit-sensitive assets to monitor collateralperformance by tracking collateral trends and looking for any potential collateral degradation.
When impairment is deemed other-than-temporary, but the Company does not intend to sell the security nor does it expect it will be required to sell beforeanticipated recovery, only the amount of total other-than-temporary impairment related to credit is recognized in earnings. The amount of the total impairmentrelated to all other factors is recognized in other comprehensive income. Based on the evaluation described below, the Company recognized total other-than-temporary impairment of $26.8 million through earnings for the three months ended March 31, 2010, consisting of $8.6 million related to credit and the fullunrealized loss of $18.3 million for those positions we intend to sell. For these impaired securities, unrealized losses not related to credit and therefore recognizedin other comprehensive income, excluding the full unrealized loss for those positions we intend to sell, was $149.9 million (net of income tax was $96.6 million)as of March 31, 2010. Prior to the adoption of the revised accounting guidance for assessing other-than-temporary impairment in the second quarter of 2009,when impairment was deemed other-than-temporary, an impairment loss was recognized in earnings equal to the entire difference between the investment’samortized cost basis and its fair value. As a result, the Company recognized $0.4 million of other-than-temporary impairment charges through earnings for thethree months ended March 31, 2009. See “Note 1 – Significant Accounting Policies” on the 2009 Form 10-K for a discussion of the key assumptions used tomeasure the credit-related component of securities deemed to be other-than-temporarily impaired.
69
Table of Contents
Cumulative other-than-temporary impairment related to credit losses recognized in earnings for available-for-sale securities is as follows:
OTTI credit lossesrecognized for AFS debtsecurities
Beginning balance ofOTTI credit losses
recognized for securitiesheld at the beginning ofthe period for which aportion of OTTI was
recognized in OCI
Additions for theamount related tocredit losses for
which an OTTI waspreviously recognized
Additions for the amountrelated to credit losses
for which OTTI was notpreviously recognized
Reductions forsecurities intended
to be sold
Ending balance ofthe amount related to
credit losses on securitiesheld at the end of the
period for which aportion of OTTI was
recognized in OCIThree months ended
March 31, 2010 CMO $ 15,159 $ 3,545 $ 817 $ (3,377) $ 16,184MBS 15,612 3,834 346 (2,835) 16,957Other-Home equity 817 — — — 817
Total $ 31,588 $ 7,379 $ 1,163 $ (6,212) $ 33,918
The Company recognized an additional $18.3 million of other-than-temporary impairment on two securities it intends to sell in the second quarter. For these twosecurities, the entire remaining unrealized loss as of March 31, 2010 has been recognized through earnings.
Collateralized Mortgage Obligations The Company’s portfolio includes investments in GSE collateralized mortgage obligations and prime non-agencycollateralized mortgage obligations. The unrealized losses on the Company’s investment in collateralized mortgage obligations were primarily caused by creditspreads and interest rates that are higher than levels existing at the date of purchase. As of March 31, 2010 1% are rated AAA, 19 % are rated other investmentgrade and 80 % are non-investment grade or not rated. As of December 31, 2009, the majority of the unrealized losses in this category are due to prime non-agency collateralized mortgage obligations, of which 2% are rated AAA, 24% are rated other investment grade and 74% are non-investment grade or not rated.These investments represent only 4% of the Company’s total available-for-sale portfolio at both March 31, 2010 and December 31, 2009.
The Company recognized credit-related other-than-temporary impairment of $4.4 million through earnings for the three months ended March 31, 2010, for sixprime non-agency collateralized mortgage obligations. For impaired securities, unrealized losses not related to credit and therefore recognized in othercomprehensive income was $80.3 million (net of tax was $51.8 million) as of March 31, 2010. The credit-related impairment was calculated based on internalforecasts using security specific delinquencies, product specific delinquency roll rates and expected severities, using industry standard third party modeling tools.The significant key assumptions used to measure the credit-related component of securities deemed to be other-than-temporarily impaired during the three monthsended March 31, 2010 and December 31, 2009 are as follows: a weighted average credit default rate of 8.54% and 6.76%, respectively, and a weighted averageexpected severity of 52% and 51%, respectively.
Based on its view of each prime non-agency security’s current credit performance along with the sufficiency of subordination to protect cash flows , the implicitU.S. government guarantee of FNMA/FHLMC securities and the explicit U.S. government guarantee of GNMA securities, the Company expects to recover theentire amortized cost basis of its remaining collateralized mortgage obligations. Furthermore, since the Company does not have the intent to sell nor will it morelikely than not be required to sell before anticipated recovery, it does not consider any of its remaining collateralized mortgage obligations in unrealized losspositions to be other-than-temporarily impaired at March 31, 2010 and December 31, 2009.
Mortgage-Backed Securities The Company’s portfolio includes investments in GSE mortgage-backed securities and prime non-agency mortgage-backedsecurities. The unrealized losses on the Company’s investment in mortgage-backed securities were primarily caused by credit spreads and interest rates that arehigher than levels existing at the date of purchase. As of March 31, 2010, the majority of unrealized losses are due to prime non-agency mortgage-backedsecurities of which 3% are rated AAA, 6% are rated other investment grade and 91% are non-investment grade or not rated. As of December 31, 2009, 4% arerated AAA, 7% are rated other investment grade and 89% are non-investment grade or not rated. These investments represent only 3% of the Company’s totalavailable-for-sale portfolio at both March 31, 2010 and December 31, 2009.
The Company recognized credit-related other-than-temporary impairment of $4.2 million through earnings for the three months ended March 31, 2010, for sixprime non-agency mortgage-backed securities. For impaired securities, unrealized losses not related to credit and therefore recognized in other comprehensiveincome was $69.2 million (net of tax was $44.5 million) as of March 31, 2010. The credit-related impairment was calculated based on internal forecasts usingsecurity specific delinquencies, product specific delinquency roll rates and expected severities, using
70
Table of Contents
industry standard third party modeling tools. The significant key assumptions used to measure the credit-related component of securities deemed to be other-than-temporary impaired during the three months ended March 31, 2010 and December 31, 2009, are as follows: a weighted average credit default rate of 7.81% and8.19%, respectively, and a weighted average expected severity of 45% and 47%, respectively.
Based on its view of each prime non-agency security’s current credit performance, the sufficiency of subordination to protect cash flows, the implicit U.S.government guarantee of FNMA/FHLMC securities, and the explicit U.S. government guarantee of GNMA securities, the Company expects to recover the entireamortized cost basis of its remaining mortgage-backed securities. Furthermore, since the Company does has not decided to sell nor will it more likely than not berequired to sell before anticipated recovery, it does not consider any of its remaining mortgage-backed securities in unrealized loss positions to be other-than-temporarily impaired at March 31, 2010 and December 31, 2009.
Asset-Backed Securities This category is comprised of investments backed by credit card, auto, dealer floor plan inventory, equipment and student loans;commercial mortgage-backed loans; and minor investments backed by home equity lines of credit. The unrealized losses on the Company’s investments in asset-backed securities were primarily caused by credit spreads and interest rates that are higher than those at the date of purchase. As of March 31, 2010, the portfoliois 88.1% rated AAA and is comprised of 76.1% credit card, 9.3% auto, 8.2% student loans, 4.8% dealer floor securities, 1.4% equipment-backed securities and0.2% home equity lines of credit. As of December 31, 2009, the portfolio is 84.2% rated AAA and is comprised of 76.3% credit card, 14.0% auto, 6.9% studentconsumer loans, 1.7% dealer floor securities, 0.8% equipment-backed securities and 0.3% home equity lines of credit.
The Company recognized no credit-related other-than-temporary impairment through earnings for the three months ended March 31, 2010. For impairedsecurities, unrealized losses not related to credit and therefore recognized in other comprehensive income was $0.4 million (net of tax was $0.3 million) as ofMarch 31, 2010. Cumulative-to-date other-than-temporary impairment losses total $0.8 million for thirteen prime non-agency mortgage-backed securities. TheCompany recognized $0.4 million in other-than-temporary impairment through earnings for the three months ended March 31, 2009.
Based on its view of each security’s current credit performance along with the sufficiency of subordination to protect cash flows, the Company expects to recoverthe entire amortized cost basis of its remaining asset-backed securities. Furthermore, since the Company has not decided to sell nor will it more likely than not berequired to sell before anticipated recovery, it does not consider any of its remaining asset-backed securities in unrealized loss positions to be other-than-temporarily impaired at March 31, 2010 and December 31, 2009.
Other This category consists primarily of municipal securities and limited investments in equity securities, primarily related to CRA activities. The unrealizedlosses on the Company’s investments in these other securities were primarily caused by credit spreads and interest rates that are higher than levels existing at thedate of purchase. As of March 31, 2010, the Company expects to recover the entire amortized cost basis of the securities in this category. Furthermore, since theCompany has not made a decision to sell nor will it more likely than not be required to sell before anticipated recovery, it does not consider any of the remaininginvestments in unrealized loss positions to be other-than-temporarily impaired at March 31, 2010 and December 31, 2009.
Gross realized gains on sales and calls of securities were $93.8 million and $2.3 million for the three months ended March 31, 2010 and 2009, respectively. Grossrealized losses on sales and calls of securities were zero and $0.7 million for the three months ended March 31, 2010 and 2009, respectively. Tax expense on netrealized gains was $33.3 million and $0.8 million for the three months ended March 31, 2010 and 2009, respectively.
The Company’s sale of securities resulted in the reclassification of $66.1 million and $(6.4) million of net gains/(losses) after tax from accumulated othercomprehensive income into earnings, for the three months ended March 31, 2010 and 2009, respectively.
Securities available-for-sale included pledged securities of $11.4 billion and $11.9 billion at March 31, 2010 and at December 31, 2009, respectively.
71
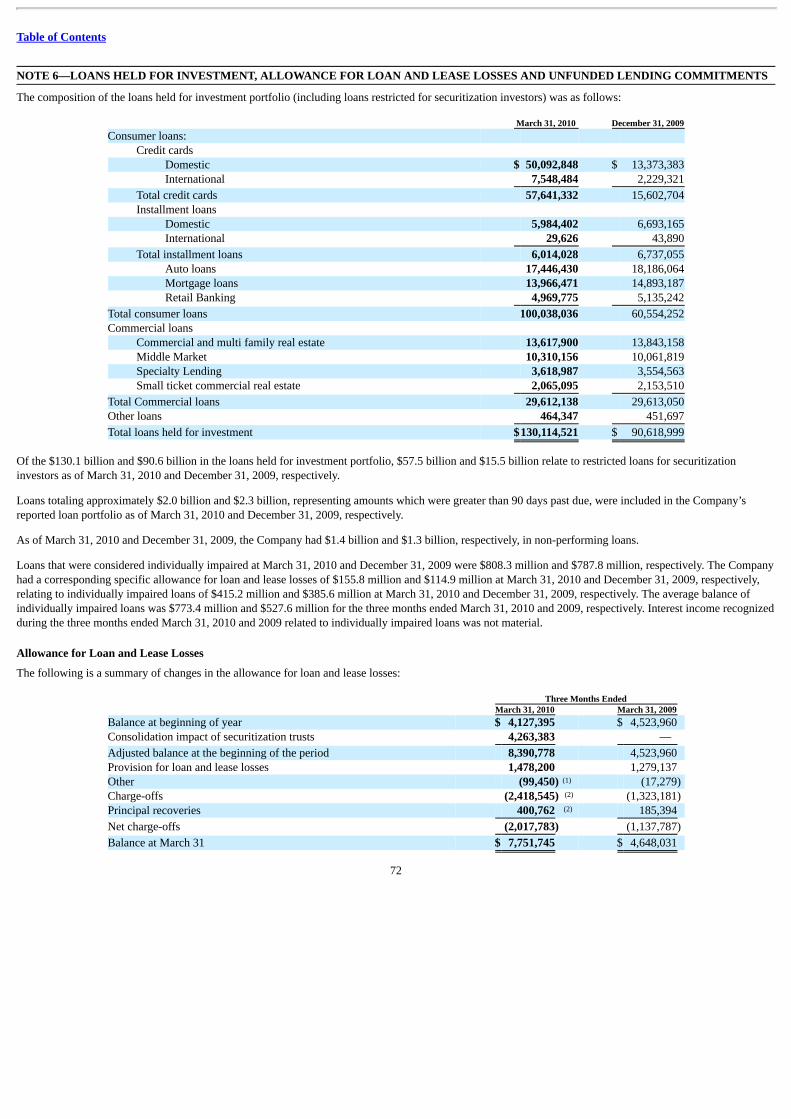
Table of Contents
NOTE 6—LOANS HELD FOR INVESTMENT, ALLOWANCE FOR LOAN AND LEASE LOSSES AND UNFUNDED LENDING COMMITMENTS The composition of the loans held for investment portfolio (including loans restricted for securitization investors) was as follows:
March 31, 2010 December 31, 2009Consumer loans:
Credit cards Domestic $ 50,092,848 $ 13,373,383International 7,548,484 2,229,321
Total credit cards 57,641,332 15,602,704Installment loans
Domestic 5,984,402 6,693,165International 29,626 43,890
Total installment loans 6,014,028 6,737,055Auto loans 17,446,430 18,186,064Mortgage loans 13,966,471 14,893,187Retail Banking 4,969,775 5,135,242
Total consumer loans 100,038,036 60,554,252Commercial loans
Commercial and multi family real estate 13,617,900 13,843,158Middle Market 10,310,156 10,061,819Specialty Lending 3,618,987 3,554,563Small ticket commercial real estate 2,065,095 2,153,510
Total Commercial loans 29,612,138 29,613,050Other loans 464,347 451,697
Total loans held for investment $130,114,521 $ 90,618,999
Of the $130.1 billion and $90.6 billion in the loans held for investment portfolio, $57.5 billion and $15.5 billion relate to restricted loans for securitizationinvestors as of March 31, 2010 and December 31, 2009, respectively.
Loans totaling approximately $2.0 billion and $2.3 billion, representing amounts which were greater than 90 days past due, were included in the Company’sreported loan portfolio as of March 31, 2010 and December 31, 2009, respectively.
As of March 31, 2010 and December 31, 2009, the Company had $1.4 billion and $1.3 billion, respectively, in non-performing loans.
Loans that were considered individually impaired at March 31, 2010 and December 31, 2009 were $808.3 million and $787.8 million, respectively. The Companyhad a corresponding specific allowance for loan and lease losses of $155.8 million and $114.9 million at March 31, 2010 and December 31, 2009, respectively,relating to individually impaired loans of $415.2 million and $385.6 million at March 31, 2010 and December 31, 2009, respectively. The average balance ofindividually impaired loans was $773.4 million and $527.6 million for the three months ended March 31, 2010 and 2009, respectively. Interest income recognizedduring the three months ended March 31, 2010 and 2009 related to individually impaired loans was not material.
Allowance for Loan and Lease Losses
The following is a summary of changes in the allowance for loan and lease losses:
Three Months Ended March 31, 2010 March 31, 2009 Balance at beginning of year $ 4,127,395 $ 4,523,960 Consolidation impact of securitization trusts 4,263,383 —
Adjusted balance at the beginning of the period 8,390,778 4,523,960 Provision for loan and lease losses 1,478,200 1,279,137 Other (99,450) (17,279) Charge-offs (2,418,545) (1,323,181) Principal recoveries 400,762 185,394
Net charge-offs (2,017,783) (1,137,787)
Balance at March 31 $ 7,751,745 $ 4,648,031
72
(1)
(2)
(2)
Table of Contents
(1) In conjunction with the deconsolidation on March 10, 2010 certain option arm mortgage loan trusts, originated by Chevy Chase Bank the Companyreleased $73.2 million of allowance recorded upon the initial consolidation.
(2) Includes charge-offs and recoveries for newly consolidated loans related to trusts previously accounted for as off-balance sheet arrangements.
The Company’s acquired loans from the Chevy Chase Bank acquisition were initially recorded at fair value and no separate allowance for loan and lease losses isrecorded for these loans as long as the loans perform as initially expected. Charge-offs of $98.5 million and $20.9 million at March 31, 2010 and 2009,respectively, were applied against the non-accretable difference established at acquisition. See “Note 2- Loans Acquired in a Transfer” for a more detaileddiscussion.
Unfunded Lending Commitments
We manage the potential risk in credit commitments by limiting the total amount of arrangements, both by individual customer and in total, by monitoring the sizeand maturity structure of these portfolios and by applying the same credit standards for all of our credit activities.
As of March 31, 2010 and December 31, 2009, the Company had $154.1 billion and $154.9 billion, respectively, of unused credit card lines. While this amountrepresented the total unused available credit card lines, the Company has not experienced, and does not anticipate, that all of its customers will exercise theirentire available line at any given point in time.
In addition to available unused credit card lines, the Company enters into commitments to extend credit that are legally binding conditional agreements havingfixed expirations or termination dates and specified interest rates and purposes. These commitments generally require customers to maintain certain creditstandards. Collateral requirements and loan-to-value ratios are the same as those for funded transactions and are established based on management’s creditassessment of the customer. Commitments may expire without being drawn upon. Therefore, the total commitment amount does not necessarily represent futurerequirements. The Company maintains a reserve for unfunded loan commitments and letters of credit to absorb estimated probable losses related to theseunfunded credit facilities in other liabilities. The outstanding unfunded commitments to extend credit other than credit card lines were approximately $12.6 billionand $12.0 billion as of March 31, 2010 and December 31, 2009, respectively. A reserve of $123.6 million and $118.6 million has been established as of March 31,2010 and December 31, 2009, respectively. NOTE 7—FAIR VALUE OF FINANCIAL INSTRUMENTS Fair Value Measurements and Disclosures, defines fair value as the exchange price that would be received for an asset or paid to transfer a liability (an exit price)in the principal or most advantageous market for the asset or liability in an orderly transaction between market participants on the measurement date. Fair ValueMeasurements and Disclosures requires that valuation techniques maximize the use of observable inputs and minimize the use of unobservable inputs. It alsoestablishes a fair value hierarchy which prioritizes the valuation inputs into three broad levels. Based on the underlying inputs, each fair value measurement in itsentirety is reported in one of the three levels. These levels are:
• Level 1—Valuation is based upon quoted prices for identical instruments traded in active markets. Level 1 assets and liabilities include debt and
equity securities traded in an active exchange market, as well as U.S. Treasury securities.
• Level 2—Valuation is based upon quoted prices for similar instruments in active markets, quoted prices for identical or similar instruments in
markets that are not active, and model based valuation techniques for which all significant assumptions are observable in the market or can becorroborated by observable market data for substantially the full term of the assets or liabilities.
• Level 3—Valuation is determined using model-based techniques with significant assumptions not observable in the market. These unobservable
assumptions reflect the Company’s own estimates of assumptions that market participants would use in pricing the asset or liability. Valuationtechniques include the use of third party pricing services, option pricing models, discounted cash flow models and similar techniques.
73
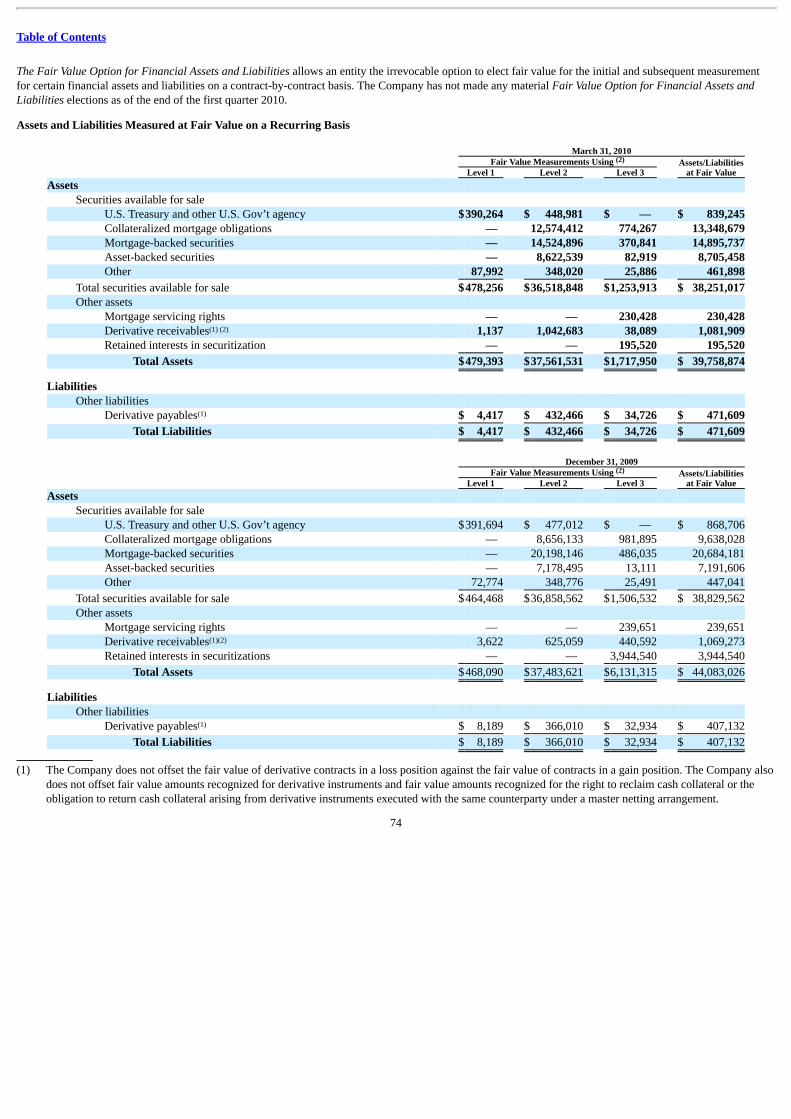
Table of Contents
The Fair Value Option for Financial Assets and Liabilities allows an entity the irrevocable option to elect fair value for the initial and subsequent measurementfor certain financial assets and liabilities on a contract-by-contract basis. The Company has not made any material Fair Value Option for Financial Assets andLiabilities elections as of the end of the first quarter 2010.
Assets and Liabilities Measured at Fair Value on a Recurring Basis
March 31, 2010 Fair Value Measurements Using Assets/Liabilities
at Fair Value Level 1 Level 2 Level 3 Assets
Securities available for sale U.S. Treasury and other U.S. Gov’t agency $390,264 $ 448,981 $ — $ 839,245Collateralized mortgage obligations — 12,574,412 774,267 13,348,679Mortgage-backed securities — 14,524,896 370,841 14,895,737Asset-backed securities — 8,622,539 82,919 8,705,458Other 87,992 348,020 25,886 461,898
Total securities available for sale $478,256 $36,518,848 $1,253,913 $ 38,251,017Other assets
Mortgage servicing rights — — 230,428 230,428Derivative receivables 1,137 1,042,683 38,089 1,081,909Retained interests in securitization — — 195,520 195,520
Total Assets $479,393 $37,561,531 $1,717,950 $ 39,758,874
Liabilities Other liabilities
Derivative payables $ 4,417 $ 432,466 $ 34,726 $ 471,609
Total Liabilities $ 4,417 $ 432,466 $ 34,726 $ 471,609
December 31, 2009 Fair Value Measurements Using Assets/Liabilities
at Fair Value Level 1 Level 2 Level 3 Assets
Securities available for sale U.S. Treasury and other U.S. Gov’t agency $391,694 $ 477,012 $ — $ 868,706Collateralized mortgage obligations — 8,656,133 981,895 9,638,028Mortgage-backed securities — 20,198,146 486,035 20,684,181Asset-backed securities — 7,178,495 13,111 7,191,606Other 72,774 348,776 25,491 447,041
Total securities available for sale $464,468 $36,858,562 $1,506,532 $ 38,829,562Other assets
Mortgage servicing rights — — 239,651 239,651Derivative receivables 3,622 625,059 440,592 1,069,273Retained interests in securitizations — — 3,944,540 3,944,540
Total Assets $468,090 $37,483,621 $6,131,315 $ 44,083,026
Liabilities Other liabilities
Derivative payables $ 8,189 $ 366,010 $ 32,934 $ 407,132
Total Liabilities $ 8,189 $ 366,010 $ 32,934 $ 407,132
(1) The Company does not offset the fair value of derivative contracts in a loss position against the fair value of contracts in a gain position. The Company alsodoes not offset fair value amounts recognized for derivative instruments and fair value amounts recognized for the right to reclaim cash collateral or theobligation to return cash collateral arising from derivative instruments executed with the same counterparty under a master netting arrangement.
74
(2)
(1) (2)
(1)
(2)
(1)(2)
(1)
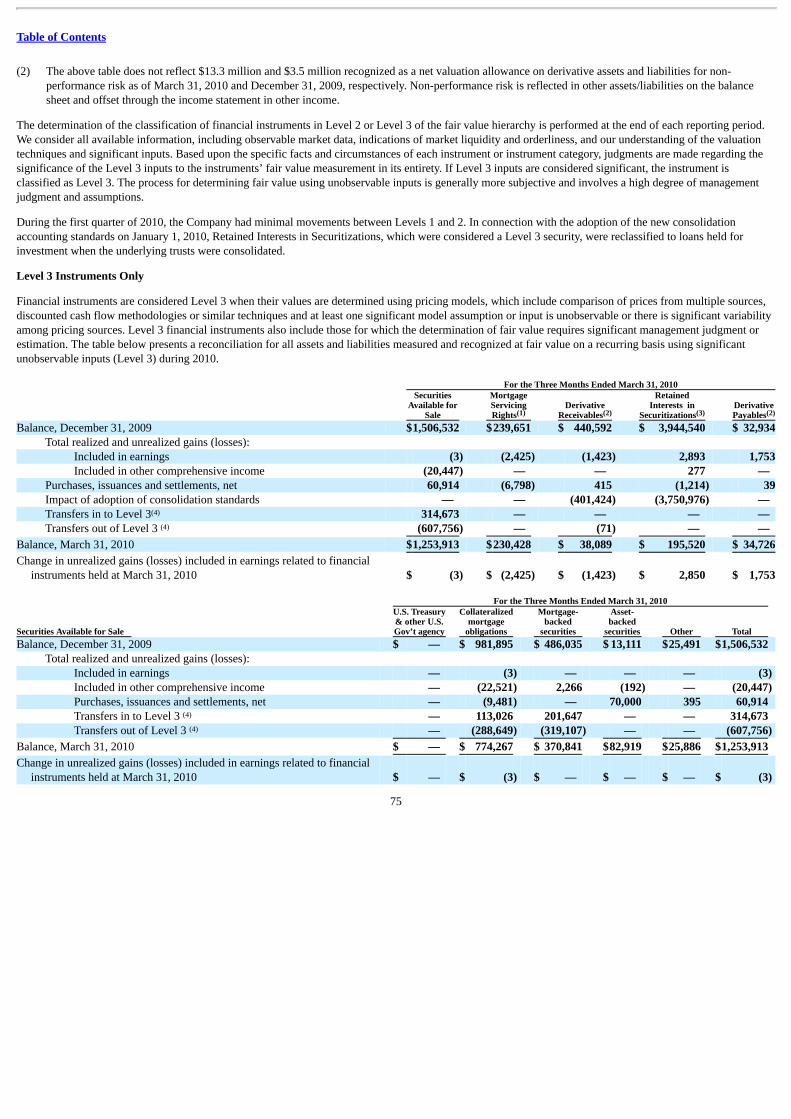
Table of Contents
(2) The above table does not reflect $13.3 million and $3.5 million recognized as a net valuation allowance on derivative assets and liabilities for non-performance risk as of March 31, 2010 and December 31, 2009, respectively. Non-performance risk is reflected in other assets/liabilities on the balancesheet and offset through the income statement in other income.
The determination of the classification of financial instruments in Level 2 or Level 3 of the fair value hierarchy is performed at the end of each reporting period.We consider all available information, including observable market data, indications of market liquidity and orderliness, and our understanding of the valuationtechniques and significant inputs. Based upon the specific facts and circumstances of each instrument or instrument category, judgments are made regarding thesignificance of the Level 3 inputs to the instruments’ fair value measurement in its entirety. If Level 3 inputs are considered significant, the instrument isclassified as Level 3. The process for determining fair value using unobservable inputs is generally more subjective and involves a high degree of managementjudgment and assumptions.
During the first quarter of 2010, the Company had minimal movements between Levels 1 and 2. In connection with the adoption of the new consolidationaccounting standards on January 1, 2010, Retained Interests in Securitizations, which were considered a Level 3 security, were reclassified to loans held forinvestment when the underlying trusts were consolidated.
Level 3 Instruments Only
Financial instruments are considered Level 3 when their values are determined using pricing models, which include comparison of prices from multiple sources,discounted cash flow methodologies or similar techniques and at least one significant model assumption or input is unobservable or there is significant variabilityamong pricing sources. Level 3 financial instruments also include those for which the determination of fair value requires significant management judgment orestimation. The table below presents a reconciliation for all assets and liabilities measured and recognized at fair value on a recurring basis using significantunobservable inputs (Level 3) during 2010. For the Three Months Ended March 31, 2010
SecuritiesAvailable for
Sale
MortgageServicingRights
DerivativeReceivables
RetainedInterests in
Securitizations DerivativePayables
Balance, December 31, 2009 $1,506,532 $239,651 $ 440,592 $ 3,944,540 $ 32,934Total realized and unrealized gains (losses):
Included in earnings (3) (2,425) (1,423) 2,893 1,753Included in other comprehensive income (20,447) — — 277 —
Purchases, issuances and settlements, net 60,914 (6,798) 415 (1,214) 39Impact of adoption of consolidation standards — — (401,424) (3,750,976) — Transfers in to Level 3 314,673 — — — — Transfers out of Level 3 (607,756) — (71) — —
Balance, March 31, 2010 $1,253,913 $230,428 $ 38,089 $ 195,520 $ 34,726
Change in unrealized gains (losses) included in earnings related to financialinstruments held at March 31, 2010 $ (3) $ (2,425) $ (1,423) $ 2,850 $ 1,753
For the Three Months Ended March 31, 2010
Securities Available for Sale
U.S. Treasury& other U.S.Gov’t agency
Collateralizedmortgage
obligations
Mortgage-backed
securities
Asset-backed
securities Other Total Balance, December 31, 2009 $ — $ 981,895 $ 486,035 $ 13,111 $25,491 $1,506,532
Total realized and unrealized gains (losses): Included in earnings — (3) — — — (3) Included in other comprehensive income — (22,521) 2,266 (192) — (20,447) Purchases, issuances and settlements, net — (9,481) — 70,000 395 60,914 Transfers in to Level 3 — 113,026 201,647 — — 314,673 Transfers out of Level 3 — (288,649) (319,107) — — (607,756)
Balance, March 31, 2010 $ — $ 774,267 $ 370,841 $82,919 $25,886 $1,253,913
Change in unrealized gains (losses) included in earnings related to financialinstruments held at March 31, 2010 $ — $ (3) $ — $ — $ — $ (3)
75
(1) (2) (3) (2)
(4)
(4)
(4)
(4)
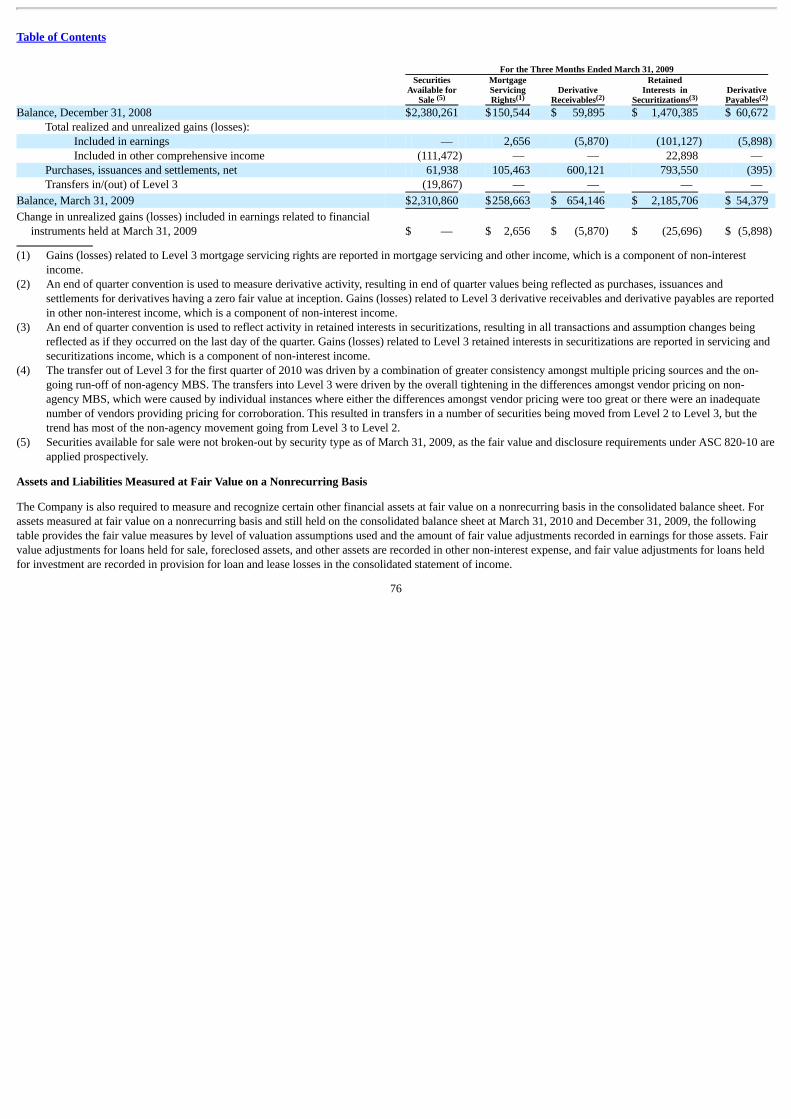
Table of Contents
For the Three Months Ended March 31, 2009
SecuritiesAvailable for
Sale
MortgageServicingRights
DerivativeReceivables
RetainedInterests in
Securitizations DerivativePayables
Balance, December 31, 2008 $2,380,261 $150,544 $ 59,895 $ 1,470,385 $ 60,672 Total realized and unrealized gains (losses):
Included in earnings — 2,656 (5,870) (101,127) (5,898) Included in other comprehensive income (111,472) — — 22,898 —
Purchases, issuances and settlements, net 61,938 105,463 600,121 793,550 (395) Transfers in/(out) of Level 3 (19,867) — — — —
Balance, March 31, 2009 $2,310,860 $258,663 $ 654,146 $ 2,185,706 $ 54,379
Change in unrealized gains (losses) included in earnings related to financialinstruments held at March 31, 2009 $ — $ 2,656 $ (5,870) $ (25,696) $ (5,898)
(1) Gains (losses) related to Level 3 mortgage servicing rights are reported in mortgage servicing and other income, which is a component of non-interest
income.(2) An end of quarter convention is used to measure derivative activity, resulting in end of quarter values being reflected as purchases, issuances and
settlements for derivatives having a zero fair value at inception. Gains (losses) related to Level 3 derivative receivables and derivative payables are reportedin other non-interest income, which is a component of non-interest income.
(3) An end of quarter convention is used to reflect activity in retained interests in securitizations, resulting in all transactions and assumption changes beingreflected as if they occurred on the last day of the quarter. Gains (losses) related to Level 3 retained interests in securitizations are reported in servicing andsecuritizations income, which is a component of non-interest income.
(4) The transfer out of Level 3 for the first quarter of 2010 was driven by a combination of greater consistency amongst multiple pricing sources and the on-going run-off of non-agency MBS. The transfers into Level 3 were driven by the overall tightening in the differences amongst vendor pricing on non-agency MBS, which were caused by individual instances where either the differences amongst vendor pricing were too great or there were an inadequatenumber of vendors providing pricing for corroboration. This resulted in transfers in a number of securities being moved from Level 2 to Level 3, but thetrend has most of the non-agency movement going from Level 3 to Level 2.
(5) Securities available for sale were not broken-out by security type as of March 31, 2009, as the fair value and disclosure requirements under ASC 820-10 areapplied prospectively.
Assets and Liabilities Measured at Fair Value on a Nonrecurring Basis
The Company is also required to measure and recognize certain other financial assets at fair value on a nonrecurring basis in the consolidated balance sheet. Forassets measured at fair value on a nonrecurring basis and still held on the consolidated balance sheet at March 31, 2010 and December 31, 2009, the followingtable provides the fair value measures by level of valuation assumptions used and the amount of fair value adjustments recorded in earnings for those assets. Fairvalue adjustments for loans held for sale, foreclosed assets, and other assets are recorded in other non-interest expense, and fair value adjustments for loans heldfor investment are recorded in provision for loan and lease losses in the consolidated statement of income.
76
(5) (1) (2) (3) (2)
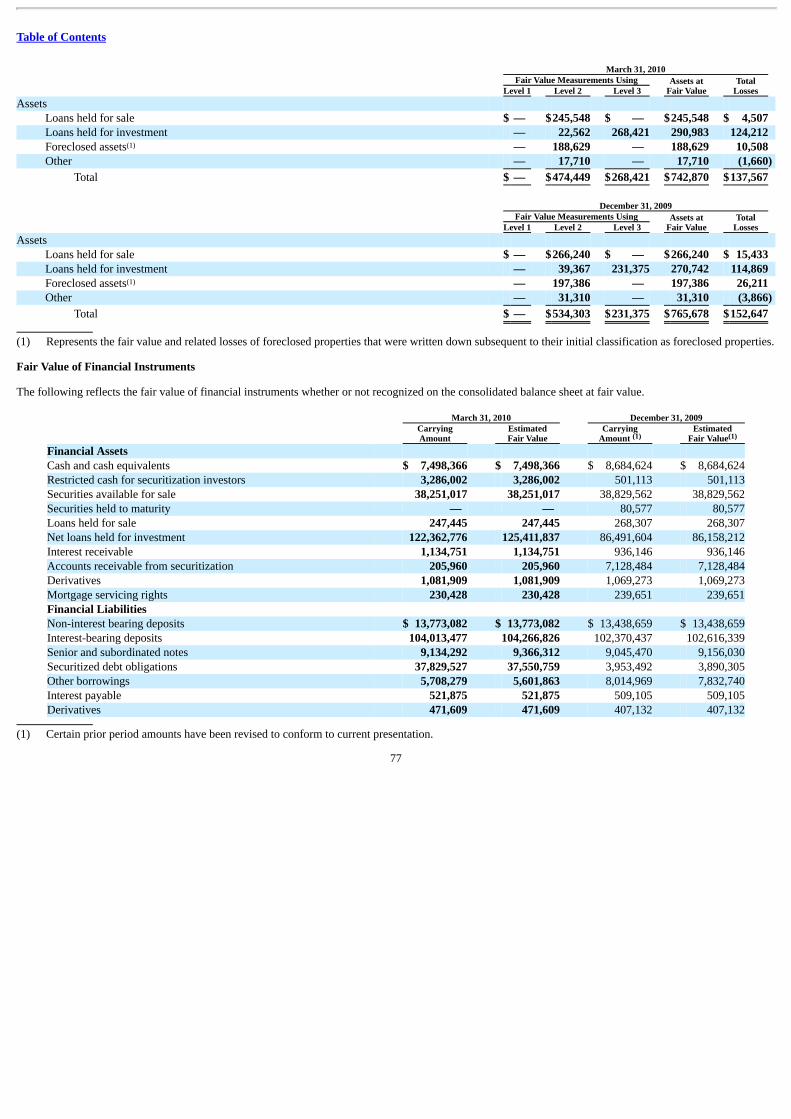
Table of Contents
March 31, 2010 Fair Value Measurements Using Assets at
Fair Value Total
Losses Level 1 Level 2 Level 3 Assets
Loans held for sale $ — $245,548 $ — $245,548 $ 4,507 Loans held for investment — 22,562 268,421 290,983 124,212 Foreclosed assets — 188,629 — 188,629 10,508 Other — 17,710 — 17,710 (1,660)
Total $ — $474,449 $268,421 $742,870 $137,567
December 31, 2009 Fair Value Measurements Using Assets at
Fair Value Total
Losses Level 1 Level 2 Level 3 Assets
Loans held for sale $ — $266,240 $ — $266,240 $ 15,433 Loans held for investment — 39,367 231,375 270,742 114,869 Foreclosed assets — 197,386 — 197,386 26,211 Other — 31,310 — 31,310 (3,866)
Total $ — $534,303 $231,375 $765,678 $152,647
(1) Represents the fair value and related losses of foreclosed properties that were written down subsequent to their initial classification as foreclosed properties.
Fair Value of Financial Instruments
The following reflects the fair value of financial instruments whether or not recognized on the consolidated balance sheet at fair value.
March 31, 2010 December 31, 2009
CarryingAmount
EstimatedFair Value
CarryingAmount
EstimatedFair Value
Financial Assets Cash and cash equivalents $ 7,498,366 $ 7,498,366 $ 8,684,624 $ 8,684,624Restricted cash for securitization investors 3,286,002 3,286,002 501,113 501,113Securities available for sale 38,251,017 38,251,017 38,829,562 38,829,562Securities held to maturity — — 80,577 80,577Loans held for sale 247,445 247,445 268,307 268,307Net loans held for investment 122,362,776 125,411,837 86,491,604 86,158,212Interest receivable 1,134,751 1,134,751 936,146 936,146Accounts receivable from securitization 205,960 205,960 7,128,484 7,128,484Derivatives 1,081,909 1,081,909 1,069,273 1,069,273Mortgage servicing rights 230,428 230,428 239,651 239,651Financial Liabilities Non-interest bearing deposits $ 13,773,082 $ 13,773,082 $ 13,438,659 $ 13,438,659Interest-bearing deposits 104,013,477 104,266,826 102,370,437 102,616,339Senior and subordinated notes 9,134,292 9,366,312 9,045,470 9,156,030Securitized debt obligations 37,829,527 37,550,759 3,953,492 3,890,305Other borrowings 5,708,279 5,601,863 8,014,969 7,832,740Interest payable 521,875 521,875 509,105 509,105Derivatives 471,609 471,609 407,132 407,132
(1) Certain prior period amounts have been revised to conform to current presentation.
77
(1)
(1)
(1) (1)
Table of Contents
The following describes the valuation techniques used in estimating the fair value of the Company’s financial instruments as of March 31, 2010 andDecember 31, 2009. The Company applied the provisions of Fair Value Measurements and Disclosures, to the financial instruments not recognized on theconsolidated balance sheet at fair value, which include loans held for investment, interest receivable, non-interest bearing and interest bearing deposits, otherborrowings, senior and subordinated notes, and interest payable. The provisions requiring the Company to maximize the use of observable inputs and to measurefair value using a notion of exit price were factored into the Company’s selection of inputs into its established valuation techniques.
Financial Assets
Cash and cash equivalents
The carrying amounts of cash and due from banks, federal funds sold and resale agreements and interest-bearing deposits at other banks approximate fair value.
Restricted cash for securitization investors
The carrying amounts of restricted cash for securitization investors approximate their fair value.
Securities held to maturity
The carrying amounts of securities held to maturity, which consists of negative amortization bonds, approximate fair value. The Company recorded thesesecurities at fair value on the date of acquisition. Fair value is determined using a discounted cash flow method, a form of the income approach. Discount rateswere determined considering market rates at which similar instruments would be sold to third parties.
Securities available for sale
Quoted prices in active markets are used to measure the fair value of U.S. Treasury securities. For other investment categories, the Company utilizes multiplethird party pricing services to obtain fair value measures for the large majority of its securities. A pricing service may be considered as the primary pricingprovider for certain types of securities, and the designation of the primary pricing provider may vary depending on the type of securities. The determination of theprimary pricing provider is based on the Company’s experience and validation benchmark of the pricing service’s performance in terms of providing fair valuemeasurement for the various types of securities.
Certain securities available for sale are classified as Level 2 and 3, the majority of which are collateralized mortgage obligations and mortgage backed securities.Classification indicates that significant valuation assumptions are not consistently observable in the market. When significant assumptions are not consistentlyobservable, fair values are derived using the best available data. Such data may include quotes provided by a dealer, the use of external pricing services,independent pricing models, or other model-based valuation techniques such as calculation of the present values of future cash flows incorporating assumptionssuch as benchmark yields, spreads, prepayment speeds, credit ratings, and losses. The techniques used by the pricing services utilize observable market data to theextent available. Pricing models may be used, which can vary by asset class and may incorporate available trade, bid and other market information. Across assetclasses information such as trader/dealer input, credit spreads, forward curves, and prepayment speeds are used to help determine appropriate valuations. Becausemany fixed income securities do not trade on a daily basis, the evaluated pricing applications may apply available information through processes such asbenchmarking curves, like securities, sector groupings, and matrix pricing to prepare valuations. In addition, model processes are used by the pricing services todevelop prepayment and interest rate scenarios.
The Company validates the pricing obtained from the primary pricing providers through comparison of pricing to additional sources, including other pricingservices, dealer pricing indications in transaction results, and other internal sources. Pricing variances among different pricing sources are analyzed and validated.
As of March 31, 2010, we saw significant improvements in the market value of our portfolio holdings driven by stabilization of the financial markets and reducedrisk premiums as compared to 2009. The decrease in the amount of Level 3 securities reflected continued run-off of the securities, the liquidation of theCompany’s CMBS and MBS securities, and improvement in pricing consistency.
Loans held for sale
Loans held for sale are carried at the lower of aggregate cost, net of deferred fees, deferred origination costs and effects of hedge accounting, or fair value. Thefair value of loans held for sale is determined using current secondary market prices for portfolios with similar characteristics. The carrying amounts as ofMarch 31, 2010 and December 31, 2009 approximate fair value.
78
Table of Contents
Loans held for investment, net
The fair values of credit card loans, installment loans, auto loans, mortgage loans and commercial loans were estimated using a discounted cash flow method, aform of the income approach. Discount rates were determined considering rates at which similar portfolios of loans would be made under current conditions andconsidering liquidity spreads applicable to each loan portfolio based on the secondary market. The fair value of credit card loans excluded any value related tocustomer account relationships. The increase in fair value above carrying amount at March 31, 2010 was primarily due to a tightening of liquidity spreads andimproved credit performance noted in our primarily in our credit card and auto portfolios. The most significant discounts to carrying amount were seen in theCompany’s commercial and mortgage portfolios.
Commercial loans are considered impaired when it is probable that all amounts due in accordance with the contractual terms will not be collected. From time totime, the Company records nonrecurring fair value adjustments to reflect the fair value of the loan’s collateral. See table within “Assets and Liabilities Measuredat Fair Value on a Nonrecurring Basis” above.
Interest Receivable
The carrying amount approximates the fair value of this asset due to its relatively short-term nature.
Accounts receivable from securitizations
Accounts receivable from securitizations include the interest-only strip, retained notes accrued interest receivable, cash reserve accounts and cash spread accountsfor those securitization structures achieving off- balance sheet treatment. Refer to “Note 13 – Securitizations” for discussion regarding the adoption of the newaccounting consolidation standards on January 1, 2010. The Company uses a valuation model that calculates the present value of estimated future cash flows. Themodel incorporates the Company’s own estimates of assumptions market participants use in determining fair value, including estimates of payment rates, defaults,discount rates including adjustments for liquidity, and contractual interest and fees. Other retained interests related to securitizations are carried at cost, whichapproximates fair value. The valuation technique for these securities is discussed in more detail in “Note 13- Securitizations”.
Derivative assets
Most of the Company’s derivatives are not exchange traded, but instead traded in over the counter markets where quoted market prices are not readily available.The fair value of those derivatives is derived using models that use primarily market observable inputs, such as interest rate yield curves, credit curves, optionvolatility and currency rates are classified as Level 2. Any derivative fair value measurements using significant assumptions that are unobservable are classifiedas Level 3, which include interest rate swaps whose remaining terms do not correlate with market observable interest rate yield curves. The impact ofcounterparty non-performance risk is considered when measuring the fair value of derivative assets. These derivatives are included in other assets on the balancesheet.
The Company validates the pricing obtained from the internal models through comparison of pricing to additional sources, including external valuation agentsand other internal sources. Pricing variances among different pricing sources are analyzed and validated.
Mortgage servicing rights
Mortgage servicing rights (“MSRs”) do not trade in an active market with readily observable prices. Accordingly, the Company determines the fair value ofMSRs using a valuation model that calculates the present value of estimated future net servicing income. The model incorporates assumptions that marketparticipants use in estimating future net servicing income, including estimates of prepayment spreads, discount rate, cost to service, contractual servicing feeincome, ancillary income and late fees. The Company records MSRs at fair value on a recurring basis. Fair value measurements of MSRs use significantunobservable inputs and, accordingly, are classified as Level 3. The valuation technique for these securities is discussed in more detail in “Note 10- MortgageServicing Rights”.
Financial liabilities
Interest bearing deposits
The fair value of other interest-bearing deposits was determined based on discounted expected cash flows using discount rates consistent with current market ratesfor similar products with similar remaining terms.
Non-interest bearing deposits
The carrying amount approximates fair value.
79
Table of Contents
Senior and subordinated notes
The Company engages third party pricing services in order to estimate the fair value of senior and subordinated notes. The pricing service utilizes a pricing modelthat incorporates available trade, bid and other market information. It also incorporates spread assumptions, volatility assumptions and relevant credit informationinto the pricing models.
Securitized debt obligations
The fair value for the majority of our securitized debt obligations was based on third party pricing services. The methodology used by these pricing services wasthe same as the methodology used to determine the fair value of senior and subordinated notes, which is described below. The Company used internal pricingmodels, discounted cash flow models or similar techniques to estimate the fair value of certain securitization trusts where third party pricing was not provided.
Other borrowings
The carrying amount of federal funds purchased and resale agreements, FHLB advances, and other short-term borrowings approximates fair value. The fair valueof junior subordinated debentures was estimated using the same methodology as described for senior and subordinated notes below. The fair value of otherborrowings was determined based on trade information for bonds with similar duration and credit quality, adjusted to incorporate any relevant credit informationof the issuer. The decrease in fair value of other borrowings below carrying values at March 31, 2010 was primarily due to interest rate spreads across the industryand the discounts in secondary trading activity exhibited in the junior subordinated debentures during the first quarter of 2010.
Interest payable
The carrying amount approximates the fair value of this liability due to its relatively short-term nature.
Derivative liabilities
Most of the Company’s derivatives are not exchange traded, but instead traded in over the counter markets where quoted market prices are not readily available.The fair value of those derivatives is derived using models that use primarily market observable inputs, such as interest rate yield curves, credit curves, optionvolatility and currency rates are classified as Level 2. Any derivative fair value measurements using significant assumptions that are unobservable are classifiedas Level 3, which include interest rate swaps whose remaining terms do not correlate with market observable interest rate yield curves. The impact ofcounterparty non-performance risk is considered when measuring the fair value of derivative assets. These derivatives are included in other liabilities on thebalance sheet.
The Company validates the pricing obtained from the internal models through comparison of pricing to additional sources, including external valuation agentsand other internal sources. Pricing variances among different pricing sources are analyzed and validated.
Commitments to extend credit and letters of credit
These financial instruments are generally not sold or traded. The fair value of the financial guarantees outstanding at March 31, 2010 and December 31, 2009 thathave been issued since January 1, 2003, are $2.8 million and $3.1 million, respectively, and was included in other liabilities. The estimated fair values ofextensions of credit and letters of credit are not readily available. However, the fair value of commitments to extend credit and letters of credit is based on feescurrently charged to enter into similar agreements with comparable credit risks and the current creditworthiness of the counterparties. Commitments to extendcredit issued by the Company are generally short-term in nature and, if drawn upon, are issued under current market terms and conditions for credits withcomparable risks. At March 31, 2010 and December 31, 2009 there was no material unrealized appreciation or depreciation on these financial instruments. NOTE 8—GOODWILL AND OTHER INTANGIBLE ASSETS The Company’s goodwill balance for quarter ended as March 31, 2010 was $13.6 billion; the decrease of $7.0 million from December 31, 2009 was primarilyattributed to foreign currency translation adjustments. The goodwill is allocated to the Company’s Credit Card, Commercial Banking and Consumer Bankingsegments and is tested for impairment at the reporting unit level, which is at the operating segment level or one level below an operating segment. There were noevents requiring an interim impairment test and there has been no goodwill impairment recorded for the quarter ended March 31, 2010.
The core deposit and trust intangibles reflect the estimated value of deposit and trust relationships. The lease intangibles reflect the difference between thecontractual obligation under current lease contracts and the fair market value of the lease contracts at the acquisition date. The other intangible items relate tocustomer lists and brokerage relationships.
80
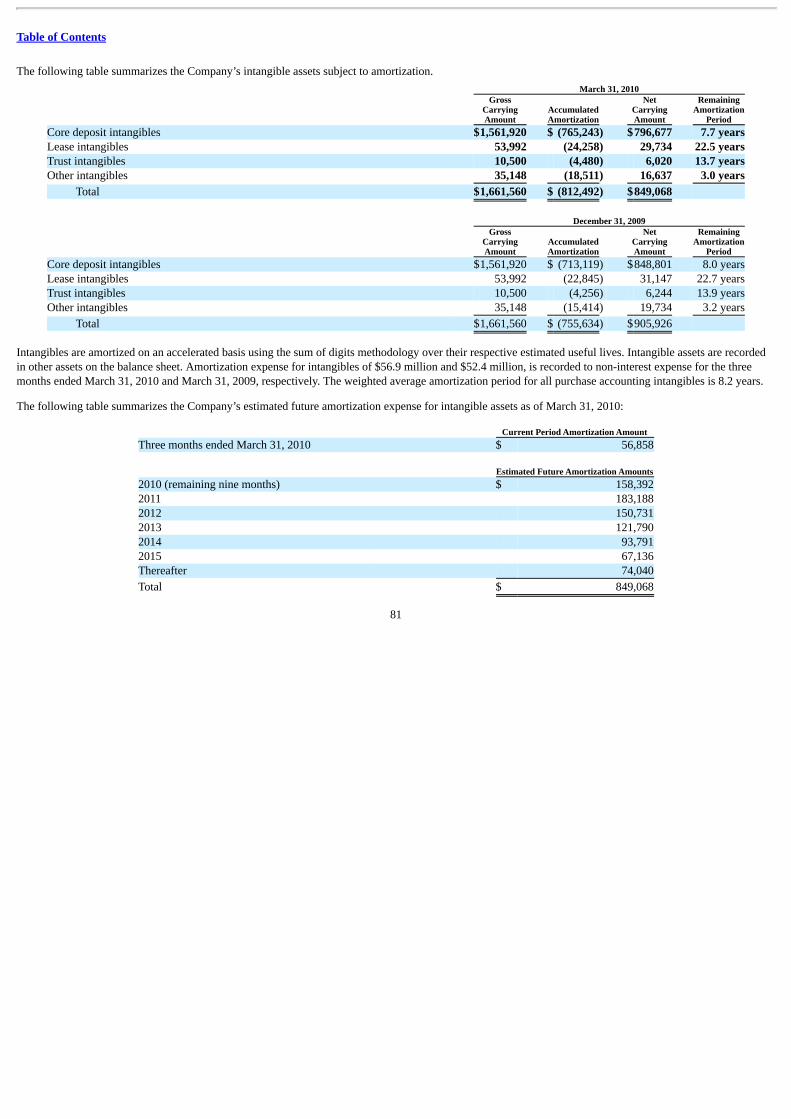
Table of Contents
The following table summarizes the Company’s intangible assets subject to amortization.
March 31, 2010
GrossCarryingAmount
AccumulatedAmortization
NetCarryingAmount
RemainingAmortization
PeriodCore deposit intangibles $1,561,920 $ (765,243) $796,677 7.7 yearsLease intangibles 53,992 (24,258) 29,734 22.5 yearsTrust intangibles 10,500 (4,480) 6,020 13.7 yearsOther intangibles 35,148 (18,511) 16,637 3.0 years
Total $1,661,560 $ (812,492) $849,068
December 31, 2009
GrossCarryingAmount
AccumulatedAmortization
NetCarryingAmount
RemainingAmortization
PeriodCore deposit intangibles $1,561,920 $ (713,119) $848,801 8.0 yearsLease intangibles 53,992 (22,845) 31,147 22.7 yearsTrust intangibles 10,500 (4,256) 6,244 13.9 yearsOther intangibles 35,148 (15,414) 19,734 3.2 years
Total $1,661,560 $ (755,634) $905,926
Intangibles are amortized on an accelerated basis using the sum of digits methodology over their respective estimated useful lives. Intangible assets are recordedin other assets on the balance sheet. Amortization expense for intangibles of $56.9 million and $52.4 million, is recorded to non-interest expense for the threemonths ended March 31, 2010 and March 31, 2009, respectively. The weighted average amortization period for all purchase accounting intangibles is 8.2 years.
The following table summarizes the Company’s estimated future amortization expense for intangible assets as of March 31, 2010:
Current Period Amortization AmountThree months ended March 31, 2010 $ 56,858
Estimated Future Amortization Amounts2010 (remaining nine months) $ 158,3922011 183,1882012 150,7312013 121,7902014 93,7912015 67,136Thereafter 74,040
Total $ 849,068
81
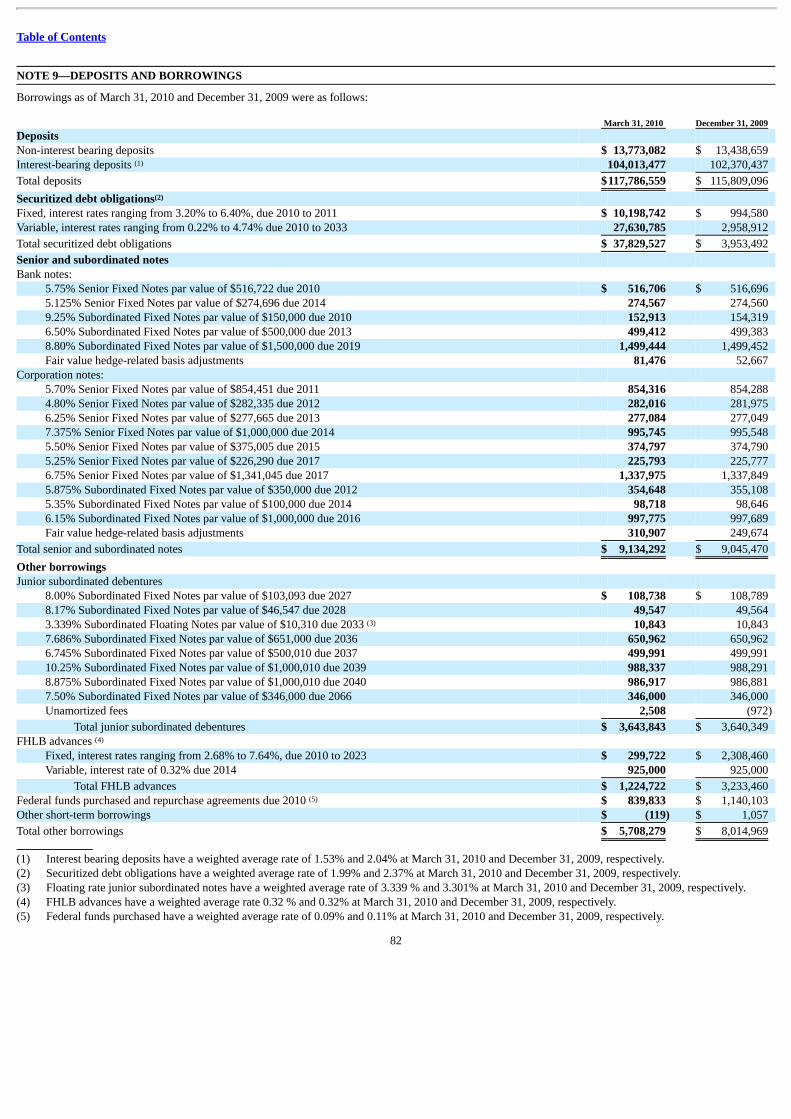
Table of Contents
NOTE 9—DEPOSITS AND BORROWINGS Borrowings as of March 31, 2010 and December 31, 2009 were as follows: March 31, 2010 December 31, 2009 Deposits Non-interest bearing deposits $ 13,773,082 $ 13,438,659 Interest-bearing deposits 104,013,477 102,370,437
Total deposits $117,786,559 $ 115,809,096
Securitized debt obligations Fixed, interest rates ranging from 3.20% to 6.40%, due 2010 to 2011 $ 10,198,742 $ 994,580 Variable, interest rates ranging from 0.22% to 4.74% due 2010 to 2033 27,630,785 2,958,912
Total securitized debt obligations $ 37,829,527 $ 3,953,492
Senior and subordinated notes Bank notes:
5.75% Senior Fixed Notes par value of $516,722 due 2010 $ 516,706 $ 516,696 5.125% Senior Fixed Notes par value of $274,696 due 2014 274,567 274,560 9.25% Subordinated Fixed Notes par value of $150,000 due 2010 152,913 154,319 6.50% Subordinated Fixed Notes par value of $500,000 due 2013 499,412 499,383 8.80% Subordinated Fixed Notes par value of $1,500,000 due 2019 1,499,444 1,499,452 Fair value hedge-related basis adjustments 81,476 52,667
Corporation notes: 5.70% Senior Fixed Notes par value of $854,451 due 2011 854,316 854,288 4.80% Senior Fixed Notes par value of $282,335 due 2012 282,016 281,975 6.25% Senior Fixed Notes par value of $277,665 due 2013 277,084 277,049 7.375% Senior Fixed Notes par value of $1,000,000 due 2014 995,745 995,548 5.50% Senior Fixed Notes par value of $375,005 due 2015 374,797 374,790 5.25% Senior Fixed Notes par value of $226,290 due 2017 225,793 225,777 6.75% Senior Fixed Notes par value of $1,341,045 due 2017 1,337,975 1,337,849 5.875% Subordinated Fixed Notes par value of $350,000 due 2012 354,648 355,108 5.35% Subordinated Fixed Notes par value of $100,000 due 2014 98,718 98,646 6.15% Subordinated Fixed Notes par value of $1,000,000 due 2016 997,775 997,689 Fair value hedge-related basis adjustments 310,907 249,674
Total senior and subordinated notes $ 9,134,292 $ 9,045,470
Other borrowings Junior subordinated debentures
8.00% Subordinated Fixed Notes par value of $103,093 due 2027 $ 108,738 $ 108,789 8.17% Subordinated Fixed Notes par value of $46,547 due 2028 49,547 49,564 3.339% Subordinated Floating Notes par value of $10,310 due 2033 10,843 10,843 7.686% Subordinated Fixed Notes par value of $651,000 due 2036 650,962 650,962 6.745% Subordinated Fixed Notes par value of $500,010 due 2037 499,991 499,991 10.25% Subordinated Fixed Notes par value of $1,000,010 due 2039 988,337 988,291 8.875% Subordinated Fixed Notes par value of $1,000,010 due 2040 986,917 986,881 7.50% Subordinated Fixed Notes par value of $346,000 due 2066 346,000 346,000 Unamortized fees 2,508 (972)
Total junior subordinated debentures $ 3,643,843 $ 3,640,349 FHLB advances
Fixed, interest rates ranging from 2.68% to 7.64%, due 2010 to 2023 $ 299,722 $ 2,308,460 Variable, interest rate of 0.32% due 2014 925,000 925,000
Total FHLB advances $ 1,224,722 $ 3,233,460 Federal funds purchased and repurchase agreements due 2010 $ 839,833 $ 1,140,103 Other short-term borrowings $ (119) $ 1,057
Total other borrowings $ 5,708,279 $ 8,014,969
(1) Interest bearing deposits have a weighted average rate of 1.53% and 2.04% at March 31, 2010 and December 31, 2009, respectively.(2) Securitized debt obligations have a weighted average rate of 1.99% and 2.37% at March 31, 2010 and December 31, 2009, respectively.(3) Floating rate junior subordinated notes have a weighted average rate of 3.339 % and 3.301% at March 31, 2010 and December 31, 2009, respectively.(4) FHLB advances have a weighted average rate 0.32 % and 0.32% at March 31, 2010 and December 31, 2009, respectively.(5) Federal funds purchased have a weighted average rate of 0.09% and 0.11% at March 31, 2010 and December 31, 2009, respectively.
82
(1)
(2)
(3)
(4)
(5)
Table of Contents
Deposits
Interest-Bearing Deposits
As of March 31, 2010, the Company had $104.0 billion in interest-bearing deposits of which $8.2 billion represents large denomination certificates of $100,000or more. As of December 31, 2009, the Company had $102.4 billion in interest-bearing deposits of which $8.8 billion represents large denomination certificatesof $100,000 or more.
Corporation Shelf Registration Statement
As of March 31, 2010, the Corporation had an effective shelf registration statement under which the Corporation may offer and sell an indeterminate aggregateamount of senior or subordinated debt securities, preferred stock, depositary shares representing preferred stock, common stock, warrants, trust preferredsecurities, junior subordinated debt securities, guarantees of trust preferred securities and certain back-up obligations, purchase contracts and units. There is nolimit under this shelf registration statement to the amount or number of such securities that the Corporation may offer and sell. Under SEC rules, the AutomaticShelf Registration Statement expires three years after filing and is effective through May 2012.
Securitized Debt Obligations
Upon adoption of the new consolidation guidance on January 1, 2010, the Company consolidated all of its credit card securitization trusts and all but oneinstallment loan program which resulted in an increase of $44.3 billion in securitized debt obligations. The balance as of March 31, 2010 consists of $34.7 billionin credit card and installment loan securitized debt obligations and $3.1 billion in auto securitized debt obligations.
The Company issues securitizations in which it transfers pools of credit card receivables, installment loans and auto loans to various trusts. These securitizationsare accounted for as secured borrowings at March 31, 2010. Principal payments on the borrowings are based on principal collections and finance charge and feecollections reclassified to cover losses on the transferred loans. The secured borrowings accrue interest at either fixed or variable rates and mature between April2010 and July 2025, but may mature earlier or later, depending upon the repayment of the underlying loans. At March 31, 2010 and December 31, 2009, $37.8billion and $4.0 billion, respectively, of the securitized debt obligations were outstanding. The Company continues to service the receivables in the trusts and itretains certain other interests in the trusts, including retained notes, which are eliminated upon consolidation and cash collateral accounts and cash reserveaccounts, which are presented as restricted cash. See “Note 13- Securitizations” for further discussion of secured borrowings.
Secured borrowings also include tender option bonds of $32.4 million and $33.1 million at March 31, 2010 and December 31, 2009, respectively.
Borrowings
Senior and Subordinated Notes
The Senior and Subordinated Global Bank Note Program gives COBNA the ability to issue securities to both U.S. and non-U.S. lenders and to raise funds in U.S.and foreign currencies. The Senior and Subordinated Global Bank Note Program had $1.3 billion outstanding at March 31, 2010 and December 31, 2009,respectively.
The Company issued senior and subordinated notes that as of March 31, 2010 and December 31, 2009, had an outstanding balance of $9.1 billion and $9.0billion, respectively. The outstanding balance of senior and subordinated bank notes include a fair value adjustments of $392.4 million and $302.3 million relatedto fair value accounting hedges at March 31, 2010 and December 31, 2009, respectively. See “Note 12- Derivative Instruments and Hedging Instruments” for afurther discussion of fair value interest rate hedges. The weighted average stated rate included in the table above is before the impact of these interest ratederivatives.
Other Borrowings
Junior Subordinated Debentures
At March 31, 2010 and December 31, 2009, the Company had junior subordinated debentures outstanding of $3.6 billion, respectively.
For the three months ended March 31, 2010 and the year ended December 31, 2009, respectively, no junior subordinated debentures were called or matured.
83
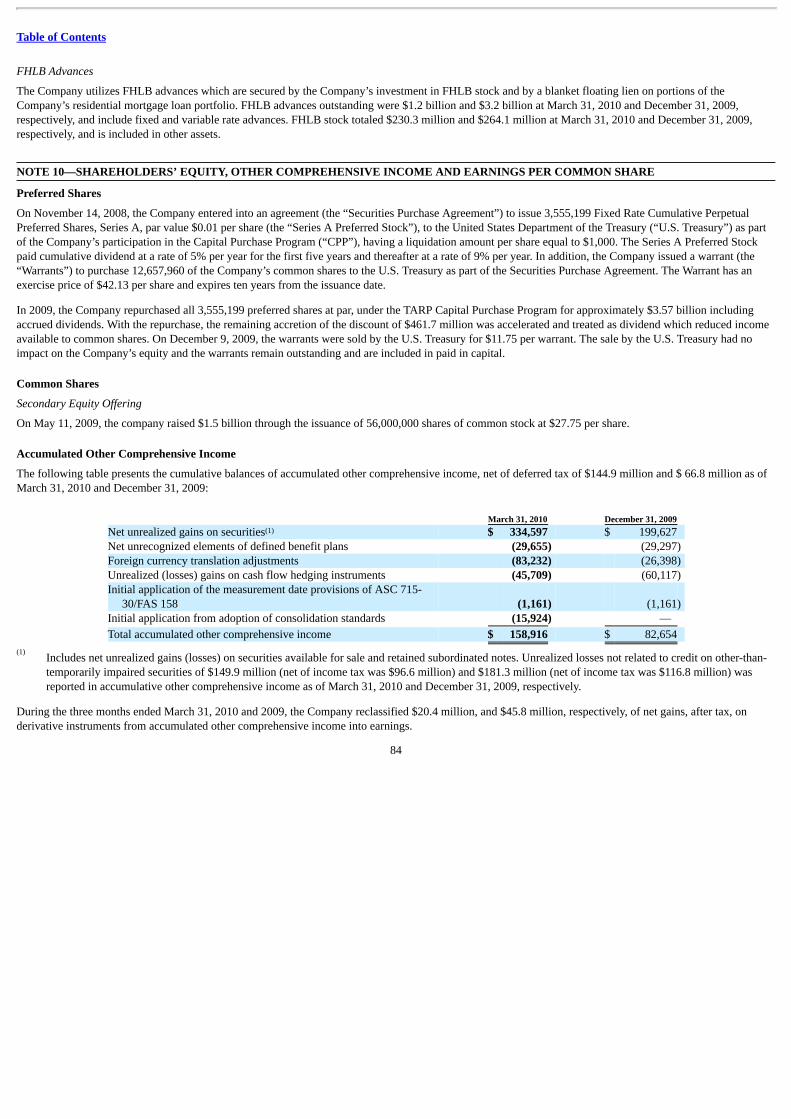
Table of Contents
FHLB Advances
The Company utilizes FHLB advances which are secured by the Company’s investment in FHLB stock and by a blanket floating lien on portions of theCompany’s residential mortgage loan portfolio. FHLB advances outstanding were $1.2 billion and $3.2 billion at March 31, 2010 and December 31, 2009,respectively, and include fixed and variable rate advances. FHLB stock totaled $230.3 million and $264.1 million at March 31, 2010 and December 31, 2009,respectively, and is included in other assets. NOTE 10—SHAREHOLDERS’ EQUITY, OTHER COMPREHENSIVE INCOME AND EARNINGS PER COMMON SHARE Preferred Shares
On November 14, 2008, the Company entered into an agreement (the “Securities Purchase Agreement”) to issue 3,555,199 Fixed Rate Cumulative PerpetualPreferred Shares, Series A, par value $0.01 per share (the “Series A Preferred Stock”), to the United States Department of the Treasury (“U.S. Treasury”) as partof the Company’s participation in the Capital Purchase Program (“CPP”), having a liquidation amount per share equal to $1,000. The Series A Preferred Stockpaid cumulative dividend at a rate of 5% per year for the first five years and thereafter at a rate of 9% per year. In addition, the Company issued a warrant (the“Warrants”) to purchase 12,657,960 of the Company’s common shares to the U.S. Treasury as part of the Securities Purchase Agreement. The Warrant has anexercise price of $42.13 per share and expires ten years from the issuance date.
In 2009, the Company repurchased all 3,555,199 preferred shares at par, under the TARP Capital Purchase Program for approximately $3.57 billion includingaccrued dividends. With the repurchase, the remaining accretion of the discount of $461.7 million was accelerated and treated as dividend which reduced incomeavailable to common shares. On December 9, 2009, the warrants were sold by the U.S. Treasury for $11.75 per warrant. The sale by the U.S. Treasury had noimpact on the Company’s equity and the warrants remain outstanding and are included in paid in capital.
Common Shares
Secondary Equity Offering
On May 11, 2009, the company raised $1.5 billion through the issuance of 56,000,000 shares of common stock at $27.75 per share.
Accumulated Other Comprehensive Income
The following table presents the cumulative balances of accumulated other comprehensive income, net of deferred tax of $144.9 million and $ 66.8 million as ofMarch 31, 2010 and December 31, 2009:
March 31, 2010 December 31, 2009 Net unrealized gains on securities $ 334,597 $ 199,627 Net unrecognized elements of defined benefit plans (29,655) (29,297) Foreign currency translation adjustments (83,232) (26,398) Unrealized (losses) gains on cash flow hedging instruments (45,709) (60,117) Initial application of the measurement date provisions of ASC 715-
30/FAS 158 (1,161) (1,161) Initial application from adoption of consolidation standards (15,924) —
Total accumulated other comprehensive income $ 158,916 $ 82,654
Includes net unrealized gains (losses) on securities available for sale and retained subordinated notes. Unrealized losses not related to credit on other-than-temporarily impaired securities of $149.9 million (net of income tax was $96.6 million) and $181.3 million (net of income tax was $116.8 million) wasreported in accumulative other comprehensive income as of March 31, 2010 and December 31, 2009, respectively.
During the three months ended March 31, 2010 and 2009, the Company reclassified $20.4 million, and $45.8 million, respectively, of net gains, after tax, onderivative instruments from accumulated other comprehensive income into earnings.
84
(1)
(1)
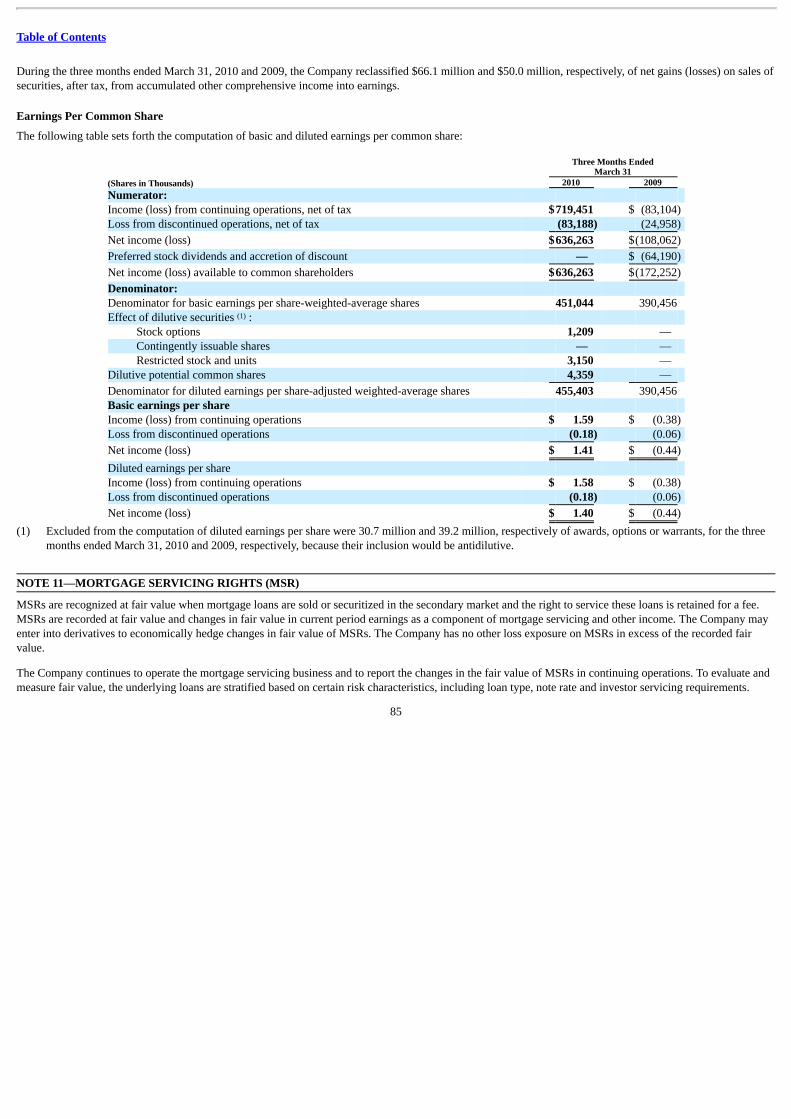
Table of Contents
During the three months ended March 31, 2010 and 2009, the Company reclassified $66.1 million and $50.0 million, respectively, of net gains (losses) on sales ofsecurities, after tax, from accumulated other comprehensive income into earnings.
Earnings Per Common Share
The following table sets forth the computation of basic and diluted earnings per common share:
Three Months Ended
March 31 (Shares in Thousands) 2010 2009 Numerator: Income (loss) from continuing operations, net of tax $719,451 $ (83,104) Loss from discontinued operations, net of tax (83,188) (24,958)
Net income (loss) $636,263 $(108,062)
Preferred stock dividends and accretion of discount — $ (64,190)
Net income (loss) available to common shareholders $636,263 $(172,252)
Denominator: Denominator for basic earnings per share-weighted-average shares 451,044 390,456 Effect of dilutive securities :
Stock options 1,209 — Contingently issuable shares — — Restricted stock and units 3,150 —
Dilutive potential common shares 4,359 —
Denominator for diluted earnings per share-adjusted weighted-average shares 455,403 390,456 Basic earnings per share Income (loss) from continuing operations $ 1.59 $ (0.38) Loss from discontinued operations (0.18) (0.06)
Net income (loss) $ 1.41 $ (0.44)
Diluted earnings per share Income (loss) from continuing operations $ 1.58 $ (0.38) Loss from discontinued operations (0.18) (0.06)
Net income (loss) $ 1.40 $ (0.44)
(1) Excluded from the computation of diluted earnings per share were 30.7 million and 39.2 million, respectively of awards, options or warrants, for the threemonths ended March 31, 2010 and 2009, respectively, because their inclusion would be antidilutive.
NOTE 11—MORTGAGE SERVICING RIGHTS (MSR) MSRs are recognized at fair value when mortgage loans are sold or securitized in the secondary market and the right to service these loans is retained for a fee.MSRs are recorded at fair value and changes in fair value in current period earnings as a component of mortgage servicing and other income. The Company mayenter into derivatives to economically hedge changes in fair value of MSRs. The Company has no other loss exposure on MSRs in excess of the recorded fairvalue.
The Company continues to operate the mortgage servicing business and to report the changes in the fair value of MSRs in continuing operations. To evaluate andmeasure fair value, the underlying loans are stratified based on certain risk characteristics, including loan type, note rate and investor servicing requirements.
85
(1)
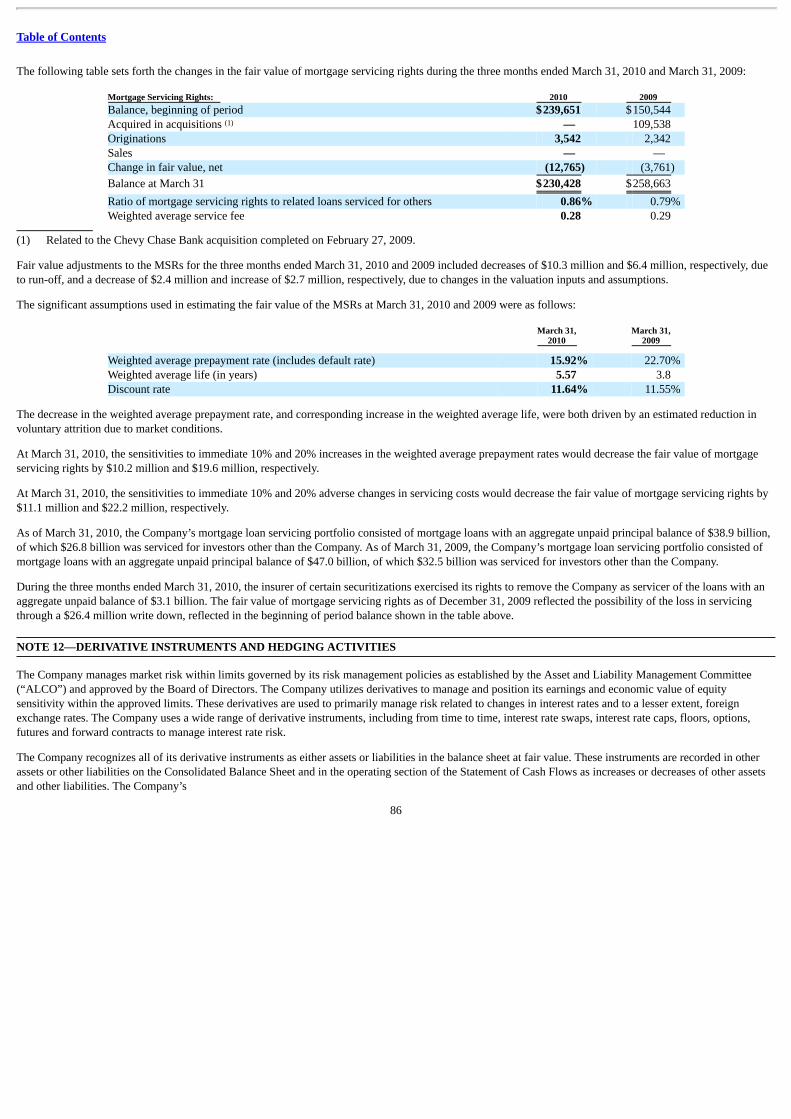
Table of Contents
The following table sets forth the changes in the fair value of mortgage servicing rights during the three months ended March 31, 2010 and March 31, 2009:
Mortgage Servicing Rights: 2010 2009 Balance, beginning of period $239,651 $150,544 Acquired in acquisitions — 109,538 Originations 3,542 2,342 Sales — — Change in fair value, net (12,765) (3,761)
Balance at March 31 $230,428 $258,663
Ratio of mortgage servicing rights to related loans serviced for others 0.86% 0.79% Weighted average service fee 0.28 0.29
(1) Related to the Chevy Chase Bank acquisition completed on February 27, 2009.
Fair value adjustments to the MSRs for the three months ended March 31, 2010 and 2009 included decreases of $10.3 million and $6.4 million, respectively, dueto run-off, and a decrease of $2.4 million and increase of $2.7 million, respectively, due to changes in the valuation inputs and assumptions.
The significant assumptions used in estimating the fair value of the MSRs at March 31, 2010 and 2009 were as follows:
March 31,
2010 March 31,
2009
Weighted average prepayment rate (includes default rate) 15.92% 22.70% Weighted average life (in years) 5.57 3.8 Discount rate 11.64% 11.55%
The decrease in the weighted average prepayment rate, and corresponding increase in the weighted average life, were both driven by an estimated reduction involuntary attrition due to market conditions.
At March 31, 2010, the sensitivities to immediate 10% and 20% increases in the weighted average prepayment rates would decrease the fair value of mortgageservicing rights by $10.2 million and $19.6 million, respectively.
At March 31, 2010, the sensitivities to immediate 10% and 20% adverse changes in servicing costs would decrease the fair value of mortgage servicing rights by$11.1 million and $22.2 million, respectively.
As of March 31, 2010, the Company’s mortgage loan servicing portfolio consisted of mortgage loans with an aggregate unpaid principal balance of $38.9 billion,of which $26.8 billion was serviced for investors other than the Company. As of March 31, 2009, the Company’s mortgage loan servicing portfolio consisted ofmortgage loans with an aggregate unpaid principal balance of $47.0 billion, of which $32.5 billion was serviced for investors other than the Company.
During the three months ended March 31, 2010, the insurer of certain securitizations exercised its rights to remove the Company as servicer of the loans with anaggregate unpaid balance of $3.1 billion. The fair value of mortgage servicing rights as of December 31, 2009 reflected the possibility of the loss in servicingthrough a $26.4 million write down, reflected in the beginning of period balance shown in the table above. NOTE 12—DERIVATIVE INSTRUMENTS AND HEDGING ACTIVITIES The Company manages market risk within limits governed by its risk management policies as established by the Asset and Liability Management Committee(“ALCO”) and approved by the Board of Directors. The Company utilizes derivatives to manage and position its earnings and economic value of equitysensitivity within the approved limits. These derivatives are used to primarily manage risk related to changes in interest rates and to a lesser extent, foreignexchange rates. The Company uses a wide range of derivative instruments, including from time to time, interest rate swaps, interest rate caps, floors, options,futures and forward contracts to manage interest rate risk.
The Company recognizes all of its derivative instruments as either assets or liabilities in the balance sheet at fair value. These instruments are recorded in otherassets or other liabilities on the Consolidated Balance Sheet and in the operating section of the Statement of Cash Flows as increases or decreases of other assetsand other liabilities. The Company’s
86
(1)
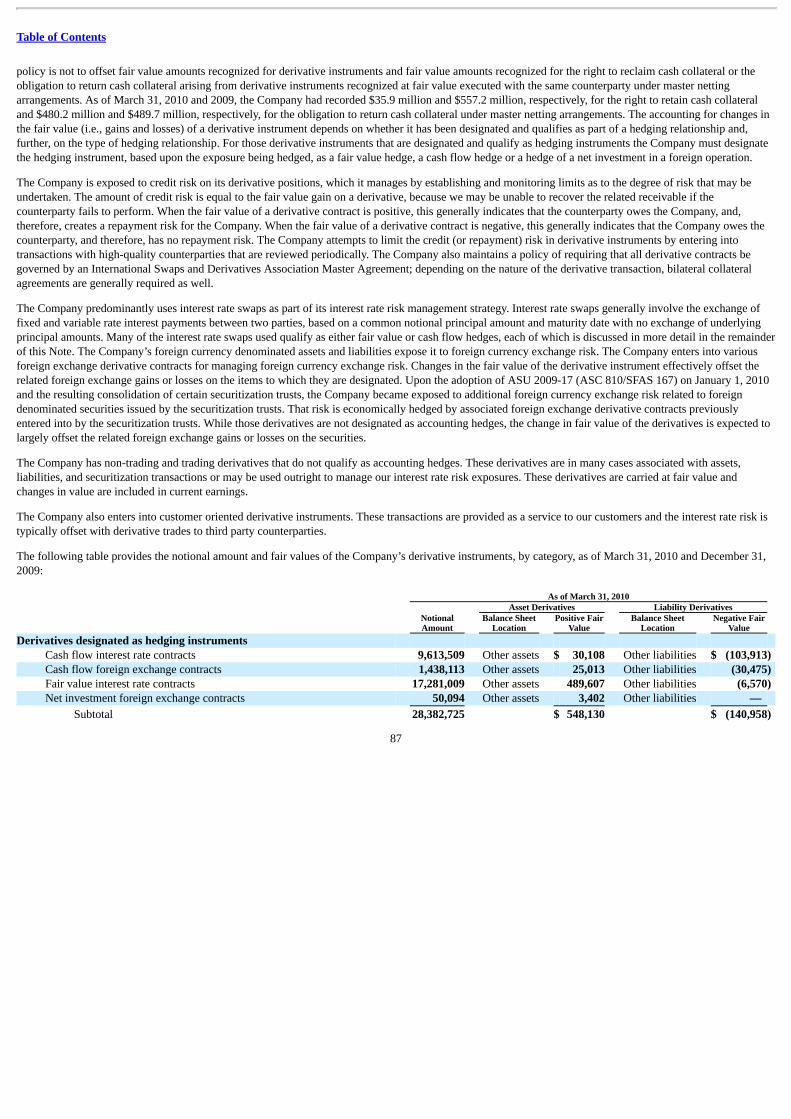
Table of Contents
policy is not to offset fair value amounts recognized for derivative instruments and fair value amounts recognized for the right to reclaim cash collateral or theobligation to return cash collateral arising from derivative instruments recognized at fair value executed with the same counterparty under master nettingarrangements. As of March 31, 2010 and 2009, the Company had recorded $35.9 million and $557.2 million, respectively, for the right to retain cash collateraland $480.2 million and $489.7 million, respectively, for the obligation to return cash collateral under master netting arrangements. The accounting for changes inthe fair value (i.e., gains and losses) of a derivative instrument depends on whether it has been designated and qualifies as part of a hedging relationship and,further, on the type of hedging relationship. For those derivative instruments that are designated and qualify as hedging instruments the Company must designatethe hedging instrument, based upon the exposure being hedged, as a fair value hedge, a cash flow hedge or a hedge of a net investment in a foreign operation.
The Company is exposed to credit risk on its derivative positions, which it manages by establishing and monitoring limits as to the degree of risk that may beundertaken. The amount of credit risk is equal to the fair value gain on a derivative, because we may be unable to recover the related receivable if thecounterparty fails to perform. When the fair value of a derivative contract is positive, this generally indicates that the counterparty owes the Company, and,therefore, creates a repayment risk for the Company. When the fair value of a derivative contract is negative, this generally indicates that the Company owes thecounterparty, and therefore, has no repayment risk. The Company attempts to limit the credit (or repayment) risk in derivative instruments by entering intotransactions with high-quality counterparties that are reviewed periodically. The Company also maintains a policy of requiring that all derivative contracts begoverned by an International Swaps and Derivatives Association Master Agreement; depending on the nature of the derivative transaction, bilateral collateralagreements are generally required as well.
The Company predominantly uses interest rate swaps as part of its interest rate risk management strategy. Interest rate swaps generally involve the exchange offixed and variable rate interest payments between two parties, based on a common notional principal amount and maturity date with no exchange of underlyingprincipal amounts. Many of the interest rate swaps used qualify as either fair value or cash flow hedges, each of which is discussed in more detail in the remainderof this Note. The Company’s foreign currency denominated assets and liabilities expose it to foreign currency exchange risk. The Company enters into variousforeign exchange derivative contracts for managing foreign currency exchange risk. Changes in the fair value of the derivative instrument effectively offset therelated foreign exchange gains or losses on the items to which they are designated. Upon the adoption of ASU 2009-17 (ASC 810/SFAS 167) on January 1, 2010and the resulting consolidation of certain securitization trusts, the Company became exposed to additional foreign currency exchange risk related to foreigndenominated securities issued by the securitization trusts. That risk is economically hedged by associated foreign exchange derivative contracts previouslyentered into by the securitization trusts. While those derivatives are not designated as accounting hedges, the change in fair value of the derivatives is expected tolargely offset the related foreign exchange gains or losses on the securities.
The Company has non-trading and trading derivatives that do not qualify as accounting hedges. These derivatives are in many cases associated with assets,liabilities, and securitization transactions or may be used outright to manage our interest rate risk exposures. These derivatives are carried at fair value andchanges in value are included in current earnings.
The Company also enters into customer oriented derivative instruments. These transactions are provided as a service to our customers and the interest rate risk istypically offset with derivative trades to third party counterparties.
The following table provides the notional amount and fair values of the Company’s derivative instruments, by category, as of March 31, 2010 and December 31,2009: As of March 31, 2010 Asset Derivatives Liability Derivatives
NotionalAmount
Balance SheetLocation
Positive FairValue
Balance SheetLocation
Negative FairValue
Derivatives designated as hedging instruments Cash flow interest rate contracts 9,613,509 Other assets $ 30,108 Other liabilities $ (103,913) Cash flow foreign exchange contracts 1,438,113 Other assets 25,013 Other liabilities (30,475) Fair value interest rate contracts 17,281,009 Other assets 489,607 Other liabilities (6,570) Net investment foreign exchange contracts 50,094 Other assets 3,402 Other liabilities —
Subtotal 28,382,725 $ 548,130 $ (140,958)
87
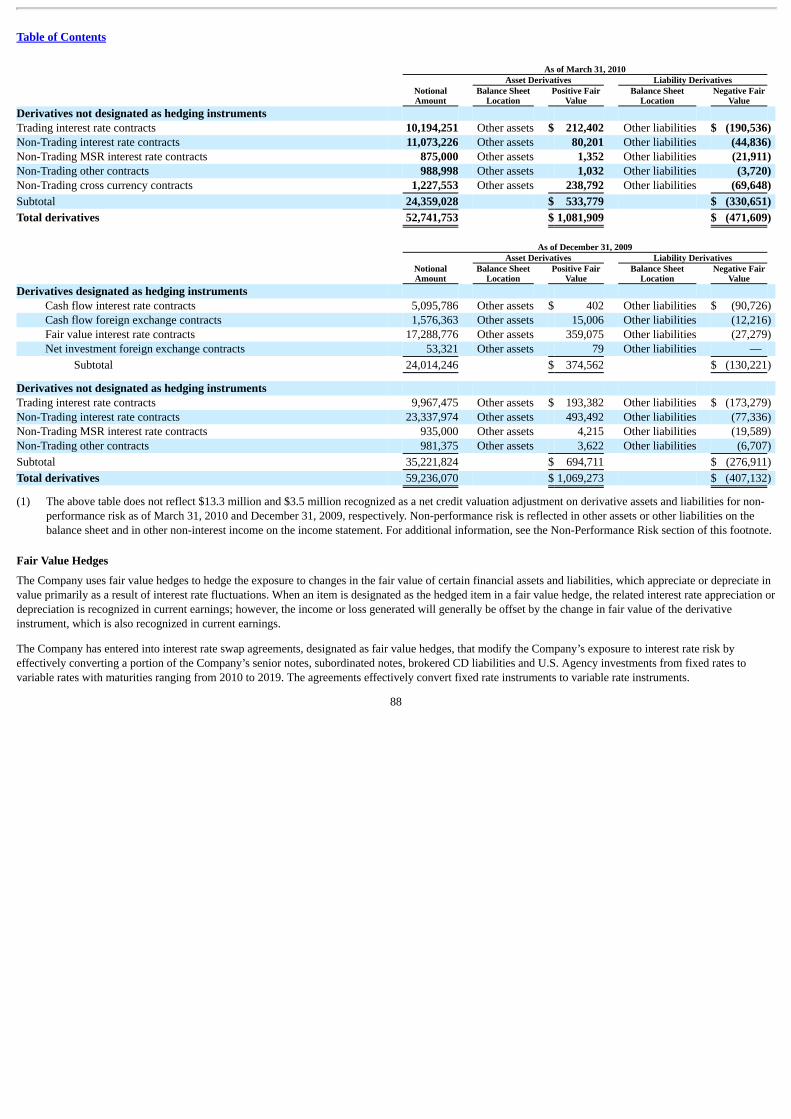
Table of Contents
As of March 31, 2010 Asset Derivatives Liability Derivatives
NotionalAmount
Balance SheetLocation
Positive FairValue
Balance SheetLocation
Negative FairValue
Derivatives not designated as hedging instruments Trading interest rate contracts 10,194,251 Other assets $ 212,402 Other liabilities $ (190,536) Non-Trading interest rate contracts 11,073,226 Other assets 80,201 Other liabilities (44,836) Non-Trading MSR interest rate contracts 875,000 Other assets 1,352 Other liabilities (21,911) Non-Trading other contracts 988,998 Other assets 1,032 Other liabilities (3,720) Non-Trading cross currency contracts 1,227,553 Other assets 238,792 Other liabilities (69,648)
Subtotal 24,359,028 $ 533,779 $ (330,651)
Total derivatives 52,741,753 $ 1,081,909 $ (471,609)
As of December 31, 2009 Asset Derivatives Liability Derivatives
NotionalAmount
Balance SheetLocation
Positive FairValue
Balance SheetLocation
Negative FairValue
Derivatives designated as hedging instruments Cash flow interest rate contracts 5,095,786 Other assets $ 402 Other liabilities $ (90,726) Cash flow foreign exchange contracts 1,576,363 Other assets 15,006 Other liabilities (12,216) Fair value interest rate contracts 17,288,776 Other assets 359,075 Other liabilities (27,279) Net investment foreign exchange contracts 53,321 Other assets 79 Other liabilities —
Subtotal 24,014,246 $ 374,562 $ (130,221)
Derivatives not designated as hedging instruments Trading interest rate contracts 9,967,475 Other assets $ 193,382 Other liabilities $ (173,279) Non-Trading interest rate contracts 23,337,974 Other assets 493,492 Other liabilities (77,336) Non-Trading MSR interest rate contracts 935,000 Other assets 4,215 Other liabilities (19,589) Non-Trading other contracts 981,375 Other assets 3,622 Other liabilities (6,707)
Subtotal 35,221,824 $ 694,711 $ (276,911)
Total derivatives 59,236,070 $ 1,069,273 $ (407,132)
(1) The above table does not reflect $13.3 million and $3.5 million recognized as a net credit valuation adjustment on derivative assets and liabilities for non-performance risk as of March 31, 2010 and December 31, 2009, respectively. Non-performance risk is reflected in other assets or other liabilities on thebalance sheet and in other non-interest income on the income statement. For additional information, see the Non-Performance Risk section of this footnote.
Fair Value Hedges
The Company uses fair value hedges to hedge the exposure to changes in the fair value of certain financial assets and liabilities, which appreciate or depreciate invalue primarily as a result of interest rate fluctuations. When an item is designated as the hedged item in a fair value hedge, the related interest rate appreciation ordepreciation is recognized in current earnings; however, the income or loss generated will generally be offset by the change in fair value of the derivativeinstrument, which is also recognized in current earnings.
The Company has entered into interest rate swap agreements, designated as fair value hedges, that modify the Company’s exposure to interest rate risk byeffectively converting a portion of the Company’s senior notes, subordinated notes, brokered CD liabilities and U.S. Agency investments from fixed rates tovariable rates with maturities ranging from 2010 to 2019. The agreements effectively convert fixed rate instruments to variable rate instruments.
88
Table of Contents
Cash Flow Hedges
The Company uses cash flow hedges to hedge the exposure to variability in the cash flows of a forecasted transaction. Changes in fair value of derivativesdesignated as cash flow hedges are recognized in other comprehensive income, a separate component of stockholders’ equity. The Company has entered intointerest rate swap agreements, designated as cash flow hedges, which effectively modify the Company’s exposure to interest rate risk by converting floating ratedebt to a fixed rate debt with maturities ranging from 2011 to 2017. The agreements involve the receipt of floating rate amounts in exchange for fixed rate interestpayments over the life of the agreements.
The Company has also entered into interest rate swap agreements, designated as cash flow hedges, which effectively modify the Company’s exposure to interestrate risk by converting floating rate assets to fixed rate assets, with maturities in 2013. The agreements involve the receipt of fixed rate amounts in exchange forfloating rate interest payments over the life of the agreements.
The Company has entered into forward exchange contracts to reduce the Company’s sensitivity to foreign currency exchange rate changes on its foreign currencydenominated loans. The forward rate agreements allow the Company to “lock-in” functional currency equivalent cash flows associated with the foreign currencydenominated loans.
At March 31, 2010, the Company expects to reclassify $43.7 million of net losses, after tax, on cash flow foreign exchange and interest rate contracts fromaccumulated other comprehensive income to earnings during the next 12 months as amounts related to terminated swaps are amortized and as interest paymentsand receipts on derivative instruments occur. This amount could change in future periods if the Company decides to terminate additional swaps in the context ofmanaging its overall market risk profile.
Hedge of Net Investment in Foreign Operations
The Company uses forward exchange contracts to protect the value of its investment in its foreign subsidiaries. Realized and unrealized foreign currency gainsand losses from these hedges are not included in the income statement, but are shown in the translation adjustments in other comprehensive income. The purposeof these hedges is to protect against adverse movements in exchange rates.
Trading Interest Rate Contracts
The Company enters into customer-oriented derivative financial instruments, including interest rate swaps, options, caps, floors, and foreign exchange contracts.These customer-oriented positions may be matched with offsetting positions to minimize risk to the Company.
These derivatives do not qualify as accounting hedges and are recorded on the balance sheet at fair value with changes in value included in current earnings innon-interest income.
Non-Trading Interest Rate Contracts
The Company uses interest rate swaps to manage interest rate sensitivity related to the Company’s non-mortgage securitization programs. The Companypreviously entered into interest rate swaps with one of its securitization trusts and essentially offset the derivatives with separate interest rate swaps with thirdparties. Upon consolidation of the trusts on January 1, 2010, the interest rate swap agreements between the Company and the trust are considered intercompanyagreements, with a notional value of approximately 6.5 billion as of December 31, 2009, and any related receivables and payables are eliminated inconsolidation. On December 31, 2009, the interest rate swaps with third parties, with a notional value of approximately 6.5 billion as of December 31, 2009, wereterminated and the net position was replaced with similar agreements at current fixed interest rates. Effective January 1, 2010 the replacement interest rate swapswere designated as cash flow hedges converting floating rate debt of the trust to fixed rate debt.
The Company uses interest rate cap agreements and reciprocal basis swap agreements in conjunction with the securitization of certain payment option mortgageloans. The interest rate cap agreements limit the Company’s exposure to interest rate risk by providing for payments to be made to the Company by third partieswhen the one-month LIBOR rate exceeds the applicable strike rate. These agreements have individual predetermined notional schedules and stated expirationdates, and relate to both currently outstanding and previously called securitization transactions. The reciprocal basis swap agreements are held with externalcounterparties and are structured to mirror the basis swap agreements within securitization programs. The basis swaps in the securitization structures account fortiming and day count differences between the mortgage and bond interest, in addition to uncapping the notes of the senior bondholders in the trust. Whilepayments on the basis swaps and the reciprocal basis swaps may be similar in amounts, the Company is not a party to any of the derivative contracts between thederivative counterparties and the securitization trusts.
89
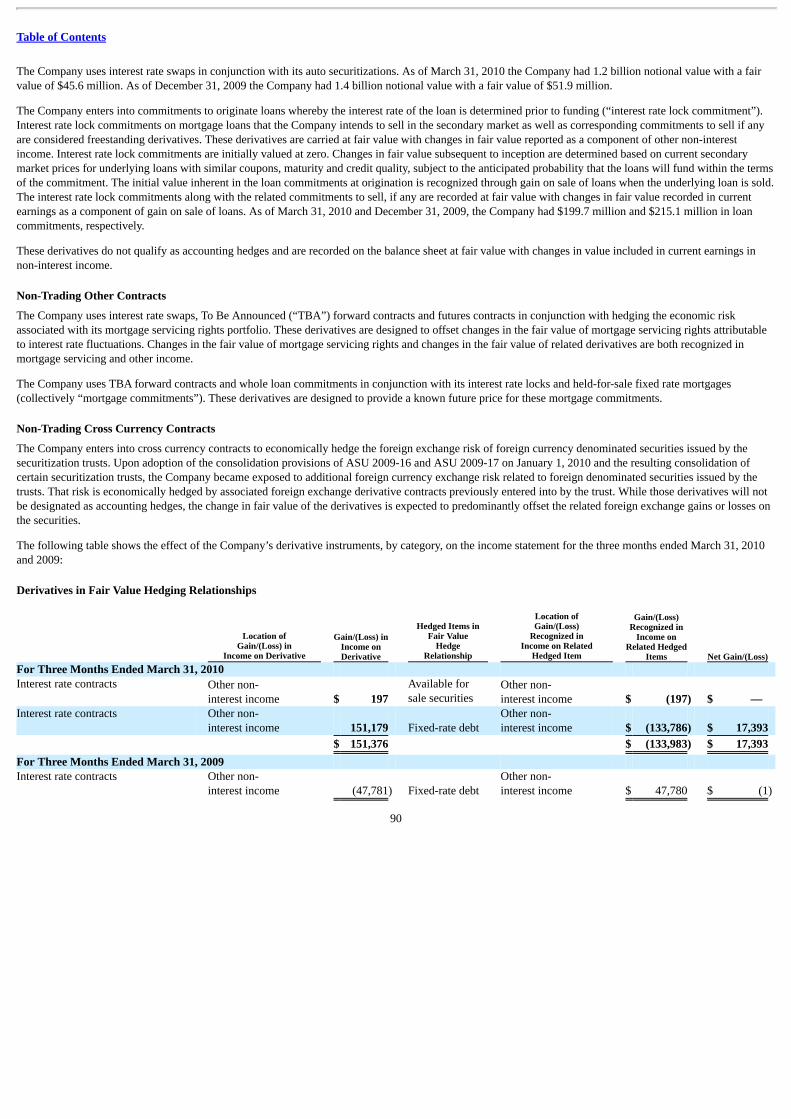
Table of Contents
The Company uses interest rate swaps in conjunction with its auto securitizations. As of March 31, 2010 the Company had 1.2 billion notional value with a fairvalue of $45.6 million. As of December 31, 2009 the Company had 1.4 billion notional value with a fair value of $51.9 million.
The Company enters into commitments to originate loans whereby the interest rate of the loan is determined prior to funding (“interest rate lock commitment”).Interest rate lock commitments on mortgage loans that the Company intends to sell in the secondary market as well as corresponding commitments to sell if anyare considered freestanding derivatives. These derivatives are carried at fair value with changes in fair value reported as a component of other non-interestincome. Interest rate lock commitments are initially valued at zero. Changes in fair value subsequent to inception are determined based on current secondarymarket prices for underlying loans with similar coupons, maturity and credit quality, subject to the anticipated probability that the loans will fund within the termsof the commitment. The initial value inherent in the loan commitments at origination is recognized through gain on sale of loans when the underlying loan is sold.The interest rate lock commitments along with the related commitments to sell, if any are recorded at fair value with changes in fair value recorded in currentearnings as a component of gain on sale of loans. As of March 31, 2010 and December 31, 2009, the Company had $199.7 million and $215.1 million in loancommitments, respectively.
These derivatives do not qualify as accounting hedges and are recorded on the balance sheet at fair value with changes in value included in current earnings innon-interest income.
Non-Trading Other Contracts
The Company uses interest rate swaps, To Be Announced (“TBA”) forward contracts and futures contracts in conjunction with hedging the economic riskassociated with its mortgage servicing rights portfolio. These derivatives are designed to offset changes in the fair value of mortgage servicing rights attributableto interest rate fluctuations. Changes in the fair value of mortgage servicing rights and changes in the fair value of related derivatives are both recognized inmortgage servicing and other income.
The Company uses TBA forward contracts and whole loan commitments in conjunction with its interest rate locks and held-for-sale fixed rate mortgages(collectively “mortgage commitments”). These derivatives are designed to provide a known future price for these mortgage commitments.
Non-Trading Cross Currency Contracts
The Company enters into cross currency contracts to economically hedge the foreign exchange risk of foreign currency denominated securities issued by thesecuritization trusts. Upon adoption of the consolidation provisions of ASU 2009-16 and ASU 2009-17 on January 1, 2010 and the resulting consolidation ofcertain securitization trusts, the Company became exposed to additional foreign currency exchange risk related to foreign denominated securities issued by thetrusts. That risk is economically hedged by associated foreign exchange derivative contracts previously entered into by the trust. While those derivatives will notbe designated as accounting hedges, the change in fair value of the derivatives is expected to predominantly offset the related foreign exchange gains or losses onthe securities.
The following table shows the effect of the Company’s derivative instruments, by category, on the income statement for the three months ended March 31, 2010and 2009:
Derivatives in Fair Value Hedging Relationships
Location ofGain/(Loss) in
Income on Derivative
Gain/(Loss) inIncome onDerivative
Hedged Items inFair Value
HedgeRelationship
Location ofGain/(Loss)
Recognized inIncome on Related
Hedged Item
Gain/(Loss)Recognized in
Income onRelated Hedged
Items Net Gain/(Loss) For Three Months Ended March 31, 2010 Interest rate contracts
Other non-interest income $ 197
Available forsale securities
Other non-interest income $ (197) $ —
Interest rate contracts
Other non-interest income 151,179 Fixed-rate debt
Other non-interest income $ (133,786) $ 17,393
$ 151,376 $ (133,983) $ 17,393
For Three Months Ended March 31, 2009 Interest rate contracts
Other non-interest income (47,781) Fixed-rate debt
Other non-interest income $ 47,780 $ (1)
90
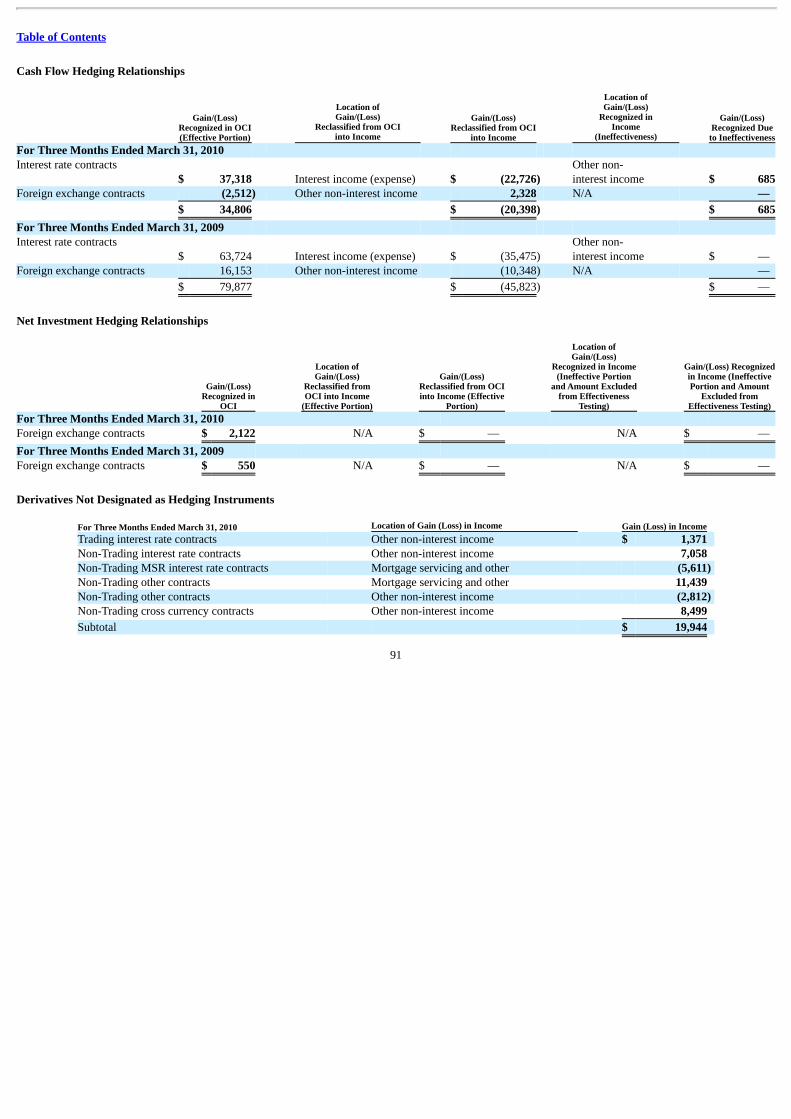
Table of Contents
Cash Flow Hedging Relationships
Gain/(Loss)Recognized in OCI(Effective Portion)
Location ofGain/(Loss)
Reclassified from OCIinto Income
Gain/(Loss)Reclassified from OCI
into Income
Location ofGain/(Loss)
Recognized inIncome
(Ineffectiveness)
Gain/(Loss)Recognized Dueto Ineffectiveness
For Three Months Ended March 31, 2010 Interest rate contracts
$ 37,318 Interest income (expense) $ (22,726) Other non-interest income $ 685
Foreign exchange contracts (2,512) Other non-interest income 2,328 N/A —
$ 34,806 $ (20,398) $ 685
For Three Months Ended March 31, 2009 Interest rate contracts
$ 63,724 Interest income (expense) $ (35,475) Other non-interest income $ —
Foreign exchange contracts 16,153 Other non-interest income (10,348) N/A —
$ 79,877 $ (45,823) $ —
Net Investment Hedging Relationships
Gain/(Loss)Recognized in
OCI
Location ofGain/(Loss)
Reclassified fromOCI into Income
(Effective Portion)
Gain/(Loss)Reclassified from OCIinto Income (Effective
Portion)
Location ofGain/(Loss)
Recognized in Income(Ineffective Portion
and Amount Excludedfrom Effectiveness
Testing)
Gain/(Loss) Recognizedin Income (IneffectivePortion and Amount
Excluded fromEffectiveness Testing)
For Three Months Ended March 31, 2010 Foreign exchange contracts $ 2,122 N/A $ — N/A $ —
For Three Months Ended March 31, 2009 Foreign exchange contracts $ 550 N/A $ — N/A $ —
Derivatives Not Designated as Hedging Instruments
For Three Months Ended March 31, 2010 Location of Gain (Loss) in Income Gain (Loss) in Income Trading interest rate contracts Other non-interest income $ 1,371 Non-Trading interest rate contracts Other non-interest income 7,058 Non-Trading MSR interest rate contracts Mortgage servicing and other (5,611) Non-Trading other contracts Mortgage servicing and other 11,439 Non-Trading other contracts Other non-interest income (2,812) Non-Trading cross currency contracts Other non-interest income 8,499
Subtotal $ 19,944
91
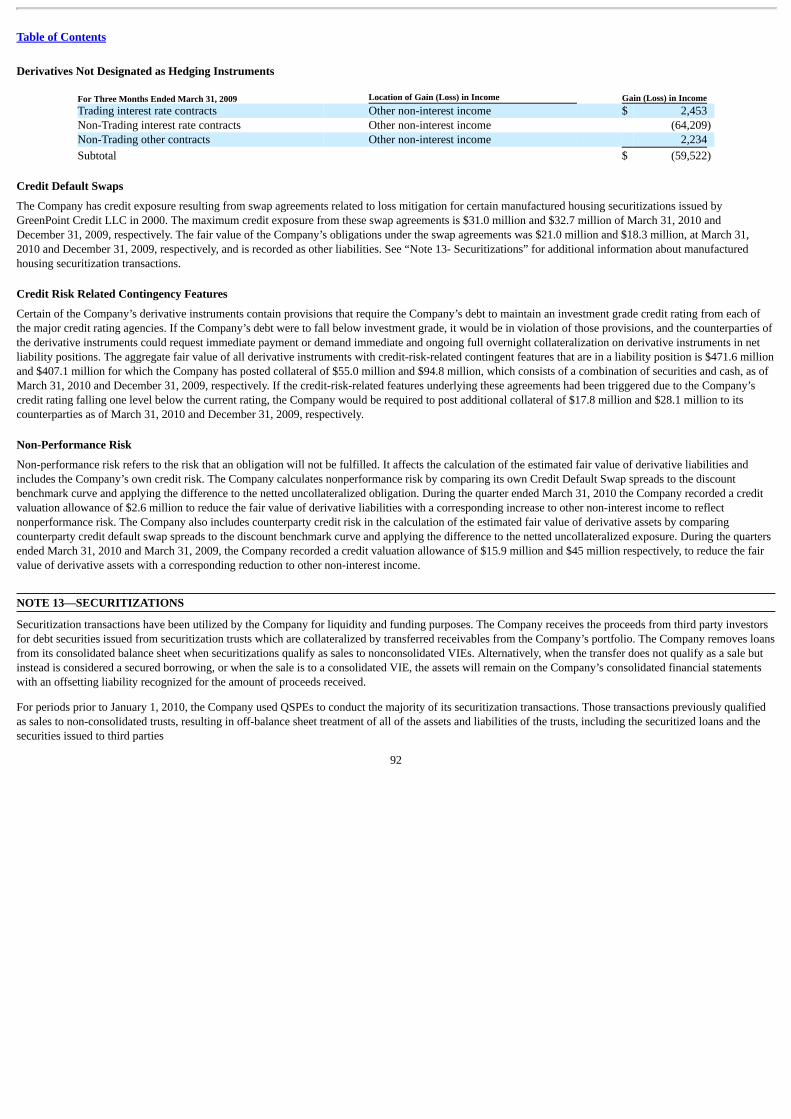
Table of Contents
Derivatives Not Designated as Hedging Instruments
For Three Months Ended March 31, 2009 Location of Gain (Loss) in Income Gain (Loss) in Income Trading interest rate contracts Other non-interest income $ 2,453 Non-Trading interest rate contracts Other non-interest income (64,209) Non-Trading other contracts Other non-interest income 2,234
Subtotal $ (59,522)
Credit Default Swaps
The Company has credit exposure resulting from swap agreements related to loss mitigation for certain manufactured housing securitizations issued byGreenPoint Credit LLC in 2000. The maximum credit exposure from these swap agreements is $31.0 million and $32.7 million of March 31, 2010 andDecember 31, 2009, respectively. The fair value of the Company’s obligations under the swap agreements was $21.0 million and $18.3 million, at March 31,2010 and December 31, 2009, respectively, and is recorded as other liabilities. See “Note 13- Securitizations” for additional information about manufacturedhousing securitization transactions.
Credit Risk Related Contingency Features
Certain of the Company’s derivative instruments contain provisions that require the Company’s debt to maintain an investment grade credit rating from each ofthe major credit rating agencies. If the Company’s debt were to fall below investment grade, it would be in violation of those provisions, and the counterparties ofthe derivative instruments could request immediate payment or demand immediate and ongoing full overnight collateralization on derivative instruments in netliability positions. The aggregate fair value of all derivative instruments with credit-risk-related contingent features that are in a liability position is $471.6 millionand $407.1 million for which the Company has posted collateral of $55.0 million and $94.8 million, which consists of a combination of securities and cash, as ofMarch 31, 2010 and December 31, 2009, respectively. If the credit-risk-related features underlying these agreements had been triggered due to the Company’scredit rating falling one level below the current rating, the Company would be required to post additional collateral of $17.8 million and $28.1 million to itscounterparties as of March 31, 2010 and December 31, 2009, respectively.
Non-Performance Risk
Non-performance risk refers to the risk that an obligation will not be fulfilled. It affects the calculation of the estimated fair value of derivative liabilities andincludes the Company’s own credit risk. The Company calculates nonperformance risk by comparing its own Credit Default Swap spreads to the discountbenchmark curve and applying the difference to the netted uncollateralized obligation. During the quarter ended March 31, 2010 the Company recorded a creditvaluation allowance of $2.6 million to reduce the fair value of derivative liabilities with a corresponding increase to other non-interest income to reflectnonperformance risk. The Company also includes counterparty credit risk in the calculation of the estimated fair value of derivative assets by comparingcounterparty credit default swap spreads to the discount benchmark curve and applying the difference to the netted uncollateralized exposure. During the quartersended March 31, 2010 and March 31, 2009, the Company recorded a credit valuation allowance of $15.9 million and $45 million respectively, to reduce the fairvalue of derivative assets with a corresponding reduction to other non-interest income. NOTE 13—SECURITIZATIONS Securitization transactions have been utilized by the Company for liquidity and funding purposes. The Company receives the proceeds from third party investorsfor debt securities issued from securitization trusts which are collateralized by transferred receivables from the Company’s portfolio. The Company removes loansfrom its consolidated balance sheet when securitizations qualify as sales to nonconsolidated VIEs. Alternatively, when the transfer does not qualify as a sale butinstead is considered a secured borrowing, or when the sale is to a consolidated VIE, the assets will remain on the Company’s consolidated financial statementswith an offsetting liability recognized for the amount of proceeds received.
For periods prior to January 1, 2010, the Company used QSPEs to conduct the majority of its securitization transactions. Those transactions previously qualifiedas sales to non-consolidated trusts, resulting in off-balance sheet treatment of all of the assets and liabilities of the trusts, including the securitized loans and thesecurities issued to third parties
92
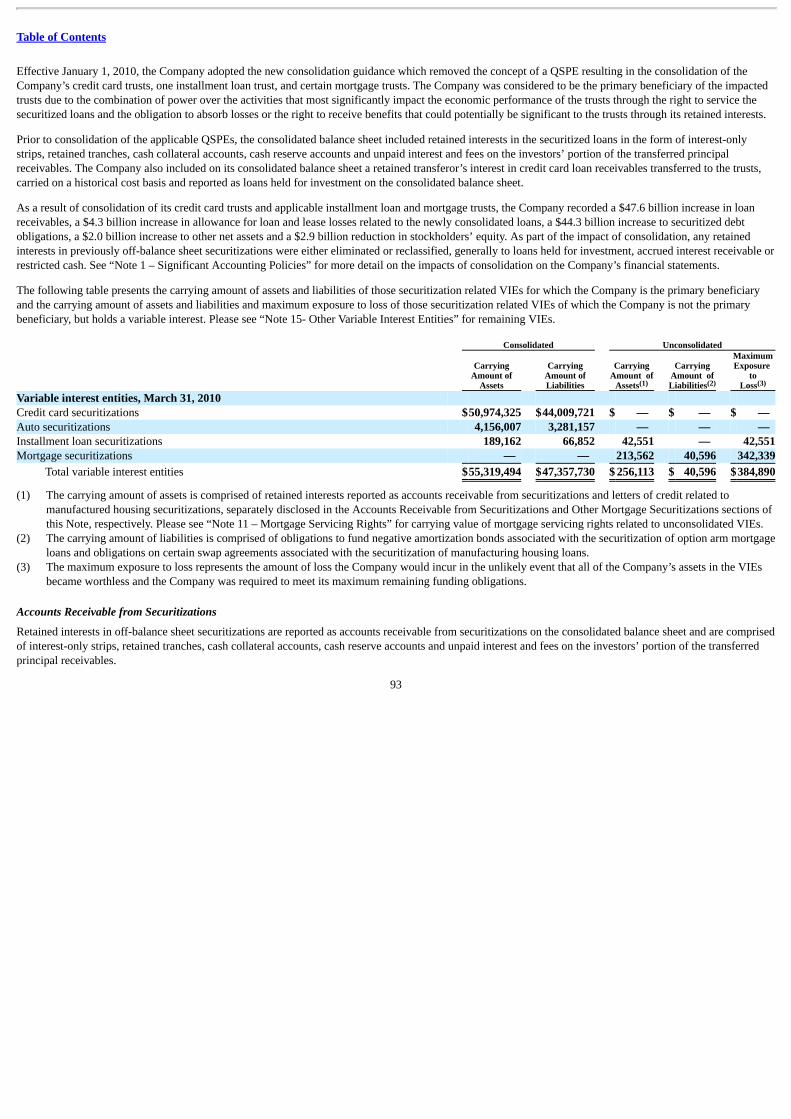
Table of Contents
Effective January 1, 2010, the Company adopted the new consolidation guidance which removed the concept of a QSPE resulting in the consolidation of theCompany’s credit card trusts, one installment loan trust, and certain mortgage trusts. The Company was considered to be the primary beneficiary of the impactedtrusts due to the combination of power over the activities that most significantly impact the economic performance of the trusts through the right to service thesecuritized loans and the obligation to absorb losses or the right to receive benefits that could potentially be significant to the trusts through its retained interests.
Prior to consolidation of the applicable QSPEs, the consolidated balance sheet included retained interests in the securitized loans in the form of interest-onlystrips, retained tranches, cash collateral accounts, cash reserve accounts and unpaid interest and fees on the investors’ portion of the transferred principalreceivables. The Company also included on its consolidated balance sheet a retained transferor’s interest in credit card loan receivables transferred to the trusts,carried on a historical cost basis and reported as loans held for investment on the consolidated balance sheet.
As a result of consolidation of its credit card trusts and applicable installment loan and mortgage trusts, the Company recorded a $47.6 billion increase in loanreceivables, a $4.3 billion increase in allowance for loan and lease losses related to the newly consolidated loans, a $44.3 billion increase to securitized debtobligations, a $2.0 billion increase to other net assets and a $2.9 billion reduction in stockholders’ equity. As part of the impact of consolidation, any retainedinterests in previously off-balance sheet securitizations were either eliminated or reclassified, generally to loans held for investment, accrued interest receivable orrestricted cash. See “Note 1 – Significant Accounting Policies” for more detail on the impacts of consolidation on the Company’s financial statements.
The following table presents the carrying amount of assets and liabilities of those securitization related VIEs for which the Company is the primary beneficiaryand the carrying amount of assets and liabilities and maximum exposure to loss of those securitization related VIEs of which the Company is not the primarybeneficiary, but holds a variable interest. Please see “Note 15- Other Variable Interest Entities” for remaining VIEs. Consolidated Unconsolidated
CarryingAmount of
Assets
CarryingAmount ofLiabilities
CarryingAmount of
Assets
CarryingAmount ofLiabilities
MaximumExposure
toLoss
Variable interest entities, March 31, 2010 Credit card securitizations $50,974,325 $44,009,721 $ — $ — $ — Auto securitizations 4,156,007 3,281,157 — — — Installment loan securitizations 189,162 66,852 42,551 — 42,551Mortgage securitizations — — 213,562 40,596 342,339
Total variable interest entities $55,319,494 $47,357,730 $ 256,113 $ 40,596 $384,890
(1) The carrying amount of assets is comprised of retained interests reported as accounts receivable from securitizations and letters of credit related tomanufactured housing securitizations, separately disclosed in the Accounts Receivable from Securitizations and Other Mortgage Securitizations sections ofthis Note, respectively. Please see “Note 11 – Mortgage Servicing Rights” for carrying value of mortgage servicing rights related to unconsolidated VIEs.
(2) The carrying amount of liabilities is comprised of obligations to fund negative amortization bonds associated with the securitization of option arm mortgageloans and obligations on certain swap agreements associated with the securitization of manufacturing housing loans.
(3) The maximum exposure to loss represents the amount of loss the Company would incur in the unlikely event that all of the Company’s assets in the VIEsbecame worthless and the Company was required to meet its maximum remaining funding obligations.
Accounts Receivable from Securitizations
Retained interests in off-balance sheet securitizations are reported as accounts receivable from securitizations on the consolidated balance sheet and are comprisedof interest-only strips, retained tranches, cash collateral accounts, cash reserve accounts and unpaid interest and fees on the investors’ portion of the transferredprincipal receivables.
93
(1) (2) (3)
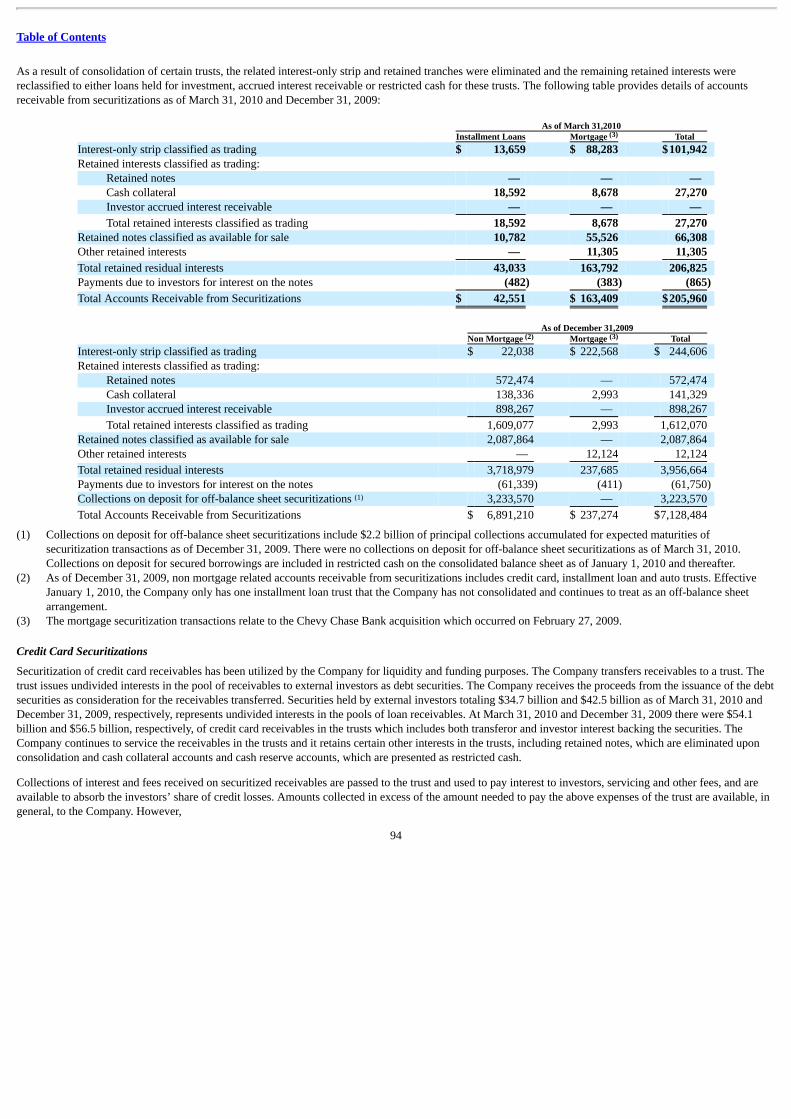
Table of Contents
As a result of consolidation of certain trusts, the related interest-only strip and retained tranches were eliminated and the remaining retained interests werereclassified to either loans held for investment, accrued interest receivable or restricted cash for these trusts. The following table provides details of accountsreceivable from securitizations as of March 31, 2010 and December 31, 2009:
As of March 31,2010 Installment Loans Mortgage Total Interest-only strip classified as trading $ 13,659 $ 88,283 $101,942 Retained interests classified as trading:
Retained notes — — — Cash collateral 18,592 8,678 27,270 Investor accrued interest receivable — — —
Total retained interests classified as trading 18,592 8,678 27,270 Retained notes classified as available for sale 10,782 55,526 66,308 Other retained interests — 11,305 11,305
Total retained residual interests 43,033 163,792 206,825 Payments due to investors for interest on the notes (482) (383) (865)
Total Accounts Receivable from Securitizations $ 42,551 $ 163,409 $205,960
As of December 31,2009 Non Mortgage Mortgage Total Interest-only strip classified as trading $ 22,038 $ 222,568 $ 244,606 Retained interests classified as trading:
Retained notes 572,474 — 572,474 Cash collateral 138,336 2,993 141,329 Investor accrued interest receivable 898,267 — 898,267
Total retained interests classified as trading 1,609,077 2,993 1,612,070 Retained notes classified as available for sale 2,087,864 — 2,087,864 Other retained interests — 12,124 12,124
Total retained residual interests 3,718,979 237,685 3,956,664 Payments due to investors for interest on the notes (61,339) (411) (61,750) Collections on deposit for off-balance sheet securitizations 3,233,570 — 3,223,570
Total Accounts Receivable from Securitizations $ 6,891,210 $ 237,274 $7,128,484
(1) Collections on deposit for off-balance sheet securitizations include $2.2 billion of principal collections accumulated for expected maturities ofsecuritization transactions as of December 31, 2009. There were no collections on deposit for off-balance sheet securitizations as of March 31, 2010.Collections on deposit for secured borrowings are included in restricted cash on the consolidated balance sheet as of January 1, 2010 and thereafter.
(2) As of December 31, 2009, non mortgage related accounts receivable from securitizations includes credit card, installment loan and auto trusts. EffectiveJanuary 1, 2010, the Company only has one installment loan trust that the Company has not consolidated and continues to treat as an off-balance sheetarrangement.
(3) The mortgage securitization transactions relate to the Chevy Chase Bank acquisition which occurred on February 27, 2009.
Credit Card Securitizations
Securitization of credit card receivables has been utilized by the Company for liquidity and funding purposes. The Company transfers receivables to a trust. Thetrust issues undivided interests in the pool of receivables to external investors as debt securities. The Company receives the proceeds from the issuance of the debtsecurities as consideration for the receivables transferred. Securities held by external investors totaling $34.7 billion and $42.5 billion as of March 31, 2010 andDecember 31, 2009, respectively, represents undivided interests in the pools of loan receivables. At March 31, 2010 and December 31, 2009 there were $54.1billion and $56.5 billion, respectively, of credit card receivables in the trusts which includes both transferor and investor interest backing the securities. TheCompany continues to service the receivables in the trusts and it retains certain other interests in the trusts, including retained notes, which are eliminated uponconsolidation and cash collateral accounts and cash reserve accounts, which are presented as restricted cash.
Collections of interest and fees received on securitized receivables are passed to the trust and used to pay interest to investors, servicing and other fees, and areavailable to absorb the investors’ share of credit losses. Amounts collected in excess of the amount needed to pay the above expenses of the trust are available, ingeneral, to the Company. However,
94
(3)
(2) (3)
(1)
Table of Contents
under certain conditions, a portion of the cash collected is required to be maintained in restricted accounts (spread accounts) to ensure future payments toinvestors. For the credit card trusts, the amount of cash held in spread accounts increased from $273.0 million as of March 31, 2009 to $359.4 million as ofMarch 31, 2010. Collections of principal are generally reinvested in the purchase of new principal loan receivables (“revolving securitization”). Also, principalcollections are remitted to the trust to pay down the debt securities when the securitization transaction is scheduled to mature. Types of credit enhancementsinclude subordinated notes and spread account and reserve account balances. No other assets of the Company are available to pay interest and principal on thesecurities. Furthermore, the trusts have no recourse to the general credit of the Company. The Company has not provided any financial or other support to thetrusts during the periods presented that it was not previously contractually required to provide.
Securitization transactions may amortize earlier than scheduled due to certain early amortization events that are generally triggered due to loan performance. Inaddition, early amortization could cause the Company to lose the ability to securitize similar receivables in the future at desirable rates. While spread accountfunding triggers for some trusts have been reached, a performance related early amortization event is not triggered for the majority of the card trusts until thethree month average excess spread is less than 0%. Three month average excess spread for the credit card trusts ranged from 5.9% to 9.2% as of March 31, 2010.No early amortization events related to the Company’s credit card securitizations have occurred to date.
Upon the adoption of the new accounting consolidation guidance at January 1, 2010, the Company consolidated the trusts used for the securitization of credit cardreceivables because it is considered to have a controlling financial interest in the trusts and thus, is their primary beneficiary. The trusts previously qualified asQSPEs and as a result were exempt from the consolidation provisions of ASC 860-10. The Company is considered the primary beneficiary of its credit card trustsbecause it has both the power, through its servicing of the receivables within the trusts, to direct the activities that most significantly impact the trusts’ economicperformance and the rights to receive benefits from the trusts or the obligation to absorb losses of the trusts that could potentially be significant to the trusts. Therights to receive potentially significant benefits are held within the Company’s retained interest-only strip and other retained interests. Also, depending on theperformance of the trusts, the obligations to absorb potentially significant losses are held within its retained subordinate tranches and other retained interests.
Installment Loan Securitizations
The Company is currently involved in two amortizing installment loan securitization programs, one of which was consolidated as of January 1, 2010 upon theadoption of the consolidation provisions of the new accounting consolidation guidance. The Company is considered the primary beneficiary of the consolidatedinstallment loan trust because it has both the power, through its servicing of the loans within the trust, to direct the activities that most significantly impact thetrust’s economic performance and the rights to receive benefits from the trust or the obligation to absorb losses of the trust that could potentially be significant tothe trust. The rights to potentially significant benefits are held within the Company’s retained interest-only strip and other retained interests. Also, depending onthe performance of the trusts, the obligations to absorb potentially significant losses are held within its retained subordinate tranches and other retained interests.The installment loans and related debt securities that remain off-balance sheet were transferred to a multi-seller conduit that holds loans significantly in excess ofthe loans transferred by the Company and that has issued debt securities significantly in excess of the securities backed by the installment loans transferred by theCompany. The Company is not considered to be the primary beneficiary of the non-consolidated installment loan program because it is not considered to haveeither the power to direct the activities that most significantly impact the overall program’s economic performance or the rights to receive benefits from theprogram or the obligation to absorb losses of the program that could potentially be significant to the program.
Consolidation of the impacted installment loan trust resulted in an increase to loans held for investment of $209.2 million, an increase to the allowance for loanlosses of $19.0 million, an increase to other borrowings of $87.8 million, a decrease to other net assets of $104.8 million, and a reduction in stockholders’ equityof $2.4 million.
The installment loan securitization program that remains off-balance has outstanding loans of $150.8 million and outstanding securities to external investors of$127.4 million at March 31, 2010. The program breached an amortization trigger within the first quarter of 2009, due to the performance of the loans within theprogram. The impact of breaching the amortization trigger resulted in the program moving from a pro rata amortization to a sequential amortization, which meansthat the Company is no longer receiving pro rata cash allocations on the retained subordinated tranches that it holds. The Company has no requirements to providethe program with additional funding or to transfer additional receivables. As of March 31, 2010, the balance of the cash reserve account was $20.6 million and theCompany holds a retained subordinated note with a face amount of $12.0 million. The cash reserve account is carried at a fair value of $18.6 million as ofMarch 31, 2010 with total fair value adjustments of $2.0 million recorded in earnings. The retained subordinated note is carried at a fair value of $10.8 million asof March 31, 2010 with total fair value adjustments of $1.2 million recorded in other comprehensive income. The aggregate fair value of the cash reserve accountand the retained
95
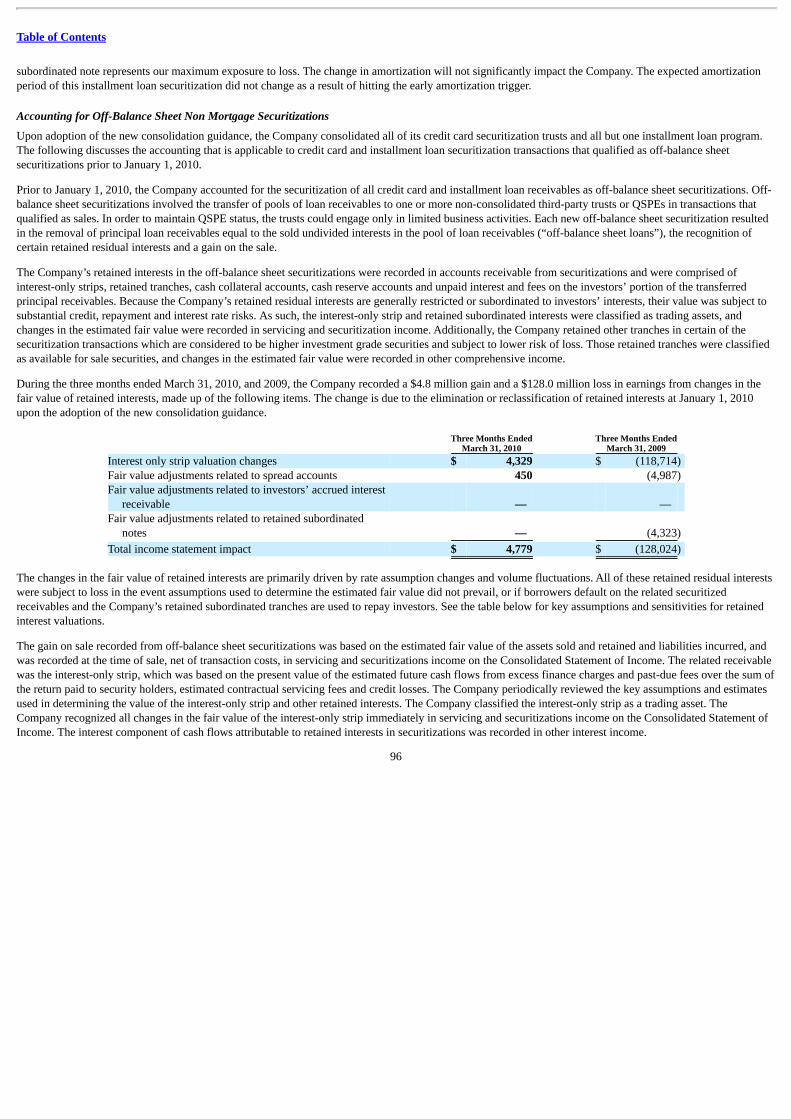
Table of Contents
subordinated note represents our maximum exposure to loss. The change in amortization will not significantly impact the Company. The expected amortizationperiod of this installment loan securitization did not change as a result of hitting the early amortization trigger.
Accounting for Off-Balance Sheet Non Mortgage Securitizations
Upon adoption of the new consolidation guidance, the Company consolidated all of its credit card securitization trusts and all but one installment loan program.The following discusses the accounting that is applicable to credit card and installment loan securitization transactions that qualified as off-balance sheetsecuritizations prior to January 1, 2010.
Prior to January 1, 2010, the Company accounted for the securitization of all credit card and installment loan receivables as off-balance sheet securitizations. Off-balance sheet securitizations involved the transfer of pools of loan receivables to one or more non-consolidated third-party trusts or QSPEs in transactions thatqualified as sales. In order to maintain QSPE status, the trusts could engage only in limited business activities. Each new off-balance sheet securitization resultedin the removal of principal loan receivables equal to the sold undivided interests in the pool of loan receivables (“off-balance sheet loans”), the recognition ofcertain retained residual interests and a gain on the sale.
The Company’s retained interests in the off-balance sheet securitizations were recorded in accounts receivable from securitizations and were comprised ofinterest-only strips, retained tranches, cash collateral accounts, cash reserve accounts and unpaid interest and fees on the investors’ portion of the transferredprincipal receivables. Because the Company’s retained residual interests are generally restricted or subordinated to investors’ interests, their value was subject tosubstantial credit, repayment and interest rate risks. As such, the interest-only strip and retained subordinated interests were classified as trading assets, andchanges in the estimated fair value were recorded in servicing and securitization income. Additionally, the Company retained other tranches in certain of thesecuritization transactions which are considered to be higher investment grade securities and subject to lower risk of loss. Those retained tranches were classifiedas available for sale securities, and changes in the estimated fair value were recorded in other comprehensive income.
During the three months ended March 31, 2010, and 2009, the Company recorded a $4.8 million gain and a $128.0 million loss in earnings from changes in thefair value of retained interests, made up of the following items. The change is due to the elimination or reclassification of retained interests at January 1, 2010upon the adoption of the new consolidation guidance.
Three Months Ended
March 31, 2010 Three Months Ended
March 31, 2009 Interest only strip valuation changes $ 4,329 $ (118,714) Fair value adjustments related to spread accounts 450 (4,987) Fair value adjustments related to investors’ accrued interest
receivable — — Fair value adjustments related to retained subordinated
notes — (4,323)
Total income statement impact $ 4,779 $ (128,024)
The changes in the fair value of retained interests are primarily driven by rate assumption changes and volume fluctuations. All of these retained residual interestswere subject to loss in the event assumptions used to determine the estimated fair value did not prevail, or if borrowers default on the related securitizedreceivables and the Company’s retained subordinated tranches are used to repay investors. See the table below for key assumptions and sensitivities for retainedinterest valuations.
The gain on sale recorded from off-balance sheet securitizations was based on the estimated fair value of the assets sold and retained and liabilities incurred, andwas recorded at the time of sale, net of transaction costs, in servicing and securitizations income on the Consolidated Statement of Income. The related receivablewas the interest-only strip, which was based on the present value of the estimated future cash flows from excess finance charges and past-due fees over the sum ofthe return paid to security holders, estimated contractual servicing fees and credit losses. The Company periodically reviewed the key assumptions and estimatesused in determining the value of the interest-only strip and other retained interests. The Company classified the interest-only strip as a trading asset. TheCompany recognized all changes in the fair value of the interest-only strip immediately in servicing and securitizations income on the Consolidated Statement ofIncome. The interest component of cash flows attributable to retained interests in securitizations was recorded in other interest income.
96
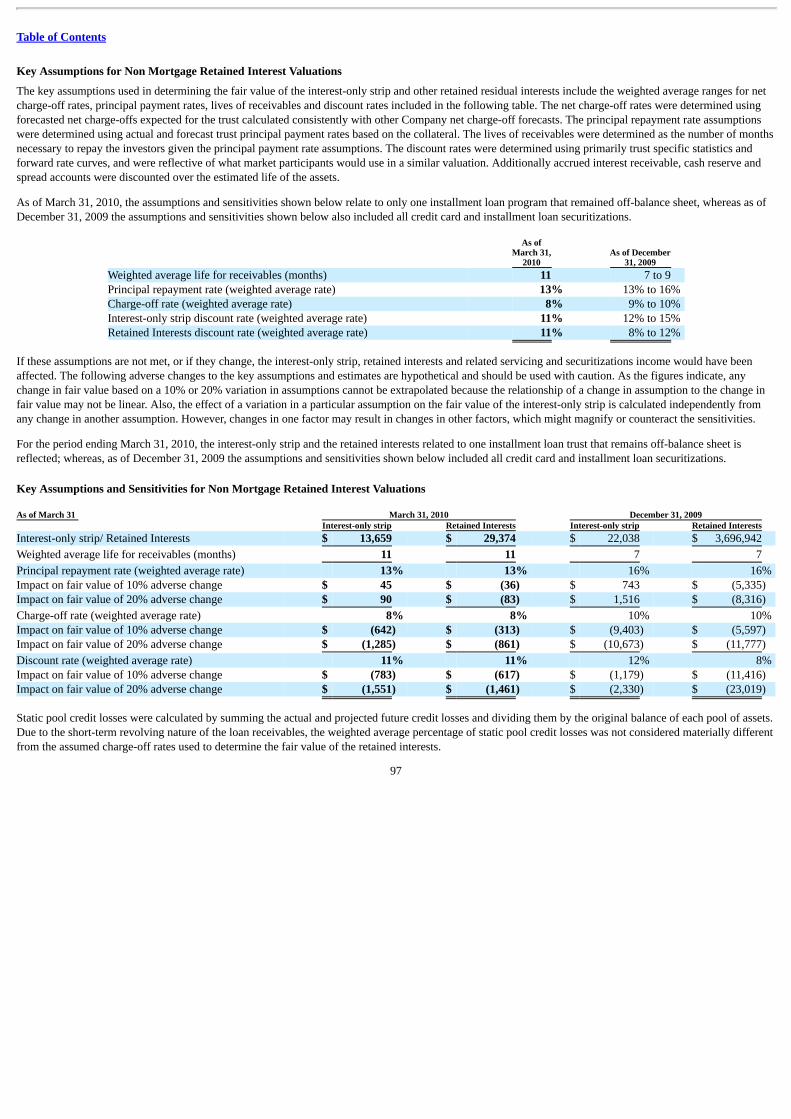
Table of Contents
Key Assumptions for Non Mortgage Retained Interest Valuations
The key assumptions used in determining the fair value of the interest-only strip and other retained residual interests include the weighted average ranges for netcharge-off rates, principal payment rates, lives of receivables and discount rates included in the following table. The net charge-off rates were determined usingforecasted net charge-offs expected for the trust calculated consistently with other Company net charge-off forecasts. The principal repayment rate assumptionswere determined using actual and forecast trust principal payment rates based on the collateral. The lives of receivables were determined as the number of monthsnecessary to repay the investors given the principal payment rate assumptions. The discount rates were determined using primarily trust specific statistics andforward rate curves, and were reflective of what market participants would use in a similar valuation. Additionally accrued interest receivable, cash reserve andspread accounts were discounted over the estimated life of the assets.
As of March 31, 2010, the assumptions and sensitivities shown below relate to only one installment loan program that remained off-balance sheet, whereas as ofDecember 31, 2009 the assumptions and sensitivities shown below also included all credit card and installment loan securitizations.
As ofMarch 31,
2010 As of December
31, 2009 Weighted average life for receivables (months) 11 7 to 9 Principal repayment rate (weighted average rate) 13% 13% to 16% Charge-off rate (weighted average rate) 8% 9% to 10% Interest-only strip discount rate (weighted average rate) 11% 12% to 15% Retained Interests discount rate (weighted average rate) 11% 8% to 12%
If these assumptions are not met, or if they change, the interest-only strip, retained interests and related servicing and securitizations income would have beenaffected. The following adverse changes to the key assumptions and estimates are hypothetical and should be used with caution. As the figures indicate, anychange in fair value based on a 10% or 20% variation in assumptions cannot be extrapolated because the relationship of a change in assumption to the change infair value may not be linear. Also, the effect of a variation in a particular assumption on the fair value of the interest-only strip is calculated independently fromany change in another assumption. However, changes in one factor may result in changes in other factors, which might magnify or counteract the sensitivities.
For the period ending March 31, 2010, the interest-only strip and the retained interests related to one installment loan trust that remains off-balance sheet isreflected; whereas, as of December 31, 2009 the assumptions and sensitivities shown below included all credit card and installment loan securitizations.
Key Assumptions and Sensitivities for Non Mortgage Retained Interest Valuations As of March 31 March 31, 2010 December 31, 2009 Interest-only strip Retained Interests Interest-only strip Retained Interests Interest-only strip/ Retained Interests $ 13,659 $ 29,374 $ 22,038 $ 3,696,942
Weighted average life for receivables (months) 11 11 7 7
Principal repayment rate (weighted average rate) 13% 13% 16% 16% Impact on fair value of 10% adverse change $ 45 $ (36) $ 743 $ (5,335) Impact on fair value of 20% adverse change $ 90 $ (83) $ 1,516 $ (8,316)
Charge-off rate (weighted average rate) 8% 8% 10% 10% Impact on fair value of 10% adverse change $ (642) $ (313) $ (9,403) $ (5,597) Impact on fair value of 20% adverse change $ (1,285) $ (861) $ (10,673) $ (11,777)
Discount rate (weighted average rate) 11% 11% 12% 8% Impact on fair value of 10% adverse change $ (783) $ (617) $ (1,179) $ (11,416) Impact on fair value of 20% adverse change $ (1,551) $ (1,461) $ (2,330) $ (23,019)
Static pool credit losses were calculated by summing the actual and projected future credit losses and dividing them by the original balance of each pool of assets.Due to the short-term revolving nature of the loan receivables, the weighted average percentage of static pool credit losses was not considered materially differentfrom the assumed charge-off rates used to determine the fair value of the retained interests.
97
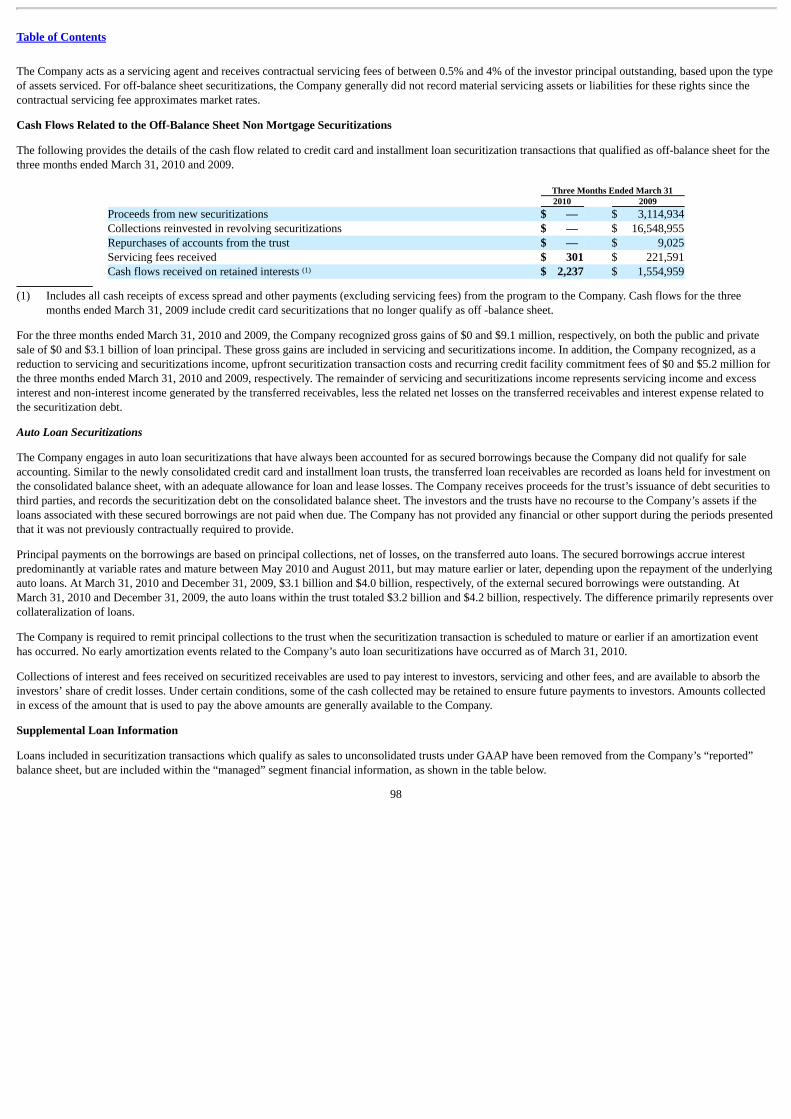
Table of Contents
The Company acts as a servicing agent and receives contractual servicing fees of between 0.5% and 4% of the investor principal outstanding, based upon the typeof assets serviced. For off-balance sheet securitizations, the Company generally did not record material servicing assets or liabilities for these rights since thecontractual servicing fee approximates market rates.
Cash Flows Related to the Off-Balance Sheet Non Mortgage Securitizations
The following provides the details of the cash flow related to credit card and installment loan securitization transactions that qualified as off-balance sheet for thethree months ended March 31, 2010 and 2009.
Three Months Ended March 31 2010 2009 Proceeds from new securitizations $ — $ 3,114,934Collections reinvested in revolving securitizations $ — $ 16,548,955Repurchases of accounts from the trust $ — $ 9,025Servicing fees received $ 301 $ 221,591Cash flows received on retained interests $ 2,237 $ 1,554,959
(1) Includes all cash receipts of excess spread and other payments (excluding servicing fees) from the program to the Company. Cash flows for the three
months ended March 31, 2009 include credit card securitizations that no longer qualify as off -balance sheet.
For the three months ended March 31, 2010 and 2009, the Company recognized gross gains of $0 and $9.1 million, respectively, on both the public and privatesale of $0 and $3.1 billion of loan principal. These gross gains are included in servicing and securitizations income. In addition, the Company recognized, as areduction to servicing and securitizations income, upfront securitization transaction costs and recurring credit facility commitment fees of $0 and $5.2 million forthe three months ended March 31, 2010 and 2009, respectively. The remainder of servicing and securitizations income represents servicing income and excessinterest and non-interest income generated by the transferred receivables, less the related net losses on the transferred receivables and interest expense related tothe securitization debt.
Auto Loan Securitizations
The Company engages in auto loan securitizations that have always been accounted for as secured borrowings because the Company did not qualify for saleaccounting. Similar to the newly consolidated credit card and installment loan trusts, the transferred loan receivables are recorded as loans held for investment onthe consolidated balance sheet, with an adequate allowance for loan and lease losses. The Company receives proceeds for the trust’s issuance of debt securities tothird parties, and records the securitization debt on the consolidated balance sheet. The investors and the trusts have no recourse to the Company’s assets if theloans associated with these secured borrowings are not paid when due. The Company has not provided any financial or other support during the periods presentedthat it was not previously contractually required to provide.
Principal payments on the borrowings are based on principal collections, net of losses, on the transferred auto loans. The secured borrowings accrue interestpredominantly at variable rates and mature between May 2010 and August 2011, but may mature earlier or later, depending upon the repayment of the underlyingauto loans. At March 31, 2010 and December 31, 2009, $3.1 billion and $4.0 billion, respectively, of the external secured borrowings were outstanding. AtMarch 31, 2010 and December 31, 2009, the auto loans within the trust totaled $3.2 billion and $4.2 billion, respectively. The difference primarily represents overcollateralization of loans.
The Company is required to remit principal collections to the trust when the securitization transaction is scheduled to mature or earlier if an amortization eventhas occurred. No early amortization events related to the Company’s auto loan securitizations have occurred as of March 31, 2010.
Collections of interest and fees received on securitized receivables are used to pay interest to investors, servicing and other fees, and are available to absorb theinvestors’ share of credit losses. Under certain conditions, some of the cash collected may be retained to ensure future payments to investors. Amounts collectedin excess of the amount that is used to pay the above amounts are generally available to the Company.
Supplemental Loan Information
Loans included in securitization transactions which qualify as sales to unconsolidated trusts under GAAP have been removed from the Company’s “reported”balance sheet, but are included within the “managed” segment financial information, as shown in the table below.
98
(1)
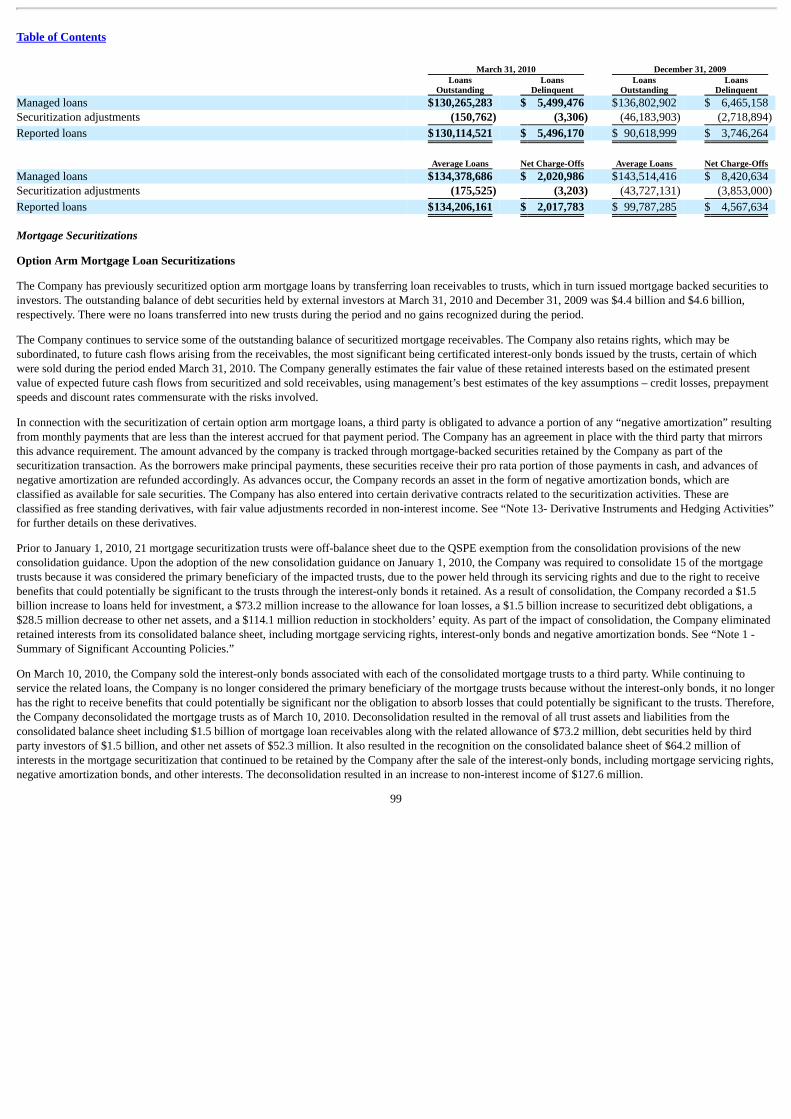
Table of Contents
March 31, 2010 December 31, 2009
Loans
Outstanding Loans
Delinquent Loans
Outstanding Loans
Delinquent Managed loans $130,265,283 $ 5,499,476 $136,802,902 $ 6,465,158 Securitization adjustments (150,762) (3,306) (46,183,903) (2,718,894)
Reported loans $130,114,521 $ 5,496,170 $ 90,618,999 $ 3,746,264
Average Loans Net Charge-Offs Average Loans Net Charge-Offs Managed loans $134,378,686 $ 2,020,986 $143,514,416 $ 8,420,634 Securitization adjustments (175,525) (3,203) (43,727,131) (3,853,000)
Reported loans $134,206,161 $ 2,017,783 $ 99,787,285 $ 4,567,634
Mortgage Securitizations
Option Arm Mortgage Loan Securitizations
The Company has previously securitized option arm mortgage loans by transferring loan receivables to trusts, which in turn issued mortgage backed securities toinvestors. The outstanding balance of debt securities held by external investors at March 31, 2010 and December 31, 2009 was $4.4 billion and $4.6 billion,respectively. There were no loans transferred into new trusts during the period and no gains recognized during the period.
The Company continues to service some of the outstanding balance of securitized mortgage receivables. The Company also retains rights, which may besubordinated, to future cash flows arising from the receivables, the most significant being certificated interest-only bonds issued by the trusts, certain of whichwere sold during the period ended March 31, 2010. The Company generally estimates the fair value of these retained interests based on the estimated presentvalue of expected future cash flows from securitized and sold receivables, using management’s best estimates of the key assumptions – credit losses, prepaymentspeeds and discount rates commensurate with the risks involved.
In connection with the securitization of certain option arm mortgage loans, a third party is obligated to advance a portion of any “negative amortization” resultingfrom monthly payments that are less than the interest accrued for that payment period. The Company has an agreement in place with the third party that mirrorsthis advance requirement. The amount advanced by the company is tracked through mortgage-backed securities retained by the Company as part of thesecuritization transaction. As the borrowers make principal payments, these securities receive their pro rata portion of those payments in cash, and advances ofnegative amortization are refunded accordingly. As advances occur, the Company records an asset in the form of negative amortization bonds, which areclassified as available for sale securities. The Company has also entered into certain derivative contracts related to the securitization activities. These areclassified as free standing derivatives, with fair value adjustments recorded in non-interest income. See “Note 13- Derivative Instruments and Hedging Activities”for further details on these derivatives.
Prior to January 1, 2010, 21 mortgage securitization trusts were off-balance sheet due to the QSPE exemption from the consolidation provisions of the newconsolidation guidance. Upon the adoption of the new consolidation guidance on January 1, 2010, the Company was required to consolidate 15 of the mortgagetrusts because it was considered the primary beneficiary of the impacted trusts, due to the power held through its servicing rights and due to the right to receivebenefits that could potentially be significant to the trusts through the interest-only bonds it retained. As a result of consolidation, the Company recorded a $1.5billion increase to loans held for investment, a $73.2 million increase to the allowance for loan losses, a $1.5 billion increase to securitized debt obligations, a$28.5 million decrease to other net assets, and a $114.1 million reduction in stockholders’ equity. As part of the impact of consolidation, the Company eliminatedretained interests from its consolidated balance sheet, including mortgage servicing rights, interest-only bonds and negative amortization bonds. See “Note 1 -Summary of Significant Accounting Policies.”
On March 10, 2010, the Company sold the interest-only bonds associated with each of the consolidated mortgage trusts to a third party. While continuing toservice the related loans, the Company is no longer considered the primary beneficiary of the mortgage trusts because without the interest-only bonds, it no longerhas the right to receive benefits that could potentially be significant nor the obligation to absorb losses that could potentially be significant to the trusts. Therefore,the Company deconsolidated the mortgage trusts as of March 10, 2010. Deconsolidation resulted in the removal of all trust assets and liabilities from theconsolidated balance sheet including $1.5 billion of mortgage loan receivables along with the related allowance of $73.2 million, debt securities held by thirdparty investors of $1.5 billion, and other net assets of $52.3 million. It also resulted in the recognition on the consolidated balance sheet of $64.2 million ofinterests in the mortgage securitization that continued to be retained by the Company after the sale of the interest-only bonds, including mortgage servicing rights,negative amortization bonds, and other interests. The deconsolidation resulted in an increase to non-interest income of $127.6 million.
99
Table of Contents
The remaining mortgage trusts with $3.0 billion of outstanding mortgage loans and $3.1 billion of securities issued to third parties were not consolidated becausethe Company is no longer servicing the mortgage loans and is not considered to be the primary beneficiary of the mortgage trusts. These trusts were notconsolidated upon initial adoption because the insurer of the mortgage securitization gave notice of its intent to remove Capital One as the servicer of the loansprior to the adoption of the new consolidation standards and formally exercised that right during the first quarter of 2010. In conjunction with the initialnotification, the Company reduced the value of mortgage servicing rights by $26.4 million for these trusts in the fourth quarter of 2009.
Key Assumptions and Sensitivities for Mortgage Retained Interest Valuations
Servicing, securitization and mortgage servicing and other includes the initial gains on current securitization and sale transactions and income from interest-onlystrips recognized in connection with current and prior period securitization and sale transactions.
As of March 31, 2010 and December 31, 2009, the key assumptions and the sensitivity of the current fair value of the retained interests to an immediate 10percent and 20 percent adverse change in those assumptions are as follows:
As of March 31, 2010
As of December 31, 2009
Interest-only strip/Retained Interests $ 152,587 $ 225,561
Weighted average life (in years) 3.8 – 4.7 3.4
Prepayment speed assumption 19.6% - 20.4% 27.8% Impact on fair value at 10% adverse change $ (6,122) $ (4,502) Impact on fair value at 20% adverse change $ (9,689) $ (8,738)
Residual cash flow discount rate (annual) 25.5% - 42.2% 11.5% Impact on fair value at 10% adverse change $ (8,338) $ (5,948) Impact on fair value at 20% adverse change $ (15,864) $ (11,570)
(1) Mortgage related retained interests were acquired in connection with the Chevy Chase Bank acquisition during 2009.(2) The Company sold interest-only bonds during the quarter which resulted in the decline in retained interests from December 31, 2009. Additionally, the
Company reclassified the negative amortization bonds from held to maturity to available for sale and recognized an other-than-temporary impairment of $4million on these securities during the three months ending March 31, 2010. The Company also recorded non credit related unrealized losses of $14 million($9 million net of tax) in other comprehensive income.
(3) The sale of certain interest-only bonds provided the Company with updated market observable inputs to incorporate into the valuations of the interest-onlybonds that continue to be held by the Company. As a result, the Company recorded a $50 million decrease to the fair value of the interest-only bonds duringthe three months ended March 31, 2010 through an increase to the discount rate, which is attributable to illiquidity in the market for these types ofsecurities.
Cash Flows Related to the Off-Balance Sheet Mortgage Securitizations
The following table summarizes certain cash flows received from securitization trusts for the three months ended March 31, 2010 and 2009:
Three Months Ended
March 31, 2010 Three Months Ended
March 31, 2009Proceeds from new securitizations $ — $ — Servicing fees received 4,308 1,676Other cash flows received on retained interests 74,938 8,656
100
(1) (1)
(2) (3)
Table of Contents
Supplemental Loan Information
Principal balances of off-balance sheet single family residential loans, delinquent amounts and net credit losses on loans being serviced by the Company for thethree months ended March 31, 2010 and year ended December 31, 2009, were as follows:
As of March 31, 2010 As of December 31, 2009Total Principal Amount of Loans $ 4,509,336 $ 4,642,142
Principal Amount of Loans Past Due 90 Days or More orNon-Performing $ 1,243,561 $ 1,246,809
Net Credit Losses Three months ended March 31, 2010 and year ended
December 31, 2009 $ 96,350 $ 217,444
Other Mortgage Securitizations
The Company’s discontinued wholesale mortgage banking unit, GreenPoint, previously sold home equity lines of credit in whole loan sales and subsequentlyacquired a residual interest in certain trusts which securitized some of those loans. The trusts had aggregate assets of $356.7 million at March 31, 2010,representing the amount outstanding on the home equity lines of credit. As residual interest holder, GreenPoint is required to fund advances on the home equitylines of credit when certain performance triggers are met due to deterioration in asset performance. The Company has funded $24.0 million in advances throughMarch 31, 2010, all of which has been expensed as funded. The Company does not consolidate the trusts because the residual certificates do not provide theCompany with the obligation to absorb losses or the right to receive benefits that could potentially be significant to the trusts.
The Company retains the primary obligation for certain provisions of corporate guarantees, recourse sales and clean-up calls related to the discontinuedmanufactured housing operations of GreenPoint Credit LLC (“GPC”) which was sold to a third party in 2004. Although the Company is the primary obligor,recourse obligations related to former GPC whole loan sales, commitments to exercise mandatory clean-up calls on certain GPC securitization transactions andservicing were transferred to a third party in the sale transaction. The Company does not consolidate the trusts used for the securitization of manufactured housingloans because it does not have the power to direct the activities that most significantly impact the economic performance of the trusts since it no longer servicesthe loans.
The Company was required to fund letters of credit in 2004 to cover losses, and is obligated to fund future amounts under swap agreements for certaintransactions. The Company also has the right to receive any funds remaining in the letters of credit after the securities are released. The amount available underthe letters of credit was $198.4 million and $204.5 million at March 31, 2010 and December 31, 2009, respectively. The fair value of the expected residualbalances on the funded letters of credit was $50.2 million and $46.0 million at March 31, 2010 and December 31, 2009, respectively, and is included in otherassets on the Consolidated Balance Sheet. The Company’s maximum exposure under the swap agreements was $31.0 million and $32.7 million at March 31,2010 and December 31, 2009, respectively. The value of the Company’s obligations under these swaps was $21.0 million and $18.3 million at March 31, 2010and December 2009, respectively, and is recorded in other liabilities on the Consolidated Balance Sheet.
The principal balance of manufactured housing securitization transactions where the Company is the residual interest holder was $1.5 billion and $1.5 billion atMarch 31, 2010 and December 31, 2009, respectively. In the event the third party does not fulfill on its obligations to exercise the clean-up calls on certaintransactions, the obligation reverts to the Company and approximately $420.3 million of loans receivable would be assumed by the Company upon its executionof the clean-up call and the Company would be required to absorb any losses on the loans receivable. There have been no instances of non-performance to date bythe third party.
Management monitors the underlying assets for trends in delinquencies and related losses and reviews the purchaser’s financial strength as well as servicingperformance. These factors are considered in assessing the adequacy of the liabilities established for these obligations and the valuations of the assets.
101
Table of Contents
NOTE 14—COMMITMENTS, CONTINGENCIES AND GUARANTEES Letters of Credit
The Company issues letters of credit (financial standby, performance standby and commercial) to meet the financing needs of its customers. Standby letters ofcredit are conditional commitments issued by the Company to guarantee the performance of a customer to a third party in a borrowing arrangement. Commercialletters of credit are short-term commitments issued primarily to facilitate trade finance activities for customers and are generally collateralized by the goods beingshipped to the client. Collateral requirements are similar to those for funded transactions and are established based on management’s credit assessment of thecustomer. Management conducts regular reviews of all outstanding letters of credit and customer acceptances, and the results of these reviews are considered inassessing the adequacy of the Company’s allowance for loan and lease losses.
The Company had contractual amounts of standby letters of credit and commercial letters of credit of $1.7 billion at March 31, 2010. As of March 31, 2010,financial guarantees had expiration dates ranging from 2010 to 2020. The fair value of the guarantees outstanding at March 31, 2010 that have been issued sinceJanuary 1, 2003, was $2.8 million and was included in other liabilities.
Potential Mortgage Representation & Warranty Liabilities
As part of broader acquisitions, the Company acquired three subsidiaries that originated residential mortgage loans and sold them to various purchasers, includingsecuritization trusts. These subsidiaries are Capital One Home Loans, which was acquired in February 2005; GreenPoint, which was acquired in December 2006as part of the North Fork acquisition; and Chevy Chase Bank, which was acquired in February 2009 and subsequently merged into CONA. In connection withtheir sales of mortgage loans, the subsidiaries entered into agreements containing representations and warranties about, among other things, the mortgage loansand the origination process. Each subsidiary may be required to repurchase mortgage loans in the event of certain breaches of these representations andwarranties. In the event of a repurchase, the subsidiary is typically required to pay the then unpaid principal balance of the loan together with interest and certainexpenses (including, in certain cases, legal costs incurred by the purchaser and/or others), and the subsidiary then recovers the underlying collateral. Eachsubsidiary is exposed to any losses on the repurchased loans after giving effect to recoveries on the collateral. Each subsidiary may also be required to indemnifycertain purchasers and others against losses they incur in the event of breaches of representations and warranties and in various other circumstances, and theamount of such losses could exceed the repurchase amount of the related loans. These subsidiaries, in total, originated and sold an aggregate of approximately$121.9 billion original principal balance of mortgage loans between 2005 and 2008, the years with respect to which most of the repurchase requests and otherclaims relate. Some of this original principal balance has been repaid, but we believe a significant amount of it remains outstanding.
At March 31, 2010, the subsidiaries had open repurchase requests relating to approximately $1.2 billion original principal balance of mortgage loans (up from$699 million at March 31, 2009 and $966 million at December 31, 2009). The Company considers open requests to be requests with respect to mortgage loansreceived within the past 24 months that are in the process of being paid, are under review, or have been denied by the subsidiary but not rescinded by the partyrequesting repurchase, as well as specifically identified mortgage loans currently subject to actual or threatened litigation. In addition to the foregoing loan-specific open repurchase requests, GreenPoint is also a defendant in a lawsuit seeking, among other things, to require it to repurchase an entire portfolio ofapproximately 30,000 mortgage loans with an aggregate principal balance of $1.8 billion within a certain securitization trust based on alleged breaches ofrepresentations and warranties relating to a limited sampling of loans in the portfolio. See discussion within the Litigation section below for a discussion relatedto U.S. Bank. GreenPoint has also received requests for indemnification in connection with a number of lawsuits in which GreenPoint is not a party, includingboth representation and warranty litigation and securities class actions brought on behalf of investors in securitization trusts that in the aggregate hold asignificant principal balance of mortgage loans for which GreenPoint was identified as the originator. The Company believes that a significant number ofmortgage loans at issue in the litigations referred to above as well as a significant number of mortgage loans sold by the subsidiaries as to which no repurchase orindemnification requests have been received are currently delinquent or already foreclosed on.
The Company has established reserves in its consolidated financial statements for inherent losses that are considered to be both probable and estimable related tothe mortgage loans sold by each subsidiary. The adequacy of each reserve is evaluated on a quarterly basis and changes in the reserves are reported in non-interestexpense. Factors considered in the evaluation process for establishing the reserves include identity of counterparty, amount of open repurchase requests, currentlevel of loan losses, estimated success rate of claimants, estimated recoveries by the subsidiary on the underlying
102
Table of Contents
collateral, and whether there is actual or threatened litigation. For counterparties other than actual or threatened litigants, factors considered in the evaluationprocess also include an estimated amount of probable repurchase requests to be received over the next 12 months based on the historical relationship betweenmortgage loan performance and repurchase requests and the estimated level of future mortgage loan performance. The Company expects that both thedelinquency rates on subsidiary-originated mortgage loans and the severity of losses on collateral recoveries will continue to be high, but the reserve settingprocess does not include an attempt to predict lifetime losses on the loans. The reserves also do not include amounts for the portfolio-wide repurchase claim atissue in the U.S. Bank litigation or for the indemnification requests with respect to securities class actions, in each case as referred to above, because neitherexposure, if any, is currently considered to be both probable and estimable. The reserves do include amounts for the loan-by-loan theory of recovery alleged in theU.S. Bank litigation, in the indemnification requests with respect to third-party representation and warranty litigation, and in various other actual or threatenedlitigation matters
The adequacy of the reserves and the ultimate amount of losses incurred will depend on, among other things, the actual future mortgage loan performance, theactual level of future repurchase and indemnification requests, the actual success rates of claimants, developments in litigation, actual recoveries on the collateral,and macroeconomic conditions (including unemployment levels and housing prices).
At March 31, 2010, the aggregate reserve for all three subsidiaries was $454 million, compared to $238 million at December 31, 2009. The $216 million changein the reserve from December 31, 2009 was the result of $8 million in repurchase claims settlements in the quarter that were applied against the reserve and anexpense of $224 million resulting primarily from updated estimates related to actual and threatened litigation. Due to the uncertainties discussed above, theCompany cannot reasonably estimate the total amount of losses that will actually be incurred as a result of each subsidiary’s repurchase and indemnificationobligations, and there can be no assurance that the Company’s current reserves will be adequate or that the total amount of losses incurred will not have a materialadverse effect upon the Company’s financial condition or results of operations.
Litigation
In accordance with the provisions of Accounting for Contingencies, the Company accrues for a litigation related liability when it is probable that such a liabilityhas been incurred and the amount of the loss can be estimated. In addition, the Company’s subsidiary banks are members of Visa U.S.A., Inc. (“Visa”). Asmembers, the Company’s subsidiary banks have indemnification obligations to Visa with respect to final judgments and settlements of certain litigation againstVisa (the “Visa Covered Litigation”).
In 2005, a number of entities, each purporting to represent a class of retail merchants, filed antitrust lawsuits (the “Interchange Lawsuits”) against MasterCard andVisa and several member banks, including the Company and its subsidiaries, alleging among other things, that the defendants conspired to fix the level ofinterchange fees. The complaints seek injunctive relief and civil monetary damages, which could be trebled. Separately, a number of large merchants haveasserted similar claims against Visa and MasterCard only. In October 2005, the class and merchant Interchange lawsuits were consolidated before the UnitedStates District Court for the Eastern District of New York for certain purposes, including discovery. Fact discovery has closed and limited expert discovery isongoing. The parties have briefed and presented oral argument on motions to dismiss and class certification and are awaiting decisions from the court.
In 2007, a number of individual plaintiffs, each purporting to represent a class of cardholders, filed antitrust lawsuits in the United States District Court for theNorthern District of California against several issuing banks, including the Company (the “In Re Late Fees Litigation”). These lawsuits allege, among otherthings, that the defendants conspired to fix the level of late fees and over-limit fees charged to cardholders, and that these fees are excessive. In May 2007, thecases were consolidated for all purposes and a consolidated amended complaint was filed alleging violations of federal statutes and state law. The amendedcomplaint requests civil monetary damages, which could be trebled. In November 2007, the court dismissed the amended complaint. Plaintiffs appealed that orderto the Ninth Circuit Court of Appeals. The plaintiffs’ appeal challenges the dismissal of their National Bank Act, Depository Institutions Deregulation Act of1980 and California Unfair Competition Law claims, but not their antitrust conspiracy claims. In June 2009, the Ninth Circuit Court of Appeals stayed the matterpending the bankruptcy proceedings of one of the defendant financial institutions. In November 2009 and April 2010, the Ninth Circuit Court of Appeals enteredadditional order continuing the stay of the matter pending the bankruptcy proceedings.
Between January and April 2010, eight substantially similar putative class actions were filed against COBNA and Capital One Services, LLC (“COSI”)challenging various marketing practices relating to the payment protection product: Blackie v. Capital One Bank, et al. (United States District Court for theEastern District of Pennsylvania); Carr v. Capital One
103

Table of Contents
Bank, et al. (United States District Court for the District of New Jersey); McCoy v. Capital One Bank, et al. (United States District Court for the Southern Districtof California); Mitchell v. Capital One Bank, et al. (United States District Court for the Central District of California); Salazar v. Capital One Bank, et al. (UnitedStates District Court for the District of South Carolina); Smith v. Capital One Bank, et al. (United States District Court for the District of Arkansas); Sullivan v.Capital One Bank, et al, (United States District Court for the District of Connecticut); Watlington v. Capital One Bank, et al. (United States District Court for theMiddle District of North Carolina). These putative class actions seek a range of remedies, including compensatory damages, punitive damages, restitution,disgorgement, injunctive relief, and attorneys’ fees. Each of these cases is in early stages. In addition, in September 2009, the United States District Court for theMiddle District of Florida certified a statewide class action in Spinelli v. Capital One Bank, et al. with respect to the marketing of the payment protection productin Florida. In May 2010, the United States Court of Appeals for the Eleventh Circuit denied COBNA’s and COSI’s petition for interlocutory review of the classcertification order, allowing the case to proceed toward the summary judgment stage. In January 2010, the West Virginia Attorney General filed suitagainst COBNA and various affiliates in Mason County, West Virginia, challenging numerous credit card practices under the West Virginia Consumer Credit andProtection Act, including practices relating to the payment protection product. The West Virginia Attorney General seeks injunctive relief, consumer refunds,statutory damages, disgorgement, and attorneys’ fees. COBNA has removed the case to the United States District Court for the Southern District of West Virginiaand filed a motion to dismiss the complaint. Finally, COBNA is subject to formal and informal inquiries from various governmental agencies relating to thepayment protection product.
On February 5, 2009, GreenPoint Mortgage Funding, Inc. (“GreenPoint”), a subsidiary of Capital One Financial Corporation, was named as a defendant in alawsuit commenced in the Supreme Court of the State of New York, New York County by U.S. Bank National Association, Syncora Guarantee Inc. (formerlyknown as XL Capital Assurance Inc.) and CIFG Assurance North America, Inc. Plaintiffs allege, among other things, that GreenPoint breached certainrepresentations and warranties in two contracts pursuant to which GreenPoint sold approximately 30,000 mortgage loans having an aggregate original principalbalance of approximately $1.8 billion to a purchaser that ultimately transferred most of these mortgage loans to a securitization trust. Some of the securities issuedby the trust were insured by two of the plaintiffs. Plaintiffs have alleged breaches of representations and warranties with respect to a limited number of specificmortgage loans. Plaintiffs seek unspecified damages and an order compelling GreenPoint to repurchase the entire portfolio of 30,000 mortgage loans based onalleged breaches of representations and warranties relating to a limited sampling of loans in the portfolio, or, alternatively, the repurchase of specific mortgageloans to which the alleged breaches of representations and warranties relate. On March 3, 2010, the Court granted GreenPoint’s motion to dismiss with respect toplaintiffs Syncora and CIFG and denied the motion with respect to U.S. Bank. On April 14, 2010 plaintiffs U.S. Bank, Syncora, and CIFG filed an amendedcomplaint seeking, among other things, the repurchase remedies described above and indemnification for losses suffered by Syncora and CIFG.
Given the complexity of the issues raised by these matters and the uncertainty regarding: (i) the outcome of these matters, (ii) the likelihood and amount of anypossible judgments, and (iii)with respect to the interchange lawsuits (a) the likelihood, amount and validity of any claim against the member banks, including theCompany and its subsidiary banks, (b) changes in industry structure that may result from the suits and (c) the effects of these suits, in turn, on competition in theindustry, member banks and interchange fees, the Company cannot determine at this time the long-term effects of these matters.
In the first quarter of 2008, Visa completed an IPO of its stock. With IPO proceeds Visa established an escrow account for the benefit of member banks to fundcertain litigation settlements and claims. As a result, in the first quarter of 2008, the Company reduced its Visa-related indemnification liabilities of $90.9 millionrecorded in other liabilities with a corresponding reduction of other non-interest expense. The Company made a Fair Value Option for Financial Assets andLiabilities, election on the indemnification guarantee to Visa and the fair value of the guarantee at March 31, 2010 and December 31, 2009 was zero.
Since July 2009, we have been providing documents and information on a voluntary basis in response to an informal inquiry by the Staff of the SEC. In the firstquarter of 2010, the SEC issued a formal order of investigation with respect to this inquiry. Although the order, as is generally customary, authorizes a broaderinquiry by the Staff, we believe that the investigation is focused largely on the Company’s method of determining the loan loss reserves at its auto financebusiness for certain quarterly periods in 2007. We are cooperating fully with the Staff’s investigation. At this time, it is not possible to predict when or how theinvestigation will be resolved.
Other Pending and Threatened Litigation
In addition, the Company is commonly subject to various pending and threatened legal actions relating to the conduct of its normal business activities. In theopinion of management, the ultimate aggregate liability, if any, arising out of any such pending or threatened legal actions will not be material to its consolidatedfinancial position or its results of operations.
104
Table of Contents
On September 21, 2009, the Tax Court issued a decision in the case Capital One Financial Corporation and Subsidiaries v. Commissioner covering tax years1995-1999, with both parties prevailing on certain issues. The time period for an appeal by each party is pending. Although the final resolution of the case isuncertain and involves unsettled areas of law, the Company has accounted for this matter applying the recognition and measurement criteria of, Accounting forUncertainty in Income Taxes, an Interpretation of FASB Statement No. 109 (“ASC 740-10”). NOTE 15—OTHER VARIABLE INTEREST ENTITIES The Company is involved with various entities that are considered to be VIEs. With respect to its interests, the Company is required to consolidate any VIE inwhich it is determined to be the primary beneficiary. The Company reviews all significant interests in the VIEs it is involved with such as amounts and types offinancial and other support including equity investments, debt financing and guarantees. The Company also considers the activities of the VIEs that mostsignificantly impact the VIEs economic performance and whether it has control over those activities. To provide the necessary disclosures, the Companyaggregates similar VIEs based on the nature and purpose of the entities.
The Company is also involved in various securitization transactions in the ordinary course of business. Please refer to “Note 11—Mortgage Servicing Rights”,“Note 13—Securitizations” and “Note 14—Commitments, Contingencies and Guarantees” for disclosures on involvement with other types of VIEs. This note islimited to non-securitization trusts and entities.
The new consolidation guidance amends the guidance for determining whether an entity is a VIE, replaces the quantitative approach for determining the primarybeneficiary with a qualitative assessment, and requires ongoing assessments as to whether an enterprise is the primary beneficiary of the VIE. Under the newconsolidation guidance the primary beneficiary is the entity that has (i) the power to direct the activities of a VIE that most significantly impact the entity’seconomic performance and (ii) the obligation to absorb losses of the entity that could potentially be significant to the VIE or the right to receive benefits from theentity that could potentially be significant to the VIE.
As part of its community reinvestment initiatives, the Company invests in private investment funds that make equity investments in multi-family affordablehousing properties. The Company receives affordable housing tax credits for these investments. The activities of these entities are financed with a combination ofinvested equity capital and debt. As a result of new consolidation guidance certain investment funds are no longer considered to be variable interest entities andare not included in the March 31, 2010 balances in the table below. These investment funds were consolidated by the Company as of January 1, 2010, the netconsolidation impact to other liabilities was $67.4 million. The assets of the unconsolidated investment funds that were VIEs at March 31, 2010 andDecember 31, 2009 were approximately $6.7 billion and $7.3 billion, respectively. The Company is not required to consolidate the investment funds that are VIEsas it does not have the power to direct the activities that most significantly impact the economic performance of those entities. The Company records its interestsin the unconsolidated VIEs in loans held for investment, other assets and other liabilities. The Company’s maximum exposure to these entities is limited to itsvariable interests in the entities. Please refer to the table below for additional details. The creditors of the VIEs have no recourse to the general credit of theCompany and the Company does not provide additional financial or other support during the period that it was not previously contractually required to provide.
The Company holds variable interests in entities (“Investor Entities”) that invest in community development entities (“CDEs”) that provide debt financing tobusinesses and non-profit entities in low-income and rural communities. Investments of the consolidated Investor Entities are also variable interests of theCompany. The activities of the Investor Entities are financed with a combination of invested equity capital and debt. The activities of the CDEs are financedsolely with invested equity capital. The Company receives federal and state tax credits for these investments. As a result of new consolidation guidance certainCDEs are no longer considered to be variable interest entities and are not included in the March 31, 2010 balances in the table below. The Company consolidatesthe VIEs in which it has the power to direct the activities that most significantly impact the VIE’s economic performance and the obligation to absorb losses orright to receive benefits that could be potentially significant to the VIE. The assets of the VIEs consolidated by the Company at March 31, 2010 andDecember 31, 2009 were approximately $161.1 million and $155.4 million, respectively. The assets and liabilities of these consolidated VIEs were recorded incash, loans held for investment, interest receivable, other assets and other liabilities. The assets of the VIEs that the Company held an interest in but was notrequired to consolidate at March 31, 2010 and December 31, 2009 were approximately $16.1 million and $58.4 million, respectively. The Company records itsinterests in these unconsolidated VIEs in loans held for investment and other assets. As referenced in the table below, the Company’s maximum exposure to theseentities is limited to its variable interests in the entities. The creditors of the VIEs have no recourse to the general credit of the Company. The Company has notprovided additional financial or other support during the period that it was not previously contractually required to provide.
105
Table of Contents
The Company also has a variable interest in a trust that is included in the other unconsolidated VIEs in the table below. The trust has a royalty interest in certainoil and gas properties. The activities of the trust are financed solely with debt. The assets of the trust at March 31, 2010 and December 31, 2009 wereapproximately $413.8 million and $429.9 million, respectively. The Company is not required to consolidate the trust because it does not have the power to directthe activities of the trust that most significantly impacts the trust’s economic performance. The Company records its interest in the trust in loans held forinvestment. As referenced in the table below, the Company’s maximum exposure to the trust is limited to its variable interest. The creditors of the trust have norecourse to the general credit of the Company. The Company has not provided additional financial or other support during the period that it was not previouslycontractually required to provide.
The following table presents the carrying amount of assets and liabilities of those VIEs for which the Company is the primary beneficiary and the carryingamount of assets and liabilities and maximum exposure to loss of those VIEs of which the Company is not the primary beneficiary, but holds a variable interest. Consolidated Unconsolidated
CarryingAmount of
Assets
CarryingAmount ofLiabilities
CarryingAmount of
Assets
CarryingAmount ofLiabilities
MaximumExposure to
LossVariable interest entities, March 31, 2010 Affordable housing entities $ — $ — $ 978,558 $303,479 $ 978,558
Entities that provide capital to low-income and rural communities 161,103 — 16,116 1,837 16,116Other — — 193,700 — 193,700
Total variable interest entities $161,103 $ — $1,188,374 $305,316 $1,188,374
Variable interest entities, December 31, 2009 Affordable housing entities $ — $ — $1,401,080 $638,442 $1,401,080Entities that provide capital to low-income and rural communities 155,444 — 58,375 1,623 58,375Other — — 202,943 — 202,943
Total variable interest entities $155,444 $ — $1,662,398 $640,065 $1,662,398
(1) We consolidate a VIE when we are the primary beneficiary that has (i) the power to direct the activities of a VIE that most significantly impact the entity’seconomic performance and (ii) the obligation to absorb losses of the entity that could potentially be significant to the VIE or the right to receive benefitsfrom the entity that could potentially be significant to the VIE.
(2) The maximum exposure to loss represents the amount of loss the Company would incur in the unlikely event that all of the Company’s assets in the VIEsbecame worthless.
(3) The Company’s maximum exposure to loss is limited to the carrying amount of assets because the Company is not required to provide any support to theseentities other than what it was previous contractually required to provide.
NOTE 16—SUBSEQUENT EVENTS We evaluate subsequent events that have occurred after the balance sheet date but before the financial statements are issued. There are two types of subsequentevents: (1) recognized, or those that provide additional evidence about conditions that existed at the date of the balance sheet, including the estimates inherent inthe process of preparing financial statements, and (2) nonrecognized, or those that provide evidence about conditions that did not exist at the date of the balancesheet but arose after that date.
Based on the evaluation, we did not identify any recognized or nonrecognized subsequent events that would have required adjustment to the financial statements.
106
(1)
(2)(3)
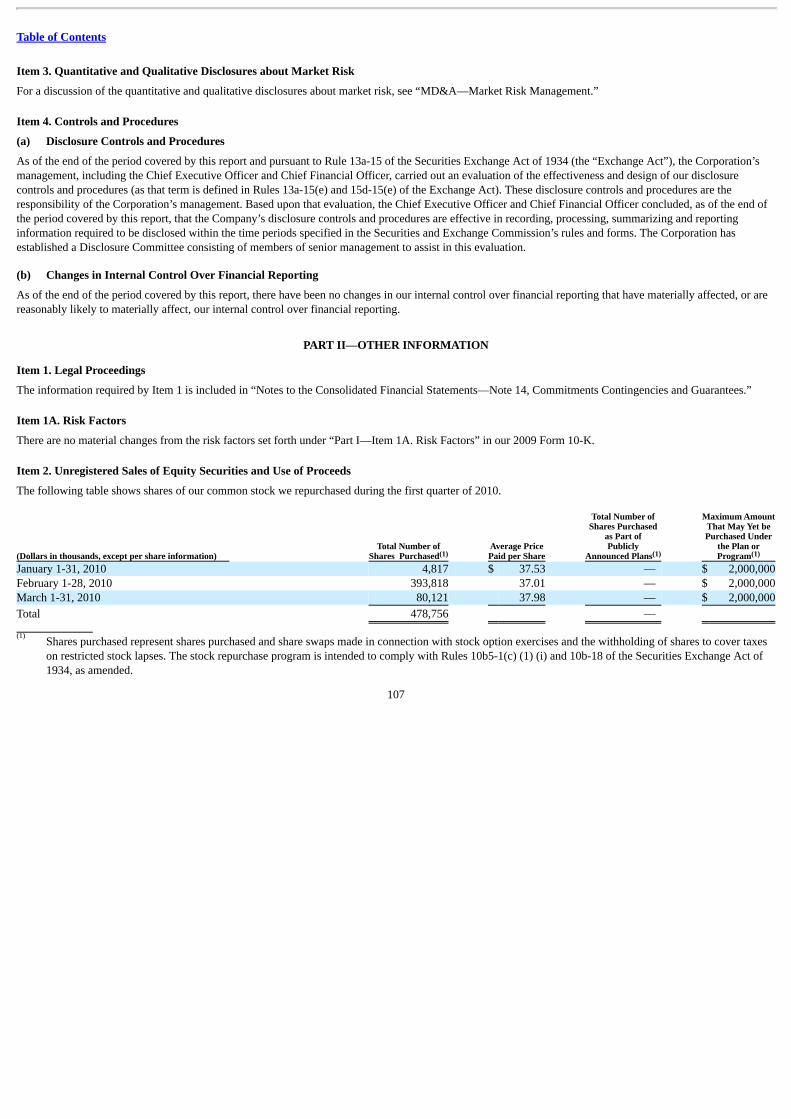
Table of Contents
Item 3. Quantitative and Qualitative Disclosures about Market Risk
For a discussion of the quantitative and qualitative disclosures about market risk, see “MD&A—Market Risk Management.”
Item 4. Controls and Procedures
(a) Disclosure Controls and Procedures
As of the end of the period covered by this report and pursuant to Rule 13a-15 of the Securities Exchange Act of 1934 (the “Exchange Act”), the Corporation’smanagement, including the Chief Executive Officer and Chief Financial Officer, carried out an evaluation of the effectiveness and design of our disclosurecontrols and procedures (as that term is defined in Rules 13a-15(e) and 15d-15(e) of the Exchange Act). These disclosure controls and procedures are theresponsibility of the Corporation’s management. Based upon that evaluation, the Chief Executive Officer and Chief Financial Officer concluded, as of the end ofthe period covered by this report, that the Company’s disclosure controls and procedures are effective in recording, processing, summarizing and reportinginformation required to be disclosed within the time periods specified in the Securities and Exchange Commission’s rules and forms. The Corporation hasestablished a Disclosure Committee consisting of members of senior management to assist in this evaluation. (b) Changes in Internal Control Over Financial Reporting
As of the end of the period covered by this report, there have been no changes in our internal control over financial reporting that have materially affected, or arereasonably likely to materially affect, our internal control over financial reporting.
PART II—OTHER INFORMATION
Item 1. Legal Proceedings
The information required by Item 1 is included in “Notes to the Consolidated Financial Statements—Note 14, Commitments Contingencies and Guarantees.”
Item 1A. Risk Factors
There are no material changes from the risk factors set forth under “Part I—Item 1A. Risk Factors” in our 2009 Form 10-K.
Item 2. Unregistered Sales of Equity Securities and Use of Proceeds
The following table shows shares of our common stock we repurchased during the first quarter of 2010.
(Dollars in thousands, except per share information) Total Number of
Shares Purchased Average PricePaid per Share
Total Number ofShares Purchased
as Part ofPublicly
Announced Plans
Maximum AmountThat May Yet bePurchased Under
the Plan orProgram
January 1-31, 2010 4,817 $ 37.53 — $ 2,000,000February 1-28, 2010 393,818 37.01 — $ 2,000,000March 1-31, 2010 80,121 37.98 — $ 2,000,000
Total 478,756 —
Shares purchased represent shares purchased and share swaps made in connection with stock option exercises and the withholding of shares to cover taxeson restricted stock lapses. The stock repurchase program is intended to comply with Rules 10b5-1(c) (1) (i) and 10b-18 of the Securities Exchange Act of1934, as amended.
107
(1) (1) (1)
(1)

Table of Contents
Item 3. Defaults upon Senior Securities
None
Item 4. (Removed and Reserved)
Item 5. Other Information
None
Item 6. Exhibits
An index to exhibits has been filed as part of this report beginning on page E-1 and is incorporated herein by reference.
108

Table of Contents
SIGNATURES
Pursuant to the requirements of the Securities Exchange Act of 1934, the Registrant has duly caused this report to be signed on its behalf by the undersignedthereunto duly authorized.
CAPITAL ONE FINANCIAL CORPORATION(Registrant)
Date: May 7, 2010 By: /s/ GARY L. PERLIN Gary L. Perlin Chief Financial Officer and Principal Accounting Officer
109
Table of Contents
INDEX TO EXHIBITS Exhibit
No. Description
2.1
Stock Purchase Agreement, dated as of December 3, 2008, by and among Capital One Financial Corporation, B.F. Saul Real Estate Investment Trust,Derwood Investment Corporation, and B.F. Saul Company Employee’s Profit Sharing and Retirement Trust (incorporated by reference to Exhibit 2.4of the Corporation’s 2008 Form 10-K).
3.1
Restated Certificate of Incorporation of Capital One Financial Corporation, (as amended May 15, 2007 (incorporated by reference to Exhibit 3.1 ofthe Corporation’s Report on Form 8-K, filed on August 28, 2007).
3.2
Amended and Restated Bylaws of Capital One Financial Corporation (as amended October 30, 2008) (incorporated by reference to Exhibit 3.1 of theCorporation’s Report on Form 8-K, filed November 3, 2008).
4.1.1
Specimen certificate representing the Common Stock (incorporated by reference to Exhibit 4.1 of the Corporation’s Annual Report on Form 10-Kfiled March 5, 2004).
4.1.2
Warrant Agreement, dated December 3, 2009, between Capital One Financial Corporation and Computershare Trust Company, N.A. (incorporatedherein by reference to the Exhibit 4.1 of the Company’s Form 8-A filed on December 4, 2009).
4.2.1
Senior Indenture dated as of November 1, 1996 between Capital One Financial Corporation and The Bank of New York Mellon Trust Company,N.A., formerly known as The Bank of New York Trust Company, N.A. (as successor to Harris Trust and Savings Bank), as trustee (incorporated byreference to Exhibit 4.1 of the Corporation’s Report on Form 8-K, filed on November 13, 1996).
4.2.2 Copy of 6.25% Notes, due 2013, of Capital One Financial Corporation (incorporated by reference to Exhibit 4.5.5 of the 2003 Form 10-K).
4.2.3 Copy of 5.25% Notes, due 2017, of Capital One Financial Corporation (incorporated by reference to Exhibit 4.5.6 of the 2004 Form 10-K).
4.2.4 Copy of 4.80% Notes, due 2012, of Capital One Financial Corporation (incorporated by reference to Exhibit 4.5.7 of the 2004 Form 10-K).
4.2.5
Copy of 5.50% Senior Notes, due 2015, of Capital One Financial Corporation (incorporated by reference to Exhibit 4.1 of the Corporation’sQuarterly Report on Form 10-Q for the period ending June 30, 2005).
4.2.6
Specimen of 5.70% Senior Note, due 2011, of Capital One Financial Corporation (incorporated by reference to Exhibit 4.2 of the Corporation’sReport on Form 8-K, filed on September 18, 2006).
4.2.7
Specimen of 6.750% Senior Note, due 2017, of Capital One Financial Corporation (incorporated by reference to Exhibit 4.1 of the Corporation’sReport on Form 8-K, filed on September 5, 2007).
4.2.8
Specimen of 7.375% Senior Note, due 2014, of Capital One Financial Corporation (incorporated by reference to Exhibit 4.1 of the Corporation’sReport on Form 8-K, filed on May 22, 2009).
4.3
Indenture (providing for the issuance of Junior Subordinated Debt Securities), dated as of June 6, 2006, between Capital One Financial Corporationand The Bank of New York Mellon Trust Company, N.A., as indenture trustee (incorporated by reference to Exhibit 4.1 of the Corporation’s CurrentReport on Form 8-K, filed on June 12, 2006).
4.4.1
First Supplemental Indenture, dated as of June 6, 2006, between Capital One Financial Corporation and The Bank of New York Mellon TrustCompany, N.A., as indenture trustee (incorporated by reference to Exhibit 4.2 of the Corporation’s Current Report on Form 8-K, filed on June 12,2006).
4.4.2
Amended and Restated Declaration of Trust of Capital One Capital II, dated as of June 6, 2006, between Capital One Financial Corporation asSponsor, The Bank of New York Mellon, as institutional trustee, BNY Mellon Trust of Delaware, as Delaware Trustee and the AdministrativeTrustees named therein (incorporated by reference to Exhibit 4.3 of the Corporation’s Current Report on Form 8-K, filed on June 12, 2006).
E-1
Table of Contents
ExhibitNo. Description
4.4.3
Guarantee Agreement, dated as of June 6, 2006, between Capital One Financial Corporation and The Bank of New York Mellon Trust Company,N.A., as guarantee trustee (incorporated by reference to Exhibit 4.4 of the Corporation’s Current Report on Form 8-K, filed on June 12, 2006).
4.4.4
Specimen certificate representing the Enhanced TRUPS (incorporated by reference to Exhibit 4.5 of the Corporation’s Current Report on Form 8-K,filed on June 12, 2006).
4.4.5
Specimen certificate representing the Junior Subordinated Debt Security (incorporated by reference to Exhibit 4.6 of the Corporation’s CurrentReport on Form 8-K, filed on June 12, 2006).
4.5.1
Second Supplemental Indenture, dated as of August 1, 2006, between Capital One Financial Corporation and The Bank of New York Mellon TrustCompany, N.A., as indenture trustee (incorporated by reference to Exhibit 4.2 of the Corporation’s Current Report on Form 8-K, filed on August 4,2006).
4.5.2
Copy of Junior Subordinated Debt Security Certificate (incorporated by reference to Exhibit 4.6 of the Corporation’s Current Report on Form 8-K,filed on August 4, 2006).
4.5.3
Amended and Restated Declaration of Trust of Capital One Capital III, dated as of August 1, 2006, between Capital One Financial Corporation, asSponsor, The Bank of New York Mellon, as institutional trustee, BNY Mellon Trust of Delaware, as Delaware trustee and the AdministrativeTrustees named therein (incorporated by reference to Exhibit 4.3 of the Corporation’s Current Report on Form 8-K, filed on August 4, 2006).
4.5.4
Guarantee Agreement, dated as of August 1, 2006, between Capital One Financial Corporation and The Bank of New York Mellon Trust Company,N.A., as guarantee trustee (incorporated by reference to Exhibit 4.4 of the Corporation’s Current Report on Form 8-K, filed on August 4, 2006).
4.5.5
Copy of Capital Security Certificate (incorporated by reference to Exhibit 4.5 of the Corporation’s Current Report on Form 8-K, filed on August 4,2006)
4.6.1
Third Supplemental Indenture, dated as of February 5, 2007, between Capital One Financial Corporation and The Bank of New York Mellon TrustCompany, N.A., as indenture trustee (incorporated by reference to Exhibit 4.2 of the Corporation’s Current Report on Form 8-K, filed on February 8,2007).
4.6.3
Guarantee Agreement, dated as of February 5, 2007, between Capital One Financial Corporation and The Bank of New York Mellon Trust Company,N.A., as guarantee trustee (incorporated by reference to Exhibit 4.4 of the Corporation’s Current Report on Form 8-K, filed on February 8, 2007).
4.6.4
Specimen certificate representing the Capital Security (incorporated by reference to Exhibit 4.5 of the Corporation’s Current Report on Form 8-K,filed on February 8, 2007).
4.6.5
Specimen certificate representing the Capital Efficient Note (incorporated by reference to Exhibit 4.6 of the Corporation’s Current Report on Form8-K, filed on February 8, 2007).
4.7.1
Fourth Supplemental Indenture, dated as of August 5, 2009, between Capital One Financial Corporation and The Bank of New York Mellon TrustCompany, N.A., as indenture trustee (incorporated by reference to Exhibit 4.2 of the Corporation’s Current Report on Form 8-K, filed on August 6,2009).
4.7.3
Guarantee Agreement, dated as of August 5, 2009, between Capital One Financial Corporation and The Bank of New York Mellon Trust Company,N.A., as guarantee trustee (incorporated by reference to Exhibit 4.4 of the Corporation’s Current Report on Form 8-K, filed on August 6, 2009).
4.7.4
Specimen Trust Preferred Security Certificate (incorporated by reference to Exhibit 4.5 of the Corporation’s Current Report on Form 8-K, filed onAugust 6, 2009).
4.7.5
Specimen Junior Subordinated Debt Security (incorporated by reference to Exhibit 4.6 of the Corporation’s Current Report on Form 8-K, filed onAugust 6, 2009).
4.8.1
Fifth Supplemental Indenture, dated as of November 13, 2009, between Capital One Financial Corporation and The Bank of New York Mellon TrustCompany, N.A., as indenture trustee (incorporated by reference to Exhibit 4.2 of the Corporation’s Current Report on Form 8-K, filed onNovember 13, 2009).
E-2

Table of Contents
ExhibitNo. Description
4.8.2
Amended and Restated Declaration of Trust of Capital One Capital VI, dated as of November 13, 2009, between Capital One FinancialCorporation as Sponsor, The Bank of New York Mellon Trust Company, N.A., as institutional trustee, BNY Mellon Trust of Delaware, asDelaware Trustee and the Administrative Trustees named therein (incorporated by reference to Exhibit 4.3 of the Corporation’s Current Reporton Form 8-K, filed on November 13, 2009).
4.8.3
Guarantee Agreement, dated as of November 13, 2009, between Capital One Financial Corporation and The Bank of New York Mellon TrustCompany, N.A., as guarantee trustee (incorporated by reference to Exhibit 4.4 of the Corporation’s Current Report on Form 8-K, filed onNovember 13, 2009).
4.8.4
Specimen Trust Preferred Security Certificate (incorporated by reference to Exhibit 4.5 of the Corporation’s Current Report on Form 8-K, filedon November 13, 2009).
4.8.5
Specimen Junior Subordinated Debt Security (incorporated by reference to Exhibit 4.6 of the Corporation’s Current Report on Form 8-K, filedon November 13, 2009).
4.9.1
Indenture, dated as of August 29, 2006, between Capital One Financial Corporation and The Bank of New York Mellon Trust Company, N.A., asindenture trustee (incorporated by reference to Exhibit 4.1 of the Corporation’s Current Report on Form 8-K, filed on August 31, 2006).
4.9.2
Copy of Subordinated Note Certificate (incorporated by reference to Exhibit 4.2 of the Corporation’s Current Report on Form 8-K, filed onAugust 31, 2006).
31.1* Certification of Richard D. Fairbank
31.2* Certification of Gary L. Perlin
32.1* Certification** of Richard D. Fairbank
32.2* Certification** of Gary L. Perlin
99.3* Reconciliation to GAAP Financial Measures
101.INS* XBRL Instance Document
101.SCH* XBRL Taxonomy Extension Schema Document
101.CAL* XBRL Taxonomy Extension Calculation Linkbase Document
101.DEF* XBRL Taxonomy Extension Definition Linkbase Document
101.LAB* XBRL Taxonomy Extension Label Linkbase Document
101.PRE* XBRL Taxonomy Presentation Linkbase Document * Indicates a document being filed with this Form 10-Q.** Information in this Form 10-Q furnished herewith shall not be deemed to be “filed” for the purposes of Section 18 of the 1934 Act or otherwise subject to
the liabilities of that section.
E-3

Exhibit 31.1
CERTIFICATION FOR QUARTERLY REPORT ON FORM 10-Q OF CAPITAL ONE FINANCIALCORPORATION AND CONSOLIDATED SUBSIDIARIES
I, Richard D. Fairbank, certify that:
1. I have reviewed this quarterly report on Form 10-Q of Capital One Financial Corporation;
2. Based on my knowledge, this report does not contain any untrue statement of a material fact or omit to state a material fact necessary to make thestatements made, in light of the circumstances under which such statements were made, not misleading with respect to the period covered by this report;
3. Based on my knowledge, the financial statements, and other financial information included in this report, fairly present in all material respects the financialcondition, results of operations and cash flows of the registrant as of, and for, the periods presented in this report;
4. The registrant’s other certifying officer and I are responsible for establishing and maintaining disclosure controls and procedures (as defined in ExchangeAct Rules 13a-15(e) and 15d-15(e)) and internal control over financial reporting (as defined in Exchange Act Rules 13a-15(f) and 15d-15(f)) for theregistrant and have:
(a) Designed such disclosure controls and procedures, or caused such disclosure controls and procedures to be designed under our supervision, to ensure
that material information relating to the registrant, including its consolidated subsidiaries, is made known to us by others within those entities,particularly during the period in which this report is being prepared;
(b) Designed such internal control over financial reporting, or caused such internal control over financial reporting to be designed under our supervision,
to provide reasonable assurance regarding the reliability of financial reporting and the preparation of financial statements for external purposes inaccordance with generally accepted accounting principles;
(c) Evaluated the effectiveness of the registrant’s disclosure controls and procedures and presented in this report our conclusions about the effectiveness
of the disclosure controls and procedures, as of the end of the period covered by this report based on such evaluation; and
(d) Disclosed in this report any change in the registrant’s internal control over financial reporting that occurred during the registrant’s most recent fiscal
quarter (the registrant’s fourth fiscal quarter in the case of an annual report) that has materially affected, or is reasonably likely to materially affect,the registrant’s internal control over financial reporting; and
5. The registrant’s other certifying officer and I have disclosed, based on our most recent evaluation of internal control over financial reporting, to theregistrant’s auditors and the audit committee of the registrant’s board of directors (or persons performing the equivalent functions):
(a) All significant deficiencies and material weaknesses in the design or operation of internal control over financial reporting which are reasonably likely
to adversely affect the registrant’s ability to record, process, summarize and report financial information; and
(b) Any fraud, whether or not material, that involves management or other employees who have a significant role in the registrant’s internal control over
financial reporting. Date: May 7, 2010 By: /s/ RICHARD D. FAIRBANK
Richard D. FairbankChairman of the Board, Chief Executive Officer and President
Exhibit 31.2
CERTIFICATION FOR QUARTERLY REPORT ON FORM 10-Q OF CAPITAL ONE FINANCIALCORPORATION AND CONSOLIDATED SUBSIDIARIES
I, Gary L. Perlin, certify that:
1. I have reviewed this quarterly report on Form 10-Q of Capital One Financial Corporation;
2. Based on my knowledge, this report does not contain any untrue statement of a material fact or omit to state a material fact necessary to make thestatements made, in light of the circumstances under which such statements were made, not misleading with respect to the period covered by this report;
3. Based on my knowledge, the financial statements, and other financial information included in this report, fairly present in all material respects the financialcondition, results of operations and cash flows of the registrant as of, and for, the periods presented in this report;
4. The registrant’s other certifying officer and I are responsible for establishing and maintaining disclosure controls and procedures (as defined in ExchangeAct Rules 13a-15(e) and 15d-15(e)) and internal control over financial reporting (as defined in Exchange Act Rules 13a-15(f) and 15d-15(f)) for theregistrant and have:
(a) Designed such disclosure controls and procedures, or caused such disclosure controls and procedures to be designed under our supervision, to ensure
that material information relating to the registrant, including its consolidated subsidiaries, is made known to us by others within those entities,particularly during the period in which this report is being prepared;
(b) Designed such internal control over financial reporting, or caused such internal control over financial reporting to be designed under our supervision,
to provide reasonable assurance regarding the reliability of financial reporting and the preparation of financial statements for external purposes inaccordance with generally accepted accounting principles;
(c) Evaluated the effectiveness of the registrant’s disclosure controls and procedures and presented in this report our conclusions about the effectiveness
of the disclosure controls and procedures, as of the end of the period covered by this report based on such evaluation; and
(d) Disclosed in this report any change in the registrant’s internal control over financial reporting that occurred during the registrant’s most recent fiscal
quarter (the registrant’s fourth fiscal quarter in the case of an annual report) that has materially affected, or is reasonably likely to materially affect,the registrant’s internal control over financial reporting; and
5. The registrant’s other certifying officer and I have disclosed, based on our most recent evaluation of internal control over financial reporting, to theregistrant’s auditors and the audit committee of the registrant’s board of directors (or persons performing the equivalent functions):
(a) All significant deficiencies and material weaknesses in the design or operation of internal control over financial reporting which are reasonably likely
to adversely affect the registrant’s ability to record, process, summarize and report financial information; and
(b) Any fraud, whether or not material, that involves management or other employees who have a significant role in the registrant’s internal control over
financial reporting. Date: May 7, 2010 By: /s/ GARY L. PERLIN
Gary L. PerlinChief Financial Officer and Principal Accounting Officer

Exhibit 32.1
CertificationPursuant to Section 906 of the Sarbanes-Oxley Act of 2002
(Subsections (a) and (b) of Section 1350, Chapter 63 of Title 18, United States Code)
Pursuant to Section 906 of the Sarbanes-Oxley Act of 2002 (Subsections (a) and (b) of Section 1350, Chapter 63 of Title 18, United States Code), I, Richard D.Fairbank, Chairman and Chief Executive Officer of Capital One Financial Corporation, a Delaware corporation (“Capital One”), do hereby certify that:
1. The Quarterly Report on Form 10-Q for the period ended March 31, 2010 (the “Form 10-Q”) of Capital One fully complies with the requirements ofSection 13(a) or 15(d) of the Securities Exchange Act of 1934; and
2. The information contained in the Form 10-Q fairly presents, in all material respects, the financial condition and results of operations of Capital One. Date: May 7, 2010 By: /s/ RICHARD D. FAIRBANK
Richard D. FairbankChairman of the Board, Chief Executive Officer and President
A signed original of this written statement required by Section 906 has been provided to Capital One and will be retained by Capital One and furnished to theSecurities and Exchange Commission or its staff upon request.

Exhibit 32.2
CertificationPursuant to Section 906 of the Sarbanes-Oxley Act of 2002
(Subsections (a) and (b) of Section 1350, Chapter 63 of Title 18, United States Code)
Pursuant to Section 906 of the Sarbanes-Oxley Act of 2002 (Subsections (a) and (b) of Section 1350, Chapter 63 of Title 18, United States Code), I, Gary L.Perlin, Executive Vice President and Chief Financial Officer of Capital One Financial Corporation, a Delaware corporation (“Capital One”), do hereby certifythat:
1. The Quarterly Report on Form 10-Q for the period ended March 31, 2010 (the “Form 10-Q”) of Capital One fully complies with the requirements ofSection 13(a) or 15(d) of the Securities Exchange Act of 1934; and
2. The information contained in the Form 10-Q fairly presents, in all material respects, the financial condition and results of operations of Capital One. Date: May 7, 2010 By: /s/ GARY L. PERLIN
Gary L. PerlinChief Financial Officer and Principal Accounting Officer
A signed original of this written statement required by Section 906 has been provided to Capital One and will be retained by Capital One and furnished to theSecurities and Exchange Commission or its staff upon request.
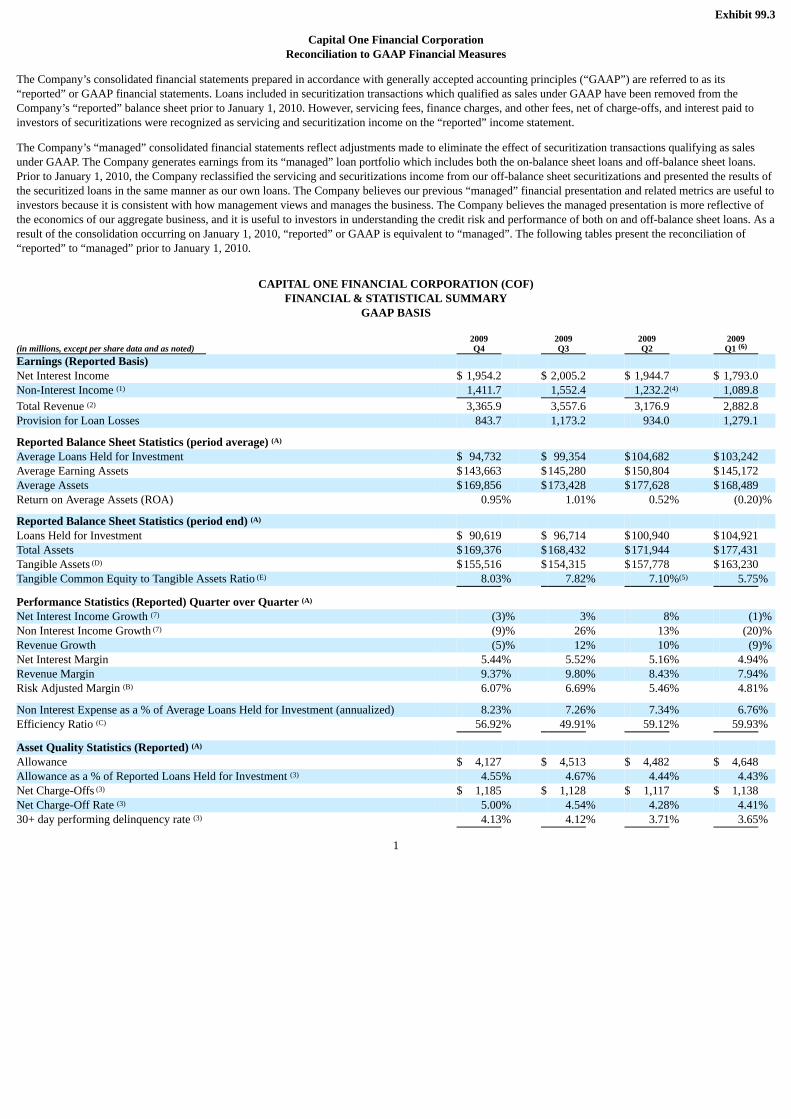
Exhibit 99.3
Capital One Financial CorporationReconciliation to GAAP Financial Measures
The Company’s consolidated financial statements prepared in accordance with generally accepted accounting principles (“GAAP”) are referred to as its“reported” or GAAP financial statements. Loans included in securitization transactions which qualified as sales under GAAP have been removed from theCompany’s “reported” balance sheet prior to January 1, 2010. However, servicing fees, finance charges, and other fees, net of charge-offs, and interest paid toinvestors of securitizations were recognized as servicing and securitization income on the “reported” income statement.
The Company’s “managed” consolidated financial statements reflect adjustments made to eliminate the effect of securitization transactions qualifying as salesunder GAAP. The Company generates earnings from its “managed” loan portfolio which includes both the on-balance sheet loans and off-balance sheet loans.Prior to January 1, 2010, the Company reclassified the servicing and securitizations income from our off-balance sheet securitizations and presented the results ofthe securitized loans in the same manner as our own loans. The Company believes our previous “managed” financial presentation and related metrics are useful toinvestors because it is consistent with how management views and manages the business. The Company believes the managed presentation is more reflective ofthe economics of our aggregate business, and it is useful to investors in understanding the credit risk and performance of both on and off-balance sheet loans. As aresult of the consolidation occurring on January 1, 2010, “reported” or GAAP is equivalent to “managed”. The following tables present the reconciliation of“reported” to “managed” prior to January 1, 2010.
CAPITAL ONE FINANCIAL CORPORATION (COF)FINANCIAL & STATISTICAL SUMMARY
GAAP BASIS
(in millions, except per share data and as noted) 2009Q4
2009Q3
2009Q2
2009Q1
Earnings (Reported Basis) Net Interest Income $ 1,954.2 $ 2,005.2 $ 1,944.7 $ 1,793.0 Non-Interest Income 1,411.7 1,552.4 1,232.2 1,089.8
Total Revenue 3,365.9 3,557.6 3,176.9 2,882.8 Provision for Loan Losses 843.7 1,173.2 934.0 1,279.1
Reported Balance Sheet Statistics (period average) Average Loans Held for Investment $ 94,732 $ 99,354 $104,682 $103,242 Average Earning Assets $143,663 $145,280 $150,804 $145,172 Average Assets $169,856 $173,428 $177,628 $168,489 Return on Average Assets (ROA) 0.95% 1.01% 0.52% (0.20)%
Reported Balance Sheet Statistics (period end) Loans Held for Investment $ 90,619 $ 96,714 $100,940 $104,921 Total Assets $169,376 $168,432 $171,944 $177,431 Tangible Assets $155,516 $154,315 $157,778 $163,230 Tangible Common Equity to Tangible Assets Ratio 8.03% 7.82% 7.10% 5.75%
Performance Statistics (Reported) Quarter over Quarter Net Interest Income Growth (3)% 3% 8% (1)% Non Interest Income Growth (9)% 26% 13% (20)% Revenue Growth (5)% 12% 10% (9)% Net Interest Margin 5.44% 5.52% 5.16% 4.94% Revenue Margin 9.37% 9.80% 8.43% 7.94% Risk Adjusted Margin 6.07% 6.69% 5.46% 4.81%
Non Interest Expense as a % of Average Loans Held for Investment (annualized) 8.23% 7.26% 7.34% 6.76% Efficiency Ratio 56.92% 49.91% 59.12% 59.93%
Asset Quality Statistics (Reported) Allowance $ 4,127 $ 4,513 $ 4,482 $ 4,648 Allowance as a % of Reported Loans Held for Investment 4.55% 4.67% 4.44% 4.43% Net Charge-Offs $ 1,185 $ 1,128 $ 1,117 $ 1,138 Net Charge-Off Rate 5.00% 4.54% 4.28% 4.41% 30+ day performing delinquency rate 4.13% 4.12% 3.71% 3.65%
1
(6)
(1) (4)
(2)
(A)
(A)
(D)
(E) (5)
(A)
(7)
(7)
(B)
(C)
(A)
(3)
(3)
(3)
(3)
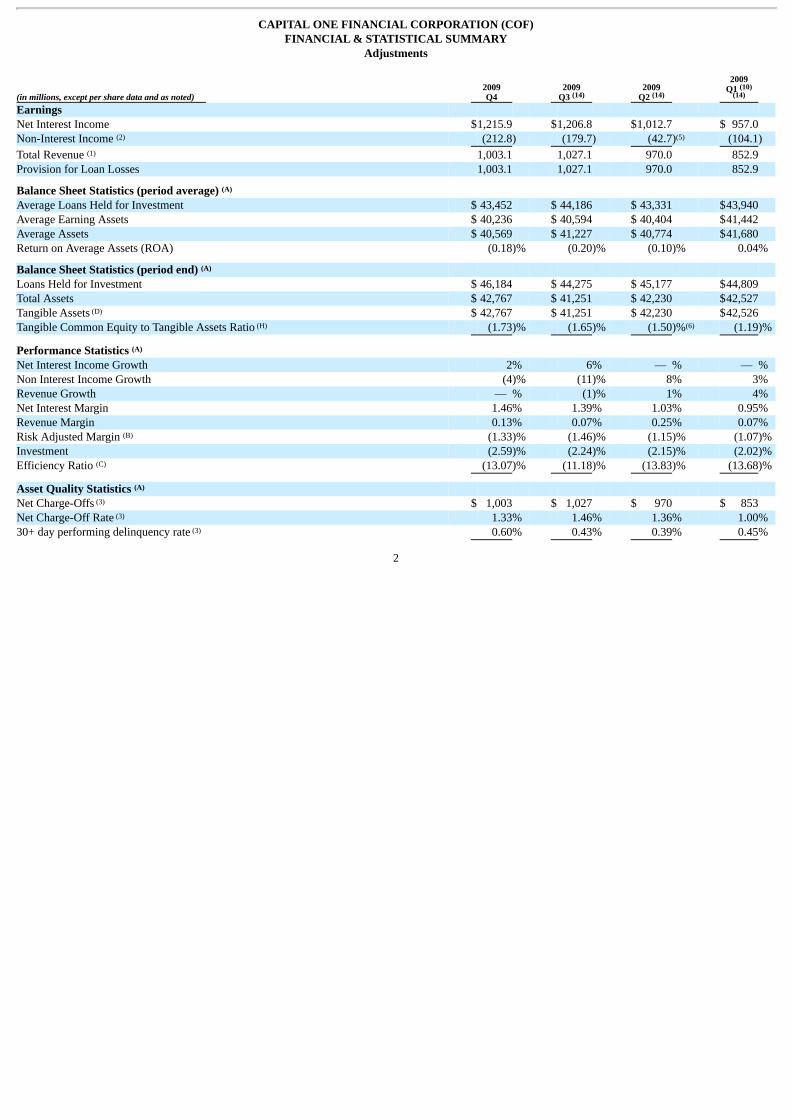
CAPITAL ONE FINANCIAL CORPORATION (COF)FINANCIAL & STATISTICAL SUMMARY
Adjustments
(in millions, except per share data and as noted) 2009Q4
2009Q3
2009Q2
2009Q1
Earnings Net Interest Income $1,215.9 $1,206.8 $1,012.7 $ 957.0 Non-Interest Income (212.8) (179.7) (42.7) (104.1)
Total Revenue 1,003.1 1,027.1 970.0 852.9 Provision for Loan Losses 1,003.1 1,027.1 970.0 852.9
Balance Sheet Statistics (period average) Average Loans Held for Investment $ 43,452 $ 44,186 $ 43,331 $43,940 Average Earning Assets $ 40,236 $ 40,594 $ 40,404 $41,442 Average Assets $ 40,569 $ 41,227 $ 40,774 $41,680 Return on Average Assets (ROA) (0.18)% (0.20)% (0.10)% 0.04%
Balance Sheet Statistics (period end) Loans Held for Investment $ 46,184 $ 44,275 $ 45,177 $44,809 Total Assets $ 42,767 $ 41,251 $ 42,230 $42,527 Tangible Assets $ 42,767 $ 41,251 $ 42,230 $42,526 Tangible Common Equity to Tangible Assets Ratio (1.73)% (1.65)% (1.50)% (1.19)%
Performance Statistics Net Interest Income Growth 2% 6% — % — % Non Interest Income Growth (4)% (11)% 8% 3% Revenue Growth — % (1)% 1% 4% Net Interest Margin 1.46% 1.39% 1.03% 0.95% Revenue Margin 0.13% 0.07% 0.25% 0.07% Risk Adjusted Margin (1.33)% (1.46)% (1.15)% (1.07)% Investment (2.59)% (2.24)% (2.15)% (2.02)% Efficiency Ratio (13.07)% (11.18)% (13.83)% (13.68)%
Asset Quality Statistics Net Charge-Offs $ 1,003 $ 1,027 $ 970 $ 853 Net Charge-Off Rate 1.33% 1.46% 1.36% 1.00% 30+ day performing delinquency rate 0.60% 0.43% 0.39% 0.45%
2
(14) (14)(10)
(14)
(2) (5)
(1)
(A)
(A)
(D)
(H) (6)
(A)
(B)
(C)
(A)
(3)
(3)
(3)
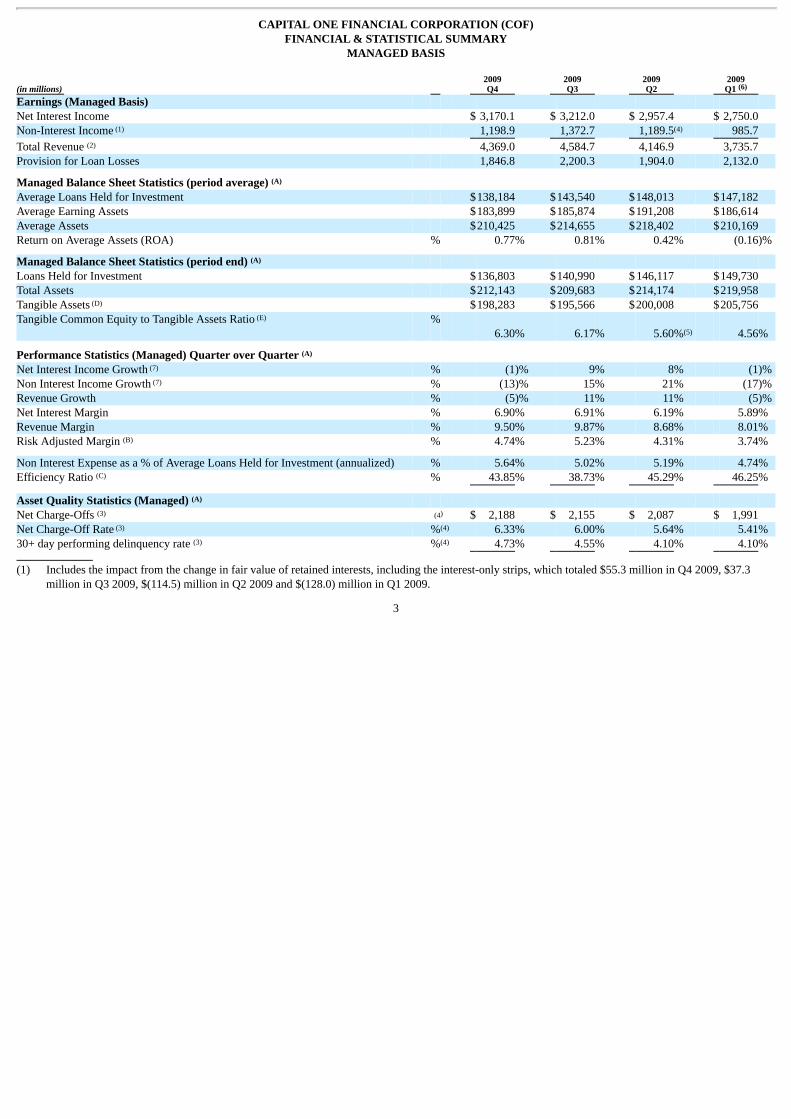
CAPITAL ONE FINANCIAL CORPORATION (COF)FINANCIAL & STATISTICAL SUMMARY
MANAGED BASIS
(in millions) 2009Q4
2009Q3
2009Q2
2009Q1
Earnings (Managed Basis) Net Interest Income $ 3,170.1 $ 3,212.0 $ 2,957.4 $ 2,750.0 Non-Interest Income 1,198.9 1,372.7 1,189.5 985.7
Total Revenue 4,369.0 4,584.7 4,146.9 3,735.7 Provision for Loan Losses 1,846.8 2,200.3 1,904.0 2,132.0
Managed Balance Sheet Statistics (period average) Average Loans Held for Investment $138,184 $143,540 $148,013 $147,182 Average Earning Assets $183,899 $185,874 $191,208 $186,614 Average Assets $210,425 $214,655 $218,402 $210,169 Return on Average Assets (ROA) % 0.77% 0.81% 0.42% (0.16)%
Managed Balance Sheet Statistics (period end) Loans Held for Investment $136,803 $140,990 $ 146,117 $149,730 Total Assets $212,143 $209,683 $214,174 $219,958 Tangible Assets $198,283 $195,566 $200,008 $205,756 Tangible Common Equity to Tangible Assets Ratio
% 6.30% 6.17% 5.60% 4.56%
Performance Statistics (Managed) Quarter over Quarter Net Interest Income Growth % (1)% 9% 8% (1)% Non Interest Income Growth % (13)% 15% 21% (17)% Revenue Growth % (5)% 11% 11% (5)% Net Interest Margin % 6.90% 6.91% 6.19% 5.89% Revenue Margin % 9.50% 9.87% 8.68% 8.01% Risk Adjusted Margin % 4.74% 5.23% 4.31% 3.74%
Non Interest Expense as a % of Average Loans Held for Investment (annualized) % 5.64% 5.02% 5.19% 4.74% Efficiency Ratio % 43.85% 38.73% 45.29% 46.25%
Asset Quality Statistics (Managed) Net Charge-Offs $ 2,188 $ 2,155 $ 2,087 $ 1,991 Net Charge-Off Rate % 6.33% 6.00% 5.64% 5.41% 30+ day performing delinquency rate % 4.73% 4.55% 4.10% 4.10%
(1) Includes the impact from the change in fair value of retained interests, including the interest-only strips, which totaled $55.3 million in Q4 2009, $37.3million in Q3 2009, $(114.5) million in Q2 2009 and $(128.0) million in Q1 2009.
3
(6)
(1) (4)
(2)
(A)
(A)
(D)
(E)
(5)
(A)
(7)
(7)
(B)
(C)
(A)
(3) (4)
(3) (4)
(3) (4)
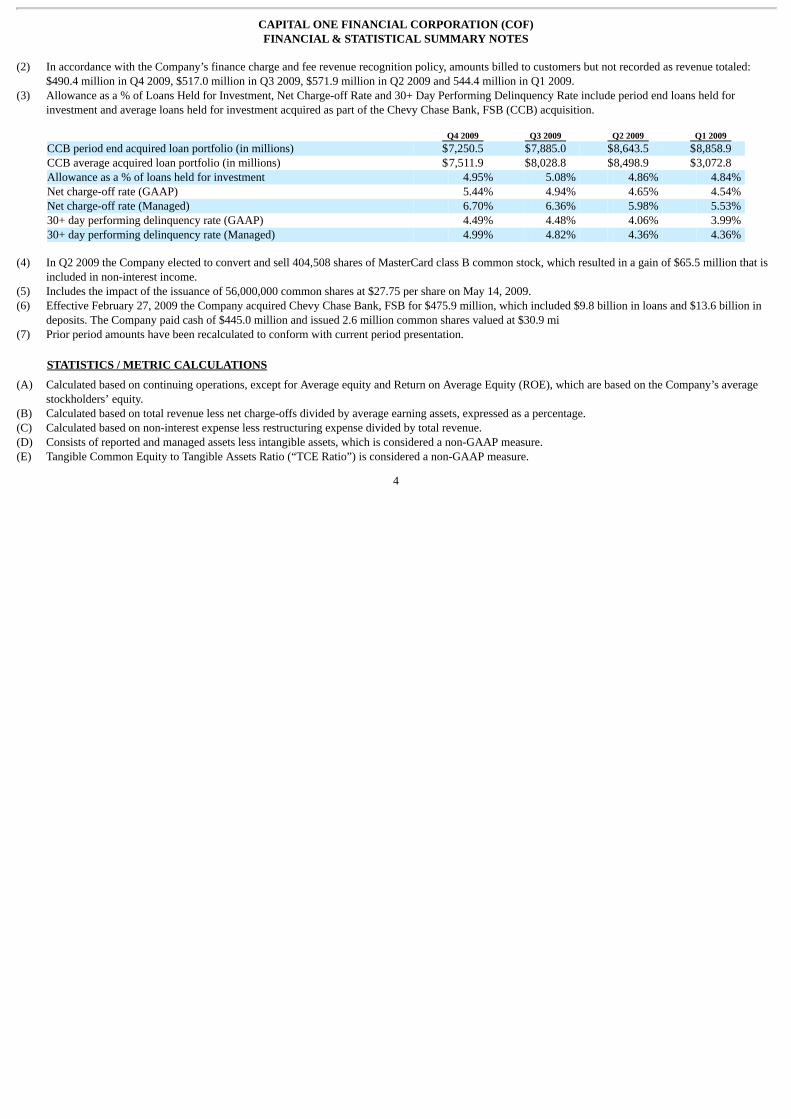
CAPITAL ONE FINANCIAL CORPORATION (COF)FINANCIAL & STATISTICAL SUMMARY NOTES
(2) In accordance with the Company’s finance charge and fee revenue recognition policy, amounts billed to customers but not recorded as revenue totaled:
$490.4 million in Q4 2009, $517.0 million in Q3 2009, $571.9 million in Q2 2009 and 544.4 million in Q1 2009.(3) Allowance as a % of Loans Held for Investment, Net Charge-off Rate and 30+ Day Performing Delinquency Rate include period end loans held for
investment and average loans held for investment acquired as part of the Chevy Chase Bank, FSB (CCB) acquisition.
Q4 2009 Q3 2009 Q2 2009 Q1 2009 CCB period end acquired loan portfolio (in millions) $7,250.5 $7,885.0 $8,643.5 $8,858.9 CCB average acquired loan portfolio (in millions) $7,511.9 $8,028.8 $8,498.9 $3,072.8 Allowance as a % of loans held for investment 4.95% 5.08% 4.86% 4.84% Net charge-off rate (GAAP) 5.44% 4.94% 4.65% 4.54% Net charge-off rate (Managed) 6.70% 6.36% 5.98% 5.53% 30+ day performing delinquency rate (GAAP) 4.49% 4.48% 4.06% 3.99% 30+ day performing delinquency rate (Managed) 4.99% 4.82% 4.36% 4.36%
(4) In Q2 2009 the Company elected to convert and sell 404,508 shares of MasterCard class B common stock, which resulted in a gain of $65.5 million that is
included in non-interest income.(5) Includes the impact of the issuance of 56,000,000 common shares at $27.75 per share on May 14, 2009.(6) Effective February 27, 2009 the Company acquired Chevy Chase Bank, FSB for $475.9 million, which included $9.8 billion in loans and $13.6 billion in
deposits. The Company paid cash of $445.0 million and issued 2.6 million common shares valued at $30.9 mi(7) Prior period amounts have been recalculated to conform with current period presentation.
STATISTICS / METRIC CALCULATIONS
(A) Calculated based on continuing operations, except for Average equity and Return on Average Equity (ROE), which are based on the Company’s averagestockholders’ equity.
(B) Calculated based on total revenue less net charge-offs divided by average earning assets, expressed as a percentage.(C) Calculated based on non-interest expense less restructuring expense divided by total revenue.(D) Consists of reported and managed assets less intangible assets, which is considered a non-GAAP measure.(E) Tangible Common Equity to Tangible Assets Ratio (“TCE Ratio”) is considered a non-GAAP measure.
4
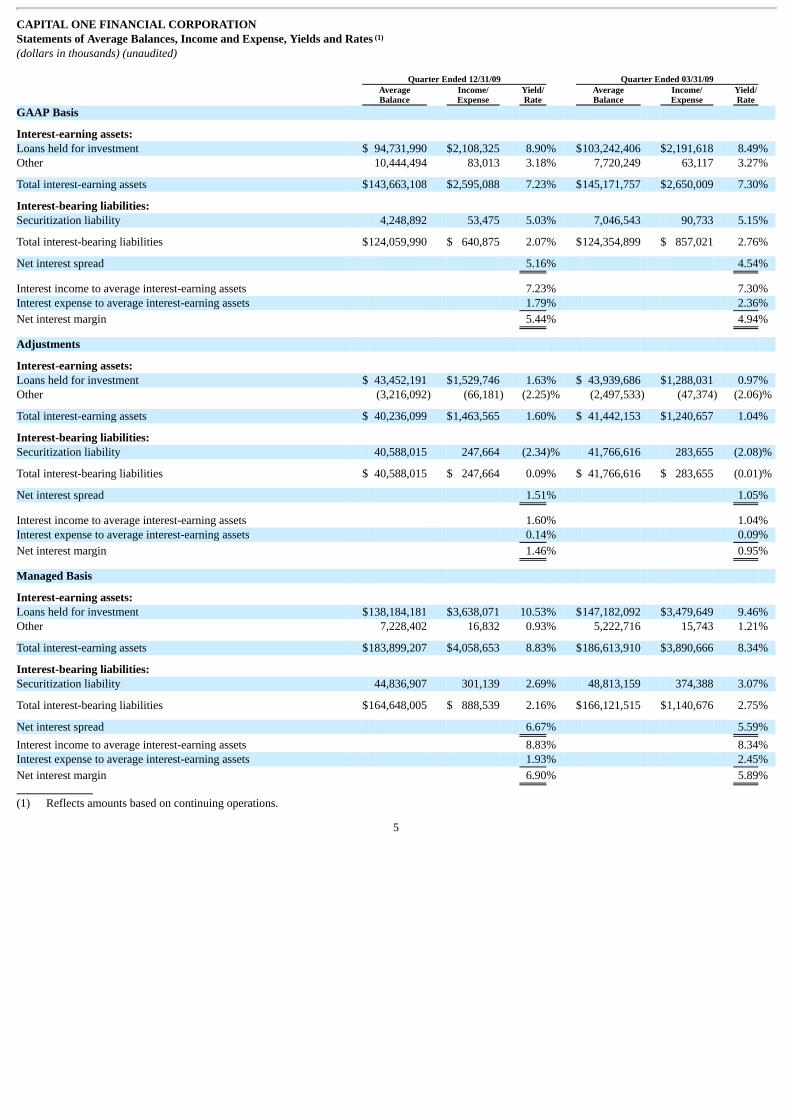
CAPITAL ONE FINANCIAL CORPORATIONStatements of Average Balances, Income and Expense, Yields and Rates(dollars in thousands) (unaudited) Quarter Ended 12/31/09 Quarter Ended 03/31/09
AverageBalance
Income/Expense
Yield/Rate
AverageBalance
Income/Expense
Yield/Rate
GAAP Basis
Interest-earning assets: Loans held for investment $ 94,731,990 $2,108,325 8.90% $103,242,406 $2,191,618 8.49% Other 10,444,494 83,013 3.18% 7,720,249 63,117 3.27%
Total interest-earning assets $143,663,108 $2,595,088 7.23% $145,171,757 $2,650,009 7.30%
Interest-bearing liabilities: Securitization liability 4,248,892 53,475 5.03% 7,046,543 90,733 5.15%
Total interest-bearing liabilities $124,059,990 $ 640,875 2.07% $124,354,899 $ 857,021 2.76%
Net interest spread 5.16% 4.54%
Interest income to average interest-earning assets 7.23% 7.30% Interest expense to average interest-earning assets 1.79% 2.36%
Net interest margin 5.44% 4.94%
Adjustments
Interest-earning assets: Loans held for investment $ 43,452,191 $1,529,746 1.63% $ 43,939,686 $1,288,031 0.97% Other (3,216,092) (66,181) (2.25)% (2,497,533) (47,374) (2.06)%
Total interest-earning assets $ 40,236,099 $1,463,565 1.60% $ 41,442,153 $1,240,657 1.04%
Interest-bearing liabilities: Securitization liability 40,588,015 247,664 (2.34)% 41,766,616 283,655 (2.08)%
Total interest-bearing liabilities $ 40,588,015 $ 247,664 0.09% $ 41,766,616 $ 283,655 (0.01)%
Net interest spread 1.51% 1.05%
Interest income to average interest-earning assets 1.60% 1.04% Interest expense to average interest-earning assets 0.14% 0.09%
Net interest margin 1.46% 0.95%
Managed Basis
Interest-earning assets: Loans held for investment $138,184,181 $3,638,071 10.53% $147,182,092 $3,479,649 9.46% Other 7,228,402 16,832 0.93% 5,222,716 15,743 1.21%
Total interest-earning assets $183,899,207 $4,058,653 8.83% $186,613,910 $3,890,666 8.34%
Interest-bearing liabilities: Securitization liability 44,836,907 301,139 2.69% 48,813,159 374,388 3.07%
Total interest-bearing liabilities $164,648,005 $ 888,539 2.16% $166,121,515 $1,140,676 2.75%
Net interest spread 6.67% 5.59%
Interest income to average interest-earning assets 8.83% 8.34% Interest expense to average interest-earning assets 1.93% 2.45%
Net interest margin 6.90% 5.89%
(1) Reflects amounts based on continuing operations.
5
(1)
Related Documents