CAPITAL MARKETS DAY

Welcome message from author
This document is posted to help you gain knowledge. Please leave a comment to let me know what you think about it! Share it to your friends and learn new things together.
Transcript

CAPITAL MARKETS DAY

Johan MenckelCEO
○ 1,600 employees
○ Listed on Nasdaq Stockholm
○ Net sales of SEK 11 billion
○ Production capacity of 420,000metric tonnes
○ Adjusted operating profit of SEK 933 million
Global market share in rolled products for brazed aluminium heat exchangers
20%
Gränges today
4

Gränges has a strong track record of growth
Sales volume (ktonnes)
0
50
100
150
200
250
300
350
400
2005 2006 2007 2008 2009 2010 2011 2012 2013 2014 2015 2016 2017
Europe
Asia
Americas
Americas acquired
5
6
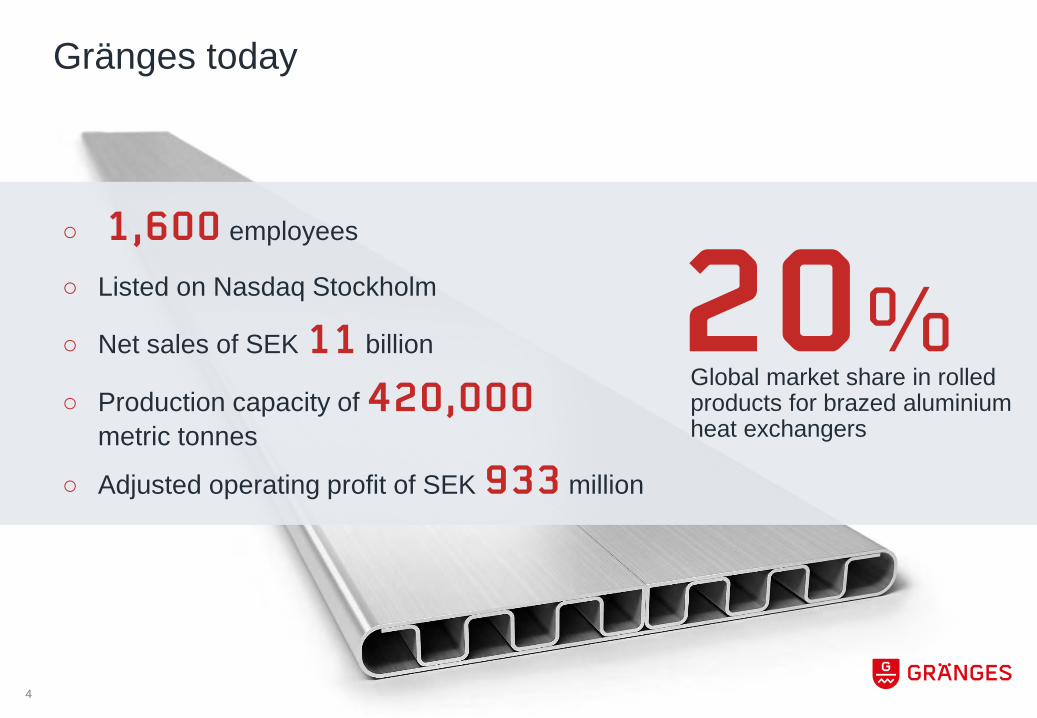
Gränges’ share price has outperformed the market since the listing in October 2014
60
80
100
120
140
160
180
200
220
240
2015 2016 2017 2018
Index
Gränges
OMX Stockholm

Today’s agenda
Time Program Speaker
08:00 Registration and coffee
08:30 Update on goals and strategy Johan Menckel, CEO
Drive growth through innovation Kent Schölin, SVP Research & Innovation
Electric vehicles Torbjörn Sternsjö, SVP Technology & Business Development
09:50 Q&A Session
10:10 Coffee break
7

Today’s agenda
Time Program Speaker
10:30 Create value from sustainability Sofia Hedevåg, VP Sustainability
Gränges Asia Colin Xu, President Asia
Gränges Americas Patrick Lawlor, President Americas
Financial update Oskar Hellström, CFO
12:15 Q&A Session
12:25 Closing remarks and summary Johan Menckel, CEO
12:30 Lunch
8
UPDATE ON GOALS AND STRATEGYAchievements since launch and strategic direction for the future
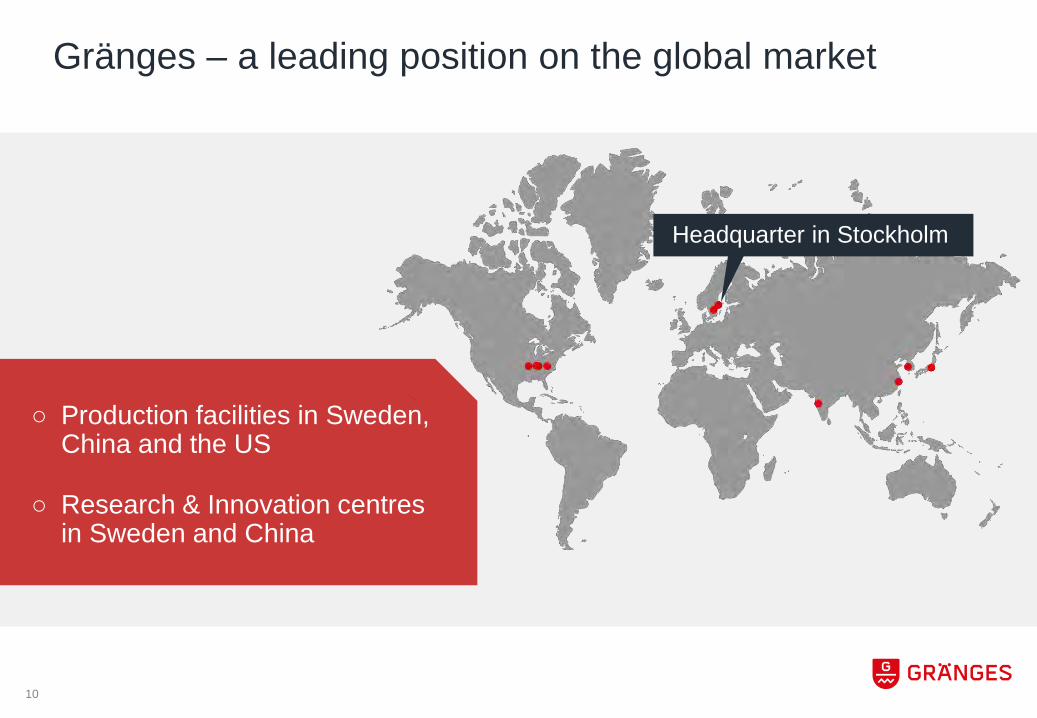
Gränges – a leading position on the global market
○ Production facilities in Sweden, China and the US
○ Research & Innovation centres in Sweden and China
10
Headquarter in Stockholm
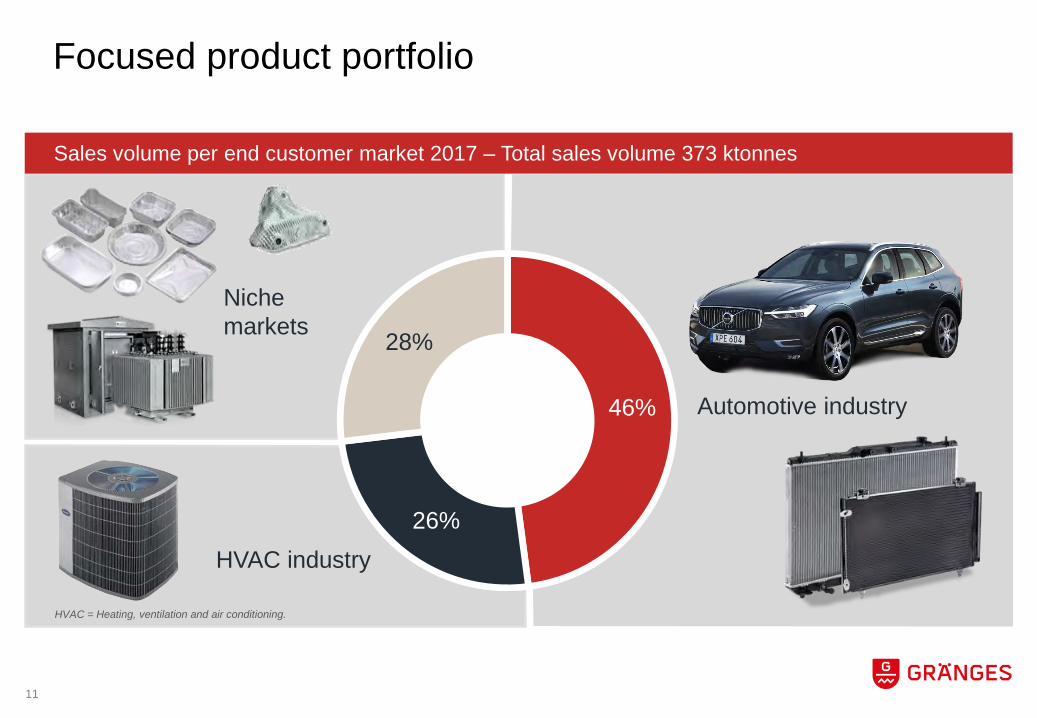
Focused product portfolio
46%
26%
28%
HVAC industry
Niche markets
Automotive industry
HVAC = Heating, ventilation and air conditioning.
Sales volume per end customer market 2017 – Total sales volume 373 ktonnes
11
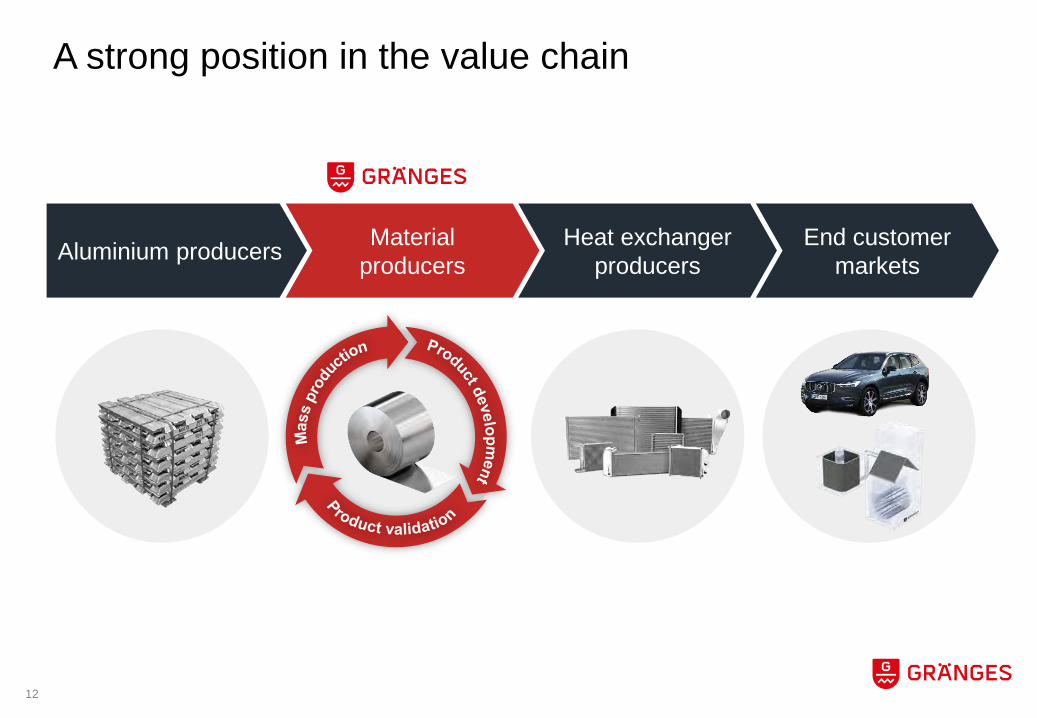
A strong position in the value chain
Aluminium producers Material producers
Heat exchanger producers
End customer markets
12

A modern car can have more thanten different heat exchangers
○ Active chiller(for battery cooling)
○ Evaporator AC○ Compartment heater
○ Passive chiller(for battery cooling)
○ Hybrid system radiator
○ Transmission oil cooler
○ Charge air cooler○ Condenser AC○ Engine radiator ○ Engine oil cooler
13
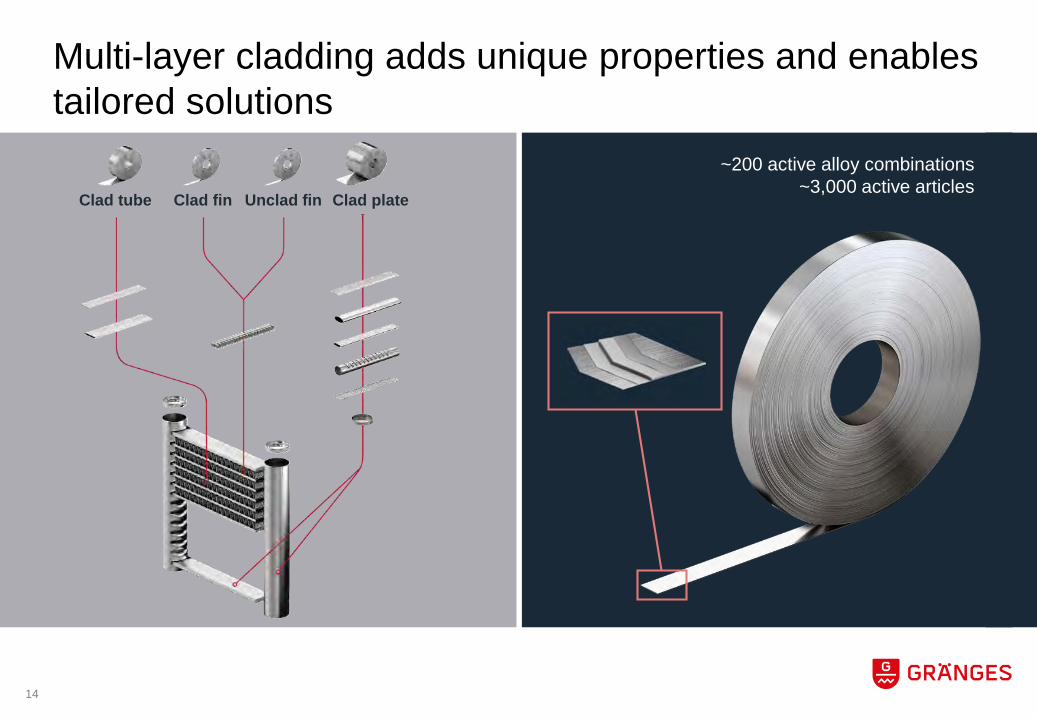
Multi-layer cladding adds unique properties and enables tailored solutions
~200 active alloy combinations~3,000 active articles
Clad tube Clad fin Unclad fin Clad plate
14
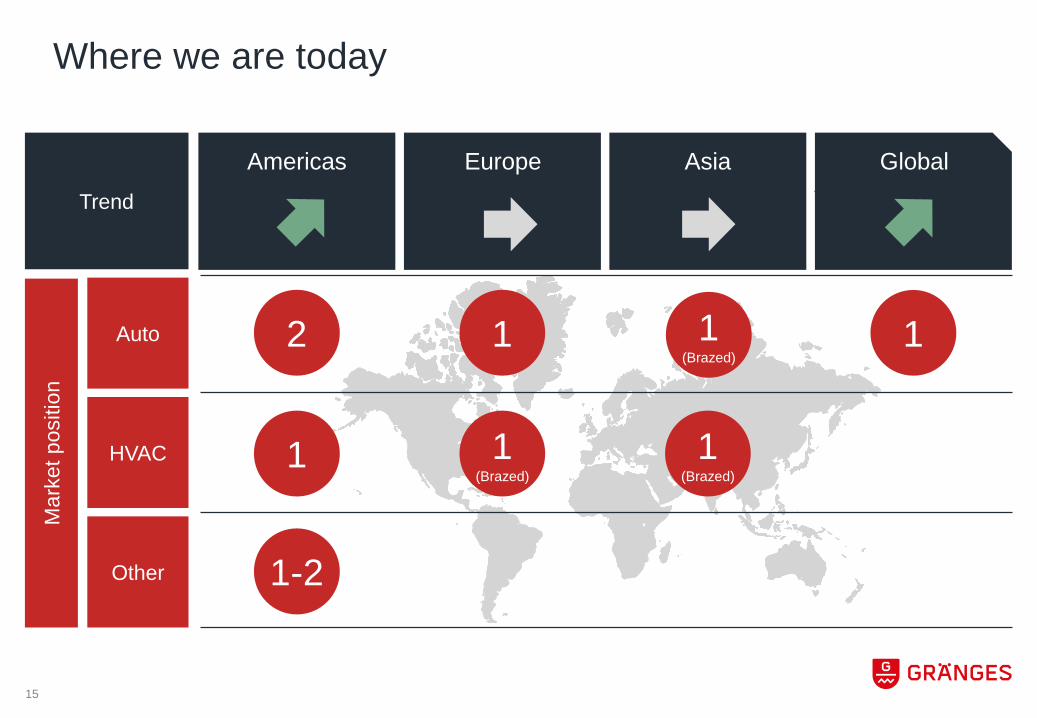
Where we are today
Americas Europe AsiaTrend
Auto
HVAC
Other
Mar
ket p
ositi
on
Global
2 1 1
1 1(Brazed)
1-2
1(Brazed)
1(Brazed)
15
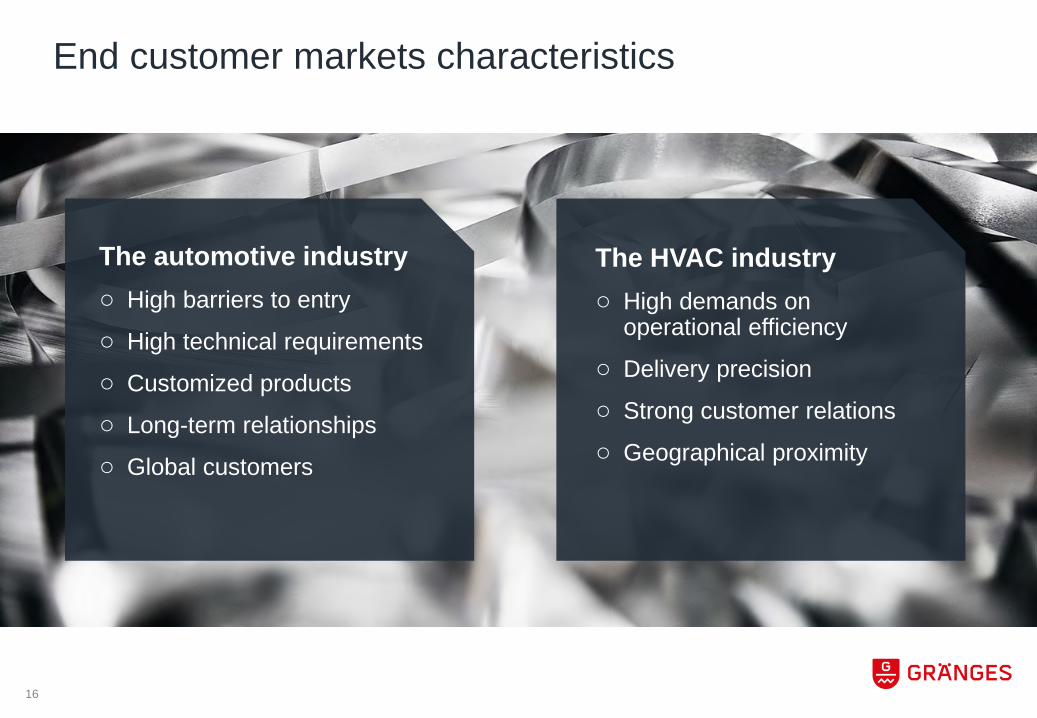
End customer markets characteristics
The automotive industry○ High barriers to entry
○ High technical requirements
○ Customized products
○ Long-term relationships
○ Global customers
The HVAC industry○ High demands on
operational efficiency
○ Delivery precision
○ Strong customer relations
○ Geographical proximity
16
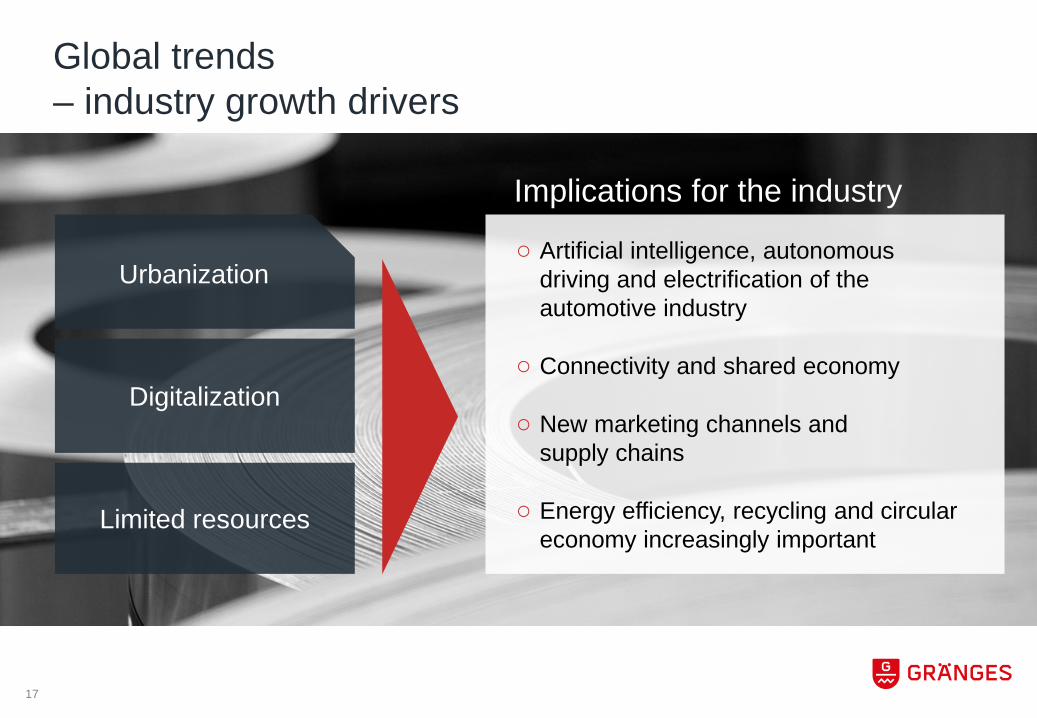
Global trends– industry growth drivers
Urbanization
Digitalization
Limited resources
○ Artificial intelligence, autonomous driving and electrification of the automotive industry
○ Connectivity and shared economy
○ New marketing channels and supply chains
○ Energy efficiency, recycling and circular economy increasingly important
Implications for the industry
17

Success factors
Operational excellence
Leading-edge technology
Attention to customer needs
18

VisionTo transform the world through innovative, aluminium engineering
19

Business concept
We support our customers with research and innovation, product development, and technical support during the product’s lifecycle.
Thereby, Gränges helps create smaller, lighter and more designable materials that increase economic efficiency and reduce environmental impact.
20
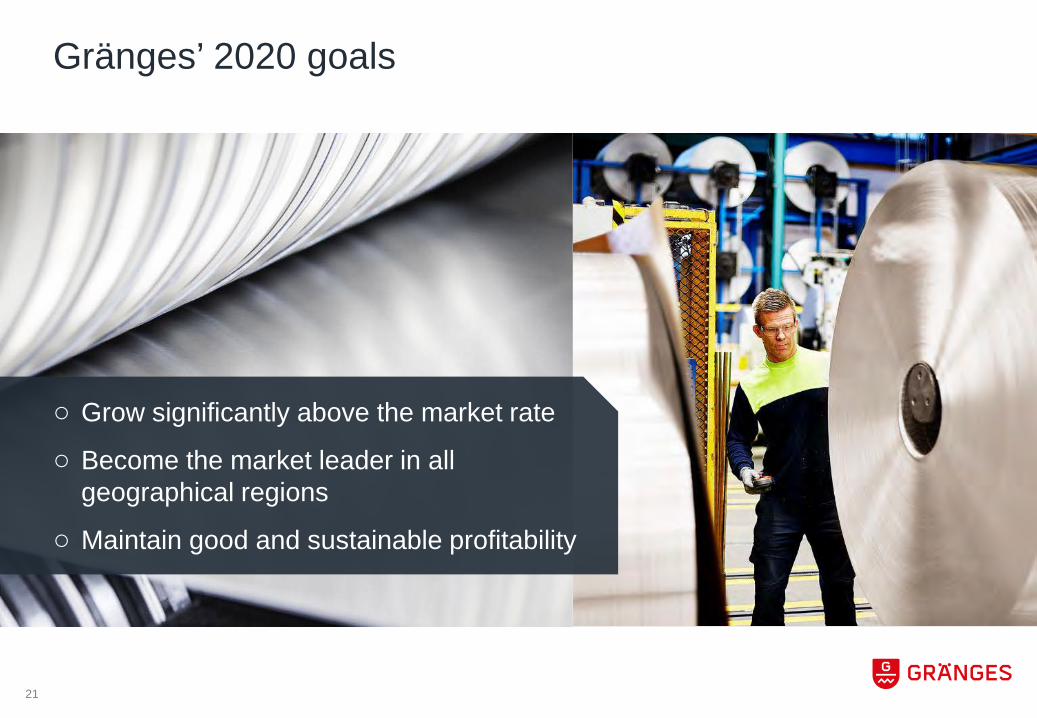
Gränges’ 2020 goals
○ Grow significantly above the market rate
○ Become the market leader in all geographical regions
○ Maintain good and sustainable profitability
21
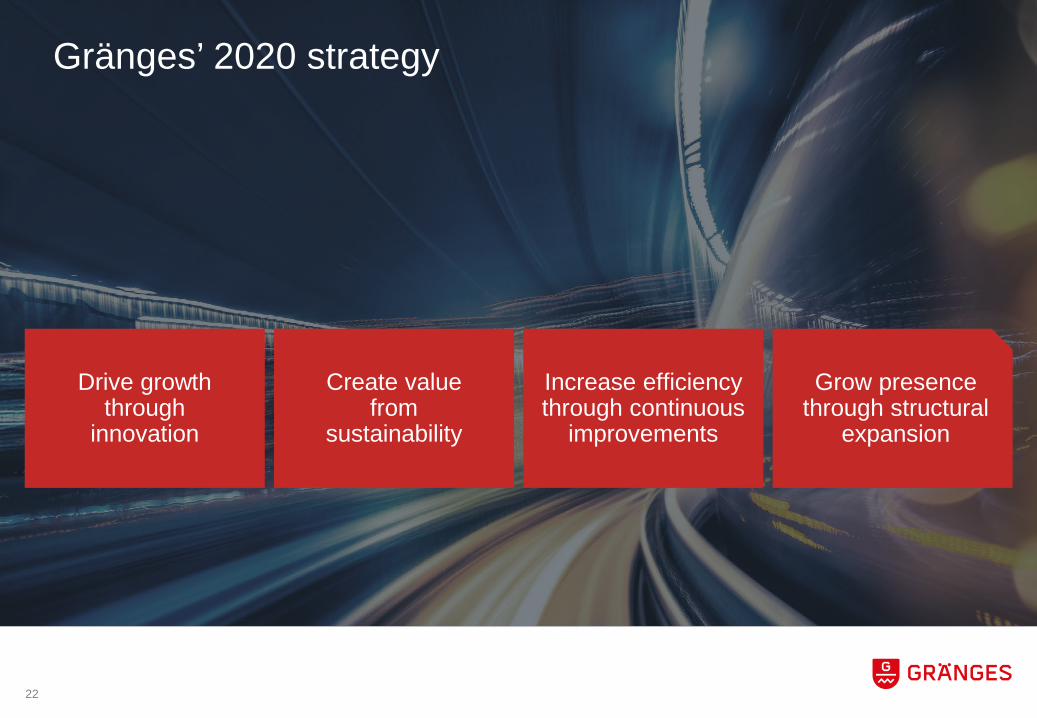
Gränges’ 2020 strategy
Drive growth through
innovation
Create value from
sustainability
Increase efficiencythrough continuous
improvements
Grow presencethrough structural
expansion
22
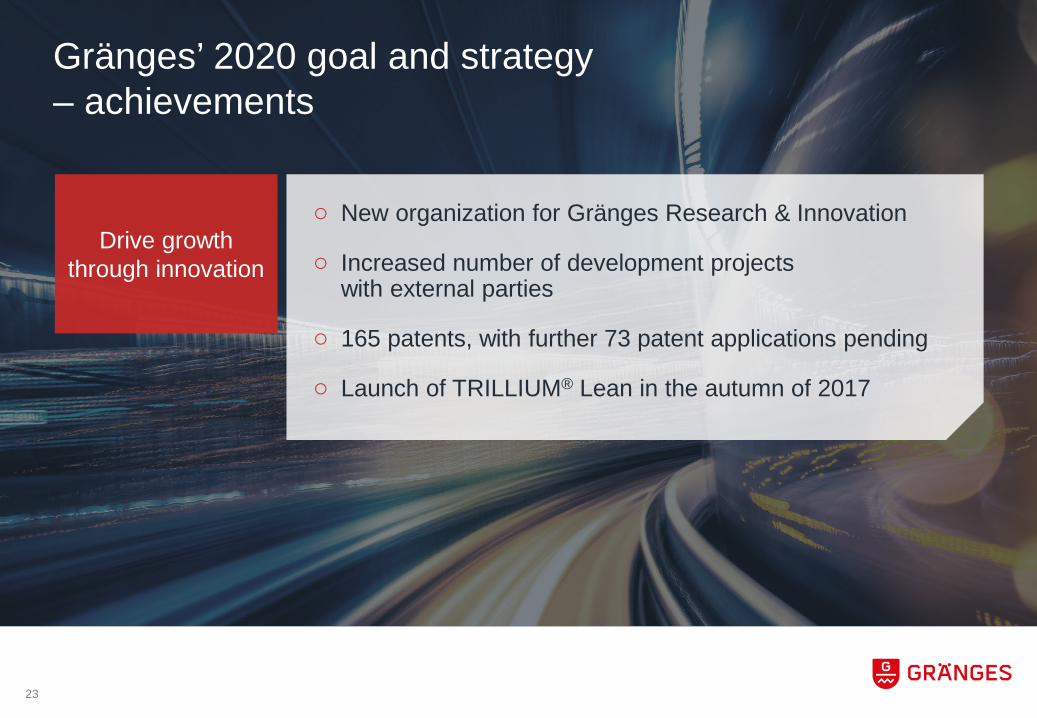
Gränges’ 2020 goal and strategy – achievements
Drive growth through innovation
○ New organization for Gränges Research & Innovation
○ Increased number of development projects with external parties
○ 165 patents, with further 73 patent applications pending
○ Launch of TRILLIUM® Lean in the autumn of 2017
23

Gränges’ 2020 goal and strategy – achievements
Create value from sustainability
○ A carbon footprint study was conducted to provide a baseline for reduced emissions
○ Increased focus on cross-audits to improve safety and share of best practice
○ Completed training in Gränges’ Code of Conduct
○ Updated the sustainability framework
24

Gränges’ 2020 goal and strategy – achievements
Increase efficiencythrough continuous
improvements
○ Increased capacity in the Americas by 5%
○ Improved quality and reduced number of claims by 25% has contributed to higher productivity
○ Reduced energy consumption by 2%
○ Increased share of internal recycled aluminium in production by 3%
25

Gränges’ 2020 goal and strategy – achievements
Grow presencethrough structural
expansion
○ Acquisition of Noranda’s downstream operations in the United States in 2016 – added nearly 200,000 tonnes in capacity and sales of SEK 4.7 billion yearly
○ Announced plans for expansion in Huntingdon (USA)
○ LOI signed with Mitsubishi Aluminum to establish a joint venture in North America for production of brazed heat exchanger material
○ Investment in spray-forming production to secure supply of TRILLIUM® billets
26
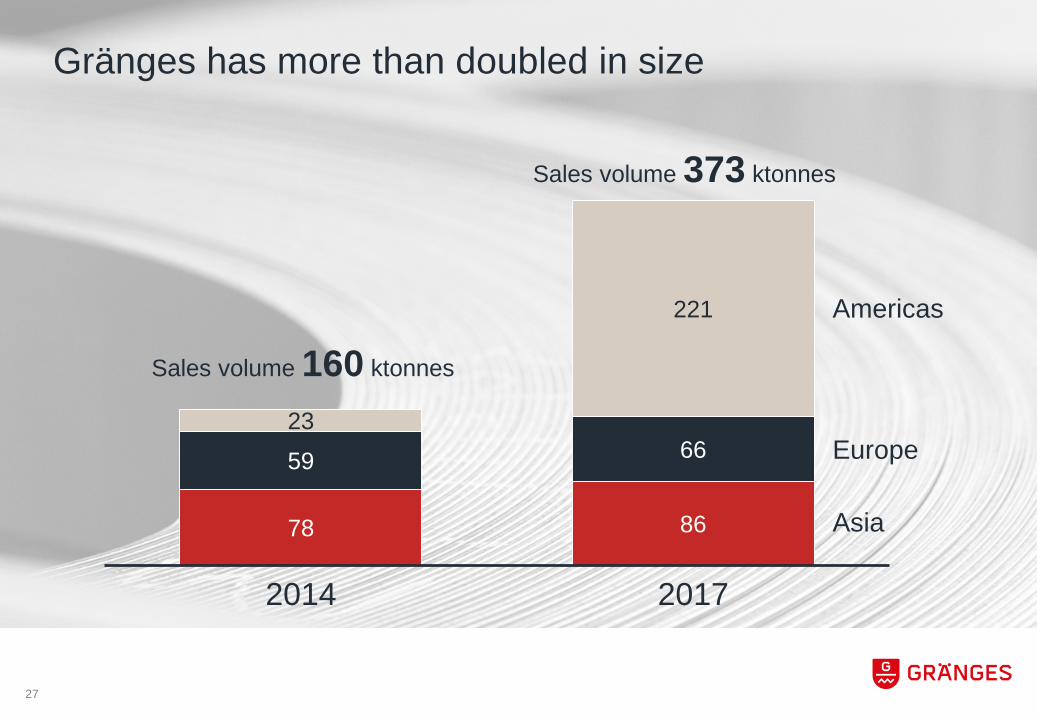
Gränges has more than doubled in size
Asia
Americas
Sales volume 373 ktonnes
78 86
59 6623
221
2014 2017
Europe
Sales volume 160 ktonnes
27
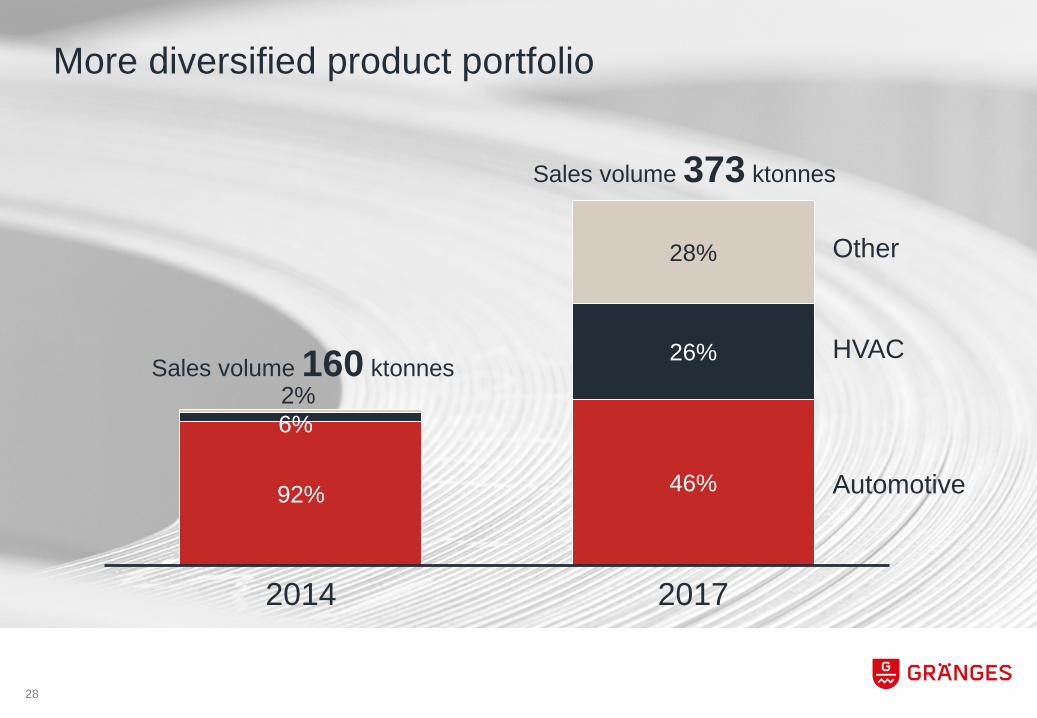
More diversified product portfolio
Sales volume 373 ktonnes
92% 46%
6%
26%
2%
28%
2014 2017
Automotive
HVAC
Other
Sales volume 160 ktonnes
28
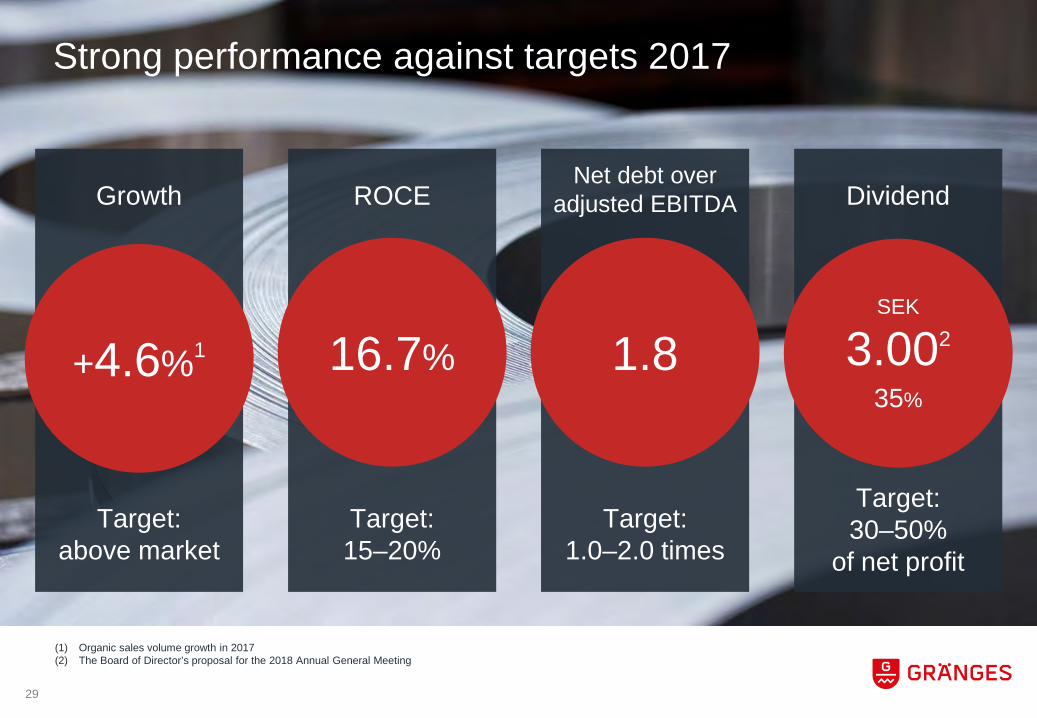
Strong performance against targets 2017
Target:above market
Growth
+4.6%1
Target:15–20%
ROCE
16.7%
Target:1.0–2.0 times
Net debt over adjusted EBITDA
1.8
Target:30–50%
of net profit
Dividend
SEK
3.002
35%
(1) Organic sales volume growth in 2017 (2) The Board of Director’s proposal for the 2018 Annual General Meeting
29
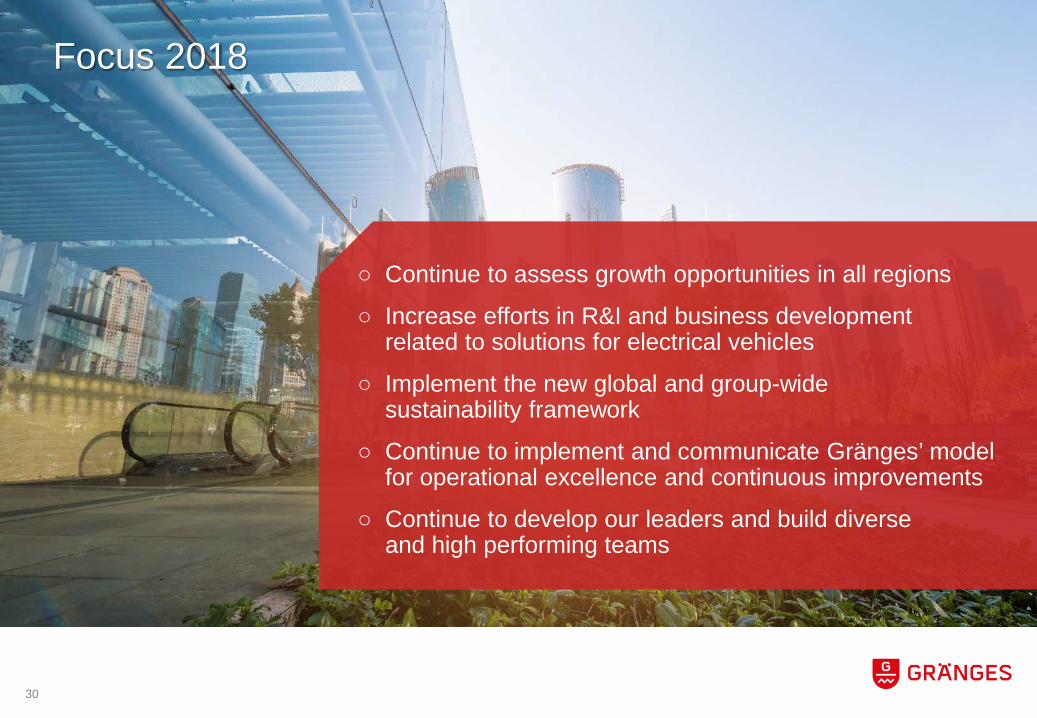
Focus 2018
○ Continue to assess growth opportunities in all regions
○ Increase efforts in R&I and business development related to solutions for electrical vehicles
○ Implement the new global and group-wide sustainability framework
○ Continue to implement and communicate Gränges’ model for operational excellence and continuous improvements
○ Continue to develop our leaders and build diverse and high performing teams
30
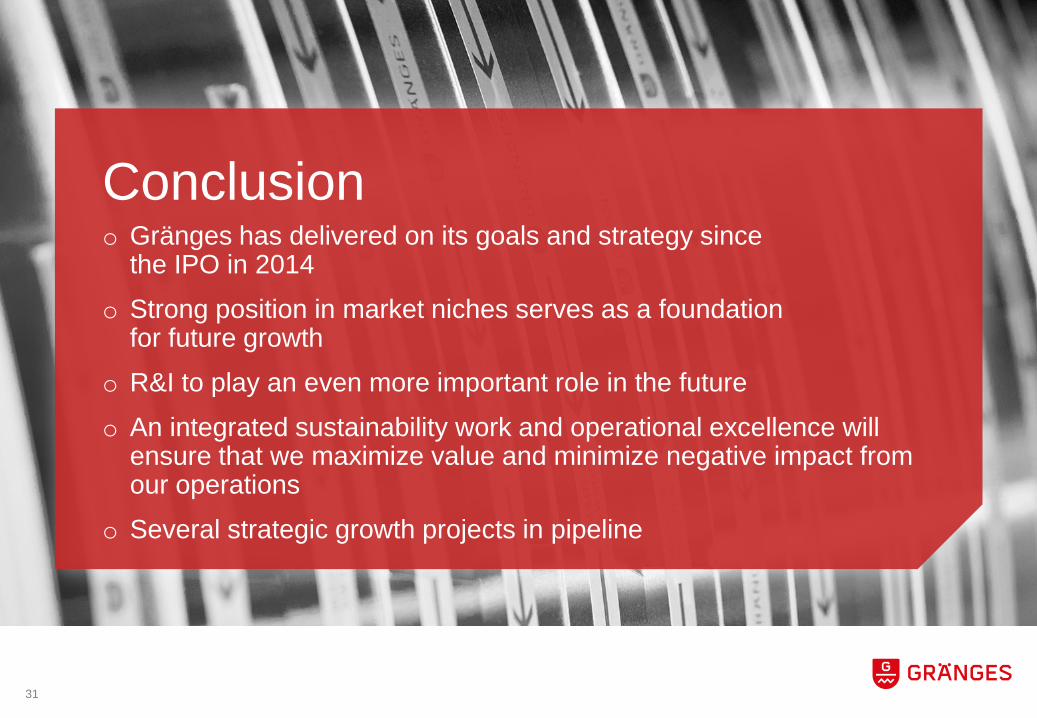
Conclusiono Gränges has delivered on its goals and strategy since
the IPO in 2014 o Strong position in market niches serves as a foundation
for future growtho R&I to play an even more important role in the futureo An integrated sustainability work and operational excellence will
ensure that we maximize value and minimize negative impact from our operations
o Several strategic growth projects in pipeline
31
DRIVE GROWTH THROUGH INNOVATION
Kent SchölinSVP Research & Innovation
33
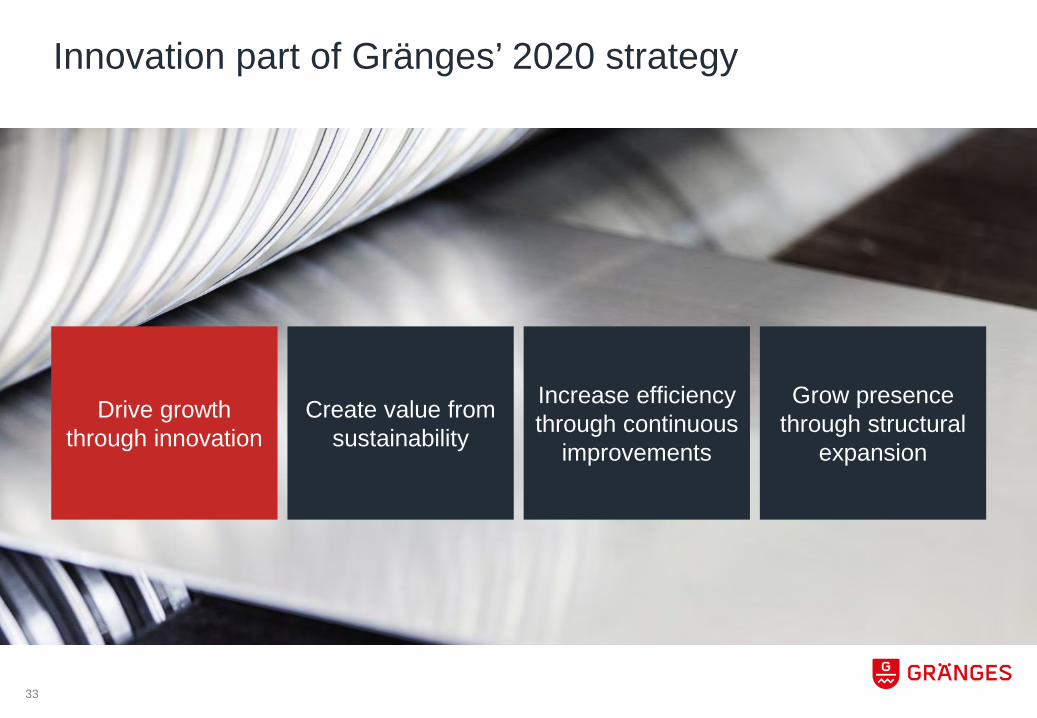
Innovation part of Gränges’ 2020 strategy
Drive growth through innovation
Create value from sustainability
Increase efficiencythrough continuous
improvements
Grow presencethrough structural
expansion
34
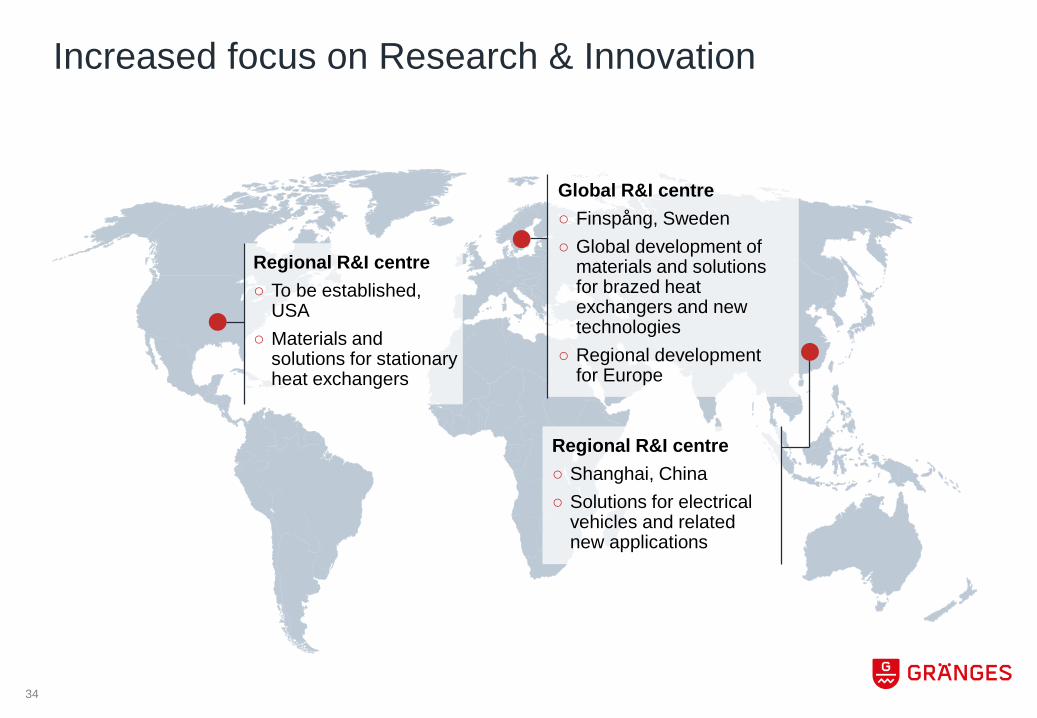
Increased focus on Research & Innovation
Regional R&I centre○ To be established,
USA○ Materials and
solutions for stationary heat exchangers
Global R&I centre○ Finspång, Sweden○ Global development of
materials and solutions for brazed heat exchangers and new technologies
○ Regional development for Europe
Regional R&I centre○ Shanghai, China○ Solutions for electrical
vehicles and related new applications
35
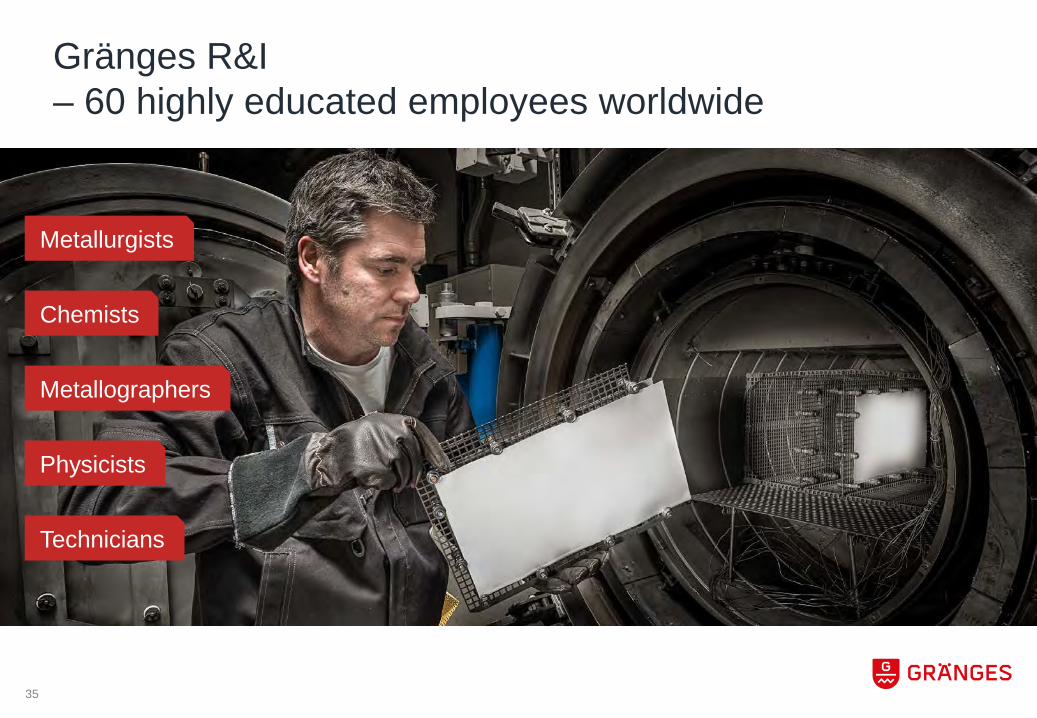
Gränges R&I – 60 highly educated employees worldwide
Metallurgists
Chemists
Metallographers
Physicists
Technicians
36
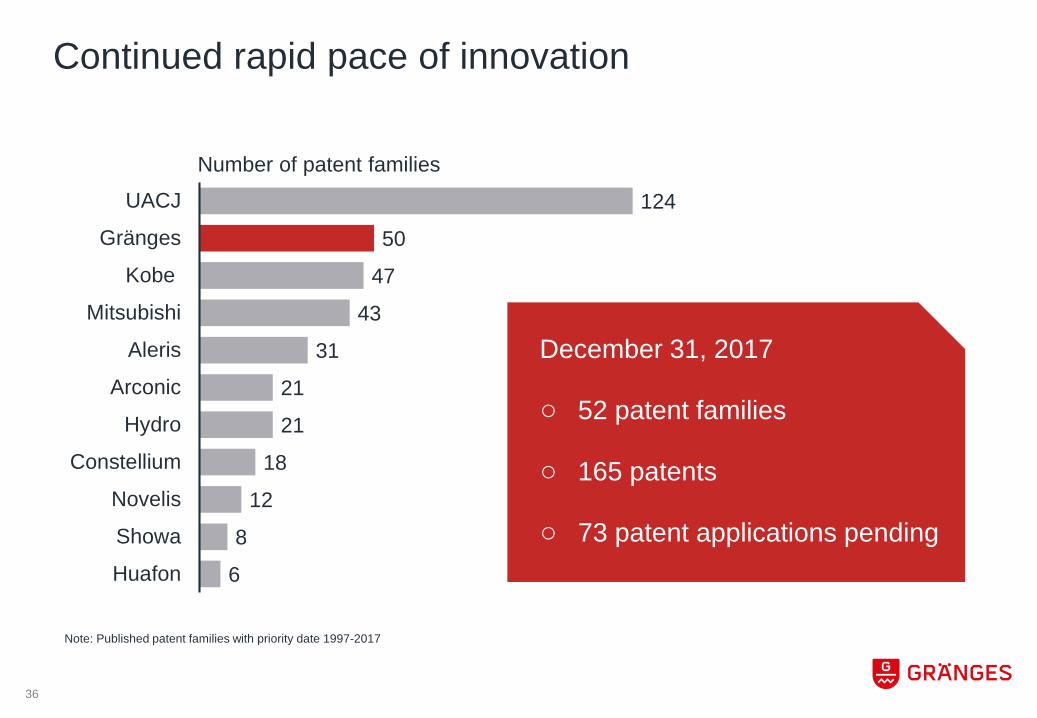
Continued rapid pace of innovation
6
8
12
18
21
21
31
43
47
50
124
Huafon
Showa
Novelis
Constellium
Hydro
Arconic
Aleris
Mitsubishi
Kobe
Gränges
UACJ
December 31, 2017
○ 52 patent families
○ 165 patents
○ 73 patent applications pending
Note: Published patent families with priority date 1997-2017
Number of patent families
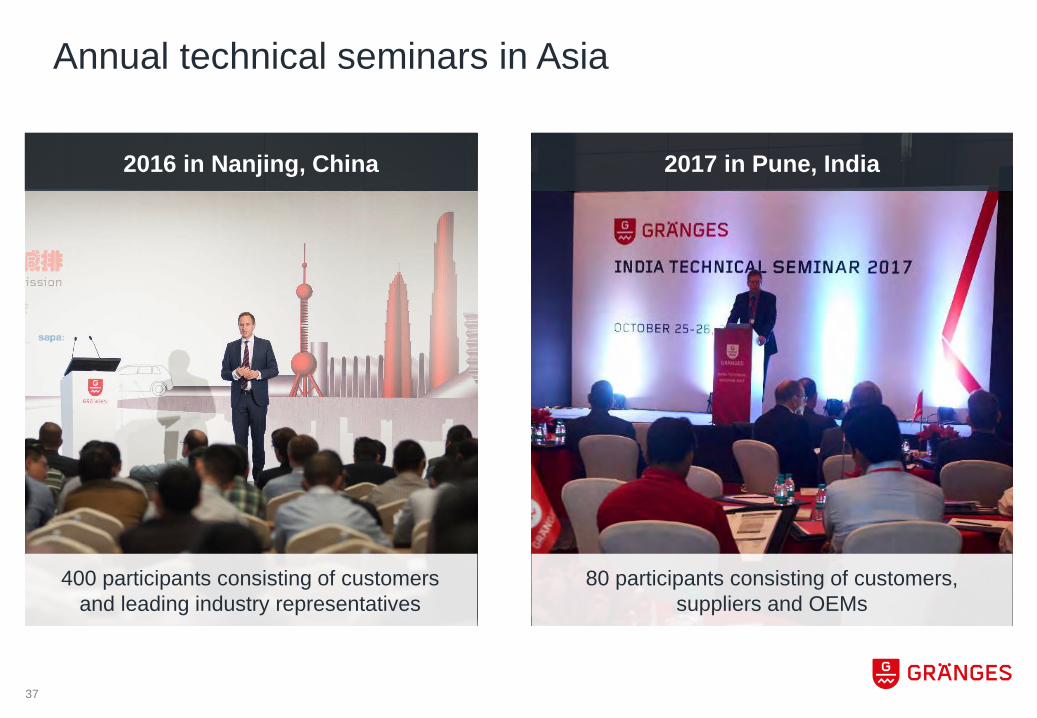
2016 in Nanjing, China
37
2017 in Pune, India
Annual technical seminars in Asia
400 participants consisting of customers and leading industry representatives
80 participants consisting of customers, suppliers and OEMs
38
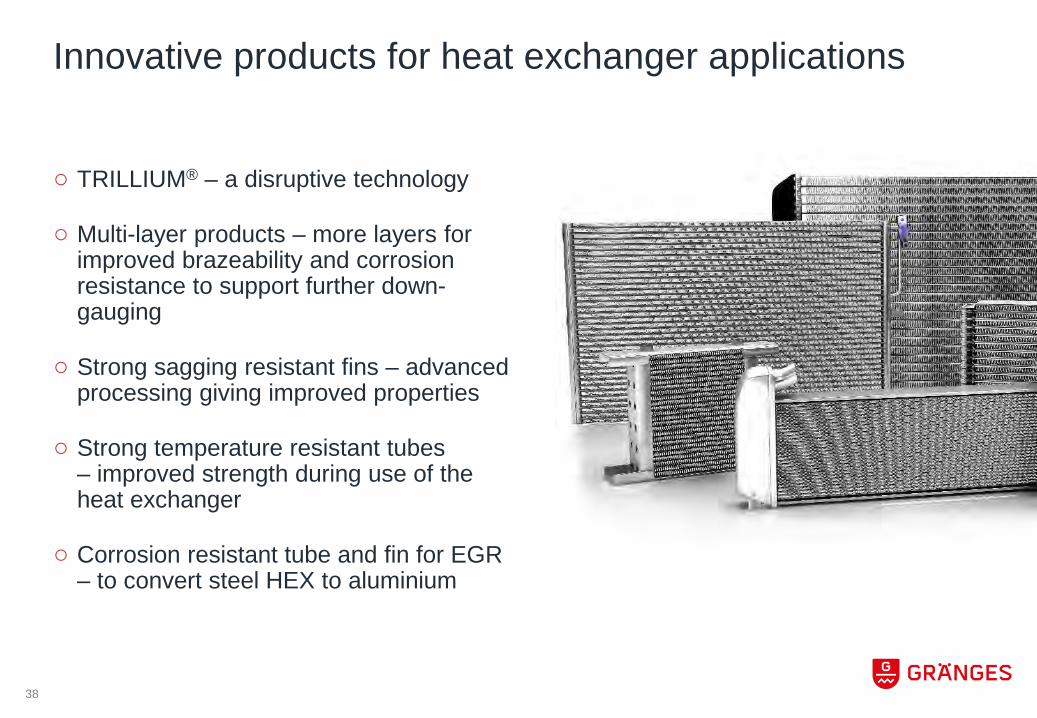
Innovative products for heat exchanger applications
○ TRILLIUM® – a disruptive technology
○ Multi-layer products – more layers for improved brazeability and corrosion resistance to support further down-gauging
○ Strong sagging resistant fins – advanced processing giving improved properties
○ Strong temperature resistant tubes – improved strength during use of the heat exchanger
○ Corrosion resistant tube and fin for EGR – to convert steel HEX to aluminium
39
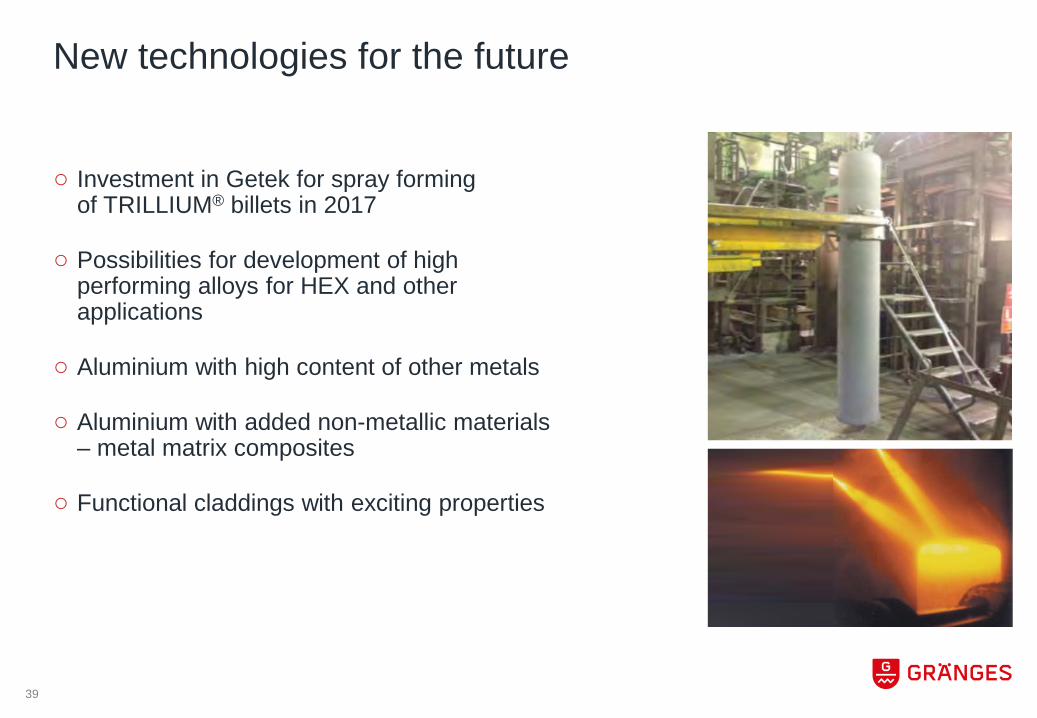
○ Investment in Getek for spray forming of TRILLIUM® billets in 2017
○ Possibilities for development of high performing alloys for HEX and other applications
○ Aluminium with high content of other metals
○ Aluminium with added non-metallic materials – metal matrix composites
○ Functional claddings with exciting properties
New technologies for the future

Video
40

TRILLIUM® Solid
TRILLIUM® Lean
Less work, more capacity
Flux containing braze metal
41
42
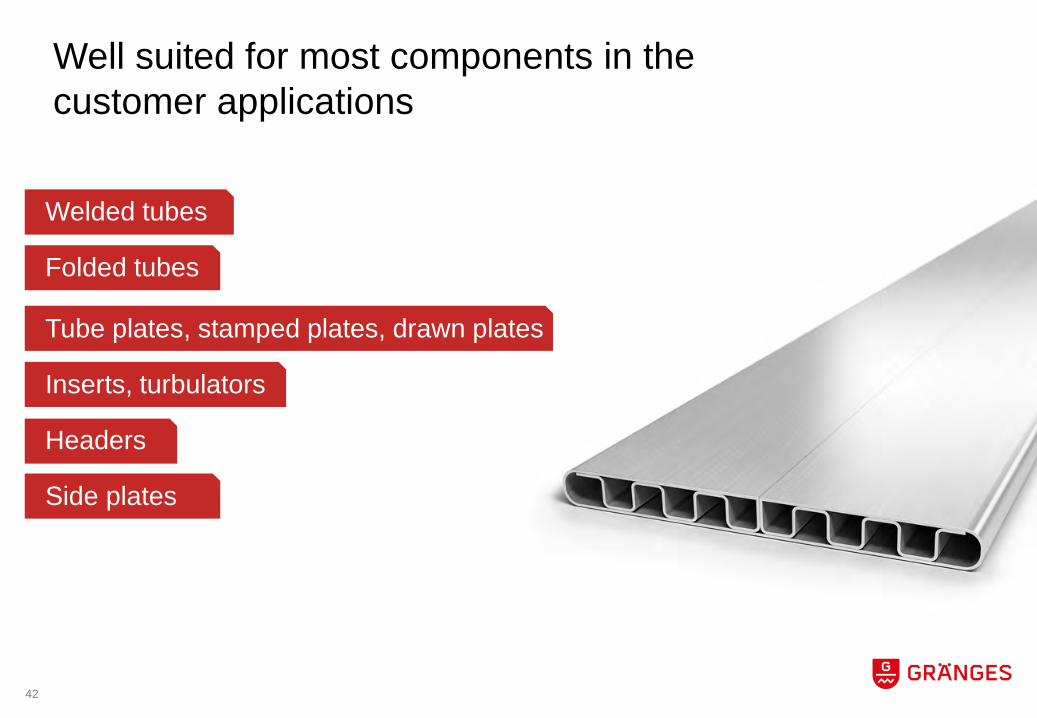
Well suited for most components in the customer applications
Welded tubes
Folded tubes
Tube plates, stamped plates, drawn plates
Inserts, turbulators
Headers
Side plates

Conventional brazing process
Degreasing
Fluxing
Drying
Brazing
43
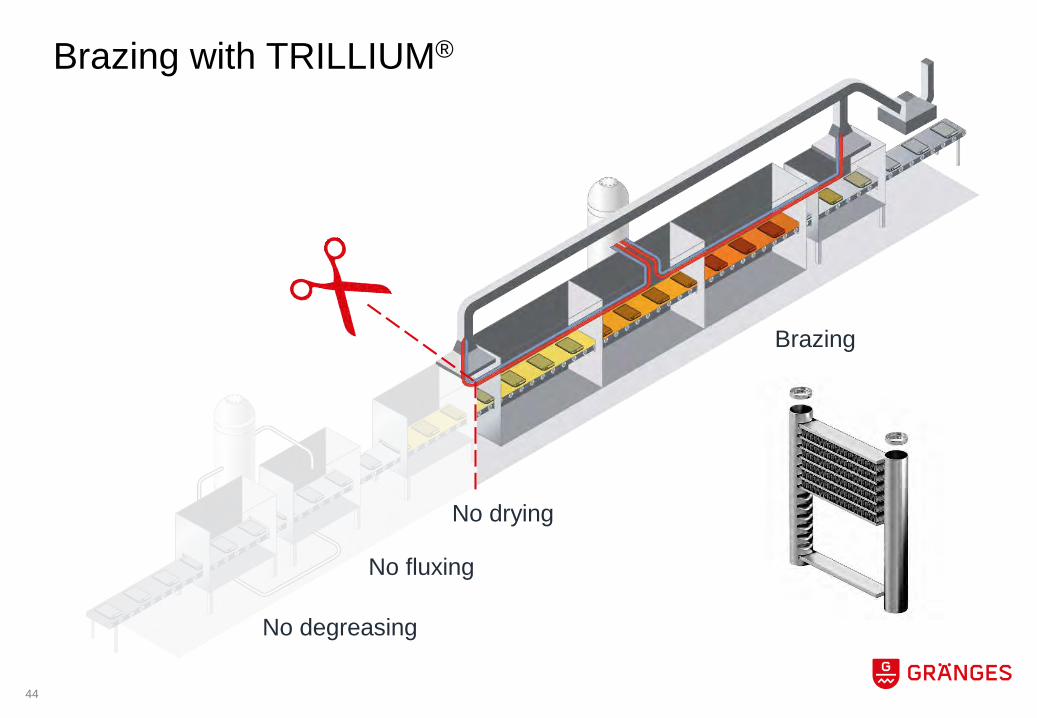
No degreasing
No fluxing
No drying
Brazing
Brazing with TRILLIUM®
44
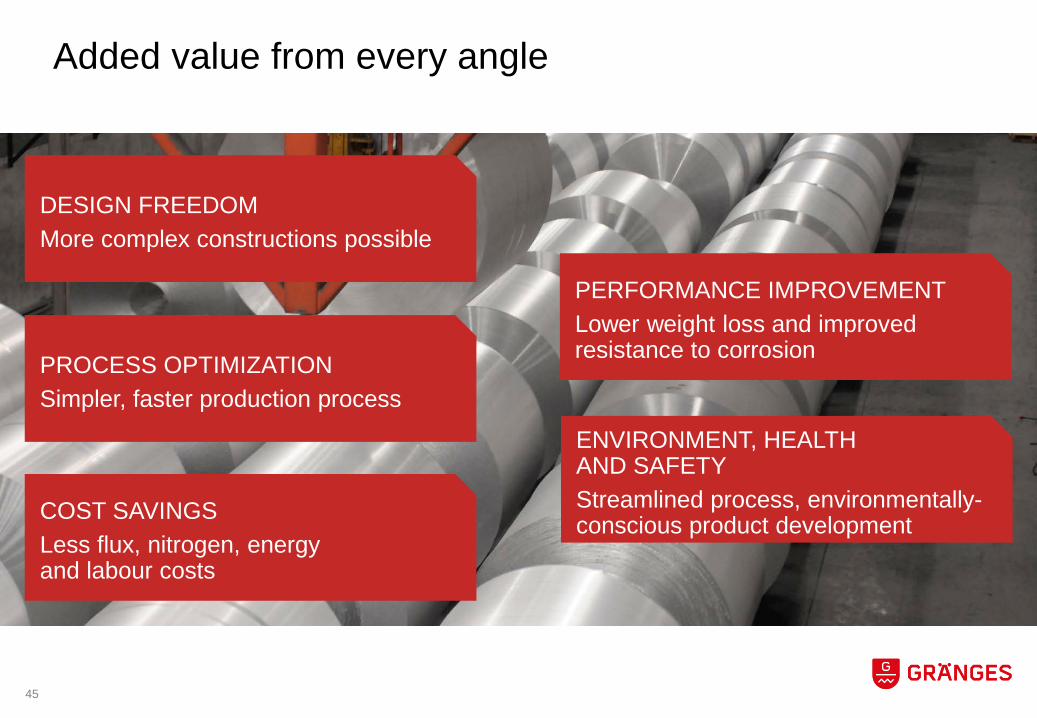
Added value from every angle
DESIGN FREEDOMMore complex constructions possible
PERFORMANCE IMPROVEMENTLower weight loss and improved resistance to corrosionPROCESS OPTIMIZATION
Simpler, faster production process
COST SAVINGSLess flux, nitrogen, energyand labour costs
ENVIRONMENT, HEALTH AND SAFETYStreamlined process, environmentally-conscious product development
45
46
Electrical vehicles
47
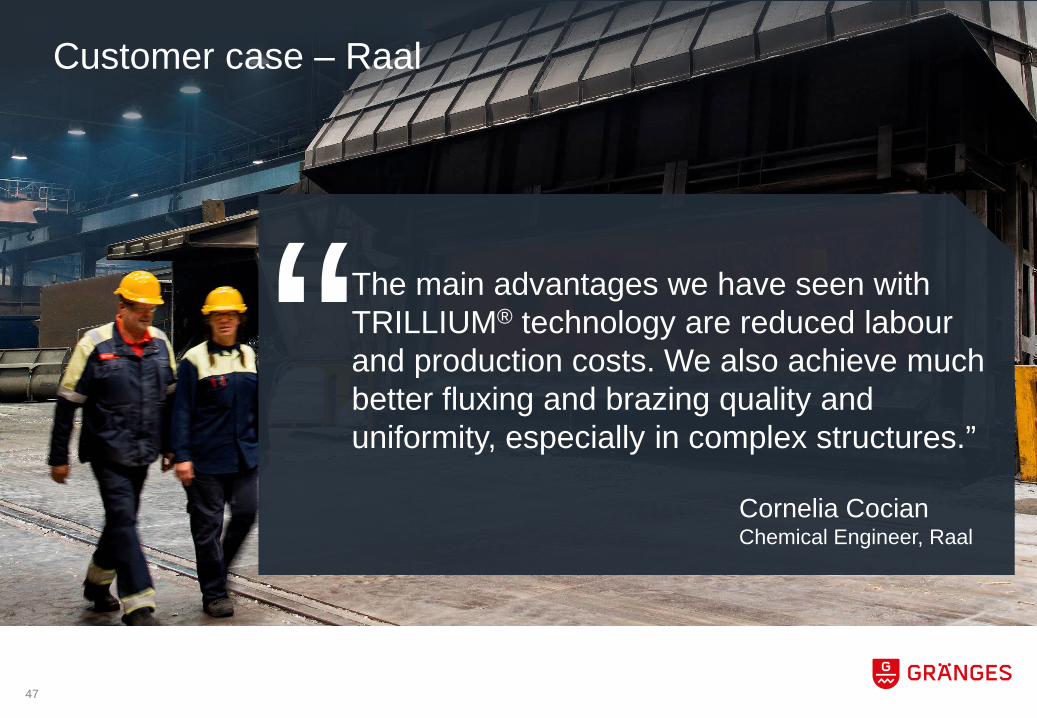
The main advantages we have seen with TRILLIUM® technology are reduced labourand production costs. We also achieve much better fluxing and brazing quality and uniformity, especially in complex structures.”
Cornelia CocianChemical Engineer, Raal
“Customer case – Raal
Conclusion○ Increase efforts in R&I○ Leading development in heat exchanger materials○ Large potential in other advanced aluminium
applications with spray forming investment○ Development in cooperation with customers
48
ELECTRIC VEHICLESTorbjörn SternsjöSVP Technology & Business Development
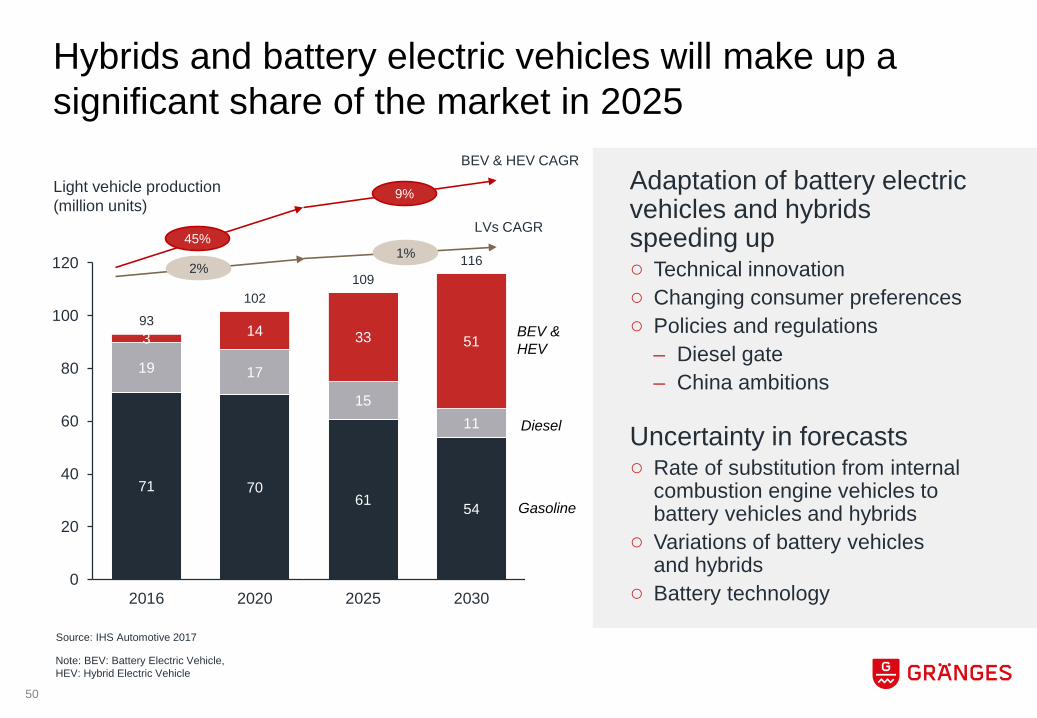
71 7061 54
19 17
1511
3 14 33 5193
102109
116
0
20
40
60
80
100
120
2016 2020 2025 2030
Hybrids and battery electric vehicles will make up a significant share of the market in 2025
Adaptation of battery electric vehicles and hybrids speeding up○ Technical innovation○ Changing consumer preferences○ Policies and regulations
– Diesel gate– China ambitions
Uncertainty in forecasts○ Rate of substitution from internal
combustion engine vehicles to battery vehicles and hybrids
○ Variations of battery vehicles and hybrids
○ Battery technology
BEV & HEV
Diesel
Gasoline
2%1%
Light vehicle production(million units)
LVs CAGR 45%
9%
BEV & HEV CAGR
50
Source: IHS Automotive 2017
Note: BEV: Battery Electric Vehicle, HEV: Hybrid Electric Vehicle

Growth in the number of hybrids and battery electric vehicles will affect share of powertrains significantly…
Source: IHS Automotive 2017
○ Regional differences– Europe and Asia will have the largest
change in powertrains
○ Gränges has a strong presence in both Europe and Asia– R&I center in Asia focused on heat
exchanger applications for battery electric vehicles
– R&I center in Europe focused on material development for battery electric vehicles
○ Growth in new and existing applications– Battery cooling and chillers for battery
electric vehicles and hybrids– Charge air coolers for hybrid electric
vehicles and internal combustion enginesBEV & HEV Diesel Gasoline
6%14%
81%
2% 4%
94%
3%
46%51%
2016 2025
Europe
Americas
Asia34%
11%
55%
14% 4%
82%
37%
26%
37%
51
Note: BEV: Battery Electric Vehicle, HEV: Hybrid Electric Vehicle

…and creates new requirements and new system designs for thermal management
Examples of heat exchangers
Radiator Charge air cooler
Condenser Evaporator
Heater core Oil cooler Other
Condenser Evaporator
ChillerHeater core
Cooling plateRadiator Charge air cooler
Condenser Evaporator
Heater core Cooling plate Chiller
Internal combustion engine vehicle
Battery electric vehicle
Hybridelectric vehicle
52
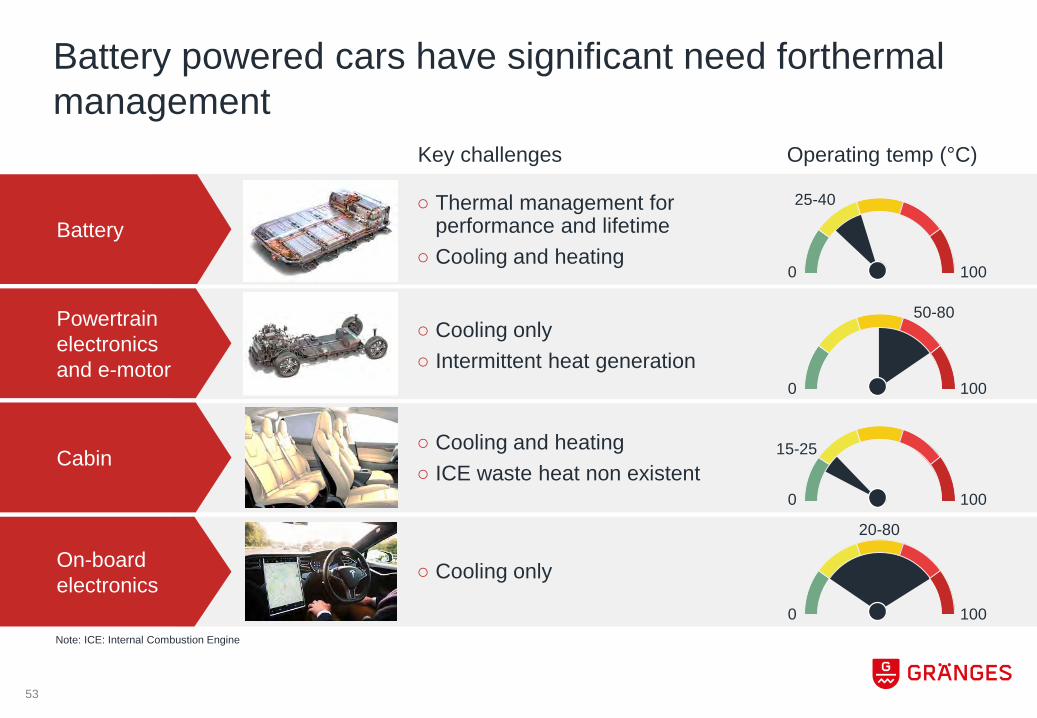
Battery powered cars have significant need forthermalmanagement
Key challenges
○ Thermal management for performance and lifetime
○ Cooling and heating
○ Cooling only○ Intermittent heat generation
○ Cooling and heating○ ICE waste heat non existent
○ Cooling only
Battery
Powertrain electronics and e-motor
Cabin
On-board electronics
Operating temp (°C)
0 100
0 100
0 100
0 100
50-80
25-40
15-25
20-80
53
Note: ICE: Internal Combustion Engine
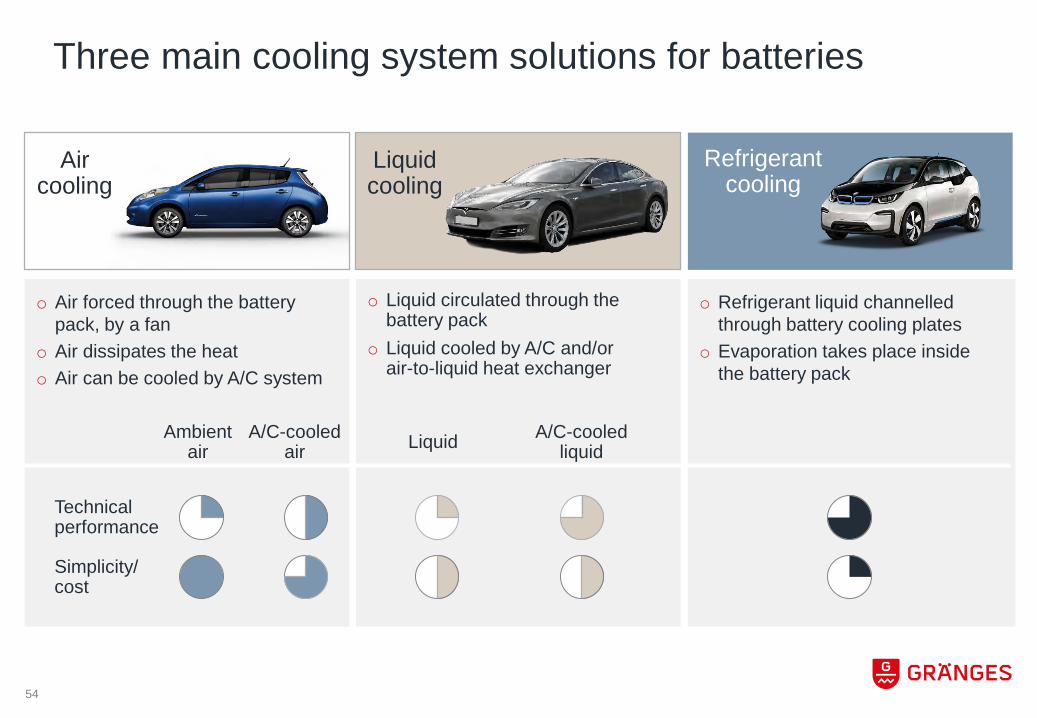
Three main cooling system solutions for batteries
o Air forced through the battery pack, by a fan
o Air dissipates the heato Air can be cooled by A/C system
o Liquid circulated through the battery pack
o Liquid cooled by A/C and/or air-to-liquid heat exchanger
o Refrigerant liquid channelled through battery cooling plates
o Evaporation takes place inside the battery pack
Technical performance
Ambient air
A/C-cooled air Liquid A/C-cooled
liquid
Simplicity/cost
Liquid cooling
Refrigerant cooling
Air cooling
54
55
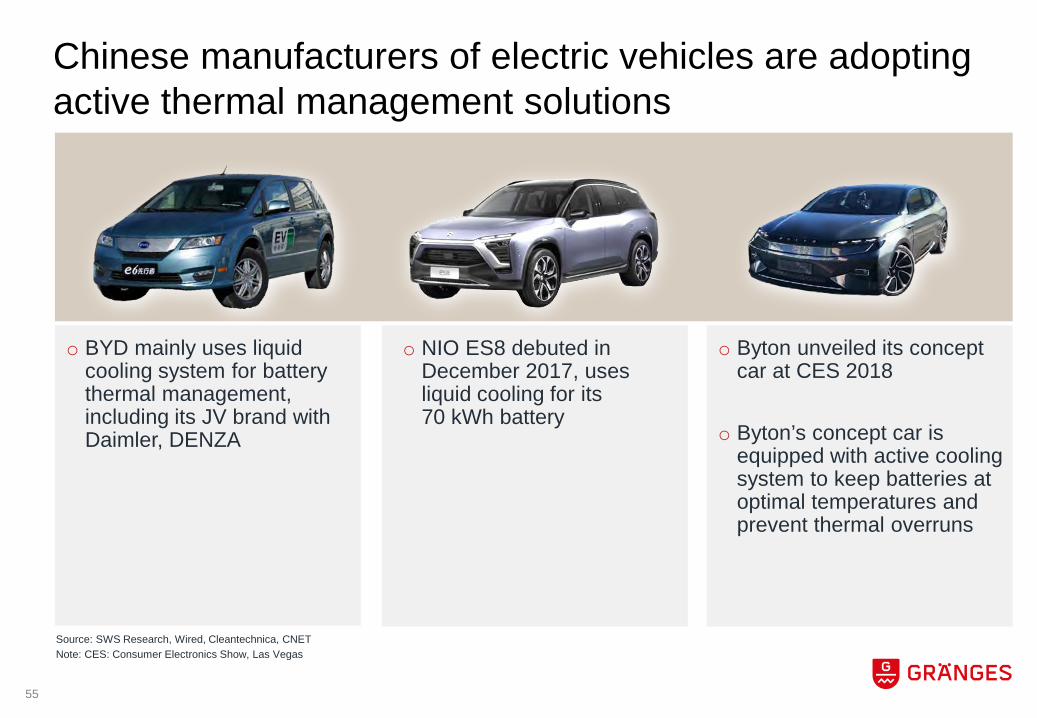
Chinese manufacturers of electric vehicles are adopting active thermal management solutions
o BYD mainly uses liquid cooling system for battery thermal management, including its JV brand with Daimler, DENZA
o Byton unveiled its concept car at CES 2018
o Byton’s concept car is equipped with active cooling system to keep batteries at optimal temperatures and prevent thermal overruns
o NIO ES8 debuted in December 2017, uses liquid cooling for its 70 kWh battery
Source: SWS Research, Wired, Cleantechnica, CNETNote: CES: Consumer Electronics Show, Las Vegas
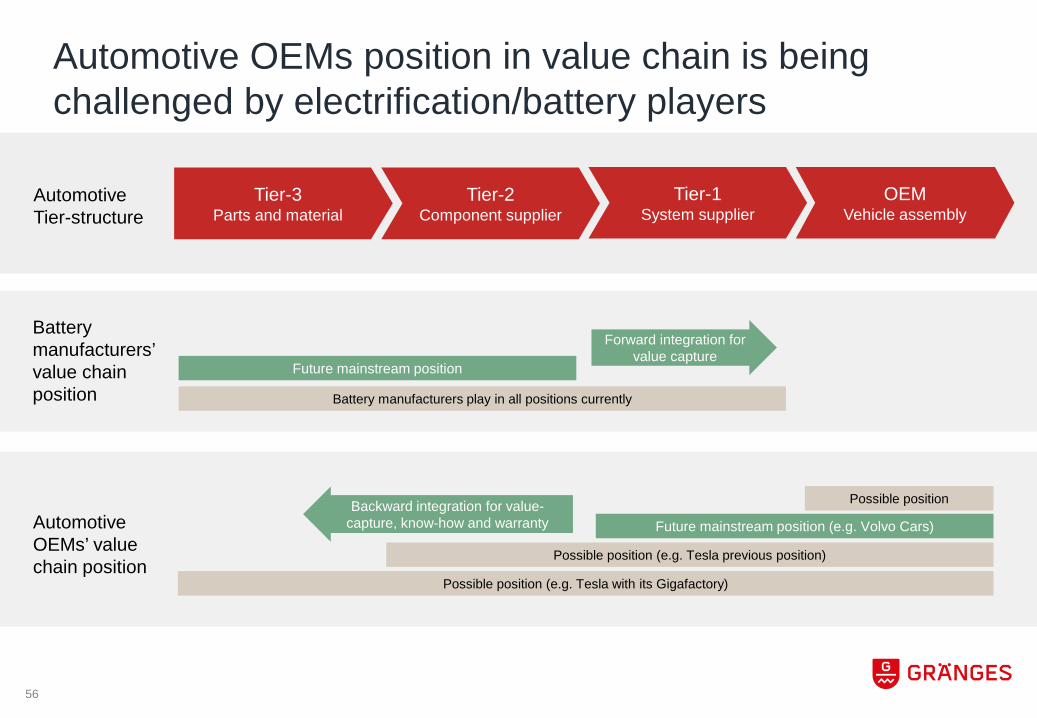
Automotive OEMs position in value chain is being challenged by electrification/battery players
Tier-1System supplier
OEMVehicle assembly
Tier-3Parts and material
Tier-2Component supplier
Battery manufacturers’value chain position
Automotive OEMs’ value chain position
Forward integration for value capture
Backward integration for value-capture, know-how and warranty
Future mainstream position
Future mainstream position (e.g. Volvo Cars)
Possible position (e.g. Tesla with its Gigafactory)
Possible position
Automotive Tier-structure
Battery manufacturers play in all positions currently
Possible position (e.g. Tesla previous position)
56
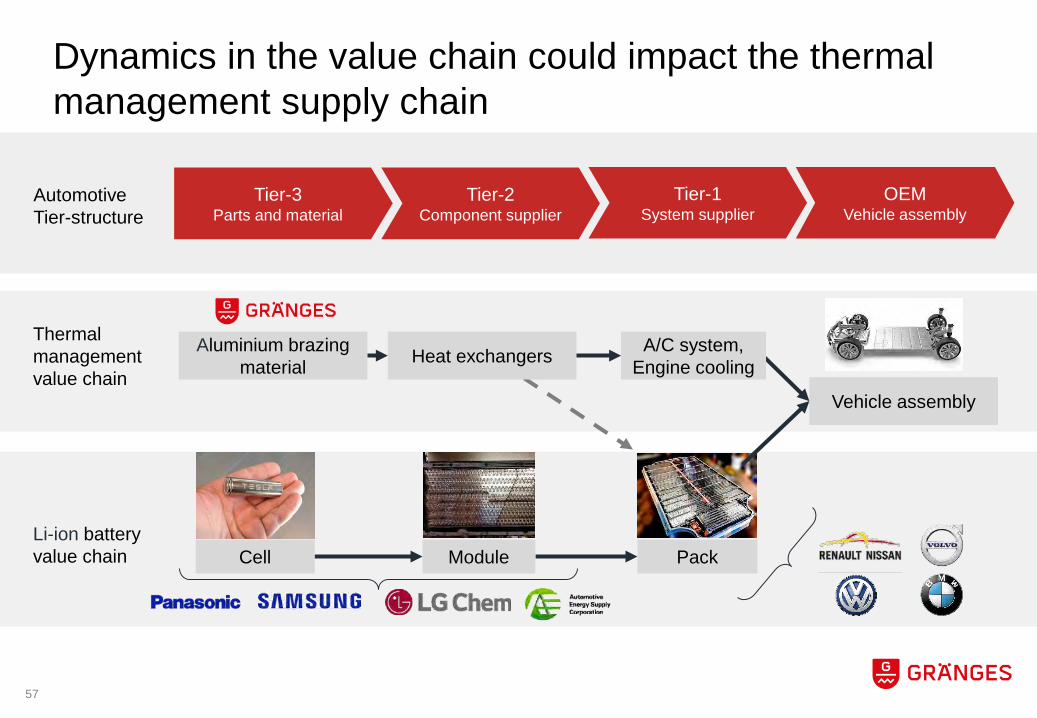
Tier-1System supplier
OEMVehicle assembly
Tier-3Parts and material
Tier-2Component supplier
Vehicle assembly
Dynamics in the value chain could impact the thermal management supply chain
Thermal management value chain
Li-ion battery value chain
Aluminium brazing material Heat exchangers A/C system,
Engine cooling
Cell Module Pack
57
Automotive Tier-structure
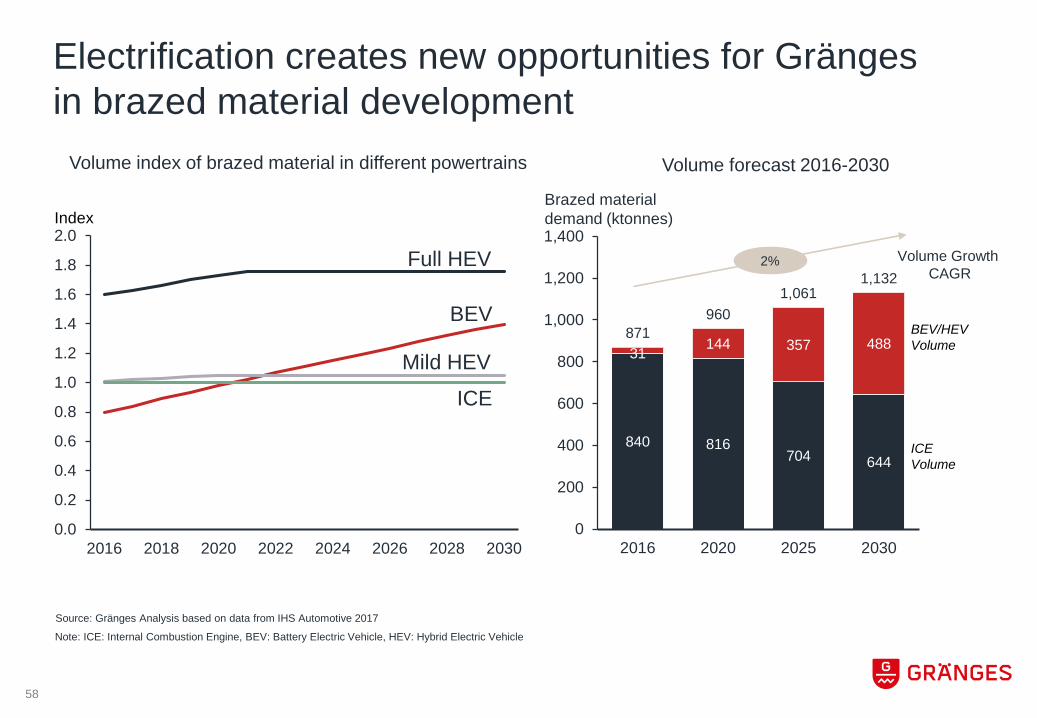
Electrification creates new opportunities for Grängesin brazed material development
Source: Gränges Analysis based on data from IHS Automotive 2017
Index
840 816704 644
31 144 357 488871
9601,061
1,132
0
200
400
600
800
1,000
1,200
1,400
2016 2020 2025 2030
Brazed material demand (ktonnes)
2%
BEV/HEV Volume
ICE Volume
Volume GrowthCAGR
Volume forecast 2016-2030
0.0
0.2
0.4
0.6
0.8
1.0
1.2
1.4
1.6
1.8
2.0
2016 2018 2020 2022 2024 2026 2028 2030
Volume index of brazed material in different powertrains
BEV
Full HEV
Mild HEVICE
Note: ICE: Internal Combustion Engine, BEV: Battery Electric Vehicle, HEV: Hybrid Electric Vehicle
58
59
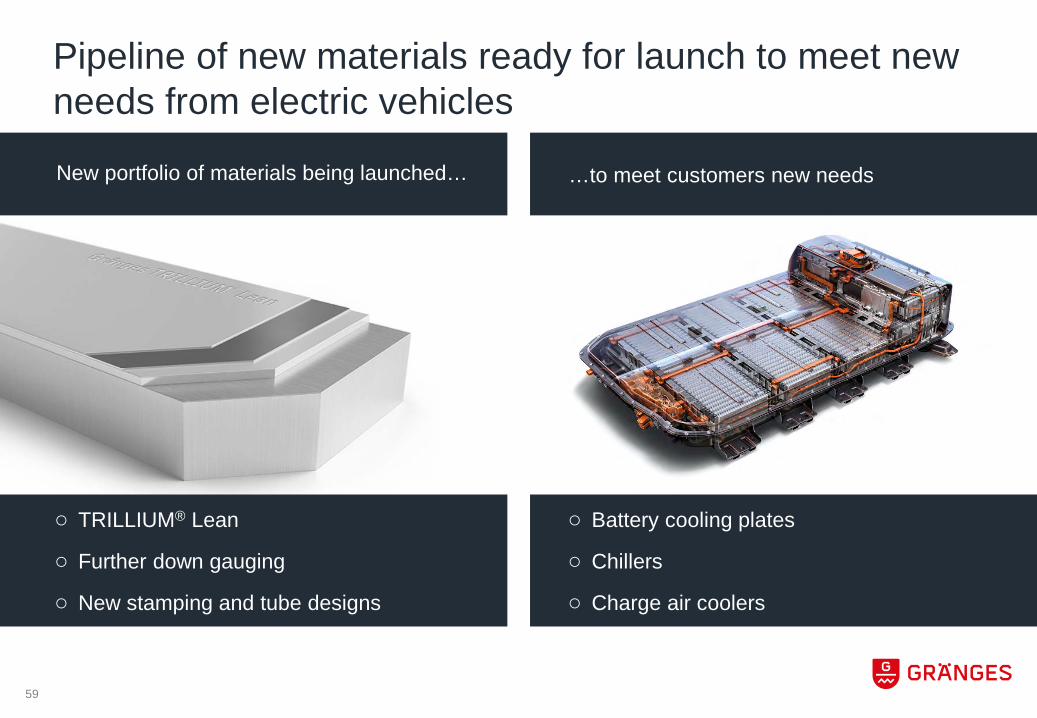
Pipeline of new materials ready for launch to meet new needs from electric vehicles
○ TRILLIUM® Lean
○ Further down gauging
○ New stamping and tube designs
…to meet customers new needs
○ Battery cooling plates
○ Chillers
○ Charge air coolers
New portfolio of materials being launched…

60
Gränges building on core strengths and working across value chain to benefit from electrification
Building on core strength
○ Material development
○ Application know-how
○ R&I capabilities
○ Global footprint
Early adaptation to market trends by working across the value chain○ Proactively driving inhouse material development in
dialogue with customer base around future designs
○ External collaboration with universities, solution providers and OEMs
○ Structural business activities organically and/or through M&A under investigation
○ Tapping into battery value chain through new collaborations
Thermal management value chain getting more and more integrated and connected
Tier-1System supplier
OEMVehicle assembly
Tier-3Parts and material
Tier-2Component supplier

Conclusion
○ Gränges well positioned to capture growth
○ Pipeline of new materials and applications to meet future needs
○ Early adaptation to market trends – working across the value chain with the market leaders
61
Heat exchanger material demand○ Battery powered cars have significant need for
thermal management○ Exponentially growing markets in early phases
of its product lifecycle
Technology shift○ No mainstream “solution” apparent in current and next
generation battery electric vehicles○ New requirements on thermal management systems
drive new requirements on heat exchanger material
Value chain remodelling○ Opportunities/uncertainties in value chain around
“owner” of electric drivetrain/components○ Movements across value chain with a higher
level of integration
CREATE VALUE FROM SUSTAINABILITY
Sofia HedevågVP Sustainability
63
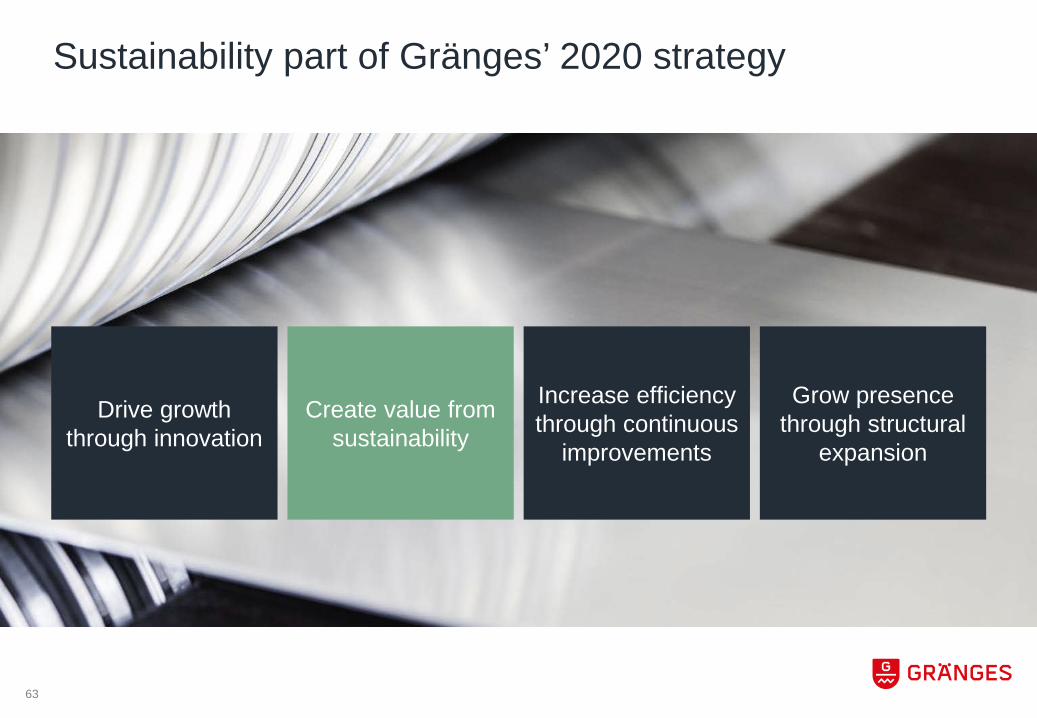
Sustainability part of Gränges’ 2020 strategy
Drive growth through innovation
Create value from sustainability
Increase efficiencythrough continuous
improvements
Grow presencethrough structural
expansion
64
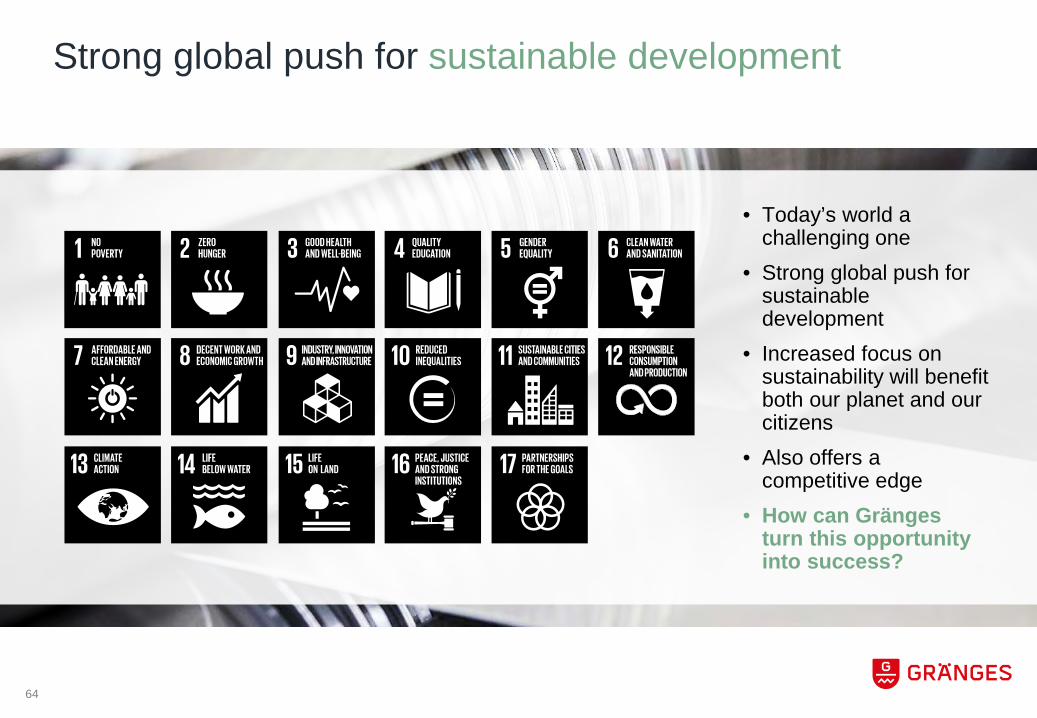
Strong global push for sustainable development
• Today’s world a challenging one
• Strong global push for sustainable development
• Increased focus on sustainability will benefit both our planet and our citizens
• Also offers a competitive edge
• How can Gränges turn this opportunity into success?

Aluminium as the green metal with unique properties
Light but strong
High corrosion resistance and durable
Versatile
Impermeable
Energy saving and highly recyclable
65
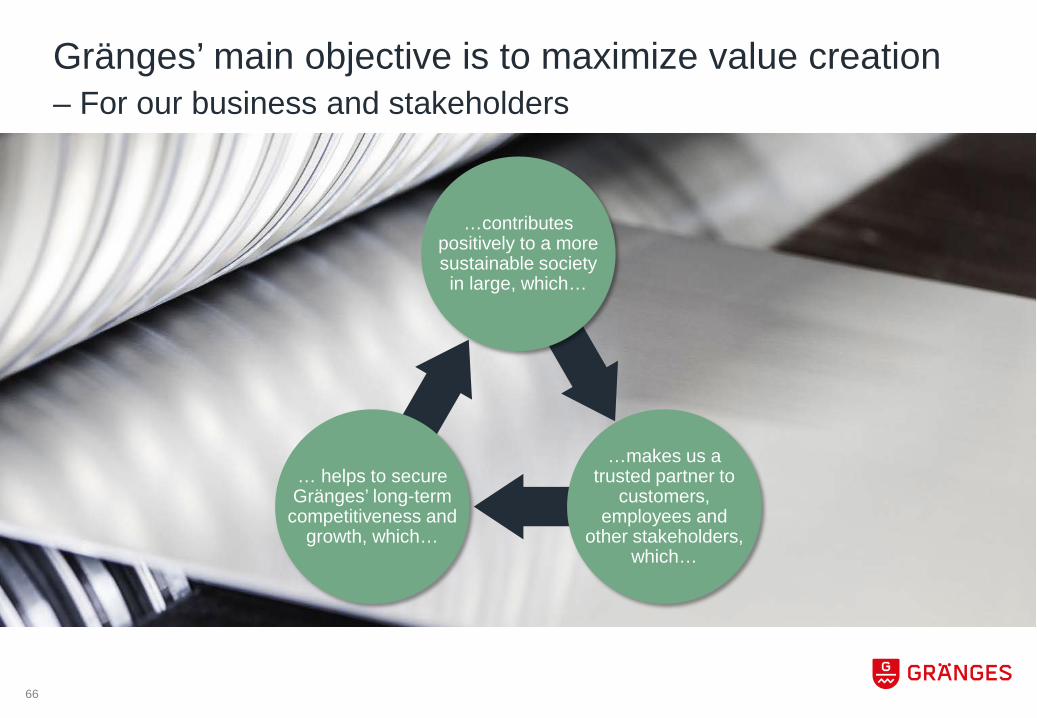
Gränges’ main objective is to maximize value creation– For our business and stakeholders
…contributes positively to a more sustainable society in large, which…
…makes us a trusted partner to
customers, employees and
other stakeholders, which…
… helps to secure Gränges’ long-term
competitiveness and growth, which…
66
very
Impact on society and Gränges’ long-term competitiveness
Impo
rtanc
e to
Grä
nges
’ sta
keho
lder
s
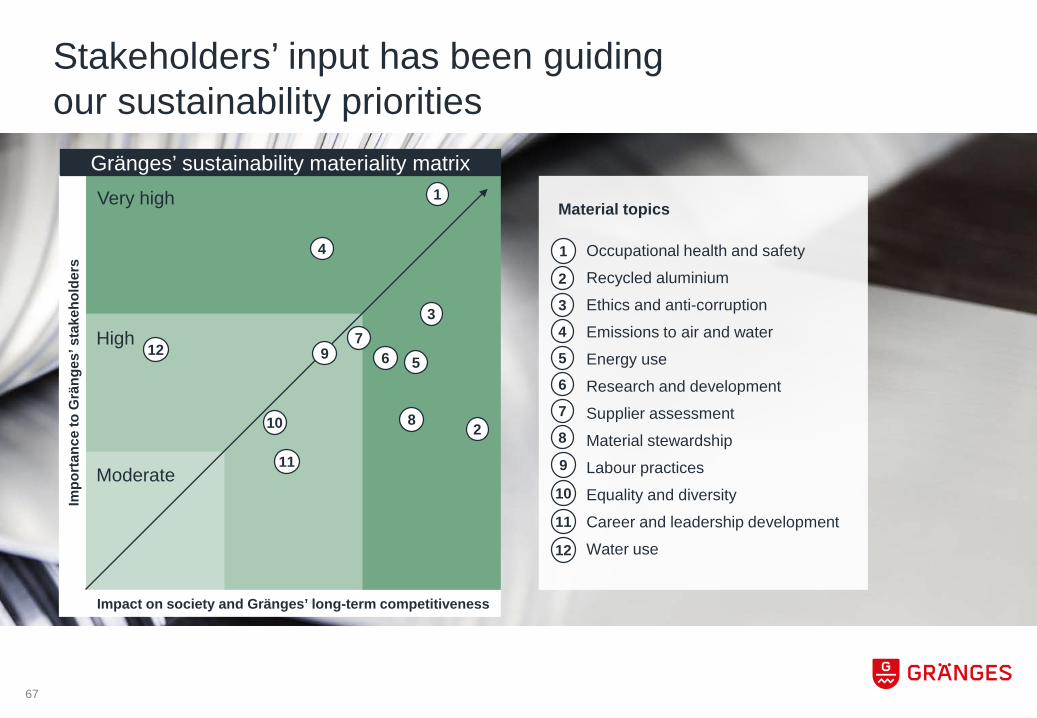
Gränges’ sustainability materiality matrixVery high
High
Moderate
Stakeholders’ input has been guiding our sustainability priorities
3
4
5
2
12
1
11
9 6
8
Material topics
Occupational health and safetyRecycled aluminiumEthics and anti-corruptionEmissions to air and waterEnergy useResearch and developmentSupplier assessmentMaterial stewardshipLabour practicesEquality and diversityCareer and leadership developmentWater use
1
2
3
4
5
6
7
8
9
10
11
12
10
7
67

Our updated global sustainability pillars and topics
ENSURE RESPONSIBLE & SUSTAINABLE SOURCING
SECURE ETHICAL BUSINESS PRACTICES
RUN SUSTAINABLE OPERATIONS
BUILD DIVERSE & HIGH-PERFORMING TEAMS
DEVELOP SUSTAINABLE PRODUCT OFFERINGS
○ Responsible sourcing
○ Sustainable supply chain performance
○ Ethics and anti-corruption
○ Climate
○ Energy use
○ Recycled aluminium
○ Water use
○ Workplace safety
○ Career and leadership development
○ Diversity and equality
○ Employee well-being
○ Eco-responsible innovation
○ Sustainable product performance
SVP Technology & Business Development
General Counsel SVP Process Engineering & Operational Development
SVP Human Resources SVP Research & Innovation
68

Ensure responsible and sustainable sourcing
o Conducted audits of strategic suppliers to ensure compliance to Gränges’ sustainability standards
o Initiated a global responsible sourcing program to ensure compliance and reduce environmental impact
WE WILL ensure that our suppliers maintain high sustainability standards by enforcing strict sustainability criteria in supplier sourcing agreements and partnerships. We also strive to improve the environmental performance of our supply base.
69

Secure ethical business practices
o Participates in the UN Global Compact since October 2016
o Completed training in Gränges’ Code of Conduct and anti-corruption
o Initiated project to update Code of Conduct and whistleblower process
WE WILL be a reliable and ethically sound partner in all our business relations and in the societies in which we conduct our business. We never accept corruption and always act rapidly, and vigorously if discovering unethical behaviour.
70
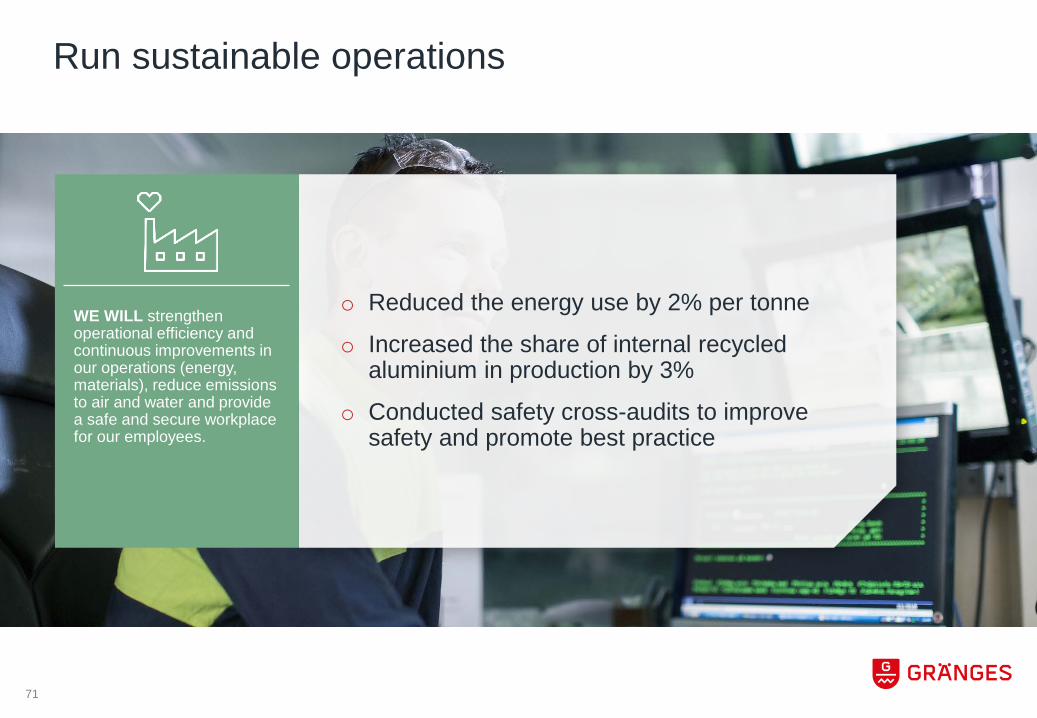
Run sustainable operations
o Reduced the energy use by 2% per tonne
o Increased the share of internal recycled aluminium in production by 3%
o Conducted safety cross-audits to improve safety and promote best practice
WE WILL strengthen operational efficiency and continuous improvements in our operations (energy, materials), reduce emissions to air and water and provide a safe and secure workplace for our employees.
71
Run sustainable operations – Energy recovery project in Finspång
72

Build diverse and high-performing teams
o Focused on building “One Gränges”; our corporate culture
o Established a global HR Council
o Worked to increase the share of females among new recruits
WE WILL ensure that our people are motivated and committed and that we provide an open, diverse and non-discriminatory workplace where employees can realize their full potentials and contribute to a high-performing organization.
73
Build diverse and high-performing teams – Family Days in Shanghai
74
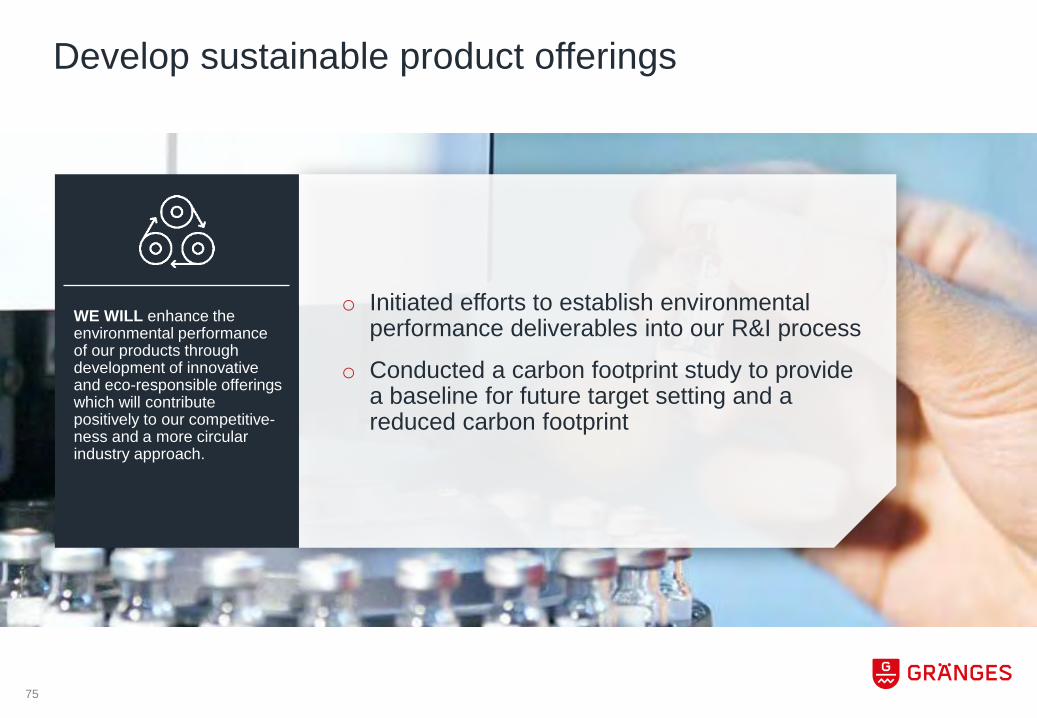
Develop sustainable product offerings
o Initiated efforts to establish environmental performance deliverables into our R&I process
o Conducted a carbon footprint study to provide a baseline for future target setting and a reduced carbon footprint
WE WILL enhance the environmental performance of our products through development of innovative and eco-responsible offerings which will contribute positively to our competitive-ness and a more circular industry approach.
75
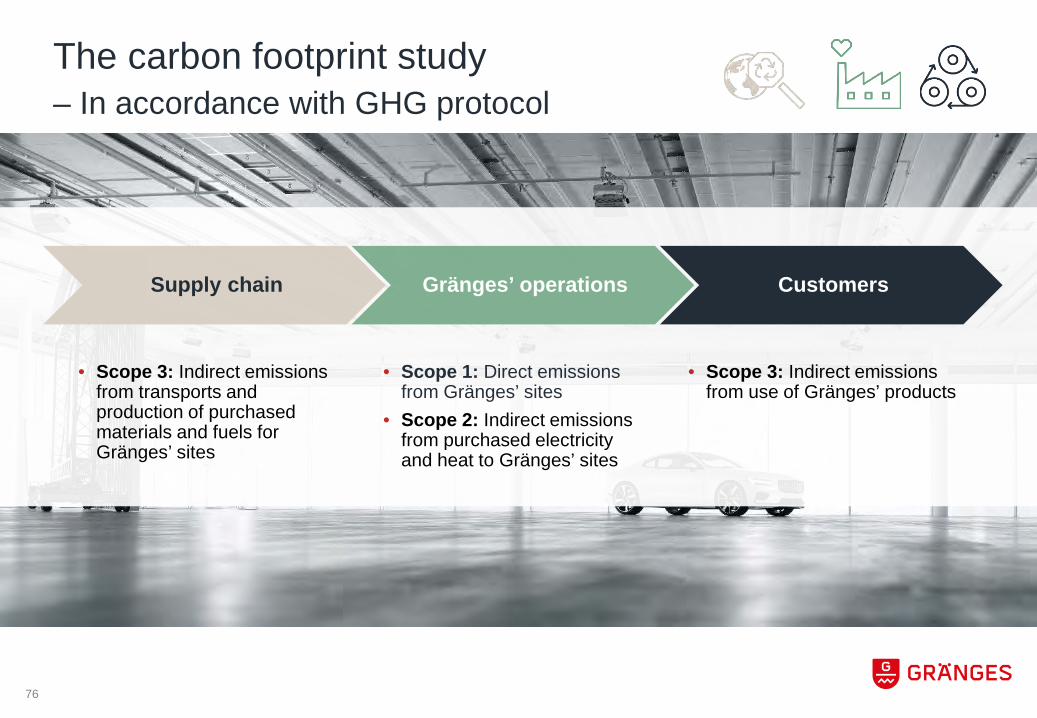
The carbon footprint study– In accordance with GHG protocol
Supply chain Gränges’ operations Customers
• Scope 3: Indirect emissions from use of Gränges’ products
• Scope 1: Direct emissions from Gränges’ sites
• Scope 2: Indirect emissions from purchased electricity and heat to Gränges’ sites
• Scope 3: Indirect emissions from transports and production of purchased materials and fuels for Gränges’ sites
76

91%
1%1% 3% 4%
Total CO2e emissions 2017: 4.6 Mtonnes
77
Main material production accounts for more than 90 per cent of total impact
0.0
0.2
0.4
0.6
0.8
1.0
1.2
Sweden China USA Total
Electricity and district heat (Scope 2)Gränges' sites (Scope 1)
Direct CO2e emissions & indirect CO2e emissions from purchased electricity and heat
[tonnes CO2e/tonnes product]
Material production (Scope 3)Transports (Scope 3)Fuel production (Scope 3)Electricity and district heat (Scope 2)Gränges' sites (Scope 1)
78
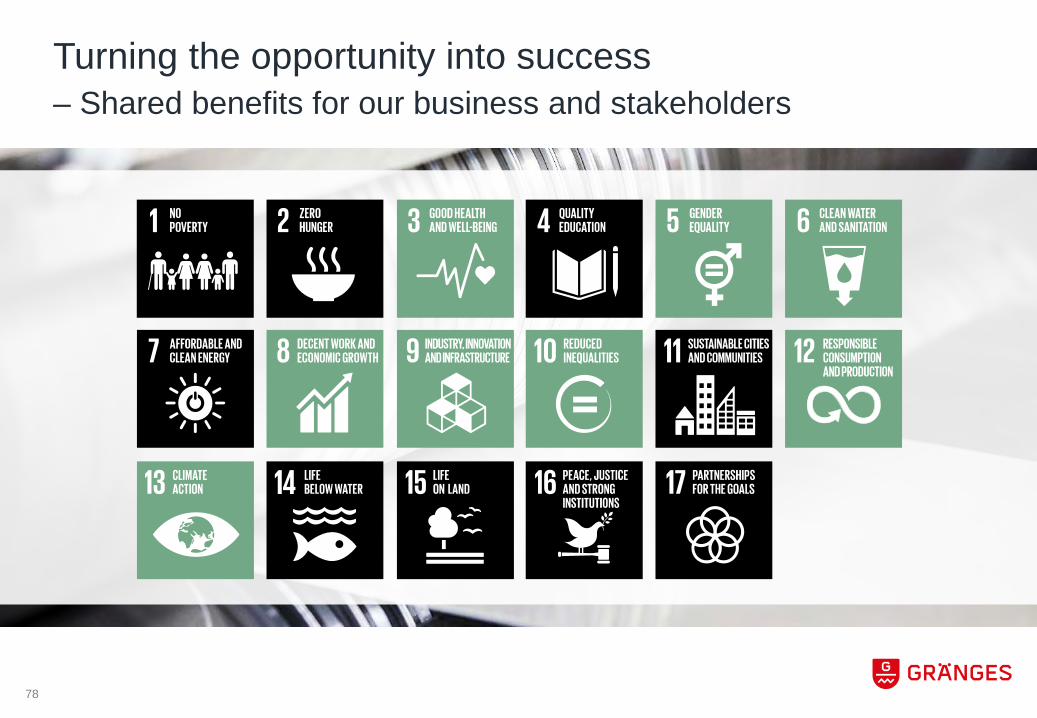
Turning the opportunity into success– Shared benefits for our business and stakeholders

Conclusiono Global push for sustainable development brings opportunitieso Aluminium with its unique properties contributes positively
to sustainable development o Continued integration of sustainability aspects across our businesso Long-term objective is to create value from sustainability and
secure our competitiveness and growth, which will also bring benefits for our stakeholders and society in large
79
Colin Xu President Asia
GRÄNGES ASIA
81
Gränges Asia
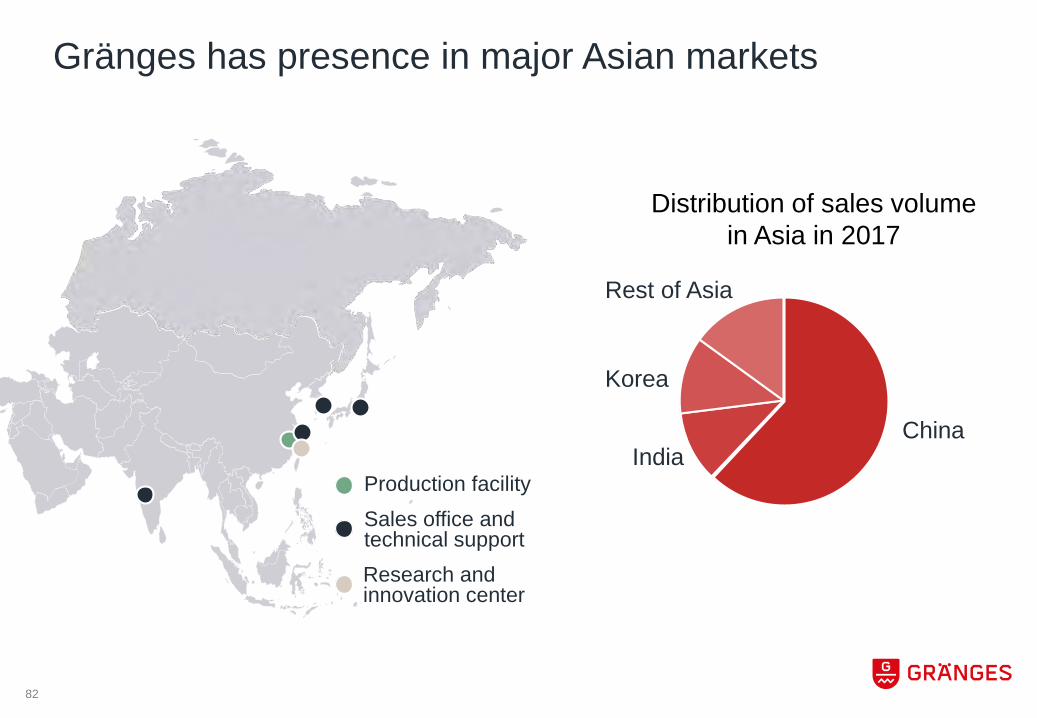
Gränges has presence in major Asian markets
Research and innovation center
Sales office and technical support
Production facility
82
Korea
ChinaIndia
Rest of Asia
Distribution of sales volume in Asia in 2017
83
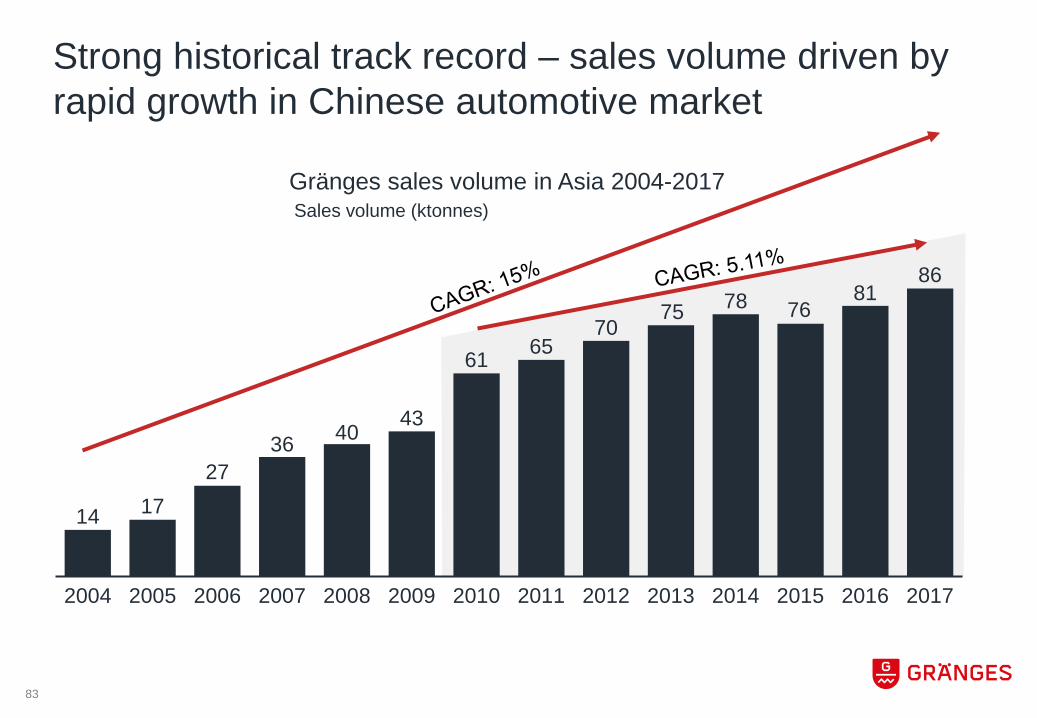
Strong historical track record – sales volume driven by rapid growth in Chinese automotive market
14 1727
36 40 43
61 6570
75 78 7681
86
2004 2005 2006 2007 2008 2009 2010 2011 2012 2013 2014 2015 2016 2017
Sales volume (ktonnes)Gränges sales volume in Asia 2004-2017
84
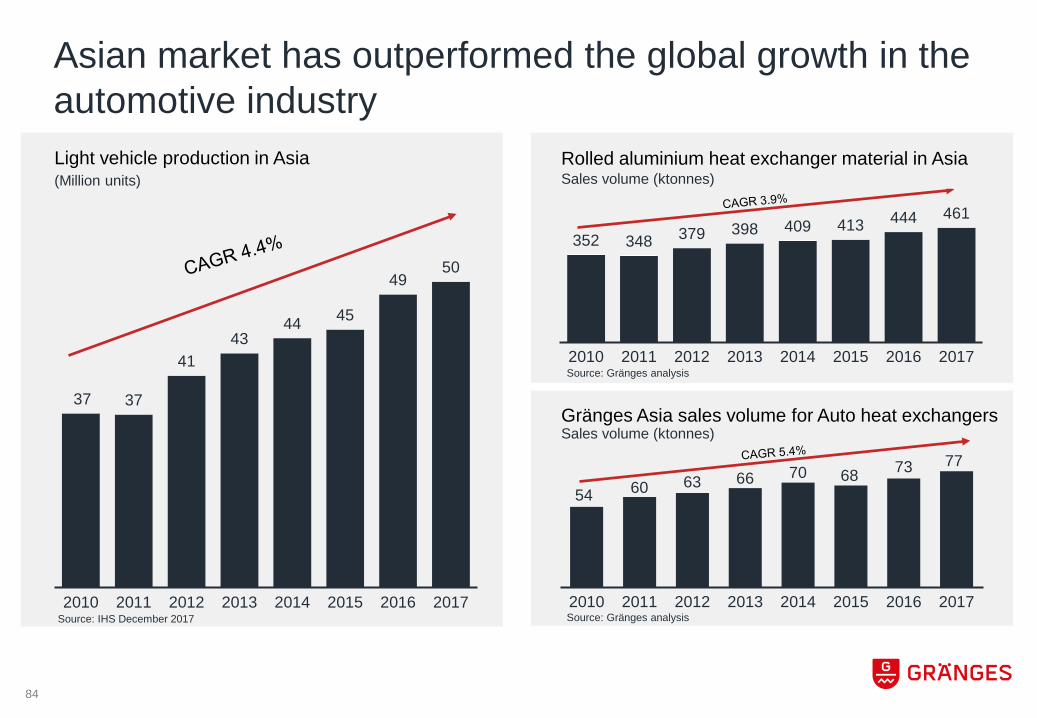
Asian market has outperformed the global growth in the automotive industry
352 348 379 398 409 413 444 461
2010 2011 2012 2013 2014 2015 2016 2017
37 37
4143
44 45
4950
2010 2011 2012 2013 2014 2015 2016 2017
Light vehicle production in Asia
54 60 63 66 70 68 73 77
2010 2011 2012 2013 2014 2015 2016 2017
Gränges Asia sales volume for Auto heat exchangers
(Million units)Rolled aluminium heat exchanger material in AsiaSales volume (ktonnes)
Sales volume (ktonnes)
Source: IHS December 2017 Source: Gränges analysis
Source: Gränges analysis
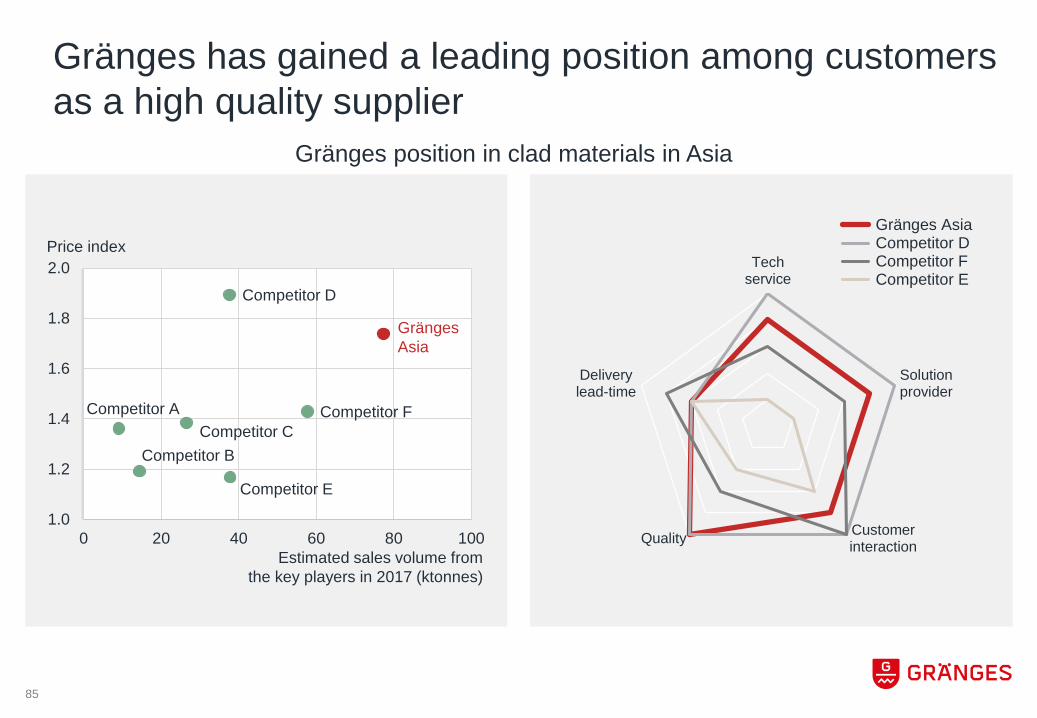
1.0
1.2
1.4
1.6
1.8
2.0
0 20 40 60 80 100
Gränges Asia
Competitor FCompetitor C
Competitor D
Competitor E
Competitor B
Competitor A
85
Gränges has gained a leading position among customers as a high quality supplier
Techservice
Solutionprovider
CustomerinteractionQuality
Deliverylead-time
Gränges Asia Competitor D Competitor F Competitor E
Estimated sales volume from the key players in 2017 (ktonnes)
Price index
Gränges position in clad materials in Asia

86
Gränges holds a market share of 23 per cent in clad products in Asia
Gränges Asia
Competitor F
Competitor E
Competitor D
Competitor C
Others
Clad product market shares
23%

Success factors
Market-driven innovation
Customer tailored solutionsQuality reputation
87
OperationalexcellenceTechnical support Strong culture
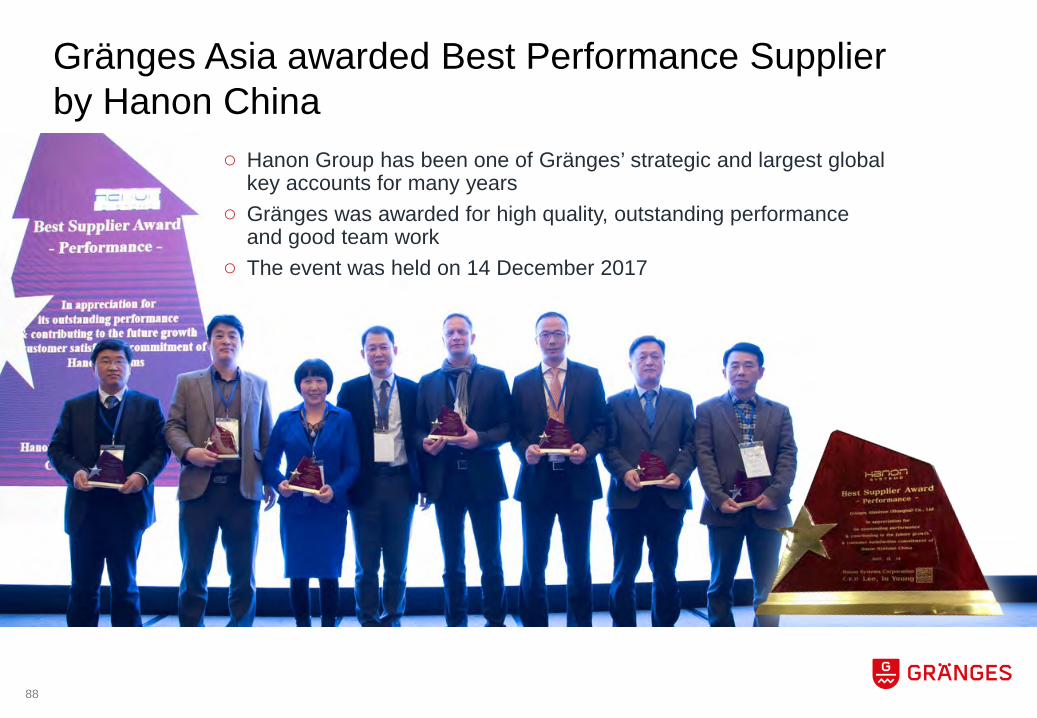
Gränges Asia awarded Best Performance Supplier by Hanon China
○ Hanon Group has been one of Gränges’ strategic and largest global key accounts for many years
○ Gränges was awarded for high quality, outstanding performance and good team work
○ The event was held on 14 December 2017
88

89
Focus on fast growing heat exchanger applications
Charge air cooler○ Conversion to folded tube
design in Commercial vehicles
○ 15% CAGR in passenger vehicles installation
○ Severe corrosion requirements
○ Solution ready with superior corrosion and strength performance
○ Development projects with most customers
Folded tube○ Is becoming standard to
replace multiport extrusions in condensers and evaporators
○ 35% estimated conversion by 2018
○ Advanced forming and brazing processes
○ Major supplier to pioneer global key account
○ Development with in-house folded tube line
Chiller○ Critical application in all
electrical vehicle systems
○ Estimated CAGR: 35%
○ High requirements on mechanical property and cleanliness after brazing
○ Gränges Asia is leading the development and growth
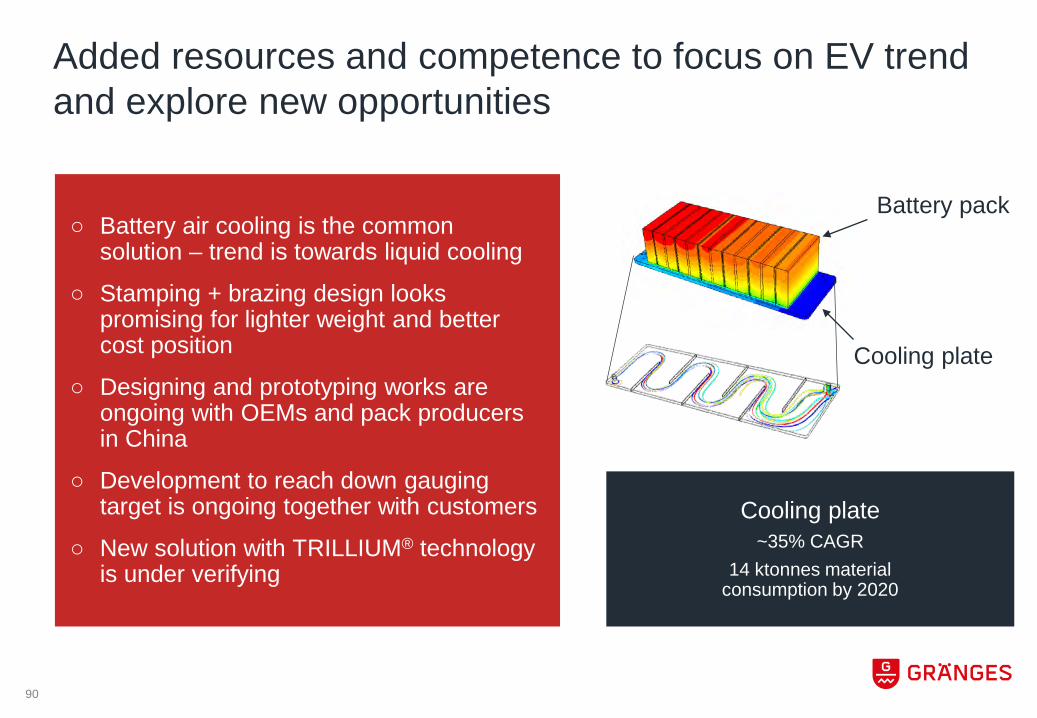
Added resources and competence to focus on EV trend and explore new opportunities
Cooling plate~35% CAGR
14 ktonnes materialconsumption by 2020
○ Battery air cooling is the common solution – trend is towards liquid cooling
○ Stamping + brazing design looks promising for lighter weight and better cost position
○ Designing and prototyping works are ongoing with OEMs and pack producers in China
○ Development to reach down gauging target is ongoing together with customers
○ New solution with TRILLIUM® technology is under verifying
Battery pack
Cooling plate
90
91
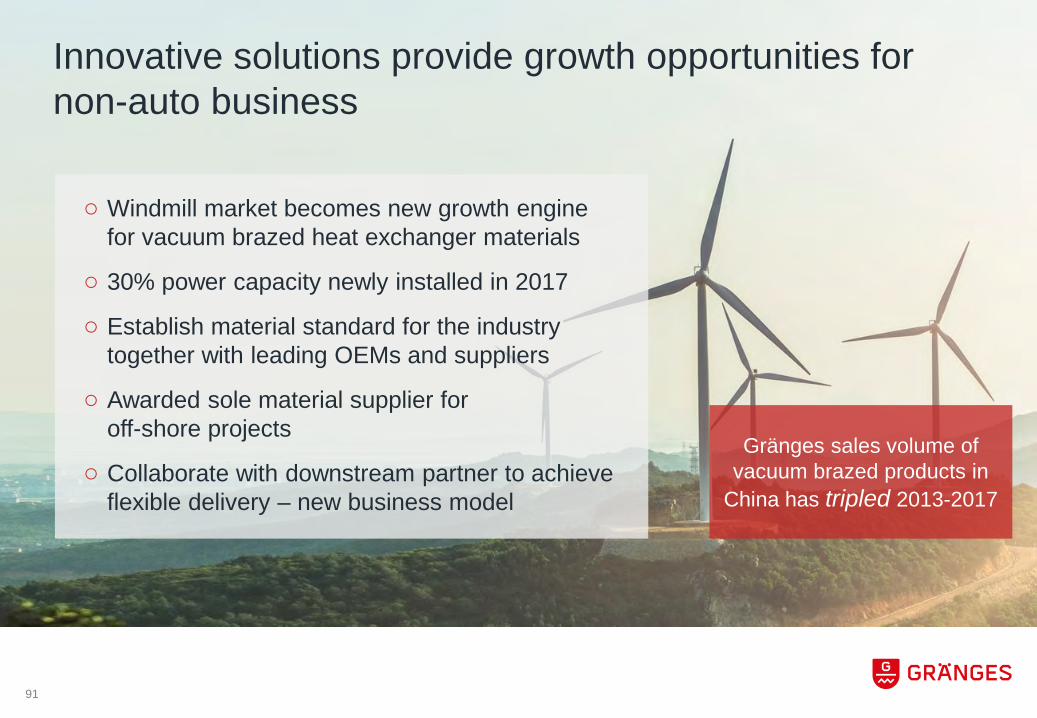
Innovative solutions provide growth opportunities for non-auto business
○ Windmill market becomes new growth engine for vacuum brazed heat exchanger materials
○ 30% power capacity newly installed in 2017
○ Establish material standard for the industry together with leading OEMs and suppliers
○ Awarded sole material supplier for off-shore projects
○ Collaborate with downstream partner to achieve flexible delivery – new business model
Gränges sales volume of vacuum brazed products in
China has tripled 2013-2017
92
○ Integrated part of the customer offering
○ Product management
○ Yearly technical forums
○ Application center complementing product development
○ Development projects for electrical vehicles
Research & Innovation competences strongly focused to serve Asian customers
93
Research & Innovation plays more important role in business development
Customer case○ Harsh standards on corrosion – needed new solution○ R&I team initiated new trials of process innovation○ New solution was developed with creative ideas of material
process change○ Optimization of brazing process with customers’ process
knowledge finally secured performance
94
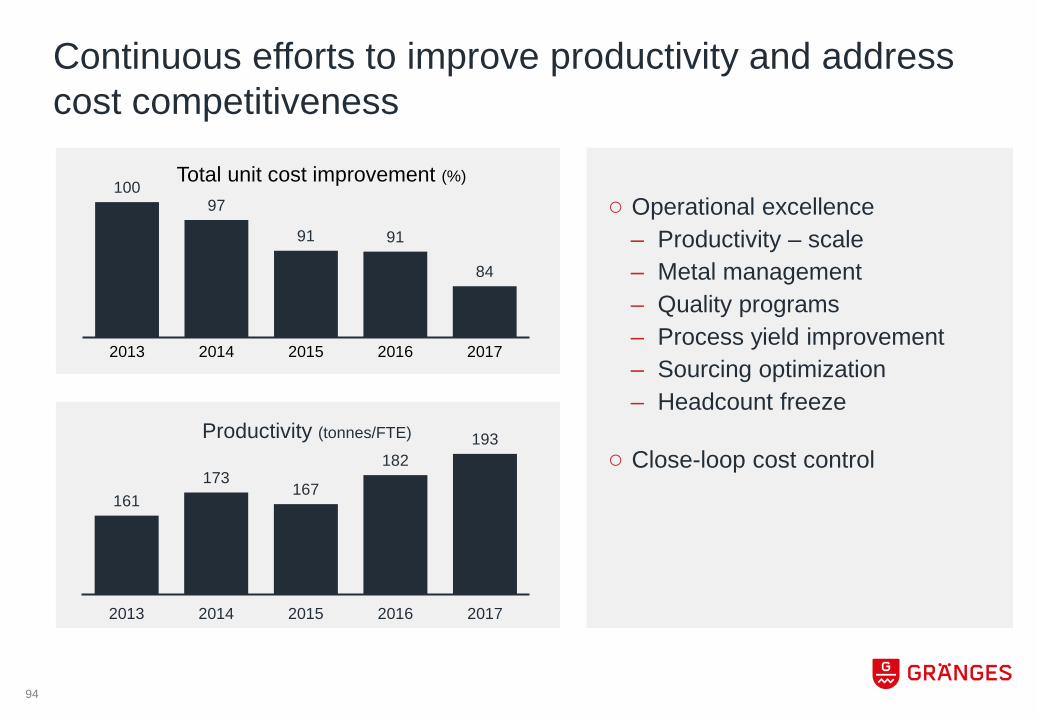
Continuous efforts to improve productivity and address cost competitiveness
○ Operational excellence– Productivity – scale– Metal management– Quality programs– Process yield improvement– Sourcing optimization– Headcount freeze
○ Close-loop cost control161
173167
182193
2013 2014 2015 2016 2017
10097
91 91
84
2013 2014 2015 2016 2017
Total unit cost improvement (%)
Productivity (tonnes/FTE)

95
Improved metal management has contributed to better cost position, but still room for further improvementsAchieved○ Better sorting operation
○ Dynamic cast house planning
○ Slab outsourcing optimization
○ New scrap categories
Potential○ Complete optimization model
○ Complete sorting system
○ Execute follow-up system
○ Implement external scrap sourcing model
Clad scrap recycle rate last five years increased more than
96
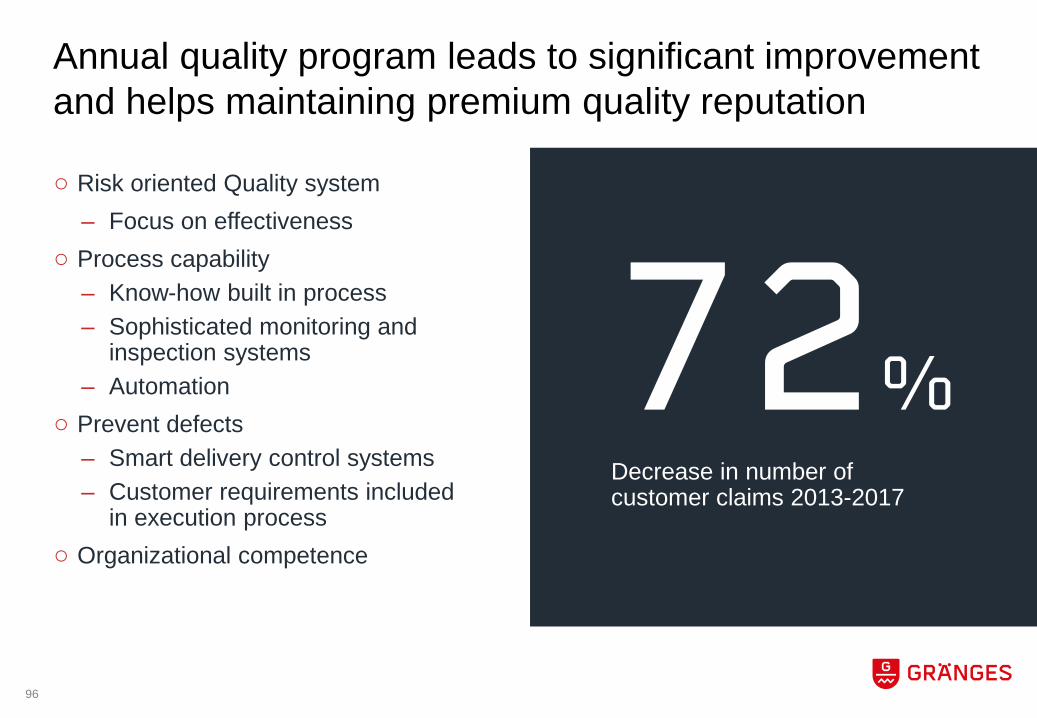
Annual quality program leads to significant improvement and helps maintaining premium quality reputation
○ Risk oriented Quality system– Focus on effectiveness
○ Process capability– Know-how built in process– Sophisticated monitoring and
inspection systems– Automation
○ Prevent defects– Smart delivery control systems– Customer requirements included
in execution process○ Organizational competence
72%Decrease in number of customer claims 2013-2017
97
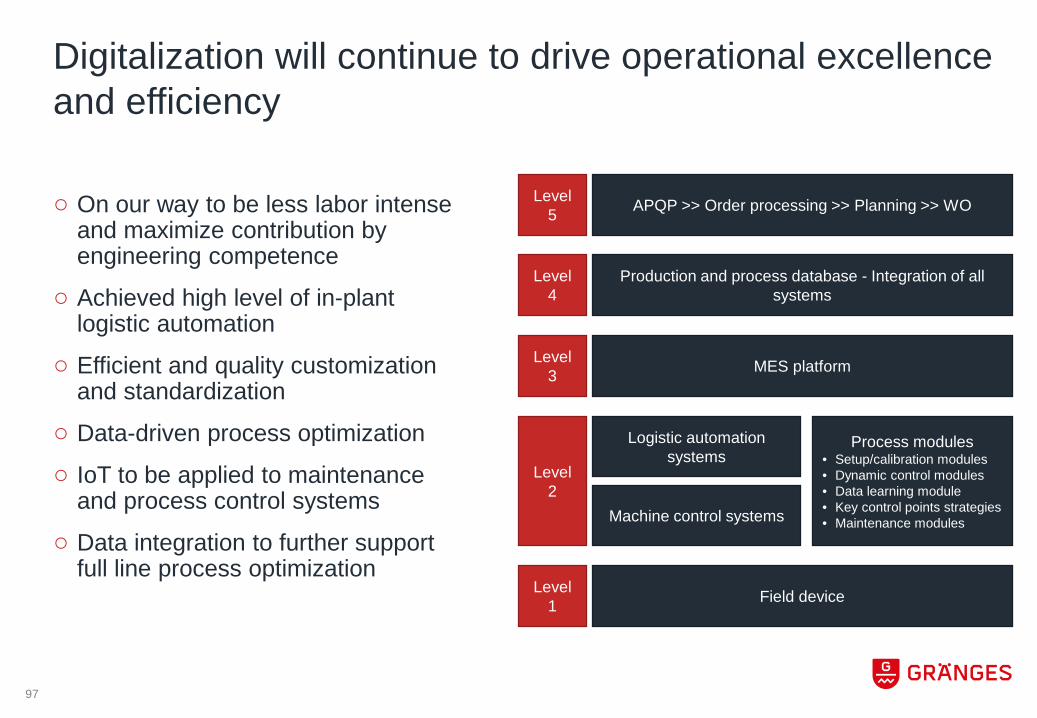
○ On our way to be less labor intense and maximize contribution by engineering competence
○ Achieved high level of in-plant logistic automation
○ Efficient and quality customization and standardization
○ Data-driven process optimization
○ IoT to be applied to maintenance and process control systems
○ Data integration to further support full line process optimization
Digitalization will continue to drive operational excellence and efficiency
Level 4
Level 3
Level 2
Level 1
Level 5
Field device
Logistic automation systems
Machine control systems
MES platform
Process modules• Setup/calibration modules• Dynamic control modules• Data learning module• Key control points strategies• Maintenance modules
Production and process database - Integration of all systems
APQP >> Order processing >> Planning >> WO

98
Stable and engaged workforce
Turnover
<5%
Employed over 10 years
>50%
Annual OPI
>1,500
99
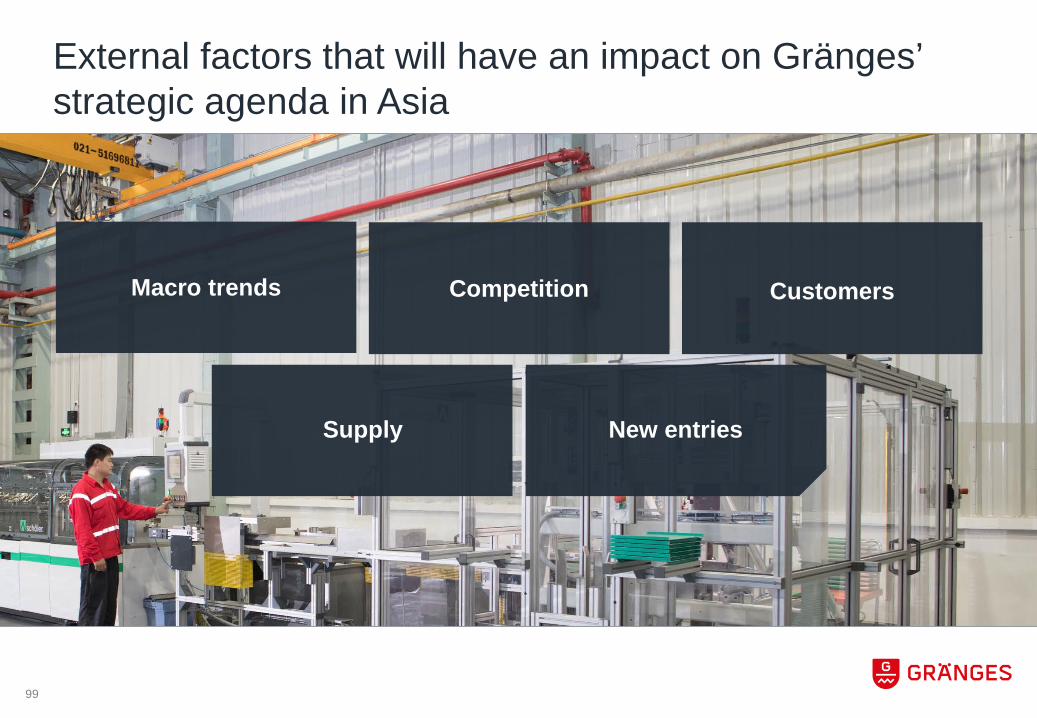
External factors that will have an impact on Gränges’ strategic agenda in Asia
Macro trends Competition Customers
Supply New entries
100
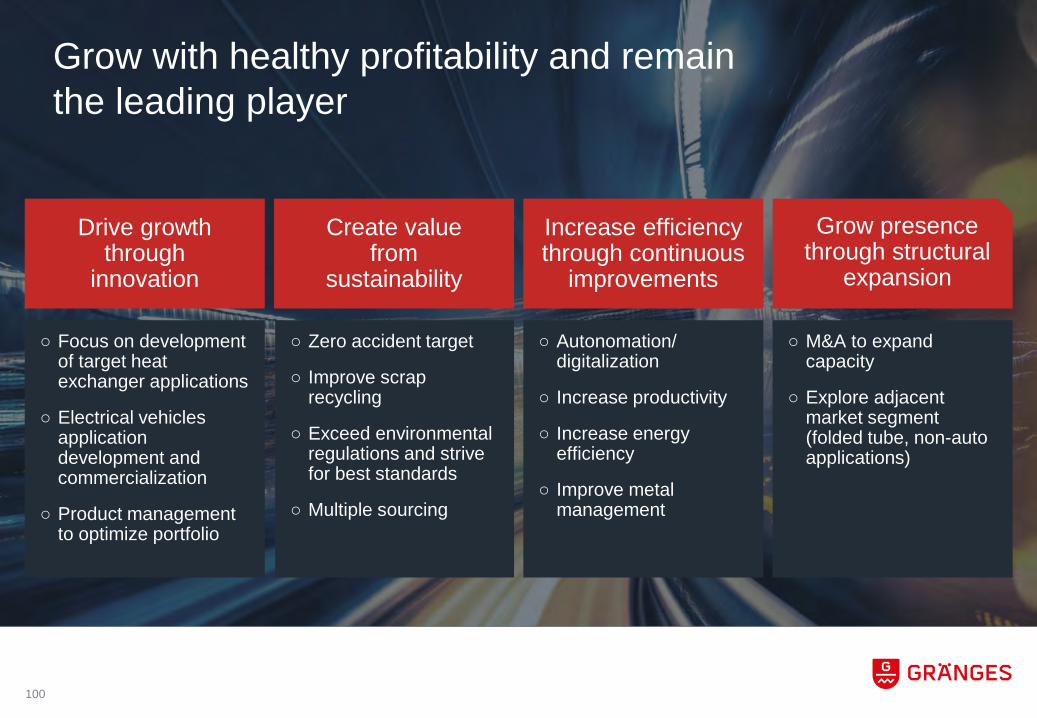
Grow with healthy profitability and remain the leading player
Drive growth through
innovation
Create value from
sustainability
Increase efficiencythrough continuous
improvements
Grow presencethrough structural
expansion
○ Focus on development of target heat exchanger applications
○ Electrical vehicles application development and commercialization
○ Product management to optimize portfolio
○ Zero accident target
○ Improve scrap recycling
○ Exceed environmental regulations and strive for best standards
○ Multiple sourcing
○ Autonomation/digitalization
○ Increase productivity
○ Increase energy efficiency
○ Improve metal management
○ M&A to expand capacity
○ Explore adjacent market segment (folded tube, non-auto applications)

Conclusiono Gränges Asia holds a strong market position through a well-defined
value propositiono The success factors have enabled Gränges Asia to deliver value
and staying competitiveo The success factors will remain important to achieve healthy
and sustainable performance in coming years
101
Patrick LawlorPresident Americas
GRÄNGES AMERICAS
103

Strong macroeconomic outlook in the United States
40
50
60
70
80
90
100
4
5
6
7
8
9
10
2017 20222009 2013
Consumer Confidence
Unemployment Rate
10.615.9 17.6 18.2
2017
CAGR 4%
202220132009
0.60.9
1.21.4
201720132009
CAGR 8%
2022
Light Vehicle Sales Forecast
Housing Starts Forecast
Positive outlook for both Employment & Consumer Confidence
% Index
Source: Bureau of Labor Statistics, Statista
Million units
Million units
Source: FRED University of Michigan Consumer Sentiment
Source: National Association of Home Builders (NAHB)
104

Trade legislation impacting aluminium imports into the United States
Note: Anti-dumping duties (ADD) and Countervailing duties (CVD) are applicable on imports from China into the United States
Foil case
• March 15, 2018, U.S. ITC voted unanimously that unfairly-traded Chinese imports had materially injured Aluminum foil producers
• AD duties ranging from 49 to 106% and CV duties from 17 to 81%
Sheet case
• US Commerce Department self-initiated ADD/CVD
• Preliminary CVD margins to be announced April 13, 2018
• Preliminary ADD margins to be announced June 12, 2018
Section 232 general tariffs of 10% on all aluminium imports
• March 8, 2018, President Trump signed proclamations formally adjusting the tariffs on aluminium (10%) and steel (25%)
• The tariffs will go into effect March 23, 2018
105
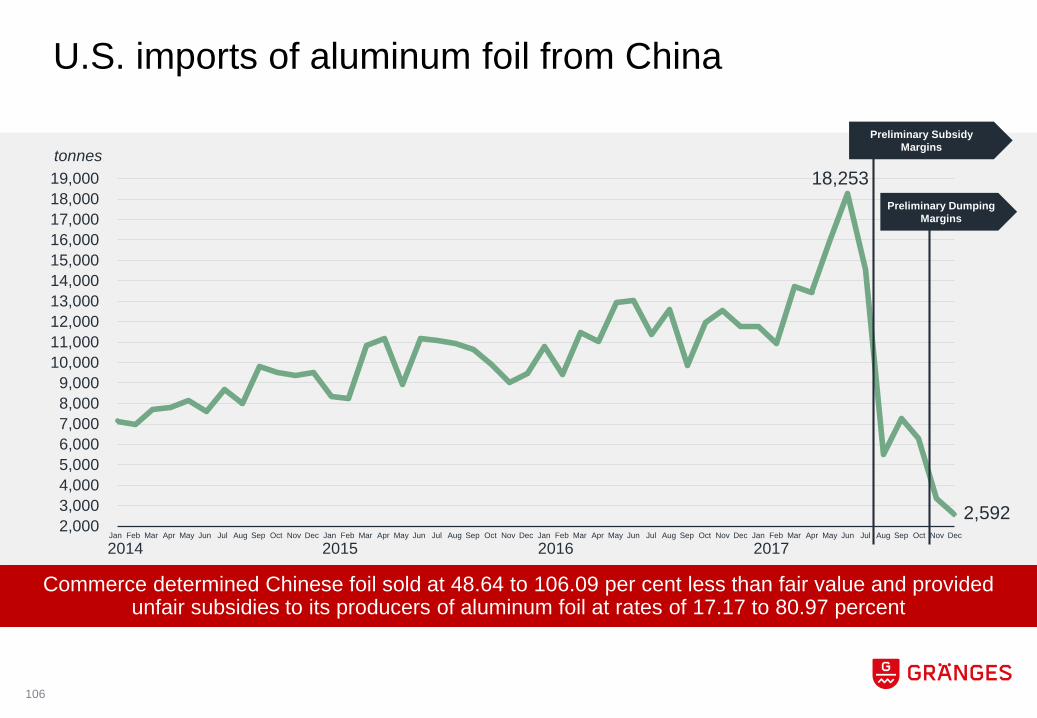
U.S. imports of aluminum foil from China
18,253
2,592 2,0003,0004,0005,0006,0007,0008,0009,000
10,00011,00012,00013,00014,00015,00016,00017,00018,00019,000
Commerce determined Chinese foil sold at 48.64 to 106.09 per cent less than fair value and provided unfair subsidies to its producers of aluminum foil at rates of 17.17 to 80.97 percent
tonnes
2014 2015 2016 2017
Preliminary Subsidy Margins
Preliminary Dumping Margins
FebJanDecNovOct Sep AugJanJulJunAugJul FebNov MayAprSepAugJulJun Aug Jun JulDecOctMayAprMarFeb MarAprMar Sep Oct Nov DecOctSep DecNov MayAprMarFebJanJunMayJan
106
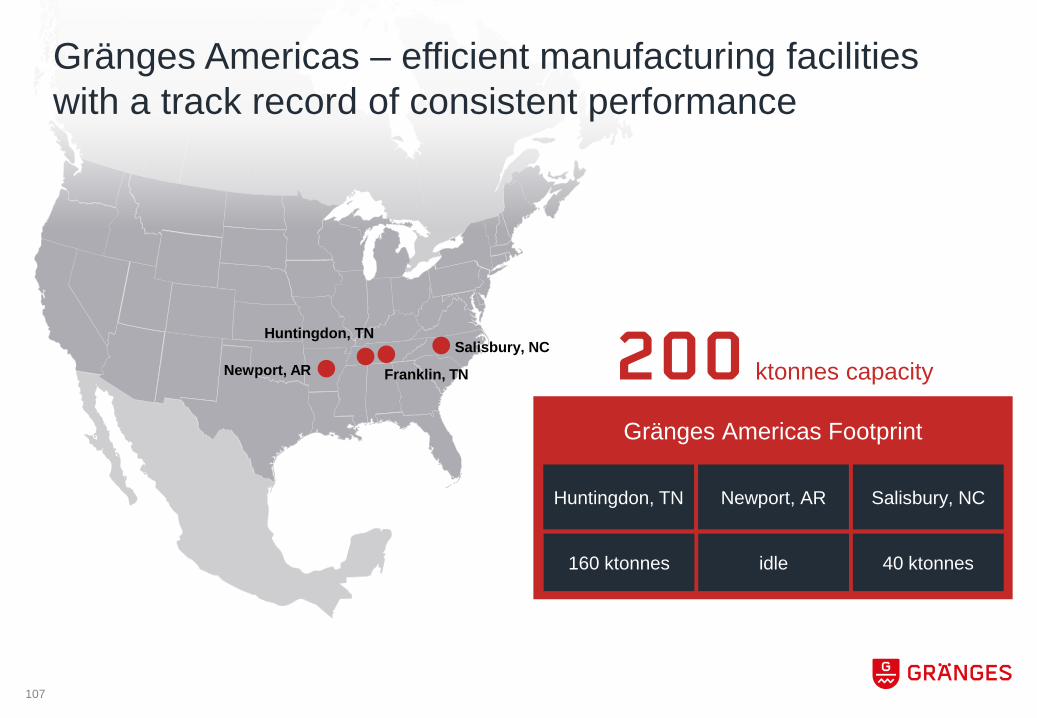
Gränges Americas Footprint
Huntingdon, TN Newport, AR Salisbury, NC
200 ktonnes capacityNewport, AR
Huntingdon, TNSalisbury, NC
Franklin, TN
160 ktonnes 40 ktonnesidle
Gränges Americas – efficient manufacturing facilities with a track record of consistent performance
107

Gränges Americas serves niche segments totaling 12 per cent of the flat rolled marketSales volume per end use market – excluding imports
Semi rigid containers
HVAC
#2
# Market position in North America
Non heat exchanger material Heat exchanger material
#1
Automotive #2
Transformer windings#1
Automotive heat shields
Other
Note: Market position in automotive heat exchanger materials include imports.
15%
3%
9%
22%
48%
3%
108
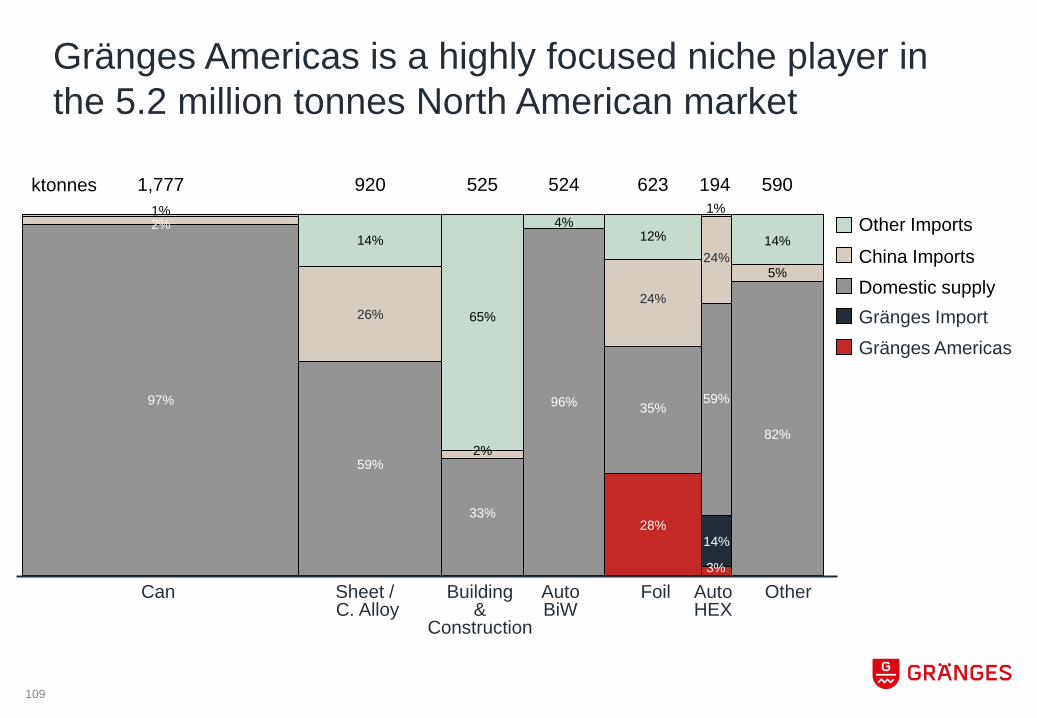
Domestic supplyChina Imports
Other Imports
Gränges Americas is a highly focused niche player in the 5.2 million tonnes North American market
65%
920
59%
Can
1,777
97%
2%1%
Other
14%
590
5%
14%
194
3%
96%
4%
Building&
Construction
525
33%
2%
14%
59%
1%
Foil
623
28%
35%
12%
AutoBiW
524ktonnes
AutoHEX
Sheet / C. Alloy
Gränges ImportGränges Americas
82%
26%
24%
24%
109
1%
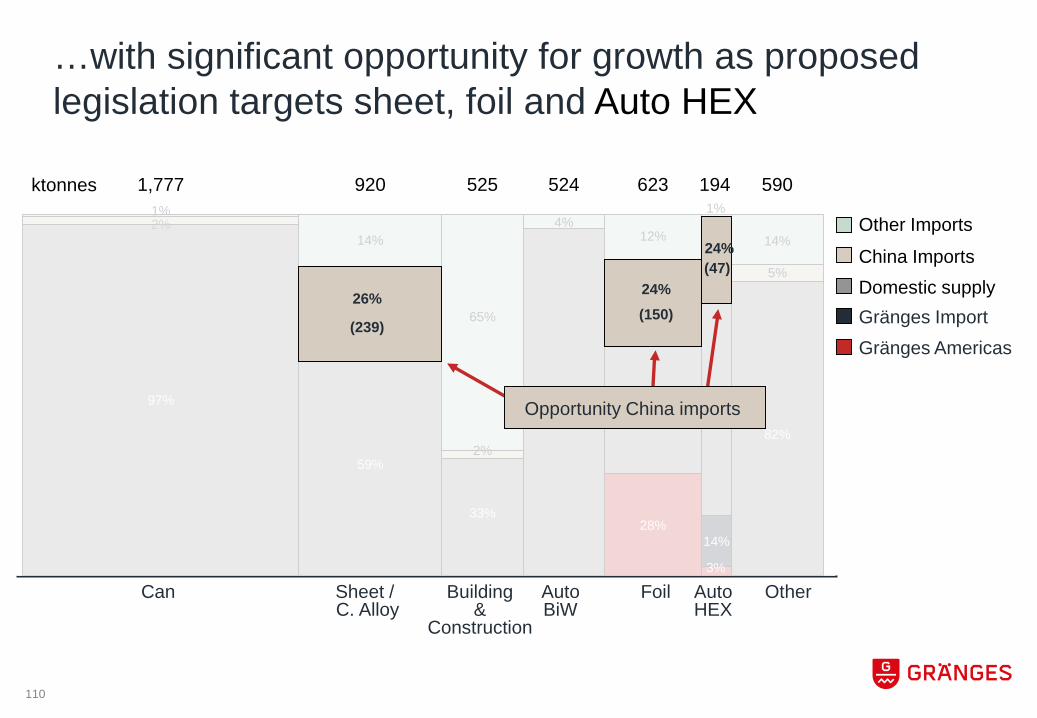
…with significant opportunity for growth as proposed legislation targets sheet, foil and Auto HEX
65%
920
59%
1,777
97%
2%1%
14%
590
5%
14%
194
3%
96%
4%
525
33%
2%
14%
59%
623
28%
35%
12%
524
82%
Can OtherBuilding&
Construction
FoilAutoBiW
AutoHEX
Sheet / C. Alloy
ktonnes
26% 24%
(239)(150)
(47)24%
Opportunity China imports
Domestic supplyChina Imports
Other Imports
Gränges ImportGränges Americas
110
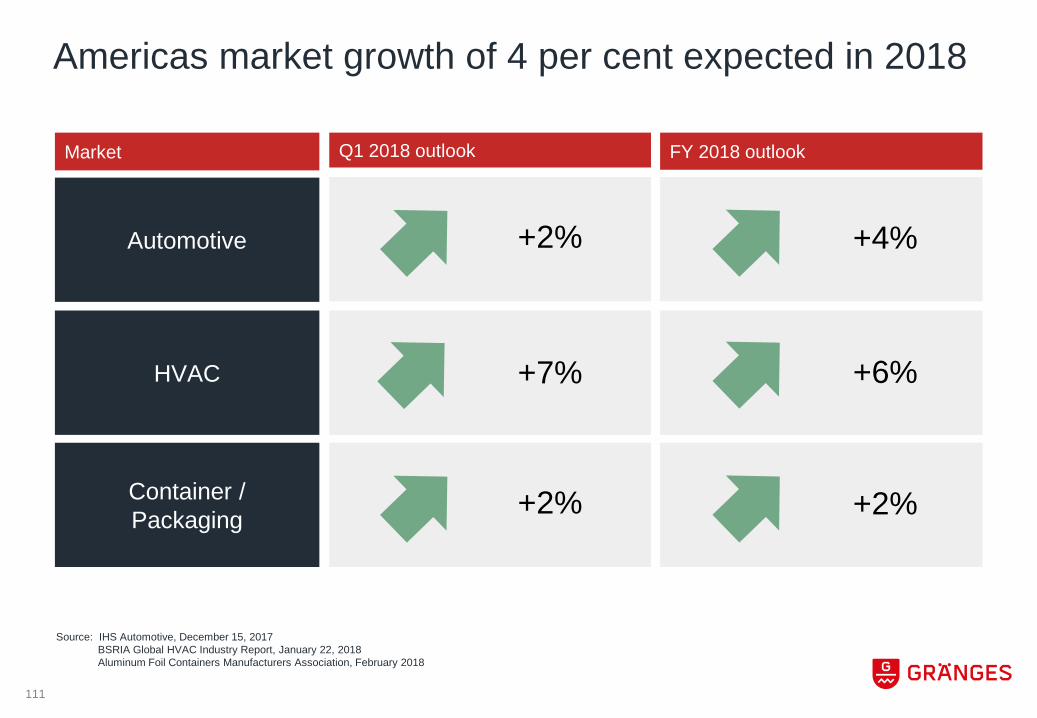
Americas market growth of 4 per cent expected in 2018
Source: IHS Automotive, December 15, 2017BSRIA Global HVAC Industry Report, January 22, 2018Aluminum Foil Containers Manufacturers Association, February 2018
Market
Automotive
HVAC
Container / Packaging
Q1 2018 outlook FY 2018 outlook
+7% +6%
+2%+2%
+4%+2%
111

Continued strong performance in 2017
○ Adjusted operating profit was SEK 268 million in 2017 (87)
○ Cashflow from operations amounted to SEK 302 million in 2017 (183)
172 180 187
22 28 30 194
2016
208
+12%
2017
217
2015
Gränges import
GrängesUS production
Volume (ktonnes)
Note: 2016 Post-Acquisition timeframe of August 22, 2016, through December 31, 2016
112
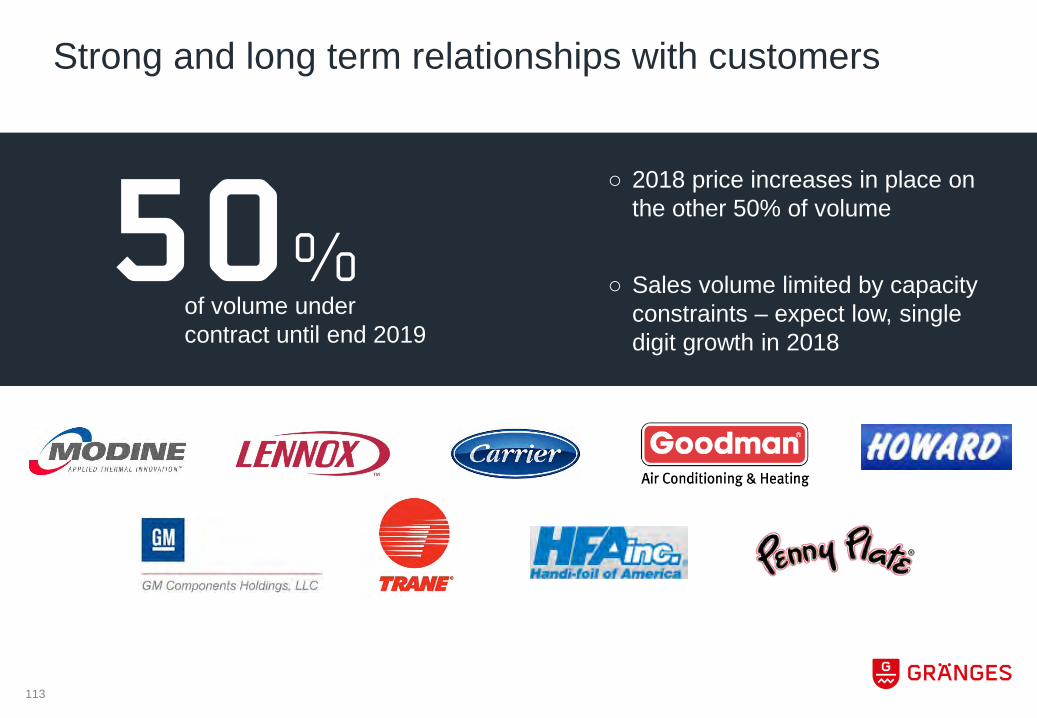
Strong and long term relationships with customers
○ 2018 price increases in place on the other 50% of volume
○ Sales volume limited by capacity constraints – expect low, single digit growth in 2018
50%of volume under contract until end 2019
113
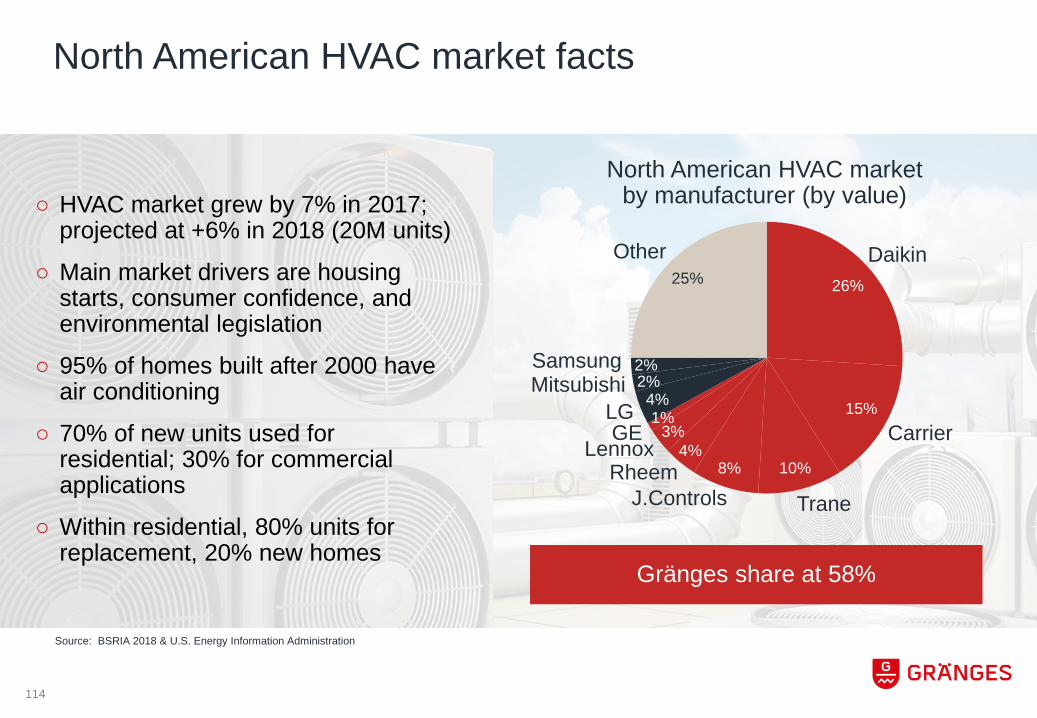
North American HVAC market facts
North American HVAC market by manufacturer (by value)
3%4%
RheemLennox
2%
25%
4%Mitsubishi 2%
LG 1%
Samsung
Other
GE
26%
J.Controls Trane
10%8%
Carrier
Daikin
15%
Gränges share at 58%
○ HVAC market grew by 7% in 2017; projected at +6% in 2018 (20M units)
○ Main market drivers are housing starts, consumer confidence, and environmental legislation
○ 95% of homes built after 2000 have air conditioning
○ 70% of new units used for residential; 30% for commercial applications
○ Within residential, 80% units for replacement, 20% new homes
Source: BSRIA 2018 & U.S. Energy Information Administration
114
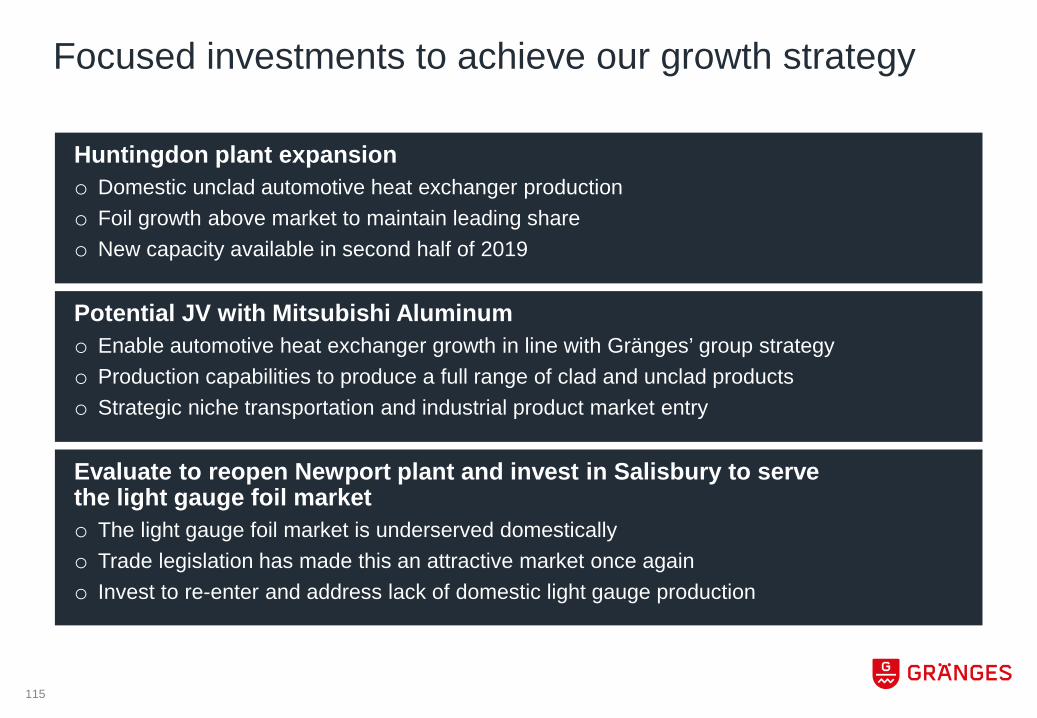
Focused investments to achieve our growth strategy
Huntingdon plant expansiono Domestic unclad automotive heat exchanger productiono Foil growth above market to maintain leading shareo New capacity available in second half of 2019
Potential JV with Mitsubishi Aluminumo Enable automotive heat exchanger growth in line with Gränges’ group strategyo Production capabilities to produce a full range of clad and unclad products o Strategic niche transportation and industrial product market entry
Evaluate to reopen Newport plant and invest in Salisbury to serve the light gauge foil market o The light gauge foil market is underserved domesticallyo Trade legislation has made this an attractive market once againo Invest to re-enter and address lack of domestic light gauge production
115

○ Investment in Huntingdon, Tennessee to meet growing demand on automotive heat exchanger materials, HVAC, and foil
○ Production capacity to increase from 160 to 200 ktonnes
○ The expansion will create 85 permanent full-time jobs
○ The project will contribute positively to operating profit in 2019
Gränges will invest USD 110 million to expand capacity and capabilities in the Huntingdon plant
116

○ Gränges has signed an LOI with Mitsubishi Aluminum Co., Ltd to form a joint venture in North America for manufacturing of advanced aluminium products for brazed heat exchangers and selected niche industrial applications
○ Both parties to evaluate establishment of a new production facility in North America
○ The joint venture agreement is expected to be signed in 2018. Additional terms will be disclosed when finalized
Gränges and Mitsubishi Aluminum to form a joint venture in North America
117
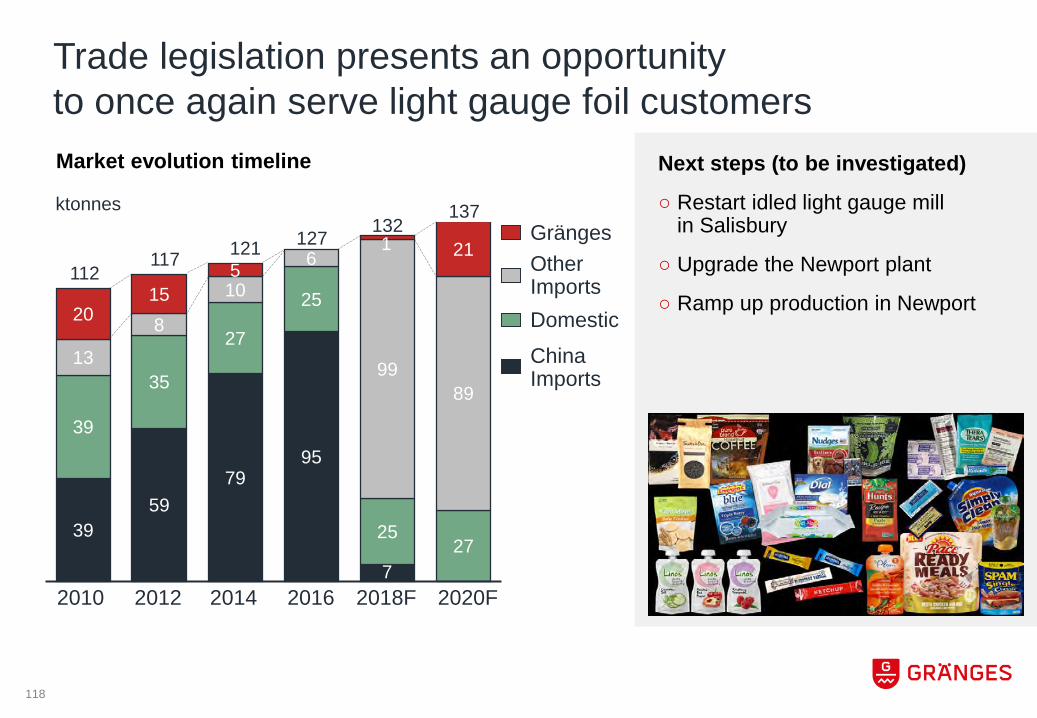
Trade legislation presents an opportunity to once again serve light gauge foil customers
Next steps (to be investigated)
○ Restart idled light gauge mill in Salisbury
○ Upgrade the Newport plant
○ Ramp up production in Newport
39 59
79 95
7
39
35
27
25
25 27
13
8
10 6
99 89
20 15
5 21
20162014 2020F2018F2010 2012
Domestic
Grängesktonnes
Market evolution timeline
Other Imports
ChinaImports
117127121
1121
137132
118

Conclusiono Strong foundation for growtho Strategy supports group targetso Niche market diversificationo Timing of US investments critical
119

Oskar HellströmCFO
FINANCIAL UPDATE
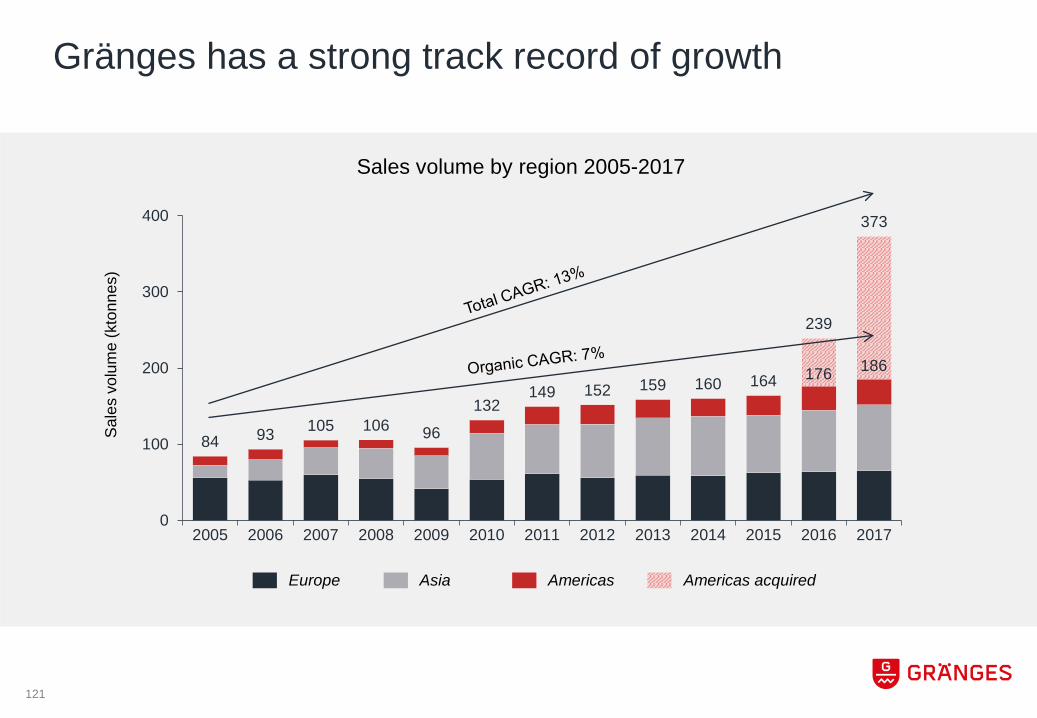
Gränges has a strong track record of growthSa
les
volu
me
(kto
nnes
)
Sales volume by region 2005-2017
84 93 105 106 96
132149 152 159 160 164
239
373
0
100
200
300
400
2005 2006 2007 2008 2009 2010 2011 2012 2013 2014 2015 2016 2017
Europe Asia Americas Americas acquired
176 186
121
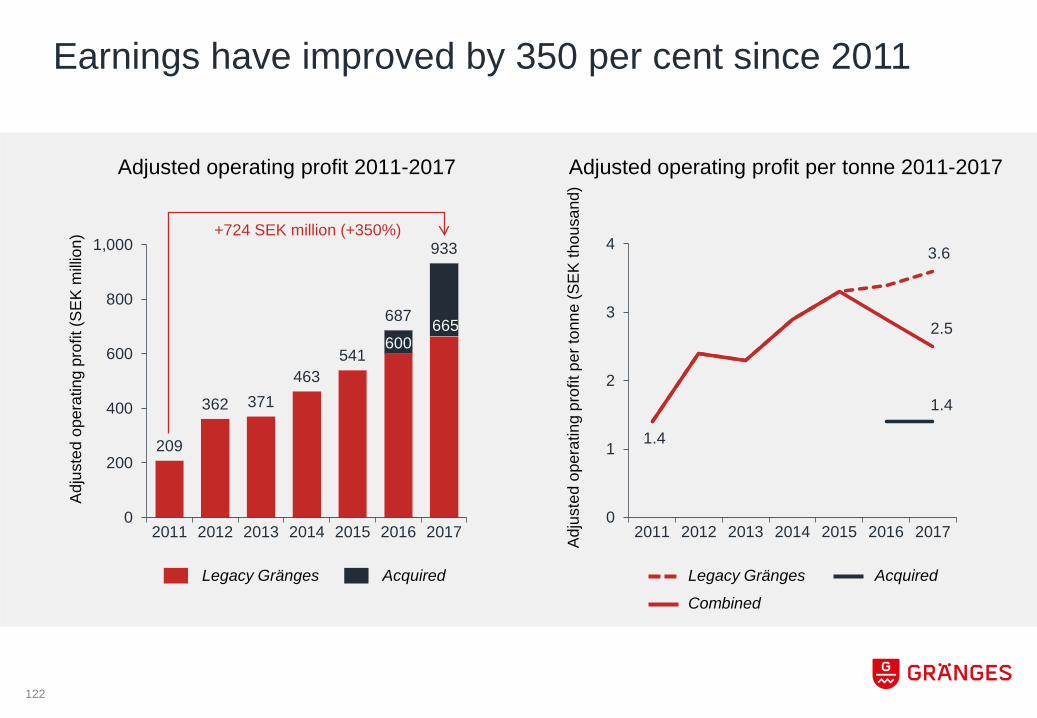
Earnings have improved by 350 per cent since 2011Ad
just
ed o
pera
ting
prof
it (S
EK m
illion
)
Adjusted operating profit 2011-2017
600665
209
362 371463
541
687
933
0
200
400
600
800
1,000
2011 2012 2013 2014 2015 2016 2017
Adju
sted
ope
ratin
g pr
ofit
per t
onne
(SEK
thou
sand
)
2.5
1.4
3.6
1.4
0
1
2
3
4
2011 2012 2013 2014 2015 2016 2017
Adjusted operating profit per tonne 2011-2017
Legacy Gränges AcquiredLegacy Gränges Acquired
Combined
+724 SEK million (+350%)
122
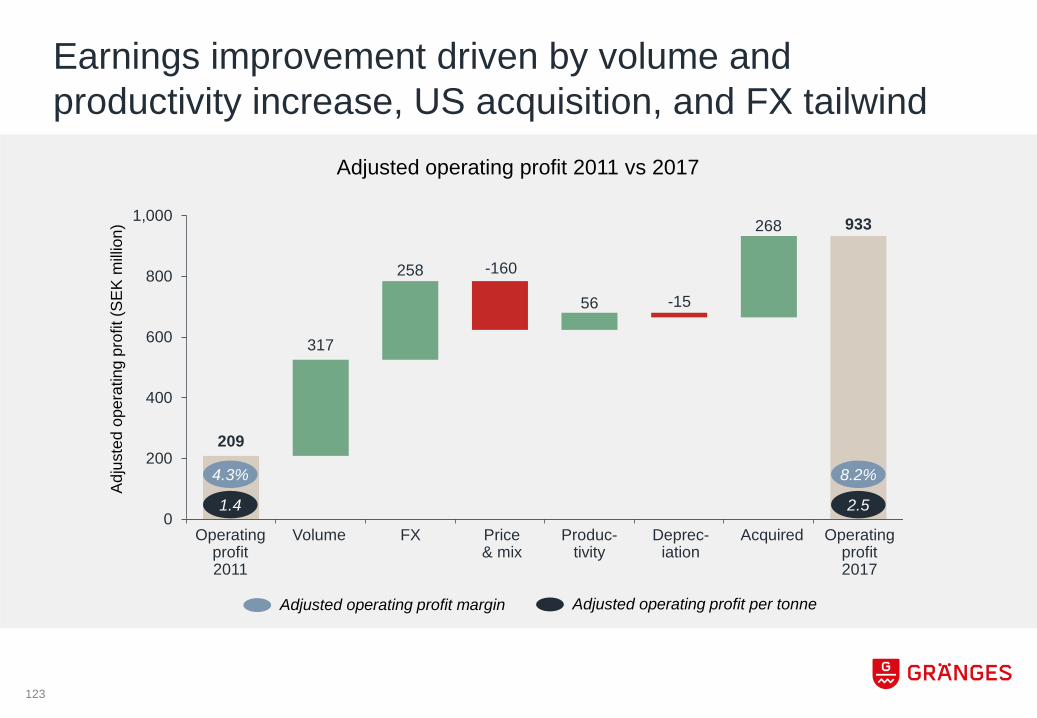
209
317
258 -160
56 -15
268 933
0
200
400
600
800
1,000
Earnings improvement driven by volume and productivity increase, US acquisition, and FX tailwind
4.3% 8.2%
1.4 2.5
Operating profit2011
Volume FX Price& mix
Produc-tivity
Deprec-iation
Acquired Operating profit2017
Adjusted operating profit 2011 vs 2017
Adju
sted
ope
ratin
g pr
ofit
(SEK
milli
on)
Adjusted operating profit margin Adjusted operating profit per tonne
123
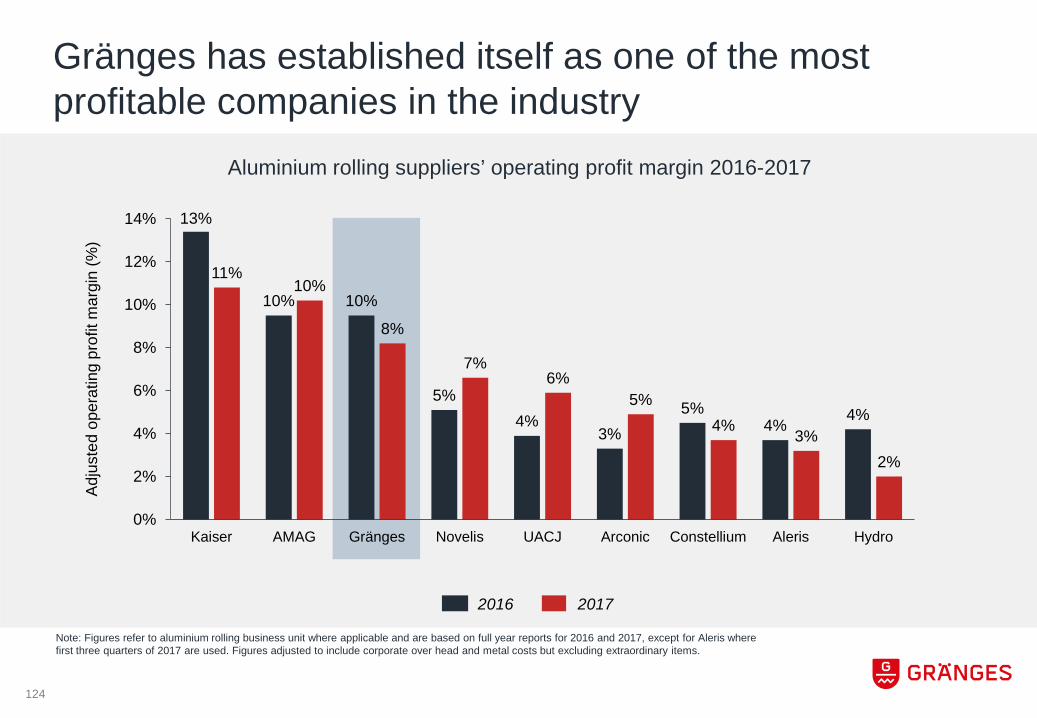
Gränges has established itself as one of the most profitable companies in the industry
13%
10% 10%
5%4%
3%5%
4% 4%
11%10%
8%
7%6%
5%4% 3%
2%
0%
2%
4%
6%
8%
10%
12%
14%
Kaiser AMAG Gränges Novelis UACJ Arconic Constellium Aleris Hydro
Aluminium rolling suppliers’ operating profit margin 2016-2017
Adju
sted
ope
ratin
g pr
ofit
mar
gin
(%)
Note: Figures refer to aluminium rolling business unit where applicable and are based on full year reports for 2016 and 2017, except for Aleris where first three quarters of 2017 are used. Figures adjusted to include corporate over head and metal costs but excluding extraordinary items.
2016 2017
124
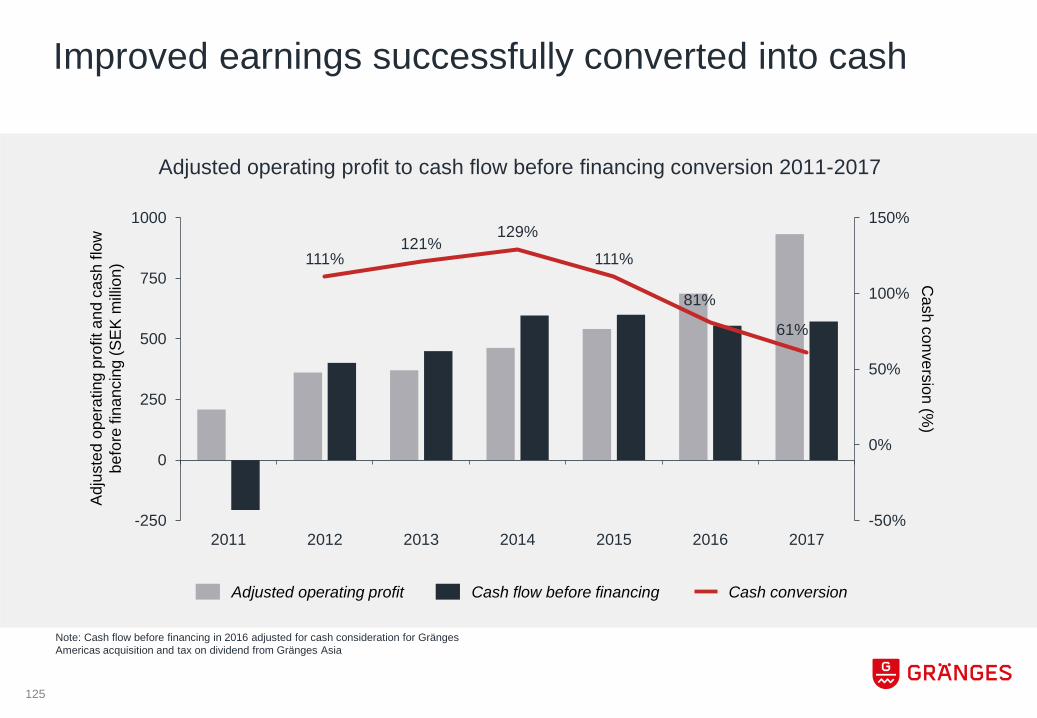
Improved earnings successfully converted into cash
Adjusted operating profit to cash flow before financing conversion 2011-2017
Adju
sted
ope
ratin
g pr
ofit
and
cash
flow
be
fore
fina
ncin
g (S
EK m
illion
) 111%121%
129%
111%
81%
61%
-50%
0%
50%
100%
150%
-250
0
250
500
750
1000
2011 2012 2013 2014 2015 2016 2017
Cash conversion (%
)
Cash flow before financing Cash conversionAdjusted operating profit
Note: Cash flow before financing in 2016 adjusted for cash consideration for Gränges Americas acquisition and tax on dividend from Gränges Asia
125

Note: Working capital days calculated based on rolling 3 months average working capital and rolling 3 months sales
Working capital days 2011-2017
112
9296 95 92
60 63
25
50
75
100
125
2011 2012 2013 2014 2015 2016 2017
Wor
king
cap
ital d
ays
Cash generation supported by working capital reduction
126
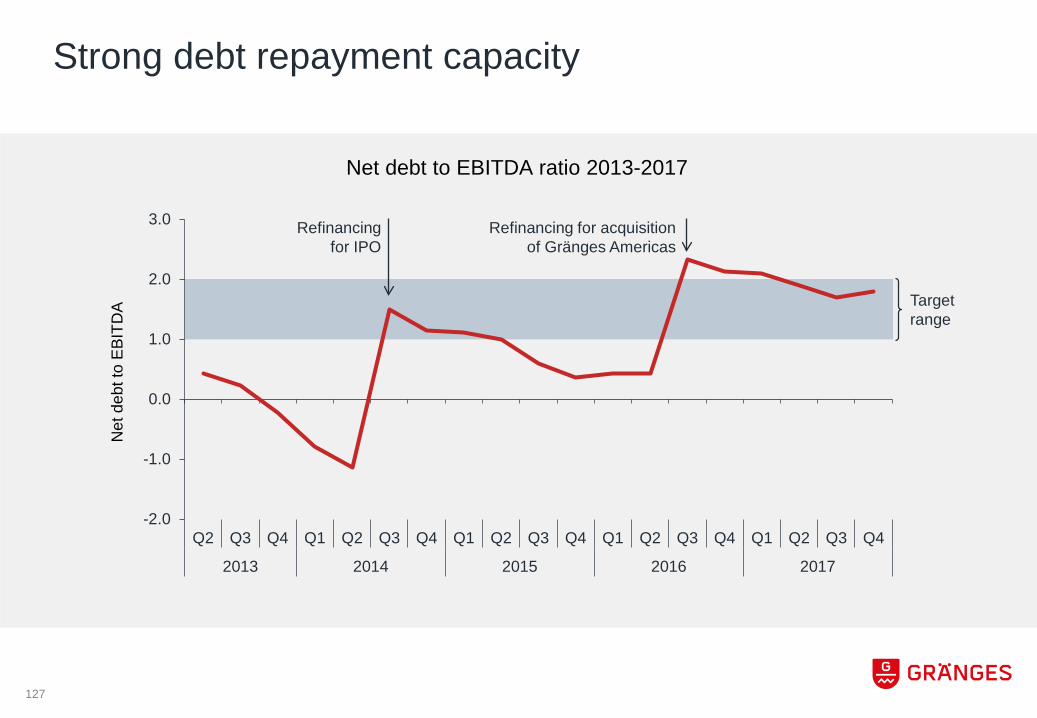
Strong debt repayment capacity
-2.0
-1.0
0.0
1.0
2.0
3.0
Q2 Q3 Q4 Q1 Q2 Q3 Q4 Q1 Q2 Q3 Q4 Q1 Q2 Q3 Q4 Q1 Q2 Q3 Q4
2013 2014 2015 2016 2017
Net
deb
t to
EBIT
DA Target
range
Net debt to EBITDA ratio 2013-2017
Refinancing for IPO
Refinancing for acquisition of Gränges Americas
127

Gränges’ strong financial position provides flexibility while balancing business risk
Strong balance sheet for
shareholder value
Riskmanagement
Capacityfor growth
Sustainingcapex
○ Exposure to auto-motive industry cyclicality
○ Exposure to metal price fluctuationson working capital
○ Sustaining capex to ensure operational excellence, improve productivity, and reduce costs
○ Reliable and predictable dividendpayments
○ Reinvestments in profitable organic growth and M&A
Dividend
Short term Long term
128
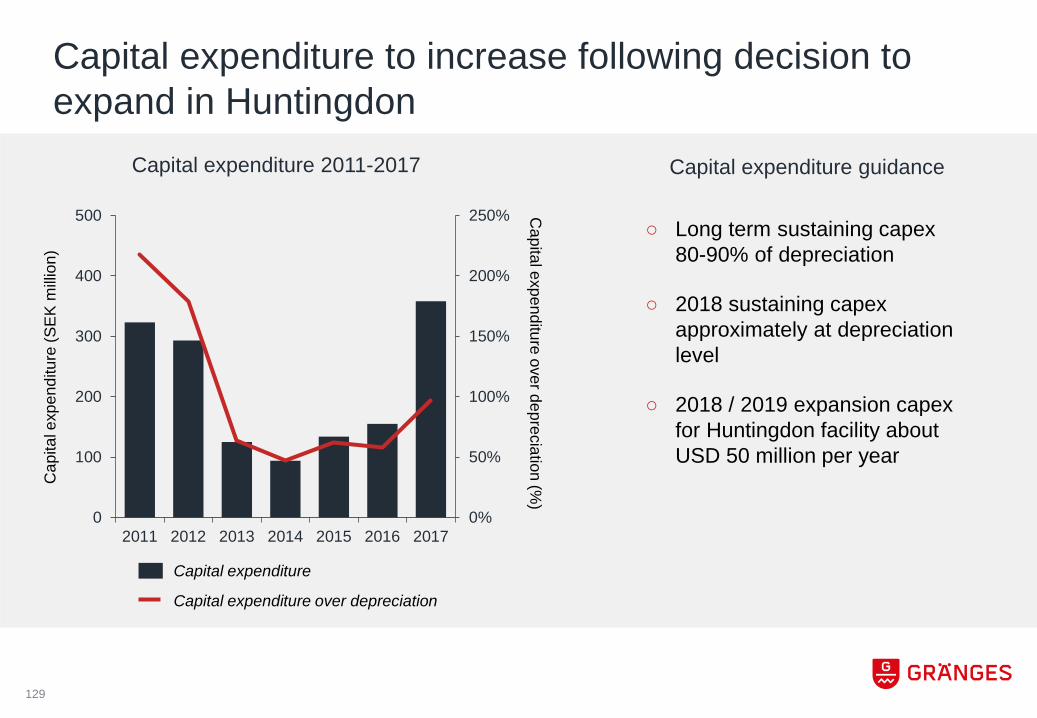
Capital expenditure to increase following decision to expand in Huntingdon
Capital expenditure 2011-2017
Cap
ital e
xpen
ditu
re (S
EK m
illion
)
Capital expenditure over depreciation (%
)
Capital expenditure
Capital expenditure over depreciation
0%
50%
100%
150%
200%
250%
0
100
200
300
400
500
2011 2012 2013 2014 2015 2016 2017
○ Long term sustaining capex 80-90% of depreciation
○ 2018 sustaining capex approximately at depreciation level
○ 2018 / 2019 expansion capex for Huntingdon facility about USD 50 million per year
Capital expenditure guidance
129
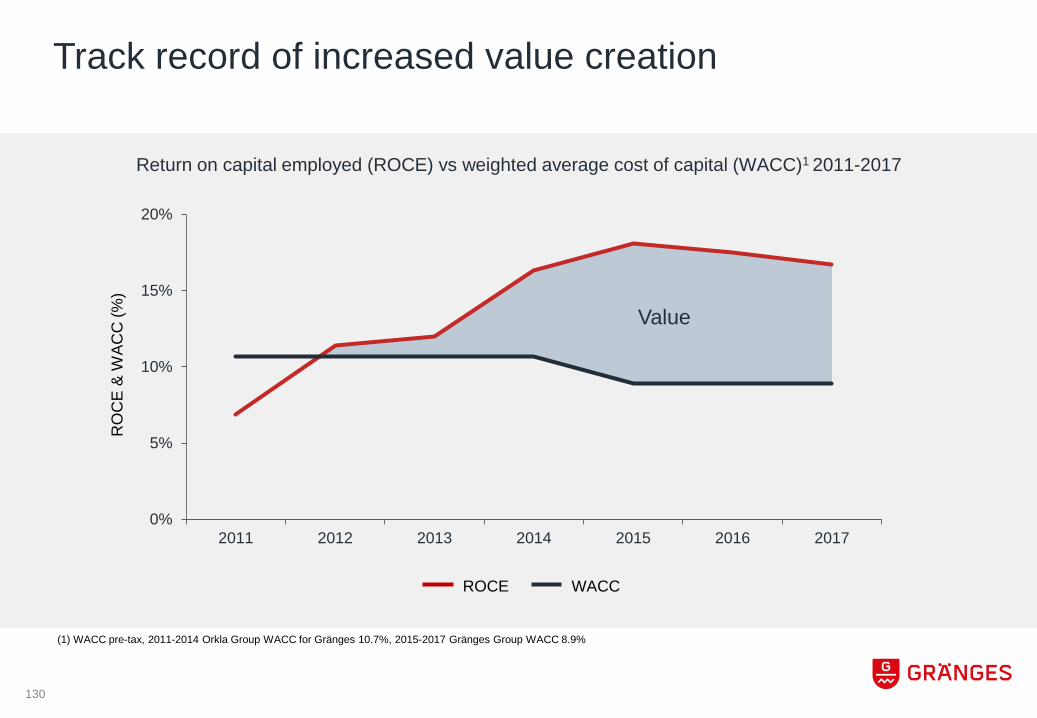
Track record of increased value creation
Return on capital employed (ROCE) vs weighted average cost of capital (WACC)1 2011-2017
RO
CE
& W
ACC
(%)
(1) WACC pre-tax, 2011-2014 Orkla Group WACC for Gränges 10.7%, 2015-2017 Gränges Group WACC 8.9%
0%
5%
10%
15%
20%
2011 2012 2013 2014 2015 2016 2017
Value
ROCE WACC
130
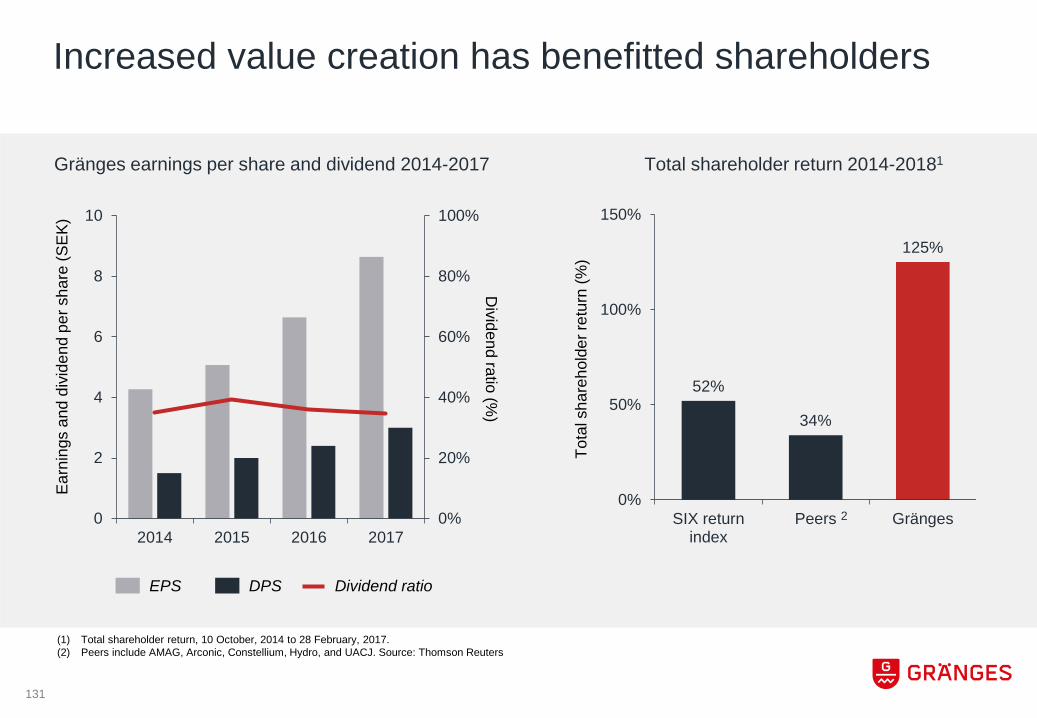
Increased value creation has benefitted shareholders
Gränges earnings per share and dividend 2014-2017
Earn
ings
and
div
iden
d pe
r sha
re (S
EK)
0%
20%
40%
60%
80%
100%
0
2
4
6
8
10
2014 2015 2016 2017D
ividend ratio (%)
DPS Dividend ratioEPS
Total shareholder return 2014-20181
52%
34%
125%
0%
50%
100%
150%
SIX returnindex
Peers Gränges
Tota
l sha
reho
lder
retu
rn (%
)
(1) Total shareholder return, 10 October, 2014 to 28 February, 2017.(2) Peers include AMAG, Arconic, Constellium, Hydro, and UACJ. Source: Thomson Reuters
2
131
Conclusiono Strong track record of growth and earnings improvemento Top profitability among industry peerso Effective capital management supporting cash conversion
and debt repaymento Solid balance sheet allowing for dividends and investments
in future growtho Increasing value creation and returns
132
Related Documents