Down for Now, but It’s Just a ‘Gully’ PRIVATE EQUITY Almost every private equity transaction measure in the first quarter was down substantially, with only fundraising dollar volume increasing. With the recovery in first quarter equity markets, we expect private equity to also shrug-off the “gully” as the year progresses. Hedge Funds Mixed; Some MACs Thrive HEDGE FUNDS/MACs The Credit Suisse Hedge Fund Index gained 4.0% in the first quarter, and the Callan Hedge Fund-of-Funds Database Group rose 3.6%. The Callan Multi-Asset Class (MAC) Style Groups showed positive but widely diverging results, with the overall group up 6.7%. DC Index Limps to the Finish Line DEFINED CONTRIBUTION The Callan DC Index™ fell 4.9% in 2018, but it outperformed the typical Age 45 Target Date Fund for the year by over 2 percentage points. For the first time in the history of the DC Index, target date funds did not experience the largest inflows; instead, stable value funds did. Real Estate Healthy; Real Assets Rebound REAL ESTATE/REAL ASSETS The NCREIF Property Index, a measure of U.S. institutional real estate assets, gained 1.8% during the first quarter. REITs across the globe bounced back. Real assets of all varieties enjoyed a strong first quarter, with energy an especially big gainer. Equity Rebound Fuels Strong Returns FUND SPONSOR After the drop in 2018, equity markets rebounded during the first quarter. Fund sponsors echoed that theme, producing strong results across the board. Funds continue to retain a strong tilt toward growth assets, with many citing the need to meet funding requirements. Resilience in the Face of Uncertainty ECONOMY Investor confidence has shifted wildly over the past six months. Markets swooned in the fourth quarter but rebounded in the first. GDP growth bounced back as well. Is everything fine again? Underneath the good news, there are signs we may be at the peak of the current cycle. 2 PAGE 12 PAGE U.S., Global Stocks See Big Bounce Back EQUITY U.S. equity markets dramatically snapped back in the first quarter, driven by the Fed’s unexpected dovish comments in January, solid corporate fundamentals, and low unemployment. Global equity markets were up in the first quarter following a sharp sell-off to end 2018. 4 PAGE Bonds Join the Rally in Global Markets FIXED INCOME The first quarter’s strong results recaptured most of the loss in the prior quarter for riskier U.S. fixed income. Developed market sovereign bonds rallied in tandem with Treasuries. Emerging market bonds also rebounded. Positive net inflows into the EM universe continued. 8 PAGE 6 PAGE 13 PAGE 15 PAGE 10 PAGE Broad Market Quarterly Returns 10.3% 2.9% 14.0% 1.5% U.S. Equity Russell 3000 U.S. Fixed Income Bloomberg Barclays Agg Non-U.S. Equity MSCI ACWI ex USA Non-U.S. Fixed Income Bloomberg Barclays Gbl ex US Sources: Bloomberg Barclays, FTSE Russell, MSCI Capital Market Review First Quarter 2019

Welcome message from author
This document is posted to help you gain knowledge. Please leave a comment to let me know what you think about it! Share it to your friends and learn new things together.
Transcript

Down for Now, but It’s Just a ‘Gully’PRIVATE EQUITY
Almost every private equity transaction measure in the first
quarter was down substantially, with only fundraising dollar volume increasing. With the recovery in first quarter equity markets, we expect private equity to also shrug-off the “gully” as the year progresses.
Hedge Funds Mixed; Some MACs ThriveHEDGE FUNDS/MACs
The Credit Suisse Hedge Fund Index gained 4.0% in the first quarter, and
the Callan Hedge Fund-of-Funds Database Group rose 3.6%. The Callan Multi-Asset Class (MAC) Style Groups showed positive but widely diverging results, with the overall group up 6.7%.
DC Index Limps to the Finish LineDEFINED CONTRIBUTION
The Callan DC Index™ fell 4.9% in 2018, but it outperformed the typical
Age 45 Target Date Fund for the year by over 2 percentage points. For the first time in the history of the DC Index, target date funds did not experience the largest inflows; instead, stable value funds did.
Real Estate Healthy; Real Assets ReboundREAL ESTATE/REAL ASSETS
The NCREIF Property Index, a measure of U.S. institutional real
estate assets, gained 1.8% during the first quarter. REITs across the globe bounced back. Real assets of all varieties enjoyed a strong first quarter, with energy an especially big gainer.
Equity Rebound Fuels Strong ReturnsFUND SPONSOR
After the drop in 2018, equity markets rebounded during the
first quarter. Fund sponsors echoed that theme, producing strong results across the board. Funds continue to retain a strong tilt toward growth assets, with many citing the need to meet funding requirements.
Resilience in the Face of UncertaintyECONOMY
Investor confidence has shifted wildly over the past six months. Markets
swooned in the fourth quarter but rebounded in the first. GDP growth bounced back as well. Is everything fine again? Underneath the good news, there are signs we may be at the peak of the current cycle.
2P A G E
12P A G E
U.S., Global Stocks See Big Bounce BackEQUITY
U.S. equity markets dramatically snapped back in the first quarter,
driven by the Fed’s unexpected dovish comments in January, solid corporate fundamentals, and low unemployment. Global equity markets were up in the first quarter following a sharp sell-off to end 2018.
4P A G E
Bonds Join the Rally in Global MarketsFIXED INCOME
The first quarter’s strong results recaptured most of the loss in the prior
quarter for riskier U.S. fixed income. Developed market sovereign bonds rallied in tandem with Treasuries. Emerging market bonds also rebounded. Positive net inflows into the EM universe continued.
8P A G E
6P A G E
13P A G E
15P A G E
10P A G E
Broad Market Quarterly Returns
10.3% 2.9%14.0% 1.5%
U.S. EquityRussell 3000
U.S. Fixed IncomeBloomberg Barclays Agg
Non-U.S. EquityMSCI ACWI ex USA
Non-U.S. Fixed IncomeBloomberg Barclays Gbl ex US
Sources: Bloomberg Barclays, FTSE Russell, MSCI
CapitalMarket Review
First Quarter 2019

2
Resilience in the Face of Uncertainty ECONOMY | Jay Kloepfer
02 0399 00 01 04 05 06 07 08 09 10 11 12 13 14 15 16 17-10%
-8%
-6%
-4%
-2%
0%
2%
4%
6%
8%
1819
Quarterly Real GDP Growth (20 Years)
-15%
-10%
-5%
0%
5%
10%
15%
20%PPI (All Commodities)CPI (All Urban Consumers)
02 0399 00 01 04 05 06 07 08 09 10 11 12 13 14 15 16 17 1819
Inflation Year-Over-Year
Source: Bureau of Labor Statistics
Source: Bureau of Economic Analysis
Investor confidence has shifted wildly over the past six months. Anxiety, panic, and gloom pushed equity markets down around the globe through the last three months of 2018, culminating in one of the worst Decembers in decades. The pessimism derailed global interest rate policy. The central banks in the euro zone had yet to join the U.S. in reversing years of monetary eas-ing, and they may now skip this cycle of tightening altogether. The Fed pressed “pause” on its own tightening plan in January after nine rate hikes. The equity markets then surged during the first quarter of 2019, moving back toward the all-time high set last October, and volatility evaporated.
What changed in the fall of 2018 and then in the first quarter of 2019 to cause this whipsaw of sentiment? U.S. GDP growth softened in the fourth quarter to a still healthy 2.2%, but then notched a surprisingly strong 3.2% increase in the first quarter. This robust gain is a sign of resilience in the face of the fourth quarter market swoon and the uncertainty generated by the government shutdown in January of this year. The increase also reversed a pattern in recent years of inexplicably slower growth in first quarter GDP. The solid GDP report was accompanied by a surge in durable goods orders reported in March, strong exports, sustained job growth, and of course the reversal of the fourth quarter stock market slump.
All of the sudden, everything is fine again. Or is it? Underneath all the good news, there are signs that we may be at the peak of the current economic cycle. More than half of the robust first quarter GDP gain came from net exports and inventory accu-mulation. Greater investment in inventories now, which adds to GDP, means less investment in the future. Exports rose and imports slumped; both are positive contributions to GDP but neither may be sustainable. Final sales to domestic purchasers, which excludes both trade and inventory building, rose at a more modest 1.4% rate, down from a 2.1% gain in the fourth quarter. Personal consumption inched up 1.2%, less than half the growth rate enjoyed over the year in 2018. To be fair, the weakness in these quarterly data appears to have been concentrated at the
start of the year, and the reports for many indicators showed a big bounce in March.
On the positive side of the ledger, the government shutdown in January had a temporary effect, shifting the timing of activity and employment, but the net impact should be minimal. The job market saw a sharp drop in February, to just 33,000 new jobs, only to see a snap back to 196,000 in March. The average gain for the first three months was 180,000, lower than the aver-age for last year but substantially above the bellwether mark

3
U.S. ECONOMY (Continued)
The Long-Term View
20191st Qtr
Periods ended Dec. 31, 2018Index Year 5 Yrs 10 Yrs 25 YrsU.S. EquityRussell 3000 14.04 -5.24 7.91 13.18 9.04
S&P 500 13.65 -4.38 8.49 13.12 9.07
Russell 2000 14.58 -11.01 4.41 11.97 8.28
Non-U.S. EquityMSCI EAFE 9.98 -13.79 0.53 6.32 4.63
MSCI ACWI ex USA 10.31 -14.20 0.68 6.57 --
MSCI Emerging Markets 9.93 -14.57 1.65 8.02 --
MSCI ACWI ex USA Small Cap 10.26 -18.20 1.96 10.02 --
Fixed IncomeBloomberg Barclays Agg 2.94 0.01 2.52 3.48 5.09
90-Day T-Bill 0.60 1.87 0.63 0.37 2.55
Bloomberg Barclays Long G/C 6.45 -4.68 5.37 5.88 6.82
Bloomberg Barclays Gl Agg ex US 1.52 -2.15 -0.01 1.73 4.39
Real EstateNCREIF Property 1.80 6.72 9.33 7.49 9.34
FTSE Nareit Equity 16.33 -4.62 7.90 12.12 9.76
AlternativesCS Hedge Fund 3.99 -3.19 1.66 5.10 7.27
Cambridge PE* -0.53 10.61 11.94 13.76 15.20
Bloomberg Commodity 6.32 -11.25 -8.80 -3.78 2.03
Gold Spot Price 1.34 -2.14 1.28 3.78 4.85
Inflation – CPI-U 1.18 1.91 1.51 1.80 2.20
*Data for most recent period lags by a quarter. Data as of December 31, 2018. Sources: Bloomberg, Bloomberg Barclays, Bureau of Economic Analysis, Credit Suisse, FTSE Russell, MSCI, NCREIF, Standard & Poor’s, Refinitiv/Cambridge
Recent Quarterly Economic Indicators
1Q19 4Q18 3Q18 2Q18 1Q18 4Q17 3Q17 2Q17Employment Cost–Total Compensation Growth 2.8% 2.9% 2.8% 2.8% 2.7% 2.6% 2.5% 2.4%
Nonfarm Business–Productivity Growth 3.6% 1.3% 1.9% 2.9% 0.7% -0.3% 2.3% 1.7%
GDP Growth 3.2% 2.2% 3.4% 4.2% 2.2% 2.3% 2.8% 3.0%
Manufacturing Capacity Utilization 76.6% 77.0% 76.9% 76.4% 76.1% 75.8% 74.9% 75.2%
Consumer Sentiment Index (1966=100) 94.5 98.2 98.1 98.3 98.9 98.4 95.1 96.4
Sources: Bureau of Economic Analysis, Bureau of Labor Statistics, Federal Reserve, IHS Economics, Reuters/University of Michigan
of 100,000 per month required to keep the economy growing. Manufacturing employment in the U.S. declined in the first quar-ter, despite the residual strength in capital goods orders. While both the Markit manufacturing and services PMIs slipped in the first quarter, they remain above readings of 50, the dividing line between expansion and contraction. Of particular interest is the eye-catching rebound in China’s manufacturing PMI, which jumped from a borderline reading of 50 to 58 in March.
The narrative has changed sharply since the nadir of December 2018. The stock market slump reversed, credit spreads have narrowed, and the potential for the yield curve to steepen has returned. The rebound in GDP and durable goods orders in March, the resilience of the job market, and the gain in net exports reinforce the perception that we are poised to see economic growth reaccelerate in the second quarter. Not all the indicators suggest good news, however. Oil prices have rebounded, driving up gasoline prices and crimping household disposable income. Home price gains, which have an attendant wealth effect typically more wide-spread and powerful than the wealth effect from the equity market, are slowing. Finally, the continuing strength of the dollar adds to the headwinds facing manufacturing.
Trade and trade policy dominates headlines, but it is worth noting that the impact of trade in the U.S. is far lower than in most of our trading partners, both developed and emerging. One measure is the trade-to-GDP ratio, the sum of exports and imports as a percentage of GDP. (Note that exports add to GDP while imports subtract from GDP, but the sum of their share of GDP is a reasonable measure of the impact of total trade activity on an economy.) Exports and imports include both goods and services. Trade has certainly become a larger
component of U.S. GDP over time, with exports rising from 7% in 1985 to 12.3% in 2018 while imports rose from 9% to 15.5%. Trade activity now involves 27.8% of U.S. GDP. By compari-son, the World Bank calculates that trade accounts for 37.8% of China GDP, 62.5% for the U.K., 77.6% for Mexico, and 87% for Germany.
4
Equity Rebound Fuels ReturnsFUND SPONSOR
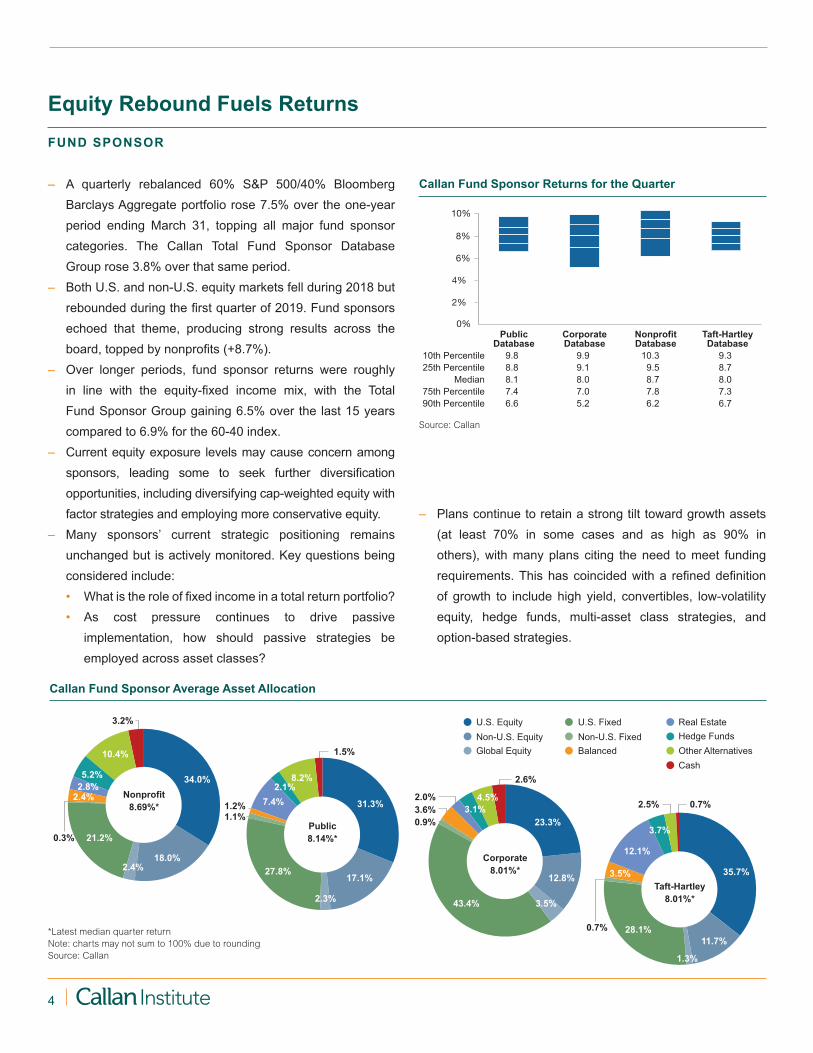
– A quarterly rebalanced 60% S&P 500/40% Bloomberg Barclays Aggregate portfolio rose 7.5% over the one-year period ending March 31, topping all major fund sponsor categories. The Callan Total Fund Sponsor Database Group rose 3.8% over that same period.
– Both U.S. and non-U.S. equity markets fell during 2018 but rebounded during the first quarter of 2019. Fund sponsors echoed that theme, producing strong results across the board, topped by nonprofits (+8.7%).
– Over longer periods, fund sponsor returns were roughly in line with the equity-fixed income mix, with the Total Fund Sponsor Group gaining 6.5% over the last 15 years compared to 6.9% for the 60-40 index.
– Current equity exposure levels may cause concern among sponsors, leading some to seek further diversification opportunities, including diversifying cap-weighted equity with factor strategies and employing more conservative equity.
– Many sponsors’ current strategic positioning remains unchanged but is actively monitored. Key questions being considered include:• What is the role of fixed income in a total return portfolio?• As cost pressure continues to drive passive
implementation, how should passive strategies be employed across asset classes?
0%
2%
4%
6%
8%
10%
Public Corporate Nonprofit Taft-Hartley Database Database Database Database 10th Percentile 9.8 9.9 10.3 9.3 25th Percentile 8.8 9.1 9.5 8.7 Median 8.1 8.0 8.7 8.0 75th Percentile 7.4 7.0 7.8 7.3 90th Percentile 6.6 5.2 6.2 6.7
Callan Fund Sponsor Returns for the Quarter
Source: Callan
U.S. Fixed Non-U.S. Fixed
Real EstateHedge FundsOther AlternativesCash
Balanced
U.S. EquityNon-U.S. EquityGlobal Equity
2.0%
Public8.14%*
31.3%
17.1%27.8%
2.1%7.4%
1.1%
2.3%
8.2%
1.5%
Nonprofit8.69%*
34.0%
18.0%
21.2%
2.4%
0.3%
5.2%2.8%
10.4%
3.2%
Taft-Hartley8.01%*
1.2%
Corporate8.01%*
1.3%
2.5% 0.7%
35.7%
28.1%11.7%
0.7%
3.5%
12.1%
3.7%
12.8%
2.6%
23.3%
43.4%
3.6%0.9%
4.5%
3.5%
2.4%
3.1%
Callan Fund Sponsor Average Asset Allocation
*Latest median quarter returnNote: charts may not sum to 100% due to roundingSource: Callan
– Plans continue to retain a strong tilt toward growth assets (at least 70% in some cases and as high as 90% in others), with many plans citing the need to meet funding requirements. This has coincided with a refined definition of growth to include high yield, convertibles, low-volatility equity, hedge funds, multi-asset class strategies, and option-based strategies.

5
FUND SPONSOR (Continued)
Source: Callan. Callan’s database includes the following groups: public defined benefit, corporate defined benefit, nonprofits, and Taft-Hartley plans. Approximately 10% to 15% of the database constituents are Callan’s clients. All database group returns presented gross of fees. Past performance is no guarantee of future results. Reference to or inclusion in this report of any product, service, or entity should not be construed as a recommendation, approval, affiliation, or endorsement of such product, service, or entity by Callan.
– Sponsors face continued fee pressure. Fund sponsor clients are focusing on fee studies, reviews of institutional vehicles, the addition of advisory services and/or vendor reviews, and evaluations of the fund structure lineup.
– Sponsors face challenges in setting capital market expectations in a volatile market environment. Where should they start? What is the time horizon? Does valuation matter? At what interest rate? Discipline in the face of uncertainty is difficult. In addition, interest rate volatility wreaks havoc with liability-driven investing glidepaths.
– The first quarter is the season for asset-liability reviews. Among the subjects being discussed:• Proper time horizon for the return on assets (ROA) for
a public plan• Tension between 10-year assumptions and “equilibrium”
assumptions
• Concern about high risk exposure but resistance to de-risking when a shorter horizon ROA is less than the public plan’s ROA
– Corporate plans moving down de-risking glidepaths are reconsidering their equity structures. Growth exposure is typically concentrated in public equity. The focus is often on cost, full diversification to equity beta in the context of liability-driven investing, implementation, and whether equity is the place to spend any active management budget.
– These same corporate plans are examining their fixed income structures at both the current point in time and as they prepare to further de-risk once they move down their glidepaths. Plans expect to move from off-the-shelf, long government/credit exposures to custom portfolios that match their interest rate and credit spread exposures.
Callan Database Median and Index Returns* for Periods ended March 31, 2019
Fund Sponsor Quarter Year 3 Years 5 Years 10 Years 15 YearsPublic Database 8.14 3.97 8.60 6.14 9.99 6.54Corporate Database 8.01 3.83 7.82 5.79 9.92 6.56Nonprofit Database 8.69 3.28 8.51 5.68 9.89 6.56Taft-Hartley Database 8.01 4.52 8.54 6.62 10.05 6.49All Funds 8.26 3.83 8.39 5.99 9.95 6.54Large (>$1 billion) 7.50 4.06 8.57 6.27 10.13 6.79Medium ($100mm - $1bn) 8.26 3.85 8.40 6.01 9.92 6.44Small (<$100 million) 8.55 3.68 8.24 5.77 9.76 6.37*Returns less than one year are not annualized.

6
U.S. EquitiesEquity markets dramatically snapped back in the first quarter, driven by the Fed’s unexpected dovish comments in January, solid corporate fundamentals, and low unemployment.
Large Cap ► S&P 500: +13.6% | Russell 1000: +14.0% – All sectors delivered double-digit gains with the exception of
Financials (+8.6%) and Health Care (+6.6%). – Consumers remain in good shape, with household debt
service as a percentage of disposable income at the lowest level in decades.
– The risk-on market was highlighted by low quality (S&P ratings B or lower) outperforming high quality (B+ or higher) by 440 basis points.
– Surprisingly, Utilities and REITs produced double-digit returns; investors sought yield in the face of a flattening yield curve and the end to rate hikes in the first quarter.
Small Cap ► Russell 2000: +14.6% | Russell 2000 Growth: +17.1% | Russell 2000 Value: +11.9%
– Within the Russell 2000 Growth Index, the three largest sectors (Health Care, Consumer Discretionary, and Technology) surged 19%, 17%, and 23%, respectively. Software and biotechnology both posted 25% gains in the quarter; combined they are more than 23% of the benchmark weight.
– Influenced by excessive fourth quarter tax-loss selling, the market experienced a strong “January effect”—where last year’s losers became January 2019’s winners.
Global Equity
Growth vs. Value ► Russell 1000 Growth: +16.1% | Russell 1000 Value: +11.9% – The sharp change in Fed rhetoric influenced the stronger
performance of growth stocks over value stocks during the quarter. Investors favored companies with stronger earnings prospects to counter a softer economic environment.
– Technology produced strong results, while the outlook for Financials weakened as the yield curve flattened.
UtilitiesReal EstateMaterialsInformationTechnology
IndustrialsHealthCare
FinancialsEnergyConsumerStaples
ConsumerDiscretionary
CommunicationServices
14.0%15.7%
12.0%
16.4%
8.6%6.6%
17.2%19.9%
10.3%
17.5%
10.8%
Quarterly Performance of Industry Sectors
Source: Standard & Poor’s
Russell 2000
Russell 2500
Russell Midcap
S&P 500
Russell 1000 Value
Russell 1000 Growth
Russell 1000
Russell 3000
5.7%
6.5%
9.3%
8.8%
9.5%
4.5%
12.7%
2.0%
Russell 2000
Russell 2500
Russell Midcap
S&P 500
Russell 1000 Value
Russell 1000 Growth
Russell 1000
Russell 3000
11.9%
16.5%
14.0%
14.0%
13.6%
15.8%
16.1%
14.6%
U.S. Equity: Quarterly Returns
U.S. Equity: One-Year Returns
Sources: FTSE Russell and Standard & Poor’s
Sources: FTSE Russell and Standard & Poor’s

7
Interest rate-sensitive Financials (+6.9%) and Utilities (+9.0%) trailed the broad index.
– Factor performance favored growth (historical and projected) while value factors were generally negative.
Emerging Markets ► MSCI Emerging Markets Index: +9.9% – In a big reversal from the fourth quarter, China led emerging
markets with MSCI China gaining 17.7% and MSCI China A up 30.9%.
– Trade talks continue but positive indications for a deal buoyed markets; uncertainty on the outcome remains.
– Asian Information Technology rebounded nicely with Chinese IT (+27.6%) leading the sector. An improving outlook on Chinese consumption positively influenced EM Consumer Discretionary (+20.8%), which was the top-performing sector.
– Growth led value with MSCI Emerging Markets Growth gaining 12.0% and EM Value up 7.8%.
Non-U.S. Small Cap ► MSCI World ex USA Small Cap: +10.9% | MSCI EM Small Cap: +7.8% – Within developed markets, small cap performed in line with
large cap. – EM Small Cap trailed EM as MSCI China Small Cap has
less exposure to IT, which led the risk-on rally.
Non-U.S./Global EquityGlobal equity markets were positive in the first quarter following a sharp sell-off to end 2018. Investors resumed a risk-on outlook as central banks telegraphed more accommodative positioning. Delayed outcomes regarding U.S./China trade talks and Brexit negotiations allowed markets to stabilize, although uncertain outcomes remain a future risk.
Developed ► MSCI EAFE: +10.0% | MSCI Europe: +10.8% | MSCI World ex USA: +10.4% | MSCI Japan: +6.7% – Developed markets rallied as central banks around the world
expressed more accommodative paths with interest rates and quantitative easing.
– Brexit negotiations continue and a “no-deal” Brexit remains a possibility, but with an extended deadline. The potential for investment paralysis drags on.
– European PMI continued to deteriorate, falling to 47.7 in March from 49.4.
– The currency effect was mixed as the U.S. dollar rose against the euro and yen, by 1.8% and 0.9%, but fell against the British pound by 2.3% as a delay in Brexit allowed for a temporary bounce.
– EAFE sector performance was mixed. Information Technology (+15.3%) and Materials (+13.2%) led economically sensitive sectors; Consumer Staples (+12.4%) led defensive sectors.
GLOBAL EQUITY (Continued)
-6.2%
-4.2%
-9.5%
-8.7%
-3.1%
2.6%
-3.7%
-0.1%
-5.1%
-7.8%
-7.4%
-15.0%
4.6%
4.0%
-12.4%
MSCI Pacific ex Japan
MSCI ACWI ex USA Small Cap
MSCI ACWI
MSCI EAFE
MSCI ACWI ex USA
MSCI World ex USA Small Cap
MSCI World ex USA
MSCI World
MSCI Europe ex UK
MSCI UK
MSCI Japan
MSCI Emerging Markets
MSCI China
MSCI Frontier Markets
MSCI Emerging Market Small Cap
MSCI Pacific ex Japan
17.7%
10.3%
10.3%
10.9%
10.4%
12.2%
10.0%
11.9%
10.5%
6.7%
9.9%
6.9%
12.2%
MSCI ACWI ex USA Small Cap
MSCI ACWI
MSCI EAFE
MSCI ACWI ex USA
MSCI World ex USA Small Cap
MSCI World ex USA
MSCI World
MSCI Europe ex UK
MSCI UK
MSCI Japan
MSCI Emerging Markets
MSCI China
MSCI Frontier Markets
12.5%
MSCI Emerging Market Small Cap 7.8%
Non-U.S. Equity: Quarterly Returns (U.S. Dollar) Non-U.S. Equity: One-Year Returns (U.S. Dollar)
Source: MSCI Source: MSCI

8
Global Fixed Income
U.S. Fixed IncomeRisk markets sharply reversed from the fourth quarter sell-off supported by the Fed’s unexpected dovish comments, solid U.S. economic growth data, and tempered concern over a slowing China. This quarter’s strong results recaptured most of the loss experienced in the prior quarter by riskier bonds. U.S. Fixed Income ► Bloomberg Barclays US Agg: +2.9% – U.S. Treasuries rose 2.1% as the yield curve shifted lower
across maturities as growth and inflation expectations declined.
– The shape of the yield curve did not materially change during the quarter. The yield differential between the 10-year and 2-year key rates remained positive and traded around a range of +12 to +20 bps. However, the front-end of the curve inverted, with the 5-year offering less yield than the 2-year.
– TIPS outperformed nominal Treasuries as the Fed’s balanced stance and unexpected wage pressures stoked higher inflation expectation.
Investment-Grade Corporates ► Bloomberg Barclays Corporate (Inv. Grade): +5.1%
– Credit spreads rallied on the back of a softer Fed stance, positive economic news, and better than expected corporate earnings.
– Net new corporate issuance during the first quarter of $117 billion was roughly on par with a year ago.
– Surprisingly, Aaa-rated corporates (+5.0%) outperformed Aa- (+3.7%) and single A-rated issuers (+4.7%). BBB-rated issuers were the best performers (+5.7%).
High Yield ► Bloomberg Barclays Corporate HY: +7.3% – Given the risk-on environment, below-investment grade
issuers were the best performers, aided by strong asset inflows.
– Ba/B sectors (+7.2%) marginally outpaced CCC by 6 bps; this was an unusual occurrence given that the dispersion between high-quality and low-quality is typically wide during these periods of absolute returns.
U.S. Treasury Yield Curves
0%
1%
2%
3%
4%
Maturity (Years)
December 31, 2018March 31, 2019 March 31, 2018
302520151050
Source: Bloomberg
U.S. Fixed Income: Quarterly Returns
U.S. Fixed Income: One-Year Returns
Bloomberg Barclays US TIPS
6.5%
3.8%
2.3%
1.2%
3.3%
7.3%
3.2%
2.9%
Bloomberg Barclays Gov/Credit 1-3 Yr
Bloomberg Barclays Interm Gov/Credit
Bloomberg Barclays Aggregate
Bloomberg Barclays Long Gov/Credit
Bloomberg Barclays Universal
CS Leveraged Loans
Bloomberg Barclays Corp. High Yield
5.2%
3.3%
4.2%
3.0%
4.5%
5.9%
2.7%
4.5%
Bloomberg Barclays Gov/Credit 1-3 Yr
Bloomberg Barclays Interm Gov/Credit
Bloomberg Barclays Aggregate
Bloomberg Barclays Long Gov/Credit
Bloomberg Barclays Universal
CS Leveraged Loans
Bloomberg Barclays Corp. High Yield
Bloomberg Barclays US TIPS
Sources: Bloomberg Barclays and Credit Suisse
Sources: Bloomberg Barclays and Credit Suisse

9
Leveraged Loans ► CS Leveraged Loans: +3.8% – Leveraged loans participated in the rally but lagged both
longer duration investment grade and high yield corporates. The sector was negatively impacted by the Fed’s pause, retail outflows, and a slow-developing CLO pipeline.
– Bank loans have less sensitivity to interest rates but may have a similar spread duration profile to that of their high yield bond counterparts.
Non-U.S. Fixed IncomeGlobal Fixed Income ► Bloomberg Barclays Global Aggregate: +2.2% | Global Aggregate (hdg): +3.0%
– Developed market sovereign bonds rallied in tandem with Treasuries. The U.S. dollar appreciated modestly versus the euro and yen, but lost ground versus the British pound and Canadian dollar.
Emerging market debt ($US) ► JPM EMBI Global Diversified: +7.0% | (Local currency) ► JPM GBI-EM Global Diversified: +2.9%
– Country returns within the EMBI Global Diversified Index were nearly all positive for the quarter.
– Turkey (-10.2%) and Argentina (-10.5%) were notable underperformers in the local currency index.
– Positive net inflows into the EM universe continued through quarter-end.
Non-U.S. Fixed Income: Quarterly Returns
Non-U.S. Fixed Income: One-Year Returns
JPM GBI-EM Global Diversified
JPM EMBI Global Diversified
1.5%
2.9%
3.0%
2.2%
7.0%
4.9%
5.5%
6.3%
Bloomberg Barclays Global Aggregate
Bloomberg Barclays Global Agg (hdg)
Bloomberg Barclays Global High Yield
Bloomberg Barclays Global Agg ex US
JPM EMBI Gl Div / JPM GBI-EM Gl Div
JPM CEMBI
Bloomberg Barclays Global Aggregate
Bloomberg Barclays Global High Yield
JPM GBI-EM Global Diversified
Bloomberg Barclays Global Agg (hdg)
-7.6%
4.9%
-0.4%
4.2%
-1.8%
5.2%
2.4%
Bloomberg Barclays Global Agg ex US
JPM EMBI Global Diversified
JPM EMBI Gl Div / JPM GBI-EM Gl Div
JPM CEMBI
-4.1%
Sources: Bloomberg Barclays and JPMorgan Chase
Sources: Bloomberg Barclays and JPMorgan Chase
-28 bps
-31 bps
-28 bps
-35 bps
-8 bps
Germany
U.S. Treasury
U.K.
Canada
Japan
Change in 10-Year Global Government Bond Yields
4Q18 to 1Q19
Source: Bloomberg Barclays
GLOBAL FIXED INCOME (Continued)

10
Real Estate Stays Strong; Real Assets Show Big GainsREAL ESTATE/REAL ASSETS | Munir Iman and David Welsch, CFA
Core Returns Driven by Income – The NCREIF Property Index, a measure of U.S. insti-
tutional real estate assets, gained 1.8% during the first quarter. The income return was 1.1%, while appreciation contributed 0.7%.
– Industrial led property sector performance with a gain of 3.0%. Hotels finished last with a 0.4% increase.
– Regionally, the West led with a 2.2% return, while the Midwest was the worst performer at 1.0%.
– The NCREIF Open-End Diversified Core Equity Index, representing equity ownership positions in U.S. core real estate, rose 1.2% during the first quarter, with income pro-viding 0.8% and appreciation 0.4%.
– U.S. core real estate returns are being driven by income with limited appreciation this late in the cycle.
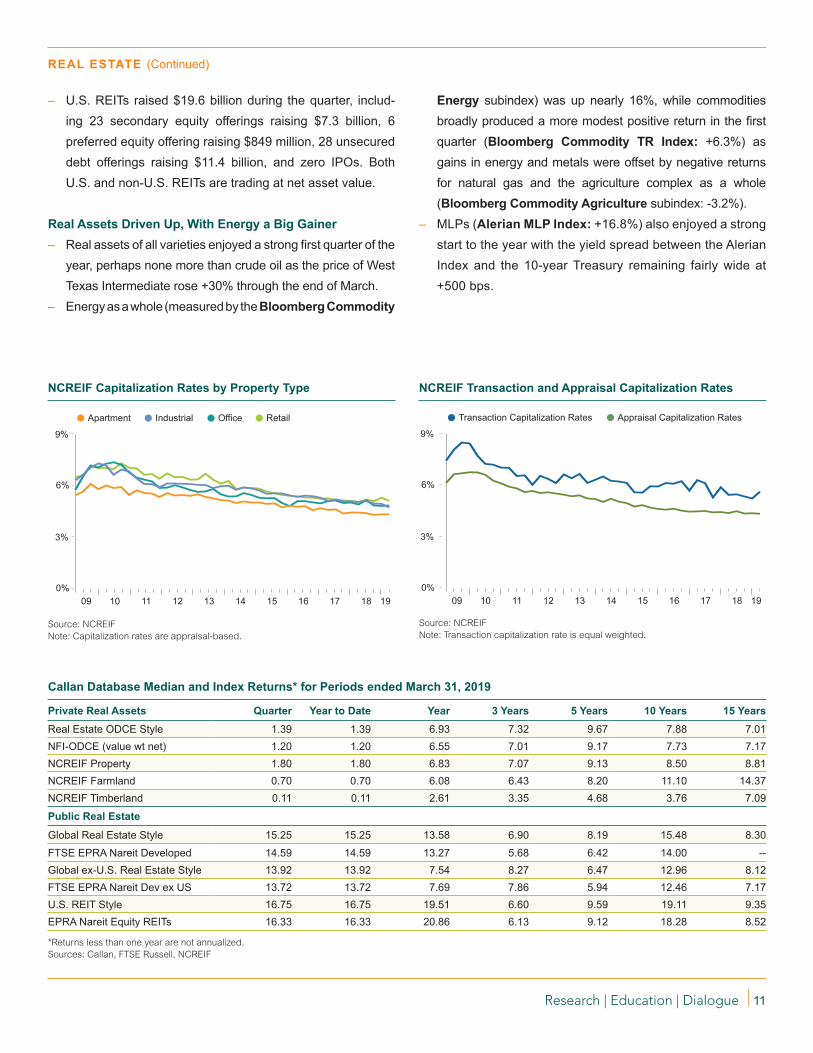
– Appraisal capitalization rates decreased slightly from 4.34% to 4.31% during the first quarter, and capitalization rates measured in active trades ticked up to 5.60% from 5.20%.
– At quarter end, the 10-year average appraisal capitaliza-tion rate was 5.20%, and the 10-year average transactions capitalization rate was 6.34%. The spread between the two measures, which reflects pricing expectations between buy-ers and holders of real estate, stood at 114 basis points.
– Within the NCREIF Property Index, the vacancy rate for U.S. Retail was 7.5% in the first quarter, the highest in nearly two years.
REITs Outperformed Global Equities – The FTSE EPRA/Nareit Developed REIT Index, a measure
of global real estate securities, rose 14.6% during the first quarter, compared to 12.2% for global equities (MSCI ACWI).
– European REITs returned 11.5% (USD). The FTSE EPRA/Nareit Asia Index (USD), representing the Asia/Pacific region, increased 14.4%.
U.S. Real Estate Securities Bounced Back – U.S. REITs, as measured by the EPRA Nareit Equity REITs
Index, bounced back and gained 16.3%. – Infrastructure (+21.4%), Industrial (+21.3%), Timber
(+21.1%), and Office (+20.3%) all led the surge. – Self Storage (+9.9%), Health Care (+13.0%), and Retail
(+14.4%) were the worst-performing sectors yet posted positive returns.
Rolling One-Year Returns
-60%
-30%
0%
30%
60%
90%
120%
REIT Style Global REIT StylePrivate Real Estate Database
02 0399 00 01 04 05 06 07 08 09 10 11 12 13 14 15 16 17 1819
Source: Callan
West
South
Midwest
East
2.2%
1.4%
1.9%
1.0%
Retail
Office
Industrial
Hotels
Apartments
1.7%
0.4%
1.6%
3.0%
1.4%
Sector Quarterly Returns by Property Type and Region
Source: NCREIF
11
REAL ESTATE (Continued)
NCREIF Transaction and Appraisal Capitalization Rates
Source: NCREIFNote: Transaction capitalization rate is equal weighted.
NCREIF Capitalization Rates by Property Type
Source: NCREIFNote: Capitalization rates are appraisal-based.
0%
3%
6%
9%
Appraisal Capitalization RatesTransaction Capitalization Rates
09 10 11 12 13 14 15 16 17 18 190%
3%
6%
9%
IndustrialApartment RetailOffice
09 10 11 12 13 14 15 16 17 18 19
Private Real Assets Quarter Year to Date Year 3 Years 5 Years 10 Years 15 YearsReal Estate ODCE Style 1.39 1.39 6.93 7.32 9.67 7.88 7.01NFI-ODCE (value wt net) 1.20 1.20 6.55 7.01 9.17 7.73 7.17NCREIF Property 1.80 1.80 6.83 7.07 9.13 8.50 8.81NCREIF Farmland 0.70 0.70 6.08 6.43 8.20 11.10 14.37NCREIF Timberland 0.11 0.11 2.61 3.35 4.68 3.76 7.09
Public Real Estate
Global Real Estate Style 15.25 15.25 13.58 6.90 8.19 15.48 8.30
FTSE EPRA Nareit Developed 14.59 14.59 13.27 5.68 6.42 14.00 --Global ex-U.S. Real Estate Style 13.92 13.92 7.54 8.27 6.47 12.96 8.12FTSE EPRA Nareit Dev ex US 13.72 13.72 7.69 7.86 5.94 12.46 7.17U.S. REIT Style 16.75 16.75 19.51 6.60 9.59 19.11 9.35EPRA Nareit Equity REITs 16.33 16.33 20.86 6.13 9.12 18.28 8.52
Callan Database Median and Index Returns* for Periods ended March 31, 2019
*Returns less than one year are not annualized.Sources: Callan, FTSE Russell, NCREIF
– U.S. REITs raised $19.6 billion during the quarter, includ-ing 23 secondary equity offerings raising $7.3 billion, 6 preferred equity offering raising $849 million, 28 unsecured debt offerings raising $11.4 billion, and zero IPOs. Both U.S. and non-U.S. REITs are trading at net asset value.
Real Assets Driven Up, With Energy a Big Gainer – Real assets of all varieties enjoyed a strong first quarter of the
year, perhaps none more than crude oil as the price of West Texas Intermediate rose +30% through the end of March.
– Energy as a whole (measured by the Bloomberg Commodity
Energy subindex) was up nearly 16%, while commodities broadly produced a more modest positive return in the first quarter (Bloomberg Commodity TR Index: +6.3%) as gains in energy and metals were offset by negative returns for natural gas and the agriculture complex as a whole (Bloomberg Commodity Agriculture subindex: -3.2%).
– MLPs (Alerian MLP Index: +16.8%) also enjoyed a strong start to the year with the yield spread between the Alerian Index and the 10-year Treasury remaining fairly wide at +500 bps.

12
Private Equity Performance Database (%) (Pooled Horizon IRRs through September 30, 2018*)Strategy 3 Months Year 3 Years 5 Years 10 Years 15 Years 20 YearsAll Venture 4.83 21.65 10.97 16.85 11.79 11.09 19.08 Growth Equity 3.65 20.89 15.16 14.39 12.56 13.54 14.14 All Buyouts 3.18 15.95 15.61 14.00 11.42 14.45 12.46 Mezzanine 2.56 11.38 10.99 10.31 9.79 9.72 8.63 Credit Opportunities 2.11 9.64 9.29 7.99 11.52 10.21 10.42 Control Distressed 0.85 7.03 10.75 9.31 10.55 10.96 10.85 All Private Equity 3.37 16.80 13.87 13.79 11.54 13.16 12.96 S&P 500 7.71 17.91 17.31 13.95 11.97 9.65 7.42 Russell 3000 7.12 17.58 17.07 13.46 12.01 9.86 7.82
Note: Private equity returns are net of fees. Sources: Refinitiv/Cambridge and Standard & Poor’s *Most recent data available at time of publication
It’s Just a ‘Gully’PRIVATE EQUITY | Gary Robertson
Funds Closed January 1 to March 31, 2019
Strategy No. of Funds Amt ($mm) ShareVenture Capital 56 13,809 11%Growth Equity 18 13,727 11%Buyouts 49 79,895 62%Mezzanine Debt 5 15,372 12%Distressed 1 825 1%Energy 1 1,200 1%Secondary and Other 5 1,628 1%Fund-of-funds 7 2,435 2%Totals 142 128,891 100%Source: PitchBookFigures may not total due to rounding.
Note: Transaction count and dollar volume figures across all private equity measures are preliminary figures and are subject to update in subsequent versions of Capital Market Review and other Callan publications.
The fourth quarter’s public equity bear market clawed through private equity transaction activity in the first quarter. Almost every private equity transaction measure in the first quarter was down substantially, with fundraising dollar volume showing the only increase. With the dramatic recovery in first quarter equity markets, we expect private equity to also shrug-off the “gully” as the year progresses.
– Fundraising ► Based on preliminary data, first quarter private equity partnerships holding final closes totaled $129 billion, with 142 new partnerships formed (unless otherwise noted, all data in this commentary comes from PitchBook). Compared to the fourth quarter, the number of funds fell 10% but the dollar volume increased by 19%. The absolute pace of fundraising remains heated.
– Buyouts ► New buyout transactions declined notably, albeit from high levels. Funds closed 1,252 investments with $67 billion in disclosed deal value, representing a 33% decline in count and a 65% dip in dollar value from the fourth quarter. The largest investment was the $6.9 billion take-private of Dun & Bradstreet by Cannae Holdings, CC Capital, Thomas H. Lee Partners, and three additional firms.
– VC Investments ► New investments in venture capital companies totaled 3,332 rounds of financing with $44 billion of announced value. The number of investments was down 23% and announced value fell 24%.
– Exits ► There were 369 private M&A exits of private equity-backed companies, with disclosed values totaling $71 billion. Both private sale count and announced dollar volume were down significantly from the prior quarter by 39% and 50%, respectively. There were 8 private equity-backed IPOs in the first quarter raising an aggregate $2 billion, down 70% and 80%, respectively, from the fourth quarter.
– Venture-backed M&A exits totaled 264 transactions with disclosed value of $38 billion. The number of sales declined 22% from the fourth quarter, and announced value fell 7%. There were 23 VC-backed IPOs in the first quarter with a combined float of $4 billion; the count fell 34% but the issuance remained unchanged from the fourth quarter.

13
Callan Database Median and Index Returns* for Periods ended March 31, 2019
Hedge Fund Universe Quarter Year 3 Years 5 Years 10 Years 15 YearsCallan Fund-of-Funds Database 3.64 1.59 5.00 2.82 5.62 4.56Callan Absolute Return FOF Style 2.44 1.46 4.62 2.82 5.58 3.97Callan Core Diversified FOF Style 3.73 1.59 4.70 2.45 5.57 4.50Callan Long/Short Equity FOF Style 7.68 0.89 6.45 3.56 6.02 5.71Credit Suisse Hedge Fund 3.99 0.20 3.74 2.26 5.42 4.81CS Convertible Arbitrage 3.78 0.59 4.46 1.90 7.04 3.61CS Distressed 2.15 0.17 5.38 1.57 6.44 5.66CS Emerging Markets 8.21 -3.94 6.32 4.18 6.91 6.16CS Equity Market Neutral 2.54 -3.29 0.39 0.31 2.23 -0.19CS Event-Driven Multi 6.36 1.31 4.61 -0.16 4.54 5.09CS Fixed Income Arb 2.19 1.54 5.13 3.37 7.27 3.88CS Global Macro 2.61 1.92 3.51 2.42 4.84 5.99CS Long/Short Equity 5.35 -0.52 4.60 3.44 6.34 5.64CS Managed Futures 3.21 -0.23 -3.87 2.58 0.62 2.19CS Multi-Strategy 3.01 0.27 4.57 4.20 7.56 5.82CS Risk Arbitrage 1.91 2.68 3.85 2.38 3.32 3.70HFRI Asset Wtd Composite 3.08 1.90 4.70 3.03 5.59 --90-Day T-Bill + 5% 1.81 7.12 6.19 5.75 5.43 6.35
*Gross of fees. Sources: Bloomberg Barclays, Callan, Credit Suisse, Hedge Fund Research, Societe Generale, and Standard & Poor’s
Mixed Bag for Hedge Funds; Long-Biased MACs ThriveHEDGE FUNDS/MACs | Jim McKee
Hedge Funds Caught Flat-Footed – Defensive positioning caught hedge funds flat-footed in the
first quarter, but most strategies recovered the prior quarter’s loss. The Credit Suisse Hedge Fund Index gained 4.0%.
– Among CS hedge fund strategies, Long/Short Equity (+5.4%) suffered from negative alpha due to poor market timing calls as equity indices rebounded faster than expected. Event-Driven Multi (+6.4%) recovered as soft catalyst-driven stocks bounced back. Relative value strategies, like Convertible Arb (+3.8%) and Fixed-Income Arb (+2.2%), performed well; Equity Market Neutral (+2.5%) recovered half of its fourth quarter loss from mean-reversion effects.
– Long-biased hedge funds beat absolute return funds in the first quarter, but trail over the last year.
– The Callan Hedge Fund-of-Funds Database Group rose 3.6% in the quarter. The Long/Short Equity FOF Group jumped 7.7%, trailed by Core Diversified (+3.7%) and Absolute Return (+2.4%).
Absolute Core Long/Short Return Diversified Equity
10th Percentile 3.5 6.4 10.5 25th Percentile 3.0 4.9 8.8 Median 2.4 3.7 7.7 75th Percentile 2.0 2.5 5.8 90th Percentile 1.6 2.1 4.8 CS Hedge Fund 4.0 4.0 4.0 90-Day T-Bill +5% 1.8 1.8 1.8
0%
4%
8%
12%
Hedge Fund-of-Funds Style Group Returns
Sources: Callan, Credit Suisse, and Federal Reserve

14
– With volatility settling down with the risk-on sentiment and returning to more normalized levels, hedge funds are likely to lag without a market dislocation. But if hard economic data does not confirm this market sentiment, hedge funds are well positioned defensively for a downturn.
– The flat yield curve levels the playing field. Today’s short-term rates provide support to hedge funds with positive returns on cash holdings and short interest rebates.
– Global economic tension is creating fundamental imbalances that may lead to more macro trading opportunities like those of 2018, especially if the trade war is not soon resolved positively.
Rebound Boosts Long-Biased MACs – The rebounding markets boosted long-biased multi-asset
class (MAC) strategies in the first quarter. The HFR Risk Parity Index targeting 12% volatility was propelled by rising equity, commodity, and fixed income markets, amplified by portfolio leverage.
– Within the CSNB Multi-Asset Risk Parity Index, Equity Momentum (-22.2%) was an outsized setback, largely due to a 15.7% January loss from a violent market reversal over the prior month. Positive returns from Currency Carry (+4.8%) and Fixed Momentum (+3.7%) helped this risk premia proxy finish the quarter with a modestly positive gain.
Absolute Risk Long Risk Return Premia Biased Parity
10th Percentile 5.4 5.6 10.6 18.9 25th Percentile 4.8 2.4 8.8 12.3 Median 4.0 2.4 7.0 10.7 75th Percentile 3.4 1.2 5.2 10.1 90th Percentile 2.9 -0.7 3.2 8.5 CSNB MARP (5%v) 0.6 0.6 0.6 0.6 60% S&P 500/ 40% BB Barclays Agg 9.4 9.4 9.4 9.4
-3%0%3%6%9%
12%
15%18%
– The Callan Multi-Asset Class Style Groups showed positive but widely diverging results, with the overall group up 6.7%. Risk Parity jumped 10.7%, while Risk Premia only gained 2.4%.
Convertible ArbDistressedLong/Short EquityManaged Futures
3.0%2.5%
3.8%
8.2%
1.9%2.2%
5.3%
3.2%2.6%2.2%
6.4%
Fixed Income ArbRisk ArbitrageEmerging Market
Equity Mkt NeutralMulti-StrategyEvent-Driven MultiGlobal Macro
Equity CarryFixed CarryCurrency CarryCommodity Carry
3.7%
0.0% -0.5%
0.7%
-3.5%
4.8%
-0.8%-4.5%
1.3%
-2.0%
Equity ValueFixed ValueCurrency ValueMARP (5%v) Average
Equity MomentumFixed MomentumCurr MomentumComm Momentum
-22.2%
MAC Style Group Returns
Credit Suisse Hedge Fund Strategy Returns Alternative Risk Factor Breakdown
Sources: Bloomberg Barclays, Callan, Credit Suisse, Neuberger Berman, Standard & Poor’s
Source: Credit Suisse Source: Credit Suisse Neuberger Berman
15
The Callan DC Index is an equally weighted index tracking the cash flows and performance of nearly 90 plans, representing more than one million DC participants and over $150 billion in assets. The Index is updated quarterly and is available on Callan’s website, as is the quarterly DC Observer newsletter.
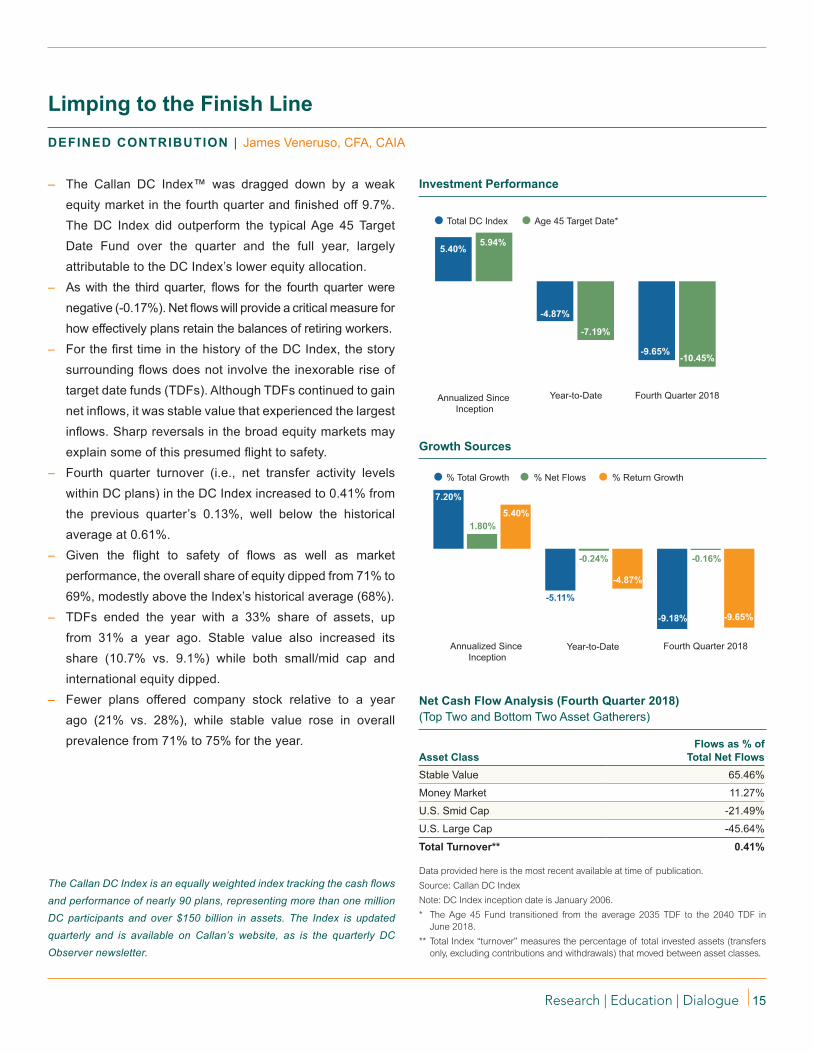
– The Callan DC Index™ was dragged down by a weak equity market in the fourth quarter and finished off 9.7%. The DC Index did outperform the typical Age 45 Target Date Fund over the quarter and the full year, largely attributable to the DC Index’s lower equity allocation.
– As with the third quarter, flows for the fourth quarter were negative (-0.17%). Net flows will provide a critical measure for how effectively plans retain the balances of retiring workers.
– For the first time in the history of the DC Index, the story surrounding flows does not involve the inexorable rise of target date funds (TDFs). Although TDFs continued to gain net inflows, it was stable value that experienced the largest inflows. Sharp reversals in the broad equity markets may explain some of this presumed flight to safety.
– Fourth quarter turnover (i.e., net transfer activity levels within DC plans) in the DC Index increased to 0.41% from the previous quarter’s 0.13%, well below the historical average at 0.61%.
– Given the flight to safety of flows as well as market performance, the overall share of equity dipped from 71% to 69%, modestly above the Index’s historical average (68%).
– TDFs ended the year with a 33% share of assets, up from 31% a year ago. Stable value also increased its share (10.7% vs. 9.1%) while both small/mid cap and international equity dipped.
– Fewer plans offered company stock relative to a year ago (21% vs. 28%), while stable value rose in overall prevalence from 71% to 75% for the year.
Limping to the Finish LineDEFINED CONTRIBUTION | James Veneruso, CFA, CAIA
Net Cash Flow Analysis (Fourth Quarter 2018) (Top Two and Bottom Two Asset Gatherers)
Asset ClassFlows as % of
Total Net FlowsStable Value 65.46%
Money Market 11.27%
U.S. Smid Cap -21.49%
U.S. Large Cap -45.64%
Total Turnover** 0.41%
Data provided here is the most recent available at time of publication. Source: Callan DC IndexNote: DC Index inception date is January 2006.* The Age 45 Fund transitioned from the average 2035 TDF to the 2040 TDF in
June 2018.** Total Index “turnover” measures the percentage of total invested assets (transfers
only, excluding contributions and withdrawals) that moved between asset classes.
Investment Performance
Growth Sources
Fourth Quarter 2018
Age 45 Target Date* Total DC Index
-9.65%-10.45%
5.40%
Annualized Since Inception
-7.19%
-4.87%
5.94%
Year-to-Date
Fourth Quarter 2018
% Net Flows % Return Growth% Total Growth
7.20%
Annualized Since Inception
1.80%
-0.16%-0.24%
5.40%
-9.18% -9.65%
-5.11%
-4.87%
Year-to-Date

16
Contributors
Munir Iman works in Callan’s Real Assets Consulting group, collecting information on real asset products and tracking new real estate fund offerings.
Gary Robertson in the Private Equity Consulting group is responsible for alternative investments consulting services at Callan.
James Veneruso, CFA, CAIA, is a defined contribution consultant in Callan’s Fund Sponsor Consulting group, responsible for providing analytical support to Callan’s DC clients and consultants.
Mark Stahl, CFA, is co-manager of Callan’s Global Manager Research group, which provides fundamental and statistical research on investment managers.
David Welsch, CFA, of Callan’s Independent Adviser Group, conducts investment manager research and due diligence.
David Zee, CFA, is an investment consultant in Callan’s Global Manager Research group, responsible for research and analysis of fixed income investment managers.
Kristin Bradbury, CFA, of Callan’s Independent Adviser Group, conducts investment manager research and due diligence with a focus on fixed income managers.
Andy Iseri, CFA, is an investment consultant in Callan’s Global Manager Research group, responsible for research and analysis of non-U.S. investment managers.
Amy Jones is co-manager of Callan’s Global Manager Research group, which provides fundamental and statistical research on investment managers.
Jay Kloepfer is director of Capital Markets Research, helping Callan’s fund sponsor clients with strategic planning and providing custom research.
Jim McKee specializes in hedge fund research addressing asset allocation, manager structure, manager search, and performance evaluation.

Certain information herein has been compiled by Callan and is based on information provided by a variety of sources believed to be reliable for which Callan has not necessarily verified the accuracy or completeness of or updated. This report is for informational purposes only and should not be construed as legal or tax advice on any matter. Any investment decision you make on the basis of this report is your sole responsibility. You should consult with legal and tax advisers before applying any of this information to your particular situation. Reference in this report to any product, service or entity should not be construed as a recommendation, approval, affiliation or endorsement of such product, service or entity by Callan. Past performance is no guarantee of future results. This report may consist of statements of opinion, which are made as of the date they are expressed and are not statements of fact. The Callan Institute (the “Institute”) is, and will be, the sole owner and copyright holder of all material prepared or developed by the Institute. No party has the right to reproduce, revise, resell, disseminate externally, disseminate to subsidiaries or parents, or post on internal web sites any part of any material prepared or developed by the Institute, without the Institute’s permission. Institute clients only have the right to utilize such material internally in their business.
The Capital Market Review is a quarterly macroeconomic indicator newsletter that provides thoughtful insights on the economy and recent performance in the equity, fixed income, alternatives, real estate, and other capital markets.
If you have any questions or comments, please email [email protected].
Editor – Stephen R. TrousdalePerformance Data – Alpay Soyoguz, CFA; Matt Loster; Fionnuala WrightDesigner – Nicole Silva
About Callan Callan was founded as an employee-owned investment consulting firm in 1973. Ever since, we have empowered institutional clients with creative, customized investment solutions that are backed by proprietary research, exclusive data, and ongoing education. Today, Callan advises on more than $2 trillion in total fund sponsor assets, which makes it among the largest independently owned investment consulting firms in the U.S. Callan uses a client-focused consulting model to serve pen-sion and defined contribution plan sponsors, endowments, foundations, independent investment advisers, investment managers, and other asset owners. Callan has six offices throughout the U.S. For more information, please visit www.callan.com.
About the Callan InstituteThe Callan Institute, established in 1980, is a source of continuing education for those in the institu-tional investment community. The Institute conducts conferences and workshops and provides pub-lished research, surveys, and newsletters. The Institute strives to present the most timely and relevant research and education available so our clients and our associates stay abreast of important trends in the investments industry.
© 2019 Callan LLC

Corporate Headquarters
600 Montgomery Street Suite 800San Francisco, CA 94111800.227.3288415.974.5060
www.callan.com
Regional Offices
Atlanta800.522.9782
Chicago800.999.3536
Denver855.864.3377
New Jersey800.274.5878
@CallanLLC Callan
Portland800.227.5060
Related Documents