1 Capital Improvements Program Transportation Priorities Steve Aldrich, Transportation Master Planner, CP&P, [email protected], 301-495-4528 Jason Sartori, Chief, CP&P, [email protected], 301-495-2172 Completed: 10/14/21 Recommendation Staff recommends transmitting a list of transportation project priorities to the County Executive for consideration by county agencies for inclusion in the FY2023-FY2028 Capital Improvements Program (CIP). Background This memorandum provides staff recommendations on priorities to forward to the County Executive as he prepares his biennial CIP for transportation investments. The transportation-related recommendations are the result of staff’s ongoing effort to maintain an updated compilation of capital improvement projects recommended in approved and adopted master plans. Prioritization is based on a desire to keep capital projects in step with the development these plans engender. The purpose of this process is to provide a way to objectively prioritize different types of projects as to how they best achieve the County’s objectives as outlined in the Growth and Infrastructure Policy and other county policy documents, including the Vision Zero Action Plan. This list is intended to be a resource for the County in selecting projects to be included in the CIP. Projects that are expected to be the State’s responsibility are also included because the County has contributed significant funds to such projects in recent years. A project is removed from this list once it is either under construction or fully funded and in the Right of Way acquisition process. For this review, the methodology developed in 2019 has been continued as follows: 1) We started with the 2019 Transportation Priorities list as approved by the Planning Board and eliminated projects that were under construction/constructed. 2) Bicycle-related projects from the pending Bicycle Master Plan Monitoring Report have been reviewed and priorities modified. For this review, new bikeways have been advanced onto this list based on equity considerations. 3) We adjusted a project’s ranking based on how well it addressed the County’s Vision Zero goals and the extent to which it would improve safety within the County’s High Injury Network (part of the Vision Zero Action Plan). MONTGOMERY COUNTY PLANNING DEPARTMENT THE MARYLAND-NATIONAL CAPITAL PARK AND PLANNING COMMISSION MCPB Item No 9 Date: 10/21/21

Welcome message from author
This document is posted to help you gain knowledge. Please leave a comment to let me know what you think about it! Share it to your friends and learn new things together.
Transcript

1
Capital Improvements Program Transportation Priorities
Steve Aldrich, Transportation Master Planner, CP&P, [email protected], 301-495-4528
Jason Sartori, Chief, CP&P, [email protected], 301-495-2172
Completed: 10/14/21
Recommendation
Staff recommends transmitting a list of transportation project priorities to the County Executive for consideration by county agencies for inclusion in the FY2023-FY2028 Capital Improvements Program (CIP).
Background
This memorandum provides staff recommendations on priorities to forward to the County Executive as he prepares his biennial CIP for transportation investments. The transportation-related recommendations are the result of staff’s ongoing effort to maintain an updated compilation of capital improvement projects recommended in approved and adopted master plans. Prioritization is based on a desire to keep capital projects in step with the development these plans engender.
The purpose of this process is to provide a way to objectively prioritize different types of projects as to how they best achieve the County’s objectives as outlined in the Growth and Infrastructure Policy and other county policy documents, including the Vision Zero Action Plan. This list is intended to be a resource for the County in selecting projects to be included in the CIP. Projects that are expected to be the State’s responsibility are also included because the County has contributed significant funds to such projects in recent years. A project is removed from this list once it is either under construction or fully funded and in the Right of Way acquisition process.
For this review, the methodology developed in 2019 has been continued as follows:
1) We started with the 2019 Transportation Priorities list as approved by the Planning Board and eliminated projects that were under construction/constructed.
2) Bicycle-related projects from the pending Bicycle Master Plan Monitoring Report have been reviewed and priorities modified. For this review, new bikeways have been advanced onto this list based on equity considerations.
3) We adjusted a project’s ranking based on how well it addressed the County’s Vision Zero goals and the extent to which it would improve safety within the County’s High Injury Network (part of the Vision Zero Action Plan).
MONTGOMERY COUNTY PLANNING DEPARTMENT THE MARYLAND-NATIONAL CAPITAL PARK AND PLANNING COMMISSION
MCPB Item No 9 Date: 10/21/21
Arnita.Jackson
Sartori
Arnita.Jackson
Sartori
Arnita.Jackson
Aldrich

2
4) We adjusted a project’s ranking if it was located in or planned to provide transportation benefits to Equity Focus Areas (EFAs)1 as designated by Montgomery Planning. This is a change from the 2019 evaluation which used Equity Emphasis Areas as designated by the Metropolitan Washington Council of Governments.
5) We adjusted a project’s ranking if it addressed the needs/capital improvement implementation plans in an adopted master plan.
New Master Plans Since Last Review
The Board last reviewed this priority list in September 2019. The list has been updated to reflect the addition of facilities recommended in master plans that have been approved and adopted since the Board’s last review:
• Shady Grove Minor Master Plan Amendment (2021) • Forest Glen/Montgomery Hills Sector Plan (2020) • Germantown Plan for the Town Sector Zone (2020)
Transportation CIP Evaluation – Top 100 Project Priorities
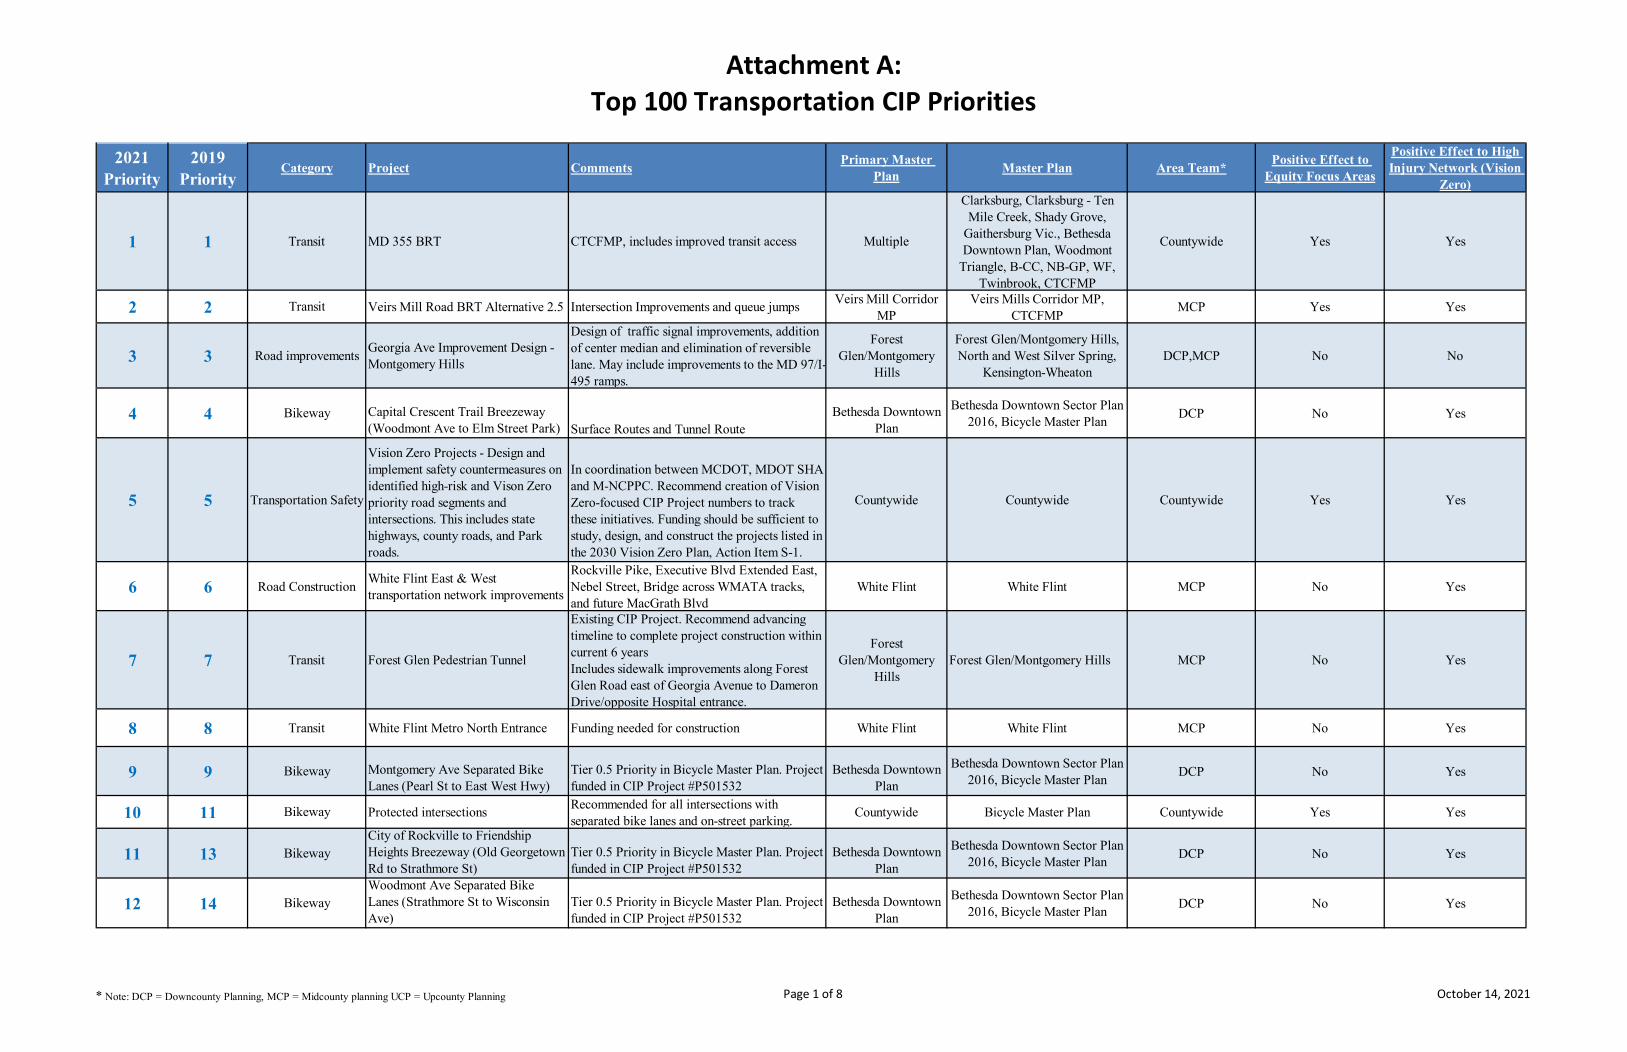
The transportation candidates have been ranked in a matrix that is attached with this memo as Attachment A. For each project, the following information is provided:
• 2021 Priority Ranking • 2019 Priority Ranking (if applicable) • Improvement Category (road, transit, bikeway, pedestrian, etc.) • Project Name, Description and Limits • Relevant Master Plan(s) • Positive contribution to an Equity Focus Area (yes/no) • Positive contribution to roads located on the High Injury Network (HIN) in support of the
Vision Zero Action Plan (yes/no) Staff recommends that the Planning Board transmit the list of the top 100 transportation project priorities (see Attachment A) to the County Executive to provide guidance to Executive Branch agencies as projects are considered for inclusion in the FY2023-FY2028 Capital Improvements Program. This list (with any changes requested by the Board at the meeting) will show the County Executive where the Board believes capital resources for transportation purposes should be devoted to support implementation of master plan recommendations. The large number of projects, however, should not be understood to mean that all these projects need to be included in the CIP at this time.
1 EFAs are parts of Montgomery County that are characterized by high concentrations of lower-income people of color who may also speak English less than very well. See https://montgomeryplanning.org/planning/equity-agenda-for-planning/the-equity-focus-areas-analysis/.

3
NOTE: The ranking does not include programmatic CIP projects that are ongoing efforts/services provided by the Montgomery County Department of Transportation (including traffic engineering, traffic signal maintenance and operation, streetlighting, and many others).
Planning staff also recommends that the County Executive improve the accountability of Vision Zero-related efforts by creating dedicated Vision Zero CIP projects, including recommendation #5 to conduct corridor assessments of the High Injury Network.
Summary of the Top 100 Priorities
The top 100 transportation project priorities for 2021 represent only minor changes from 2019, with 19 of the 100 projects being new to the list. These new entries reflect changing priorities from the Bicycle Master Plan Monitoring Report, recently completed Master and Sector Plans, and changing county priorities, including an increased emphasis on equity.
The projects present a wide diversity of transportation projects, fully consistent with current County policies. Figure 1 below shows the breakdown of top 100 transportation priorities by project type. The largest share of projects is the bikeways/bicycle facilities category (40 projects). The second highest category is transit projects (16 projects), followed by pedestrian projects (15 projects). Road-related projects are shown in several categories, but overall account for 26 of the 100 recommended projects.
Figure 1 Top 100 Transportation Project Priorities by Type
Bicycle projects are typically programmed in three different methods by the Montgomery County Department of Transportation (MCDOT):
1) As part of a Bicycle-Pedestrian Priority Area (CIP item), 2) As a stand-alone CIP project, 3) As part of the Bicycle Program Minor Projects - CIP Project (P507596).

4
Of the 41 bicycle projects identified, the vast majority are located primarily within BiPPA boundaries of already funded BiPPA CIP projects. The CIP budget, however, may not be adequate to accommodate the addition of these recommended projects. MCDOT should review and seek budget modifications as necessary.
Within the proposed Top 100 transportation projects, there are 19 new entries as shown below:
• #17 - Trial Bikeway Demonstration Projects • #33 - Level of Effort Sidewalk Retrofit Program • #34 - MD 355 Improvements – Milestone Manor to Little Seneca Parkway • #37 - Improve existing trail crossings on state and county roads and provide protect crossings • #39 - Matthew Henson Trail Overpass at Veirs Mill Road • #47 – Expand the consideration and application of road diets/open streets/multimodal access
improvements on county roads (including park roads) • #65 – North Bethesda Transitway - BRT • #66 - Protected crossings along Veirs Mill Road and Twinbrook Parkway (9 locations) • #77 - Briggs-Chaney Road (North Side) Sidepath between Old Columbia Pike and the ICC Trail • #81 - Germantown Road (North Side) Sidepath between Clopper Road and Middlebrook Road • #83 - Montgomery Village Avenue (East Side) Sidepath between Wrightman Road and Stedwick
Road) • #85 - Montgomery Village Avenue (East Side) Sidepath between Stedwick Road and the City of
Gaithersburg) • #87 - Piney Branch Road (MD 320) Separated Bike Lanes between University Blvd and the Prince
George’s County Line • #89 - Scenery Drive Sidepath between Germantown Road and Frederick Road (MD 355) • #95 - Sidewalk Gap on Shady Grove Road between Crabbs Branch Road and Midcounty Highway • #97 - 13th Street/Burlington Avenue Separated Bike Lanes from the DC Line to Fenton Street • #98 - Redesign Veirs Mill Road as a complete street/tree lined boulevard • #99 - Advance the planning for a future Shady Grove MARC station • #100 - Crabbs Branch Way Road Diet – Convert the existing center turn lane into a vegetated
median
The majority of these new entries are bicycle and pedestrian facilities, some recommended in recent Master or Sector Plans, while others are being advanced as part of the Bicycle Master Plan Monitoring Report for equity reasons. The top new project, Trial Bikeway Demonstration Projects, was identified by Planning staff based on the success of the University Boulevard bike lane demonstration project, and the recent road diet/temporary bike lanes recommendation approved by the Planning Board for the White Flint Metro Access Mandatory Referral. The second highest new project (#33) titled Level of Effort Sidewalk Retrofit Program is a proposed budget expansion of the county’s sidewalk program in support of the ongoing Pedestrian Master Plan. The third highest new project (#34) is a road improvement project for MD 355 in Clarksburg between Milestone Manor Road and Little Seneca

5
Parkway. These road improvements were identified in the MD 355 corridor study recently completed by MDOT SHA (see Attachment B). This study identified long-term improvement needs along this section of MD 355 both with and without Observation Drive in place. Note that the design and construction of Observation Drive between Waters Discovery Lane and Little Seneca Parkway is recommendation #38.
Vision Zero Considerations
To assess potential vision zero benefits of the top 100 transportation priorities, an evaluation was conducted to determine if the proposed project would improve the safety of road segments within Montgomery County’s High Injury Network (HIN).2 The HIN includes road segments with five or more severe or fatal collisions per year and one or more collisions per mile per year (excluding interstate highways). The HIN represents 54 road miles which is only five percent3 of the County’s road network, but most of these road miles are on some of the heavier-traveled state and county-owned non-interstate roads in Montgomery County. Overall, 51 percent of the staff’s recommended priority projects are expected to provide a safety benefit to road corridors on the Vision Zero Action Plan HIN. As we continue working toward the 10-Year Action Plan, the Planning Department and MCDOT will work to refine our analytical skills to expand this focus. This may include the implementation of a predictive safety analysis tool.
Equity Considerations
In addition to the project types, the locations of the recommended top 100 transportation project priorities are important to review. Unlike other CIP projects that may be point or parcel specific and have a defined area of benefit, however, it is difficult to identify the people who will benefit from a transportation project.
Equity has become a major focus within the Planning Department and is one of the core drivers behind the General Plan update, Thrive Montgomery. The Bicycle Master Plan completed in 2018 and the ongoing Bicycle Master Plan Monitoring Report include an equity evaluation, and it is hoped that Montgomery Planning can continue to make progress in the future in evaluating equity as an integral element of all our planning work. As part of this biennial review, equity remains a primary consideration in the prioritization of transportation CIP projects.
As a starting point, it is important to assess current capital improvement efforts. Equity Focus Areas represent seven percent of the County’s land area and contain 26 percent of the County’s population. By comparison, the top 100 transportation CIP project priorities recommended in this staff report present a significantly improved attention to equity, with 54 percent of the priority projects providing transportation benefits to Equity Focus Areas. This represents only projects that are locatable, so it ignores ongoing programmatic services provided by MCDOT including traffic engineering, RideOn
2 Vison Zero: No Deaths by 2030 in Montgomery County, Two-Year Action Plan, November 2017, p6. 3 Per the Master Plan of Highways and Transitways road mileage. Excludes secondary and tertiary roads.

6
services, streetlighting and others. We will continue to work to improve this transportation CIP evaluation process in future biennial reviews.
Equity and Vision Zero Findings
Equity and Vision Zero are high priorities within Montgomery County, so providing positive transportation benefits to areas of concern regarding equity and road safety were prioritized. As indicated above, the top 100 transportation project priorities include 54 projects that are expected to provide a transportation benefit to Equity Focus Areas, and 51 projects that are expected to provide a transportation benefit to road corridors on the Vision Zero Action Plan High Injury Network. There are 39 recommended projects that are expected to accomplish both equity and Vision Zero benefits.
Next Steps
The identification of CIP transportation priorities is one tool that planners use to evaluate the extent to which the transportation elements of the County’s multiple master plans have been built, offering guidance as to what remains to be completed and providing feedback to the County by identifying projects for consideration when CIP programs are under development. This information will be stored in a GIS format and maintained to facilitate tracking of what remains unbuilt in future years.
Attachments
A. Top 100 Transportation Project Priorities 2021 B. MD 355 Capacity Analysis report, MDOT SHA, June 2021
Attachment A:Top 100 Transportation CIP Priorities
2021 Priority
2019 Priority
Category Project Comments Primary Master Plan Master Plan Area Team* Positive Effect to
Equity Focus Areas
Positive Effect to High Injury Network (Vision
Zero)
1 1 Transit MD 355 BRT CTCFMP, includes improved transit access Multiple
Clarksburg, Clarksburg - Ten Mile Creek, Shady Grove,
Gaithersburg Vic., Bethesda Downtown Plan, Woodmont
Triangle, B-CC, NB-GP, WF, Twinbrook, CTCFMP
Countywide Yes Yes
2 2 Transit Veirs Mill Road BRT Alternative 2.5 Intersection Improvements and queue jumps Veirs Mill Corridor MP
Veirs Mills Corridor MP, CTCFMP MCP Yes Yes
3 3 Road improvements Georgia Ave Improvement Design - Montgomery Hills
Design of traffic signal improvements, addition of center median and elimination of reversible lane. May include improvements to the MD 97/I-495 ramps.
Forest Glen/Montgomery
Hills
Forest Glen/Montgomery Hills, North and West Silver Spring,
Kensington-WheatonDCP,MCP No No
4 4 Bikeway Capital Crescent Trail Breezeway (Woodmont Ave to Elm Street Park) Surface Routes and Tunnel Route
Bethesda Downtown Plan
Bethesda Downtown Sector Plan 2016, Bicycle Master Plan DCP No Yes
5 5 Transportation Safety
Vision Zero Projects - Design and implement safety countermeasures on identified high-risk and Vison Zero priority road segments and intersections. This includes state highways, county roads, and Park roads.
In coordination between MCDOT, MDOT SHA and M-NCPPC. Recommend creation of Vision Zero-focused CIP Project numbers to track these initiatives. Funding should be sufficient to study, design, and construct the projects listed in the 2030 Vision Zero Plan, Action Item S-1.
Countywide Countywide Countywide Yes Yes
6 6 Road Construction White Flint East & West transportation network improvements
Rockville Pike, Executive Blvd Extended East, Nebel Street, Bridge across WMATA tracks, and future MacGrath Blvd
White Flint White Flint MCP No Yes
7 7 Transit Forest Glen Pedestrian Tunnel
Existing CIP Project. Recommend advancing timeline to complete project construction within current 6 yearsIncludes sidewalk improvements along Forest Glen Road east of Georgia Avenue to Dameron Drive/opposite Hospital entrance.
Forest Glen/Montgomery
HillsForest Glen/Montgomery Hills MCP No Yes
8 8 Transit White Flint Metro North Entrance Funding needed for construction White Flint White Flint MCP No Yes
9 9 Bikeway Montgomery Ave Separated Bike Lanes (Pearl St to East West Hwy)
Tier 0.5 Priority in Bicycle Master Plan. Project funded in CIP Project #P501532
Bethesda Downtown Plan
Bethesda Downtown Sector Plan 2016, Bicycle Master Plan DCP No Yes
10 11 Bikeway Protected intersections Recommended for all intersections with separated bike lanes and on-street parking. Countywide Bicycle Master Plan Countywide Yes Yes
11 13 BikewayCity of Rockville to Friendship Heights Breezeway (Old Georgetown Rd to Strathmore St)
Tier 0.5 Priority in Bicycle Master Plan. Project funded in CIP Project #P501532
Bethesda Downtown Plan
Bethesda Downtown Sector Plan 2016, Bicycle Master Plan DCP No Yes
12 14 BikewayWoodmont Ave Separated Bike Lanes (Strathmore St to Wisconsin Ave)
Tier 0.5 Priority in Bicycle Master Plan. Project funded in CIP Project #P501532
Bethesda Downtown Plan
Bethesda Downtown Sector Plan 2016, Bicycle Master Plan DCP No Yes
* Note: DCP = Downcounty Planning, MCP = Midcounty planning UCP = Upcounty Planning Page 1 of 8 October 14, 2021
Attachment A:Top 100 Transportation CIP Priorities
2021 Priority
2019 Priority
Category Project Comments Primary Master Plan Master Plan Area Team* Positive Effect to
Equity Focus Areas
Positive Effect to High Injury Network (Vision
Zero)
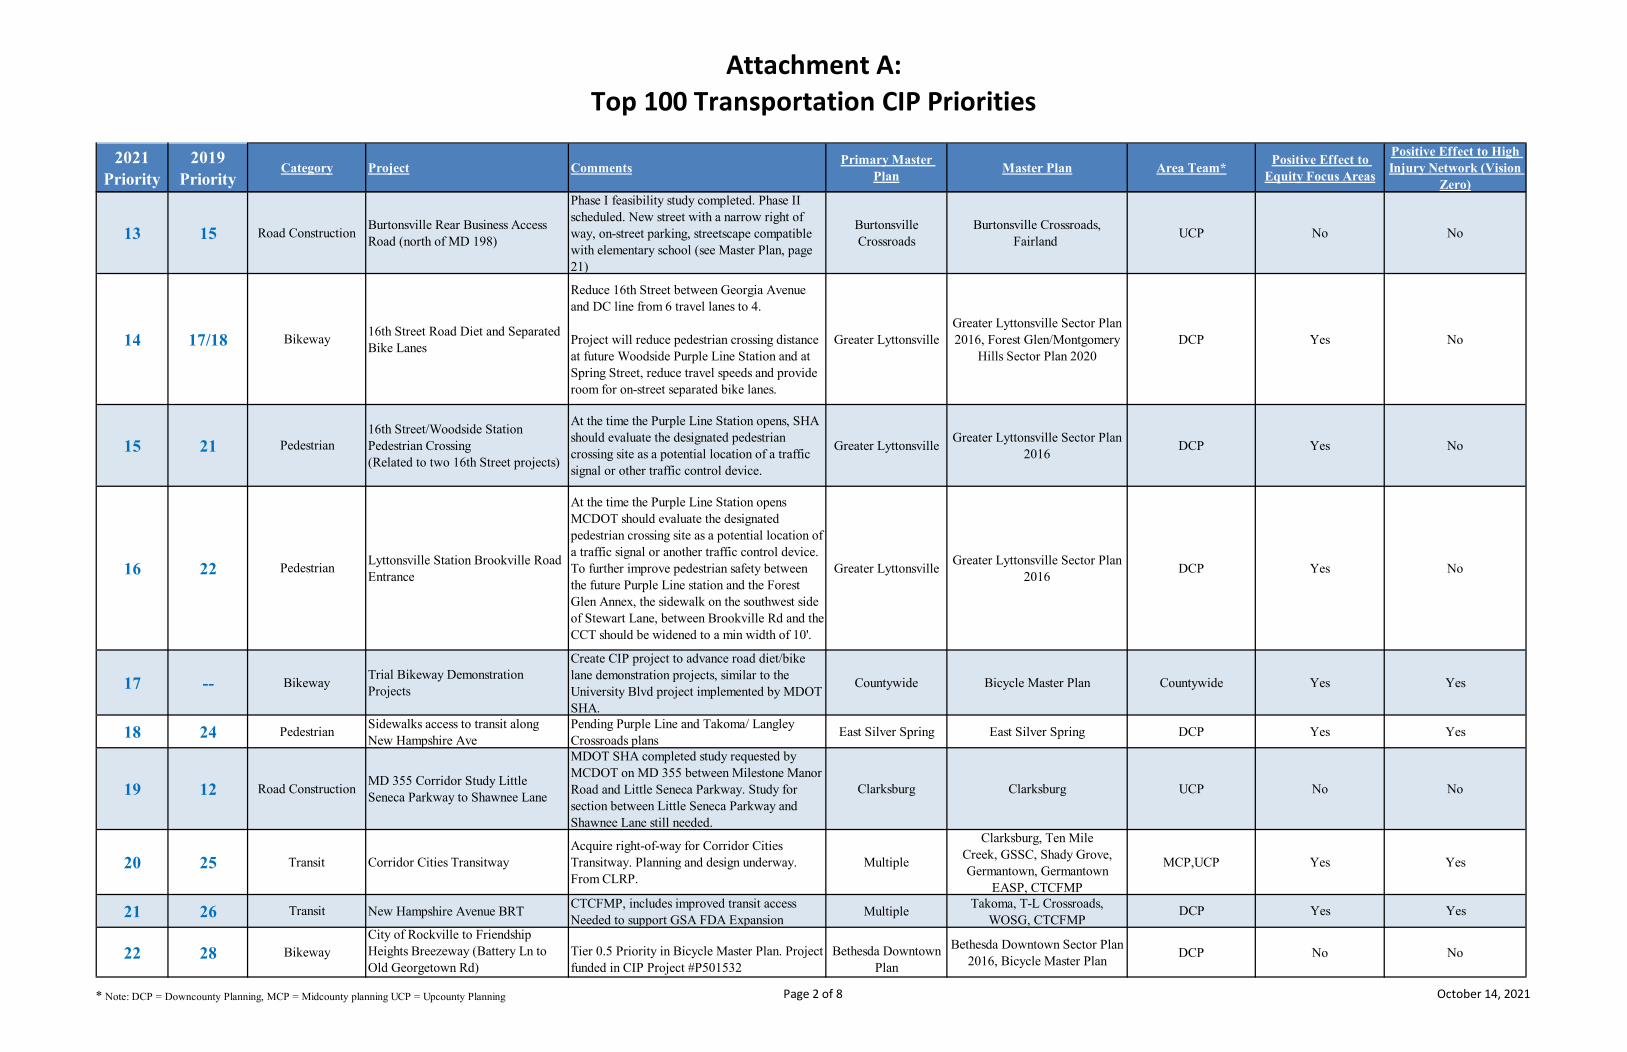
13 15 Road Construction Burtonsville Rear Business Access Road (north of MD 198)
Phase I feasibility study completed. Phase II scheduled. New street with a narrow right of way, on-street parking, streetscape compatible with elementary school (see Master Plan, page 21)
Burtonsville Crossroads
Burtonsville Crossroads, Fairland UCP No No
14 17/18 Bikeway 16th Street Road Diet and Separated Bike Lanes
Reduce 16th Street between Georgia Avenue and DC line from 6 travel lanes to 4.
Project will reduce pedestrian crossing distance at future Woodside Purple Line Station and at Spring Street, reduce travel speeds and provide room for on-street separated bike lanes.
Greater LyttonsvilleGreater Lyttonsville Sector Plan 2016, Forest Glen/Montgomery
Hills Sector Plan 2020DCP Yes No
15 21 Pedestrian16th Street/Woodside Station Pedestrian Crossing(Related to two 16th Street projects)
At the time the Purple Line Station opens, SHA should evaluate the designated pedestrian crossing site as a potential location of a traffic signal or other traffic control device.
Greater Lyttonsville Greater Lyttonsville Sector Plan 2016 DCP Yes No
16 22 Pedestrian Lyttonsville Station Brookville Road Entrance
At the time the Purple Line Station opens MCDOT should evaluate the designated pedestrian crossing site as a potential location of a traffic signal or another traffic control device. To further improve pedestrian safety between the future Purple Line station and the Forest Glen Annex, the sidewalk on the southwest side of Stewart Lane, between Brookville Rd and the CCT should be widened to a min width of 10'.
Greater Lyttonsville Greater Lyttonsville Sector Plan 2016 DCP Yes No
17 -- Bikeway Trial Bikeway Demonstration Projects
Create CIP project to advance road diet/bike lane demonstration projects, similar to the University Blvd project implemented by MDOT SHA.
Countywide Bicycle Master Plan Countywide Yes Yes
18 24 Pedestrian Sidewalks access to transit along New Hampshire Ave
Pending Purple Line and Takoma/ Langley Crossroads plans East Silver Spring East Silver Spring DCP Yes Yes
19 12 Road Construction MD 355 Corridor Study Little Seneca Parkway to Shawnee Lane
MDOT SHA completed study requested by MCDOT on MD 355 between Milestone Manor Road and Little Seneca Parkway. Study for section between Little Seneca Parkway and Shawnee Lane still needed.
Clarksburg Clarksburg UCP No No
20 25 Transit Corridor Cities Transitway Acquire right-of-way for Corridor Cities Transitway. Planning and design underway. From CLRP.
Multiple
Clarksburg, Ten Mile Creek, GSSC, Shady Grove, Germantown, Germantown
EASP, CTCFMP
MCP,UCP Yes Yes
21 26 Transit New Hampshire Avenue BRT CTCFMP, includes improved transit access Needed to support GSA FDA Expansion Multiple Takoma, T-L Crossroads,
WOSG, CTCFMPDCP Yes Yes
22 28 BikewayCity of Rockville to Friendship Heights Breezeway (Battery Ln to Old Georgetown Rd)
Tier 0.5 Priority in Bicycle Master Plan. Project funded in CIP Project #P501532
Bethesda Downtown Plan
Bethesda Downtown Sector Plan 2016, Bicycle Master Plan DCP No No
* Note: DCP = Downcounty Planning, MCP = Midcounty planning UCP = Upcounty Planning Page 2 of 8 October 14, 2021

Attachment A:Top 100 Transportation CIP Priorities
2021 Priority
2019 Priority
Category Project Comments Primary Master Plan Master Plan Area Team* Positive Effect to
Equity Focus Areas
Positive Effect to High Injury Network (Vision
Zero)
23 29 BikewayFenton St Separated Bike Lanes (Ellsworth Dr to Wayne Ave)
Tier 0.5 Priority in Bicycle Master Plan. Project funded in CIP Project #P502001 Silver Spring CBD
Silver Spring CBD, Bicycle Master Plan DCP Yes Yes
24 36 BikewayGlenmont to Silver Spring Breezeway (Arcola Ave to Blueridge Ave)
Tier 1 Priority in Bicycle Master Plan. Project funded in CIP Project #P502002
Wheaton CBD Kensington-Wheaton, Bicycle Master Plan
MCP Yes Yes
25 30 BikewayFenton St Separated Bike Lanes (Wayne Ave to King St)
Tier 0.5 Priority in Bicycle Master Plan. Project funded in CIP Project #P502001 Silver Spring CBD
Silver Spring CBD, Bicycle Master Plan DCP Yes Yes
26 20/27 Road WideningI-495 (Capital Beltway) HOV between the American Legion Bridge and the I-270 Western Spur
Extend HOV lanes south of I-270 West Spur. Under Study by MDOT SHA as part of Managed Lanes Study
Bethesda-Chevy Chase, Potomac DCP,MCP No No
27 40 BikewayGlenmont to Silver Spring Breezeway (Blueridge Ave to University Blvd)
Tier 1 Priority in Bicycle Master Plan. Project funded in CIP Project #P502002
Wheaton CBD Wheaton CBD, Bicycle Master Plan
MCP Yes Yes
28 16/32/38 Road Widening
I-270 Widening to 6 lanes from MD 121 to the County Line. Widen to 8 lanes from Little Seneca Creek to MD 121. Could be replaced by Phase 1B of Managed Lanes project (City of Frederick to I-370)
From CLRP. In 2017 joint priorities letter. Under Study by MDOT SHA as part of Managed Lanes Study
Clarksburg Clarksburg, Clarksburg - Ten Mile Creek UCP No No
29 33 Pedestrian Dale Drive SidewalkRecommend advancement of project into Preliminary Design. Currently funded for Facility Planning only Project #P509337
North and West Silver Spring North and West Silver Spring DCP No No
30 34 Transit Boyds Station, Bus Loop, and Parking
Acquire the for-sale Anderson property north of the MARC station for station facilities, bus loop, and additional parking. MTA may help fund. Current funding for property acquisition only - Project #P501915
MARC Rail Communities
MARC Rail Communities Sector Plan UCP No No
31 35 Road Improvements Redesign Wisconsin Avenue as an urban boulevard
Redesign the road to conform to Urban Road Code and make room for BRT operations. Options included dedicated lanes (curb and median), stations (curb and median), and BAT lanes. Wider sidewalks and buffers are also included. For transportation purposes, the Urban Boulevard concept envisions a pedestrian through zone of 10-20ft with a planting/furnishing zone of 6-10ft.
Bethesda Downtown Plan
Bethesda Downtown Sector Plan 2016 DCP No Yes
32 37 Road Diet Middlebrook Road Germantown Road to Great Seneca Highway. MCDOT implemented SB direction only
MARC Rail Communities
MARC Rail Communities Sector Plan UCP Yes Yes
33 -- Pedestrian Level-of-Effort Sidewalk Retrofit Program
Demand for sidewalk retrofits in the County far exceeds MCDOT’s ability to construct. To improve countywide Pedestrian Level of Comfort and achieve Pedestrian Master Plan connectivity goals, the budget for this program should be greatly increased.
Countywide Countywide Countywide Yes Yes
* Note: DCP = Downcounty Planning, MCP = Midcounty planning UCP = Upcounty Planning Page 3 of 8 October 14, 2021

Attachment A:Top 100 Transportation CIP Priorities
2021 Priority
2019 Priority
Category Project Comments Primary Master Plan Master Plan Area Team* Positive Effect to
Equity Focus Areas
Positive Effect to High Injury Network (Vision
Zero)
34 -- Road WideningMD 355 Improvements - Milestone Manor Road to Little Seneca Parkway
MDTO SHA completed study 2021 Clarksburg Clarksburg UCP No No
35 39 Road Construction Pearl Street Connector Supported as a connection in Bicycle Master Plan
Bethesda Downtown Plan
Bethesda Downtown Sector Plan 2016 DCP No No
36 31 BikewayGlenmont to Silver Spring Breezeway (Georgia Ave to Arcola Ave)
Tier 1 Priority in Bicycle Master Plan. Project funded in CIP Project #P502002 between Arcola Ave and Dawson Ave Wheaton CBD
Wheaton CBD, Kensington-Wheaton, Bicycle Master Plan
MCP Yes Yes
37 -- Pedestrian
Improve existing trail crossings on state and county roads and provide protected crossings where warranted. Create new CIP project at the county level for MCDOT trail crossing improvements.
Projects included have been identified in Montgomery Parks Trail Crossing Study.
Countywide Countywide Countywide Yes Yes
38 41 Road ConstructionObservation Drive Extended (A-19) between Waters Discovery Lane and Little Seneca Parkway
Construction of this road up to Little Seneca Parkway found to have benefits in MDOT SHA MD 355 Corridor Study (2021)
ClarksburgClarksburg, Clarksburg - Ten
Mile Creek, Germantown, Germantown EASP
UCP No No
39 --
PedestrianMatthew Henson Trail Overpass at Veirs Mill Road (MD 586)
Improve the Matthew Henson Trail crossing with a protected crossing that eliminates conflicts and has a high rate of compliance, a direct crosswalk and additional pedestrian-scale lighting.
Veirs Mill Corridor MP Veirs Mill Corridor MP MCP Yes Yes
40 42 Interchange Improvements
Georgia Avenue (MD97) at Norbeck Road (MD28)
Construct a grade-separated interchange at intersection of Georgia Ave and Norbeck Rd. SHA has completed a facility planning study; waiting for construction funding. From CLRP. In 2017 joint priorities letter
Kensington/Wheaton Olney, Aspen Hill MCP,UCP No Yes
41 43 Transit Georgia Avenue North BRT Wheaton CBD to Olney Multiple Wheaton, Glenmont, Aspen Hill, Olney MCP,UCP Yes Yes
42 44 Bridge Dorsey Mill Bridge and Road (B-14)Crystal Rock Drive to Observation Drive. Intended accommodate the CCT in the median. In design.
Germantown Employment Area
Germantown Employment Area, CTCFMP UCP No No
43 45 Road Construction Dorsey Mill CCT station - direct access from I-270
The Plan recommends direct access to the Dorsey Mill station to and from north I-270 through direct access ramps at the interchange or a revision to the Father Hurley Boulevard interchange.
Germantown Employment Area
Germantown Employment Area, CTCFMP UCP No No
44 46 Interchange Improvements
Little Seneca Parkway Extended or Newcut Road/I-270 Interchange Not programmed. In CLRP. Ten Mile Creek Clarksburg, Ten Mile Creek UCP No No
45 47 Transit White Flint MARC Rail Station and Service
MDOT - conduct a feasibility study for an infill MARC station along the Brunswick Line and determine if a MARC station should be located in the plan area
White Flint White Flint MCP Yes No
46 48 BikewayCastle Blvd (Castle Ridge Cir to Briggs Chaney Rd) Tier 1 Priority in Bicycle Master Plan. Fairland Bicycle Master Plan, Fairland UCP Yes No
* Note: DCP = Downcounty Planning, MCP = Midcounty planning UCP = Upcounty Planning Page 4 of 8 October 14, 2021

Attachment A:Top 100 Transportation CIP Priorities
2021 Priority
2019 Priority
Category Project Comments Primary Master Plan Master Plan Area Team* Positive Effect to
Equity Focus Areas
Positive Effect to High Injury Network (Vision
Zero)
47 --
Road Diet
Expand the consideration and application of Road Diets/Open Streets/Multimodal Access Improvements on County roads (including Park roads)
Parks projects included have been identified in Montgomery Parks Countywide Park Trails Master Plan and on-going Vision Zero analysis.
Countywide Countywide Countywide Yes Yes
48 78/79 BikewayGrandview Ave Neighborhood Greenway (Arcola Ave to University Blvd) Tier 1 Priority in Bicycle Master Plan.
Wheaton CBD Wheaton CBD, Kensington-Wheaton, Bicycle Master Plan
MCP Yes Yes
49 52 Road Construction New Road (B-25)Seneca Meadows Pkwy to Milestone Center Court. This new road would also carry the eastern leg of the CCT over Ridge Road.
Germantown Employment Area
Germantown Employment Area, CTCFMP UCP No No
50 53/55 BikewayGreenwood Ave Neighborhood Greenway (Wabash Ave to Piney Brnch) Tier 1 Priority in Bicycle Master Plan.
Long Branch Bicycle Master Plan, Takoma Park, Silver Spring East DCP Yes No
51 54 Pedestrian Oakview Drive pedestrian and transit access
Improve pedestrian and transit access along Oakview Drive East Silver Spring East Silver Spring DCP Yes Yes
52 56 Bikeway Germantown Town Center BiPPAAdvance planning for Germantown Town Center BiPPA . Add to current CIP Project # P501532.
Germantown Employment Area
Germantown/ Germantown Employment Area UCP Yes Yes
53 57 Bridge Old Columbia Pike Bridge at Paint Branch
Bridge and roadway reconstruction White Oak Science Gateway White Oak Science Gateway MCP Yes Yes
54 58 Pedestrian Sidewalk construction on "Community Connector Streets"
The streets identified should have sidewalk on at least one side of the street and wayfinding signs to guide pedestrians to their destinations
Greater Lyttonsville Greater Lyttonsville Sector Plan 2016 DCP Yes No
55 59 BikewayVeirs Mill Rd (MD 586) Neighborhood Greenway (Glorus Pl to Veirs Mill Rd) Tier 1 Priority in Bicycle Master Plan.
Veirs Mill Corridor MP
Veirs Mill Corridor Master Plan, Bicycle Master Plan,
MCP Yes Yes
56 60 BikewayFlower Ave to University Blvd Neighborhood Greenway (Flower Ave to University Blvd) Tier 1 Priority in Bicycle Master Plan.
Long Branch Long Branch Sector Plan, Bicycle Master Plan DCP Yes Yes
57 61 Road Construction Locbury Drive (B-5)Wisteria Drive to Middlebrook Drive. Construct new road to connect existing Locbury Drive north of Middlebrook to Waters Road.
Germantown Employment Area
Germantown Employment Area, Germantown UCP Yes Yes
58 62 Transit Georgia Avenue South BRT CTCFMP, includes improved transit access. Multiple SS CBD, North & West SS, Wheaton DCP,MCP Yes Yes
59 63 BikewaySelfridge Rd Neighborhood Greenway (Aspen Hill Rd to Veirs Mill Rd) Tier 1 Priority in Bicycle Master Plan.
Veirs Mill Corridor MP
Veirs Mill Corridor Master Plan, Bicycle Master Plan,
MCP Yes No
60 64/98 PedestrianProvide a sidewalk and bikeway along Redland Road between MD 200 and Briardale Road.
Currently, walking to Metro or nearby parks is challenging and unpleasant due to the lack of sidewalks and streetscape improvements.
Shady Grove Shady Grove MCP Yes No
61 65 BikewayFriendship Blvd Separated Bike Lanes (Willard Ave to District of Columbia) Tier 0.5 Priority in Bicycle Master Plan.
Friendship Heights Friendship Heights CBD, Bicycle Master Plan
DCP No No
* Note: DCP = Downcounty Planning, MCP = Midcounty planning UCP = Upcounty Planning Page 5 of 8 October 14, 2021
Attachment A:Top 100 Transportation CIP Priorities
2021 Priority
2019 Priority
Category Project Comments Primary Master Plan Master Plan Area Team* Positive Effect to
Equity Focus Areas
Positive Effect to High Injury Network (Vision
Zero)
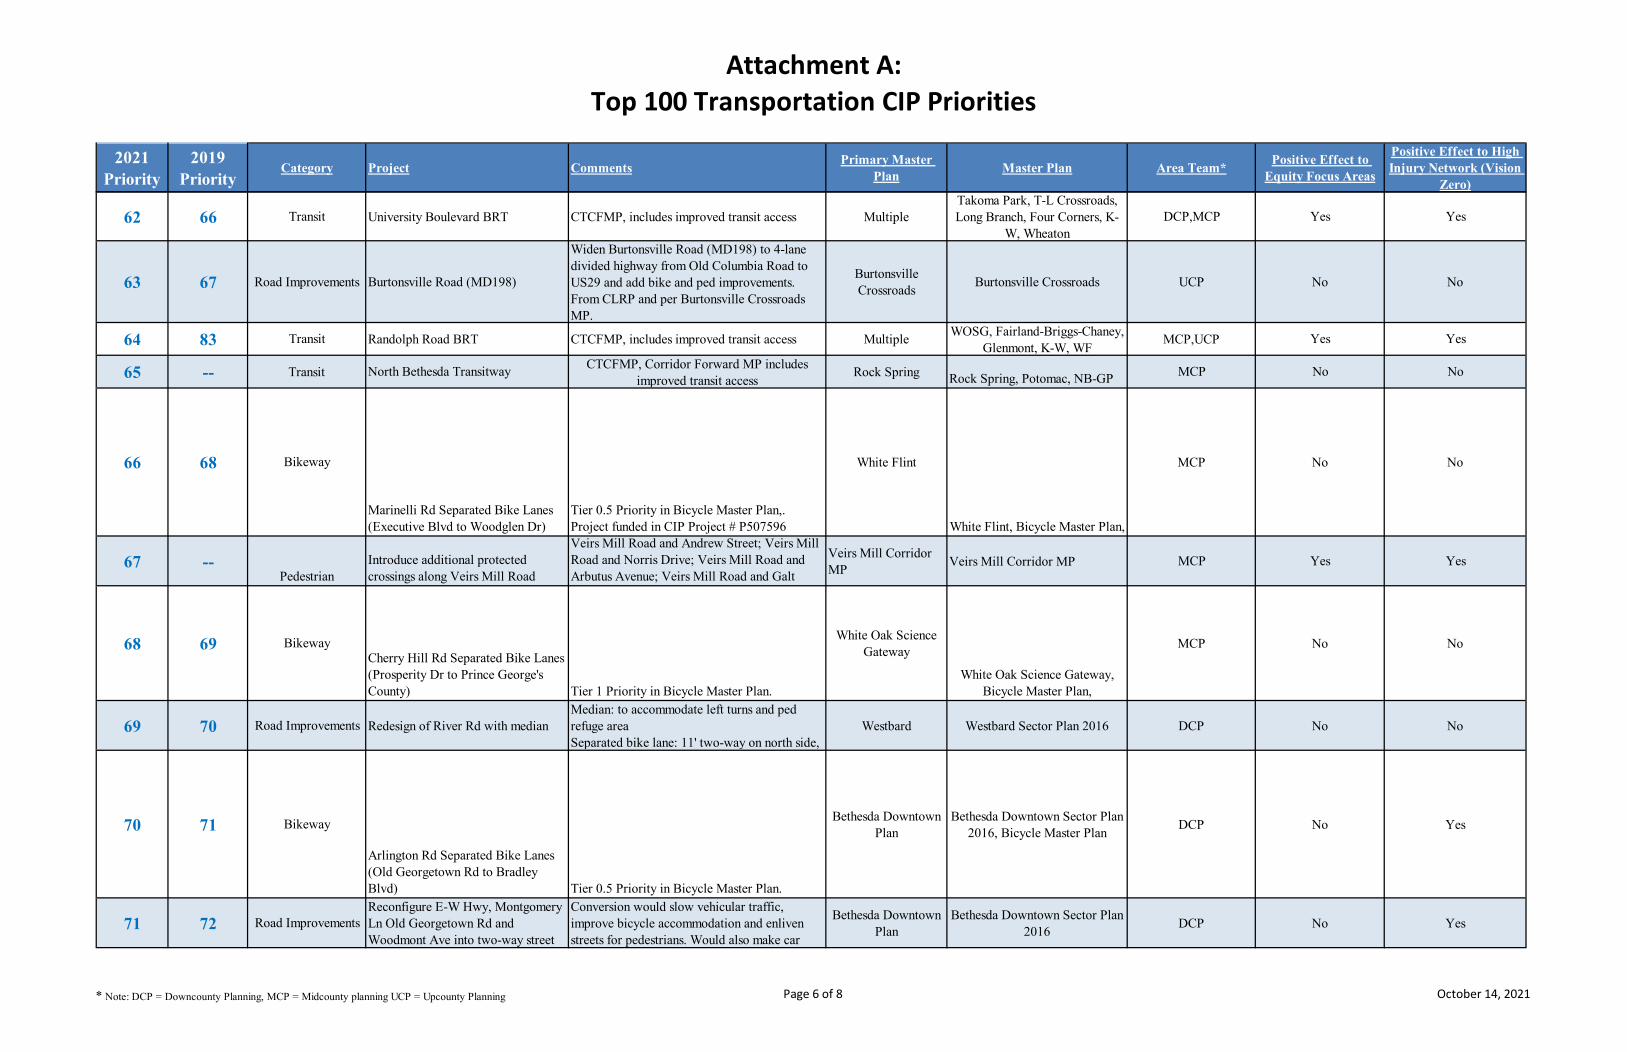
62 66 Transit University Boulevard BRT CTCFMP, includes improved transit access MultipleTakoma Park, T-L Crossroads, Long Branch, Four Corners, K-
W, WheatonDCP,MCP Yes Yes
63 67 Road Improvements Burtonsville Road (MD198)
Widen Burtonsville Road (MD198) to 4-lane divided highway from Old Columbia Road to US29 and add bike and ped improvements. From CLRP and per Burtonsville Crossroads MP.
Burtonsville Crossroads Burtonsville Crossroads UCP No No
64 83 Transit Randolph Road BRT CTCFMP, includes improved transit access Multiple WOSG, Fairland-Briggs-Chaney, Glenmont, K-W, WF MCP,UCP Yes Yes
65 -- Transit North Bethesda Transitway CTCFMP, Corridor Forward MP includes improved transit access Rock Spring Rock Spring, Potomac, NB-GP MCP No No
66 68 Bikeway
Marinelli Rd Separated Bike Lanes (Executive Blvd to Woodglen Dr)
Tier 0.5 Priority in Bicycle Master Plan,. Project funded in CIP Project # P507596
White Flint
White Flint, Bicycle Master Plan,
MCP No No
67 --Pedestrian
Introduce additional protected crossings along Veirs Mill Road
Veirs Mill Road and Andrew Street; Veirs Mill Road and Norris Drive; Veirs Mill Road and Arbutus Avenue; Veirs Mill Road and Galt
Veirs Mill Corridor MP Veirs Mill Corridor MP MCP Yes Yes
68 69 BikewayCherry Hill Rd Separated Bike Lanes (Prosperity Dr to Prince George's County) Tier 1 Priority in Bicycle Master Plan.
White Oak Science Gateway
White Oak Science Gateway, Bicycle Master Plan,
MCP No No
69 70 Road Improvements Redesign of River Rd with medianMedian: to accommodate left turns and ped refuge areaSeparated bike lane: 11' two-way on north side,
Westbard Westbard Sector Plan 2016 DCP No No
70 71 Bikeway
Arlington Rd Separated Bike Lanes (Old Georgetown Rd to Bradley Blvd) Tier 0.5 Priority in Bicycle Master Plan.
Bethesda Downtown Plan
Bethesda Downtown Sector Plan 2016, Bicycle Master Plan DCP No Yes
71 72 Road ImprovementsReconfigure E-W Hwy, Montgomery Ln Old Georgetown Rd and Woodmont Ave into two-way street
Conversion would slow vehicular traffic, improve bicycle accommodation and enliven streets for pedestrians. Would also make car
Bethesda Downtown Plan
Bethesda Downtown Sector Plan 2016 DCP No Yes
* Note: DCP = Downcounty Planning, MCP = Midcounty planning UCP = Upcounty Planning Page 6 of 8 October 14, 2021

Attachment A:Top 100 Transportation CIP Priorities
2021 Priority
2019 Priority
Category Project Comments Primary Master Plan Master Plan Area Team* Positive Effect to
Equity Focus Areas
Positive Effect to High Injury Network (Vision
Zero)
72 73/74 BikewayEdgemoor Ln Neighborhood Greenway (Exeter Rd to Bethesda Metro Station) Tier 0.5 Priority in Bicycle Master Plan.
Bethesda Downtown Plan
Bethesda Downtown Sector Plan 2016, Bicycle Master Plan DCP No No
73 49 Bikeway ICC BikewaySupport extension of existing ICC bikeway with expansion of bikeway between Emory Lane and the Prince George's County line; would provide
Bicycle Master Plan UCP Yes No
74 41 Road ConstructionObservation Drive Extended (A-19) between Little Seneca Parkway and Shawnee Lane
Additional study needed per previous Planning Board recommendations with re-assessment of Clarksburg Bypass
ClarksburgClarksburg, Clarksburg - Ten
Mile Creek, Germantown, Germantown EASP
UCP No No
75 75 Pedestrian Redesign Norfolk Ave as a shared street
A portion of Norfolk Ave within the Woodmont Triangle be improved as a shared street with
Bethesda Downtown Plan
Bethesda Downtown Sector Plan 2016 DCP No No
76 76 Bikeway Broadbirch Dr Separated Bike Lanes (Tech Rd to Cherry Hill Rd) Tier 1 Priority in Bicycle Master Plan.
White Oak Science Gateway
Bicycle Master Plan, White Oak Science Gateway
MCP No No
77 -- BikewayBriggs-Chaney Rd (North Side) Sidepath (Old Columpia Pike to ICC In Support of Fairland Briggs Chaney
Fairland/Briggs-Chaney UCP Yes No
78 77 Transit Circulator Bus Route - Downtown Bethesda
Bethesda Downtown Plan
Bethesda Downtown Sector Plan 2016 DCP No Yes
79 50 Road ConstructionMidcounty Highway (M-83) from Ridge Road to Montgomery Village Avenue
No current plans by MCDOT to advance Montgomery VillageMontgomery Village,
Clarksburg, Clarksburg - Ten Mile Creek, Germantown,
UCP No No
80 80 Transit Extend regional bus service to connect to Prince George's County
Extend regional bus service to include connections between major activity centers along US 29 and Prince George's County.
Fairland Fairland UCP Yes No
81 -- BikewayGermantown Road (North Side) Sidepath (Clopper Rd to Middlebrook Rd) Advance for equity
Germantown Employment Area Germantown Employment Area
UCP Yes No
82 81 Bikeway Grandview Ave Separated Bike Lanes (University Blvd to Reedie Dr) Tier 1 Priority in Bicycle Master Plan.
Wheaton CBD Wheaton CBD, Bicycle Master Plan
MCP Yes Yes
83 -- BikewayMontgomery Village Ave (east Side Sidepath (Wrightman Rd to Stedwick Advance for equity Montgomery Village Montgomery Village MCP Yes No
8482
Pedestrian Olney Sandy Spring Rd Improve pedestrian access within walking distance of the village centers. Sandy Spring/Ashton Sandy Spring/Ashton UCP No No
85 -- BikewayMontgomery Village Ave (east Side Sidepath (Stedwick Rd to City of Advance for equity Montgomery Village Montgomery Village MCP Yes No
86 84 Road Construction Crabbs Branch Way extension Facility Planning Study to extend Crabbs Branch Way to Amity Drive Shady Grove Shady Grove MCP No No
87 -- BikewayPiney Branch Rd (MD 320) Separated Bike Lanes (University Blvd to Prince George's Co Line) Advance for equity
Long Branch Long Branch, Silver Spring East DCP Yes Yes
* Note: DCP = Downcounty Planning, MCP = Midcounty planning UCP = Upcounty Planning Page 7 of 8 October 14, 2021
Attachment A:Top 100 Transportation CIP Priorities
2021 Priority
2019 Priority
Category Project Comments Primary Master Plan Master Plan Area Team* Positive Effect to
Equity Focus Areas
Positive Effect to High Injury Network (Vision
Zero)
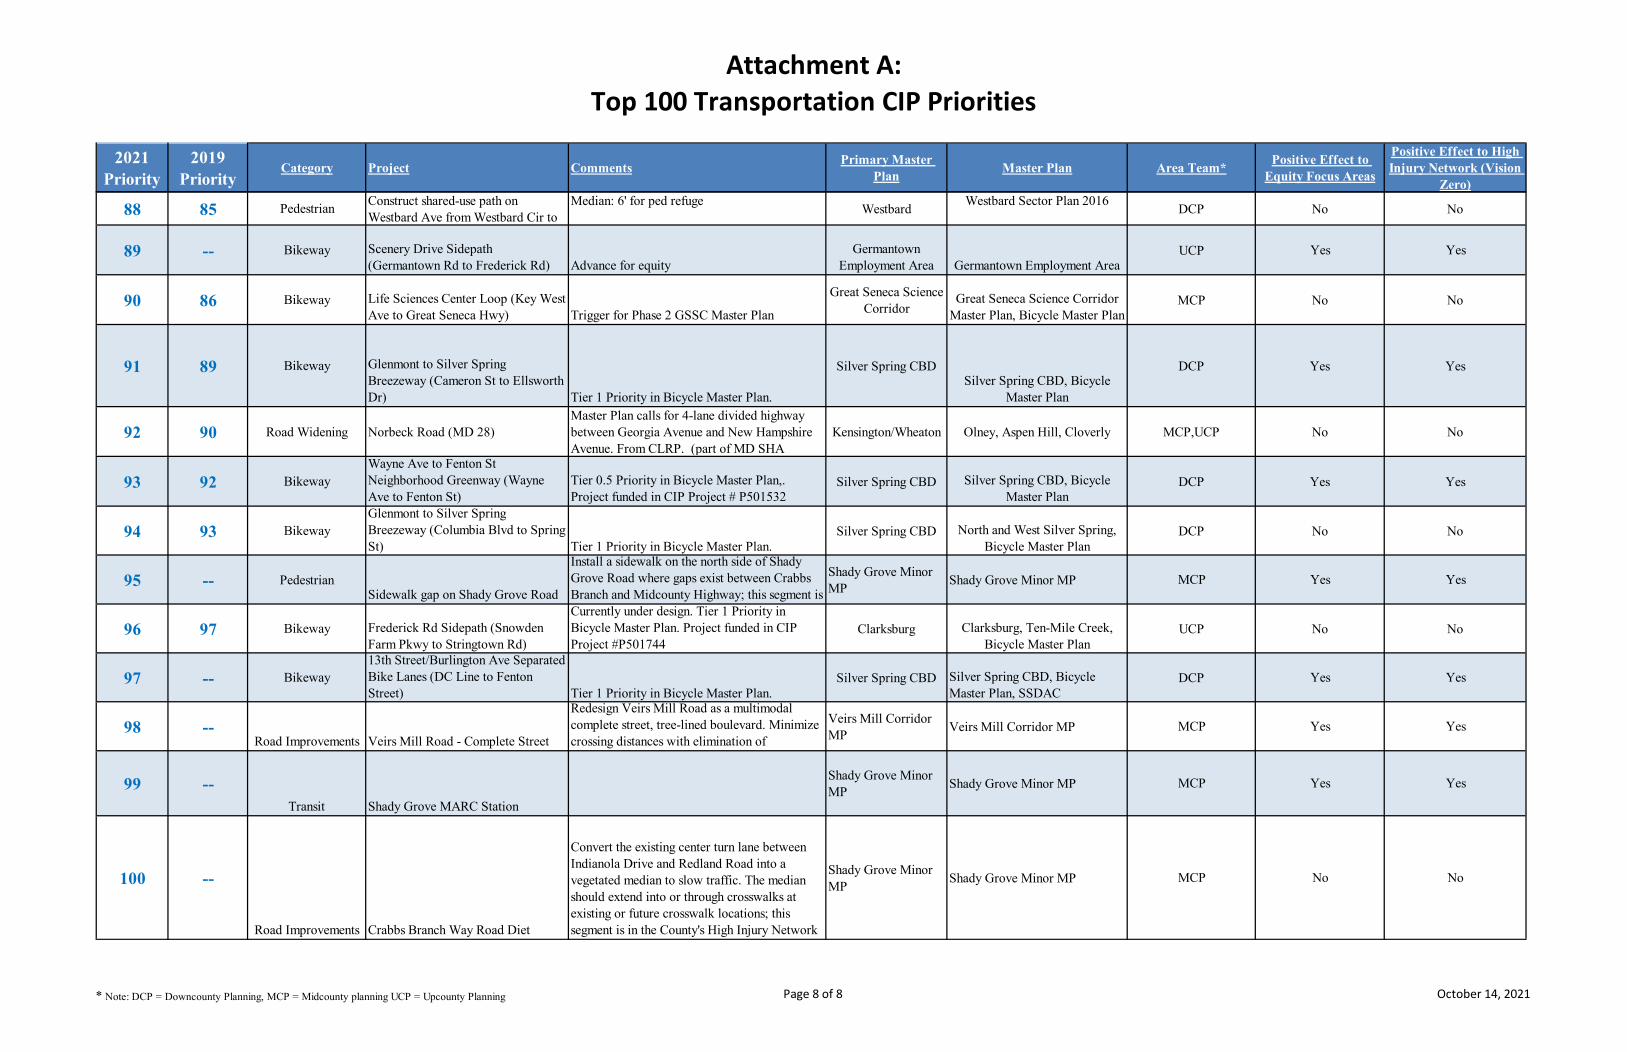
88 85 Pedestrian Construct shared-use path on Westbard Ave from Westbard Cir to
Median: 6' for ped refuge Westbard Westbard Sector Plan 2016 DCP No No
89 -- Bikeway Scenery Drive Sidepath (Germantown Rd to Frederick Rd) Advance for equity
Germantown Employment Area Germantown Employment Area
UCP Yes Yes
90 86 Bikeway Life Sciences Center Loop (Key West Ave to Great Seneca Hwy) Trigger for Phase 2 GSSC Master Plan
Great Seneca Science Corridor
Great Seneca Science Corridor Master Plan, Bicycle Master Plan
MCP No No
91 89 Bikeway Glenmont to Silver Spring Breezeway (Cameron St to Ellsworth Dr) Tier 1 Priority in Bicycle Master Plan.
Silver Spring CBDSilver Spring CBD, Bicycle
Master Plan
DCP Yes Yes
92 90 Road Widening Norbeck Road (MD 28)Master Plan calls for 4-lane divided highway between Georgia Avenue and New Hampshire Avenue. From CLRP. (part of MD SHA
Kensington/Wheaton Olney, Aspen Hill, Cloverly MCP,UCP No No
93 92 BikewayWayne Ave to Fenton St Neighborhood Greenway (Wayne Ave to Fenton St)
Tier 0.5 Priority in Bicycle Master Plan,. Project funded in CIP Project # P501532
Silver Spring CBD Silver Spring CBD, Bicycle Master Plan
DCP Yes Yes
94 93 BikewayGlenmont to Silver Spring Breezeway (Columbia Blvd to Spring St) Tier 1 Priority in Bicycle Master Plan.
Silver Spring CBD North and West Silver Spring, Bicycle Master Plan
DCP No No
95 -- PedestrianSidewalk gap on Shady Grove Road
Install a sidewalk on the north side of Shady Grove Road where gaps exist between Crabbs Branch and Midcounty Highway; this segment is
Shady Grove Minor MP Shady Grove Minor MP MCP Yes Yes
96 97 Bikeway Frederick Rd Sidepath (Snowden Farm Pkwy to Stringtown Rd)
Currently under design. Tier 1 Priority in Bicycle Master Plan. Project funded in CIP Project #P501744
Clarksburg Clarksburg, Ten-Mile Creek, Bicycle Master Plan
UCP No No
97 -- Bikeway13th Street/Burlington Ave Separated Bike Lanes (DC Line to Fenton Street) Tier 1 Priority in Bicycle Master Plan.
Silver Spring CBD Silver Spring CBD, Bicycle Master Plan, SSDAC
DCP Yes Yes
98 --Road Improvements Veirs Mill Road - Complete Street
Redesign Veirs Mill Road as a multimodal complete street, tree-lined boulevard. Minimize crossing distances with elimination of
Veirs Mill Corridor MP Veirs Mill Corridor MP MCP Yes Yes
99 --Transit Shady Grove MARC Station
Shady Grove Minor MP Shady Grove Minor MP MCP Yes Yes
100 --
Road Improvements Crabbs Branch Way Road Diet
Convert the existing center turn lane between Indianola Drive and Redland Road into a vegetated median to slow traffic. The median should extend into or through crosswalks at existing or future crosswalk locations; this segment is in the County's High Injury Network
Shady Grove Minor MP Shady Grove Minor MP MCP No No
* Note: DCP = Downcounty Planning, MCP = Midcounty planning UCP = Upcounty Planning Page 8 of 8 October 14, 2021

Office of Planning and Preliminary Engineering Travel Forecasting & Analysis Division
Prepared By WRA, LLP
[Document title] [Document subtitle]
MD 355 Capacity Analysis
Little Seneca Parkway to Milestone Manor Lane, Montgomery County, MD
June 2021

MD 355 Capacity Analysis Report - June 2021
i | P a g e
TABLE OF CONTENTS 1. Purpose .................................................................................................................................... 1 2. Baseline Assumptions.............................................................................................................. 1
2.1. Scope of Study ..................................................................................................................1 2.2. Alternatives .......................................................................................................................2
2.3. Description of Corridor .....................................................................................................3
2.4. Turning Movement Counts & 2019 Balanced Volumes .................................................10 2.5. Travel Times ...................................................................................................................11
2.6. Field Observations ..........................................................................................................11 2.7. Signal Timings ................................................................................................................12
2.8. Pedestrian and Bicycle Network .....................................................................................12
a) Existing Roadside Pedestrian Network .......................................................................... 12
b) Existing Crosswalks ....................................................................................................... 12
c) Existing Bicycle Network .............................................................................................. 13
d) Proposed Pedestrian/Bicycle Facilities .......................................................................... 13
2.9. Bus Stop Inventory ..........................................................................................................16
2.10. Future Year 2040 Volumes .............................................................................................18
3. Operational Analysis ............................................................................................................. 23
3.1. Model Selection ..............................................................................................................23
3.2. Existing (2019) Traffic Conditions .................................................................................28
3.3. 2040 No Build without Observation Drive Extension Traffic Conditions .....................29
3.4. 2040 Build 1 without Observation Drive Extension Traffic Conditions ........................29
3.5. 2040 Build 2 without Observation Drive Extension Traffic Conditions ........................31
3.6. 2040 No Build with Observation Drive Extension Traffic Conditions ..........................33
3.7. 2040 Build 1 with Observation Drive Extension Traffic Conditions .............................33 3.8. 2040 Build 2 with Observation Drive Extension Traffic Conditions .............................34
4. Costs/Concepts ...................................................................................................................... 36
5. Conclusions/Recommendations............................................................................................. 39

MD 355 Capacity Analysis Report - June 2021
ii | P a g e
LIST OF FIGURES Figure 1: Study Intersections and Existing Lane Configurations ................................................... 4 Figure 2: 2040 No Build without Observation Drive Extension/2040 Build 1 without Observation Drive Extension Lane Configurations ............................................................................................ 5 Figure 3: 2040 Build 2 without Observation Drive Extension Lane Configurations ..................... 6 Figure 4: 2040 No Build with Observation Drive Extension Lane Configurations ....................... 7 Figure 5: 2040 Build 1 with Observation Drive Extension Lane Configurations .......................... 8 Figure 6: 2040 Build 2 with Observation Drive Extension Lane Configurations .......................... 9 Figure 7: Existing AM/PM Peak Hour Volumes .......................................................................... 10 Figure 8: Existing Roadside Pedestrian Network with W. Old Baltimore Road Intersection Project Improvements ................................................................................................................... 14 Figure 9: Existing Bicycle Signage on Northbound MD 355 ....................................................... 15 Figure 10: Existing Bicycle Lane Begins at Northbound Approach to Little Seneca Parkway ... 15 Figure 11: Map of M-NCPPC Bicycle Network (Source: https://mcatlas.org/bikeplan/) ............ 16 Figure 12: Existing Bus Stop Map ................................................................................................ 17 Figure 13: Existing Bus Stops on MD 355 at Greenridge Rd and at West Old Baltimore Rd ..... 18 Figure 14: 2040 No Build/Build 1 without Observation Drive Extension AM/PM Peak Hour Volumes ........................................................................................................................................ 20 Figure 15: 2040 Build 2 without Observation Drive Extension AM/PM Peak Hour Volumes ... 21 Figure 16: 2040 No Build/Build 1 with Observation Drive Extension AM/PM Peak Hour Volumes ........................................................................................................................................ 22 Figure 17: 2040 Build 2 with Observation Drive Extension AM/PM Peak Hour Volumes ......... 23 Figure 18: Build 2 Concept Plan ................................................................................................... 38
LIST OF TABLES Table 1: Field-Measured and Modeled MD 355 Travel Time ...................................................... 11 Table 2: SimTraffic MD 355 Travel Time and Delay .................................................................. 24 Table 3: SimTraffic Intersection Peak Hour Level of Service (LOS) and Delay (in seconds) – AM ................................................................................................................................................ 24 Table 4: SimTraffic Intersection Peak Hour LOS and Delay (in seconds) – PM ......................... 25 Table 5: Summary of 95th Percentile Queue Length (ft) along MD 355 (SimTraffic) AM Peak Hour .............................................................................................................................................. 26 Table 6: Summary of 95th Percentile Queue Length (ft) along MD 355 (SimTraffic) PM Peak Hour .............................................................................................................................................. 27 Table 7: Intersections with Failing Peak Hour LOS by Delay (in seconds) and Queue Capacity 28 Table 8: Intersections with Improved Peak Hour LOS by Delay (2040 Build 1 w/o Observation Drive Extension vs 2040 No Build w/o Observation Drive Extension) ....................................... 31 Table 9: Intersections with Improved Peak Hour LOS by Delay (2040 Build 2 w/o Observation Drive Extension vs 2040 No Build w/o Observation Drive Extension and 2040 Build 1 w/o Observation Drive Extension)....................................................................................................... 33 Table 10: Intersections with Improved Peak Hour LOS by Delay (2040 Build 1 w/ Observation Drive Extension vs 2040 No Build w/ Observation Drive Extension) ......................................... 34 Table 11: Intersections with Improved Peak Hour LOS by Delay (2040 Build 2 w/ Observation Drive Extension vs 2040 No Build w/ Observation Drive Extension and 2040 Build 1 w/ Observation Drive Extension)....................................................................................................... 36 Table 12: Conceptual Cost Estimate – Build 2 Alternatives ........................................................ 37

MD 355 Capacity Analysis Report - June 2021
iii | P a g e
APPENDICES
Appendix A: Traffic Count Data Appendix B: Volume Calculations Appendix C: Synchro/SimTraffic Reports Appendix D: Bus Ridership Data Appendix E: Costs/Concepts

MD 355 Capacity Analysis – June 2021
1 | P a g e
1. PURPOSE This report summarizes MDOT SHA’s analysis to determine the need for potential improvements in the MD 355 (Frederick Road) corridor from Little Seneca Parkway to Milestone Manor Lane in Clarksburg. This analysis provides guidance for possible improvements to the corridor and analyzes the corridor both with and without the proposed section of the Observation Drive Extension1 between Ridge Road and Little Seneca Parkway running parallel to and west of MD 355. This analysis was performed by MDOT SHA at the request of Montgomery County to assist in prioritizing transportation improvements in the Clarksburg area.
2. BASELINE ASSUMPTIONS 2.1. Scope of Study This Study is a capacity analysis of MD 355 for the 1.3-mile segment of MD 355 from Little Seneca Parkway to Milestone Manor Lane in Clarksburg. The study includes:
• Development of 2019 Existing and forecasted 2040 No Build balanced traffic volumes. 2040 volumes are developed for both with and without the proposed Observation Drive Extension.
• Field review, including peak hour observations, travel time runs, transportation network geometry and condition survey, and review of gaps in the pedestrian and bicycle networks.
• Assessment of the multimodal facilities within the study area. This includes pedestrian and bicycle networks, and transit amenities and accessibility.
• Development and calibration of 2019 Existing and 2040 No Build Synchro/SimTraffic models for capacity analyses. 2040 models are developed for both with and without the proposed Observation Drive Extension.
• Development of proposed solutions to improve vehicular traffic operations for the corridor both with and without the proposed Observation Drive Extension based on capacity analyses.
• Summary of analysis and findings.
Between Little Seneca Parkway and Milestone Manor Lane, MD 355 is an undivided two-lane roadway. At Little Seneca Parkway, MD 355 widens to provide turn and auxiliary lanes. Farther north, MD 355 is a two-lane undivided roadway. South of Milestone Manor Lane, MD 355 is a four-lane divided roadway. All unsignalized intersections have stop sign control along the side streets.
1 The Observation Drive Extension is a proposed extension of Observation Drive from its existing terminus north of MD 27 (Ridge Road) to Stringtown Road, north of Little Seneca Parkway. As this proposed roadway would run parallel to MD 355, its completion would provide an alternate route to MD 355 in this area.

MD 355 Capacity Analysis – June 2021
2 | P a g e
Capacity analyses are included for the following intersections (see Figures 1 and 2):
1. MD 355 at Little Seneca Parkway (Signalized) 2. MD 355 at Newcut Road (Unsignalized) 3. MD 355 at Canterfield Way/Rosecrest Drive (Unsignalized) 4. MD 355 at West Old Baltimore Road (Signalized) 5. MD 355 at Greenbrook Drive (Unsignalized) 6. MD 355 at Brink Road (Unsignalized) 7. MD 355 at Milestone Manor Lane (Unsignalized)
All unsignalized intersections have stop sign control along the side streets. This analysis also includes an assessment of the multimodal facilities within the study area. This includes pedestrian networks, bicycle networks, and transit amenities and accessibility.
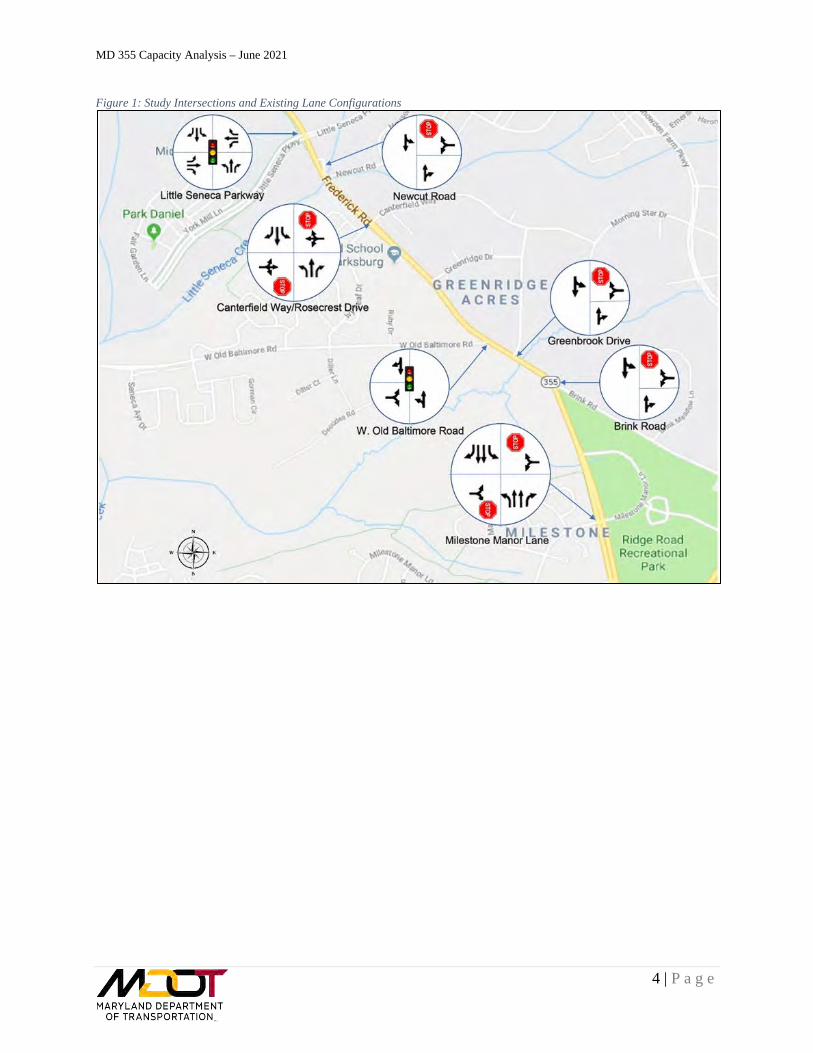
2.2. Alternatives This study includes an evaluation of the AM and PM peak hours for multiple alternatives. The lane configurations of the alternatives are shown in Figures 2-6. MDOT SHA evaluated build alternatives with and without the Observation Drive Extension section between Ridge Road and Little Seneca Parkway. The Observation Drive Extension route is shown in Figures 4-6. Detailed descriptions of the alternatives are listed later in this report.
The list of alternatives includes:
• Existing Conditions • 2040 No Build network without Observation Drive Extension • 2040 Build 1 Alternative without Observation Drive Extension – includes smaller-
scale/lower cost system improvements, including restriping of a turn lane and restricting left turns at Newcut Road
• 2040 Build 2 Alternative without Observation Drive Extension – includes larger-scale/higher cost system improvements, including widening MD 355 to two lanes per direction, adding exclusive turn lanes at the MD 355 at Little Seneca Parkway intersection, and restricting left turns at Newcut Road
• 2040 No Build network with Observation Drive Extension • 2040 Build 1 Alternative with Observation Drive Extension – includes smaller-scale/lower
cost system improvements, including restriping of a turn lane and restricting left turns at Newcut Road
• 2040 Build 2 Alternative with Observation Drive Extension – includes larger-scale/higher cost system improvements, including widening MD 355 to two lanes per direction, including widening MD 355 to two lanes per direction, adding exclusive turn lanes at the MD 355 at Little Seneca Parkway intersection, and restricting left turns at Newcut Road
All of the 2040 alternatives include one just completed improvement and one planned improvement to the existing roadway network:
MD 355 Capacity Analysis – June 2021
3 | P a g e
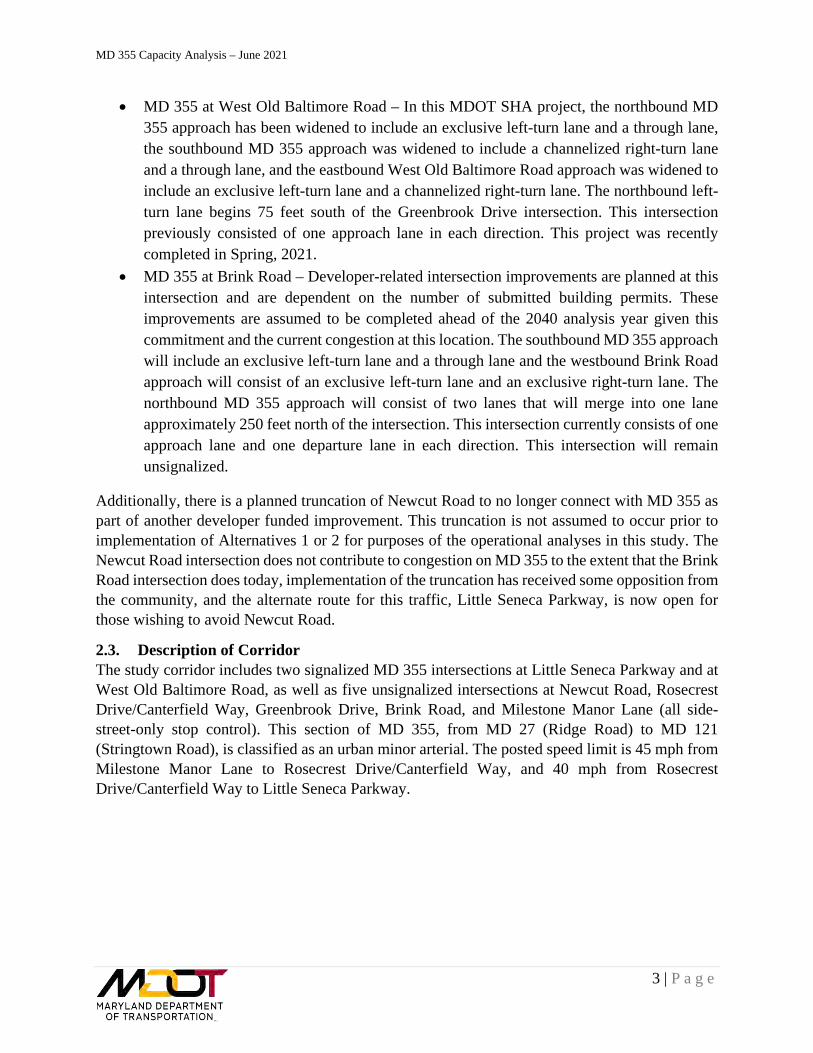
• MD 355 at West Old Baltimore Road – In this MDOT SHA project, the northbound MD 355 approach has been widened to include an exclusive left-turn lane and a through lane, the southbound MD 355 approach was widened to include a channelized right-turn lane and a through lane, and the eastbound West Old Baltimore Road approach was widened to include an exclusive left-turn lane and a channelized right-turn lane. The northbound left-turn lane begins 75 feet south of the Greenbrook Drive intersection. This intersection previously consisted of one approach lane in each direction. This project was recently completed in Spring, 2021.
• MD 355 at Brink Road – Developer-related intersection improvements are planned at this intersection and are dependent on the number of submitted building permits. These improvements are assumed to be completed ahead of the 2040 analysis year given this commitment and the current congestion at this location. The southbound MD 355 approach will include an exclusive left-turn lane and a through lane and the westbound Brink Road approach will consist of an exclusive left-turn lane and an exclusive right-turn lane. The northbound MD 355 approach will consist of two lanes that will merge into one lane approximately 250 feet north of the intersection. This intersection currently consists of one approach lane and one departure lane in each direction. This intersection will remain unsignalized.
Additionally, there is a planned truncation of Newcut Road to no longer connect with MD 355 as part of another developer funded improvement. This truncation is not assumed to occur prior to implementation of Alternatives 1 or 2 for purposes of the operational analyses in this study. The Newcut Road intersection does not contribute to congestion on MD 355 to the extent that the Brink Road intersection does today, implementation of the truncation has received some opposition from the community, and the alternate route for this traffic, Little Seneca Parkway, is now open for those wishing to avoid Newcut Road.
2.3. Description of Corridor The study corridor includes two signalized MD 355 intersections at Little Seneca Parkway and at West Old Baltimore Road, as well as five unsignalized intersections at Newcut Road, Rosecrest Drive/Canterfield Way, Greenbrook Drive, Brink Road, and Milestone Manor Lane (all side-street-only stop control). This section of MD 355, from MD 27 (Ridge Road) to MD 121 (Stringtown Road), is classified as an urban minor arterial. The posted speed limit is 45 mph from Milestone Manor Lane to Rosecrest Drive/Canterfield Way, and 40 mph from Rosecrest Drive/Canterfield Way to Little Seneca Parkway.
MD 355 Capacity Analysis – June 2021
4 | P a g e
Figure 1: Study Intersections and Existing Lane Configurations

MD 355 Capacity Analysis – June 2021
5 | P a g e
Figure 2: 2040 No Build without Observation Drive Extension/2040 Build 1 without Observation Drive Extension Lane Configurations

MD 355 Capacity Analysis – June 2021
6 | P a g e
Figure 3: 2040 Build 2 without Observation Drive Extension Lane Configurations

MD 355 Capacity Analysis – June 2021
7 | P a g e
Figure 4: 2040 No Build with Observation Drive Extension Lane Configurations

MD 355 Capacity Analysis – June 2021
8 | P a g e
Figure 5: 2040 Build 1 with Observation Drive Extension Lane Configurations
MD 355 Capacity Analysis – June 2021
9 | P a g e
Figure 6: 2040 Build 2 with Observation Drive Extension Lane Configurations
MD 355 Capacity Analysis – June 2021
10 | P a g e
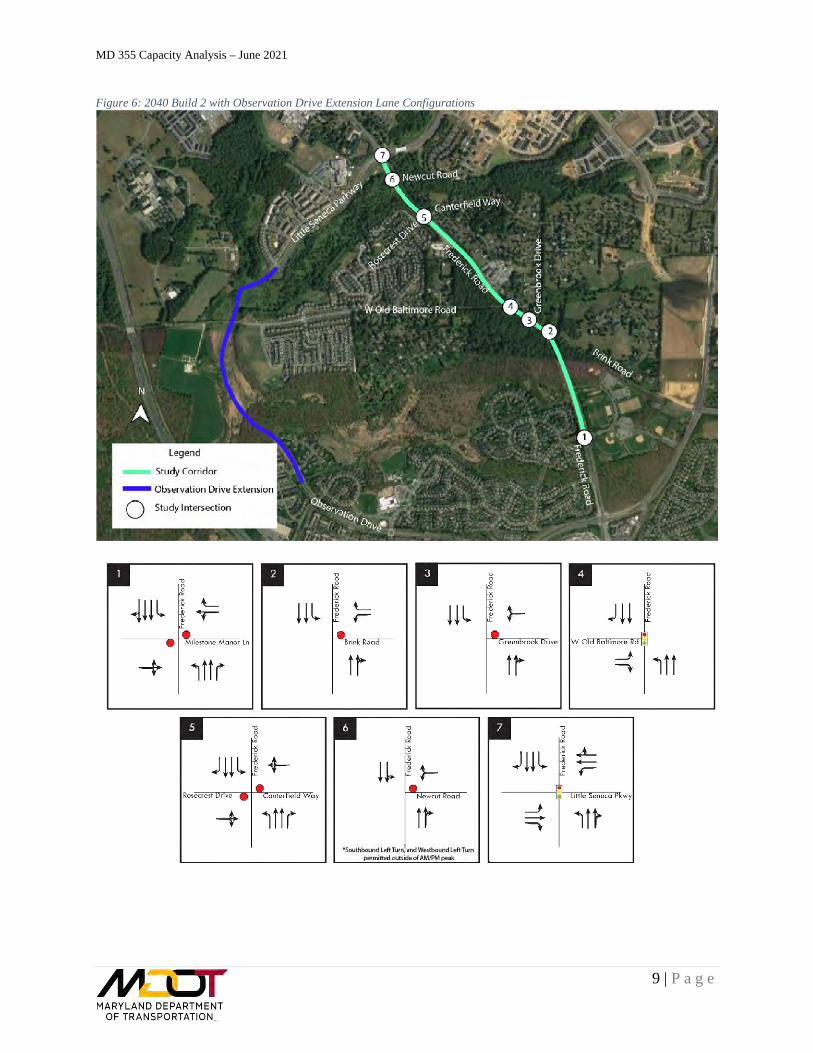
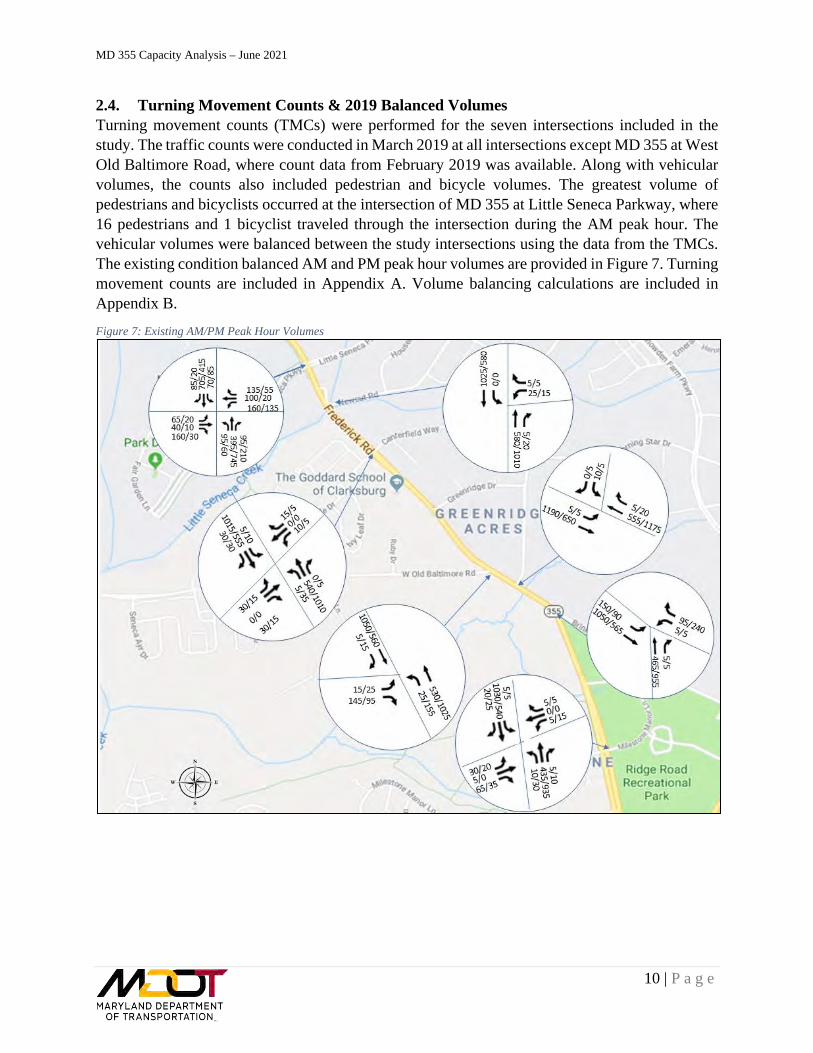
2.4. Turning Movement Counts & 2019 Balanced Volumes Turning movement counts (TMCs) were performed for the seven intersections included in the study. The traffic counts were conducted in March 2019 at all intersections except MD 355 at West Old Baltimore Road, where count data from February 2019 was available. Along with vehicular volumes, the counts also included pedestrian and bicycle volumes. The greatest volume of pedestrians and bicyclists occurred at the intersection of MD 355 at Little Seneca Parkway, where 16 pedestrians and 1 bicyclist traveled through the intersection during the AM peak hour. The vehicular volumes were balanced between the study intersections using the data from the TMCs. The existing condition balanced AM and PM peak hour volumes are provided in Figure 7. Turning movement counts are included in Appendix A. Volume balancing calculations are included in Appendix B.
Figure 7: Existing AM/PM Peak Hour Volumes

MD 355 Capacity Analysis – June 2021
11 | P a g e
2.5. Travel Times Travel time runs were conducted during the AM and PM peak periods (7:00 to 9:00 AM and 4:00 to 6:00 PM) along the entire network. As shown in Table 1, travel times through the 1.2-mile corridor range from slightly more than two minutes to slightly more than five minutes for an average speed of approximately 15 to 35 mph (including slowing down and stops at traffic signals).
The travel times for existing traffic recorded in SimTraffic (shown in Table 1) vary slightly from the field measured travel times but fall within ten percent (acceptable variance) of the field measured travel times. Synchro/SimTraffic reports are included in Appendix C.
Table 1: Field-Measured and Modeled MD 355 Travel Time
Time Period Field-
Recorded Travel Time (s)
SimTraffic Existing Model Arterial Travel Time (s)
% Difference
AM NB 135.6 136.0 <1%
SB 269.9 263.6 -2%
PM NB 303.1 325.4 7%
SB 165.5 166.6 <1%
2.6. Field Observations Field observations, including queuing and travel time runs, were conducted on Tuesday, April 16, 2019 under clear weather conditions. During the field visit, the following conditions were observed:
• Traffic congestion was observed in the southbound direction during the AM peak period and the northbound direction during the PM peak period.
• Most of the congestion, for northbound traffic, occurred between the northernmost Milestone Manor Lane intersection and the Rosecrest Drive/Canterfield Way intersection. The corridor reduces from two lanes to one lane in the northbound direction between these intersections. For southbound traffic, most of the congestion occurred north of the West Old Baltimore Road intersection.
• Substantial northbound traffic queues (approximately 1,000 feet) were observed at the West Old Baltimore Road intersection during the PM peak period. Queues were associated with left-turning vehicles blocking the shared thru-left lane.
• The northbound queues at the West Old Baltimore Road intersection extended beyond the Brink Road intersection. Vehicles turned to and from Brink Road by maneuvering between queued vehicles creating a potential safety hazard.
• When northbound left-turning vehicles block the northbound shared left-through travel lane at West Old Baltimore Road, some of the vehicles were observed bypassing the turning vehicles using the right shoulder.
• Southbound traffic also experienced delays and queues at Brink Road associated with left-turning vehicles blocking the shared thru-left lane.
• There was also a lot of construction work being done along this corridor, including work associated with the previously mentioned West Old Baltimore Road construction. However, this was mostly construction off the road and did not impact traffic conditions.
• Queuing along southbound MD 355 at the West Old Baltimore Road intersection, particularly during the AM peak period, extends from this intersection back to the Goddard

MD 355 Capacity Analysis – June 2021
12 | P a g e
School. Vehicles entered and exited the school driveway by maneuvering between queued vehicles creating a potential safety hazard.
2.7. Signal Timings The existing signal timings for the signalized intersections of MD 355 at Little Seneca Parkway and MD 355 at West Old Baltimore Road were provided by the Montgomery County Department of Transportation (MCDOT). Each of the signals has a total cycle length of 150 seconds. These signal timings (splits and cycle lengths) were then confirmed during field observations. The signal timings provided by MCDOT were used for the existing conditions analysis at both signals, including the temporary signal that was in place during the 2019 field data collection at MD 355 at West Old Baltimore Road.
Signal timings are optimized in future conditions analysis using Synchro. For each future alternative, splits at both signals were optimized while maintaining the cycle length and keeping the minimum split time along the mainline consistent with those at adjacent signals to ensure no adverse impacts to progression along the MD 355 corridor. The signal phasings at both intersections were maintained in the future. The planned signal improvements at MD 355 at West Old Baltimore Road have the same phasings as with existing conditions.
2.8. Pedestrian and Bicycle Network a) Existing Roadside Pedestrian Network
Intermittent pedestrian facilities exist along the corridor. As shown in Figure 8, sidewalk is present along the west side of MD 355 north of Little Seneca Parkway and along both sides of MD 355 for approximately 200 feet south of Little Seneca Parkway. Sidewalk is present along the west side of MD 355 from approximately 500 feet north to 750 feet south of Canterfield Way/Rosecrest Drive, and approximately 50 feet south of Canterfield Way/Rosecrest Drive on the east side. Approximately 50 feet of sidewalk is present along the east side of MD 355 north of Greenbrook Drive. A shared-use path is present along the west side of MD 355 for approximately 700 feet north of Milestone Manor Lane. However, the majority of the corridor currently lacks adequate pedestrian connections. The existing sidewalk and path network and planned segments associated with the current MDOT SHA improvements to the MD 355 at West Old Baltimore intersection are shown in Figure 8. These include sidewalk along the east side of MD 355 extending from the existing sidewalk near Greenbrook Drive to approximately 300 feet north of Old Baltimore Road, and a shared-use path along the west side of MD 355 from north of Brink Road to approximately 500 feet north of Old Baltimore Road.
b) Existing Crosswalks Marked pedestrian crosswalks are provided at three of the intersections along this section of MD 355, including the intersections with Little Seneca Parkway, which is signalized, and the intersections of Canterfield Way/Rosecrest Drive and the T-intersection at the driveway to the Goddard School of Clarksburg, both of which are unsignalized.
During the field visit, the crosswalk at the west leg of the T-intersection at the driveway to the Goddard School was very faded. The faded crosswalk was brought to the attention of MDOT SHA
MD 355 Capacity Analysis – June 2021
13 | P a g e
District 3. The District then refreshed the paint in early 2021. At Canterfield Way, an approximately 10-foot wide continental crosswalk is provided on the west leg of the intersection.
The intersection at MD 355 and Little Seneca Parkway provides crosswalks across the west, north, and east legs of the intersection. The west leg of Little Seneca Parkway is median-divided, where there is a pedestrian refuge for the 80-foot long crosswalk. The east leg crosswalk is about 83 feet long. The north leg crosswalk is 67 feet long. Each of the three crosswalks is approximately 11 feet wide. A pedestrian signal is installed at each corner of the intersection serving the three crosswalks, and each signal provides adequate crossing time. None of the pedestrian signals include a leading pedestrian interval (LPI).
c) Existing Bicycle Network The bicycle network along the MD 355 corridor is limited. The presence of an existing bicycle network is noted by a sign north of Milestone Manor Lane which reads “Bicycles May Use Full Lane” indicating that this northbound segment of MD 355 is shared between vehicles and bicycles (see Figure 9). There are no designated bicycle lanes in the study corridor, except for a northbound bicycle lane which begins 280 feet south of the intersection of Little Seneca Parkway where the northbound lanes widen to accommodate right-turn and left-turn only traffic lanes (see Figure 10). The bicycle lane continues after Little Seneca Parkway marked as the road shoulder, though the shoulder varies in width from less than 1 foot to 12 feet. There are no other indicators marking bicycle pathways in the corridor study area.
d) Proposed Pedestrian/Bicycle Facilities A shared use path along the west side of MD 355 (CIP# P501118), from north of the existing path near Milestone Manor Lane to Stringtown Road is currently under construction with an anticipated completion in Summer, 2021 (see Figure 11 – shown as “proposed”). A shared use path along the west side of MD 355 and a sidewalk along the east side of MD 355 near West Old Baltimore Road were recently completed as part of the MD 355 at West Old Baltimore Road improvements (MO5361) as noted in Section 2.8a. Finally, a separated bikeway is proposed but not funded for Brink Road in the 2018 M-NCPPC Bicycle Master Plan along the south side of the roadway near MD 355.

MD 355 Capacity Analysis – June 2021
14 | P a g e
Figure 8: Existing Roadside Pedestrian Network with W. Old Baltimore Road Intersection Project Improvements

MD 355 Capacity Analysis – June 2021
15 | P a g e
Figure 9: Existing Bicycle Signage on Northbound MD 355
Source: Google Streetview
Figure 10: Existing Bicycle Lane Begins at Northbound Approach to Little Seneca Parkway
Source: Google Streetview

MD 355 Capacity Analysis – June 2021
16 | P a g e
Figure 11: Map of M-NCPPC Bicycle Network (Source: https://mcatlas.org/bikeplan/)
Note: Independent of West Old Baltimore Road improvements shown in Figure 8
2.9. Bus Stop Inventory Nine bus stops are located along the study corridor. Bus stops along the study corridor, listed from north to south, are as follows: Northbound MD 355
• MD 355 at Little Seneca Parkway (SE corner) • MD 355 at Canterfield Way (SE corner) • MD 355 at Greenridge Road (south of the intersection) • MD 355 at Greenbrook Drive (NE corner) • MD 355 at Milestone Manor Lane (SE corner)
Southbound MD 355
• MD 355 at Little Seneca Parkway (SW corner) • MD 355 at Rosecrest Drive (SE corner) • MD 355 at West Old Baltimore Road (north of the intersection) • MD 355 at Milestone Manor Lane (SW corner)

MD 355 Capacity Analysis – June 2021
17 | P a g e
Figure 12: Existing Bus Stop Map
All of the bus stops along MD 355 within the study area serve Montgomery County Ride On Bus Routes 73 and 75. There was very little activity observed at these bus stops during AM and PM peak period field observations in April 2019 under clear and warm weather conditions. This is consistent with the ridership data for Route 75, provided by the MCDOT. According to the data, each of the bus stops average between 0 to 12 people boarding and 0 to 14 people alighting daily, except for the northbound Frederick Road and Little Seneca Parkway bus stop, which averages 30 alightings. Higher bus stop usage at this location may attributable to the Rocky Hill Middle School, which is located approximately 0.3 miles west of the intersection. Ridership data is available in Appendix D. Many of the bus stops do not have sidewalks or crosswalks that lead to them, rather they have a small portion of a sidewalk surrounding the bus stop sign. An example of this is shown in Figure 13.

MD 355 Capacity Analysis – June 2021
18 | P a g e
Figure 13: Existing Bus Stops on MD 355 at Greenridge Rd and at West Old Baltimore Rd
Source: Google Streetview
2.10. Future Year 2040 Volumes To develop 2040 volumes, growth rates sourced from the MWCOG regional travel demand model (version 2.3.70) were utilized. The model used is the regionally calibrated base version of the model from MWCOG and was not refined or calibrated further for this project. The region of the model that includes this section of MD 355 is shown in Appendix B.
The 2016 base network and the 2040 future network from MWCOG both include the existing two-lane geometry along MD 355 and the proposed ultimate planned Observation Drive Extension connecting from Ridge Road up to Stringtown Road. For this study, the section of the Observation Drive Extension from Ridge Road to Little Seneca Parkway was removed from the 2016 network before running the model to represent existing conditions and the 2040 No Build and Build without Observation Drive Extension conditions. The section between Little Seneca Parkway and Stringtown Road was left in the existing and No Build network as portions of this section and the adjacent Gateway Center Drive exist and connect to some land uses in this area. The 2040 model includes the ultimate complete Observation Drive alignment between Ridge Road and Stringtown Road for the 2040 No Build and Build with Observation Drive Extension conditions. Additionally, the growth along model segment 22496-452 (zone centroid connector shown in Appendix B) was used to develop the growth along the east leg of the MD 355/Little Seneca Parkway intersection.
The 2040 forecast model network with the current two-lane section along MD 355 was run with and without Observation Drive Extension from Ridge Road to Little Seneca Parkway to develop the 2040 No Build and 2040 Build 1 volume sets. The 2016 without Observation Drive Extension model output volumes were compared to both the 2040 without Observation Drive Extension and 2040 with Observation Drive Extension volume sets to develop growth rates for the MD 355 corridor and most of the side streets included in the study for the 2040 No Build and 2040 Build 1

MD 355 Capacity Analysis – June 2021
19 | P a g e
scenarios. For the side streets that are not included in the MWCOG model; Newcut Road and Milestone Manor Lane; the growth rates identified for the segments of MD 355 adjacent to these roads were used.
For the 2040 Build 2 alternatives, which include a four-lane section along MD 355, the 2040 networks with and without Observation Drive Extension were modified to include four lanes along MD 355 from their current terminus at Milestone Manor Lane to Little Seneca Parkway. The growth rates were derived using the same methodology as the two-lane scenarios (2040 No Build and 2040 Build 1).
NCHRP 255 methodologies were used to develop turning movement volumes for each alternative.
The MWCOG model outputs for the two-lane roadway alternatives showed negative or very small growth rates for the study area roadways between 2016 and 2040: annual growth rates for the two-lane scenarios without Observation Drive Extension ranged from 0.1% to 0.5%, and annual growth rates for the two-lane scenarios with Observation Drive Extension ranged from -0.1% to 0.5%. Therefore, minimum growth rates were established. Based on knowledge of the area and experience with similar projects, a conservative minimum annual growth rate of 0.5% was assumed for the 2040 two-lane roadway volumes without Observation Drive Extension. A minimum annual growth rate of 0.25% was assumed for the 2040 two-lane roadway volumes with Observation Drive Extension, as some vehicles along MD 355 may reroute to Observation Drive, but some growth along MD 355 is still possible. The volumes were then balanced between intersections.
Annual growth rates for the four-lane scenario without Observation Drive Extension ranged from 1.2% to 4.1%. Annual growth rates for the four-lane scenario with Observation Drive Extension ranged from 1.2% to 1.9%, with the exception of the links near Milestone Manor Lane, which had annual growth rates of 0.5% to 0.9%. The added capacity of the four-lane scenarios will likely attract drivers currently using parallel roadways. As all modeled growth rates for the four-lane scenarios were positive, no minimum growth rate was necessary.
The balanced AM and PM peak hour volumes for the 2040 Build 2 without Observation Drive Extension, 2040 No Build/2040 Build 1 with and without Observation Drive Extension and the 2040 Build 2 with Observation Drive Extension alternatives are provided in Figures 14 to 17.
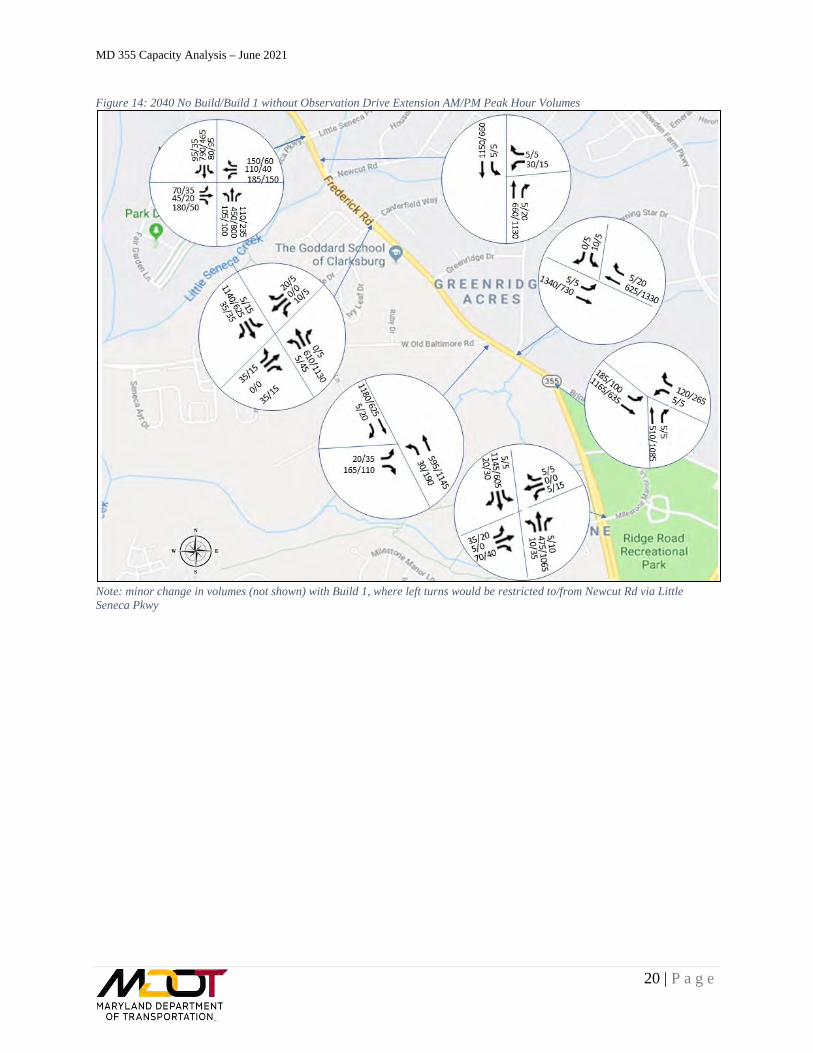
MD 355 Capacity Analysis – June 2021
20 | P a g e
Figure 14: 2040 No Build/Build 1 without Observation Drive Extension AM/PM Peak Hour Volumes
Note: minor change in volumes (not shown) with Build 1, where left turns would be restricted to/from Newcut Rd via Little Seneca Pkwy

MD 355 Capacity Analysis – June 2021
21 | P a g e
Figure 15: 2040 Build 2 without Observation Drive Extension AM/PM Peak Hour Volumes

MD 355 Capacity Analysis – June 2021
22 | P a g e
Figure 16: 2040 No Build/Build 1 with Observation Drive Extension AM/PM Peak Hour Volumes
Note: minor change in volumes (not shown) with Build 1, where left turns would be restricted to/from Newcut Rd via Little Seneca Pkwy

MD 355 Capacity Analysis – June 2021
23 | P a g e
Figure 17: 2040 Build 2 with Observation Drive Extension AM/PM Peak Hour Volumes
3. OPERATIONAL ANALYSIS 3.1. Model Selection Intersection level of service (LOS) and delay were developed using Synchro/Simtraffic 10. Synchro is a traffic modeling software based on Highway Capacity Manual (HCM) methodology. SimTraffic is microsimulation software that models individual vehicles traveling through the network and considers the impacts from one intersection to the next. Synchro/SimTraffic models were calibrated based on travel time runs, field observations, and verification of lane geometry and signal timings. Delays, travel times, and intersection queues along the corridor were reported in SimTraffic 10. Existing queues were verified in the field. Existing and forecasted travel times are shown in Table 2. LOS outputs are shown in Tables 3 and 4 and queues are shown in Tables 5 and 6. Some future year outputs are improved over existing model outputs due to the completion of planned improvements described earlier in this report. The SimTraffic outputs are included in Appendix D.

MD 355 Capacity Analysis – June 2021
24 | P a g e
Table 2: SimTraffic MD 355 Travel Time and Delay
Time Period
SimTraffic Arterial Travel Time (s)
Existing Model
No Build w/o Observation Dr Extension
Build 1 w/o Observation Dr Extension
Build 2 w/o Observation Dr Extension
No Build With Observation Dr
Extension
Build 1 With Observation Dr Extension
Build 2 With Observation Dr Extension
AM NB 136.0 127.2 129.7 137.6 137.2 138.0 130.4
SB 263.6 241.6 260.3 135.1 141.2 159.5 155.1
PM NB 325.4 144.6 144.7 137.8 170.8 166.2 132.2
SB 166.6 121.1 122.1 119.9 120.6 115.6 115.5 *Note: Improvements in travel times between Year 2019 and Year 2040 No Build Observation Drive Extension can be attributed to planned intersection improvements at Brink Road and West Old Baltimore Road Table 3: SimTraffic Intersection Peak Hour Level of Service (LOS) and Delay (in seconds) – AM
*Stop-controlled intersection; delay and LOS for stop-controlled approach are shown
Yellow LOS D Orange LOS E Red LOS F
Intersection
2019 AM 2040 AM
Existing Model
No Build w/o
Obs. Dr. Extension
Build 1 w/o Obs.
Dr. Extension
Build 2 w/o Obs.
Dr. Extension
No Build With
Obs. Dr. Extension
Build 1 With
Obs. Dr. Extension
Build 2 With
Obs. Dr. Extension
MD 355 at Little Seneca Pkwy
E 59.4
E 65.1
E 64.2
E 60.8
F 99.2
F 83.4
D 35.5
MD 355 at Newcut Rd*
F 169.8
F >500
D 30.7
D 31.0
F 247.0
C 15.4
A 9.3
MD 355 at Rosecrest Dr/Canterfield Way*
F >500
F >500
F >500
F >500
F 150.8
F >500
F >500
MD 355 at West Old Baltimore Rd
E 56.2
C 33.8
D 36.7
B 11.9
A 8.4
B 12.4
C 21.4
MD 355 at Greenbrook Dr*
F 62.9
F 96.4
F 172.2
F 62.2
F 56.4
F 82.2
F 148.7
MD 355 at Brink Rd*
C 20.2
A 7.7
A 8.6
A 9.9
A 5.5
A 6.6
A 8.4
MD 355 at Milestone Manor La*
C 16.6
E 46.6
D 28.7
F >500
C 15.2
D 30.0
F 189.2

MD 355 Capacity Analysis – June 2021
25 | P a g e
Table 4: SimTraffic Intersection Peak Hour LOS and Delay (in seconds) – PM
*Stop-controlled intersection; delay and LOS for stop-controlled approach are shown
Yellow LOS D Orange LOS E Red LOS F
Intersection
2019 PM 2040 PM
Existing Model
No Build w/o
Obs. Dr. Extension
Build 1 w/o
Obs. Dr. Extension
Build 2 w/o
Obs. Dr. Extension
No Build With
Obs. Dr. Extension
Build 1 With
Obs. Dr. Extension
Build 2 With
Obs. Dr. Extension
MD 355 at Little Seneca Pkwy
B 15.8
B 16.1
B 16.9
C 30.0
D 51.6
D 41.4
C 24.6
MD 355 at Newcut Rd*
F 100.7
F >500
F 190.6
E 47.5
F >500
F 333.1
E 44.7
MD 355 at Rosecrest Dr/Canterfield Way*
C 20.6
D 32.1
F 53.2
F 59.9
E 36.6
D 34.1
C 23.8
MD 355 at West Old Baltimore
Rd
C 32.5
A 6.7
A 6.6
A 6.1
A 5.7
A 4.4
A 4.6
MD 355 at Greenbrook Dr*
F 110.9
F 89.6
F 202.5
F >500
F 69.5
E 36.0
F 279.9
MD 355 at Brink Rd*
F >500
D 32.2
C 23.7
F 226.0
B 13.2
B 12.2
E 48.7
MD 355 at Milestone Manor La*
F 343.8
D 34.3
C 24.6
F >500
C 19.6
D 25.6
F 125.3

MD 355 Capacity Analysis – June 2021
26 | P a g e
Table 5: Summary of 95th Percentile Queue Length (ft) along MD 355 (SimTraffic) AM Peak Hour
*Stop-controlled intersection ** The distance to the major adjacent intersection is approximately 700 feet ^Longer queues are due to increased volumes along this approach ^^Queues caused by lefts and lane reduction ^^^Shorter queues in this scenario due to lower through volume along MD 355
Orange Queue length exceeds storage
2 Storage lengths were measured back to the adjacent intersection
Intersection Approach
2019 AM 2040 AM
Storage Length2 Existing
Model
No Build w/o
Obs. Dr. Extension
Build 1 w/o
Obs. Dr. Extension
Build 2 w/o
Obs. Dr. Extension
No Build With
Obs. Dr. Extension
Build 1 With
Obs. Dr. Extension
Build 2 With
Obs. Dr. Extension
MD 355 at Little Seneca
Pkwy
NB 286 247 256 348 315 318 247 270 SB 790 878 774 787 759 764 800 865 EB 125 165 203 904^ 752^ 941^ 350 1,040 WB 378 790 794 602^ 646^ 666^ 314 1,410
MD 355 at Newcut Rd*
NB 25 0 <25 296 <25 <25 <25 1,075 SB 352 495^^ 487^^ 31 179 399^^ <25 270 WB 129 629 <25 <25 216 <25 <25 1,040
MD 355 at Rosecrest Dr/ Canterfield
Way*
NB <25 28 28 <25 27 30 <25 1,060 SB <25 <25 <25 <25 <25 <25 <25 1,075 EB 542 724 688 763 298^^^ 761 644 120** WB 177 713 737 225 67 414 95 260
MD 355 at West Old
Baltimore Rd
NB 270 154 205 128 163 169 88 330 SB 1,449 955 741 287 187 299 374 1,010 EB 193 67 56 150 50 65 182 1,190
MD 355 at Greenbrook
Dr*
NB <25 0 0 0 0 0 0 630 SB 34 <25 <25 <25 <25 <25 45 330 WB 44 64 76 46 52 50 69 1,330
MD 355 at Brink Rd*
NB 0 <25 0 <25 <25 <25 <25 935 SB 128 76 63 81 57 62 64 630 WB 111 73 76 86 64 71 72 1,430
MD 355 at Milestone Manor La*
NB <25 <25 <25 30 25 <25 28 720 SB <25 <25 <25 <25 <25 <25 <25 880 EB 95 198 132 799^ 106 169 510^ 320 WB <25 <25 <25 25 <25 <25 26 505

MD 355 Capacity Analysis – June 2021
27 | P a g e
Table 6: Summary of 95th Percentile Queue Length (ft) along MD 355 (SimTraffic) PM Peak Hour
*Stop-controlled intersection ^Long left-turn queues due to lack of gaps; movement is restricted in Build scenarios ^^Increase in queue due to increase in forecast volume in this scenario ^^^Longer queues are due to increased volumes along MD 355
Orange Queue length exceeds storage
3 Storage lengths were measured back to the adjacent intersection
Intersection Approach
2019 PM 2040 PM
Storage Length3 Existing
Model
No Build w/o
Obs. Dr. Extension
Build 1 w/o
Obs. Dr. Extension
Build 2 w/o
Obs. Dr. Extension
No Build With
Obs. Dr. Extension
Build 1 With
Obs. Dr. Extension
Build 2 With
Obs. Dr. Extension
MD 355 at Little Seneca
Pkwy
NB 423 484 482 324 519 498 314 270 SB 196 238 236 331 316 378 223 865 EB 59 88 82 234 951 722 195 1,040 WB 238 206 230 299 284 405 216 1,410
MD 355 at Newcut Rd*
NB 62 173 231 209 711 553 132 1,075 SB <25 <25 <25 0 <25 <25 0 270 WB 72 301 42 35 447^ 47 39 1,040
MD 355 at Rosecrest Dr/ Canterfield
Way*
NB 33 39 43 42 42 47 33 1,060 SB <25 28 29 30 <25 <25 <25 1,075 EB 56 66 74 87 64 66 59 120 WB <25 <25 29 <25 40 31 <25 260
MD 355 at West Old
Baltimore Rd
NB 513 168 172 119 152 159 112 330 SB 608 217 244 199 185 80 142 1,010 EB 144 82 82 65 69 72 73 1,190
MD 355 at Greenbrook
Dr*
NB 756 0 <25 0 0 0 0 630 SB 273 <25 85 <25 69 <25 <25 330 WB 50 55 88 160 59 36 90 1,330
MD 355 at Brink Rd*
NB 2,224 94 53 <25 <25 <25 <25 935 SB 485 306 154 92 129 114 74 630 WB 1,661 317 198 1,218^^ 141 147 325 1,430
MD 355 at Milestone Manor La*
NB 436 36 34 61 31 34 47 720 SB 42 <25 <25 <25 <25 <25 <25 880 EB 438 120 91 734 83 74 308 320 WB 245 47 43 173 44 49 129 505
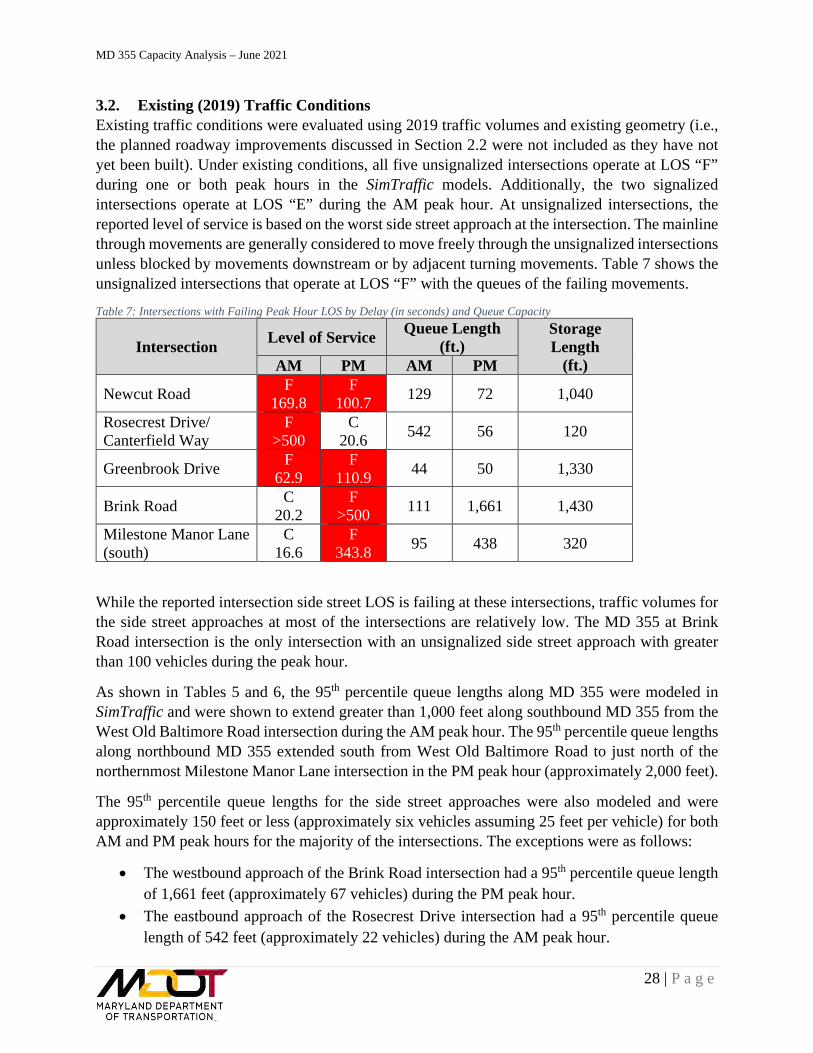
MD 355 Capacity Analysis – June 2021
28 | P a g e
3.2. Existing (2019) Traffic Conditions Existing traffic conditions were evaluated using 2019 traffic volumes and existing geometry (i.e., the planned roadway improvements discussed in Section 2.2 were not included as they have not yet been built). Under existing conditions, all five unsignalized intersections operate at LOS “F” during one or both peak hours in the SimTraffic models. Additionally, the two signalized intersections operate at LOS “E” during the AM peak hour. At unsignalized intersections, the reported level of service is based on the worst side street approach at the intersection. The mainline through movements are generally considered to move freely through the unsignalized intersections unless blocked by movements downstream or by adjacent turning movements. Table 7 shows the unsignalized intersections that operate at LOS “F” with the queues of the failing movements.
Table 7: Intersections with Failing Peak Hour LOS by Delay (in seconds) and Queue Capacity
Intersection Level of Service Queue Length (ft.)
Storage Length
(ft.) AM PM AM PM
Newcut Road F 169.8
F 100.7 129 72 1,040
Rosecrest Drive/ Canterfield Way
F >500
C 20.6 542 56 120
Greenbrook Drive F 62.9
F 110.9 44 50 1,330
Brink Road C 20.2
F >500 111 1,661 1,430
Milestone Manor Lane (south)
C 16.6
F 343.8 95 438 320
While the reported intersection side street LOS is failing at these intersections, traffic volumes for the side street approaches at most of the intersections are relatively low. The MD 355 at Brink Road intersection is the only intersection with an unsignalized side street approach with greater than 100 vehicles during the peak hour.
As shown in Tables 5 and 6, the 95th percentile queue lengths along MD 355 were modeled in SimTraffic and were shown to extend greater than 1,000 feet along southbound MD 355 from the West Old Baltimore Road intersection during the AM peak hour. The 95th percentile queue lengths along northbound MD 355 extended south from West Old Baltimore Road to just north of the northernmost Milestone Manor Lane intersection in the PM peak hour (approximately 2,000 feet).
The 95th percentile queue lengths for the side street approaches were also modeled and were approximately 150 feet or less (approximately six vehicles assuming 25 feet per vehicle) for both AM and PM peak hours for the majority of the intersections. The exceptions were as follows:
• The westbound approach of the Brink Road intersection had a 95th percentile queue length of 1,661 feet (approximately 67 vehicles) during the PM peak hour.
• The eastbound approach of the Rosecrest Drive intersection had a 95th percentile queue length of 542 feet (approximately 22 vehicles) during the AM peak hour.
MD 355 Capacity Analysis – June 2021
29 | P a g e
• The eastbound approach of the Milestone Manor Lane intersection (south) had a 95th percentile queue length of 438 feet (approximately 18 vehicles) during the PM peak hour.
For the Brink Road and Rosecrest Drive approaches to MD 355, the observed queue lengths corresponded with the average queue as shown in SimTraffic. However, the 95th percentile queue could not be replicated in SimTraffic due to software and field review limitations4.
3.3. 2040 No Build without Observation Drive Extension Traffic Conditions With 2040 volumes added to the Existing condition Synchro network, the stop-controlled approaches at the unsignalized intersections are forecasted to continue to operate at LOS “E” or “F” except for the MD 355 at Brink Road intersection which is expected to improve to LOS “A” during the AM peak hour and LOS “D” during the PM peak hour resulting from the planned improvements for MD 355 to be built in the vicinity of the intersection. The MD 355 at Milestone Manor Lane intersection also improves to LOS “D” in the PM peak hour due to the reduction in queues at the MD 355 at Brink Road intersection. However, the MD 355 at Milestone Manor Lane intersection is expected to degrade from LOS “C” in 2019 to LOS “E” in 2040 during the AM peak hour.
Queue lengths along the side street approaches are expected to increase in the 2040 No Build scenario without Observation Drive Extension, but those approaches are expected to continue to have relatively low turning movement volumes. Queue lengths along MD 355 at West Old Baltimore Road and at Brink Road are expected to decrease, again due to planned improvements. Travel times along the MD 355 corridor are expected to decrease under the 2040 No Build without Observation Drive Extension conditions when compared to the Existing conditions (particularly northbound in the PM peak) due to the planned improvements at the intersections of MD 355 at West Old Baltimore Road and MD 355 at Brink Road.
3.4. 2040 Build 1 without Observation Drive Extension Traffic Conditions This alternative includes smaller-scale/lower cost system improvements to MD 355, including restriping of a turn lane and restricting left turns at Newcut Road, without the Observation Drive Extension. Possible mitigation measures were explored in the attempt to improve the level of service, travel times and queues at the intersections along the MD 355 corridor in 2040, without the Observation Drive Extension. Because the unsignalized intersections along the study corridor have relatively low volumes on the side street approaches, no geometric improvements to these intersections were considered in the development of mitigation strategies. The following possible mitigation measures were incorporated:
• Convert the westbound Little Seneca Parkway exclusive right-turn lane to a shared through/right-turn lane to improve throughput along the westbound approach, allowing for more green time along the MD 355 approaches.
• Prohibit left turns to and from Newcut Road during the AM and PM peak periods to improve traffic flow along southbound MD 355 and improve traffic operations along the Newcut Road approach. Vehicles would use Little Seneca Parkway and Winding Woods
4 The PM 95th percentile queue at Brink Road is 1,661 feet versus 900 feet observed in the field. The AM 95th percentile queue at Rosecrest Drive is 542 feet versus 250 feet observed in the field. Note that observations are based upon a single day.
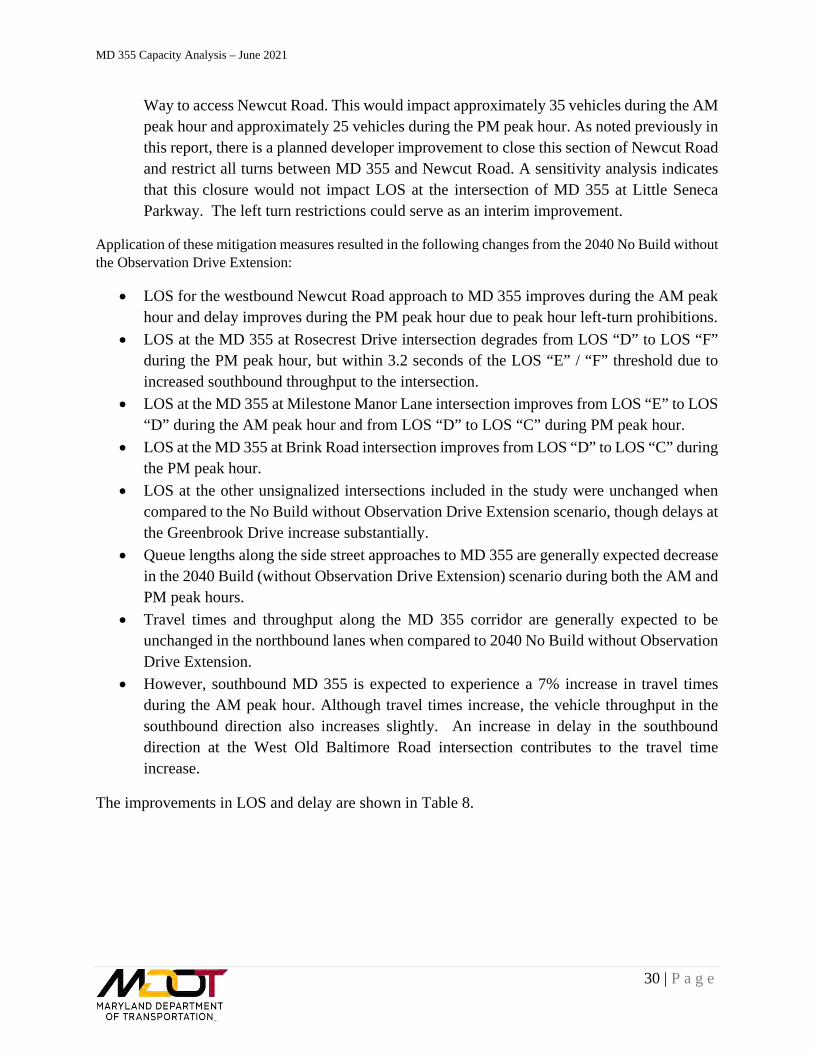
MD 355 Capacity Analysis – June 2021
30 | P a g e
Way to access Newcut Road. This would impact approximately 35 vehicles during the AM peak hour and approximately 25 vehicles during the PM peak hour. As noted previously in this report, there is a planned developer improvement to close this section of Newcut Road and restrict all turns between MD 355 and Newcut Road. A sensitivity analysis indicates that this closure would not impact LOS at the intersection of MD 355 at Little Seneca Parkway. The left turn restrictions could serve as an interim improvement.
Application of these mitigation measures resulted in the following changes from the 2040 No Build without the Observation Drive Extension:
• LOS for the westbound Newcut Road approach to MD 355 improves during the AM peak hour and delay improves during the PM peak hour due to peak hour left-turn prohibitions.
• LOS at the MD 355 at Rosecrest Drive intersection degrades from LOS “D” to LOS “F” during the PM peak hour, but within 3.2 seconds of the LOS “E” / “F” threshold due to increased southbound throughput to the intersection.
• LOS at the MD 355 at Milestone Manor Lane intersection improves from LOS “E” to LOS “D” during the AM peak hour and from LOS “D” to LOS “C” during PM peak hour.
• LOS at the MD 355 at Brink Road intersection improves from LOS “D” to LOS “C” during the PM peak hour.
• LOS at the other unsignalized intersections included in the study were unchanged when compared to the No Build without Observation Drive Extension scenario, though delays at the Greenbrook Drive increase substantially.
• Queue lengths along the side street approaches to MD 355 are generally expected decrease in the 2040 Build (without Observation Drive Extension) scenario during both the AM and PM peak hours.
• Travel times and throughput along the MD 355 corridor are generally expected to be unchanged in the northbound lanes when compared to 2040 No Build without Observation Drive Extension.
• However, southbound MD 355 is expected to experience a 7% increase in travel times during the AM peak hour. Although travel times increase, the vehicle throughput in the southbound direction also increases slightly. An increase in delay in the southbound direction at the West Old Baltimore Road intersection contributes to the travel time increase.
The improvements in LOS and delay are shown in Table 8.

MD 355 Capacity Analysis – June 2021
31 | P a g e
Table 8: Intersections with Improved Peak Hour LOS by Delay (2040 Build 1 w/o Observation Drive Extension vs 2040 No Build w/o Observation Drive Extension)
Intersection
Level of Service and Delay (s/veh)
No Build w/o Observation Dr
Extension
Build 1 w/o Observation Dr
Extension AM PM AM PM
Newcut Road F >500
F >500
D 30.7
F 190.6
Brink Road A 7.7
D 32.2
A 8.6
C 23.7
Milestone Manor Lane E 46.6
D 34.3
D 28.7
C 24.6
3.5. 2040 Build 2 without Observation Drive Extension Traffic Conditions This alternative includes larger-scale/higher cost system improvements for MD 355, including widening MD 355 to two lanes per direction, adding exclusive turn lanes at the MD 355 at Little Seneca Parkway intersection, and restricting left turns at Newcut Road without the Observation Drive Extension. Widening of MD 355 to double the number of through lanes to four was considered to improve the throughput, level of service, travel times, and queues at the intersections along the MD 355 corridor. Because the side street approaches to MD 355 at the unsignalized intersections have relatively low volumes, no additional geometric improvements were made to those intersections. The following potential mitigation measures were incorporated in the 2040 Build 2 without Observation Drive Extension scenario:
• Widen MD 355 to four lanes throughout the corridor from north of Milestone Manor Lane to Little Seneca Parkway to improve the overall capacity and throughput of the corridor.
• Change the lane configuration of southbound MD 355 at Little Seneca Parkway to provide one exclusive left-turn lane, two through lanes, and one exclusive right-turn lane to improve capacity and reduce delay in the southbound direction.
• Convert the westbound Little Seneca Parkway right-turn lane from an exclusive right-turn lane to a shared through/right-turn lane to improve traffic operation on the westbound approach and allow more green signal time for the MD 355 approaches.
• Provide a second exclusive right-turn lane along the eastbound Little Seneca Parkway approach to MD 355 to improve traffic operations on Little Seneca Parkway and allow more green signal time for the MD 355 approaches. The installation of a second right-turn lane would require prohibiting right turns on red from this approach.
• Prohibit left turns to and from Newcut Road during the AM and PM peak periods to improve traffic flow along southbound MD 355 and reduce delay and queues along the Newcut Road approach. Vehicles would use Little Seneca Parkway and Winding Woods Way to access Newcut Road. As noted previously, there is a planned developer improvement to close this section of Newcut Road and restrict all turns between MD 355 and Newcut Road. A sensitivity analysis indicates that this closure would not impact LOS

MD 355 Capacity Analysis – June 2021
32 | P a g e
at the intersection of MD 355 at Little Seneca Parkway. The left turn restrictions could serve as an interim improvement.
These mitigation measures when compared to No Build without Observation Drive Extension and Build 1 without Observation Drive Extension resulted in the following:
• LOS at the MD 355 at Little Seneca Parkway intersection is forecasted to continue to operate at LOS “E” in the AM peak hour though the delay per vehicle is slightly improved. This intersection is expected to operate at LOS “C” during the PM peak hour.
• Delay at the MD 355 at West Old Baltimore Road intersection improves in the AM and PM peak hours compared to No Build without Observation Drive Extension and Build 1 without Observation Drive Extension.
• Delay along the westbound Newcut Road approach to MD 355 improves in the PM peak hour compared to No Build without Observation Drive Extension and Build 1 without Observation Drive Extension.
• The delays along the side street approaches are expected to increase during both peak hours at the Brink Road, Milestone Manor Lane, Rosecrest Drive/Canterfield Way, and Greenbrook Drive (in the PM only) intersections when compared to 2040 No Build without Observation Drive Extension and Build 1 without Observation Drive Extension due to increased throughput along MD 355, resulting in fewer gaps for side street traffic.
• Queue lengths along southbound MD 355 at Newcut Road and West Old Baltimore Road are expected to decrease during the AM and PM peak hours compared to 2040 No Build without Observation Drive Extension and Build 1 without Observation Drive Extension.
• Queue lengths along most side street approaches and along MD 355 decrease or change little during the AM and PM peak hours when compared to 2040 No Build without Observation Drive Extension and Build 1 without Observation Drive Extension. The exceptions are along the side street approaches at the Milestone Manor Lane and Brink Road intersections which are longer.
• Travel times along the MD 355 corridor are generally expected to be unchanged when compared to 2040 No Build without Observation Drive Extension and Build 1 without Observation Drive Extension, with the exception of southbound MD 355 during the AM peak hour which is expected to experience a 44% decrease compared to 2040 No Build without Observation Drive Extension and a 48% decrease compared to Build 1 without Observation Drive Extension.
The improvements in LOS and/or delay are shown in Table 9.
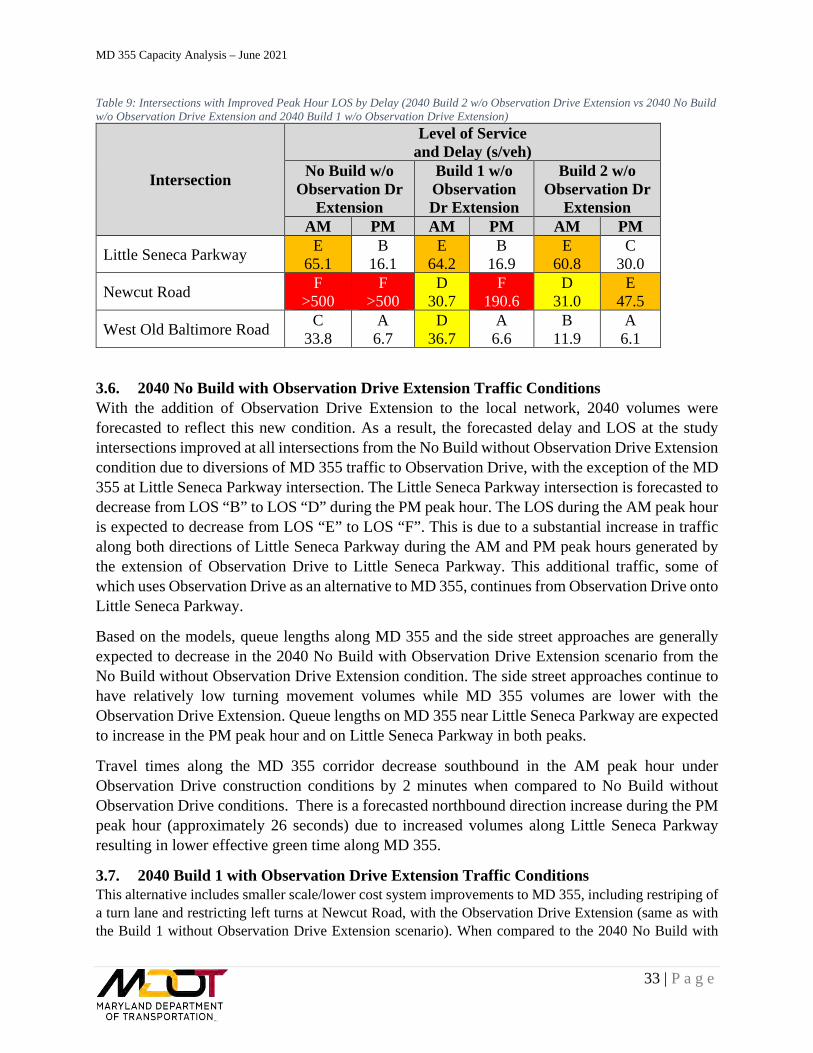
MD 355 Capacity Analysis – June 2021
33 | P a g e
Table 9: Intersections with Improved Peak Hour LOS by Delay (2040 Build 2 w/o Observation Drive Extension vs 2040 No Build w/o Observation Drive Extension and 2040 Build 1 w/o Observation Drive Extension)
Intersection
Level of Service and Delay (s/veh)
No Build w/o Observation Dr
Extension
Build 1 w/o Observation Dr Extension
Build 2 w/o Observation Dr
Extension AM PM AM PM AM PM
Little Seneca Parkway E 65.1
B 16.1
E 64.2
B 16.9
E 60.8
C 30.0
Newcut Road F >500
F >500
D 30.7
F 190.6
D 31.0
E 47.5
West Old Baltimore Road C 33.8
A 6.7
D 36.7
A 6.6
B 11.9
A 6.1
3.6. 2040 No Build with Observation Drive Extension Traffic Conditions With the addition of Observation Drive Extension to the local network, 2040 volumes were forecasted to reflect this new condition. As a result, the forecasted delay and LOS at the study intersections improved at all intersections from the No Build without Observation Drive Extension condition due to diversions of MD 355 traffic to Observation Drive, with the exception of the MD 355 at Little Seneca Parkway intersection. The Little Seneca Parkway intersection is forecasted to decrease from LOS “B” to LOS “D” during the PM peak hour. The LOS during the AM peak hour is expected to decrease from LOS “E” to LOS “F”. This is due to a substantial increase in traffic along both directions of Little Seneca Parkway during the AM and PM peak hours generated by the extension of Observation Drive to Little Seneca Parkway. This additional traffic, some of which uses Observation Drive as an alternative to MD 355, continues from Observation Drive onto Little Seneca Parkway.
Based on the models, queue lengths along MD 355 and the side street approaches are generally expected to decrease in the 2040 No Build with Observation Drive Extension scenario from the No Build without Observation Drive Extension condition. The side street approaches continue to have relatively low turning movement volumes while MD 355 volumes are lower with the Observation Drive Extension. Queue lengths on MD 355 near Little Seneca Parkway are expected to increase in the PM peak hour and on Little Seneca Parkway in both peaks.
Travel times along the MD 355 corridor decrease southbound in the AM peak hour under Observation Drive construction conditions by 2 minutes when compared to No Build without Observation Drive conditions. There is a forecasted northbound direction increase during the PM peak hour (approximately 26 seconds) due to increased volumes along Little Seneca Parkway resulting in lower effective green time along MD 355.
3.7. 2040 Build 1 with Observation Drive Extension Traffic Conditions This alternative includes smaller scale/lower cost system improvements to MD 355, including restriping of a turn lane and restricting left turns at Newcut Road, with the Observation Drive Extension (same as with the Build 1 without Observation Drive Extension scenario). When compared to the 2040 No Build with

MD 355 Capacity Analysis – June 2021
34 | P a g e
Observation Drive Extension outputs, application of the Build 1 strategies is forecasted to result in the following:
• Average delay at the MD 355 at Little Seneca Parkway intersection is expected to decrease by approximately 16 seconds during the AM peak hour and 10 seconds during the PM peak hour.
• LOS and queues along the westbound Newcut Road approach to MD 355 are expected to improve during the AM peak hour due to the proposed peak hour left-turn lanes restrictions.
• Queue lengths for many movements are consistent with the 2040 No Build. However, side street queues at the Rosecrest Drive/Canterfield Way intersection increase in the AM peak period due to the lack of gaps resulting from the increased through volume along MD 355.
• Travel times along the MD 355 corridor are expected to change little, as shown in Table 2.
The improvements in LOS and delay are shown in Table 10.
Table 10: Intersections with Improved Peak Hour LOS by Delay (2040 Build 1 w/ Observation Drive Extension vs 2040 No Build w/ Observation Drive Extension)
Intersection
Level of Service and Delay (s/veh)
No Build w/ Observation Dr
Extension
Build 1 w/ Observation
Dr Extension
AM PM AM PM
Little Seneca Parkway F 99.2
D 51.6
F 83.4
D 41.4
Newcut Road F 247.0
F >500
C 15.4
F 333.1
3.8. 2040 Build 2 with Observation Drive Extension Traffic Conditions This alternative includes larger scale/higher cost system improvements to MD 355, including widening MD 355 to two lanes per direction, adding exclusive turn lanes at the MD 355 at Little Seneca Parkway intersection, and restricting left turns at Newcut Road with the Observation Drive Extension (same as with the 2040 Build 2 without Observation Drive Extension scenario). Under the 2040 Build 2 with Observation Drive Extension scenario the following results are forecasted when compared to No Build with Observation Drive Extension and Build 1 with Observation Drive Extension:
• LOS at the MD 355 at Little Seneca Parkway intersection is expected to improve from LOS “F” during the AM peak hour and LOS “D” during the PM peak hour with No Build with Observation Drive Extension and Build 1 with Observation Drive Extension to LOS “D” during the AM peak hour and LOS “C” during the PM peak hour with Build 2 with Observation Drive Extension.

MD 355 Capacity Analysis – June 2021
35 | P a g e
• LOS at the MD 355 at Newcut Road intersection is expected to improve during the AM peak hour from LOS “F” with No Build with Observation Drive Extension and LOS ‘C” with Build 1 with Observation Drive Extension to LOS “A” with Build 2 with Observation Drive Extension. During the PM peak hour, the LOS is expected to improve from LOS “F” with No Build with Observation Drive Extension and Build 1 with Observation Drive Extension to LOS ‘E” with Observation Drive Extension. As noted elsewhere in this report, there is a planned developer improvement to close this section of Newcut Road and restrict all turns between MD 355 and Newcut Road. A sensitivity analysis indicates that this closure would not impact LOS at the intersection of MD 355 at Little Seneca Parkway.
• LOS for the side street approaches at the Rosecrest Drive/Canterfield Way intersection are expected to improve during the PM peak hour from LOS “F” with No Build with Observation Drive Extension and LOS “D” with Build 1 with Observation Drive Extension to LOS “C” with Build 2 with Observation Drive Extension.
• LOS along the Greenbrook Drive approach is expected to remain at a LOS F during the AM peak hour and drop from “E” to “F” during the PM peak hour due to increased volume along MD 355 creating fewer gaps for turning traffic.
• LOS along the Brink Road approach is expected to be unchanged in the AM peak hour when compared to 2040 No Build with Observation Drive Extension and Build 1 with Observation Drive Extension, but is expected to degrade from LOS “B” to “E” during the PM peak hour due to increased volume along MD 355 creating fewer gaps for turning traffic.
• The delay on the side street approaches is expected to significantly increase at the Milestone Manor Lane intersection compared to 2040 No Build with Observation Drive Extension and Build 1 with Observation Drive Extension.
• Queue lengths along MD 355 and the side street approaches to MD 355 are generally expected to decrease in the northern section of the corridor (at Little Seneca Parkway and Newcut Road) compared to 2040 No Build with Observation Drive Extension and Build 1 with Observation Drive Extension. Some side street queues increase at other unsignalized intersections due to increased volume creating fewer gaps.
• Travel times along the MD 355 corridor are generally expected to decrease by approximately five percent to 23 percent compared to 2040 No Build with Observation Drive Extension and by less than one percent to 20 percent compared to 2040 Build 1 with Observation Drive Extension.
The improvements in LOS and delay are shown in Table 11.

MD 355 Capacity Analysis – June 2021
36 | P a g e
Table 11: Intersections with Improved Peak Hour LOS by Delay (2040 Build 2 w/ Observation Drive Extension vs 2040 No Build w/ Observation Drive Extension and 2040 Build 1 w/ Observation Drive Extension)
Intersection
Level of Service and Delay (s/veh)
No Build w/ Observation Dr
Extension
Build 1 w/ Observation Dr
Extension
Build 2 w/ Observation Dr
Extension AM PM AM PM AM PM
Little Seneca Parkway F 99.2
D 51.6
F 83.4
D 41.4
D 35.5
C 24.6
Newcut Road F 247.0
F >500
C 15.4
F 333.1
A 9.3
E 44.7
Rosecrest Drive/ Canterfield Way
F 150.8
E 36.6
F >500
D 34.1
F >500
C 23.8
4. COSTS/CONCEPTS A concept plan and costs were developed for the Build 2 alternatives. The concept plan is shown in Figure 18 and the costs are shown in Table 12. The costs and concepts are included in Appendix E. The Build 1 alternatives include lane designation changes and turning restrictions, which have costs likely to be under $500,000. Therefore, costs and concepts were not developed for the Build 1 alternatives. The Build 2 alternatives have the same improvements both with and without the Observation Drive Extension, so the costs and concepts are the same for both Build 2 alternatives. It is estimated that the improvements associated with the Build 2 alternatives will have a total construction cost of approximately $18 million (not including right of way or utilities).
The following assumptions were made in developing the costs and concepts for the Build 2 scenarios:
• With widening, Newcut Road will no longer connect to MD 355 due to the prohibitive cost of realigning Newcut Road and a previous commitment by area developers to construct the truncation. As discussed previously, vehicles now have numerous options to access Newcut Road due to the new connections to the east including using Little Seneca Parkway and Winding Woods Way, Grey Squirrel Street, or Snowden Farm Parkway to access Newcut Road due to the new connections to the east. As the operational analysis in this report assumed a restriction to allow right turns only at Newcut Road, supplemental sensitivity analysis was performed with the Newcut Road right turns removed and rerouted consistent with the cost estimate assumption. As this volume is low, the impact on operations of closing the Newcut Road access to MD 355 is negligible and is not reflected in earlier sections and figures.
• The prohibitive cost for realigning Newcut Road is related to: o The need for another significant new bridge on Newcut Road over Little Seneca
Creek.

MD 355 Capacity Analysis – June 2021
37 | P a g e
A conservative estimate of the cost of this bridge is approximately $5 million.
o Potentially significant environmental impacts including to floodplain, forest, and waters of the US.
o Significant earthwork to provide clearance for the new bridge over Little Seneca Creek and to tie to MD 355.
• The widening of MD 355 over Little Seneca Creek will require either widening the existing bridge or full replacement of the bridge. The cost estimate conservatively assumes that the bridge will be fully replaced as this would cost more than widening.
• Drainage items will include extension of the box culverts near Greenbrook Drive and Milestone Manor Lane.
• Utility costs are not included in the estimate. However, there are existing overhead and underground utilities that will be impacted including utility pole impacts at the north end of the corridor that are confirmed.
• Right of way costs are not included in the estimate. Along this corridor of MD 355 there is a wide existing right of way available for the roadway widening. However, there will still be impacts to properties and the need for some right of way and temporary construction easement purchases.
Table 12: Conceptual Cost Estimate – Build 2 Alternatives
Description Total Cost Notes
Category 1: Preliminary $1,710,000 35% of Categories 2,5,6
Category 1: Maintenance of Traffic $490,000 10% of Categories
2,5,6 Category 2: Grading $1,850,000 Based on quantities
Category 3: Drainage $1,470,000 30% of Categories 2,5,6
Category 4: Structures $3,700,000 Based on quantities Category 5: Paving $2,550,000 Based on quantities
Category 6: Shoulders $490,000 Based on quantities
Category 7: Landscape $490,000 10% of Categories 2,5,6
Category 8: Traffic $450,000 Based on quantities Subtotal 1 $13,200,000
Contingency $4,620,000 35% of Subtotal 1 Total $17,820,000
Note: does not include right of way or utility costs

MD 355 Capacity Analysis – June 2021
38 | P a g e
Figure 18: Build 2 Concept Plan
MD 355 Capacity Analysis – June 2021
39 | P a g e
5. CONCLUSIONS/RECOMMENDATIONS The study results suggest the following:
• With Build 1, the construction cost will likely be under $500,000 as the improvements include signal timing improvements, lane designation changes, and turning restrictions only.
• With Build 2, the estimated construction cost will be approximately $18 million, not including right of way and utilities.
• The alternative with the best overall operational results is Build 2 with Observation Drive Extension, which includes widening MD 355 to four lanes between the Little Seneca Parkway and Milestone Manor Lane intersections along with the addition of the Observation Drive Extension (to be built by others) between Ridge Road and Little Seneca Parkway. This alternative is projected to provide the best intersection levels of service, shortest overall MD 355 corridor travel times, and lowest queue lengths along the study corridor.
• It is also recommended that the signal timing optimization be implemented at the MD 355 at Little Seneca Parkway and West Old Baltimore Road intersections in future years as traffic changes, with any of the future geometric conditions. These improvements will allow the increased east/west traffic volume along Little Seneca Parkway to travel more efficiently and is expected to improve the level of service at the intersections along the MD 355 corridor compared to without optimization. It should be noted that any changes to signal timings will need to be coordinated with upstream and downstream intersections, such as MD 355 at MD 27/Ridge Road.
• It is also recommended at the intersection of MD 355 at Newcut Road to restrict the southbound MD 355 and westbound Newcut Road left-turn movements to improve operations along southbound MD 355 and alleviate queuing along Newcut Road with the Build 1 and Build 2 conditions. Due to constructability issues, this intersection will need to be removed with Build 2 conditions with all turning movements restricted. There is a planned developer improvement that includes removing this intersection. Vehicles currently performing these movements would have the option to use Little Seneca Parkway and Winding Woods Way to access Newcut Road. Removal of this intersection and the redistribution of turning movements to the intersection of MD 355 at Little Seneca Parkway will not impact LOS at the Little Seneca Parkway intersection as the impacted volume is low.
• Increasing throughput by accommodating higher volumes or improving efficiency on MD 355 may result in longer delays and queues on some unsignalized side streets when gaps in MD 355 traffic are reduced.
• Construction of the Observation Drive Extension between Ridge Road and Little Seneca Parkway results in overall lower through volumes along MD 355 south of Little Seneca Parkway. However, there is an increase in through movements and some turning

MD 355 Capacity Analysis – June 2021
40 | P a g e
movements along Little Seneca Parkway at its intersection with MD 355. Turning volumes to/from other side streets are generally similar to or slightly lower with the Observation Drive Extension. Widening MD 355 results in higher volumes due to the increased capacity of the roadway.

Appendix A
Traffic Count Data

Maryland Department of Transportation
State Highway Administration Data Services Engineering Division
Turning Movement Count Study - Field Sheet
1596
Station ID:
Location:
Interval
(dd): PEAK
HOURS
AM PERIOD
6:00AM-12:00PM
Start End VolumePM PERIOD
12:00PM-19:00P
Start End Volume
MD 355 at Milestone Manor La
County:
Town:
Weather:
Montgomery
none
Cloudy/Cold
1620
Comments:
Date: Tuesday 03/05/2019
S2000150214
15 min
07:00 08:00 15:45 16:45A
LOS LOS V/CV/C
0.34 A 0.36
From SouthHour
EndingFrom North
TOTAL TOTAL TOTAL TOTAL
From East From WestLeft Through RightLeft Throug
h
RIGHTLeft Throug
h
RightLeft RightThrough
MD 355 MD 355 Milestone Manor La Milestone Manor La
Grand
TotalU.Tur
n
U.Turn U.Turn U.Turn
0 9 0 0:15 9 11 0 1 10 0 0 0 0 0 0 0 20 0 0 0 0 0
0 11 0 0:30 11 15 1 2 13 0 1 0 0 0 0 1 28 0 0 0 0 1
0 2 0 0:45 2 7 1 1 6 0 0 0 0 0 0 1 10 0 0 0 0 0
0 4 0 1:00 4 14 0 1 13 0 0 0 0 0 0 0 18 0 0 0 0 0
0 3 0 1:15 3 12 0 0 12 0 0 0 0 0 0 0 15 0 0 0 0 0
0 1 0 1:30 1 12 0 1 10 1 0 0 0 0 0 0 13 0 0 0 0 0
0 3 0 1:45 3 9 0 0 9 0 1 0 0 0 0 0 13 0 0 0 0 1
0 4 0 2:00 4 3 0 0 3 0 0 0 0 0 0 0 7 0 0 0 0 0
0 1 0 2:15 1 3 0 0 3 0 0 0 0 0 0 0 4 0 0 0 0 0
0 3 0 2:30 3 3 0 0 2 1 1 0 0 0 0 0 7 0 0 0 0 1
0 4 0 2:45 4 7 0 1 6 0 0 0 0 0 0 0 11 0 0 0 0 0
0 7 0 3:00 7 4 0 0 4 0 0 0 0 0 0 0 11 0 0 0 0 0
0 3 0 3:15 3 1 0 0 1 0 0 0 0 0 0 0 4 0 0 0 0 0
0 2 0 3:30 2 3 2 0 3 0 0 0 0 0 0 2 7 0 0 0 0 0
0 2 0 3:45 2 3 1 0 3 0 0 0 0 1 0 0 6 0 0 0 0 0
0 11 0 4:00 11 4 0 0 4 0 0 0 0 0 0 0 15 0 0 0 0 0
0 9 0 4:15 9 4 0 0 4 0 0 0 0 0 0 0 13 0 0 0 0 0
0 5 0 4:30 5 4 1 0 4 0 0 0 0 0 0 1 10 0 0 0 0 0
0 26 0 4:45 26 8 1 0 8 0 0 0 0 0 0 1 35 0 0 0 0 0
0 34 0 5:00 34 9 2 0 9 0 0 0 0 0 0 2 45 0 0 0 0 0
Page 1 of 11

1596
Station ID:
Location:
Interval
(dd): PEAK
HOURS
AM PERIOD
6:00AM-12:00PM
Start End VolumePM PERIOD
12:00PM-19:00P
Start End Volume
MD 355 at Milestone Manor La
County:
Town:
Weather:
Montgomery
none
Cloudy/Cold
1620
Comments:
Date: Tuesday 03/05/2019
S2000150214
15 min
07:00 08:00 15:45 16:45A
LOS LOS V/CV/C
0.34 A 0.36
0 41 0 5:15 41 7 1 0 7 0 0 0 0 0 0 1 49 0 0 0 0 0
0 61 1 5:30 62 13 5 0 13 0 0 0 0 0 0 5 80 0 0 0 0 0
0 88 0 5:45 88 20 7 0 20 0 0 0 0 0 0 7 115 0 0 0 0 0
0 114 0 6:00 114 20 7 0 20 0 0 0 0 0 0 7 141 0 0 0 0 0
0 179 1 6:15 181 33 10 2 31 0 0 0 0 1 0 9 224 1 0 0 0 0
0 236 0 6:30 236 43 13 1 42 0 0 0 0 1 0 12 292 0 0 0 0 0
0 274 3 6:45 277 52 17 2 50 0 0 0 0 2 0 15 346 0 0 0 0 0
0 281 1 7:00 282 63 8 1 62 0 0 0 0 3 0 5 353 0 0 0 0 0
1 263 0 7:15 264 103 25 4 97 2 1 1 0 10 0 15 394 0 0 0 0 2
0 239 6 7:30 245 126 30 1 125 0 0 0 0 14 0 16 401 0 0 0 0 0
1 241 9 7:45 251 104 31 2 101 1 0 0 1 9 0 22 387 0 0 0 0 1
0 283 4 8:00 287 104 22 4 100 0 1 0 0 4 1 17 414 0 0 0 0 1
0 270 3 8:15 275 92 18 2 88 2 0 0 0 5 0 12 385 2 0 0 1 0
0 255 2 8:30 257 79 14 2 77 0 0 0 0 4 0 10 350 0 0 0 0 0
0 283 3 8:45 286 73 13 3 69 1 1 0 0 2 0 11 373 0 0 0 0 1
0 275 1 9:00 276 87 16 5 82 0 0 0 0 5 0 11 379 0 0 0 0 0
0 266 7 9:15 273 77 18 2 73 2 1 0 0 2 0 16 369 0 0 0 0 1
0 223 1 9:30 224 98 11 3 95 0 0 0 0 6 0 5 333 0 0 0 0 0
0 188 1 9:45 189 65 13 3 62 0 0 1 0 0 0 13 268 0 0 0 0 1
0 166 1 10:00 167 77 10 3 71 3 0 0 0 0 0 10 254 0 0 0 0 0
0 119 1 10:15 120 76 6 4 71 1 1 0 1 0 0 6 204 0 0 0 0 2
0 111 0 10:30 111 72 6 6 63 3 0 0 0 2 0 4 189 0 0 0 0 0
1 114 3 10:45 118 84 5 3 78 3 1 0 0 1 0 4 208 0 0 0 0 1
0 112 1 11:00 113 102 7 2 99 1 2 0 1 2 0 5 225 0 0 0 0 3
0 113 1 11:15 114 91 8 3 82 5 2 0 1 4 0 4 216 0 1 0 0 3
2 127 1 11:30 130 112 13 2 108 2 3 0 0 0 1 12 258 0 0 0 0 3
Page 2 of 11

1596
Station ID:
Location:
Interval
(dd): PEAK
HOURS
AM PERIOD
6:00AM-12:00PM
Start End VolumePM PERIOD
12:00PM-19:00P
Start End Volume
MD 355 at Milestone Manor La
County:
Town:
Weather:
Montgomery
none
Cloudy/Cold
1620
Comments:
Date: Tuesday 03/05/2019
S2000150214
15 min
07:00 08:00 15:45 16:45A
LOS LOS V/CV/C
0.34 A 0.36
0 151 3 11:45 154 120 7 5 114 1 0 0 1 1 0 6 282 0 0 0 0 1
0 122 3 12:00 125 120 8 4 115 0 1 0 0 1 0 7 254 0 1 0 0 1
2 133 3 12:15 138 116 8 7 103 4 2 0 0 2 0 6 264 0 2 0 0 2
0 126 0 12:30 127 140 5 3 135 2 1 0 0 1 0 4 273 1 0 0 0 1
1 122 1 12:45 124 123 2 2 119 1 3 0 1 0 0 2 253 0 1 0 0 4
0 112 3 13:00 116 140 4 5 133 2 0 1 0 1 0 3 261 1 0 0 0 1
0 111 1 13:15 112 121 7 6 113 2 1 0 1 2 0 5 242 0 0 0 0 2
0 94 4 13:30 98 118 5 3 112 3 0 0 1 1 0 4 222 0 0 0 0 1
0 113 0 13:45 113 154 4 7 145 2 3 0 2 1 0 3 277 0 0 1 0 6
0 87 2 14:00 89 153 5 7 145 1 0 0 1 2 0 3 248 0 0 0 0 1
0 86 4 14:15 90 137 6 3 131 2 2 0 0 2 0 4 235 0 1 0 0 2
2 76 1 14:30 79 139 5 8 128 3 0 0 1 1 0 4 224 0 0 0 0 1
0 141 7 14:45 148 151 5 10 140 1 1 0 0 3 0 2 305 0 0 0 0 1
0 155 8 15:00 165 185 8 9 173 3 1 0 2 3 0 5 361 2 0 0 0 3
0 110 1 15:15 111 186 11 7 176 2 1 0 0 5 0 6 309 0 1 0 0 1
1 119 2 15:30 122 224 5 6 217 1 0 0 0 2 0 3 351 0 0 0 0 0
0 112 5 15:45 117 225 4 8 212 4 4 0 1 0 0 4 351 0 1 0 0 5
1 122 5 16:00 128 257 5 9 247 1 2 0 2 3 0 2 394 0 0 0 0 4
1 138 2 16:15 141 277 18 14 258 5 0 0 0 9 0 9 436 0 0 0 0 0
1 138 4 16:30 143 241 9 9 230 2 2 0 0 7 0 2 395 0 0 0 0 2
0 152 4 16:45 156 226 13 9 213 4 0 0 0 4 0 9 395 0 0 0 0 0
1 117 6 17:00 124 251 6 10 239 1 2 0 0 3 0 3 383 0 1 0 0 2
0 139 7 17:15 146 249 9 8 239 1 1 0 1 4 0 5 406 0 1 0 0 2
2 134 7 17:30 143 239 16 7 227 4 2 0 0 7 0 9 400 0 1 0 0 2
0 118 4 17:45 122 236 14 6 224 4 2 0 0 3 0 11 374 0 2 0 0 2
0 119 7 18:00 126 254 12 9 243 1 9 0 1 4 0 8 402 0 1 0 0 10
Page 3 of 11

1596
Station ID:
Location:
Interval
(dd): PEAK
HOURS
AM PERIOD
6:00AM-12:00PM
Start End VolumePM PERIOD
12:00PM-19:00P
Start End Volume
MD 355 at Milestone Manor La
County:
Town:
Weather:
Montgomery
none
Cloudy/Cold
1620
Comments:
Date: Tuesday 03/05/2019
S2000150214
15 min
07:00 08:00 15:45 16:45A
LOS LOS V/CV/C
0.34 A 0.36
0 139 3 18:15 142 260 7 19 239 2 1 0 0 0 0 7 410 0 0 0 0 1
0 127 1 18:30 128 243 14 15 228 0 2 0 1 3 0 11 388 0 0 0 0 3
0 132 2 18:45 134 267 11 17 249 1 4 0 0 5 0 6 416 0 0 0 0 4
0 112 3 19:00 115 244 8 14 229 1 0 0 0 2 0 6 367 0 0 0 0 0
0 87 2 19:15 89 183 11 7 175 1 0 0 0 5 0 6 283 0 0 0 0 0
0 58 0 19:30 59 201 8 8 188 0 0 0 0 3 0 5 268 1 5 0 0 0
0 83 2 19:45 85 155 8 7 120 0 0 0 0 0 0 8 248 0 28 0 0 0
0 82 0 20:00 82 126 5 10 85 0 0 0 0 0 0 5 213 0 31 0 0 0
0 83 4 20:15 87 148 9 14 117 0 0 0 0 0 0 9 244 0 17 0 0 0
0 62 1 20:30 63 113 2 9 104 0 0 0 0 0 0 2 178 0 0 0 0 0
0 97 5 20:45 102 123 5 10 106 1 1 0 0 0 0 5 231 0 6 0 0 1
0 63 2 21:00 65 100 3 5 94 0 0 0 0 0 0 3 168 0 1 0 0 0
0 33 2 21:15 35 90 3 8 82 0 1 0 0 0 0 3 129 0 0 0 0 1
0 56 0 21:30 57 100 2 14 86 0 2 0 0 0 0 2 161 1 0 0 0 2
0 27 2 21:45 29 84 5 7 76 1 0 0 0 1 0 4 118 0 0 0 0 0
0 26 1 22:00 27 59 2 3 56 0 0 0 1 0 0 2 89 0 0 0 0 1
0 29 0 22:15 29 73 1 0 68 5 0 0 0 1 0 0 103 0 0 0 0 0
0 32 0 22:30 32 53 2 1 48 4 0 0 0 2 0 0 87 0 0 0 0 0
0 20 0 22:45 20 52 2 0 45 6 0 0 0 0 0 2 74 0 1 0 0 0
0 24 0 23:00 24 37 0 0 36 1 0 0 0 0 0 0 61 0 0 0 0 0
0 12 0 23:15 12 26 0 0 26 0 0 0 0 0 0 0 38 0 0 0 0 0
0 16 0 23:30 16 26 0 0 26 0 0 1 0 0 0 0 43 0 0 0 0 1
0 7 0 23:45 7 30 0 0 26 4 0 0 0 0 0 0 37 0 0 0 0 0
0 14 0 0:00 14 23 2 0 23 0 0 0 0 0 0 2 39 0 0 0 0 0
Page 4 of 11

1596
Station ID:
Location:
Interval
(dd): PEAK
HOURS
AM PERIOD
6:00AM-12:00PM
Start End VolumePM PERIOD
12:00PM-19:00P
Start End Volume
MD 355 at Milestone Manor La
County:
Town:
Weather:
Montgomery
none
Cloudy/Cold
1620
Comments:
Date: Wednesday 03/06/2019
S2000150214
15 min
07:00 08:00 15:45 16:45A
LOS LOS V/CV/C
0.34 A 0.36
2
3 550
1026 19
15
TOTAL:
1047
568
AM Peak:
PM Peak:
437
1001
11 3
41 948 12
2 1
4 0 2
37 1 70
23 0 22
4
6
108
45 1620
1596 1
17 9634 175 9835 416 8976 112 9607 67 4 21 93 172 2 479 654 20189 9
0
1
0
0
0
1
0
0
103
0
0
423
Page 5 of 11

1596
Station ID:
Location:
Interval
(dd): PEAK
HOURS
AM PERIOD
6:00AM-12:00PM
Start End VolumePM PERIOD
12:00PM-19:00P
Start End Volume
MD 355 at Milestone Manor La
County:
Town:
Weather:
Montgomery
none
Cloudy/Cold
1620
Comments:
Date: Wednesday 03/06/2019
S2000150214
15 min
07:00 08:00 15:45 16:45A
LOS LOS V/CV/C
0.34 A 0.36
PedestriansPedestrians BicyclesPedestrainsBicyclesPedestrians
Hour
Ending
North Leg South Leg East Leg West Leg
MD 355 MD 355 Milestone Manor La Milestone Manor La
School
Children
School
Children
School
ChildrenBicycles Bicycles
School
Children
0 0:15 0 0 0 0 0 0 0 0 0 0 0
0 0:30 0 0 0 0 0 0 0 0 0 0 0
0 0:45 0 0 0 0 0 0 0 0 0 0 0
0 1:00 0 0 0 0 0 0 0 0 0 0 0
0 1:15 0 0 0 0 0 0 0 0 0 0 0
0 1:30 0 0 0 0 0 0 0 0 0 0 0
0 1:45 0 0 0 0 0 0 0 0 0 0 0
0 2:00 0 0 0 0 0 0 0 0 0 0 0
0 2:15 0 0 0 0 0 0 0 0 0 0 0
0 2:30 0 0 0 0 0 0 0 0 0 0 0
0 2:45 0 0 0 0 0 0 0 0 0 0 0
0 3:00 0 0 0 0 0 0 0 0 0 0 0
0 3:15 0 0 0 0 0 0 0 0 0 0 0
0 3:30 0 0 0 0 0 0 0 0 0 0 0
0 3:45 0 0 0 0 0 0 0 0 0 0 0
0 4:00 0 0 0 0 0 0 0 0 0 0 0
0 4:15 0 0 0 0 0 0 0 0 0 0 0
0 4:30 0 0 0 0 0 0 0 0 0 0 0
0 4:45 0 0 0 0 0 0 0 0 0 0 0
0 5:00 0 0 0 0 0 0 0 0 0 0 0
0 5:15 0 0 0 0 0 0 0 0 0 0 0
0 5:30 0 0 0 0 0 0 0 0 0 0 0
0 5:45 0 0 0 0 0 0 0 0 0 0 0
0 6:00 0 0 0 0 0 0 0 0 0 0 0
0 6:15 0 0 0 0 0 0 0 0 0 1 0
0 6:30 0 0 0 0 0 0 0 0 0 0 0
0 6:45 0 0 0 0 0 0 0 0 0 0 0
0 7:00 0 0 0 0 0 0 0 0 0 0 0
Page 6 of 11

1596
Station ID:
Location:
Interval
(dd): PEAK
HOURS
AM PERIOD
6:00AM-12:00PM
Start End VolumePM PERIOD
12:00PM-19:00P
Start End Volume
MD 355 at Milestone Manor La
County:
Town:
Weather:
Montgomery
none
Cloudy/Cold
1620
Comments:
Date: Wednesday 03/06/2019
S2000150214
15 min
07:00 08:00 15:45 16:45A
LOS LOS V/CV/C
0.34 A 0.36
0 7:15 0 0 0 0 0 0 0 0 0 0 0
0 7:30 0 0 0 0 0 0 0 0 0 0 0
0 7:45 0 0 0 0 0 0 0 0 0 1 0
0 8:00 0 0 0 0 0 0 0 0 0 1 0
0 8:15 0 0 0 0 0 0 0 0 0 0 0
0 8:30 0 0 0 0 0 0 0 0 0 0 0
0 8:45 0 0 0 0 0 0 0 0 0 0 0
0 9:00 0 0 0 0 0 0 0 0 0 0 0
0 9:15 0 0 0 0 0 0 0 0 0 0 0
0 9:30 0 0 0 0 0 0 0 0 0 0 0
0 9:45 0 0 0 0 0 0 0 0 0 0 0
0 10:00 0 0 0 0 0 0 0 0 0 0 0
0 10:15 0 0 0 0 0 0 0 0 0 0 0
0 10:30 0 0 0 0 0 0 0 0 0 0 0
0 10:45 0 0 0 0 0 0 0 0 0 0 0
0 11:00 0 0 0 0 0 0 0 0 0 0 0
0 11:15 0 0 0 0 0 0 0 0 0 0 0
0 11:30 0 1 0 0 0 0 0 0 0 0 0
0 11:45 0 0 0 0 0 0 0 0 0 0 0
0 12:00 0 0 0 0 0 0 0 0 0 0 0
0 12:15 0 0 0 0 0 0 0 0 0 0 0
0 12:30 0 0 0 0 0 0 0 0 0 1 0
0 12:45 0 0 0 0 0 0 0 0 0 1 0
0 13:00 0 0 0 0 0 0 0 0 0 0 0
0 13:15 0 0 0 0 0 0 0 0 0 0 0
0 13:30 0 0 0 1 0 0 0 0 0 0 0
0 13:45 0 0 0 0 0 0 0 0 0 0 0
0 14:00 0 0 0 0 0 0 0 0 0 0 0
0 14:15 0 0 0 0 0 0 0 0 0 0 0
0 14:30 0 1 0 0 0 0 0 0 0 0 0
0 14:45 0 0 0 0 0 0 0 0 0 0 0
0 15:00 0 0 0 0 0 0 0 0 0 0 0
Page 7 of 11

1596
Station ID:
Location:
Interval
(dd): PEAK
HOURS
AM PERIOD
6:00AM-12:00PM
Start End VolumePM PERIOD
12:00PM-19:00P
Start End Volume
MD 355 at Milestone Manor La
County:
Town:
Weather:
Montgomery
none
Cloudy/Cold
1620
Comments:
Date: Wednesday 03/06/2019
S2000150214
15 min
07:00 08:00 15:45 16:45A
LOS LOS V/CV/C
0.34 A 0.36
0 15:15 0 0 0 0 0 0 0 0 0 1 0
0 15:30 0 0 0 0 0 0 0 0 0 0 0
0 15:45 0 0 0 0 0 0 0 0 0 1 0
0 16:00 0 0 0 1 0 0 0 0 0 0 0
0 16:15 0 0 0 0 0 0 0 0 0 0 0
0 16:30 0 0 0 0 0 0 0 0 0 2 0
0 16:45 0 0 0 0 0 0 0 0 0 0 0
0 17:00 0 0 0 0 0 0 0 0 0 1 0
0 17:15 0 0 0 0 0 0 0 0 0 0 0
0 17:30 0 0 0 0 0 0 0 0 0 0 0
0 17:45 0 0 0 0 0 0 0 0 0 0 0
0 18:00 0 0 0 0 0 0 0 0 0 0 0
0 18:15 0 1 0 0 0 0 0 1 0 1 0
0 18:30 0 0 0 0 0 0 0 0 0 1 0
0 18:45 0 0 0 0 0 0 0 0 0 1 0
0 19:00 0 0 0 0 0 0 0 0 0 0 0
0 19:15 0 0 0 0 0 0 0 0 0 0 0
0 19:30 0 0 0 0 0 0 0 0 0 0 0
0 19:45 0 0 0 0 0 0 0 0 0 0 0
0 20:00 0 0 0 0 0 0 0 0 0 0 0
0 20:15 0 0 0 0 0 0 0 0 0 0 0
0 20:30 0 0 0 0 0 0 0 0 0 0 0
0 20:45 0 0 0 0 0 0 0 0 0 0 0
0 21:00 0 0 0 0 0 0 0 0 0 0 0
0 21:15 0 0 0 0 0 0 0 0 0 0 0
0 21:30 0 0 0 0 0 0 0 0 0 0 0
0 21:45 0 0 0 0 0 0 0 0 0 0 0
0 22:00 0 0 0 0 0 0 0 0 0 0 0
0 22:15 0 0 0 0 0 0 0 0 0 2 0
0 22:30 0 0 0 0 0 0 0 0 0 0 0
0 22:45 0 0 0 0 0 0 0 0 0 0 0
0 23:00 0 0 0 0 0 0 0 0 0 0 0
Page 8 of 11

1596
Station ID:
Location:
Interval
(dd): PEAK
HOURS
AM PERIOD
6:00AM-12:00PM
Start End VolumePM PERIOD
12:00PM-19:00P
Start End Volume
MD 355 at Milestone Manor La
County:
Town:
Weather:
Montgomery
none
Cloudy/Cold
1620
Comments:
Date: Wednesday 03/06/2019
S2000150214
15 min
07:00 08:00 15:45 16:45A
LOS LOS V/CV/C
0.34 A 0.36
0 23:15 0 0 0 0 0 0 0 0 0 0 0
0 23:30 0 0 0 0 0 0 0 0 0 0 0
0 23:45 0 0 0 0 0 0 0 0 0 0 0
0 0:00 0 0 0 0 0 0 0 0 0 0 0
0
0
0
0
0
0
Total:
AM Pe 0 0 0
0 0 0
0
0
0
1
0
0
0
0
2
2
0
0
0 0 0 0 3 0 2 0 15 0 0 1
PM Pe
Page 9 of 11

1596
Station ID:
Location:
Interval
(dd): PEAK
HOURS
AM PERIOD
6:00AM-12:00PM
Start End VolumePM PERIOD
12:00PM-19:00P
Start End Volume
MD 355 at Milestone Manor La
County:
Town:
Weather:
Montgomery
none
Cloudy/Cold
1620
Comments:
Date: Wednesday 03/06/2019
S2000150214
15 min
07:00 08:00 15:45 16:45A
LOS LOS V/CV/C
0.34 A 0.36
R T L U
U
L
T
R
R
T
L
U
RTLU
2 1026 19
423 3 11
2
1 37
1
70
1047 461
1508
4
10
437 1098
1535
108
31
139
1
LEG 1
MD 355
LE
G 3
Mile
sto
ne
Ma
no
r
La
LEG 2
MD 355
LE
G 4
Mile
sto
ne
Ma
no
r
La
3 56
81 5
Quadrant Quadrant
QuadrantQuadrant
6
AM Peak Hour
19013
17 9634 175
R T L U
MD 355
LEG 1
9835 9178
416 8976 112
U L T R
MD 355
LEG 2
9607 10283
19890
93
67
4
21 R
T
L
U
Mile
sto
ne
Ma
no
r La
LE
G 3
132
225 172
2
479
U
L
T
R
Mile
sto
ne
Ma
no
r
La
LE
G 4
596
654
1250
47 348
180 998
Quadrant Quadrant
QuadrantQuadrant
Turning Movement Summary
9
103
1
1
0
0
0
0
Page 10 of 11

1596
Station ID:
Location:
Interval
(dd): PEAK
HOURS
AM PERIOD
6:00AM-12:00PM
Start End VolumePM PERIOD
12:00PM-19:00P
Start End Volume
MD 355 at Milestone Manor La
County:
Town:
Weather:
Montgomery
none
Cloudy/Cold
1620
Comments:
Date: Wednesday 03/06/2019
S2000150214
15 min
07:00 08:00 15:45 16:45A
LOS LOS V/CV/C
0.34 A 0.36
1541
3 15 550
41 12 948
4
0
2
23
0
22
R T L U
LEG 1
MD 355
U L T R
R
T
L
U
U
L
T
R
Mile
sto
ne
Ma
no
r
La
LE
G 4
568 973
6
15
21
56
45
101
576 1001
1577
LEG 2
MD 355
LE
G 3
Mile
sto
ne
Ma
no
r
La
Quadrant
QuadrantQuadrant
Quadrant 5
16
38
63
PM Peak Hour
0
0
0
0
Page 11 of 11

Maryland Department of Transportation
State Highway Administration Data Services Engineering Division
Turning Movement Count Study - Field Sheet
1756
Station ID:
Location:
Interval
(dd): PEAK
HOURS
AM PERIOD
6:00AM-12:00PM
Start End VolumePM PERIOD
12:00PM-19:00P
Start End Volume
MD 355 at BRINK RD
County:
Town:
Weather:
Montgomery
none
Cloudy/Cold
1822
Comments:
Date: Tuesday 03/05/2019
S2011150803
15 min
07:15 08:15 17:30 18:30D
LOS LOS V/CV/C
0.90 D 0.81
From SouthHour
EndingFrom North
TOTAL TOTAL TOTAL TOTAL
From East From WestLeft Through RightLeft Throug
h
RIGHTLeft Throug
h
RightLeft RightThrough
MD 355 MD 355 BRINK RD
Grand
TotalU.Tur
n
U.Turn U.Turn U.Turn
0 11 0 0:15 11 9 0 0 9 0 0 0 2 0 0 0 22 0 0 0 0 2
2 11 0 0:30 13 14 0 0 14 0 0 0 0 0 0 0 27 0 0 0 0 0
0 1 0 0:45 1 6 0 0 6 0 0 0 1 0 0 0 8 0 0 0 0 1
0 4 0 1:00 4 14 0 0 14 0 0 0 4 0 0 0 22 0 0 0 0 4
0 3 0 1:15 3 11 0 0 11 0 0 0 1 0 0 0 15 0 0 0 0 1
1 1 0 1:30 2 9 0 0 9 0 0 0 0 0 0 0 11 0 0 0 0 0
1 3 0 1:45 4 10 0 0 10 0 0 0 1 0 0 0 15 0 0 0 0 1
1 4 0 2:00 5 4 0 0 4 0 0 0 1 0 0 0 10 0 0 0 0 1
0 1 0 2:15 1 3 0 0 3 0 0 0 0 0 0 0 4 0 0 0 0 0
1 3 0 2:30 4 2 0 0 2 0 0 0 0 0 0 0 6 0 0 0 0 0
0 4 0 2:45 4 5 0 0 5 0 0 0 0 0 0 0 9 0 0 0 0 0
0 7 0 3:00 7 5 0 0 5 0 0 0 1 0 0 0 13 0 0 0 0 1
0 3 0 3:15 3 1 0 0 1 0 0 0 2 0 0 0 6 0 0 0 0 2
1 2 0 3:30 3 3 0 0 3 0 0 0 0 0 0 0 6 0 0 0 0 0
1 2 0 3:45 3 3 0 0 3 0 0 0 1 0 0 0 7 0 0 0 0 1
2 10 0 4:00 12 5 0 0 5 0 0 0 1 0 0 0 18 0 0 0 0 1
1 7 0 4:15 8 3 0 0 3 0 0 0 0 0 0 0 11 0 0 0 0 0
1 7 0 4:30 8 5 0 0 5 0 0 0 2 0 0 0 15 0 0 0 0 2
6 25 0 4:45 31 7 0 0 7 0 0 0 1 0 0 0 39 0 0 0 0 1
3 36 0 5:00 39 8 0 0 8 0 0 0 4 0 0 0 51 0 0 0 0 4
Page 1 of 11
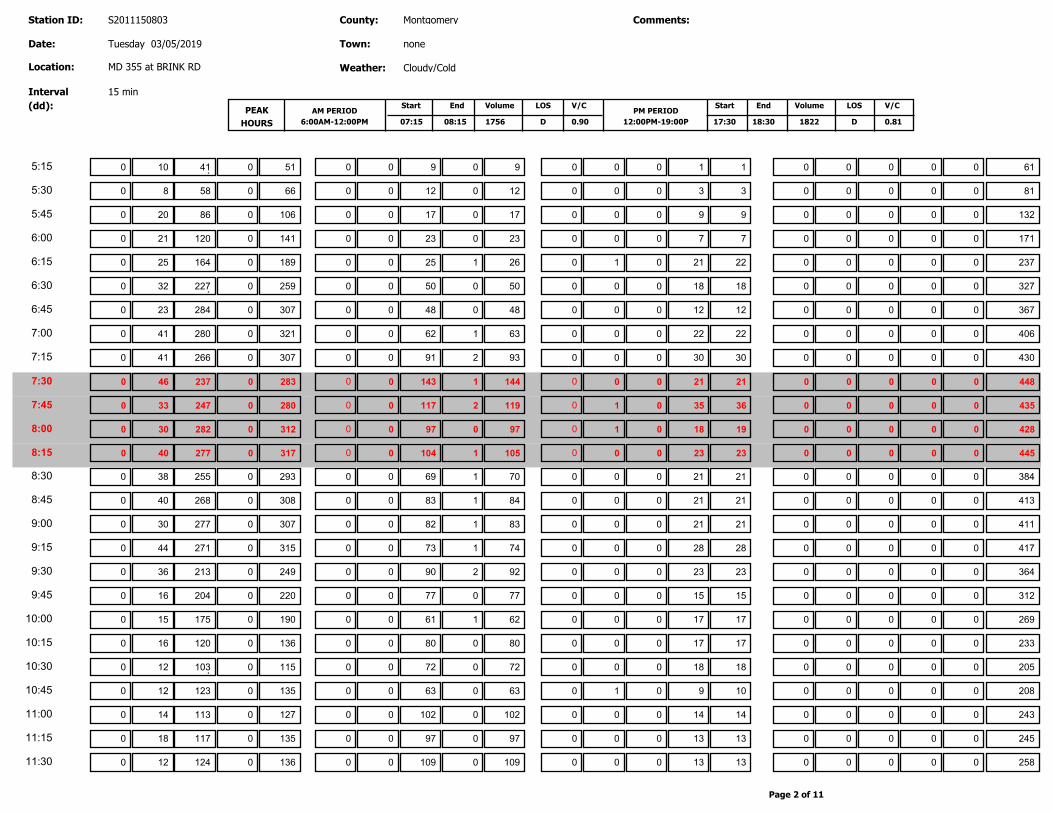
1756
Station ID:
Location:
Interval
(dd): PEAK
HOURS
AM PERIOD
6:00AM-12:00PM
Start End VolumePM PERIOD
12:00PM-19:00P
Start End Volume
MD 355 at BRINK RD
County:
Town:
Weather:
Montgomery
none
Cloudy/Cold
1822
Comments:
Date: Tuesday 03/05/2019
S2011150803
15 min
07:15 08:15 17:30 18:30D
LOS LOS V/CV/C
0.90 D 0.81
10 41 0 5:15 51 9 0 0 9 0 0 0 1 0 0 0 61 0 0 0 0 1
8 58 0 5:30 66 12 0 0 12 0 0 0 3 0 0 0 81 0 0 0 0 3
20 86 0 5:45 106 17 0 0 17 0 0 0 9 0 0 0 132 0 0 0 0 9
21 120 0 6:00 141 23 0 0 23 0 0 0 7 0 0 0 171 0 0 0 0 7
25 164 0 6:15 189 26 0 0 25 1 1 0 21 0 0 0 237 0 0 0 0 22
32 227 0 6:30 259 50 0 0 50 0 0 0 18 0 0 0 327 0 0 0 0 18
23 284 0 6:45 307 48 0 0 48 0 0 0 12 0 0 0 367 0 0 0 0 12
41 280 0 7:00 321 63 0 0 62 1 0 0 22 0 0 0 406 0 0 0 0 22
41 266 0 7:15 307 93 0 0 91 2 0 0 30 0 0 0 430 0 0 0 0 30
46 237 0 7:30 283 144 0 0 143 1 0 0 21 0 0 0 448 0 0 0 0 21
33 247 0 7:45 280 119 0 0 117 2 1 0 35 0 0 0 435 0 0 0 0 36
30 282 0 8:00 312 97 0 0 97 0 1 0 18 0 0 0 428 0 0 0 0 19
40 277 0 8:15 317 105 0 0 104 1 0 0 23 0 0 0 445 0 0 0 0 23
38 255 0 8:30 293 70 0 0 69 1 0 0 21 0 0 0 384 0 0 0 0 21
40 268 0 8:45 308 84 0 0 83 1 0 0 21 0 0 0 413 0 0 0 0 21
30 277 0 9:00 307 83 0 0 82 1 0 0 21 0 0 0 411 0 0 0 0 21
44 271 0 9:15 315 74 0 0 73 1 0 0 28 0 0 0 417 0 0 0 0 28
36 213 0 9:30 249 92 0 0 90 2 0 0 23 0 0 0 364 0 0 0 0 23
16 204 0 9:45 220 77 0 0 77 0 0 0 15 0 0 0 312 0 0 0 0 15
15 175 0 10:00 190 62 0 0 61 1 0 0 17 0 0 0 269 0 0 0 0 17
16 120 0 10:15 136 80 0 0 80 0 0 0 17 0 0 0 233 0 0 0 0 17
12 103 0 10:30 115 72 0 0 72 0 0 0 18 0 0 0 205 0 0 0 0 18
12 123 0 10:45 135 63 0 0 63 0 1 0 9 0 0 0 208 0 0 0 0 10
14 113 0 11:00 127 102 0 0 102 0 0 0 14 0 0 0 243 0 0 0 0 14
18 117 0 11:15 135 97 0 0 97 0 0 0 13 0 0 0 245 0 0 0 0 13
12 124 0 11:30 136 109 0 0 109 0 0 0 13 0 0 0 258 0 0 0 0 13
Page 2 of 11
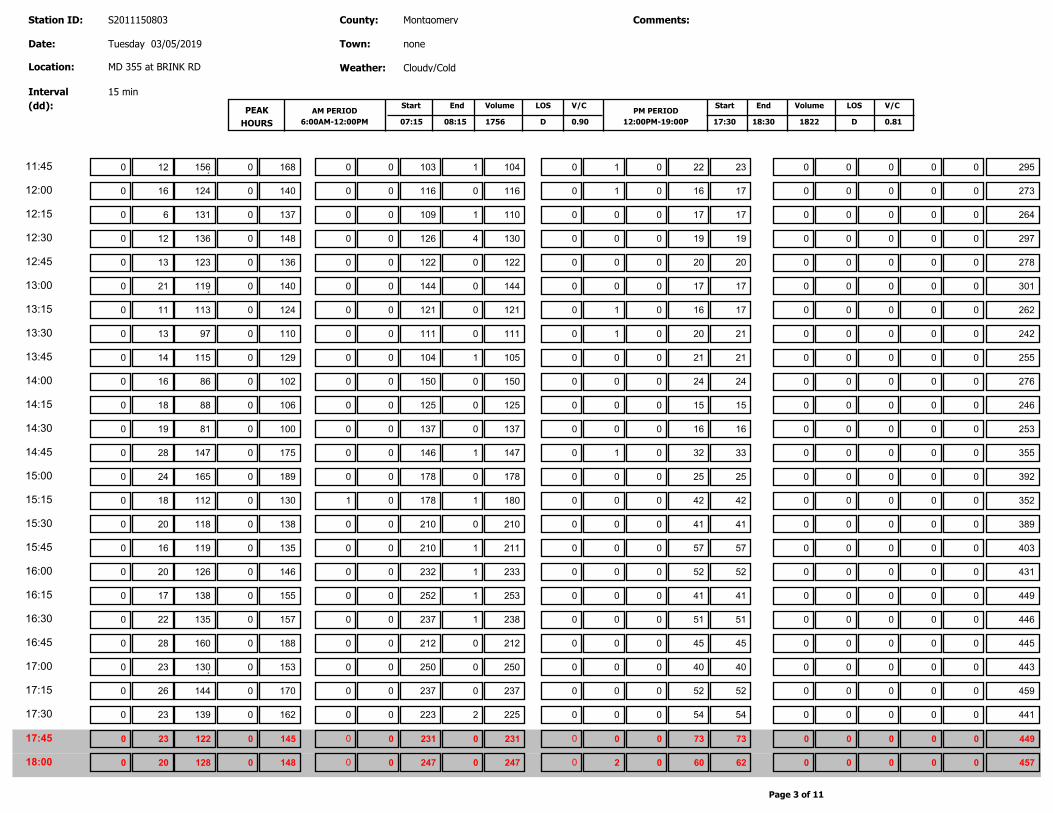
1756
Station ID:
Location:
Interval
(dd): PEAK
HOURS
AM PERIOD
6:00AM-12:00PM
Start End VolumePM PERIOD
12:00PM-19:00P
Start End Volume
MD 355 at BRINK RD
County:
Town:
Weather:
Montgomery
none
Cloudy/Cold
1822
Comments:
Date: Tuesday 03/05/2019
S2011150803
15 min
07:15 08:15 17:30 18:30D
LOS LOS V/CV/C
0.90 D 0.81
12 156 0 11:45 168 104 0 0 103 1 1 0 22 0 0 0 295 0 0 0 0 23
16 124 0 12:00 140 116 0 0 116 0 1 0 16 0 0 0 273 0 0 0 0 17
6 131 0 12:15 137 110 0 0 109 1 0 0 17 0 0 0 264 0 0 0 0 17
12 136 0 12:30 148 130 0 0 126 4 0 0 19 0 0 0 297 0 0 0 0 19
13 123 0 12:45 136 122 0 0 122 0 0 0 20 0 0 0 278 0 0 0 0 20
21 119 0 13:00 140 144 0 0 144 0 0 0 17 0 0 0 301 0 0 0 0 17
11 113 0 13:15 124 121 0 0 121 0 1 0 16 0 0 0 262 0 0 0 0 17
13 97 0 13:30 110 111 0 0 111 0 1 0 20 0 0 0 242 0 0 0 0 21
14 115 0 13:45 129 105 0 0 104 1 0 0 21 0 0 0 255 0 0 0 0 21
16 86 0 14:00 102 150 0 0 150 0 0 0 24 0 0 0 276 0 0 0 0 24
18 88 0 14:15 106 125 0 0 125 0 0 0 15 0 0 0 246 0 0 0 0 15
19 81 0 14:30 100 137 0 0 137 0 0 0 16 0 0 0 253 0 0 0 0 16
28 147 0 14:45 175 147 0 0 146 1 1 0 32 0 0 0 355 0 0 0 0 33
24 165 0 15:00 189 178 0 0 178 0 0 0 25 0 0 0 392 0 0 0 0 25
18 112 0 15:15 130 180 0 0 178 1 0 0 42 0 0 0 352 0 1 0 0 42
20 118 0 15:30 138 210 0 0 210 0 0 0 41 0 0 0 389 0 0 0 0 41
16 119 0 15:45 135 211 0 0 210 1 0 0 57 0 0 0 403 0 0 0 0 57
20 126 0 16:00 146 233 0 0 232 1 0 0 52 0 0 0 431 0 0 0 0 52
17 138 0 16:15 155 253 0 0 252 1 0 0 41 0 0 0 449 0 0 0 0 41
22 135 0 16:30 157 238 0 0 237 1 0 0 51 0 0 0 446 0 0 0 0 51
28 160 0 16:45 188 212 0 0 212 0 0 0 45 0 0 0 445 0 0 0 0 45
23 130 0 17:00 153 250 0 0 250 0 0 0 40 0 0 0 443 0 0 0 0 40
26 144 0 17:15 170 237 0 0 237 0 0 0 52 0 0 0 459 0 0 0 0 52
23 139 0 17:30 162 225 0 0 223 2 0 0 54 0 0 0 441 0 0 0 0 54
23 122 0 17:45 145 231 0 0 231 0 0 0 73 0 0 0 449 0 0 0 0 73
20 128 0 18:00 148 247 0 0 247 0 2 0 60 0 0 0 457 0 0 0 0 62
Page 3 of 11

1756
Station ID:
Location:
Interval
(dd): PEAK
HOURS
AM PERIOD
6:00AM-12:00PM
Start End VolumePM PERIOD
12:00PM-19:00P
Start End Volume
MD 355 at BRINK RD
County:
Town:
Weather:
Montgomery
none
Cloudy/Cold
1822
Comments:
Date: Tuesday 03/05/2019
S2011150803
15 min
07:15 08:15 17:30 18:30D
LOS LOS V/CV/C
0.90 D 0.81
27 139 0 18:15 166 239 0 0 239 0 1 0 55 0 0 0 461 0 0 0 0 56
18 132 0 18:30 150 269 0 0 269 0 0 0 36 0 0 0 455 0 0 0 0 36
14 128 0 18:45 142 257 0 0 257 0 1 0 34 0 0 0 434 0 0 0 0 35
12 117 0 19:00 129 250 0 0 249 1 1 0 28 0 0 0 408 0 0 0 0 29
12 92 0 19:15 104 180 0 0 180 0 0 0 35 0 0 0 319 0 0 0 0 35
7 61 0 19:30 68 162 0 0 162 0 0 0 20 0 0 0 250 0 0 0 0 20
6 81 0 19:45 87 101 0 0 100 1 0 0 22 0 0 0 210 0 0 0 0 22
6 77 0 20:00 83 106 0 0 106 0 0 0 12 0 0 0 201 0 0 0 0 12
7 68 0 20:15 75 97 0 0 96 1 0 0 8 0 0 0 180 0 0 0 0 8
5 67 0 20:30 72 130 0 0 129 1 0 0 16 0 0 0 218 0 0 0 0 16
7 93 0 20:45 100 78 0 0 78 0 0 0 5 0 0 0 183 0 0 0 0 5
0 55 0 21:00 55 113 0 0 109 4 0 0 8 0 0 0 176 0 0 0 0 8
10 41 0 21:15 51 94 0 0 94 0 0 0 7 0 0 0 152 0 0 0 0 7
4 59 0 21:30 63 90 0 0 90 0 0 0 8 0 0 0 161 0 0 0 0 8
4 29 0 21:45 33 81 0 0 80 1 0 0 7 0 0 0 121 0 0 0 0 7
3 27 0 22:00 30 52 0 0 52 0 0 0 8 0 0 0 90 0 0 0 0 8
4 29 0 22:15 33 72 0 0 72 0 0 0 8 0 0 0 113 0 0 0 0 8
1 32 0 22:30 33 52 0 0 52 0 0 0 7 0 0 0 92 0 0 0 0 7
2 20 0 22:45 22 47 0 0 47 0 0 0 1 0 0 0 70 0 0 0 0 1
1 24 0 23:00 25 36 0 0 36 0 0 0 2 0 0 0 63 0 0 0 0 2
0 11 0 23:15 11 28 0 0 28 0 0 0 2 0 0 0 41 0 0 0 0 2
3 16 0 23:30 19 28 0 0 28 0 0 0 2 0 0 0 49 0 0 0 0 2
2 8 0 23:45 10 26 0 0 26 0 0 0 3 0 0 0 39 0 0 0 0 3
0 14 0 0:00 14 20 0 0 20 0 0 0 3 0 0 0 37 0 0 0 0 3
Page 4 of 11

1756
Station ID:
Location:
Interval
(dd): PEAK
HOURS
AM PERIOD
6:00AM-12:00PM
Start End VolumePM PERIOD
12:00PM-19:00P
Start End Volume
MD 355 at BRINK RD
County:
Town:
Weather:
Montgomery
none
Cloudy/Cold
1822
Comments:
Date: Wednesday 03/06/2019
S2011150803
15 min
07:15 08:15 17:30 18:30D
LOS LOS V/CV/C
0.90 D 0.81
149
88 521
1043 0
0
TOTAL:
1192
609
AM Peak:
PM Peak:
465
986
0 4
0 986 0
2 0
3 0 224
0 0 0
0 0 0
99
227
0
0 1822
1756 97
1328 9749 0 11077 0 9093 39 9133 14 0 1697 1711 0 0 0 0 21921 0
0
0
0
0
0
0
0
0
1
0
0
461
Page 5 of 11

1756
Station ID:
Location:
Interval
(dd): PEAK
HOURS
AM PERIOD
6:00AM-12:00PM
Start End VolumePM PERIOD
12:00PM-19:00P
Start End Volume
MD 355 at BRINK RD
County:
Town:
Weather:
Montgomery
none
Cloudy/Cold
1822
Comments:
Date: Wednesday 03/06/2019
S2011150803
15 min
07:15 08:15 17:30 18:30D
LOS LOS V/CV/C
0.90 D 0.81
PedestriansPedestrians BicyclesPedestrainsBicyclesPedestrians
Hour
Ending
North Leg South Leg East Leg West Leg
MD 355 MD 355 BRINK RD
School
Children
School
Children
School
ChildrenBicycles Bicycles
School
Children
0 0:15 0 0 0 0 0 0 0 0 0 0 0
0 0:30 0 0 0 0 0 0 0 0 0 0 0
0 0:45 0 0 0 0 0 0 0 0 0 0 0
0 1:00 0 0 0 0 0 0 0 0 0 0 0
0 1:15 0 0 0 0 0 0 0 0 0 0 0
0 1:30 0 0 0 0 0 0 0 0 0 0 0
0 1:45 0 0 0 0 0 0 0 0 0 0 0
0 2:00 0 0 0 0 0 0 0 0 0 0 0
0 2:15 0 0 0 0 0 0 0 0 0 0 0
0 2:30 0 0 0 0 0 0 0 0 0 0 0
0 2:45 0 0 0 0 0 0 0 0 0 0 0
0 3:00 0 0 0 0 0 0 0 0 0 0 0
0 3:15 0 0 0 0 0 0 0 0 0 0 0
0 3:30 0 0 0 0 0 0 0 0 0 0 0
0 3:45 0 0 0 0 0 0 0 0 0 0 0
0 4:00 0 0 0 0 0 0 0 0 0 0 0
0 4:15 0 0 0 0 0 0 0 0 0 0 0
0 4:30 0 0 0 0 0 0 0 0 0 0 0
0 4:45 0 0 0 0 0 0 0 0 0 0 0
0 5:00 0 0 0 0 0 0 0 0 0 0 0
0 5:15 0 0 0 0 0 0 0 0 0 0 0
0 5:30 0 0 0 0 0 0 0 0 0 0 0
0 5:45 0 0 0 0 0 0 0 0 0 0 0
0 6:00 0 0 0 0 0 0 0 0 0 0 0
0 6:15 0 0 0 0 0 0 0 0 0 0 0
0 6:30 0 0 0 0 0 0 0 0 0 0 0
0 6:45 0 0 0 0 0 0 0 0 0 0 0
0 7:00 0 0 0 0 0 0 0 0 0 0 0
Page 6 of 11

1756
Station ID:
Location:
Interval
(dd): PEAK
HOURS
AM PERIOD
6:00AM-12:00PM
Start End VolumePM PERIOD
12:00PM-19:00P
Start End Volume
MD 355 at BRINK RD
County:
Town:
Weather:
Montgomery
none
Cloudy/Cold
1822
Comments:
Date: Wednesday 03/06/2019
S2011150803
15 min
07:15 08:15 17:30 18:30D
LOS LOS V/CV/C
0.90 D 0.81
0 7:15 0 0 0 0 0 0 0 0 0 0 0
0 7:30 0 0 0 0 0 0 0 0 0 0 0
0 7:45 0 0 0 0 0 0 0 0 0 0 0
0 8:00 0 0 0 0 0 0 0 0 0 0 0
0 8:15 0 0 0 0 0 0 0 0 0 0 0
0 8:30 0 0 0 0 0 0 0 0 0 0 0
0 8:45 0 0 0 0 0 0 0 0 0 0 0
0 9:00 0 0 0 0 0 0 0 0 0 0 0
0 9:15 0 0 0 0 0 0 0 0 0 0 0
0 9:30 0 0 0 0 0 0 0 0 0 0 0
0 9:45 0 0 0 0 0 0 0 0 0 0 0
0 10:00 0 0 0 0 0 0 0 0 0 0 0
0 10:15 0 0 0 0 0 0 0 0 0 0 0
0 10:30 0 0 0 0 0 0 0 0 0 0 0
0 10:45 0 0 0 0 0 0 0 0 0 0 0
0 11:00 0 0 0 0 0 0 0 0 0 0 0
0 11:15 0 0 0 0 0 0 0 0 0 0 0
0 11:30 0 0 0 0 0 0 0 0 0 0 0
0 11:45 0 0 0 0 0 0 0 0 0 0 0
0 12:00 0 0 0 0 0 0 0 0 0 0 0
0 12:15 0 0 0 0 0 0 0 0 0 0 0
0 12:30 0 0 0 0 0 0 0 0 0 0 0
0 12:45 0 0 0 0 0 0 0 0 0 0 0
0 13:00 0 0 0 0 0 0 0 0 0 0 0
0 13:15 0 0 0 0 0 0 0 0 0 0 0
0 13:30 0 0 0 0 0 0 0 0 0 0 0
0 13:45 0 0 0 0 0 0 0 0 0 0 0
0 14:00 0 0 0 0 0 0 0 0 0 0 0
0 14:15 0 0 0 0 0 0 0 0 0 0 0
0 14:30 0 0 0 0 0 0 0 0 0 0 0
0 14:45 0 0 0 0 0 0 0 0 0 0 0
0 15:00 0 0 0 0 0 0 0 0 0 0 0
Page 7 of 11

1756
Station ID:
Location:
Interval
(dd): PEAK
HOURS
AM PERIOD
6:00AM-12:00PM
Start End VolumePM PERIOD
12:00PM-19:00P
Start End Volume
MD 355 at BRINK RD
County:
Town:
Weather:
Montgomery
none
Cloudy/Cold
1822
Comments:
Date: Wednesday 03/06/2019
S2011150803
15 min
07:15 08:15 17:30 18:30D
LOS LOS V/CV/C
0.90 D 0.81
0 15:15 0 0 0 0 0 0 0 0 0 0 0
0 15:30 0 0 0 0 0 0 0 0 0 0 0
0 15:45 0 0 0 0 0 0 1 0 0 0 0
0 16:00 0 0 0 1 0 0 0 0 0 0 0
0 16:15 0 0 0 0 0 0 0 0 0 0 0
0 16:30 0 0 0 0 0 0 0 0 0 0 0
0 16:45 0 0 0 0 0 0 0 0 0 0 0
0 17:00 0 0 0 0 0 0 0 0 0 0 0
0 17:15 0 0 0 0 0 0 0 0 0 0 0
0 17:30 0 0 0 0 0 0 0 0 0 0 0
0 17:45 0 0 0 0 0 0 0 0 0 0 0
0 18:00 0 0 0 0 0 0 0 0 0 0 0
0 18:15 0 0 0 0 0 0 0 0 0 0 0
0 18:30 0 0 0 0 0 0 0 0 0 0 0
0 18:45 0 0 0 1 0 0 0 0 0 0 0
0 19:00 0 0 0 0 0 0 0 0 0 0 0
0 19:15 0 0 0 0 0 0 0 0 0 0 0
0 19:30 0 0 0 0 0 0 0 0 0 0 0
0 19:45 0 0 0 0 0 0 0 0 0 0 0
0 20:00 0 0 0 0 0 0 0 0 0 0 0
0 20:15 0 0 0 0 0 0 0 0 0 0 0
0 20:30 0 0 0 0 0 0 0 0 0 0 0
0 20:45 0 0 0 0 0 0 0 0 0 0 0
0 21:00 0 0 0 0 0 0 0 0 0 0 0
0 21:15 0 0 0 0 0 0 0 0 0 0 0
0 21:30 0 0 0 0 0 0 0 0 0 0 0
0 21:45 0 0 0 0 0 0 0 0 0 0 0
0 22:00 0 0 0 0 0 0 0 0 0 0 0
0 22:15 0 0 0 0 0 0 0 0 0 0 0
0 22:30 0 0 0 0 0 0 0 0 0 0 0
0 22:45 0 0 0 0 0 0 0 0 0 0 0
0 23:00 0 0 0 0 0 0 0 0 0 0 0
Page 8 of 11

1756
Station ID:
Location:
Interval
(dd): PEAK
HOURS
AM PERIOD
6:00AM-12:00PM
Start End VolumePM PERIOD
12:00PM-19:00P
Start End Volume
MD 355 at BRINK RD
County:
Town:
Weather:
Montgomery
none
Cloudy/Cold
1822
Comments:
Date: Wednesday 03/06/2019
S2011150803
15 min
07:15 08:15 17:30 18:30D
LOS LOS V/CV/C
0.90 D 0.81
0 23:15 0 0 0 0 0 0 0 0 0 0 0
0 23:30 0 0 0 0 0 0 0 0 0 0 0
0 23:45 0 0 0 0 0 0 0 0 0 0 0
0 0:00 0 0 0 0 0 0 0 0 0 0 0
0
0
0
0
0
0
Total:
AM Pe 0 0 0
0 0 0
0
0
0
0
0
0
0
0
0
0
0
0
0 0 0 0 0 0 2 0 0 0 1 0
PM Pe
Page 9 of 11

1756
Station ID:
Location:
Interval
(dd): PEAK
HOURS
AM PERIOD
6:00AM-12:00PM
Start End VolumePM PERIOD
12:00PM-19:00P
Start End Volume
MD 355 at BRINK RD
County:
Town:
Weather:
Montgomery
none
Cloudy/Cold
1822
Comments:
Date: Wednesday 03/06/2019
S2011150803
15 min
07:15 08:15 17:30 18:30D
LOS LOS V/CV/C
0.90 D 0.81
R T L U
U
L
T
R
R
T
L
U
RTLU
149 1043 0
461 4 0
2
0 0
0
0
1192 558
1750
99
252
465 1045
1510
0
0
0
97
LEG 1
MD 355
LE
G 3
BR
INK
RD
LEG 2
MD 355
LE
G 4
246 0
0 6
Quadrant Quadrant
QuadrantQuadrant
153
AM Peak Hour
21867
1328 9749 0
R T L U
MD 355
LEG 1
11077 10790
0 9093 39
U L T R
MD 355
LEG 2
9133 9764
18897
1711
14
0
1697 R
T
L
U
BR
INK
RD
LE
G 3
1367
3078 0
0
0
U
L
T
R
LE
G 4
0
0
0
3025 0
53 1
Quadrant Quadrant
QuadrantQuadrant
Turning Movement Summary
0
1
0
0
0
0
0
0
Page 10 of 11

1756
Station ID:
Location:
Interval
(dd): PEAK
HOURS
AM PERIOD
6:00AM-12:00PM
Start End VolumePM PERIOD
12:00PM-19:00P
Start End Volume
MD 355 at BRINK RD
County:
Town:
Weather:
Montgomery
none
Cloudy/Cold
1822
Comments:
Date: Wednesday 03/06/2019
S2011150803
15 min
07:15 08:15 17:30 18:30D
LOS LOS V/CV/C
0.90 D 0.81
1819
88 0 521
0 0 986
3
0
224
0
0
0
R T L U
LEG 1
MD 355
U L T R
R
T
L
U
U
L
T
R
LE
G 4
609 1210
227
88
315
0
0
0
524 986
1510
LEG 2
MD 355
LE
G 3
BR
INK
RD
Quadrant
QuadrantQuadrant
Quadrant 312
3
0
0
PM Peak Hour
0
0
0
0
Page 11 of 11

Maryland Department of Transportation
State Highway Administration Data Services Engineering Division
Turning Movement Count Study - Field Sheet
1749
Station ID:
Location:
Interval
(dd): PEAK
HOURS
AM PERIOD
6:00AM-12:00PM
Start End VolumePM PERIOD
12:00PM-19:00P
Start End Volume
MD 355 at GREENBROOK DR
County:
Town:
Weather:
Montgomery
none
Cloudy/Cold
1827
Comments:
Date: Tuesday 03/05/2019
S2014150397
15 min
07:15 08:15 17:00 18:00C
LOS LOS V/CV/C
0.75 C 0.74
From SouthHour
EndingFrom North
TOTAL TOTAL TOTAL TOTAL
From East From WestLeft Through RightLeft Throug
h
RIGHTLeft Throug
h
RightLeft RightThrough
MD 355 MD 355 GREENBROOK DR
Grand
TotalU.Tur
n
U.Turn U.Turn U.Turn
0 9 0 0:15 9 12 0 0 12 0 1 0 0 0 0 0 22 0 0 0 0 1
0 12 0 0:30 12 15 0 0 15 0 0 0 0 0 0 0 27 0 0 0 0 0
1 2 0 0:45 3 6 0 0 6 0 0 0 1 0 0 0 10 0 0 0 0 1
0 3 0 1:00 3 18 0 0 18 0 1 0 0 0 0 0 22 0 0 0 0 1
0 2 0 1:15 2 12 0 0 11 1 0 0 0 0 0 0 14 0 0 0 0 0
0 3 0 1:30 3 10 0 0 10 0 0 0 0 0 0 0 13 0 0 0 0 0
0 3 0 1:45 3 10 0 0 9 1 0 0 0 0 0 0 13 0 0 0 0 0
0 5 0 2:00 5 5 0 0 5 0 0 0 0 0 0 0 10 0 0 0 0 0
0 1 0 2:15 1 3 0 0 3 0 0 0 0 0 0 0 4 0 0 0 0 0
0 4 0 2:30 4 2 0 0 2 0 0 0 0 0 0 0 6 0 0 0 0 0
0 3 0 2:45 3 5 0 0 5 0 1 0 0 0 0 0 9 0 0 0 0 1
0 6 0 3:00 6 5 0 0 5 0 1 0 0 0 0 0 12 0 0 0 0 1
0 3 0 3:15 3 3 0 0 3 0 0 0 0 0 0 0 6 0 0 0 0 0
0 3 0 3:30 3 3 0 0 3 0 0 0 0 0 0 0 6 0 0 0 0 0
0 3 0 3:45 3 3 0 0 3 0 0 0 0 0 0 0 6 0 0 0 0 0
0 13 0 4:00 13 6 0 0 6 0 0 0 0 0 0 0 19 0 0 0 0 0
0 9 0 4:15 9 3 0 0 3 0 1 0 0 0 0 0 13 0 0 0 0 1
0 12 0 4:30 12 6 0 0 6 0 0 0 0 0 0 0 18 0 0 0 0 0
0 27 0 4:45 27 8 0 0 8 0 0 0 0 0 0 0 35 0 0 0 0 0
0 38 0 5:00 38 12 0 0 12 0 0 0 0 0 0 0 50 0 0 0 0 0
Page 1 of 11

1749
Station ID:
Location:
Interval
(dd): PEAK
HOURS
AM PERIOD
6:00AM-12:00PM
Start End VolumePM PERIOD
12:00PM-19:00P
Start End Volume
MD 355 at GREENBROOK DR
County:
Town:
Weather:
Montgomery
none
Cloudy/Cold
1827
Comments:
Date: Tuesday 03/05/2019
S2014150397
15 min
07:15 08:15 17:00 18:00C
LOS LOS V/CV/C
0.75 C 0.74
1 50 0 5:15 51 10 0 0 10 0 1 0 0 0 0 0 62 0 0 0 0 1
0 70 0 5:30 70 15 0 0 15 0 2 0 0 0 0 0 87 0 0 0 0 2
0 107 0 5:45 107 26 0 0 26 0 2 0 0 0 0 0 135 0 0 0 0 2
0 139 0 6:00 139 29 0 0 29 0 2 0 0 0 0 0 170 0 0 0 0 2
1 203 0 6:15 204 49 0 0 49 0 5 0 0 0 0 0 258 0 0 0 0 5
2 261 0 6:30 263 70 0 0 68 2 1 0 1 0 0 0 335 0 0 0 0 2
0 304 0 6:45 304 58 0 0 58 0 5 0 0 0 0 0 367 0 0 0 0 5
0 314 0 7:00 314 96 0 0 96 0 4 0 0 0 0 0 414 0 0 0 0 4
0 305 0 7:15 305 114 0 0 113 1 2 0 1 0 0 0 422 0 0 0 0 3
1 277 0 7:30 278 170 0 0 168 2 1 0 0 0 0 0 449 0 0 0 0 1
0 289 0 7:45 289 146 0 0 146 0 1 0 0 0 0 0 436 0 0 0 0 1
1 313 0 8:00 314 125 0 0 123 2 1 0 0 0 0 0 440 0 0 0 0 1
0 302 0 8:15 302 117 0 0 117 0 5 0 0 0 0 0 424 0 0 0 0 5
0 293 0 8:30 293 94 0 0 93 1 2 0 0 0 0 0 389 0 0 0 0 2
0 328 0 8:45 328 102 0 0 102 0 0 0 0 0 0 0 430 0 0 0 0 0
0 298 0 9:00 298 105 0 0 103 2 2 0 1 0 0 0 406 0 0 0 0 3
0 319 0 9:15 319 107 0 0 105 2 2 0 1 0 0 0 429 0 0 0 0 3
0 245 0 9:30 245 110 0 0 107 3 2 0 1 0 0 0 358 0 0 0 0 3
0 206 0 9:45 206 89 0 0 86 3 1 0 1 0 0 0 297 0 0 0 0 2
0 186 0 10:00 186 81 0 0 79 2 0 0 0 0 0 0 267 0 0 0 0 0
0 132 0 10:15 132 91 0 0 87 4 0 0 1 0 0 0 224 0 0 0 0 1
1 121 0 10:30 122 88 0 0 85 3 1 0 0 0 0 0 211 0 0 0 0 1
0 128 0 10:45 128 80 0 0 79 1 0 0 0 0 0 0 208 0 0 0 0 0
0 128 0 11:00 128 109 0 0 107 2 0 0 0 0 0 0 237 0 0 0 0 0
0 130 0 11:15 130 114 0 0 113 1 2 0 0 0 0 0 246 0 0 0 0 2
0 138 0 11:30 138 120 0 0 120 0 2 0 0 0 0 0 260 0 0 0 0 2
Page 2 of 11
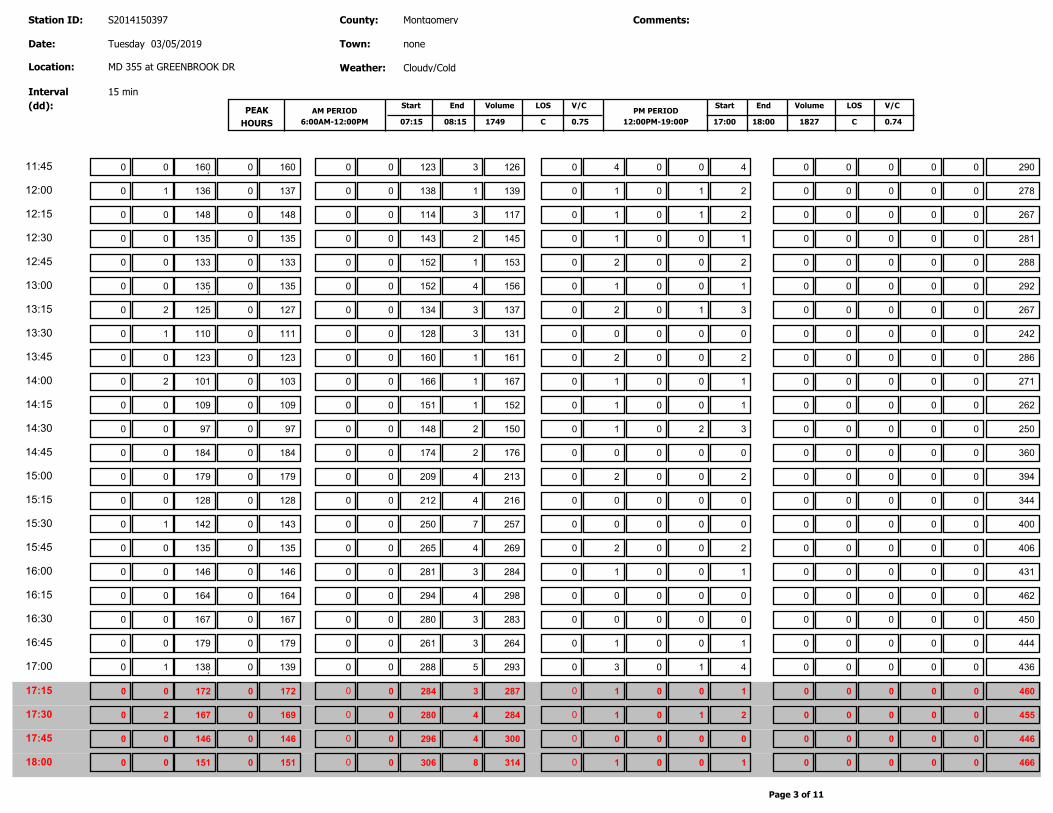
1749
Station ID:
Location:
Interval
(dd): PEAK
HOURS
AM PERIOD
6:00AM-12:00PM
Start End VolumePM PERIOD
12:00PM-19:00P
Start End Volume
MD 355 at GREENBROOK DR
County:
Town:
Weather:
Montgomery
none
Cloudy/Cold
1827
Comments:
Date: Tuesday 03/05/2019
S2014150397
15 min
07:15 08:15 17:00 18:00C
LOS LOS V/CV/C
0.75 C 0.74
0 160 0 11:45 160 126 0 0 123 3 4 0 0 0 0 0 290 0 0 0 0 4
1 136 0 12:00 137 139 0 0 138 1 1 0 1 0 0 0 278 0 0 0 0 2
0 148 0 12:15 148 117 0 0 114 3 1 0 1 0 0 0 267 0 0 0 0 2
0 135 0 12:30 135 145 0 0 143 2 1 0 0 0 0 0 281 0 0 0 0 1
0 133 0 12:45 133 153 0 0 152 1 2 0 0 0 0 0 288 0 0 0 0 2
0 135 0 13:00 135 156 0 0 152 4 1 0 0 0 0 0 292 0 0 0 0 1
2 125 0 13:15 127 137 0 0 134 3 2 0 1 0 0 0 267 0 0 0 0 3
1 110 0 13:30 111 131 0 0 128 3 0 0 0 0 0 0 242 0 0 0 0 0
0 123 0 13:45 123 161 0 0 160 1 2 0 0 0 0 0 286 0 0 0 0 2
2 101 0 14:00 103 167 0 0 166 1 1 0 0 0 0 0 271 0 0 0 0 1
0 109 0 14:15 109 152 0 0 151 1 1 0 0 0 0 0 262 0 0 0 0 1
0 97 0 14:30 97 150 0 0 148 2 1 0 2 0 0 0 250 0 0 0 0 3
0 184 0 14:45 184 176 0 0 174 2 0 0 0 0 0 0 360 0 0 0 0 0
0 179 0 15:00 179 213 0 0 209 4 2 0 0 0 0 0 394 0 0 0 0 2
0 128 0 15:15 128 216 0 0 212 4 0 0 0 0 0 0 344 0 0 0 0 0
1 142 0 15:30 143 257 0 0 250 7 0 0 0 0 0 0 400 0 0 0 0 0
0 135 0 15:45 135 269 0 0 265 4 2 0 0 0 0 0 406 0 0 0 0 2
0 146 0 16:00 146 284 0 0 281 3 1 0 0 0 0 0 431 0 0 0 0 1
0 164 0 16:15 164 298 0 0 294 4 0 0 0 0 0 0 462 0 0 0 0 0
0 167 0 16:30 167 283 0 0 280 3 0 0 0 0 0 0 450 0 0 0 0 0
0 179 0 16:45 179 264 0 0 261 3 1 0 0 0 0 0 444 0 0 0 0 1
1 138 0 17:00 139 293 0 0 288 5 3 0 1 0 0 0 436 0 0 0 0 4
0 172 0 17:15 172 287 0 0 284 3 1 0 0 0 0 0 460 0 0 0 0 1
2 167 0 17:30 169 284 0 0 280 4 1 0 1 0 0 0 455 0 0 0 0 2
0 146 0 17:45 146 300 0 0 296 4 0 0 0 0 0 0 446 0 0 0 0 0
0 151 0 18:00 151 314 0 0 306 8 1 0 0 0 0 0 466 0 0 0 0 1
Page 3 of 11

1749
Station ID:
Location:
Interval
(dd): PEAK
HOURS
AM PERIOD
6:00AM-12:00PM
Start End VolumePM PERIOD
12:00PM-19:00P
Start End Volume
MD 355 at GREENBROOK DR
County:
Town:
Weather:
Montgomery
none
Cloudy/Cold
1827
Comments:
Date: Tuesday 03/05/2019
S2014150397
15 min
07:15 08:15 17:00 18:00C
LOS LOS V/CV/C
0.75 C 0.74
0 163 0 18:15 163 289 0 0 282 7 0 0 0 0 0 0 452 0 0 0 0 0
0 141 0 18:30 141 305 0 0 296 9 2 0 0 0 0 0 448 0 0 0 0 2
0 146 0 18:45 146 294 0 0 285 9 0 0 1 0 0 0 441 0 0 0 0 1
0 127 0 19:00 127 280 0 0 272 8 2 0 0 0 0 0 409 0 0 0 0 2
1 102 0 19:15 103 205 0 0 200 5 2 0 2 0 0 0 312 0 0 0 0 4
1 59 0 19:30 60 185 0 0 183 2 2 0 0 0 0 0 247 0 0 0 0 2
0 93 0 19:45 93 112 0 0 111 1 1 0 2 0 0 0 208 0 0 0 0 3
1 84 0 20:00 85 119 0 0 113 6 0 0 0 0 0 0 204 0 0 0 0 0
0 82 0 20:15 82 102 0 0 100 2 0 0 2 0 0 0 186 0 0 0 0 2
0 56 0 20:30 56 148 0 0 145 3 3 0 0 0 0 0 207 0 0 0 0 3
0 107 0 20:45 107 80 0 0 79 1 1 0 0 0 0 0 188 0 0 0 0 1
0 55 0 21:00 55 118 0 0 114 4 0 0 1 0 0 0 174 0 0 0 0 1
0 53 0 21:15 53 105 0 0 102 3 1 0 1 0 0 0 160 0 0 0 0 2
1 54 0 21:30 55 100 0 0 98 2 2 0 1 0 0 0 158 0 0 0 0 3
0 28 0 21:45 28 88 0 0 85 3 1 0 0 0 0 0 117 0 0 0 0 1
1 28 0 22:00 29 62 0 0 61 1 1 0 0 0 0 0 92 0 0 0 0 1
0 34 0 22:15 34 78 0 0 75 3 0 0 0 0 0 0 112 0 0 0 0 0
1 36 0 22:30 37 57 0 0 56 1 1 0 0 0 0 0 95 0 0 0 0 1
0 18 0 22:45 18 49 0 0 49 0 0 0 0 0 0 0 67 0 0 0 0 0
0 24 0 23:00 24 40 0 0 40 0 0 0 0 0 0 0 64 0 0 0 0 0
2 13 0 23:15 15 26 0 0 26 0 1 0 0 0 0 0 42 0 0 0 0 1
0 17 0 23:30 17 30 0 0 30 0 0 0 0 0 0 0 47 0 0 0 0 0
0 8 0 23:45 8 29 0 0 29 0 1 0 0 0 0 0 38 0 0 0 0 1
0 15 0 0:00 15 23 0 0 21 2 0 0 0 0 0 0 38 0 0 0 0 0
Page 4 of 11

1749
Station ID:
Location:
Interval
(dd): PEAK
HOURS
AM PERIOD
6:00AM-12:00PM
Start End VolumePM PERIOD
12:00PM-19:00P
Start End Volume
MD 355 at GREENBROOK DR
County:
Town:
Weather:
Montgomery
none
Cloudy/Cold
1827
Comments:
Date: Wednesday 03/06/2019
S2014150397
15 min
07:15 08:15 17:00 18:00C
LOS LOS V/CV/C
0.75 C 0.74
2
2 636
1181 0
0
TOTAL:
1183
638
AM Peak:
PM Peak:
558
1185
0 4
0 1166 19
8 0
3 0 1
0 0 0
0 0 0
8
4
0
0 1827
1749 0
26 11000 0 11026 0 10670 188 10858 101 0 25 126 0 0 0 0 22010 0
0
0
0
0
0
0
0
0
0
0
0
554
Page 5 of 11

1749
Station ID:
Location:
Interval
(dd): PEAK
HOURS
AM PERIOD
6:00AM-12:00PM
Start End VolumePM PERIOD
12:00PM-19:00P
Start End Volume
MD 355 at GREENBROOK DR
County:
Town:
Weather:
Montgomery
none
Cloudy/Cold
1827
Comments:
Date: Wednesday 03/06/2019
S2014150397
15 min
07:15 08:15 17:00 18:00C
LOS LOS V/CV/C
0.75 C 0.74
PedestriansPedestrians BicyclesPedestrainsBicyclesPedestrians
Hour
Ending
North Leg South Leg East Leg West Leg
MD 355 MD 355 GREENBROOK DR
School
Children
School
Children
School
ChildrenBicycles Bicycles
School
Children
0 0:15 0 0 0 0 0 0 0 0 0 0 0
0 0:30 0 0 0 0 0 0 0 0 0 0 0
0 0:45 0 0 0 0 0 0 0 0 0 0 0
0 1:00 0 0 0 0 0 0 0 0 0 0 0
0 1:15 0 0 0 0 0 0 0 0 0 0 0
0 1:30 0 0 0 0 0 0 0 0 0 0 0
0 1:45 0 0 0 0 0 0 0 0 0 0 0
0 2:00 0 0 0 0 0 0 0 0 0 0 0
0 2:15 0 0 0 0 0 0 0 0 0 0 0
0 2:30 0 0 0 0 0 0 0 0 0 0 0
0 2:45 0 0 0 0 0 0 0 0 0 0 0
0 3:00 0 0 0 0 0 0 0 0 0 0 0
0 3:15 0 0 0 0 0 0 0 0 0 0 0
0 3:30 0 0 0 0 0 0 0 0 0 0 0
0 3:45 0 0 0 0 0 0 0 0 0 0 0
0 4:00 0 0 0 0 0 0 0 0 0 0 0
0 4:15 0 0 0 0 0 0 0 0 0 0 0
0 4:30 0 0 0 0 0 0 0 0 0 0 0
0 4:45 0 0 0 0 0 0 0 0 0 0 0
0 5:00 0 0 0 0 0 0 0 0 0 0 0
0 5:15 0 0 0 0 0 0 0 0 0 0 0
0 5:30 0 0 0 0 0 0 0 0 0 0 0
0 5:45 0 0 0 0 0 0 0 0 0 0 0
0 6:00 0 0 0 0 0 0 0 0 0 0 0
0 6:15 0 0 0 2 0 0 0 0 0 0 0
0 6:30 0 0 0 0 0 0 0 0 0 0 0
0 6:45 0 0 0 0 0 0 0 0 0 0 0
0 7:00 0 0 0 0 0 0 0 0 0 0 0
Page 6 of 11

1749
Station ID:
Location:
Interval
(dd): PEAK
HOURS
AM PERIOD
6:00AM-12:00PM
Start End VolumePM PERIOD
12:00PM-19:00P
Start End Volume
MD 355 at GREENBROOK DR
County:
Town:
Weather:
Montgomery
none
Cloudy/Cold
1827
Comments:
Date: Wednesday 03/06/2019
S2014150397
15 min
07:15 08:15 17:00 18:00C
LOS LOS V/CV/C
0.75 C 0.74
0 7:15 0 0 0 0 0 0 0 0 0 0 0
0 7:30 0 0 0 0 0 0 0 0 0 0 0
0 7:45 0 0 0 0 0 0 0 0 0 0 0
0 8:00 0 0 0 0 0 0 0 0 0 0 0
0 8:15 0 0 0 0 0 0 0 0 0 0 0
0 8:30 0 0 0 0 0 0 0 0 0 0 0
0 8:45 0 0 0 0 0 0 0 0 0 0 0
0 9:00 0 0 0 0 0 0 0 0 0 0 0
0 9:15 0 0 0 0 0 0 0 0 0 0 0
0 9:30 0 0 0 0 0 0 0 0 0 0 0
0 9:45 0 0 0 0 0 0 0 0 0 0 0
0 10:00 0 0 0 0 0 0 0 0 0 0 0
0 10:15 0 0 0 0 0 0 0 0 0 0 0
0 10:30 0 0 0 0 0 0 0 0 0 0 0
0 10:45 0 0 0 0 0 0 0 0 0 0 0
0 11:00 0 0 0 0 0 0 0 0 0 0 0
0 11:15 0 1 0 0 0 0 0 0 0 0 0
0 11:30 0 0 0 0 0 0 0 0 0 0 0
0 11:45 0 0 0 0 0 0 0 0 0 0 0
0 12:00 0 0 0 0 0 0 0 0 0 0 0
0 12:15 0 0 0 0 0 0 0 0 0 0 0
0 12:30 0 0 0 0 0 0 0 0 0 0 0
0 12:45 0 0 0 0 0 0 0 0 0 0 0
0 13:00 0 0 0 0 0 0 0 0 0 0 0
0 13:15 0 0 0 0 0 0 0 0 0 0 0
0 13:30 0 0 0 0 0 0 0 0 0 0 0
0 13:45 0 0 0 0 0 0 0 0 0 0 0
0 14:00 0 0 0 0 0 0 0 0 0 0 0
0 14:15 0 0 0 0 0 0 0 0 0 0 0
0 14:30 0 0 0 0 0 0 0 0 0 0 0
0 14:45 0 0 0 0 0 0 0 0 0 0 0
0 15:00 0 0 0 0 0 0 0 0 0 0 0
Page 7 of 11

1749
Station ID:
Location:
Interval
(dd): PEAK
HOURS
AM PERIOD
6:00AM-12:00PM
Start End VolumePM PERIOD
12:00PM-19:00P
Start End Volume
MD 355 at GREENBROOK DR
County:
Town:
Weather:
Montgomery
none
Cloudy/Cold
1827
Comments:
Date: Wednesday 03/06/2019
S2014150397
15 min
07:15 08:15 17:00 18:00C
LOS LOS V/CV/C
0.75 C 0.74
0 15:15 0 0 0 0 0 0 0 0 0 0 0
0 15:30 0 0 0 0 0 0 0 0 0 0 0
0 15:45 0 0 0 0 0 0 0 0 0 0 0
0 16:00 0 0 0 1 0 0 0 0 0 0 0
0 16:15 0 0 0 0 0 0 0 0 0 0 0
0 16:30 0 0 0 0 0 0 0 0 0 0 0
0 16:45 0 0 0 0 0 0 0 0 0 0 0
0 17:00 0 0 0 0 0 0 0 0 0 0 0
0 17:15 0 0 0 0 0 0 0 0 0 0 0
0 17:30 0 0 0 0 0 0 0 0 0 0 0
0 17:45 0 0 0 0 0 0 0 0 0 0 0
0 18:00 0 0 0 0 0 0 0 0 0 0 0
0 18:15 0 1 0 0 0 0 0 0 0 0 0
0 18:30 0 0 0 0 0 0 0 0 0 0 0
0 18:45 0 1 0 2 0 0 0 0 0 0 0
0 19:00 0 0 0 1 0 0 0 0 0 0 0
0 19:15 0 0 0 0 0 0 0 0 0 0 0
0 19:30 0 0 0 0 0 0 0 0 0 0 0
0 19:45 0 0 0 0 0 0 0 0 0 0 0
0 20:00 0 0 0 0 0 0 0 0 0 0 0
0 20:15 0 0 0 0 0 0 0 0 0 0 0
0 20:30 0 0 0 0 0 0 0 0 0 0 0
0 20:45 0 0 0 0 0 0 0 0 0 0 0
0 21:00 0 0 0 0 0 0 0 0 0 0 0
0 21:15 0 0 0 0 0 0 0 0 0 0 0
0 21:30 0 0 0 0 0 0 0 0 0 0 0
0 21:45 0 0 0 0 0 0 0 0 0 0 0
0 22:00 0 0 0 0 0 0 0 0 0 0 0
0 22:15 0 0 0 0 0 0 0 0 0 0 0
0 22:30 0 0 0 0 0 0 0 0 0 0 0
0 22:45 0 0 0 0 0 0 0 0 0 0 0
0 23:00 0 0 0 0 0 0 0 0 0 0 0
Page 8 of 11

1749
Station ID:
Location:
Interval
(dd): PEAK
HOURS
AM PERIOD
6:00AM-12:00PM
Start End VolumePM PERIOD
12:00PM-19:00P
Start End Volume
MD 355 at GREENBROOK DR
County:
Town:
Weather:
Montgomery
none
Cloudy/Cold
1827
Comments:
Date: Wednesday 03/06/2019
S2014150397
15 min
07:15 08:15 17:00 18:00C
LOS LOS V/CV/C
0.75 C 0.74
0 23:15 0 0 0 0 0 0 0 0 0 0 0
0 23:30 0 0 0 0 0 0 0 0 0 0 0
0 23:45 0 0 0 0 0 0 0 0 0 0 0
0 0:00 0 0 0 0 0 0 0 0 0 0 0
0
0
0
0
0
0
Total:
AM Pe 0 0 0
0 0 0
0
0
0
0
0
0
0
0
0
0
0
0
0 0 0 0 3 0 6 0 0 0 0 0
PM Pe
Page 9 of 11
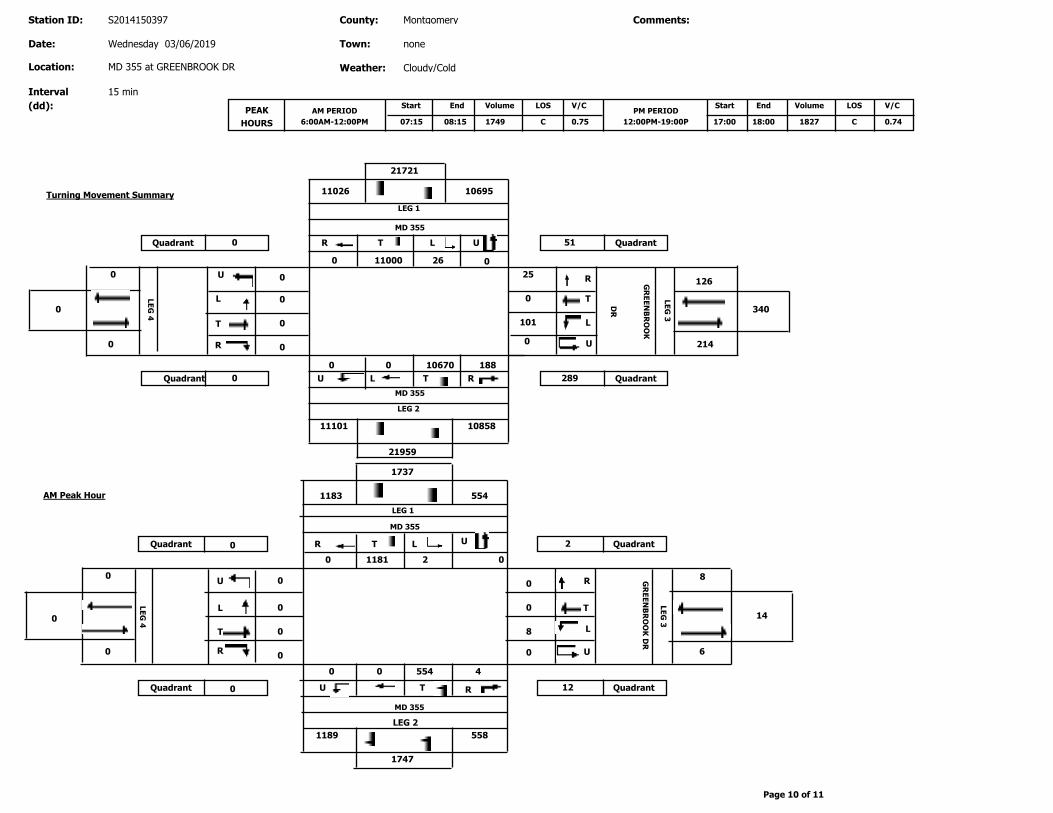
1749
Station ID:
Location:
Interval
(dd): PEAK
HOURS
AM PERIOD
6:00AM-12:00PM
Start End VolumePM PERIOD
12:00PM-19:00P
Start End Volume
MD 355 at GREENBROOK DR
County:
Town:
Weather:
Montgomery
none
Cloudy/Cold
1827
Comments:
Date: Wednesday 03/06/2019
S2014150397
15 min
07:15 08:15 17:00 18:00C
LOS LOS V/CV/C
0.75 C 0.74
R T L U
U
L
T
R
R
T
L
U
RTLU
2 1181 0
554 4 0
8
0 0
0
0
1183 554
1737
8
14
558 1189
1747
0
0
0
0
LEG 1
MD 355
LE
G 3
GR
EE
NB
RO
OK
DR
LEG 2
MD 355
LE
G 4
2 0
0 12
Quadrant Quadrant
QuadrantQuadrant
6
AM Peak Hour
21721
26 11000 0
R T L U
MD 355
LEG 1
11026 10695
0 10670 188
U L T R
MD 355
LEG 2
10858 11101
21959
126
101
0
25 R
T
L
U
GR
EE
NB
RO
OK
DR
LE
G 3
214
340 0
0
0
U
L
T
R
LE
G 4
0
0
0
51 0
289 0
Quadrant Quadrant
QuadrantQuadrant
Turning Movement Summary
0
0
0
0
0
0
0
0
Page 10 of 11
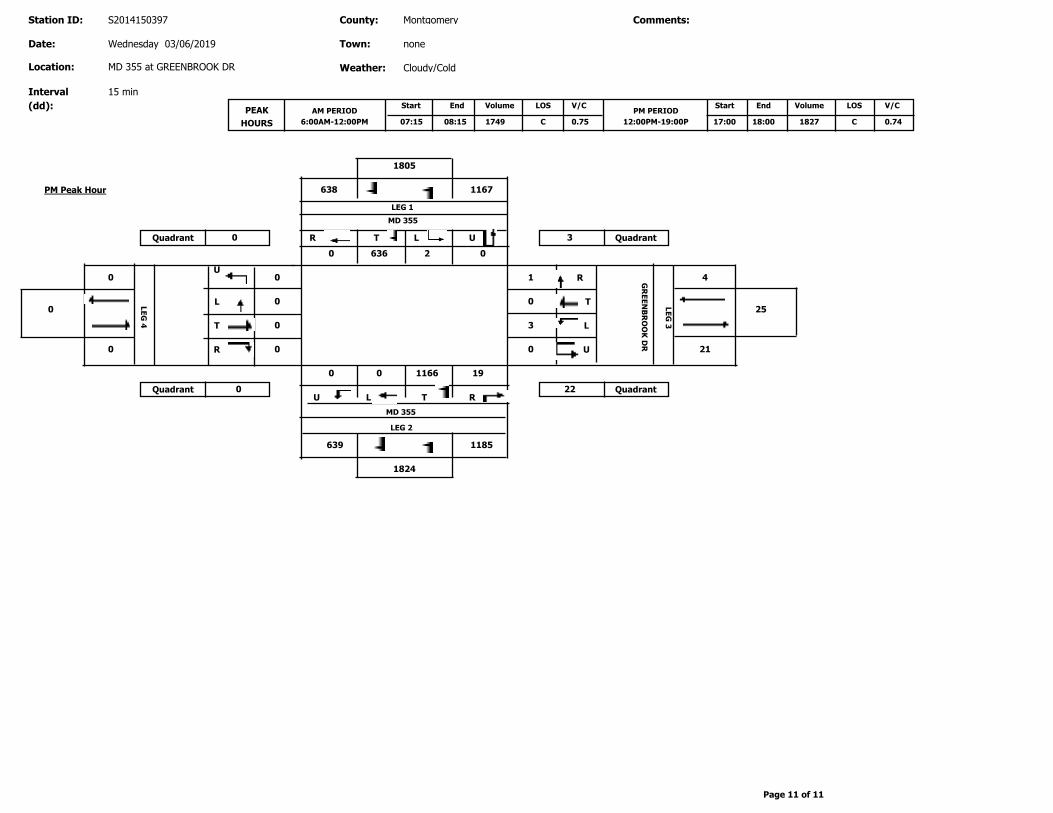
1749
Station ID:
Location:
Interval
(dd): PEAK
HOURS
AM PERIOD
6:00AM-12:00PM
Start End VolumePM PERIOD
12:00PM-19:00P
Start End Volume
MD 355 at GREENBROOK DR
County:
Town:
Weather:
Montgomery
none
Cloudy/Cold
1827
Comments:
Date: Wednesday 03/06/2019
S2014150397
15 min
07:15 08:15 17:00 18:00C
LOS LOS V/CV/C
0.75 C 0.74
1805
2 0 636
0 19 1166
3
0
1
0
0
0
R T L U
LEG 1
MD 355
U L T R
R
T
L
U
U
L
T
R
LE
G 4
638 1167
4
21
25
0
0
0
639 1185
1824
LEG 2
MD 355
LE
G 3
GR
EE
NB
RO
OK
DR
Quadrant
QuadrantQuadrant
Quadrant 3
22
0
0
PM Peak Hour
0
0
0
0
Page 11 of 11

Maryland Department of Transportation
State Highway Administration Data Services Engineering Division
Turning Movement Count Study - Field Sheet
1609
Station ID:
Location:
Interval
(dd): PEAK
HOURS
AM PERIOD
6:00AM-12:00PM
Start End VolumePM PERIOD
12:00PM-19:00P
Start End Volume
MD 355 at WEST OLD BALTIMORE
County:
Town:
Weather:
Montgomery
none
Cloudy/Cold
1892
Comments:
Date: Wednesday 02/13/2019
S2006150099
15 min
06:45 Montg 17:00 MontgC
LOS LOS V/CV/C
0.77 E 0.93
From SouthHour
EndingFrom North
TOTAL TOTAL TOTAL TOTAL
From East From WestLeft Through RightLeft Throug
h
RIGHTLeft Throug
h
RightLeft RightThrough
MD 355 MD 355 West Old Baltimore Rd
Grand
TotalU.Tur
n
U.Turn U.Turn U.Turn
0 151 0 6:15 151 42 23 4 38 0 0 0 0 2 0 21 216 0 0 0 0 0
0 225 3 6:30 228 61 22 9 52 0 0 0 0 1 0 21 311 0 0 0 0 0
0 296 2 6:45 298 56 27 4 52 0 0 0 0 0 0 27 381 0 0 0 0 0
0 283 1 7:00 284 70 33 5 65 0 0 0 0 1 0 32 387 0 0 0 0 0
0 268 2 7:15 270 91 45 6 85 0 0 0 0 6 0 39 406 0 0 0 0 0
0 216 2 7:30 218 177 40 6 171 0 0 0 0 7 0 33 435 0 0 0 0 0
0 180 2 7:45 182 155 40 10 145 0 0 0 0 3 0 37 377 0 0 0 0 0
0 212 2 8:00 214 117 44 8 109 0 0 0 0 2 0 42 375 0 0 0 0 0
0 220 1 8:15 221 96 33 0 96 0 0 0 0 1 0 32 350 0 0 0 0 0
0 232 4 8:30 236 86 42 5 81 0 0 0 0 3 0 39 364 0 0 0 0 0
0 198 2 8:45 200 82 40 9 73 0 0 0 0 1 0 39 322 0 0 0 0 0
0 244 6 9:00 250 113 34 14 99 0 0 0 0 1 0 33 397 0 0 0 0 0
0 192 1 9:15 193 108 48 10 98 0 0 0 0 3 0 45 349 0 0 0 0 0
0 251 6 9:30 257 94 39 11 83 0 0 0 0 2 0 37 390 0 0 0 0 0
0 206 3 9:45 209 103 36 5 98 0 0 0 0 4 0 32 348 0 0 0 0 0
0 179 3 10:00 182 89 20 14 75 0 0 0 0 1 0 19 291 0 0 0 0 0
0 137 0 10:15 137 95 27 10 85 0 0 0 0 5 0 22 259 0 0 0 0 0
0 128 0 10:30 128 97 21 10 87 0 0 0 0 1 0 20 246 0 0 0 0 0
0 121 3 10:45 124 106 14 17 89 0 0 0 0 1 0 13 244 0 0 0 0 0
0 125 2 11:00 127 98 31 8 90 0 0 0 0 4 0 27 256 0 0 0 0 0
Page 1 of 7
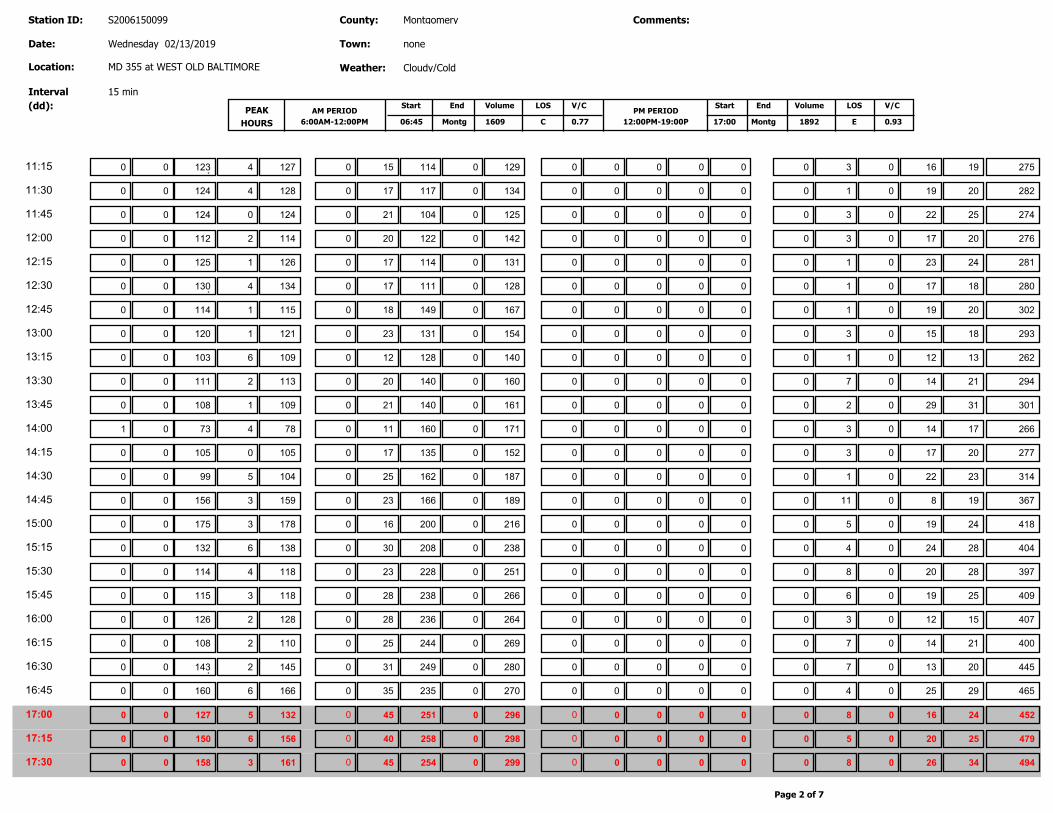
1609
Station ID:
Location:
Interval
(dd): PEAK
HOURS
AM PERIOD
6:00AM-12:00PM
Start End VolumePM PERIOD
12:00PM-19:00P
Start End Volume
MD 355 at WEST OLD BALTIMORE
County:
Town:
Weather:
Montgomery
none
Cloudy/Cold
1892
Comments:
Date: Wednesday 02/13/2019
S2006150099
15 min
06:45 Montg 17:00 MontgC
LOS LOS V/CV/C
0.77 E 0.93
0 123 4 11:15 127 129 19 15 114 0 0 0 0 3 0 16 275 0 0 0 0 0
0 124 4 11:30 128 134 20 17 117 0 0 0 0 1 0 19 282 0 0 0 0 0
0 124 0 11:45 124 125 25 21 104 0 0 0 0 3 0 22 274 0 0 0 0 0
0 112 2 12:00 114 142 20 20 122 0 0 0 0 3 0 17 276 0 0 0 0 0
0 125 1 12:15 126 131 24 17 114 0 0 0 0 1 0 23 281 0 0 0 0 0
0 130 4 12:30 134 128 18 17 111 0 0 0 0 1 0 17 280 0 0 0 0 0
0 114 1 12:45 115 167 20 18 149 0 0 0 0 1 0 19 302 0 0 0 0 0
0 120 1 13:00 121 154 18 23 131 0 0 0 0 3 0 15 293 0 0 0 0 0
0 103 6 13:15 109 140 13 12 128 0 0 0 0 1 0 12 262 0 0 0 0 0
0 111 2 13:30 113 160 21 20 140 0 0 0 0 7 0 14 294 0 0 0 0 0
0 108 1 13:45 109 161 31 21 140 0 0 0 0 2 0 29 301 0 0 0 0 0
0 73 4 14:00 78 171 17 11 160 0 0 0 0 3 0 14 266 1 0 0 0 0
0 105 0 14:15 105 152 20 17 135 0 0 0 0 3 0 17 277 0 0 0 0 0
0 99 5 14:30 104 187 23 25 162 0 0 0 0 1 0 22 314 0 0 0 0 0
0 156 3 14:45 159 189 19 23 166 0 0 0 0 11 0 8 367 0 0 0 0 0
0 175 3 15:00 178 216 24 16 200 0 0 0 0 5 0 19 418 0 0 0 0 0
0 132 6 15:15 138 238 28 30 208 0 0 0 0 4 0 24 404 0 0 0 0 0
0 114 4 15:30 118 251 28 23 228 0 0 0 0 8 0 20 397 0 0 0 0 0
0 115 3 15:45 118 266 25 28 238 0 0 0 0 6 0 19 409 0 0 0 0 0
0 126 2 16:00 128 264 15 28 236 0 0 0 0 3 0 12 407 0 0 0 0 0
0 108 2 16:15 110 269 21 25 244 0 0 0 0 7 0 14 400 0 0 0 0 0
0 143 2 16:30 145 280 20 31 249 0 0 0 0 7 0 13 445 0 0 0 0 0
0 160 6 16:45 166 270 29 35 235 0 0 0 0 4 0 25 465 0 0 0 0 0
0 127 5 17:00 132 296 24 45 251 0 0 0 0 8 0 16 452 0 0 0 0 0
0 150 6 17:15 156 298 25 40 258 0 0 0 0 5 0 20 479 0 0 0 0 0
0 158 3 17:30 161 299 34 45 254 0 0 0 0 8 0 26 494 0 0 0 0 0
Page 2 of 7

1609
Station ID:
Location:
Interval
(dd): PEAK
HOURS
AM PERIOD
6:00AM-12:00PM
Start End VolumePM PERIOD
12:00PM-19:00P
Start End Volume
MD 355 at WEST OLD BALTIMORE
County:
Town:
Weather:
Montgomery
none
Cloudy/Cold
1892
Comments:
Date: Wednesday 02/13/2019
S2006150099
15 min
06:45 Montg 17:00 MontgC
LOS LOS V/CV/C
0.77 E 0.93
0 125 2 17:45 127 309 31 37 272 0 0 0 0 6 0 25 467 0 0 0 0 0
0 127 5 18:00 132 284 27 32 252 0 0 0 0 4 0 23 443 0 0 0 0 0
0 115 8 18:15 123 316 24 35 281 0 0 0 0 4 0 20 463 0 0 0 0 0
0 128 4 18:30 132 296 16 47 249 0 0 0 0 1 0 15 444 0 0 0 0 0
0 135 4 18:45 139 296 28 39 257 0 0 0 0 2 0 26 463 0 0 0 0 0
0 97 3 19:00 100 267 22 45 222 0 0 0 0 4 0 18 389 0 0 0 0 0
0
0 560
1063 7
16
TOTAL:
1070
576
AM Peak:
PM Peak:
394
1202
21 0
167 1035 0
0 0
0 0 0
14 0 131
27 0 87
0
0
145
114 1892
1609 0
0 8026 151 8178 1023 7898 0 8921 0 0 0 0 179 0 1209 1388 18487 1
0
0
0
0
0
0
0
0
0
0
0
373
Page 3 of 7
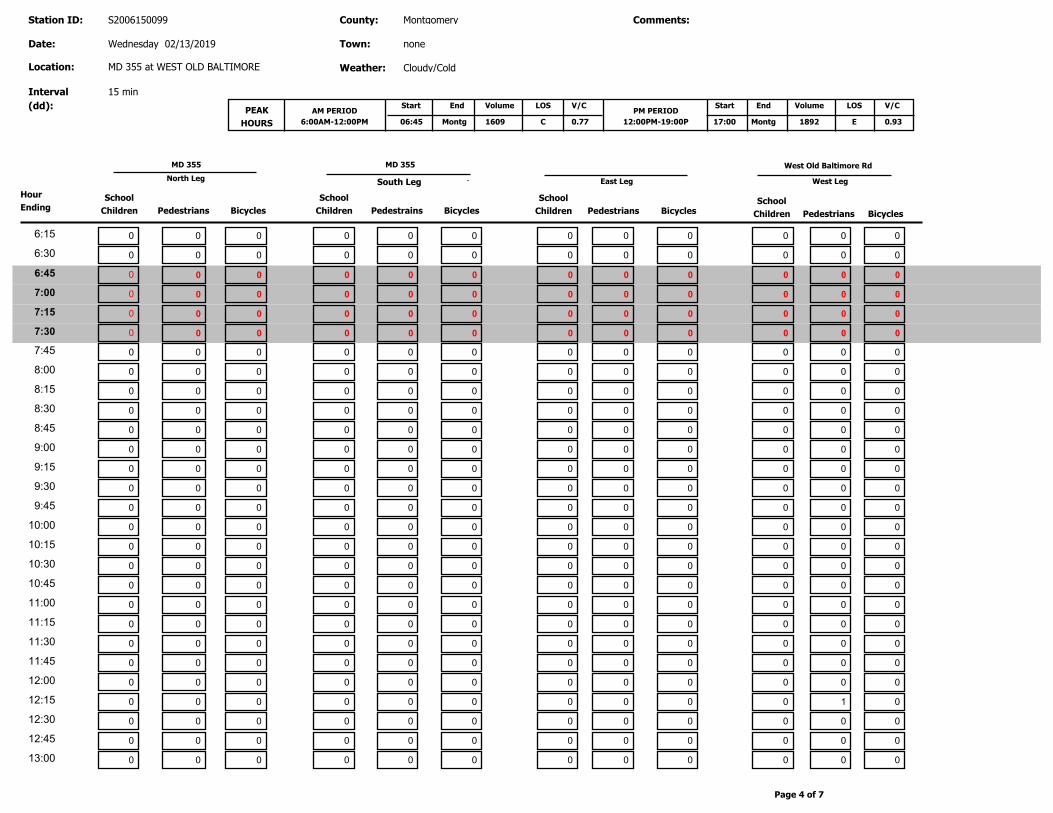
1609
Station ID:
Location:
Interval
(dd): PEAK
HOURS
AM PERIOD
6:00AM-12:00PM
Start End VolumePM PERIOD
12:00PM-19:00P
Start End Volume
MD 355 at WEST OLD BALTIMORE
County:
Town:
Weather:
Montgomery
none
Cloudy/Cold
1892
Comments:
Date: Wednesday 02/13/2019
S2006150099
15 min
06:45 Montg 17:00 MontgC
LOS LOS V/CV/C
0.77 E 0.93
PedestriansPedestrians BicyclesPedestrainsBicyclesPedestrians
Hour
Ending
North Leg South Leg East Leg West Leg
MD 355 MD 355 West Old Baltimore Rd
School
Children
School
Children
School
ChildrenBicycles Bicycles
School
Children
0 6:15 0 0 0 0 0 0 0 0 0 0 0
0 6:30 0 0 0 0 0 0 0 0 0 0 0
0 6:45 0 0 0 0 0 0 0 0 0 0 0
0 7:00 0 0 0 0 0 0 0 0 0 0 0
0 7:15 0 0 0 0 0 0 0 0 0 0 0
0 7:30 0 0 0 0 0 0 0 0 0 0 0
0 7:45 0 0 0 0 0 0 0 0 0 0 0
0 8:00 0 0 0 0 0 0 0 0 0 0 0
0 8:15 0 0 0 0 0 0 0 0 0 0 0
0 8:30 0 0 0 0 0 0 0 0 0 0 0
0 8:45 0 0 0 0 0 0 0 0 0 0 0
0 9:00 0 0 0 0 0 0 0 0 0 0 0
0 9:15 0 0 0 0 0 0 0 0 0 0 0
0 9:30 0 0 0 0 0 0 0 0 0 0 0
0 9:45 0 0 0 0 0 0 0 0 0 0 0
0 10:00 0 0 0 0 0 0 0 0 0 0 0
0 10:15 0 0 0 0 0 0 0 0 0 0 0
0 10:30 0 0 0 0 0 0 0 0 0 0 0
0 10:45 0 0 0 0 0 0 0 0 0 0 0
0 11:00 0 0 0 0 0 0 0 0 0 0 0
0 11:15 0 0 0 0 0 0 0 0 0 0 0
0 11:30 0 0 0 0 0 0 0 0 0 0 0
0 11:45 0 0 0 0 0 0 0 0 0 0 0
0 12:00 0 0 0 0 0 0 0 0 0 0 0
0 12:15 0 0 0 0 0 0 0 0 0 1 0
0 12:30 0 0 0 0 0 0 0 0 0 0 0
0 12:45 0 0 0 0 0 0 0 0 0 0 0
0 13:00 0 0 0 0 0 0 0 0 0 0 0
Page 4 of 7

1609
Station ID:
Location:
Interval
(dd): PEAK
HOURS
AM PERIOD
6:00AM-12:00PM
Start End VolumePM PERIOD
12:00PM-19:00P
Start End Volume
MD 355 at WEST OLD BALTIMORE
County:
Town:
Weather:
Montgomery
none
Cloudy/Cold
1892
Comments:
Date: Wednesday 02/13/2019
S2006150099
15 min
06:45 Montg 17:00 MontgC
LOS LOS V/CV/C
0.77 E 0.93
0 13:15 0 0 0 0 0 0 0 0 0 0 0
0 13:30 0 0 0 0 0 0 0 0 0 0 0
0 13:45 0 0 0 0 0 0 0 0 0 0 0
0 14:00 0 0 0 0 0 0 0 0 0 0 0
0 14:15 0 0 0 0 0 0 0 0 0 0 0
0 14:30 0 0 0 0 0 0 0 0 0 0 0
0 14:45 0 0 0 0 0 0 0 0 0 0 0
0 15:00 0 0 0 0 0 0 0 0 0 0 0
0 15:15 0 0 0 0 0 0 0 0 0 0 0
0 15:30 0 0 0 0 0 0 0 0 0 0 0
0 15:45 0 0 0 0 0 0 0 0 0 0 0
0 16:00 0 0 0 0 0 0 0 0 0 0 0
0 16:15 0 0 0 0 0 0 0 0 0 0 0
0 16:30 0 0 0 0 0 0 0 0 0 0 0
0 16:45 0 0 0 0 0 0 0 0 0 0 0
0 17:00 0 0 0 0 0 0 0 0 0 0 0
0 17:15 0 0 0 0 0 0 0 0 0 0 0
0 17:30 0 0 0 0 0 0 0 0 0 0 0
0 17:45 0 0 0 0 0 0 0 0 0 0 0
0 18:00 0 0 0 0 0 0 0 0 0 0 0
0 18:15 0 0 0 0 0 0 0 0 0 0 0
0 18:30 0 0 0 0 0 0 0 0 0 0 0
0 18:45 0 0 0 0 0 0 0 0 0 0 0
0 19:00 0 0 0 0 0 0 0 0 0 0 0
0
0
0
0
0
0
Total:
AM Pe 0 0 0
0 0 0
0
0
0
0
0
0
0
0
0
0
0
0
0 0 0 0 0 0 0 0 1 0 0 0
PM Pe
Page 5 of 7

1609
Station ID:
Location:
Interval
(dd): PEAK
HOURS
AM PERIOD
6:00AM-12:00PM
Start End VolumePM PERIOD
12:00PM-19:00P
Start End Volume
MD 355 at WEST OLD BALTIMORE
County:
Town:
Weather:
Montgomery
none
Cloudy/Cold
1892
Comments:
Date: Wednesday 02/13/2019
S2006150099
15 min
06:45 Montg 17:00 MontgC
LOS LOS V/CV/C
0.77 E 0.93
R T L U
U
L
T
R
R
T
L
U
RTLU
0 1063 7
373 0 21
0
0 14
0
131
1070 387
1457
0
0
394 1194
1588
145
28
173
0
LEG 1
MD 355
LE
G 3
LEG 2
MD 355
LE
G 4
We
st O
ld
Ba
ltimo
re R
d
0 21
152 0
Quadrant Quadrant
QuadrantQuadrant
0
AM Peak Hour
16256
0 8026 151
R T L U
MD 355
LEG 1
8178 8078
1023 7898 0
U L T R
MD 355
LEG 2
8921 9235
18156
0
0
0
0 R
T
L
U
LE
G 3
0
0 179
0
1209
U
L
T
R
We
st O
ld
Ba
ltimo
re R
d
LE
G 4
1174
1388
2562
1 330
0 2232
Quadrant Quadrant
QuadrantQuadrant
Turning Movement Summary
1
0
0
0
0
0
0
0
Page 6 of 7

1609
Station ID:
Location:
Interval
(dd): PEAK
HOURS
AM PERIOD
6:00AM-12:00PM
Start End VolumePM PERIOD
12:00PM-19:00P
Start End Volume
MD 355 at WEST OLD BALTIMORE
County:
Town:
Weather:
Montgomery
none
Cloudy/Cold
1892
Comments:
Date: Wednesday 02/13/2019
S2006150099
15 min
06:45 Montg 17:00 MontgC
LOS LOS V/CV/C
0.77 E 0.93
1638
0 16 560
167 0 1035
0
0
0
27
0
87
R T L U
LEG 1
MD 355
U L T R
R
T
L
U
U
L
T
R
We
st O
ld
Ba
ltimo
re R
d
LE
G 4
576 1062
0
0
0
183
114
297
647 1202
1849
LEG 2
MD 355
LE
G 3
Quadrant
QuadrantQuadrant
Quadrant 0
0
43
254
PM Peak Hour
0
0
0
0
Page 7 of 7

Maryland Department of Transportation
State Highway Administration Data Services Engineering Division
Turning Movement Count Study - Field Sheet
1682
Station ID:
Location:
Interval
(dd): PEAK
HOURS
AM PERIOD
6:00AM-12:00PM
Start End VolumePM PERIOD
12:00PM-19:00P
Start End Volume
MD 355 at CANTERFIELD WAY/ROS
County:
Town:
Weather:
Montgomery
none
Cloudy/Cold
1737
Comments:
Date: Tuesday 03/05/2019
S2014150398
15 min
07:15 08:15 17:00 18:00B
LOS LOS V/CV/C
0.70 B 0.67
From SouthHour
EndingFrom North
TOTAL TOTAL TOTAL TOTAL
From East From WestLeft Through RightLeft Throug
h
RIGHTLeft Throug
h
RightLeft RightThrough
MD 355 MD 355 CANTERFIELD WAY ROSECREST DR
Grand
TotalU.Tur
n
U.Turn U.Turn U.Turn
0 11 0 0:15 11 12 1 0 12 0 0 0 0 1 0 0 24 0 0 0 0 0
0 9 0 0:30 9 14 0 3 10 1 0 0 1 0 0 0 24 0 0 0 0 1
0 4 0 0:45 4 7 0 0 7 0 0 0 0 0 0 0 11 0 0 0 0 0
0 3 1 1:00 4 17 2 0 17 0 0 0 0 2 0 0 23 0 0 0 0 0
0 2 0 1:15 2 10 0 0 10 0 0 0 0 0 0 0 12 0 0 0 0 0
0 4 0 1:30 4 7 0 0 7 0 0 0 0 0 0 0 11 0 0 0 0 0
0 1 0 1:45 1 8 1 0 8 0 0 0 0 0 0 1 10 0 0 0 0 0
0 3 0 2:00 3 3 0 1 2 0 0 0 0 0 0 0 6 0 0 0 0 0
0 1 0 2:15 1 3 0 0 3 0 0 0 0 0 0 0 4 0 0 0 0 0
0 3 0 2:30 3 1 0 0 1 0 0 0 0 0 0 0 4 0 0 0 0 0
0 4 0 2:45 4 4 0 0 4 0 0 0 0 0 0 0 8 0 0 0 0 0
0 5 1 3:00 6 5 1 0 5 0 0 0 0 0 1 0 12 0 0 0 0 0
0 2 0 3:15 2 3 0 0 3 0 0 0 0 0 0 0 5 0 0 0 0 0
0 2 0 3:30 2 3 0 0 3 0 0 0 0 0 0 0 5 0 0 0 0 0
0 4 0 3:45 4 4 0 0 4 0 0 0 0 0 0 0 8 0 0 0 0 0
0 11 0 4:00 11 4 1 0 4 0 0 0 0 0 0 1 16 0 0 0 0 0
0 8 0 4:15 8 4 0 0 4 0 0 0 0 0 0 0 12 0 0 0 0 0
0 12 0 4:30 12 6 1 0 6 0 1 0 0 0 0 1 20 0 0 0 0 1
0 23 0 4:45 23 8 1 0 8 0 1 0 0 0 0 1 33 0 0 0 0 1
0 32 0 5:00 32 11 1 0 11 0 0 0 1 0 0 1 45 0 0 0 0 1
Page 1 of 11
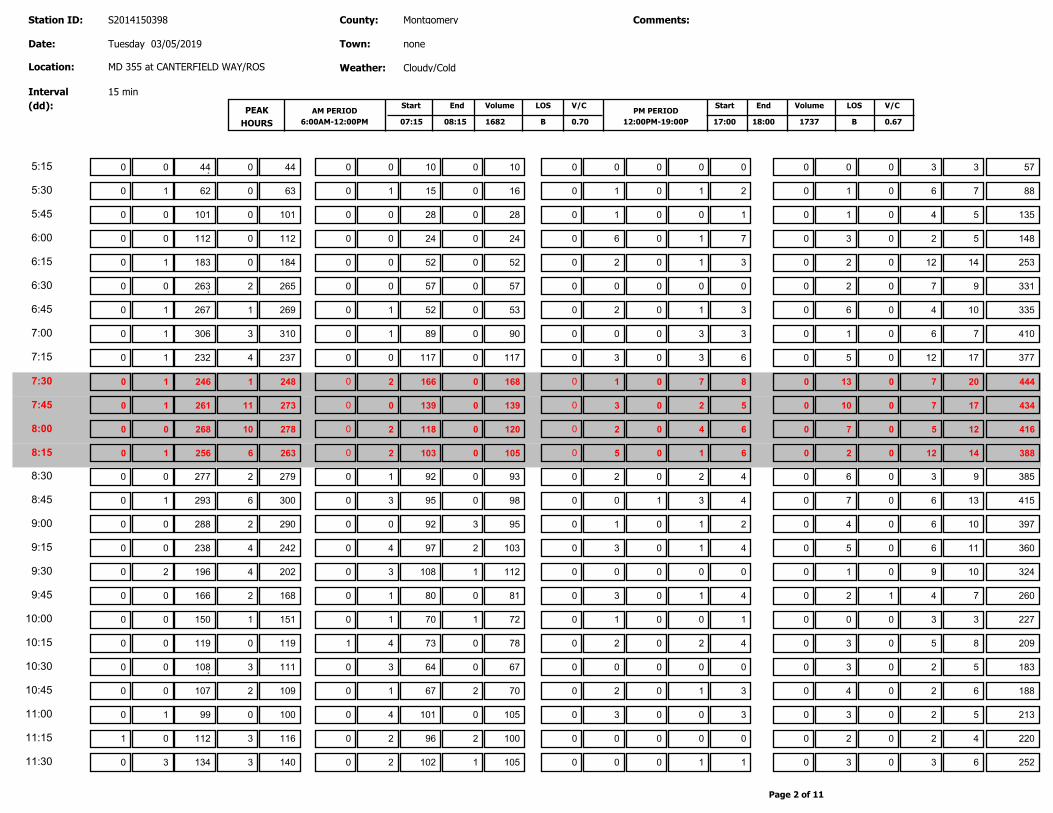
1682
Station ID:
Location:
Interval
(dd): PEAK
HOURS
AM PERIOD
6:00AM-12:00PM
Start End VolumePM PERIOD
12:00PM-19:00P
Start End Volume
MD 355 at CANTERFIELD WAY/ROS
County:
Town:
Weather:
Montgomery
none
Cloudy/Cold
1737
Comments:
Date: Tuesday 03/05/2019
S2014150398
15 min
07:15 08:15 17:00 18:00B
LOS LOS V/CV/C
0.70 B 0.67
0 44 0 5:15 44 10 3 0 10 0 0 0 0 0 0 3 57 0 0 0 0 0
1 62 0 5:30 63 16 7 1 15 0 1 0 1 1 0 6 88 0 0 0 0 2
0 101 0 5:45 101 28 5 0 28 0 1 0 0 1 0 4 135 0 0 0 0 1
0 112 0 6:00 112 24 5 0 24 0 6 0 1 3 0 2 148 0 0 0 0 7
1 183 0 6:15 184 52 14 0 52 0 2 0 1 2 0 12 253 0 0 0 0 3
0 263 2 6:30 265 57 9 0 57 0 0 0 0 2 0 7 331 0 0 0 0 0
1 267 1 6:45 269 53 10 1 52 0 2 0 1 6 0 4 335 0 0 0 0 3
1 306 3 7:00 310 90 7 1 89 0 0 0 3 1 0 6 410 0 0 0 0 3
1 232 4 7:15 237 117 17 0 117 0 3 0 3 5 0 12 377 0 0 0 0 6
1 246 1 7:30 248 168 20 2 166 0 1 0 7 13 0 7 444 0 0 0 0 8
1 261 11 7:45 273 139 17 0 139 0 3 0 2 10 0 7 434 0 0 0 0 5
0 268 10 8:00 278 120 12 2 118 0 2 0 4 7 0 5 416 0 0 0 0 6
1 256 6 8:15 263 105 14 2 103 0 5 0 1 2 0 12 388 0 0 0 0 6
0 277 2 8:30 279 93 9 1 92 0 2 0 2 6 0 3 385 0 0 0 0 4
1 293 6 8:45 300 98 13 3 95 0 0 1 3 7 0 6 415 0 0 0 0 4
0 288 2 9:00 290 95 10 0 92 3 1 0 1 4 0 6 397 0 0 0 0 2
0 238 4 9:15 242 103 11 4 97 2 3 0 1 5 0 6 360 0 0 0 0 4
2 196 4 9:30 202 112 10 3 108 1 0 0 0 1 0 9 324 0 0 0 0 0
0 166 2 9:45 168 81 7 1 80 0 3 0 1 2 1 4 260 0 0 0 0 4
0 150 1 10:00 151 72 3 1 70 1 1 0 0 0 0 3 227 0 0 0 0 1
0 119 0 10:15 119 78 8 4 73 0 2 0 2 3 0 5 209 0 1 0 0 4
0 108 3 10:30 111 67 5 3 64 0 0 0 0 3 0 2 183 0 0 0 0 0
0 107 2 10:45 109 70 6 1 67 2 2 0 1 4 0 2 188 0 0 0 0 3
1 99 0 11:00 100 105 5 4 101 0 3 0 0 3 0 2 213 0 0 0 0 3
0 112 3 11:15 116 100 4 2 96 2 0 0 0 2 0 2 220 1 0 0 0 0
3 134 3 11:30 140 105 6 2 102 1 0 0 1 3 0 3 252 0 0 0 0 1
Page 2 of 11
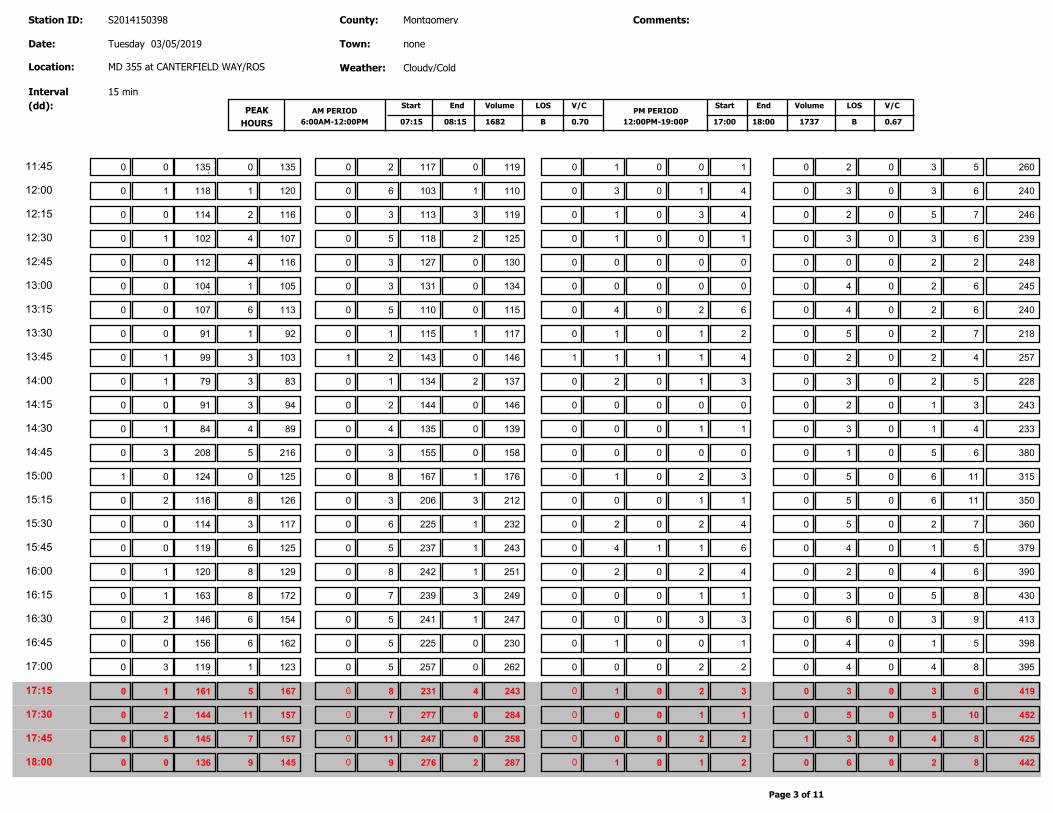
1682
Station ID:
Location:
Interval
(dd): PEAK
HOURS
AM PERIOD
6:00AM-12:00PM
Start End VolumePM PERIOD
12:00PM-19:00P
Start End Volume
MD 355 at CANTERFIELD WAY/ROS
County:
Town:
Weather:
Montgomery
none
Cloudy/Cold
1737
Comments:
Date: Tuesday 03/05/2019
S2014150398
15 min
07:15 08:15 17:00 18:00B
LOS LOS V/CV/C
0.70 B 0.67
0 135 0 11:45 135 119 5 2 117 0 1 0 0 2 0 3 260 0 0 0 0 1
1 118 1 12:00 120 110 6 6 103 1 3 0 1 3 0 3 240 0 0 0 0 4
0 114 2 12:15 116 119 7 3 113 3 1 0 3 2 0 5 246 0 0 0 0 4
1 102 4 12:30 107 125 6 5 118 2 1 0 0 3 0 3 239 0 0 0 0 1
0 112 4 12:45 116 130 2 3 127 0 0 0 0 0 0 2 248 0 0 0 0 0
0 104 1 13:00 105 134 6 3 131 0 0 0 0 4 0 2 245 0 0 0 0 0
0 107 6 13:15 113 115 6 5 110 0 4 0 2 4 0 2 240 0 0 0 0 6
0 91 1 13:30 92 117 7 1 115 1 1 0 1 5 0 2 218 0 0 0 0 2
1 99 3 13:45 103 146 4 2 143 0 1 1 1 2 0 2 257 0 1 1 0 4
1 79 3 14:00 83 137 5 1 134 2 2 0 1 3 0 2 228 0 0 0 0 3
0 91 3 14:15 94 146 3 2 144 0 0 0 0 2 0 1 243 0 0 0 0 0
1 84 4 14:30 89 139 4 4 135 0 0 0 1 3 0 1 233 0 0 0 0 1
3 208 5 14:45 216 158 6 3 155 0 0 0 0 1 0 5 380 0 0 0 0 0
0 124 0 15:00 125 176 11 8 167 1 1 0 2 5 0 6 315 1 0 0 0 3
2 116 8 15:15 126 212 11 3 206 3 0 0 1 5 0 6 350 0 0 0 0 1
0 114 3 15:30 117 232 7 6 225 1 2 0 2 5 0 2 360 0 0 0 0 4
0 119 6 15:45 125 243 5 5 237 1 4 1 1 4 0 1 379 0 0 0 0 6
1 120 8 16:00 129 251 6 8 242 1 2 0 2 2 0 4 390 0 0 0 0 4
1 163 8 16:15 172 249 8 7 239 3 0 0 1 3 0 5 430 0 0 0 0 1
2 146 6 16:30 154 247 9 5 241 1 0 0 3 6 0 3 413 0 0 0 0 3
0 156 6 16:45 162 230 5 5 225 0 1 0 0 4 0 1 398 0 0 0 0 1
3 119 1 17:00 123 262 8 5 257 0 0 0 2 4 0 4 395 0 0 0 0 2
1 161 5 17:15 167 243 6 8 231 4 1 0 2 3 0 3 419 0 0 0 0 3
2 144 11 17:30 157 284 10 7 277 0 0 0 1 5 0 5 452 0 0 0 0 1
5 145 7 17:45 157 258 8 11 247 0 0 0 2 3 0 4 425 0 0 0 1 2
0 136 9 18:00 145 287 8 9 276 2 1 0 1 6 0 2 442 0 0 0 0 2
Page 3 of 11
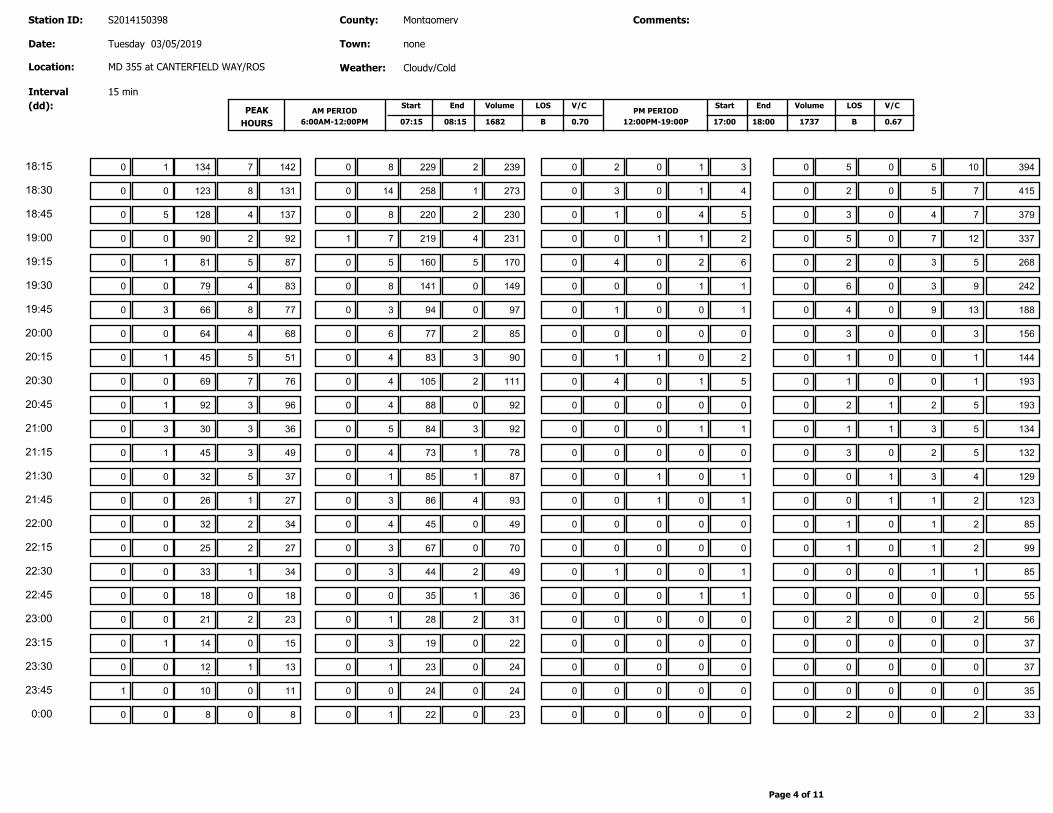
1682
Station ID:
Location:
Interval
(dd): PEAK
HOURS
AM PERIOD
6:00AM-12:00PM
Start End VolumePM PERIOD
12:00PM-19:00P
Start End Volume
MD 355 at CANTERFIELD WAY/ROS
County:
Town:
Weather:
Montgomery
none
Cloudy/Cold
1737
Comments:
Date: Tuesday 03/05/2019
S2014150398
15 min
07:15 08:15 17:00 18:00B
LOS LOS V/CV/C
0.70 B 0.67
1 134 7 18:15 142 239 10 8 229 2 2 0 1 5 0 5 394 0 0 0 0 3
0 123 8 18:30 131 273 7 14 258 1 3 0 1 2 0 5 415 0 0 0 0 4
5 128 4 18:45 137 230 7 8 220 2 1 0 4 3 0 4 379 0 0 0 0 5
0 90 2 19:00 92 231 12 7 219 4 0 1 1 5 0 7 337 0 1 0 0 2
1 81 5 19:15 87 170 5 5 160 5 4 0 2 2 0 3 268 0 0 0 0 6
0 79 4 19:30 83 149 9 8 141 0 0 0 1 6 0 3 242 0 0 0 0 1
3 66 8 19:45 77 97 13 3 94 0 1 0 0 4 0 9 188 0 0 0 0 1
0 64 4 20:00 68 85 3 6 77 2 0 0 0 3 0 0 156 0 0 0 0 0
1 45 5 20:15 51 90 1 4 83 3 1 1 0 1 0 0 144 0 0 0 0 2
0 69 7 20:30 76 111 1 4 105 2 4 0 1 1 0 0 193 0 0 0 0 5
1 92 3 20:45 96 92 5 4 88 0 0 0 0 2 1 2 193 0 0 0 0 0
3 30 3 21:00 36 92 5 5 84 3 0 0 1 1 1 3 134 0 0 0 0 1
1 45 3 21:15 49 78 5 4 73 1 0 0 0 3 0 2 132 0 0 0 0 0
0 32 5 21:30 37 87 4 1 85 1 0 1 0 0 1 3 129 0 0 0 0 1
0 26 1 21:45 27 93 2 3 86 4 0 1 0 0 1 1 123 0 0 0 0 1
0 32 2 22:00 34 49 2 4 45 0 0 0 0 1 0 1 85 0 0 0 0 0
0 25 2 22:15 27 70 2 3 67 0 0 0 0 1 0 1 99 0 0 0 0 0
0 33 1 22:30 34 49 1 3 44 2 1 0 0 0 0 1 85 0 0 0 0 1
0 18 0 22:45 18 36 0 0 35 1 0 0 1 0 0 0 55 0 0 0 0 1
0 21 2 23:00 23 31 2 1 28 2 0 0 0 2 0 0 56 0 0 0 0 0
1 14 0 23:15 15 22 0 3 19 0 0 0 0 0 0 0 37 0 0 0 0 0
0 12 1 23:30 13 24 0 1 23 0 0 0 0 0 0 0 37 0 0 0 0 0
0 10 0 23:45 11 24 0 0 24 0 0 0 0 0 0 0 35 1 0 0 0 0
0 8 0 0:00 8 23 2 1 22 0 0 0 0 2 0 0 33 0 0 0 0 0
Page 4 of 11

1682
Station ID:
Location:
Interval
(dd): PEAK
HOURS
AM PERIOD
6:00AM-12:00PM
Start End VolumePM PERIOD
12:00PM-19:00P
Start End Volume
MD 355 at CANTERFIELD WAY/ROS
County:
Town:
Weather:
Montgomery
none
Cloudy/Cold
1737
Comments:
Date: Wednesday 03/06/2019
S2014150398
15 min
07:15 08:15 17:00 18:00B
LOS LOS V/CV/C
0.70 B 0.67
3
8 586
1031 28
32
TOTAL:
1062
626
AM Peak:
PM Peak:
532
1072
6 0
35 1031 6
11 0
2 0 6
32 0 31
17 0 14
25
8
63
31 1737
1682 14
57 9516 264 9840 269 9260 74 9606 88 7 81 177 232 6 274 513 20136 3
0
1
0
0
1
1
0
0
3
0
0
526
Page 5 of 11

1682
Station ID:
Location:
Interval
(dd): PEAK
HOURS
AM PERIOD
6:00AM-12:00PM
Start End VolumePM PERIOD
12:00PM-19:00P
Start End Volume
MD 355 at CANTERFIELD WAY/ROS
County:
Town:
Weather:
Montgomery
none
Cloudy/Cold
1737
Comments:
Date: Wednesday 03/06/2019
S2014150398
15 min
07:15 08:15 17:00 18:00B
LOS LOS V/CV/C
0.70 B 0.67
PedestriansPedestrians BicyclesPedestrainsBicyclesPedestrians
Hour
Ending
North Leg South Leg East Leg West Leg
MD 355 MD 355 CANTERFIELD WAY ROSECREST DR
School
Children
School
Children
School
ChildrenBicycles Bicycles
School
Children
0 0:15 0 0 0 0 0 0 0 0 0 0 0
0 0:30 0 0 0 0 0 0 0 0 0 0 0
0 0:45 0 0 0 0 0 0 0 0 0 0 0
0 1:00 0 0 0 0 0 0 0 0 0 0 0
0 1:15 0 0 0 0 0 0 0 0 0 0 0
0 1:30 0 0 0 0 0 0 0 0 0 0 0
0 1:45 0 0 0 0 0 0 0 0 0 0 0
0 2:00 0 0 0 0 0 0 0 0 0 0 0
0 2:15 0 0 0 0 0 0 0 0 0 0 0
0 2:30 0 0 0 0 0 0 0 0 0 0 0
0 2:45 0 0 0 0 0 0 0 0 0 0 0
0 3:00 0 0 0 0 0 0 0 0 0 0 0
0 3:15 0 0 0 0 0 0 0 0 0 0 0
0 3:30 0 0 0 0 0 0 0 0 0 0 0
0 3:45 0 0 0 0 0 0 0 0 0 0 0
0 4:00 0 0 0 0 0 0 0 0 0 0 0
0 4:15 0 0 0 0 0 0 0 0 0 0 0
0 4:30 0 0 0 0 0 0 0 0 0 0 0
0 4:45 0 0 0 0 0 0 0 0 0 0 0
0 5:00 0 0 0 0 0 0 0 0 0 0 0
0 5:15 0 0 0 0 0 0 0 0 0 0 0
0 5:30 0 0 0 0 0 0 0 0 0 0 0
0 5:45 0 0 0 0 0 0 0 0 0 0 0
0 6:00 0 0 0 0 0 0 0 0 0 0 0
0 6:15 0 0 0 0 0 0 0 0 0 0 0
0 6:30 0 0 0 0 0 0 0 0 0 0 0
0 6:45 0 0 0 0 0 0 0 0 0 0 0
0 7:00 0 0 0 0 0 0 0 0 0 0 0
Page 6 of 11
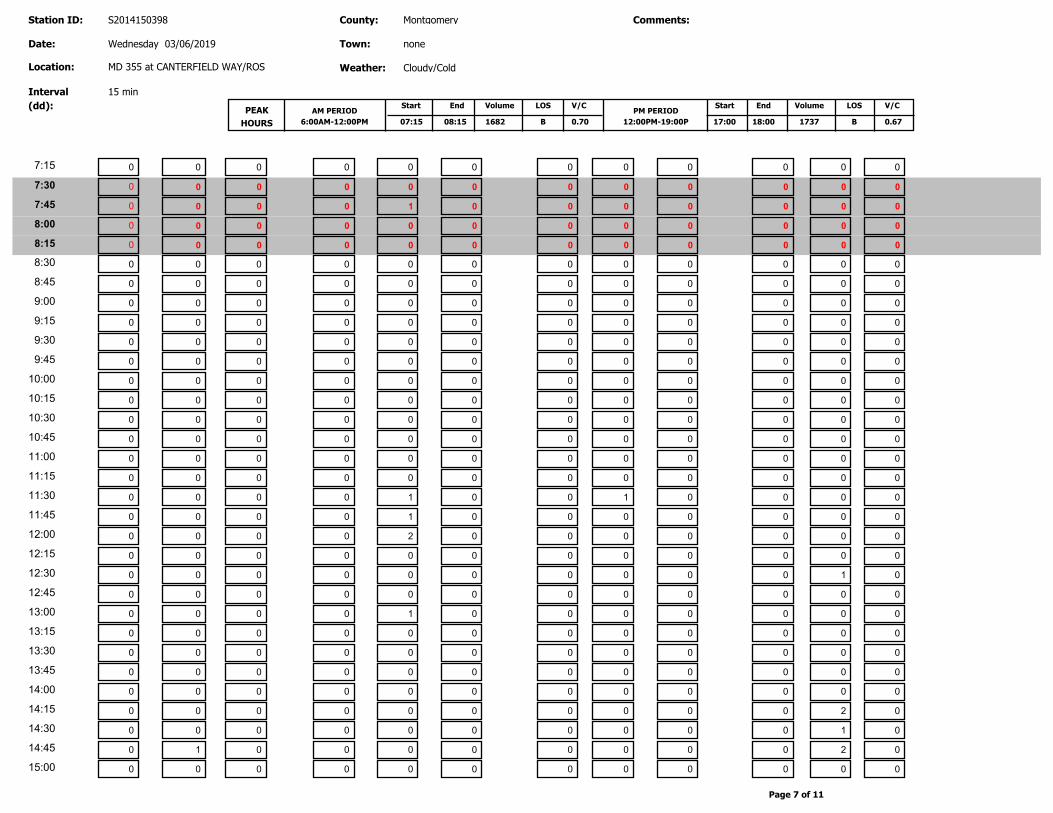
1682
Station ID:
Location:
Interval
(dd): PEAK
HOURS
AM PERIOD
6:00AM-12:00PM
Start End VolumePM PERIOD
12:00PM-19:00P
Start End Volume
MD 355 at CANTERFIELD WAY/ROS
County:
Town:
Weather:
Montgomery
none
Cloudy/Cold
1737
Comments:
Date: Wednesday 03/06/2019
S2014150398
15 min
07:15 08:15 17:00 18:00B
LOS LOS V/CV/C
0.70 B 0.67
0 7:15 0 0 0 0 0 0 0 0 0 0 0
0 7:30 0 0 0 0 0 0 0 0 0 0 0
0 7:45 0 1 0 0 0 0 0 0 0 0 0
0 8:00 0 0 0 0 0 0 0 0 0 0 0
0 8:15 0 0 0 0 0 0 0 0 0 0 0
0 8:30 0 0 0 0 0 0 0 0 0 0 0
0 8:45 0 0 0 0 0 0 0 0 0 0 0
0 9:00 0 0 0 0 0 0 0 0 0 0 0
0 9:15 0 0 0 0 0 0 0 0 0 0 0
0 9:30 0 0 0 0 0 0 0 0 0 0 0
0 9:45 0 0 0 0 0 0 0 0 0 0 0
0 10:00 0 0 0 0 0 0 0 0 0 0 0
0 10:15 0 0 0 0 0 0 0 0 0 0 0
0 10:30 0 0 0 0 0 0 0 0 0 0 0
0 10:45 0 0 0 0 0 0 0 0 0 0 0
0 11:00 0 0 0 0 0 0 0 0 0 0 0
0 11:15 0 0 0 0 0 0 0 0 0 0 0
0 11:30 0 1 0 1 0 0 0 0 0 0 0
0 11:45 0 1 0 0 0 0 0 0 0 0 0
0 12:00 0 2 0 0 0 0 0 0 0 0 0
0 12:15 0 0 0 0 0 0 0 0 0 0 0
0 12:30 0 0 0 0 0 0 0 0 0 1 0
0 12:45 0 0 0 0 0 0 0 0 0 0 0
0 13:00 0 1 0 0 0 0 0 0 0 0 0
0 13:15 0 0 0 0 0 0 0 0 0 0 0
0 13:30 0 0 0 0 0 0 0 0 0 0 0
0 13:45 0 0 0 0 0 0 0 0 0 0 0
0 14:00 0 0 0 0 0 0 0 0 0 0 0
0 14:15 0 0 0 0 0 0 0 0 0 2 0
0 14:30 0 0 0 0 0 0 0 0 0 1 0
1 14:45 0 0 0 0 0 0 0 0 0 2 0
0 15:00 0 0 0 0 0 0 0 0 0 0 0
Page 7 of 11

1682
Station ID:
Location:
Interval
(dd): PEAK
HOURS
AM PERIOD
6:00AM-12:00PM
Start End VolumePM PERIOD
12:00PM-19:00P
Start End Volume
MD 355 at CANTERFIELD WAY/ROS
County:
Town:
Weather:
Montgomery
none
Cloudy/Cold
1737
Comments:
Date: Wednesday 03/06/2019
S2014150398
15 min
07:15 08:15 17:00 18:00B
LOS LOS V/CV/C
0.70 B 0.67
0 15:15 0 0 0 0 0 0 0 0 0 0 0
0 15:30 0 0 0 0 0 0 0 0 0 0 0
0 15:45 0 0 0 0 0 0 0 0 0 0 0
0 16:00 0 0 0 0 0 0 0 0 0 0 0
0 16:15 0 0 0 0 0 0 0 0 0 0 0
0 16:30 0 0 0 0 0 0 0 0 0 0 0
0 16:45 0 0 0 0 0 0 0 0 0 0 0
0 17:00 0 0 0 0 0 0 0 0 0 0 0
0 17:15 0 0 0 0 0 0 0 0 0 0 0
0 17:30 0 0 0 0 0 0 0 0 0 0 0
0 17:45 0 0 0 0 0 0 0 0 0 0 0
0 18:00 0 0 0 0 0 0 0 0 0 0 0
0 18:15 0 0 0 0 0 0 0 0 0 0 0
0 18:30 0 0 0 0 0 0 0 0 0 0 0
0 18:45 0 0 0 0 0 0 0 0 0 0 0
0 19:00 0 0 0 0 0 0 0 0 0 0 0
0 19:15 0 0 0 0 0 0 0 0 0 0 0
0 19:30 0 0 0 0 0 0 0 0 0 0 0
0 19:45 0 0 0 0 0 0 0 0 0 0 0
0 20:00 0 0 0 0 0 0 0 0 0 0 0
0 20:15 0 0 0 0 0 0 0 0 0 0 0
0 20:30 0 0 0 0 0 0 0 0 0 0 0
0 20:45 0 0 0 0 0 0 0 0 0 0 0
0 21:00 0 0 0 0 0 0 0 0 0 0 0
0 21:15 0 0 0 0 0 0 0 0 0 0 0
0 21:30 0 0 0 0 0 0 0 0 0 0 0
0 21:45 0 0 0 0 0 0 0 0 0 0 0
0 22:00 0 0 0 0 0 0 0 0 0 0 0
0 22:15 0 0 0 0 0 0 0 0 0 0 0
0 22:30 0 0 0 0 0 0 0 0 0 0 0
0 22:45 0 0 0 0 0 0 0 0 0 0 0
0 23:00 0 0 0 0 0 0 0 0 0 0 0
Page 8 of 11
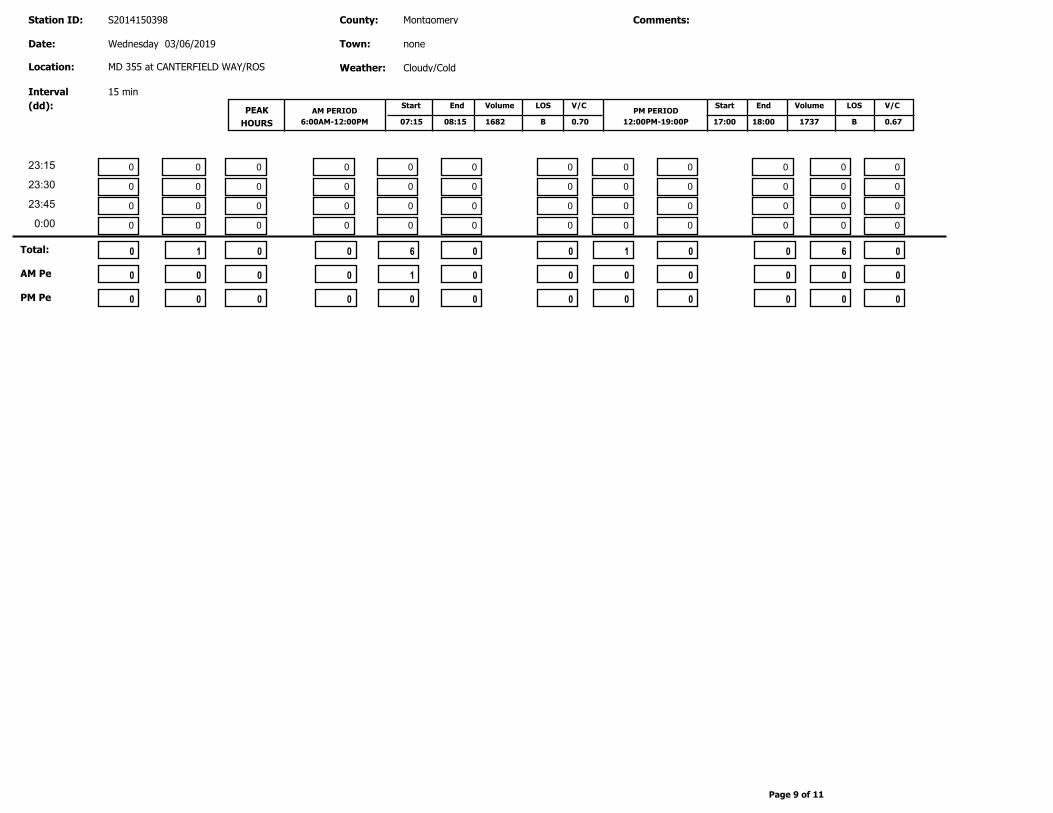
1682
Station ID:
Location:
Interval
(dd): PEAK
HOURS
AM PERIOD
6:00AM-12:00PM
Start End VolumePM PERIOD
12:00PM-19:00P
Start End Volume
MD 355 at CANTERFIELD WAY/ROS
County:
Town:
Weather:
Montgomery
none
Cloudy/Cold
1737
Comments:
Date: Wednesday 03/06/2019
S2014150398
15 min
07:15 08:15 17:00 18:00B
LOS LOS V/CV/C
0.70 B 0.67
0 23:15 0 0 0 0 0 0 0 0 0 0 0
0 23:30 0 0 0 0 0 0 0 0 0 0 0
0 23:45 0 0 0 0 0 0 0 0 0 0 0
0 0:00 0 0 0 0 0 0 0 0 0 0 0
0
0
0
0
0
0
Total:
AM Pe 0 1 0
0 0 0
0
0
0
0
0
0
0
0
0
0
0
0
0 0 1 0 6 0 1 0 6 0 0 0
PM Pe
Page 9 of 11

1682
Station ID:
Location:
Interval
(dd): PEAK
HOURS
AM PERIOD
6:00AM-12:00PM
Start End VolumePM PERIOD
12:00PM-19:00P
Start End Volume
MD 355 at CANTERFIELD WAY/ROS
County:
Town:
Weather:
Montgomery
none
Cloudy/Cold
1737
Comments:
Date: Wednesday 03/06/2019
S2014150398
15 min
07:15 08:15 17:00 18:00B
LOS LOS V/CV/C
0.70 B 0.67
R T L U
U
L
T
R
R
T
L
U
RTLU
3 1031 28
526 0 6
11
0 32
0
31
1062 572
1634
25
28
532 1073
1605
63
34
97
14
LEG 1
MD 355
LE
G 3
CA
NT
ER
FIE
LD
WA
Y
LEG 2
MD 355
LE
G 4
RO
SE
CR
ES
T D
R
17 60
37 11
Quadrant Quadrant
QuadrantQuadrant
3
AM Peak Hour
19416
57 9516 264
R T L U
MD 355
LEG 1
9840 9576
269 9260 74
U L T R
MD 355
LEG 2
9606 9881
19487
177
88
7
81 R
T
L
U
CA
NT
ER
FIE
LD
WA
Y
LE
G 3
138
315 232
6
274
U
L
T
R
RO
SE
CR
ES
T D
R
LE
G 4
541
513
1054
141 497
163 546
Quadrant Quadrant
QuadrantQuadrant
Turning Movement Summary
3
3
1
1
0
0
0
0
Page 10 of 11

1682
Station ID:
Location:
Interval
(dd): PEAK
HOURS
AM PERIOD
6:00AM-12:00PM
Start End VolumePM PERIOD
12:00PM-19:00P
Start End Volume
MD 355 at CANTERFIELD WAY/ROS
County:
Town:
Weather:
Montgomery
none
Cloudy/Cold
1737
Comments:
Date: Wednesday 03/06/2019
S2014150398
15 min
07:15 08:15 17:00 18:00B
LOS LOS V/CV/C
0.70 B 0.67
1680
8 32 586
35 6 1031
2
0
6
17
0
14
R T L U
LEG 1
MD 355
U L T R
R
T
L
U
U
L
T
R
RO
SE
CR
ES
T D
R
LE
G 4
626 1054
8
14
22
68
32
100
602 1072
1674
LEG 2
MD 355
LE
G 3
CA
NT
ER
FIE
LD
WA
Y
Quadrant
QuadrantQuadrant
Quadrant 14
8
50
49
PM Peak Hour
0
0
1
0
Page 11 of 11
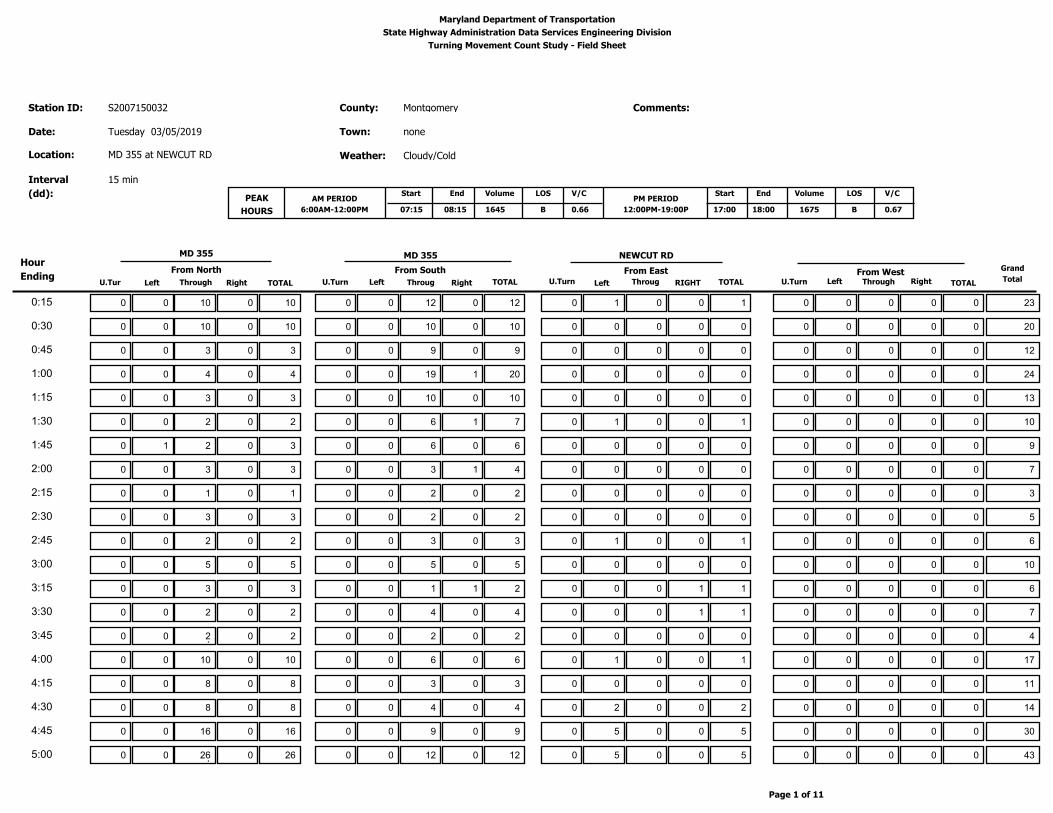
Maryland Department of Transportation
State Highway Administration Data Services Engineering Division
Turning Movement Count Study - Field Sheet
1645
Station ID:
Location:
Interval
(dd): PEAK
HOURS
AM PERIOD
6:00AM-12:00PM
Start End VolumePM PERIOD
12:00PM-19:00P
Start End Volume
MD 355 at NEWCUT RD
County:
Town:
Weather:
Montgomery
none
Cloudy/Cold
1675
Comments:
Date: Tuesday 03/05/2019
S2007150032
15 min
07:15 08:15 17:00 18:00B
LOS LOS V/CV/C
0.66 B 0.67
From SouthHour
EndingFrom North
TOTAL TOTAL TOTAL TOTAL
From East From WestLeft Through RightLeft Throug
h
RIGHTLeft Throug
h
RightLeft RightThrough
MD 355 MD 355 NEWCUT RD
Grand
TotalU.Tur
n
U.Turn U.Turn U.Turn
0 10 0 0:15 10 12 0 0 12 0 1 0 0 0 0 0 23 0 0 0 0 1
0 10 0 0:30 10 10 0 0 10 0 0 0 0 0 0 0 20 0 0 0 0 0
0 3 0 0:45 3 9 0 0 9 0 0 0 0 0 0 0 12 0 0 0 0 0
0 4 0 1:00 4 20 0 0 19 1 0 0 0 0 0 0 24 0 0 0 0 0
0 3 0 1:15 3 10 0 0 10 0 0 0 0 0 0 0 13 0 0 0 0 0
0 2 0 1:30 2 7 0 0 6 1 1 0 0 0 0 0 10 0 0 0 0 1
1 2 0 1:45 3 6 0 0 6 0 0 0 0 0 0 0 9 0 0 0 0 0
0 3 0 2:00 3 4 0 0 3 1 0 0 0 0 0 0 7 0 0 0 0 0
0 1 0 2:15 1 2 0 0 2 0 0 0 0 0 0 0 3 0 0 0 0 0
0 3 0 2:30 3 2 0 0 2 0 0 0 0 0 0 0 5 0 0 0 0 0
0 2 0 2:45 2 3 0 0 3 0 1 0 0 0 0 0 6 0 0 0 0 1
0 5 0 3:00 5 5 0 0 5 0 0 0 0 0 0 0 10 0 0 0 0 0
0 3 0 3:15 3 2 0 0 1 1 0 0 1 0 0 0 6 0 0 0 0 1
0 2 0 3:30 2 4 0 0 4 0 0 0 1 0 0 0 7 0 0 0 0 1
0 2 0 3:45 2 2 0 0 2 0 0 0 0 0 0 0 4 0 0 0 0 0
0 10 0 4:00 10 6 0 0 6 0 1 0 0 0 0 0 17 0 0 0 0 1
0 8 0 4:15 8 3 0 0 3 0 0 0 0 0 0 0 11 0 0 0 0 0
0 8 0 4:30 8 4 0 0 4 0 2 0 0 0 0 0 14 0 0 0 0 2
0 16 0 4:45 16 9 0 0 9 0 5 0 0 0 0 0 30 0 0 0 0 5
0 26 0 5:00 26 12 0 0 12 0 5 0 0 0 0 0 43 0 0 0 0 5
Page 1 of 11
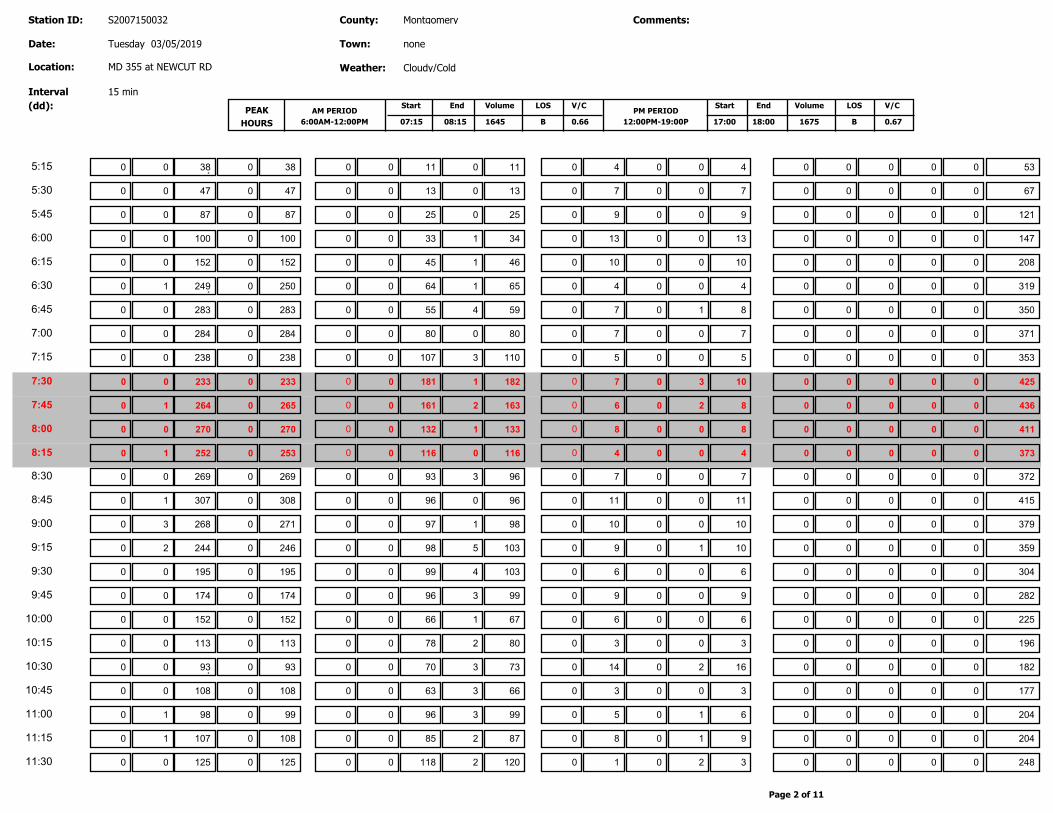
1645
Station ID:
Location:
Interval
(dd): PEAK
HOURS
AM PERIOD
6:00AM-12:00PM
Start End VolumePM PERIOD
12:00PM-19:00P
Start End Volume
MD 355 at NEWCUT RD
County:
Town:
Weather:
Montgomery
none
Cloudy/Cold
1675
Comments:
Date: Tuesday 03/05/2019
S2007150032
15 min
07:15 08:15 17:00 18:00B
LOS LOS V/CV/C
0.66 B 0.67
0 38 0 5:15 38 11 0 0 11 0 4 0 0 0 0 0 53 0 0 0 0 4
0 47 0 5:30 47 13 0 0 13 0 7 0 0 0 0 0 67 0 0 0 0 7
0 87 0 5:45 87 25 0 0 25 0 9 0 0 0 0 0 121 0 0 0 0 9
0 100 0 6:00 100 34 0 0 33 1 13 0 0 0 0 0 147 0 0 0 0 13
0 152 0 6:15 152 46 0 0 45 1 10 0 0 0 0 0 208 0 0 0 0 10
1 249 0 6:30 250 65 0 0 64 1 4 0 0 0 0 0 319 0 0 0 0 4
0 283 0 6:45 283 59 0 0 55 4 7 0 1 0 0 0 350 0 0 0 0 8
0 284 0 7:00 284 80 0 0 80 0 7 0 0 0 0 0 371 0 0 0 0 7
0 238 0 7:15 238 110 0 0 107 3 5 0 0 0 0 0 353 0 0 0 0 5
0 233 0 7:30 233 182 0 0 181 1 7 0 3 0 0 0 425 0 0 0 0 10
1 264 0 7:45 265 163 0 0 161 2 6 0 2 0 0 0 436 0 0 0 0 8
0 270 0 8:00 270 133 0 0 132 1 8 0 0 0 0 0 411 0 0 0 0 8
1 252 0 8:15 253 116 0 0 116 0 4 0 0 0 0 0 373 0 0 0 0 4
0 269 0 8:30 269 96 0 0 93 3 7 0 0 0 0 0 372 0 0 0 0 7
1 307 0 8:45 308 96 0 0 96 0 11 0 0 0 0 0 415 0 0 0 0 11
3 268 0 9:00 271 98 0 0 97 1 10 0 0 0 0 0 379 0 0 0 0 10
2 244 0 9:15 246 103 0 0 98 5 9 0 1 0 0 0 359 0 0 0 0 10
0 195 0 9:30 195 103 0 0 99 4 6 0 0 0 0 0 304 0 0 0 0 6
0 174 0 9:45 174 99 0 0 96 3 9 0 0 0 0 0 282 0 0 0 0 9
0 152 0 10:00 152 67 0 0 66 1 6 0 0 0 0 0 225 0 0 0 0 6
0 113 0 10:15 113 80 0 0 78 2 3 0 0 0 0 0 196 0 0 0 0 3
0 93 0 10:30 93 73 0 0 70 3 14 0 2 0 0 0 182 0 0 0 0 16
0 108 0 10:45 108 66 0 0 63 3 3 0 0 0 0 0 177 0 0 0 0 3
1 98 0 11:00 99 99 0 0 96 3 5 0 1 0 0 0 204 0 0 0 0 6
1 107 0 11:15 108 87 0 0 85 2 8 0 1 0 0 0 204 0 0 0 0 9
0 125 0 11:30 125 120 0 0 118 2 1 0 2 0 0 0 248 0 0 0 0 3
Page 2 of 11

1645
Station ID:
Location:
Interval
(dd): PEAK
HOURS
AM PERIOD
6:00AM-12:00PM
Start End VolumePM PERIOD
12:00PM-19:00P
Start End Volume
MD 355 at NEWCUT RD
County:
Town:
Weather:
Montgomery
none
Cloudy/Cold
1675
Comments:
Date: Tuesday 03/05/2019
S2007150032
15 min
07:15 08:15 17:00 18:00B
LOS LOS V/CV/C
0.66 B 0.67
2 134 0 11:45 136 108 0 0 106 2 5 0 1 0 0 0 250 0 0 0 0 6
2 123 0 12:00 125 116 0 0 113 3 4 0 1 0 0 0 246 0 0 0 0 5
0 116 0 12:15 116 110 0 0 110 0 3 0 1 0 0 0 230 0 0 0 0 4
0 104 0 12:30 104 119 0 0 116 3 3 0 1 0 0 0 227 0 0 0 0 4
1 115 0 12:45 116 132 0 0 130 2 2 0 1 0 0 0 251 0 0 0 0 3
0 108 0 13:00 108 141 0 0 136 5 3 0 0 0 0 0 252 0 0 0 0 3
2 105 0 13:15 107 118 0 0 116 2 4 0 2 0 0 0 231 0 0 0 0 6
0 91 0 13:30 91 124 0 0 120 4 1 0 2 0 0 0 218 0 0 0 0 3
0 96 0 13:45 96 119 0 0 116 3 5 0 1 0 0 0 221 0 0 0 0 6
1 82 0 14:00 83 147 0 0 146 1 6 0 1 0 0 0 237 0 0 0 0 7
2 82 0 14:15 84 138 0 0 137 1 4 0 1 0 0 0 227 0 0 0 0 5
1 88 0 14:30 89 153 0 0 150 3 4 0 1 0 0 0 247 0 0 0 0 5
0 195 0 14:45 195 145 0 0 142 2 5 0 4 0 0 0 349 0 1 0 0 9
2 138 0 15:00 140 175 0 0 171 4 3 0 2 0 0 0 320 0 0 0 0 5
0 122 0 15:15 122 197 0 0 193 4 0 0 0 0 0 0 319 0 0 0 0 0
0 114 0 15:30 114 239 0 0 233 6 3 0 0 0 0 0 356 0 0 0 0 3
1 117 0 15:45 118 233 0 0 230 3 4 0 0 0 0 0 355 0 0 0 0 4
0 130 0 16:00 130 251 0 0 248 3 1 0 2 0 0 0 384 0 0 0 0 3
1 155 0 16:15 156 248 0 0 246 2 4 0 0 0 0 0 408 0 0 0 0 4
0 166 0 16:30 166 252 0 0 248 4 1 0 0 0 0 0 419 0 0 0 0 1
0 156 0 16:45 156 224 0 0 221 3 3 0 2 0 0 0 385 0 0 0 0 5
0 128 0 17:00 128 258 0 0 252 6 3 0 0 0 0 0 389 0 0 0 0 3
0 162 0 17:15 162 246 0 0 243 3 3 0 2 0 0 0 413 0 0 0 0 5
0 160 0 17:30 161 251 0 0 245 6 5 0 0 0 0 0 417 1 0 0 0 5
0 148 0 17:45 148 277 0 0 268 9 3 0 1 0 0 0 429 0 0 0 0 4
1 142 0 18:00 143 268 0 0 264 4 5 0 1 0 0 0 417 0 0 0 0 6
Page 3 of 11

1645
Station ID:
Location:
Interval
(dd): PEAK
HOURS
AM PERIOD
6:00AM-12:00PM
Start End VolumePM PERIOD
12:00PM-19:00P
Start End Volume
MD 355 at NEWCUT RD
County:
Town:
Weather:
Montgomery
none
Cloudy/Cold
1675
Comments:
Date: Tuesday 03/05/2019
S2007150032
15 min
07:15 08:15 17:00 18:00B
LOS LOS V/CV/C
0.66 B 0.67
1 142 0 18:15 143 249 0 0 240 9 4 0 1 0 0 0 397 0 0 0 0 5
0 120 0 18:30 120 259 0 0 251 8 6 0 1 0 0 0 386 0 0 0 0 7
0 128 0 18:45 128 244 0 0 233 11 3 0 0 0 0 0 375 0 0 0 0 3
0 106 0 19:00 106 202 0 0 196 6 3 0 0 0 0 0 311 0 0 0 0 3
0 84 0 19:15 84 189 0 0 184 5 5 0 1 0 0 0 279 0 0 0 0 6
0 78 0 19:30 78 143 0 0 138 5 1 0 0 0 0 0 222 0 0 0 0 1
2 80 0 19:45 82 120 0 0 114 6 5 0 2 0 0 0 209 0 0 0 0 7
0 69 0 20:00 69 85 0 0 84 1 0 0 0 0 0 0 154 0 0 0 0 0
0 46 0 20:15 46 90 0 0 88 2 3 0 1 0 0 0 140 0 0 0 0 4
0 60 0 20:30 60 98 0 0 97 1 3 0 2 0 0 0 163 0 0 0 0 5
1 102 0 20:45 103 104 0 0 99 5 3 0 0 0 0 0 210 0 0 0 0 3
0 36 0 21:00 36 75 0 0 69 6 0 0 2 0 0 0 113 0 0 0 0 2
0 45 0 21:15 45 82 0 0 78 4 2 0 0 0 0 0 129 0 0 0 0 2
0 44 0 21:30 44 86 0 0 84 2 2 0 0 0 0 0 132 0 0 0 0 2
0 25 0 21:45 25 56 0 0 55 1 2 0 0 0 0 0 83 0 0 0 0 2
0 28 0 22:00 28 49 0 0 46 3 0 0 0 0 0 0 77 0 0 0 0 0
0 29 0 22:15 29 60 0 0 58 2 1 0 0 0 0 0 90 0 0 0 0 1
0 34 0 22:30 34 36 0 0 35 1 2 0 0 0 0 0 72 0 0 0 0 2
1 17 0 22:45 18 53 0 0 52 1 0 0 1 0 0 0 72 0 0 0 0 1
0 26 0 23:00 26 28 0 0 27 1 1 0 0 0 0 0 55 0 0 0 0 1
0 12 0 23:15 12 23 0 0 23 0 0 0 0 0 0 0 35 0 0 0 0 0
1 12 0 23:30 13 24 0 0 24 0 4 0 0 0 0 0 41 0 0 0 0 4
0 9 0 23:45 9 26 0 0 26 0 2 0 1 0 0 0 38 0 0 0 0 3
1 9 0 0:00 10 18 0 0 17 1 0 0 0 0 0 0 28 0 0 0 0 0
Page 4 of 11

1645
Station ID:
Location:
Interval
(dd): PEAK
HOURS
AM PERIOD
6:00AM-12:00PM
Start End VolumePM PERIOD
12:00PM-19:00P
Start End Volume
MD 355 at NEWCUT RD
County:
Town:
Weather:
Montgomery
none
Cloudy/Cold
1675
Comments:
Date: Wednesday 03/06/2019
S2007150032
15 min
07:15 08:15 17:00 18:00B
LOS LOS V/CV/C
0.66 B 0.67
2
1 612
1019 0
0
TOTAL:
1021
613
AM Peak:
PM Peak:
594
1042
0 4
0 1020 22
25 0
16 0 4
0 0 0
0 0 0
30
20
0
0 1675
1645 5
35 9491 0 9527 0 9324 219 9544 338 0 54 392 0 0 0 0 19463 1
0
0
1
0
0
0
0
0
1
0
0
590
Page 5 of 11

1645
Station ID:
Location:
Interval
(dd): PEAK
HOURS
AM PERIOD
6:00AM-12:00PM
Start End VolumePM PERIOD
12:00PM-19:00P
Start End Volume
MD 355 at NEWCUT RD
County:
Town:
Weather:
Montgomery
none
Cloudy/Cold
1675
Comments:
Date: Wednesday 03/06/2019
S2007150032
15 min
07:15 08:15 17:00 18:00B
LOS LOS V/CV/C
0.66 B 0.67
PedestriansPedestrians BicyclesPedestrainsBicyclesPedestrians
Hour
Ending
North Leg South Leg East Leg West Leg
MD 355 MD 355 NEWCUT RD
School
Children
School
Children
School
ChildrenBicycles Bicycles
School
Children
0 0:15 0 0 0 0 0 0 0 0 0 0 0
0 0:30 0 0 0 0 0 0 0 0 0 0 0
0 0:45 0 0 0 0 0 0 0 0 0 0 0
0 1:00 0 0 0 0 0 0 0 0 0 0 0
0 1:15 0 0 0 0 0 0 0 0 0 0 0
0 1:30 0 0 0 0 0 0 0 0 0 0 0
0 1:45 0 0 0 0 0 0 0 0 0 0 0
0 2:00 0 0 0 0 0 0 0 0 0 0 0
0 2:15 0 0 0 0 0 0 0 0 0 0 0
0 2:30 0 0 0 0 0 0 0 0 0 0 0
0 2:45 0 0 0 0 0 0 0 0 0 0 0
0 3:00 0 0 0 0 0 0 0 0 0 0 0
0 3:15 0 0 0 0 0 0 0 0 0 0 0
0 3:30 0 0 0 0 0 0 0 0 0 0 0
0 3:45 0 0 0 0 0 0 0 0 0 0 0
0 4:00 0 0 0 0 0 0 0 0 0 0 0
0 4:15 0 0 0 0 0 0 0 0 0 0 0
0 4:30 0 0 0 0 0 0 0 0 0 0 0
0 4:45 0 0 0 0 0 0 0 0 0 0 0
0 5:00 0 0 0 0 0 0 0 0 0 0 0
0 5:15 0 0 0 0 0 0 0 0 0 0 0
0 5:30 0 0 0 0 0 0 0 0 0 0 0
0 5:45 0 0 0 0 0 0 0 0 0 0 0
0 6:00 0 0 0 0 0 0 0 0 0 0 0
0 6:15 0 0 0 0 0 0 0 0 0 0 0
0 6:30 0 0 0 0 0 0 0 0 0 0 0
0 6:45 0 0 0 0 0 0 0 0 0 0 0
0 7:00 0 0 0 0 0 0 0 0 0 0 0
Page 6 of 11

1645
Station ID:
Location:
Interval
(dd): PEAK
HOURS
AM PERIOD
6:00AM-12:00PM
Start End VolumePM PERIOD
12:00PM-19:00P
Start End Volume
MD 355 at NEWCUT RD
County:
Town:
Weather:
Montgomery
none
Cloudy/Cold
1675
Comments:
Date: Wednesday 03/06/2019
S2007150032
15 min
07:15 08:15 17:00 18:00B
LOS LOS V/CV/C
0.66 B 0.67
0 7:15 0 0 0 0 0 0 0 0 0 0 0
0 7:30 0 0 0 0 0 0 0 0 0 0 0
0 7:45 0 0 0 0 0 0 0 0 0 0 0
0 8:00 0 0 0 0 0 0 0 0 0 0 0
0 8:15 0 0 0 0 0 0 0 0 0 0 0
0 8:30 0 0 0 0 0 0 0 0 0 0 0
0 8:45 0 0 0 0 0 0 0 0 0 0 0
0 9:00 0 0 0 0 0 0 0 0 0 0 0
0 9:15 0 0 0 0 0 0 0 0 0 0 0
0 9:30 0 0 0 0 0 0 0 0 0 0 0
0 9:45 0 0 0 0 0 0 0 0 0 0 0
0 10:00 0 0 0 0 0 0 0 0 0 0 0
0 10:15 0 0 0 0 0 0 0 0 0 0 0
0 10:30 0 0 0 0 0 0 0 0 0 0 0
0 10:45 0 0 0 0 0 0 0 0 0 0 0
0 11:00 0 0 0 0 0 0 0 0 0 0 0
0 11:15 0 0 0 0 0 0 0 0 0 0 0
0 11:30 0 0 0 0 0 0 0 0 0 0 0
0 11:45 0 0 0 0 0 0 0 0 0 0 0
0 12:00 0 0 0 0 0 0 0 0 0 0 0
0 12:15 0 0 0 0 0 0 0 0 0 0 0
0 12:30 0 0 0 0 0 0 0 0 0 0 0
0 12:45 0 0 0 0 0 0 0 0 0 0 0
0 13:00 0 0 0 0 0 0 0 0 0 0 0
0 13:15 0 0 0 0 0 0 0 0 0 0 0
0 13:30 0 0 0 0 0 0 0 0 0 0 0
0 13:45 0 0 0 0 0 0 0 0 0 0 0
0 14:00 0 0 0 0 0 0 0 0 0 0 0
0 14:15 0 0 0 0 0 0 0 0 0 0 0
0 14:30 0 0 0 0 0 0 0 0 0 0 0
0 14:45 0 0 0 0 0 0 0 0 0 0 0
0 15:00 0 0 0 0 0 0 0 0 0 0 0
Page 7 of 11

1645
Station ID:
Location:
Interval
(dd): PEAK
HOURS
AM PERIOD
6:00AM-12:00PM
Start End VolumePM PERIOD
12:00PM-19:00P
Start End Volume
MD 355 at NEWCUT RD
County:
Town:
Weather:
Montgomery
none
Cloudy/Cold
1675
Comments:
Date: Wednesday 03/06/2019
S2007150032
15 min
07:15 08:15 17:00 18:00B
LOS LOS V/CV/C
0.66 B 0.67
0 15:15 0 0 0 0 0 0 0 0 0 0 0
0 15:30 0 0 0 0 0 0 0 0 0 0 0
0 15:45 0 0 0 0 0 0 0 0 0 0 0
0 16:00 0 0 0 0 0 0 0 0 0 0 0
0 16:15 0 0 0 0 0 0 0 0 0 0 0
0 16:30 0 0 0 0 0 0 0 0 0 0 0
0 16:45 0 0 0 0 0 0 0 0 0 0 0
0 17:00 0 0 0 0 0 0 0 0 0 0 0
0 17:15 0 0 0 0 0 0 0 0 0 0 0
0 17:30 0 0 0 0 0 0 0 0 0 0 0
0 17:45 0 0 0 0 0 0 0 0 0 0 0
0 18:00 0 0 0 0 0 0 0 0 0 0 0
0 18:15 0 0 0 0 0 0 0 0 0 0 0
0 18:30 0 0 0 0 0 0 0 0 0 0 0
0 18:45 0 0 0 0 0 0 0 0 0 0 0
0 19:00 0 0 0 0 0 0 0 0 0 0 0
0 19:15 0 0 0 0 0 0 0 0 0 0 0
0 19:30 0 0 0 0 0 0 0 0 0 0 0
0 19:45 0 0 0 0 0 0 0 0 0 0 0
0 20:00 0 0 0 0 0 0 0 0 0 0 0
0 20:15 0 0 0 0 0 0 0 0 0 0 0
0 20:30 0 0 0 0 0 0 0 0 0 0 0
0 20:45 0 0 0 0 0 0 0 0 0 0 0
0 21:00 0 0 0 0 0 0 0 0 0 0 0
0 21:15 0 0 0 0 0 0 0 0 0 0 0
0 21:30 0 0 0 0 0 0 0 0 0 0 0
0 21:45 0 0 0 0 0 0 0 0 0 0 0
0 22:00 0 0 0 0 0 0 0 0 0 0 0
0 22:15 0 0 0 0 0 0 0 0 0 0 0
0 22:30 0 0 0 0 0 0 0 0 0 0 0
0 22:45 0 0 0 0 0 0 0 0 0 0 0
0 23:00 0 0 0 0 0 0 0 0 0 0 0
Page 8 of 11
1645
Station ID:
Location:
Interval
(dd): PEAK
HOURS
AM PERIOD
6:00AM-12:00PM
Start End VolumePM PERIOD
12:00PM-19:00P
Start End Volume
MD 355 at NEWCUT RD
County:
Town:
Weather:
Montgomery
none
Cloudy/Cold
1675
Comments:
Date: Wednesday 03/06/2019
S2007150032
15 min
07:15 08:15 17:00 18:00B
LOS LOS V/CV/C
0.66 B 0.67
0 23:15 0 0 0 0 0 0 0 0 0 0 0
0 23:30 0 0 0 0 0 0 0 0 0 0 0
0 23:45 0 0 0 0 0 0 0 0 0 0 0
0 0:00 0 0 0 0 0 0 0 0 0 0 0
0
0
0
0
0
0
Total:
AM Pe 0 0 0
0 0 0
0
0
0
0
0
0
0
0
0
0
0
0
0 0 0 0 0 0 0 0 0 0 0 0
PM Pe
Page 9 of 11

1645
Station ID:
Location:
Interval
(dd): PEAK
HOURS
AM PERIOD
6:00AM-12:00PM
Start End VolumePM PERIOD
12:00PM-19:00P
Start End Volume
MD 355 at NEWCUT RD
County:
Town:
Weather:
Montgomery
none
Cloudy/Cold
1675
Comments:
Date: Wednesday 03/06/2019
S2007150032
15 min
07:15 08:15 17:00 18:00B
LOS LOS V/CV/C
0.66 B 0.67
R T L U
U
L
T
R
R
T
L
U
RTLU
2 1019 0
590 4 0
25
0 0
0
0
1021 595
1616
30
36
594 1044
1638
0
0
0
5
LEG 1
MD 355
LE
G 3
NE
WC
UT
RD
LEG 2
MD 355
LE
G 4
7 0
0 29
Quadrant Quadrant
QuadrantQuadrant
6
AM Peak Hour
18906
35 9491 0
R T L U
MD 355
LEG 1
9527 9379
0 9324 219
U L T R
MD 355
LEG 2
9544 9830
19374
392
338
0
54 R
T
L
U
NE
WC
UT
RD
LE
G 3
254
646 0
0
0
U
L
T
R
LE
G 4
0
0
0
90 0
557 1
Quadrant Quadrant
QuadrantQuadrant
Turning Movement Summary
1
1
0
0
0
0
0
0
Page 10 of 11

1645
Station ID:
Location:
Interval
(dd): PEAK
HOURS
AM PERIOD
6:00AM-12:00PM
Start End VolumePM PERIOD
12:00PM-19:00P
Start End Volume
MD 355 at NEWCUT RD
County:
Town:
Weather:
Montgomery
none
Cloudy/Cold
1675
Comments:
Date: Wednesday 03/06/2019
S2007150032
15 min
07:15 08:15 17:00 18:00B
LOS LOS V/CV/C
0.66 B 0.67
1639
1 0 612
0 22 1020
16
0
4
0
0
0
R T L U
LEG 1
MD 355
U L T R
R
T
L
U
U
L
T
R
LE
G 4
614 1025
20
23
43
0
0
0
628 1042
1670
LEG 2
MD 355
LE
G 3
NE
WC
UT
RD
Quadrant
QuadrantQuadrant
Quadrant 6
38
0
0
PM Peak Hour
1
0
0
0
Page 11 of 11

Maryland Department of Transportation
State Highway Administration Data Services Engineering Division
Turning Movement Count Study - Field Sheet
2113
Station ID:
Location:
Interval
(dd): PEAK
HOURS
AM PERIOD
6:00AM-12:00PM
Start End VolumePM PERIOD
12:00PM-19:00P
Start End Volume
MD 355 at Little Seneca Pkwy
County:
Town:
Weather:
Montgomery
none
Cloudy/Cold
1839
Comments:
Date: Tuesday 03/05/2019
S2004150096
15 min
07:15 08:15 17:00 18:00B
LOS LOS V/CV/C
0.64 A 0.61
From SouthHour
EndingFrom North
TOTAL TOTAL TOTAL TOTAL
From East From WestLeft Through RightLeft Throug
h
RIGHTLeft Throug
h
RightLeft RightThrough
MD 355 MD 355 Little Seneca Pkwy Little Senca Pkwy
Grand
TotalU.Tur
n
U.Turn U.Turn U.Turn
1 4 0 0:15 5 16 0 2 7 7 4 1 1 0 0 0 27 0 0 0 0 6
3 9 0 0:30 12 9 1 0 4 5 2 1 0 0 0 1 25 0 0 0 0 3
0 2 0 0:45 2 9 1 0 7 2 1 0 1 0 1 0 14 0 0 0 0 2
2 2 1 1:00 5 16 2 2 13 1 1 1 0 1 0 1 25 0 0 0 0 2
1 3 0 1:15 4 14 0 0 9 5 0 0 0 0 0 0 18 0 0 0 0 0
0 2 0 1:30 2 5 0 0 4 1 0 1 1 0 0 0 9 0 0 0 0 2
0 2 0 1:45 2 7 1 0 5 2 0 0 0 0 0 1 10 0 0 0 0 0
1 0 0 2:00 1 3 0 1 2 0 3 0 0 0 0 0 7 0 0 0 0 3
0 0 1 2:15 1 2 0 0 1 1 1 0 0 0 0 0 4 0 0 0 0 1
0 3 0 2:30 3 2 1 0 2 0 0 0 0 0 1 0 6 0 0 0 0 0
1 2 0 2:45 3 3 0 0 3 0 0 0 0 0 0 0 6 0 0 0 0 0
0 3 0 3:00 3 5 0 0 4 1 2 0 0 0 0 0 10 0 0 0 0 2
1 2 1 3:15 4 2 1 0 2 0 0 0 0 0 0 1 7 0 0 0 0 0
0 1 0 3:30 1 5 2 1 4 0 0 0 0 1 0 1 8 0 0 0 0 0
0 2 0 3:45 2 2 0 0 1 1 0 0 0 0 0 0 4 0 0 0 0 0
0 6 0 4:00 6 5 4 0 4 1 1 0 0 1 0 3 16 0 0 0 0 1
0 6 0 4:15 6 1 0 0 1 0 1 0 1 0 0 0 9 0 0 0 0 2
1 4 0 4:30 5 7 2 0 7 0 2 0 1 0 0 2 17 0 0 0 0 3
3 13 0 4:45 16 9 4 0 8 1 3 0 1 2 0 2 33 0 0 0 0 4
6 18 0 5:00 24 13 5 0 9 4 7 0 5 0 2 3 54 0 0 0 0 12
Page 1 of 11

2113
Station ID:
Location:
Interval
(dd): PEAK
HOURS
AM PERIOD
6:00AM-12:00PM
Start End VolumePM PERIOD
12:00PM-19:00P
Start End Volume
MD 355 at Little Seneca Pkwy
County:
Town:
Weather:
Montgomery
none
Cloudy/Cold
1839
Comments:
Date: Tuesday 03/05/2019
S2004150096
15 min
07:15 08:15 17:00 18:00B
LOS LOS V/CV/C
0.64 A 0.61
2 28 1 5:15 31 9 3 0 8 1 5 0 1 0 0 3 49 0 0 0 0 6
2 28 0 5:30 30 13 4 0 11 2 14 1 3 0 0 4 65 0 0 0 0 18
1 70 0 5:45 71 26 2 2 23 1 12 0 4 0 0 2 115 0 0 0 0 16
3 76 0 6:00 79 25 9 1 20 4 21 0 4 0 0 9 138 0 0 0 0 25
8 102 4 6:15 114 43 17 0 37 6 35 2 6 2 0 15 217 0 0 0 0 43
5 187 1 6:30 193 66 10 4 56 6 43 2 8 0 1 9 322 0 0 0 0 53
5 221 5 6:45 231 58 19 1 51 6 49 5 6 2 5 12 369 0 0 1 0 61
4 243 3 7:00 250 78 11 5 55 18 34 2 12 0 2 9 387 0 0 0 0 48
8 195 5 7:15 208 103 21 7 82 14 38 5 29 3 2 16 404 0 0 0 0 72
15 174 12 7:30 201 176 24 11 152 13 44 8 42 5 3 16 495 0 0 0 0 94
26 188 17 7:45 231 173 47 18 125 30 39 27 57 10 6 31 574 0 0 0 0 123
23 193 34 8:00 250 124 81 26 71 27 37 37 16 22 13 46 545 0 0 0 0 90
6 145 20 8:15 171 126 116 38 62 26 39 29 18 30 17 69 499 0 0 0 0 86
6 181 5 8:30 192 88 41 9 62 17 53 4 8 5 5 31 386 0 0 0 0 65
5 231 2 8:45 238 97 19 6 64 27 56 2 17 2 3 14 429 0 0 0 0 75
11 201 5 9:00 217 105 21 5 70 30 61 1 8 3 3 15 413 0 0 0 0 70
10 168 3 9:15 181 95 42 10 62 23 54 2 16 8 3 30 390 0 0 0 1 72
10 141 2 9:30 153 103 12 8 71 24 42 2 3 3 0 9 315 0 0 0 0 47
6 139 3 9:45 148 97 18 7 66 24 22 0 8 3 3 12 293 0 0 0 0 30
12 105 1 10:00 118 65 20 5 42 18 36 1 7 3 3 14 247 0 0 0 0 44
5 84 1 10:15 90 82 13 11 55 16 19 1 9 2 0 11 214 0 0 0 0 29
10 62 3 10:30 75 67 10 5 51 11 24 1 13 3 0 7 190 0 0 0 0 38
11 74 2 10:45 87 69 14 4 55 10 22 0 8 0 2 12 200 0 0 0 0 30
9 64 2 11:00 75 96 19 8 70 18 19 1 7 3 4 12 217 0 0 0 0 27
6 88 4 11:15 98 89 11 3 66 20 20 2 7 3 3 5 227 0 0 0 0 29
18 98 2 11:30 118 114 10 5 86 23 17 3 4 2 2 6 266 0 0 0 0 24
Page 2 of 11

2113
Station ID:
Location:
Interval
(dd): PEAK
HOURS
AM PERIOD
6:00AM-12:00PM
Start End VolumePM PERIOD
12:00PM-19:00P
Start End Volume
MD 355 at Little Seneca Pkwy
County:
Town:
Weather:
Montgomery
none
Cloudy/Cold
1839
Comments:
Date: Tuesday 03/05/2019
S2004150096
15 min
07:15 08:15 17:00 18:00B
LOS LOS V/CV/C
0.64 A 0.61
9 100 1 11:45 110 113 16 7 84 22 26 4 7 1 3 12 276 0 0 0 0 37
10 93 0 12:00 103 104 12 9 80 15 26 4 8 5 1 6 257 0 0 0 0 38
16 78 2 12:15 96 115 20 7 76 32 22 2 8 2 3 15 263 0 0 0 0 32
12 76 3 12:30 91 115 5 4 77 34 26 1 7 0 0 5 245 0 0 0 0 34
9 87 3 12:45 99 131 15 11 94 26 18 2 7 2 0 13 272 0 0 0 0 27
10 67 2 13:00 79 129 21 8 95 26 24 0 10 3 1 17 263 0 0 0 0 34
5 68 3 13:15 76 128 10 4 95 29 27 1 8 4 0 6 250 0 0 0 0 36
8 65 2 13:30 75 111 11 4 78 29 23 2 5 1 1 8 227 0 0 0 1 30
11 67 2 13:45 80 125 11 7 91 27 21 1 9 4 0 7 247 0 0 0 0 31
13 58 1 14:00 72 143 10 8 110 25 13 1 13 2 0 8 252 0 0 0 0 27
6 57 1 14:15 64 141 12 8 106 27 15 1 15 3 2 7 248 0 0 0 0 31
8 68 3 14:30 79 142 17 7 110 25 17 2 21 5 3 9 278 0 0 0 0 40
32 145 10 14:45 187 146 27 13 104 29 16 4 17 3 2 22 397 0 0 0 0 37
16 122 12 15:00 150 175 14 25 116 34 12 7 14 2 0 12 372 0 0 0 0 33
17 61 9 15:15 87 193 74 30 112 51 23 5 8 28 12 34 390 0 0 0 0 36
14 70 8 15:30 92 228 37 15 171 42 26 1 13 12 9 16 398 0 0 1 0 41
12 75 5 15:45 92 227 40 11 172 44 26 5 13 13 9 18 403 0 0 0 0 44
20 94 3 16:00 117 247 19 12 187 48 31 3 13 7 5 7 430 0 0 0 0 47
15 112 12 16:15 139 254 22 17 185 52 26 5 11 6 4 12 457 0 0 0 0 42
25 125 14 16:30 164 240 40 19 187 34 28 8 12 15 11 14 492 0 0 0 0 48
20 114 3 16:45 137 226 34 10 175 41 29 3 7 17 6 11 436 0 0 0 0 39
13 103 3 17:00 119 248 17 21 188 39 23 1 9 4 1 12 417 0 0 0 0 33
22 120 3 17:15 145 250 18 17 186 47 31 5 22 8 2 8 471 0 0 0 0 58
18 119 4 17:30 141 237 16 11 179 47 33 2 7 7 2 7 436 0 0 0 0 42
23 104 6 17:45 133 272 14 14 197 61 32 3 4 4 2 8 458 0 0 0 0 39
22 106 5 18:00 133 265 8 20 192 53 38 10 20 1 2 5 474 0 0 0 0 68
Page 3 of 11

2113
Station ID:
Location:
Interval
(dd): PEAK
HOURS
AM PERIOD
6:00AM-12:00PM
Start End VolumePM PERIOD
12:00PM-19:00P
Start End Volume
MD 355 at Little Seneca Pkwy
County:
Town:
Weather:
Montgomery
none
Cloudy/Cold
1839
Comments:
Date: Tuesday 03/05/2019
S2004150096
15 min
07:15 08:15 17:00 18:00B
LOS LOS V/CV/C
0.64 A 0.61
28 94 6 18:15 128 236 24 19 172 45 35 6 13 4 8 11 442 0 0 0 1 54
12 79 5 18:30 96 259 16 24 179 56 35 11 13 4 2 10 430 0 0 0 0 59
20 78 7 18:45 105 229 23 19 150 60 36 3 3 5 6 12 399 0 0 0 0 42
14 69 6 19:00 89 206 20 18 142 46 28 6 20 3 6 11 369 0 0 0 0 54
9 53 1 19:15 63 182 21 15 115 52 27 5 15 4 8 9 313 0 0 0 0 47
16 50 0 19:30 66 147 21 11 88 48 15 3 8 4 4 13 260 0 0 0 0 26
8 52 2 19:45 62 109 8 12 64 33 22 3 8 1 0 7 212 0 0 0 0 33
10 52 3 20:00 65 83 8 12 53 18 15 7 10 1 2 5 188 0 0 0 0 32
22 31 4 20:15 57 83 8 11 48 24 14 5 8 3 1 4 175 0 0 0 0 27
14 41 4 20:30 59 112 10 18 64 30 11 4 15 3 4 3 211 0 0 0 0 30
22 90 2 20:45 114 90 4 10 49 31 12 4 10 0 1 3 234 0 0 0 0 26
7 31 3 21:00 41 72 4 9 39 24 8 3 4 3 0 1 132 0 0 0 0 15
3 33 1 21:15 37 87 6 12 42 33 6 2 3 1 1 4 141 0 0 0 0 11
7 27 2 21:30 36 81 6 10 45 26 13 2 5 0 1 5 143 0 0 0 0 20
3 19 0 21:45 22 53 4 9 25 19 7 2 7 1 3 0 95 0 0 0 0 16
3 23 0 22:00 26 53 10 6 29 18 1 0 0 2 3 5 90 0 0 0 0 1
1 11 1 22:15 13 57 2 7 25 25 13 2 2 0 0 2 89 0 0 0 0 17
3 21 0 22:30 24 39 3 6 26 7 12 2 2 1 0 2 82 0 0 0 0 16
3 15 0 22:45 18 52 1 8 23 21 4 1 1 1 0 0 77 0 0 0 0 6
1 12 0 23:00 13 28 10 5 10 13 6 1 0 2 0 8 58 0 0 0 0 7
0 9 0 23:15 9 23 1 1 11 11 0 0 0 0 0 1 33 0 0 0 0 0
0 8 0 23:30 8 23 2 2 14 7 5 0 1 0 0 2 39 0 0 0 0 6
2 5 0 23:45 7 27 2 3 17 7 2 0 0 0 1 1 38 0 0 0 0 2
1 7 0 0:00 8 17 1 3 10 4 3 1 0 1 0 0 30 0 0 0 0 4
Page 4 of 11

2113
Station ID:
Location:
Interval
(dd): PEAK
HOURS
AM PERIOD
6:00AM-12:00PM
Start End VolumePM PERIOD
12:00PM-19:00P
Start End Volume
MD 355 at Little Seneca Pkwy
County:
Town:
Weather:
Montgomery
none
Cloudy/Cold
1839
Comments:
Date: Wednesday 03/06/2019
S2004150096
15 min
07:15 08:15 17:00 18:00B
LOS LOS V/CV/C
0.64 A 0.61
70
85 449
700 83
18
TOTAL:
853
552
AM Peak:
PM Peak:
599
1024
93 96
62 754 208
159 101
134 20 53
67 39 162
20 8 28
393
207
268
56 1839
2113 133
842 6834 307 7983 774 6557 2044 9375 1845 298 768 2913 322 216 852 1393 21664 0
0
3
0
0
0
2
0
0
0
0
0
410
Page 5 of 11
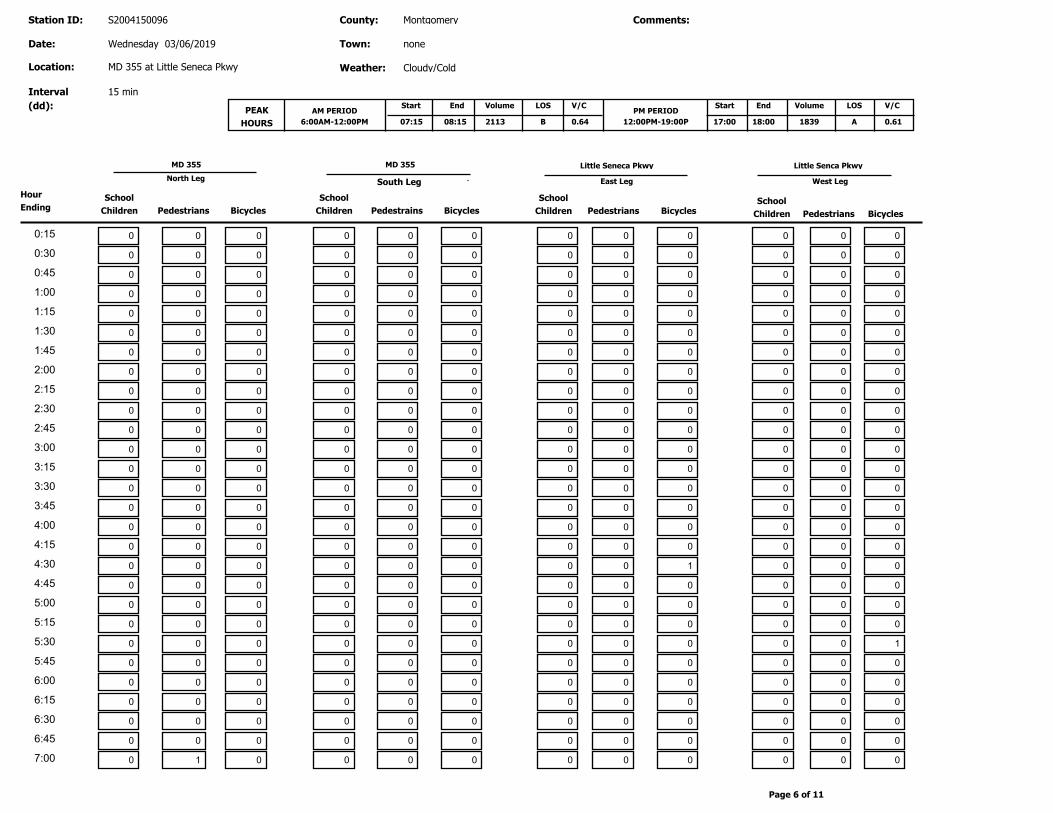
2113
Station ID:
Location:
Interval
(dd): PEAK
HOURS
AM PERIOD
6:00AM-12:00PM
Start End VolumePM PERIOD
12:00PM-19:00P
Start End Volume
MD 355 at Little Seneca Pkwy
County:
Town:
Weather:
Montgomery
none
Cloudy/Cold
1839
Comments:
Date: Wednesday 03/06/2019
S2004150096
15 min
07:15 08:15 17:00 18:00B
LOS LOS V/CV/C
0.64 A 0.61
PedestriansPedestrians BicyclesPedestrainsBicyclesPedestrians
Hour
Ending
North Leg South Leg East Leg West Leg
MD 355 MD 355 Little Seneca Pkwy Little Senca Pkwy
School
Children
School
Children
School
ChildrenBicycles Bicycles
School
Children
0 0:15 0 0 0 0 0 0 0 0 0 0 0
0 0:30 0 0 0 0 0 0 0 0 0 0 0
0 0:45 0 0 0 0 0 0 0 0 0 0 0
0 1:00 0 0 0 0 0 0 0 0 0 0 0
0 1:15 0 0 0 0 0 0 0 0 0 0 0
0 1:30 0 0 0 0 0 0 0 0 0 0 0
0 1:45 0 0 0 0 0 0 0 0 0 0 0
0 2:00 0 0 0 0 0 0 0 0 0 0 0
0 2:15 0 0 0 0 0 0 0 0 0 0 0
0 2:30 0 0 0 0 0 0 0 0 0 0 0
0 2:45 0 0 0 0 0 0 0 0 0 0 0
0 3:00 0 0 0 0 0 0 0 0 0 0 0
0 3:15 0 0 0 0 0 0 0 0 0 0 0
0 3:30 0 0 0 0 0 0 0 0 0 0 0
0 3:45 0 0 0 0 0 0 0 0 0 0 0
0 4:00 0 0 0 0 0 0 0 0 0 0 0
0 4:15 0 0 0 0 0 0 0 0 0 0 0
0 4:30 0 0 0 0 0 0 1 0 0 0 0
0 4:45 0 0 0 0 0 0 0 0 0 0 0
0 5:00 0 0 0 0 0 0 0 0 0 0 0
0 5:15 0 0 0 0 0 0 0 0 0 0 0
0 5:30 0 0 0 0 0 0 0 1 0 0 0
0 5:45 0 0 0 0 0 0 0 0 0 0 0
0 6:00 0 0 0 0 0 0 0 0 0 0 0
0 6:15 0 0 0 0 0 0 0 0 0 0 0
0 6:30 0 0 0 0 0 0 0 0 0 0 0
0 6:45 0 0 0 0 0 0 0 0 0 0 0
1 7:00 0 0 0 0 0 0 0 0 0 0 0
Page 6 of 11

2113
Station ID:
Location:
Interval
(dd): PEAK
HOURS
AM PERIOD
6:00AM-12:00PM
Start End VolumePM PERIOD
12:00PM-19:00P
Start End Volume
MD 355 at Little Seneca Pkwy
County:
Town:
Weather:
Montgomery
none
Cloudy/Cold
1839
Comments:
Date: Wednesday 03/06/2019
S2004150096
15 min
07:15 08:15 17:00 18:00B
LOS LOS V/CV/C
0.64 A 0.61
0 7:15 0 0 0 1 0 0 0 0 0 0 0
4 7:30 0 0 0 1 0 0 0 0 0 0 0
8 7:45 0 0 0 1 1 0 0 0 0 0 0
0 8:00 0 0 0 0 0 0 0 0 0 1 0
1 8:15 0 0 0 0 0 0 0 0 0 0 0
0 8:30 0 0 0 0 0 0 0 0 0 0 0
0 8:45 0 0 0 1 0 0 0 0 0 1 0
0 9:00 0 0 0 0 0 0 0 0 0 0 0
0 9:15 0 0 0 1 0 0 0 0 0 0 0
0 9:30 0 0 0 0 0 0 0 0 0 0 0
0 9:45 0 0 0 0 0 0 0 0 0 0 0
0 10:00 0 0 0 0 0 0 0 0 0 1 0
0 10:15 0 0 0 0 0 0 0 0 0 4 0
2 10:30 0 0 0 2 0 0 0 0 0 0 0
0 10:45 0 0 0 0 0 0 0 0 0 0 0
0 11:00 0 0 0 0 0 0 0 0 0 0 0
1 11:15 0 0 0 2 0 0 0 0 0 0 0
2 11:30 0 0 0 1 0 0 0 0 0 1 0
1 11:45 0 0 0 1 0 0 0 0 0 1 0
0 12:00 0 0 0 0 0 0 0 0 0 2 0
0 12:15 0 0 0 0 0 0 0 0 0 2 0
0 12:30 0 0 0 0 0 0 0 0 0 1 0
0 12:45 0 0 0 0 0 0 0 0 0 0 0
0 13:00 0 0 0 0 0 0 0 0 0 2 0
1 13:15 0 0 0 0 0 0 0 0 0 0 0
2 13:30 0 0 0 0 0 0 0 0 0 0 0
0 13:45 0 0 0 0 0 0 0 0 0 2 0
1 14:00 0 0 0 0 0 0 0 0 0 0 0
2 14:15 0 0 0 2 0 0 0 0 0 0 0
0 14:30 0 0 0 0 0 0 0 0 0 0 0
9 14:45 0 0 0 3 0 0 0 0 0 5 0
14 15:00 0 0 0 6 0 0 0 0 0 2 0
Page 7 of 11
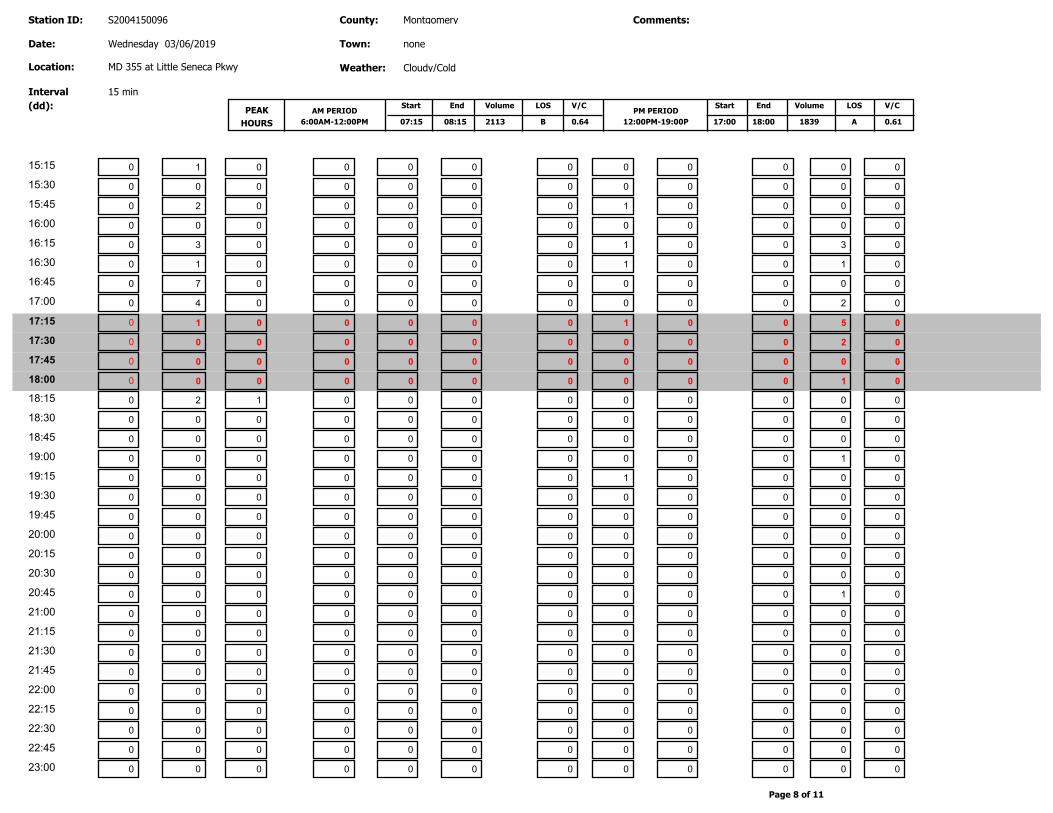
2113
Station ID:
Location:
Interval
(dd): PEAK
HOURS
AM PERIOD
6:00AM-12:00PM
Start End VolumePM PERIOD
12:00PM-19:00P
Start End Volume
MD 355 at Little Seneca Pkwy
County:
Town:
Weather:
Montgomery
none
Cloudy/Cold
1839
Comments:
Date: Wednesday 03/06/2019
S2004150096
15 min
07:15 08:15 17:00 18:00B
LOS LOS V/CV/C
0.64 A 0.61
1 15:15 0 0 0 0 0 0 0 0 0 0 0
0 15:30 0 0 0 0 0 0 0 0 0 0 0
2 15:45 0 0 0 1 0 0 0 0 0 0 0
0 16:00 0 0 0 0 0 0 0 0 0 0 0
3 16:15 0 0 0 1 0 0 0 0 0 3 0
1 16:30 0 0 0 1 0 0 0 0 0 1 0
7 16:45 0 0 0 0 0 0 0 0 0 0 0
4 17:00 0 0 0 0 0 0 0 0 0 2 0
1 17:15 0 0 0 1 0 0 0 0 0 5 0
0 17:30 0 0 0 0 0 0 0 0 0 2 0
0 17:45 0 0 0 0 0 0 0 0 0 0 0
0 18:00 0 0 0 0 0 0 0 0 0 1 0
2 18:15 0 0 0 0 1 0 0 0 0 0 0
0 18:30 0 0 0 0 0 0 0 0 0 0 0
0 18:45 0 0 0 0 0 0 0 0 0 0 0
0 19:00 0 0 0 0 0 0 0 0 0 1 0
0 19:15 0 0 0 1 0 0 0 0 0 0 0
0 19:30 0 0 0 0 0 0 0 0 0 0 0
0 19:45 0 0 0 0 0 0 0 0 0 0 0
0 20:00 0 0 0 0 0 0 0 0 0 0 0
0 20:15 0 0 0 0 0 0 0 0 0 0 0
0 20:30 0 0 0 0 0 0 0 0 0 0 0
0 20:45 0 0 0 0 0 0 0 0 0 1 0
0 21:00 0 0 0 0 0 0 0 0 0 0 0
0 21:15 0 0 0 0 0 0 0 0 0 0 0
0 21:30 0 0 0 0 0 0 0 0 0 0 0
0 21:45 0 0 0 0 0 0 0 0 0 0 0
0 22:00 0 0 0 0 0 0 0 0 0 0 0
0 22:15 0 0 0 0 0 0 0 0 0 0 0
0 22:30 0 0 0 0 0 0 0 0 0 0 0
0 22:45 0 0 0 0 0 0 0 0 0 0 0
0 23:00 0 0 0 0 0 0 0 0 0 0 0
Page 8 of 11

2113
Station ID:
Location:
Interval
(dd): PEAK
HOURS
AM PERIOD
6:00AM-12:00PM
Start End VolumePM PERIOD
12:00PM-19:00P
Start End Volume
MD 355 at Little Seneca Pkwy
County:
Town:
Weather:
Montgomery
none
Cloudy/Cold
1839
Comments:
Date: Wednesday 03/06/2019
S2004150096
15 min
07:15 08:15 17:00 18:00B
LOS LOS V/CV/C
0.64 A 0.61
0 23:15 0 0 0 0 0 0 0 0 0 0 0
0 23:30 0 0 0 0 0 0 0 0 0 0 0
0 23:45 0 0 0 0 0 0 0 0 0 0 0
0 0:00 0 0 0 0 0 0 0 0 0 0 0
0
0
13
1
1
0
Total:
AM Pe 0 0 0
0 0 0
0
0
2
1
0
0
0
0
1
8
0
0
0 0 70 2 0 0 27 0 41 0 1 1
PM Pe
Page 9 of 11

2113
Station ID:
Location:
Interval
(dd): PEAK
HOURS
AM PERIOD
6:00AM-12:00PM
Start End VolumePM PERIOD
12:00PM-19:00P
Start End Volume
MD 355 at Little Seneca Pkwy
County:
Town:
Weather:
Montgomery
none
Cloudy/Cold
1839
Comments:
Date: Wednesday 03/06/2019
S2004150096
15 min
07:15 08:15 17:00 18:00B
LOS LOS V/CV/C
0.64 A 0.61
R T L U
U
L
T
R
R
T
L
U
RTLU
70 700 83
410 96 93
159
101 67
39
162
853 610
1463
393
598
599 1021
1620
268
277
545
133
LEG 1
MD 355
LE
G 3
Little
Se
ne
ca
Pk
wy
LEG 2
MD 355
LE
G 4
Little
Se
nca
Pk
wy
203 150
255 255
Quadrant Quadrant
QuadrantQuadrant
205
AM Peak Hour
15630
842 6834 307
R T L U
MD 355
LEG 1
7983 7647
774 6557 2044
U L T R
MD 355
LEG 2
9375 9531
18906
2913
1845
298
768 R
T
L
U
Little
Se
ne
ca
Pk
wy
LE
G 3
3104
6017 322
216
852
U
L
T
R
Little
Se
nca
Pk
wy
LE
G 4
1382
1393
2775
1610 632
3891 1626
Quadrant Quadrant
QuadrantQuadrant
Turning Movement Summary
0
0
3
2
0
0
0
0
Page 10 of 11
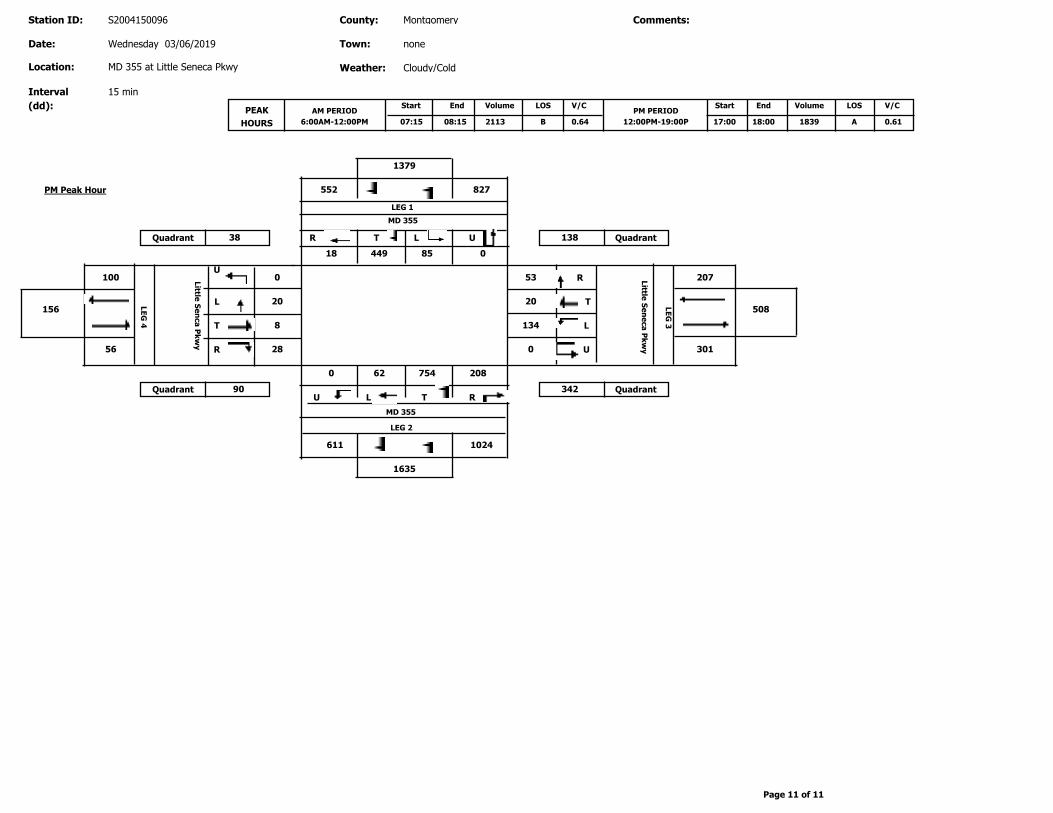
2113
Station ID:
Location:
Interval
(dd): PEAK
HOURS
AM PERIOD
6:00AM-12:00PM
Start End VolumePM PERIOD
12:00PM-19:00P
Start End Volume
MD 355 at Little Seneca Pkwy
County:
Town:
Weather:
Montgomery
none
Cloudy/Cold
1839
Comments:
Date: Wednesday 03/06/2019
S2004150096
15 min
07:15 08:15 17:00 18:00B
LOS LOS V/CV/C
0.64 A 0.61
1379
85 18 449
62 208 754
134
20
53
20
8
28
R T L U
LEG 1
MD 355
U L T R
R
T
L
U
U
L
T
R
Little
Se
nca
Pk
wy
LE
G 4
552 827
207
301
508
100
56
156
611 1024
1635
LEG 2
MD 355
LE
G 3
Little
Se
ne
ca
Pk
wy
Quadrant
QuadrantQuadrant
Quadrant 138
342
38
90
PM Peak Hour
0
0
0
0
Page 11 of 11

Appendix B
Volume Calculations

MWCOG 2016/2040 Model Network with Observation Drive Extension
Observation Dr Extension

MD 355 Volume Calcs.xlsxExisting Raw
853 610 552 82783 700 70 18 449 85
277 Out/In Out/In 393 100 Out/In Out/In 20767 133 20 5339 101 8 20162 159 28 134
268 Out/In Out/In 205 56 Out/In Out/In 30193 410 96 62 754 208
1021 599 611 1024
0 4 2 0
1021 595 613 10241019 2 612 1
0 Out/In Out/In 30 0 Out/In Out/In 205 4
25 160 Out/In Out/In 6 0 Out/In Out/In 23
590 4 1020 221044 594 628 1042
18 22 -2 -12
1062 572 626 105428 1031 3 32 586 8
34 Out/In Out/In 25 67 Out/In Out/In 832 14 17 60 0 0 031 11 14 2
63 Out/In Out/In 3 31 Out/In Out/In 146 526 0 35 1031 6
1073 532 602 1072
-238 -2 -26 13
835 534 576 10597 828 16 560
31 Out/In Out/In 0 170 Out/In Out/In 013 23
144 94157 Out/In Out/In 0 117 Out/In Out/In 0
24 521 154 1036972 545 654 1190
211 -9 -16 23
1183 554 638 11671181 2 636 2
0 Out/In Out/In 8 0 Out/In Out/In 40 1
8 30 Out/In Out/In 6 0 Out/In Out/In 21
554 4 1166 191189 558 639 1185
3 0 -14 8
1192 558 625 11771043 149 533 92
0 Out/In Out/In 99 0 Out/In Out/In 24197 239
2 20 Out/In Out/In 153 0 Out/In Out/In 94
461 4 938 21045 465 535 940
11 18 2 -13
1056 447 537 95322 1033 1 25 510 2
31 Out/In Out/In 2 55 Out/In Out/In 1632 1 18 21 0 0 067 1 33 14
100 Out/In Out/In 5 51 Out/In Out/In 129 414 3 5 30 933 10
1101 426 U-turns 562 978
3/5/2019 3/5/20197:15 - 8:15 AM 5:00 - 6:00 PM
MD 355 MD 355Milestone Manor Ln Milestone Manor Ln
TEV:1584 TEV:1582
TEV:1756 TEV:18063/5/2019 3/5/2019
7:15 - 8:15 AM 5:00 - 6:00 PM
7:15 - 8:15 AM 5:00 - 6:00 PM
MD 355 MD 355Brink Rd Brink Rd
Greenbrook Dr Greenbrook DrTEV:1749 TEV:18273/5/2019 3/5/2019
2/13/2019 2/13/20197:15 - 8:15 AM 5:00 - 6:00 PM
MD 355 MD 355
MD 355 MD 355W Old Baltimore Rd W Old Baltimore Rd
TEV:1537 TEV:1883
TEV:1682 TEV:17373/5/2019 3/5/2019
7:15 - 8:15 AM 5:00 - 6:00 PM
7:15 - 8:15 AM 5:00 - 6:00 PM
MD 355 MD 355Canterfield/Rosecrest Canterfield/Rosecrest
New Cut Rd New Cut RdTEV:1645 TEV:16753/5/2019 3/5/2019
3/5/2019 3/5/20197:15 - 8:15 AM 5:00 - 6:00 PM
MD 355 MD 355
MD 355 MD 355Little Seneca Pkwy Little Seneca Pkwy
TEV:2113 TEV:1839
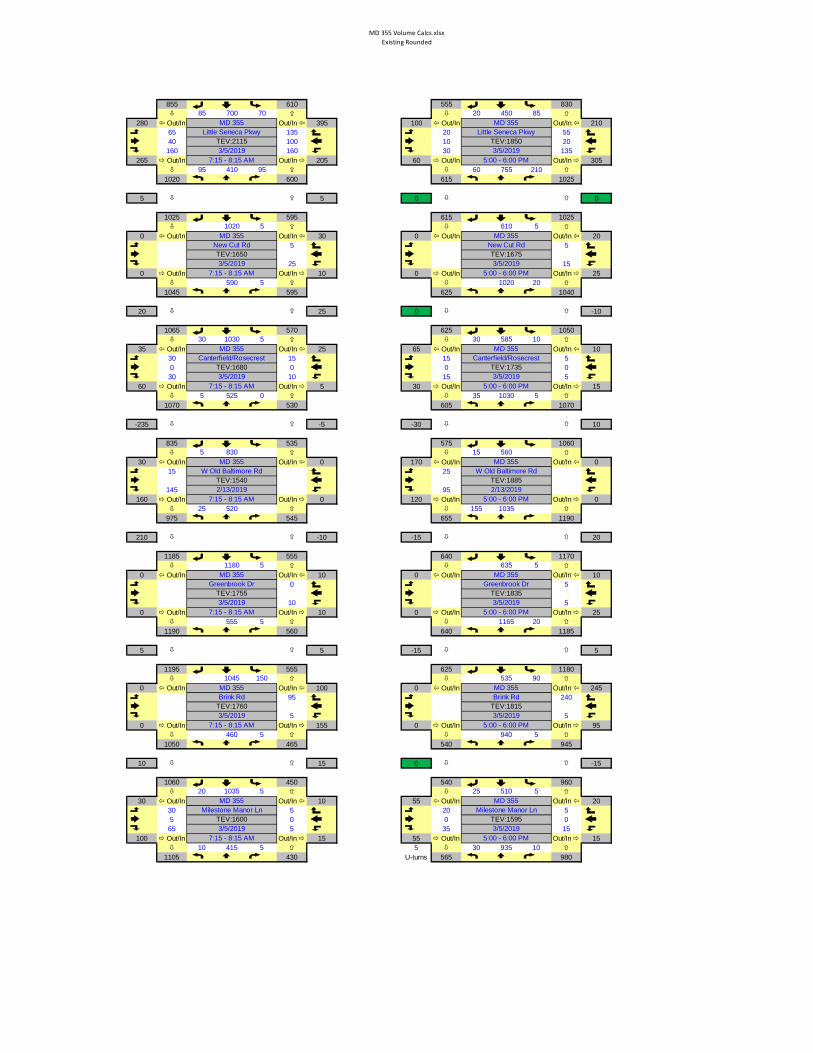
MD 355 Volume Calcs.xlsxExisting Rounded
855 610 555 83085 700 70 20 450 85
280 Out/In Out/In 395 100 Out/In Out/In 21065 135 20 5540 100 10 20160 160 30 135
265 Out/In Out/In 205 60 Out/In Out/In 30595 410 95 60 755 210
1020 600 615 1025
5 5 0 0
1025 595 615 10251020 5 610 5
0 Out/In Out/In 30 0 Out/In Out/In 205 5
25 150 Out/In Out/In 10 0 Out/In Out/In 25
590 5 1020 201045 595 625 1040
20 25 0 -10
1065 570 625 105030 1030 5 30 585 10
35 Out/In Out/In 25 65 Out/In Out/In 1030 15 15 50 0 0 030 10 15 5
60 Out/In Out/In 5 30 Out/In Out/In 155 525 0 35 1030 5
1070 530 605 1070
-235 -5 -30 10
835 535 575 10605 830 15 560
30 Out/In Out/In 0 170 Out/In Out/In 015 25
145 95160 Out/In Out/In 0 120 Out/In Out/In 0
25 520 155 1035975 545 655 1190
210 -10 -15 20
1185 555 640 11701180 5 635 5
0 Out/In Out/In 10 0 Out/In Out/In 100 5
10 50 Out/In Out/In 10 0 Out/In Out/In 25
555 5 1165 201190 560 640 1185
5 5 -15 5
1195 555 625 11801045 150 535 90
0 Out/In Out/In 100 0 Out/In Out/In 24595 240
5 50 Out/In Out/In 155 0 Out/In Out/In 95
460 5 940 51050 465 540 945
10 15 0 -15
1060 450 540 96020 1035 5 25 510 5
30 Out/In Out/In 10 55 Out/In Out/In 2030 5 20 55 0 0 065 5 35 15
100 Out/In Out/In 15 55 Out/In Out/In 1510 415 5 5 30 935 10
1105 430 U-turns 565 980
3/5/2019 3/5/20197:15 - 8:15 AM 5:00 - 6:00 PM
MD 355 MD 355Milestone Manor Ln Milestone Manor Ln
TEV:1600 TEV:1595
TEV:1760 TEV:18153/5/2019 3/5/2019
7:15 - 8:15 AM 5:00 - 6:00 PM
7:15 - 8:15 AM 5:00 - 6:00 PM
MD 355 MD 355Brink Rd Brink Rd
Greenbrook Dr Greenbrook DrTEV:1755 TEV:18353/5/2019 3/5/2019
2/13/2019 2/13/20197:15 - 8:15 AM 5:00 - 6:00 PM
MD 355 MD 355
MD 355 MD 355W Old Baltimore Rd W Old Baltimore Rd
TEV:1540 TEV:1885
TEV:1680 TEV:17353/5/2019 3/5/2019
7:15 - 8:15 AM 5:00 - 6:00 PM
7:15 - 8:15 AM 5:00 - 6:00 PM
MD 355 MD 355Canterfield/Rosecrest Canterfield/Rosecrest
New Cut Rd New Cut RdTEV:1650 TEV:16753/5/2019 3/5/2019
3/5/2019 3/5/20197:15 - 8:15 AM 5:00 - 6:00 PM
MD 355 MD 355
MD 355 MD 355Little Seneca Pkwy Little Seneca Pkwy
TEV:2115 TEV:1850

MD 355 Volume Calcs.xlsxExisting Balanced
Balanced upBalanced down
865 595 525 82085 710 70 20 420 85
280 Out/In Out/In 395 100 Out/In Out/In 21065 135 20 5540 100 10 20160 160 30 135
265 Out/In Out/In 205 60 Out/In Out/In 30595 395 95 60 745 210
1030 585 585 1015
0 0 0 0
1030 585 585 10151025 5 580 5
0 Out/In Out/In 30 0 Out/In Out/In 205 5
25 150 Out/In Out/In 10 0 Out/In Out/In 25
580 5 1010 201050 585 595 1030
0 0 0 0
1050 585 595 103030 1015 5 30 555 10
35 Out/In Out/In 25 65 Out/In Out/In 1030 15 15 50 0 0 030 10 15 5
60 Out/In Out/In 5 30 Out/In Out/In 155 540 0 35 1010 5
1055 545 575 1050
0 0 0 0
1055 545 575 10505 1050 15 560
30 Out/In Out/In 0 170 Out/In Out/In 015 25
145 95160 Out/In Out/In 0 120 Out/In Out/In 0
25 530 155 10251195 555 655 1180
0 0 0 0
1195 555 655 11801190 5 650 5
0 Out/In Out/In 10 0 Out/In Out/In 100 5
10 50 Out/In Out/In 10 0 Out/In Out/In 25
555 5 1175 201200 560 655 1195
0 0 0 0
1200 560 655 11951050 150 565 90
0 Out/In Out/In 100 0 Out/In Out/In 24595 240
5 50 Out/In Out/In 155 0 Out/In Out/In 95
465 5 955 51055 470 570 960
0 0 0 0
1055 470 570 96020 1030 5 25 540 5
30 Out/In Out/In 10 55 Out/In Out/In 2030 5 20 55 0 0 065 5 35 15
100 Out/In Out/In 15 55 Out/In Out/In 1510 435 5 5 30 935 10
1100 450 U-turns 595 980
3/5/2019 3/5/20197:15 - 8:15 AM 5:00 - 6:00 PM
MD 355 MD 355Milestone Manor Ln Milestone Manor Ln
TEV:1615 TEV:1625
TEV:1770 TEV:18603/5/2019 3/5/2019
7:15 - 8:15 AM 5:00 - 6:00 PM
7:15 - 8:15 AM 5:00 - 6:00 PM
MD 355 MD 355Brink Rd Brink Rd
Greenbrook Dr Greenbrook DrTEV:1765 TEV:18603/5/2019 3/5/2019
2/13/2019 2/13/20197:15 - 8:15 AM 5:00 - 6:00 PM
MD 355 MD 355
MD 355 MD 355W Old Baltimore Rd W Old Baltimore Rd
TEV:1770 TEV:1875
TEV:1680 TEV:16853/5/2019 3/5/2019
7:15 - 8:15 AM 5:00 - 6:00 PM
7:15 - 8:15 AM 5:00 - 6:00 PM
MD 355 MD 355Canterfield/Rosecrest Canterfield/Rosecrest
New Cut Rd New Cut RdTEV:1645 TEV:16353/5/2019 3/5/2019
3/5/2019 3/5/20197:15 - 8:15 AM 5:00 - 6:00 PM
MD 355 MD 355
MD 355 MD 355Little Seneca Pkwy Little Seneca Pkwy
TEV:2110 TEV:1810
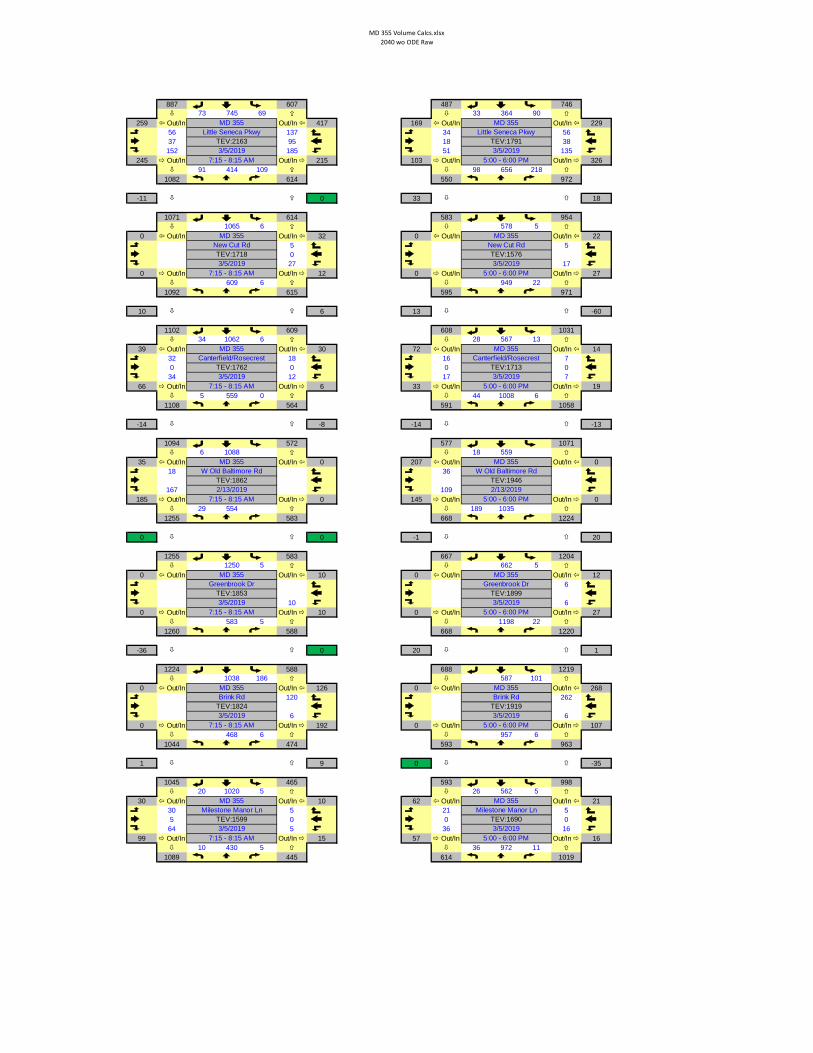
MD 355 Volume Calcs.xlsx2040 wo ODE Raw
887 607 487 74673 745 69 33 364 90
259 Out/In Out/In 417 169 Out/In Out/In 22956 137 34 5637 95 18 38152 185 51 135
245 Out/In Out/In 215 103 Out/In Out/In 32691 414 109 98 656 218
1082 614 550 972
-11 0 33 18
1071 614 583 9541065 6 578 5
0 Out/In Out/In 32 0 Out/In Out/In 225 5027 17
0 Out/In Out/In 12 0 Out/In Out/In 27609 6 949 22
1092 615 595 971
10 6 13 -60
1102 609 608 103134 1062 6 28 567 13
39 Out/In Out/In 30 72 Out/In Out/In 1432 18 16 70 0 0 034 12 17 7
66 Out/In Out/In 6 33 Out/In Out/In 195 559 0 44 1008 6
1108 564 591 1058
-14 -8 -14 -13
1094 572 577 10716 1088 18 559
35 Out/In Out/In 0 207 Out/In Out/In 018 36
167 109185 Out/In Out/In 0 145 Out/In Out/In 0
29 554 189 10351255 583 668 1224
0 0 -1 20
1255 583 667 12041250 5 662 5
0 Out/In Out/In 10 0 Out/In Out/In 126
10 60 Out/In Out/In 10 0 Out/In Out/In 27
583 5 1198 221260 588 668 1220
-36 0 20 1
1224 588 688 12191038 186 587 101
0 Out/In Out/In 126 0 Out/In Out/In 268120 262
6 60 Out/In Out/In 192 0 Out/In Out/In 107
468 6 957 61044 474 593 963
1 9 0 -35
1045 465 593 99820 1020 5 26 562 5
30 Out/In Out/In 10 62 Out/In Out/In 2130 5 21 55 0 0 064 5 36 16
99 Out/In Out/In 15 57 Out/In Out/In 1610 430 5 36 972 11
1089 445 614 1019
3/5/2019 3/5/20197:15 - 8:15 AM 5:00 - 6:00 PM
MD 355 MD 355Milestone Manor Ln Milestone Manor Ln
TEV:1599 TEV:1690
TEV:1824 TEV:19193/5/2019 3/5/2019
7:15 - 8:15 AM 5:00 - 6:00 PM
7:15 - 8:15 AM 5:00 - 6:00 PM
MD 355 MD 355Brink Rd Brink Rd
Greenbrook Dr Greenbrook DrTEV:1853 TEV:18993/5/2019 3/5/2019
2/13/2019 2/13/20197:15 - 8:15 AM 5:00 - 6:00 PM
MD 355 MD 355
MD 355 MD 355W Old Baltimore Rd W Old Baltimore Rd
TEV:1862 TEV:1946
TEV:1762 TEV:17133/5/2019 3/5/2019
7:15 - 8:15 AM 5:00 - 6:00 PM
7:15 - 8:15 AM 5:00 - 6:00 PM
MD 355 MD 355Canterfield/Rosecrest Canterfield/Rosecrest
New Cut Rd New Cut RdTEV:1718 TEV:15763/5/2019 3/5/2019
3/5/2019 3/5/20197:15 - 8:15 AM 5:00 - 6:00 PM
MD 355 MD 355
MD 355 MD 355Little Seneca Pkwy Little Seneca Pkwy
TEV:2163 TEV:1791

MD 355 Volume Calcs.xlsx2040 wo ODE Min Growth
960 661 593 92294 788 78 33 466 94
310 Out/In Out/In 446 169 Out/In Out/In 24972 150 34 6144 111 18 38178 185 51 150
294 Out/In Out/In 231 103 Out/In Out/In 345105 439 109 98 827 233
1151 653 667 1158
-7 3 -17 30
1144 650 650 11281138 6 644 6
0 Out/In Out/In 34 0 Out/In Out/In 236 6028 17
0 Out/In Out/In 12 0 Out/In Out/In 28644 6 1122 22
1166 650 661 1144
1 -1 1 -2
1167 651 662 114634 1127 6 33 616 13
40 Out/In Out/In 30 77 Out/In Out/In 1433 18 17 70 0 0 034 12 17 7
67 Out/In Out/In 6 34 Out/In Out/In 196 600 0 44 1122 6
1173 606 640 1172
-1 -1 0 -2
1172 607 640 11746 1166 18 622
35 Out/In Out/In 0 207 Out/In Out/In 018 36
167 109185 Out/In Out/In 0 145 Out/In Out/In 0
29 589 189 11381333 618 731 1327
-6 2 -3 16
1327 616 728 13111321 6 722 6
0 Out/In Out/In 11 0 Out/In Out/In 120 6
11 60 Out/In Out/In 12 0 Out/In Out/In 28
616 6 1305 221332 622 728 1327
20 -14 0 0
1352 636 728 13271166 186 627 101
0 Out/In Out/In 126 0 Out/In Out/In 273120 267
6 60 Out/In Out/In 192 0 Out/In Out/In 107
516 6 1060 61172 522 633 1066
0 0 1 0
1172 522 634 106622 1144 6 28 600 6
33 Out/In Out/In 12 64 Out/In Out/In 2333 6 22 66 0 0 072 6 39 17
111 Out/In Out/In 18 61 Out/In Out/In 1711 483 6 36 1038 11
1222 500 656 1085
3/5/2019 3/5/20197:15 - 8:15 AM 5:00 - 6:00 PM
MD 355 MD 355Milestone Manor Ln Milestone Manor Ln
TEV:1795 TEV:1803
TEV:2000 TEV:20673/5/2019 3/5/2019
7:15 - 8:15 AM 5:00 - 6:00 PM
7:15 - 8:15 AM 5:00 - 6:00 PM
MD 355 MD 355Brink Rd Brink Rd
Greenbrook Dr Greenbrook DrTEV:1960 TEV:20673/5/2019 3/5/2019
2/13/2019 2/13/20197:15 - 8:15 AM 5:00 - 6:00 PM
MD 355 MD 355
MD 355 MD 355W Old Baltimore Rd W Old Baltimore Rd
TEV:1975 TEV:2112
TEV:1870 TEV:18823/5/2019 3/5/2019
7:15 - 8:15 AM 5:00 - 6:00 PM
7:15 - 8:15 AM 5:00 - 6:00 PM
MD 355 MD 355Canterfield/Rosecrest Canterfield/Rosecrest
New Cut Rd New Cut RdTEV:1828 TEV:18173/5/2019 3/5/2019
3/5/2019 3/5/20197:15 - 8:15 AM 5:00 - 6:00 PM
MD 355 MD 355
MD 355 MD 355Little Seneca Pkwy Little Seneca Pkwy
TEV:2353 TEV:2103

MD 355 Volume Calcs.xlsx2040 wo ODE Rounded
965 660 595 92095 790 80 35 465 95
310 Out/In Out/In 445 175 Out/In Out/In 25070 150 35 6045 110 20 40180 185 50 150
295 Out/In Out/In 235 105 Out/In Out/In 350105 440 110 100 825 235
1155 655 665 1160
-10 5 -15 35
1145 650 650 11251140 5 645 5
0 Out/In Out/In 35 0 Out/In Out/In 205 5030 15
0 Out/In Out/In 10 0 Out/In Out/In 25645 5 1120 20
1170 650 660 1140
-5 -5 5 0
1165 655 665 114035 1125 5 35 615 15
40 Out/In Out/In 30 80 Out/In Out/In 1035 20 15 50 0 0 035 10 15 5
70 Out/In Out/In 5 30 Out/In Out/In 205 600 0 45 1120 5
1170 605 635 1170
0 -5 5 -5
1170 610 640 11755 1165 20 620
35 Out/In Out/In 0 210 Out/In Out/In 020 35
165 110185 Out/In Out/In 0 145 Out/In Out/In 0
30 590 190 11401330 620 730 1330
-5 5 -5 20
1325 615 725 13101320 5 720 5
0 Out/In Out/In 10 0 Out/In Out/In 100 5
10 50 Out/In Out/In 10 0 Out/In Out/In 25
615 5 1305 201330 620 725 1325
20 -15 0 0
1350 635 725 13251165 185 625 100
0 Out/In Out/In 125 0 Out/In Out/In 270120 265
5 50 Out/In Out/In 190 0 Out/In Out/In 105
515 5 1060 51170 520 630 1065
0 -5 5 0
1170 525 635 106520 1145 5 30 600 5
30 Out/In Out/In 10 65 Out/In Out/In 2035 5 20 55 0 0 070 5 40 15
110 Out/In Out/In 15 60 Out/In Out/In 1510 485 5 35 1040 10
1220 500 655 1085
3/5/2019 3/5/20197:15 - 8:15 AM 5:00 - 6:00 PM
MD 355 MD 355Milestone Manor Ln Milestone Manor Ln
TEV:1790 TEV:1800
TEV:1995 TEV:20603/5/2019 3/5/2019
7:15 - 8:15 AM 5:00 - 6:00 PM
7:15 - 8:15 AM 5:00 - 6:00 PM
MD 355 MD 355Brink Rd Brink Rd
Greenbrook Dr Greenbrook DrTEV:1955 TEV:20603/5/2019 3/5/2019
2/13/2019 2/13/20197:15 - 8:15 AM 5:00 - 6:00 PM
MD 355 MD 355
MD 355 MD 355W Old Baltimore Rd W Old Baltimore Rd
TEV:1975 TEV:2115
TEV:1870 TEV:18753/5/2019 3/5/2019
7:15 - 8:15 AM 5:00 - 6:00 PM
7:15 - 8:15 AM 5:00 - 6:00 PM
MD 355 MD 355Canterfield/Rosecrest Canterfield/Rosecrest
New Cut Rd New Cut RdTEV:1830 TEV:18103/5/2019 3/5/2019
3/5/2019 3/5/20197:15 - 8:15 AM 5:00 - 6:00 PM
MD 355 MD 355
MD 355 MD 355Little Seneca Pkwy Little Seneca Pkwy
TEV:2360 TEV:2110

MD 355 Volume Calcs.xlsx2040 wo ODE Balanced
Balanced upBalanced down
965 670 595 89595 790 80 35 465 95
310 Out/In Out/In 445 175 Out/In Out/In 25070 150 35 6045 110 20 40180 185 50 150
295 Out/In Out/In 235 105 Out/In Out/In 350105 450 110 100 800 235
1155 665 665 1135
0 0 0 0
1155 665 665 11351150 5 660 5
0 Out/In Out/In 35 0 Out/In Out/In 205 5030 15
0 Out/In Out/In 10 0 Out/In Out/In 25660 5 1130 20
1180 665 675 1150
0 0 0 0
1180 665 675 115035 1140 5 35 625 15
40 Out/In Out/In 30 80 Out/In Out/In 1035 20 15 50 0 0 035 10 15 5
70 Out/In Out/In 5 30 Out/In Out/In 205 610 0 45 1130 5
1185 615 645 1180
0 0 0 0
1185 615 645 11805 1180 20 625
35 Out/In Out/In 0 210 Out/In Out/In 020 35
165 110185 Out/In Out/In 0 145 Out/In Out/In 0
30 595 190 11451345 625 735 1335
0 0 0 0
1345 625 735 13351340 5 730 5
0 Out/In Out/In 10 0 Out/In Out/In 100 5
10 50 Out/In Out/In 10 0 Out/In Out/In 25
625 5 1330 201350 630 735 1350
0 0 0 0
1350 630 735 13501165 185 635 100
0 Out/In Out/In 125 0 Out/In Out/In 270120 265
5 50 Out/In Out/In 190 0 Out/In Out/In 105
510 5 1085 51170 515 640 1090
0 0 0 0
1170 515 640 109020 1145 5 30 605 5
30 Out/In Out/In 10 65 Out/In Out/In 2035 5 20 55 0 0 070 5 40 15
110 Out/In Out/In 15 60 Out/In Out/In 1510 475 5 35 1065 10
1220 490 660 1110
3/5/2019 3/5/20197:15 - 8:15 AM 5:00 - 6:00 PM
MD 355 MD 355Milestone Manor Ln Milestone Manor Ln
TEV:1780 TEV:1830
TEV:1990 TEV:20953/5/2019 3/5/2019
7:15 - 8:15 AM 5:00 - 6:00 PM
7:15 - 8:15 AM 5:00 - 6:00 PM
MD 355 MD 355Brink Rd Brink Rd
Greenbrook Dr Greenbrook DrTEV:1985 TEV:20953/5/2019 3/5/2019
2/13/2019 2/13/20197:15 - 8:15 AM 5:00 - 6:00 PM
MD 355 MD 355
MD 355 MD 355W Old Baltimore Rd W Old Baltimore Rd
TEV:1995 TEV:2125
TEV:1895 TEV:18953/5/2019 3/5/2019
7:15 - 8:15 AM 5:00 - 6:00 PM
7:15 - 8:15 AM 5:00 - 6:00 PM
MD 355 MD 355Canterfield/Rosecrest Canterfield/Rosecrest
New Cut Rd New Cut RdTEV:1855 TEV:18353/5/2019 3/5/2019
3/5/2019 3/5/20197:15 - 8:15 AM 5:00 - 6:00 PM
MD 355 MD 355
MD 355 MD 355Little Seneca Pkwy Little Seneca Pkwy
TEV:2370 TEV:2085

MD 355 Volume Calcs.xlsx2040 w ODE Raw
849 596 610 795594 226 29 283 227 100
1229 Out/In Out/In 405 801 Out/In Out/In 261436 43 296 48167 338 117 170522 24 163 43
1125 Out/In Out/In 213 576 Out/In Out/In 316297 117 17 348 451 99
772 431 433 898
112 -8 42 147
884 439 475 751881 3 470 5
0 Out/In Out/In 35 0 Out/In Out/In 233 5
32 180 Out/In Out/In 10 0 Out/In Out/In 26
436 7 746 21913 443 488 767
56 -66 34 -78
969 509 522 84528 935 6 18 497 7
39 Out/In Out/In 32 72 Out/In Out/In 1421 13 10 50 0 0 048 19 24 9
69 Out/In Out/In 6 34 Out/In Out/In 1911 475 0 54 830 12
1002 486 530 896
-5 -32 -9 -70
997 518 521 9665 992 15 506
27 Out/In Out/In 0 163 Out/In Out/In 014 24
131 90145 Out/In Out/In 0 114 Out/In Out/In 0
22 504 148 9421123 526 596 1090
0 4 0 16
1123 522 596 10741118 5 590 6
0 Out/In Out/In 10 0 Out/In Out/In 120 6
10 60 Out/In Out/In 10 0 Out/In Out/In 28
522 5 1068 221128 527 596 1090
-103 1 -5 3
1025 526 591 1087861 164 502 89
0 Out/In Out/In 118 0 Out/In Out/In 240114 235
4 50 Out/In Out/In 169 0 Out/In Out/In 93
412 5 852 4865 417 507 856
1 32 0 2
866 385 507 85417 845 4 22 481 4
25 Out/In Out/In 8 53 Out/In Out/In 1825 4 18 54 0 0 053 4 31 13
82 Out/In Out/In 12 49 Out/In Out/In 138 356 4 31 831 9
902 368 525 871
MD 355 MD 355Little Seneca Pkwy Little Seneca Pkwy
TEV:2810 TEV:23453/5/2019 3/5/2019
7:15 - 8:15 AM 5:00 - 6:00 PM
MD 355 MD 355New Cut Rd New Cut RdTEV:1362 TEV:12653/5/2019 3/5/2019
7:15 - 8:15 AM 5:00 - 6:00 PM
MD 355 MD 355Canterfield/Rosecrest Canterfield/Rosecrest
TEV:1556 TEV:14663/5/2019 3/5/2019
7:15 - 8:15 AM 5:00 - 6:00 PM
MD 355 MD 355W Old Baltimore Rd W Old Baltimore Rd
TEV:1668 TEV:17252/13/2019 2/13/2019
7:15 - 8:15 AM 5:00 - 6:00 PM
MD 355 MD 355Greenbrook Dr Greenbrook Dr
TEV:1660 TEV:16983/5/2019 3/5/2019
7:15 - 8:15 AM 5:00 - 6:00 PM
MD 355 MD 355Brink Rd Brink Rd
TEV:1560 TEV:16873/5/2019 3/5/2019
7:15 - 8:15 AM 5:00 - 6:00 PM
3/5/2019 3/5/20197:15 - 8:15 AM 5:00 - 6:00 PM
MD 355 MD 355Milestone Manor Ln Milestone Manor Ln
TEV:1324 TEV:1445
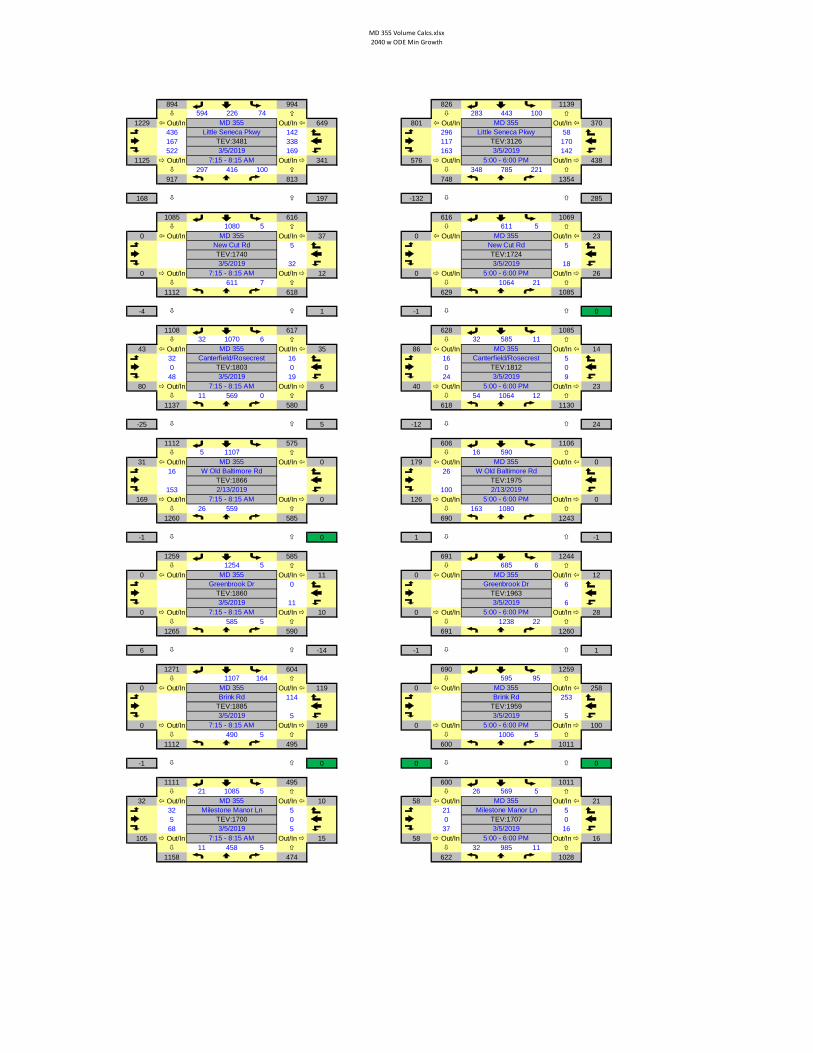
MD 355 Volume Calcs.xlsx2040 w ODE Min Growth
894 994 826 1139594 226 74 283 443 100
1229 Out/In Out/In 649 801 Out/In Out/In 370436 142 296 58167 338 117 170522 169 163 142
1125 Out/In Out/In 341 576 Out/In Out/In 438297 416 100 348 785 221
917 813 748 1354
168 197 -132 285
1085 616 616 10691080 5 611 5
0 Out/In Out/In 37 0 Out/In Out/In 235 5
32 180 Out/In Out/In 12 0 Out/In Out/In 26
611 7 1064 211112 618 629 1085
-4 1 -1 0
1108 617 628 108532 1070 6 32 585 11
43 Out/In Out/In 35 86 Out/In Out/In 1432 16 16 50 0 0 048 19 24 9
80 Out/In Out/In 6 40 Out/In Out/In 2311 569 0 54 1064 12
1137 580 618 1130
-25 5 -12 24
1112 575 606 11065 1107 16 590
31 Out/In Out/In 0 179 Out/In Out/In 016 26
153 100169 Out/In Out/In 0 126 Out/In Out/In 0
26 559 163 10801260 585 690 1243
-1 0 1 -1
1259 585 691 12441254 5 685 6
0 Out/In Out/In 11 0 Out/In Out/In 120 6
11 60 Out/In Out/In 10 0 Out/In Out/In 28
585 5 1238 221265 590 691 1260
6 -14 -1 1
1271 604 690 12591107 164 595 95
0 Out/In Out/In 119 0 Out/In Out/In 258114 253
5 50 Out/In Out/In 169 0 Out/In Out/In 100
490 5 1006 51112 495 600 1011
-1 0 0 0
1111 495 600 101121 1085 5 26 569 5
32 Out/In Out/In 10 58 Out/In Out/In 2132 5 21 55 0 0 068 5 37 16
105 Out/In Out/In 15 58 Out/In Out/In 1611 458 5 32 985 11
1158 474 622 1028
3/5/2019 3/5/20197:15 - 8:15 AM 5:00 - 6:00 PM
MD 355 MD 355Milestone Manor Ln Milestone Manor Ln
TEV:1700 TEV:1707
TEV:1885 TEV:19593/5/2019 3/5/2019
7:15 - 8:15 AM 5:00 - 6:00 PM
7:15 - 8:15 AM 5:00 - 6:00 PM
MD 355 MD 355Brink Rd Brink Rd
Greenbrook Dr Greenbrook DrTEV:1860 TEV:19633/5/2019 3/5/2019
2/13/2019 2/13/20197:15 - 8:15 AM 5:00 - 6:00 PM
MD 355 MD 355
MD 355 MD 355W Old Baltimore Rd W Old Baltimore Rd
TEV:1866 TEV:1975
TEV:1803 TEV:18123/5/2019 3/5/2019
7:15 - 8:15 AM 5:00 - 6:00 PM
7:15 - 8:15 AM 5:00 - 6:00 PM
MD 355 MD 355Canterfield/Rosecrest Canterfield/Rosecrest
New Cut Rd New Cut RdTEV:1740 TEV:17243/5/2019 3/5/2019
3/5/2019 3/5/20197:15 - 8:15 AM 5:00 - 6:00 PM
MD 355 MD 355
MD 355 MD 355Little Seneca Pkwy Little Seneca Pkwy
TEV:3481 TEV:3126

MD 355 Volume Calcs.xlsx2040 w ODE Rounded
895 990 830 1140595 225 75 285 445 100
1230 Out/In Out/In 650 805 Out/In Out/In 370435 140 295 60165 340 115 170520 170 165 140
1120 Out/In Out/In 340 575 Out/In Out/In 435295 415 100 350 785 220
915 810 750 1355
170 195 -135 285
1085 615 615 10701080 5 610 5
0 Out/In Out/In 35 0 Out/In Out/In 255 5030 20
0 Out/In Out/In 10 0 Out/In Out/In 25610 5 1065 20
1110 615 630 1085
-5 0 -5 0
1105 615 625 108530 1070 5 30 585 10
40 Out/In Out/In 35 85 Out/In Out/In 1530 15 15 50 0 0 050 20 25 10
80 Out/In Out/In 5 40 Out/In Out/In 2010 570 0 55 1065 10
1140 580 620 1130
-30 5 -15 25
1110 575 605 11055 1105 15 590
30 Out/In Out/In 0 180 Out/In Out/In 015 25
155 100170 Out/In Out/In 0 125 Out/In Out/In 0
25 560 165 10801260 585 690 1245
0 0 0 0
1260 585 690 12451255 5 685 5
0 Out/In Out/In 10 0 Out/In Out/In 100 5
10 50 Out/In Out/In 10 0 Out/In Out/In 25
585 5 1240 201265 590 690 1260
5 -15 0 0
1270 605 690 12601105 165 595 95
0 Out/In Out/In 120 0 Out/In Out/In 260115 255
5 50 Out/In Out/In 170 0 Out/In Out/In 100
490 5 1005 51110 495 600 1010
0 0 0 0
1110 495 600 101020 1085 5 25 570 5
30 Out/In Out/In 10 55 Out/In Out/In 2030 5 20 55 0 0 070 5 35 15
105 Out/In Out/In 15 55 Out/In Out/In 1510 460 5 30 985 10
1160 475 620 1025
3/5/2019 3/5/20197:15 - 8:15 AM 5:00 - 6:00 PM
MD 355 MD 355Milestone Manor Ln Milestone Manor Ln
TEV:1700 TEV:1700
TEV:1885 TEV:19603/5/2019 3/5/2019
7:15 - 8:15 AM 5:00 - 6:00 PM
7:15 - 8:15 AM 5:00 - 6:00 PM
MD 355 MD 355Brink Rd Brink Rd
Greenbrook Dr Greenbrook DrTEV:1860 TEV:19603/5/2019 3/5/2019
2/13/2019 2/13/20197:15 - 8:15 AM 5:00 - 6:00 PM
MD 355 MD 355
MD 355 MD 355W Old Baltimore Rd W Old Baltimore Rd
TEV:1865 TEV:1975
TEV:1800 TEV:18103/5/2019 3/5/2019
7:15 - 8:15 AM 5:00 - 6:00 PM
7:15 - 8:15 AM 5:00 - 6:00 PM
MD 355 MD 355Canterfield/Rosecrest Canterfield/Rosecrest
New Cut Rd New Cut RdTEV:1735 TEV:17253/5/2019 3/5/2019
3/5/2019 3/5/20197:15 - 8:15 AM 5:00 - 6:00 PM
MD 355 MD 355
MD 355 MD 355Little Seneca Pkwy Little Seneca Pkwy
TEV:3475 TEV:3130

MD 355 Volume Calcs.xlsx2040 w ODE Balanced
Balanced upBalanced down
970 790 780 1040195 700 75 285 395 100
680 Out/In Out/In 650 565 Out/In Out/In 370275 140 250 60165 340 265 170200 170 70 140
640 Out/In Out/In 340 585 Out/In Out/In 585145 375 100 110 730 220
1070 620 605 1060
0 0 0 0
1070 620 605 10601065 5 600 5
0 Out/In Out/In 35 0 Out/In Out/In 255 5030 20
0 Out/In Out/In 10 0 Out/In Out/In 25615 5 1055 20
1095 620 620 1075
0 0 0 0
1095 620 620 107530 1060 5 30 580 10
40 Out/In Out/In 35 85 Out/In Out/In 1530 15 15 50 0 0 050 20 25 10
80 Out/In Out/In 5 40 Out/In Out/In 2010 575 0 55 1055 10
1130 585 615 1120
0 0 0 0
1130 585 615 11205 1125 15 600
30 Out/In Out/In 0 180 Out/In Out/In 015 25
155 100170 Out/In Out/In 0 125 Out/In Out/In 0
25 570 165 10951280 595 700 1260
0 0 0 0
1280 595 700 12601275 5 695 5
0 Out/In Out/In 10 0 Out/In Out/In 100 5
10 50 Out/In Out/In 10 0 Out/In Out/In 25
595 5 1255 201285 600 700 1275
0 0 0 0
1285 600 700 12751120 165 605 95
0 Out/In Out/In 120 0 Out/In Out/In 260115 255
5 50 Out/In Out/In 170 0 Out/In Out/In 100
485 5 1020 51125 490 610 1025
0 0 0 0
1125 490 610 102520 1100 5 25 580 5
30 Out/In Out/In 10 55 Out/In Out/In 2030 5 20 55 0 0 070 5 35 15
105 Out/In Out/In 15 55 Out/In Out/In 1510 455 5 30 1000 10
1175 470 630 1040
7:15 - 8:15 AM 5:00 - 6:00 PM
3/5/2019 3/5/20197:15 - 8:15 AM 5:00 - 6:00 PM
MD 355 MD 355Milestone Manor Ln Milestone Manor Ln
TEV:1710 TEV:1725
Brink Rd Brink RdTEV:1895 TEV:19853/5/2019 3/5/2019
3/5/2019 3/5/20197:15 - 8:15 AM 5:00 - 6:00 PM
MD 355 MD 355
MD 355 MD 355Greenbrook Dr Greenbrook Dr
TEV:1890 TEV:1985
TEV:1895 TEV:20002/13/2019 2/13/2019
7:15 - 8:15 AM 5:00 - 6:00 PM
7:15 - 8:15 AM 5:00 - 6:00 PM
MD 355 MD 355W Old Baltimore Rd W Old Baltimore Rd
Canterfield/Rosecrest Canterfield/RosecrestTEV:1795 TEV:17953/5/2019 3/5/2019
3/5/2019 3/5/20197:15 - 8:15 AM 5:00 - 6:00 PM
MD 355 MD 355
MD 355 MD 355New Cut Rd New Cut RdTEV:1725 TEV:1705
SBR: decreased by 400 in AM to account for increase of 475 in SBT
EBL: decreased in both peaks by half of the decrease in EBREBT: increased in PM to more closely match reverse volume in AM
MD 355 MD 355Little Seneca Pkwy Little Seneca Pkwy
TEV:2880 TEV:27953/5/2019 3/5/2019
7:15 - 8:15 AM 5:00 - 6:00 PM

MD 355 Volume Calcs with Widening.xlsx2040 Build 2 wo ODE Raw
1178 749 693 1042613 535 30 103 502 88
1876 Out/In Out/In 528 681 Out/In Out/In 339418 45 111 47175 415 68 1161313 68 246 176
1906 Out/In Out/In 252 425 Out/In Out/In 473848 286 47 462 884 317
1916 1181 924 1663
-293 93 -10 59
1623 1088 914 16041614 9 906 8
0 Out/In Out/In 38 0 Out/In Out/In 3124 8014 23
0 Out/In Out/In 12 0 Out/In Out/In 391064 3 1596 31
1628 1067 929 1627
-72 161 32 20
1556 906 961 160734 1516 6 22 926 13
39 Out/In Out/In 33 72 Out/In Out/In 1342 23 11 60 0 0 026 10 22 7
68 Out/In Out/In 6 33 Out/In Out/In 195 841 0 50 1590 6
1552 846 955 1646
53 45 -63 60
1605 801 892 15865 1600 16 876
32 Out/In Out/In 0 189 Out/In Out/In 016 22
157 113173 Out/In Out/In 0 135 Out/In Out/In 0
27 785 173 15641757 812 989 1737
2 -4 1 -45
1759 816 990 17821754 5 984 6
0 Out/In Out/In 10 0 Out/In Out/In 126
10 60 Out/In Out/In 10 0 Out/In Out/In 29
816 5 1776 231764 821 990 1799
-194 -2 -65 -5
1570 823 925 18041379 191 815 110
0 Out/In Out/In 141 0 Out/In Out/In 323137 317
4 60 Out/In Out/In 195 0 Out/In Out/In 116
686 4 1487 61383 690 821 1493
-1 74 0 111
1382 616 821 138226 1349 7 36 778 7
39 Out/In Out/In 14 86 Out/In Out/In 2939 7 29 77 0 0 085 7 50 22
131 Out/In Out/In 21 79 Out/In Out/In 2213 570 7 50 1346 15
1441 590 850 1411
MD 355 MD 355Little Seneca Pkwy Little Seneca Pkwy
TEV:4793 TEV:31203/5/2019 3/5/2019
7:15 - 8:15 AM 5:00 - 6:00 PM
MD 355 MD 355New Cut Rd New Cut RdTEV:2728 TEV:25723/5/2019 3/5/2019
7:15 - 8:15 AM 5:00 - 6:00 PM
MD 355 MD 355Canterfield/Rosecrest Canterfield/Rosecrest
TEV:2503 TEV:26533/5/2019 3/5/2019
7:15 - 8:15 AM 5:00 - 6:00 PM
MD 355 MD 355W Old Baltimore Rd W Old Baltimore Rd
TEV:2590 TEV:27642/13/2019 2/13/2019
7:15 - 8:15 AM 5:00 - 6:00 PM
MD 355 MD 355Greenbrook Dr Greenbrook Dr
TEV:2590 TEV:28013/5/2019 3/5/2019
7:15 - 8:15 AM 5:00 - 6:00 PM
MD 355 MD 355Brink Rd Brink Rd
TEV:2401 TEV:27413/5/2019 3/5/2019
7:15 - 8:15 AM 5:00 - 6:00 PM
3/5/2019 3/5/20197:15 - 8:15 AM 5:00 - 6:00 PM
MD 355 MD 355Milestone Manor Ln Milestone Manor Ln
TEV:2117 TEV:2340
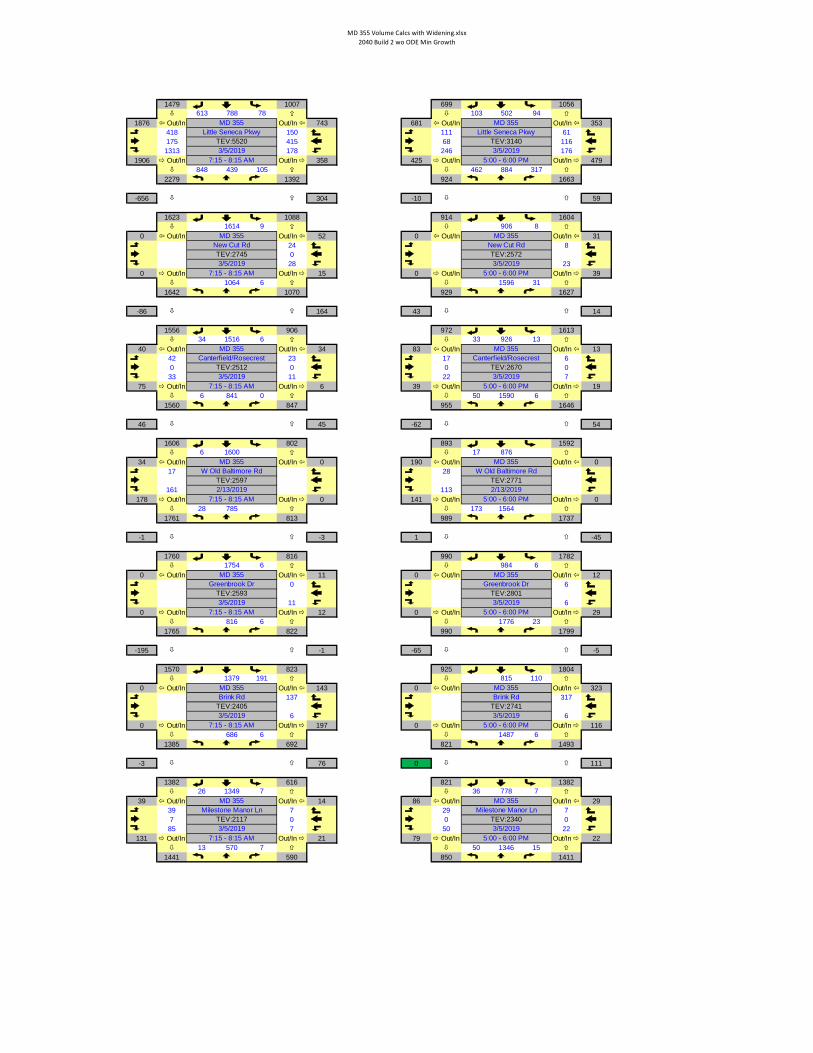
MD 355 Volume Calcs with Widening.xlsx2040 Build 2 wo ODE Min Growth
1479 1007 699 1056613 788 78 103 502 94
1876 Out/In Out/In 743 681 Out/In Out/In 353418 150 111 61175 415 68 1161313 178 246 176
1906 Out/In Out/In 358 425 Out/In Out/In 479848 439 105 462 884 317
2279 1392 924 1663
-656 304 -10 59
1623 1088 914 16041614 9 906 8
0 Out/In Out/In 52 0 Out/In Out/In 3124 8028 23
0 Out/In Out/In 15 0 Out/In Out/In 391064 6 1596 31
1642 1070 929 1627
-86 164 43 14
1556 906 972 161334 1516 6 33 926 13
40 Out/In Out/In 34 83 Out/In Out/In 1342 23 17 60 0 0 033 11 22 7
75 Out/In Out/In 6 39 Out/In Out/In 196 841 0 50 1590 6
1560 847 955 1646
46 45 -62 54
1606 802 893 15926 1600 17 876
34 Out/In Out/In 0 190 Out/In Out/In 017 28
161 113178 Out/In Out/In 0 141 Out/In Out/In 0
28 785 173 15641761 813 989 1737
-1 -3 1 -45
1760 816 990 17821754 6 984 6
0 Out/In Out/In 11 0 Out/In Out/In 120 6
11 60 Out/In Out/In 12 0 Out/In Out/In 29
816 6 1776 231765 822 990 1799
-195 -1 -65 -5
1570 823 925 18041379 191 815 110
0 Out/In Out/In 143 0 Out/In Out/In 323137 317
6 60 Out/In Out/In 197 0 Out/In Out/In 116
686 6 1487 61385 692 821 1493
-3 76 0 111
1382 616 821 138226 1349 7 36 778 7
39 Out/In Out/In 14 86 Out/In Out/In 2939 7 29 77 0 0 085 7 50 22
131 Out/In Out/In 21 79 Out/In Out/In 2213 570 7 50 1346 15
1441 590 850 1411
MD 355 MD 355Little Seneca Pkwy Little Seneca Pkwy
TEV:5520 TEV:31403/5/2019 3/5/2019
7:15 - 8:15 AM 5:00 - 6:00 PM
MD 355 MD 355New Cut Rd New Cut RdTEV:2745 TEV:25723/5/2019 3/5/2019
7:15 - 8:15 AM 5:00 - 6:00 PM
MD 355 MD 355Canterfield/Rosecrest Canterfield/Rosecrest
TEV:2512 TEV:26703/5/2019 3/5/2019
7:15 - 8:15 AM 5:00 - 6:00 PM
MD 355 MD 355W Old Baltimore Rd W Old Baltimore Rd
TEV:2597 TEV:27712/13/2019 2/13/2019
7:15 - 8:15 AM 5:00 - 6:00 PM
MD 355 MD 355Greenbrook Dr Greenbrook Dr
TEV:2593 TEV:28013/5/2019 3/5/2019
7:15 - 8:15 AM 5:00 - 6:00 PM
MD 355 MD 355Brink Rd Brink Rd
TEV:2405 TEV:27413/5/2019 3/5/2019
7:15 - 8:15 AM 5:00 - 6:00 PM
3/5/2019 3/5/20197:15 - 8:15 AM 5:00 - 6:00 PM
MD 355 MD 355Milestone Manor Ln Milestone Manor Ln
TEV:2117 TEV:2340
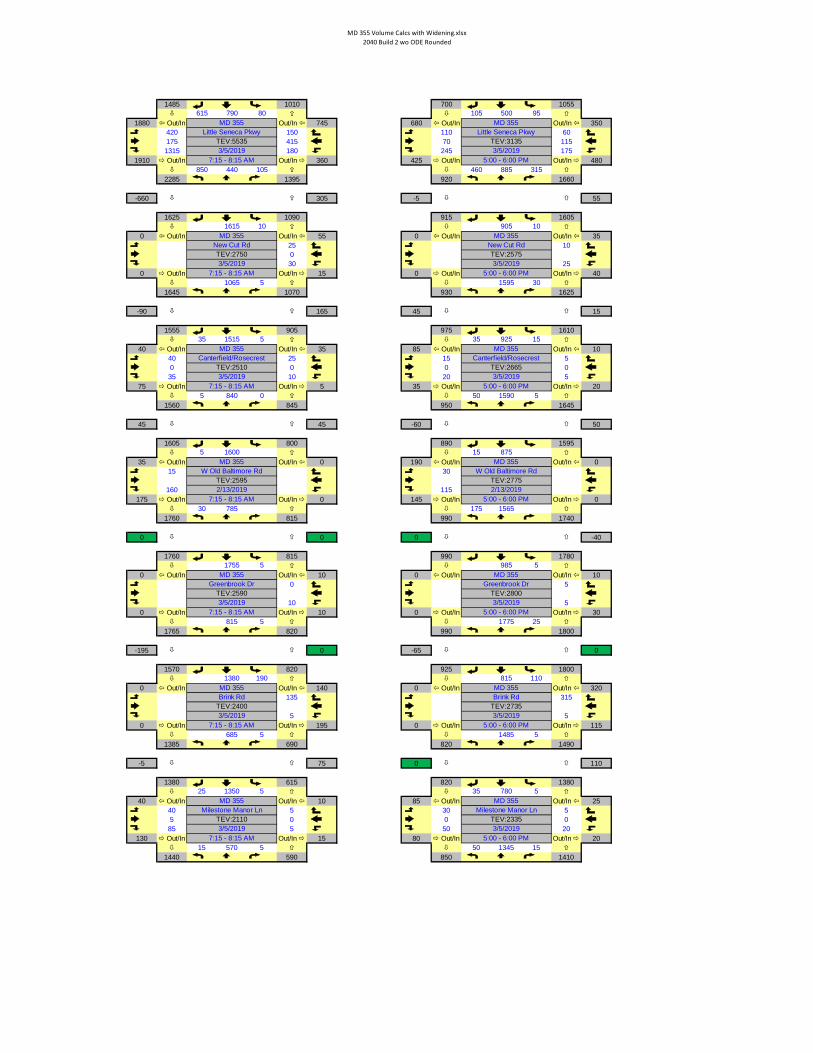
MD 355 Volume Calcs with Widening.xlsx2040 Build 2 wo ODE Rounded
1485 1010 700 1055615 790 80 105 500 95
1880 Out/In Out/In 745 680 Out/In Out/In 350420 150 110 60175 415 70 1151315 180 245 175
1910 Out/In Out/In 360 425 Out/In Out/In 480850 440 105 460 885 315
2285 1395 920 1660
-660 305 -5 55
1625 1090 915 16051615 10 905 10
0 Out/In Out/In 55 0 Out/In Out/In 3525 10030 25
0 Out/In Out/In 15 0 Out/In Out/In 401065 5 1595 30
1645 1070 930 1625
-90 165 45 15
1555 905 975 161035 1515 5 35 925 15
40 Out/In Out/In 35 85 Out/In Out/In 1040 25 15 50 0 0 035 10 20 5
75 Out/In Out/In 5 35 Out/In Out/In 205 840 0 50 1590 5
1560 845 950 1645
45 45 -60 50
1605 800 890 15955 1600 15 875
35 Out/In Out/In 0 190 Out/In Out/In 015 30
160 115175 Out/In Out/In 0 145 Out/In Out/In 0
30 785 175 15651760 815 990 1740
0 0 0 -40
1760 815 990 17801755 5 985 5
0 Out/In Out/In 10 0 Out/In Out/In 100 5
10 50 Out/In Out/In 10 0 Out/In Out/In 30
815 5 1775 251765 820 990 1800
-195 0 -65 0
1570 820 925 18001380 190 815 110
0 Out/In Out/In 140 0 Out/In Out/In 320135 315
5 50 Out/In Out/In 195 0 Out/In Out/In 115
685 5 1485 51385 690 820 1490
-5 75 0 110
1380 615 820 138025 1350 5 35 780 5
40 Out/In Out/In 10 85 Out/In Out/In 2540 5 30 55 0 0 085 5 50 20
130 Out/In Out/In 15 80 Out/In Out/In 2015 570 5 50 1345 15
1440 590 850 1410
MD 355 MD 355Little Seneca Pkwy Little Seneca Pkwy
TEV:5535 TEV:31353/5/2019 3/5/2019
7:15 - 8:15 AM 5:00 - 6:00 PM
MD 355 MD 355New Cut Rd New Cut RdTEV:2750 TEV:25753/5/2019 3/5/2019
7:15 - 8:15 AM 5:00 - 6:00 PM
MD 355 MD 355Canterfield/Rosecrest Canterfield/Rosecrest
TEV:2510 TEV:26653/5/2019 3/5/2019
7:15 - 8:15 AM 5:00 - 6:00 PM
MD 355 MD 355W Old Baltimore Rd W Old Baltimore Rd
TEV:2595 TEV:27752/13/2019 2/13/2019
7:15 - 8:15 AM 5:00 - 6:00 PM
MD 355 MD 355Greenbrook Dr Greenbrook Dr
TEV:2590 TEV:28003/5/2019 3/5/2019
7:15 - 8:15 AM 5:00 - 6:00 PM
MD 355 MD 355Brink Rd Brink Rd
TEV:2400 TEV:27353/5/2019 3/5/2019
7:15 - 8:15 AM 5:00 - 6:00 PM
3/5/2019 3/5/20197:15 - 8:15 AM 5:00 - 6:00 PM
MD 355 MD 355Milestone Manor Ln Milestone Manor Ln
TEV:2110 TEV:2335

MD 355 Volume Calcs with Widening.xlsx2040 Build 2 wo ODE Balanced
Balanced upBalanced down
1410 945 775 1090440 890 80 155 525 95
1270 Out/In Out/In 755 700 Out/In Out/In 350245 150 160 60175 415 120 115715 190 235 175
1135 Out/In Out/In 370 515 Out/In Out/In 530415 550 115 430 870 315
1795 1080 935 1615
0 0 0 0
1795 1080 935 16151795 0 935 0
0 Out/In Out/In 5 0 Out/In Out/In 105 10
0 0 Note: WBL to be restricted0 Out/In Out/In 5 0 Out/In Out/In 30
1075 5 1605 301795 1080 935 1635
0 0 0 0
1795 1080 935 163535 1755 5 35 885 15
40 Out/In Out/In 35 85 Out/In Out/In 1040 25 15 50 0 0 035 10 20 5
75 Out/In Out/In 5 35 Out/In Out/In 205 1015 0 50 1615 5
1800 1020 910 1670
0 0 0 0
1800 1020 910 16705 1795 15 895
35 Out/In Out/In 0 190 Out/In Out/In 015 30
160 115175 Out/In Out/In 0 145 Out/In Out/In 0
30 1005 175 16401955 1035 1010 1815
0 0 0 0
1955 1035 1010 18151950 5 1005 5
0 Out/In Out/In 10 0 Out/In Out/In 100 5
10 50 Out/In Out/In 10 0 Out/In Out/In 30
1035 5 1810 251960 1040 1010 1835
0 0 0 0
1960 1040 1010 18351770 190 900 110
0 Out/In Out/In 140 0 Out/In Out/In 320135 315
5 50 Out/In Out/In 195 0 Out/In Out/In 115
905 5 1520 51775 910 905 1525
0 0 0 0
1775 910 905 152525 1745 5 35 865 5
40 Out/In Out/In 10 85 Out/In Out/In 2540 5 30 55 0 0 085 5 50 20
130 Out/In Out/In 15 80 Out/In Out/In 2015 865 5 50 1490 15
1835 885 935 1555
MD 355 MD 355Little Seneca Pkwy Little Seneca Pkwy
TEV:4380 TEV:32553/5/2019 3/5/2019
7:15 - 8:15 AM 5:00 - 6:00 PM
MD 355 MD 355New Cut Rd New Cut RdTEV:2880 TEV:25803/5/2019 3/5/2019
7:15 - 8:15 AM 5:00 - 6:00 PM
MD 355 MD 355Canterfield/Rosecrest Canterfield/Rosecrest
TEV:2925 TEV:26503/5/2019 3/5/2019
7:15 - 8:15 AM 5:00 - 6:00 PM
MD 355 MD 355W Old Baltimore Rd W Old Baltimore Rd
TEV:3010 TEV:28702/13/2019 2/13/2019
7:15 - 8:15 AM 5:00 - 6:00 PM
MD 355 MD 355Greenbrook Dr Greenbrook Dr
TEV:3005 TEV:28553/5/2019 3/5/2019
7:15 - 8:15 AM 5:00 - 6:00 PM
MD 355 MD 355Brink Rd Brink Rd
TEV:3010 TEV:28553/5/2019 3/5/2019
7:15 - 8:15 AM 5:00 - 6:00 PM
3/5/2019 3/5/20197:15 - 8:15 AM 5:00 - 6:00 PM
MD 355 MD 355Milestone Manor Ln Milestone Manor Ln
TEV:2800 TEV:2565
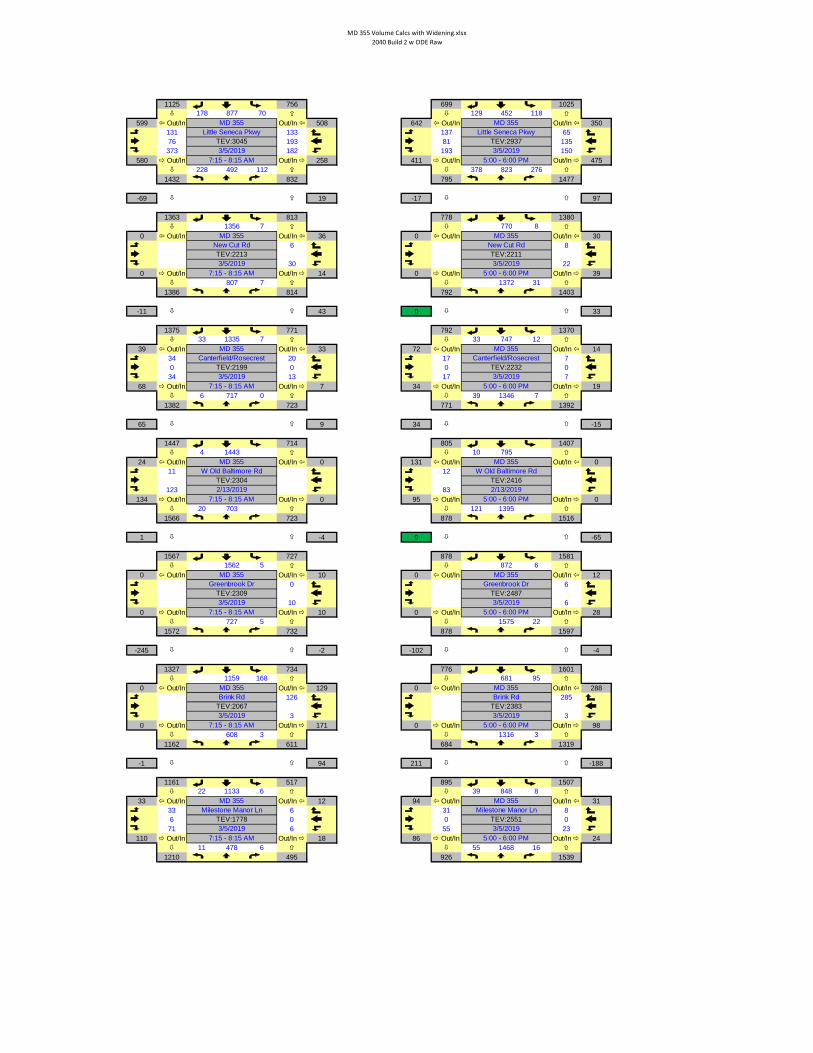
MD 355 Volume Calcs with Widening.xlsx2040 Build 2 w ODE Raw
1125 756 699 1025178 877 70 129 452 118
599 Out/In Out/In 508 642 Out/In Out/In 350131 133 137 6576 193 81 135373 182 193 150
580 Out/In Out/In 258 411 Out/In Out/In 475228 492 112 378 823 276
1432 832 795 1477
-69 19 -17 97
1363 813 778 13801356 7 770 8
0 Out/In Out/In 36 0 Out/In Out/In 306 8
30 220 Out/In Out/In 14 0 Out/In Out/In 39
807 7 1372 311386 814 792 1403
-11 43 0 33
1375 771 792 137033 1335 7 33 747 12
39 Out/In Out/In 33 72 Out/In Out/In 1434 20 17 70 0 0 034 13 17 7
68 Out/In Out/In 7 34 Out/In Out/In 196 717 0 39 1346 7
1382 723 771 1392
65 9 34 -15
1447 714 805 14074 1443 10 795
24 Out/In Out/In 0 131 Out/In Out/In 011 12
123 83134 Out/In Out/In 0 95 Out/In Out/In 0
20 703 121 13951566 723 878 1516
1 -4 0 -65
1567 727 878 15811562 5 872 6
0 Out/In Out/In 10 0 Out/In Out/In 120 6
10 60 Out/In Out/In 10 0 Out/In Out/In 28
727 5 1575 221572 732 878 1597
-245 -2 -102 -4
1327 734 776 16011159 168 681 95
0 Out/In Out/In 129 0 Out/In Out/In 288126 285
3 30 Out/In Out/In 171 0 Out/In Out/In 98
608 3 1316 31162 611 684 1319
-1 94 211 -188
1161 517 895 150722 1133 6 39 848 8
33 Out/In Out/In 12 94 Out/In Out/In 3133 6 31 86 0 0 071 6 55 23
110 Out/In Out/In 18 86 Out/In Out/In 2411 478 6 55 1468 16
1210 495 926 1539
3/5/2019 3/5/20197:15 - 8:15 AM 5:00 - 6:00 PM
MD 355 MD 355Milestone Manor Ln Milestone Manor Ln
TEV:1778 TEV:2551
TEV:2067 TEV:23833/5/2019 3/5/2019
7:15 - 8:15 AM 5:00 - 6:00 PM
7:15 - 8:15 AM 5:00 - 6:00 PM
MD 355 MD 355Brink Rd Brink Rd
Greenbrook Dr Greenbrook DrTEV:2309 TEV:24873/5/2019 3/5/2019
2/13/2019 2/13/20197:15 - 8:15 AM 5:00 - 6:00 PM
MD 355 MD 355
MD 355 MD 355W Old Baltimore Rd W Old Baltimore Rd
TEV:2304 TEV:2416
TEV:2199 TEV:22323/5/2019 3/5/2019
7:15 - 8:15 AM 5:00 - 6:00 PM
7:15 - 8:15 AM 5:00 - 6:00 PM
MD 355 MD 355Canterfield/Rosecrest Canterfield/Rosecrest
New Cut Rd New Cut RdTEV:2213 TEV:22113/5/2019 3/5/2019
3/5/2019 3/5/20197:15 - 8:15 AM 5:00 - 6:00 PM
MD 355 MD 355
MD 355 MD 355Little Seneca Pkwy Little Seneca Pkwy
TEV:3045 TEV:2937

MD 355 Volume Calcs with Widening.xlsx2040 Build 2 w ODE Min Growth
478 765 699 1025178 226 74 129 452 118
599 Out/In Out/In 517 642 Out/In Out/In 350131 142 137 6576 193 81 135373 182 193 150
580 Out/In Out/In 262 411 Out/In Out/In 475228 492 112 378 823 276
781 832 795 1477
582 19 -17 97
1363 813 778 13801356 7 770 8
0 Out/In Out/In 36 0 Out/In Out/In 306 8
30 220 Out/In Out/In 14 0 Out/In Out/In 39
807 7 1372 311386 814 792 1403
-11 43 0 33
1375 771 792 137033 1335 7 33 747 12
39 Out/In Out/In 33 72 Out/In Out/In 1434 20 17 70 0 0 034 13 17 7
68 Out/In Out/In 7 34 Out/In Out/In 196 717 0 39 1346 7
1382 723 771 1392
66 4 40 -29
1448 719 811 14215 1443 16 795
31 Out/In Out/In 0 179 Out/In Out/In 016 26
153 100169 Out/In Out/In 0 126 Out/In Out/In 0
26 703 163 13951596 729 895 1558
-29 2 -17 -23
1567 727 878 15811562 5 872 6
0 Out/In Out/In 11 0 Out/In Out/In 120 6
11 60 Out/In Out/In 10 0 Out/In Out/In 28
727 5 1575 221573 732 878 1597
-246 -2 -102 -4
1327 734 776 16011159 168 681 95
0 Out/In Out/In 131 0 Out/In Out/In 290126 285
5 50 Out/In Out/In 173 0 Out/In Out/In 100
608 5 1316 51164 613 686 1321
-3 96 209 -186
1161 517 895 150722 1133 6 39 848 8
33 Out/In Out/In 12 94 Out/In Out/In 3133 6 31 86 0 0 071 6 55 23
110 Out/In Out/In 18 86 Out/In Out/In 2411 478 6 55 1468 16
1210 495 926 1539
MD 355 MD 355Little Seneca Pkwy Little Seneca Pkwy
TEV:2407 TEV:29373/5/2019 3/5/2019
7:15 - 8:15 AM 5:00 - 6:00 PM
MD 355 MD 355New Cut Rd New Cut RdTEV:2213 TEV:22113/5/2019 3/5/2019
7:15 - 8:15 AM 5:00 - 6:00 PM
MD 355 MD 355Canterfield/Rosecrest Canterfield/Rosecrest
TEV:2199 TEV:22323/5/2019 3/5/2019
7:15 - 8:15 AM 5:00 - 6:00 PM
MD 355 MD 355W Old Baltimore Rd W Old Baltimore Rd
TEV:2346 TEV:24952/13/2019 2/13/2019
7:15 - 8:15 AM 5:00 - 6:00 PM
MD 355 MD 355Greenbrook Dr Greenbrook Dr
TEV:2310 TEV:24873/5/2019 3/5/2019
7:15 - 8:15 AM 5:00 - 6:00 PM
MD 355 MD 355Brink Rd Brink Rd
TEV:2071 TEV:23873/5/2019 3/5/2019
7:15 - 8:15 AM 5:00 - 6:00 PM
3/5/2019 3/5/20197:15 - 8:15 AM 5:00 - 6:00 PM
MD 355 MD 355Milestone Manor Ln Milestone Manor Ln
TEV:1778 TEV:2551

MD 355 Volume Calcs with Widening.xlsx2040 Build 2 w ODE Rounded
480 760 700 1025180 225 75 130 450 120
605 Out/In Out/In 515 645 Out/In Out/In 350130 140 135 6575 195 80 135375 180 195 150
580 Out/In Out/In 260 410 Out/In Out/In 475230 490 110 380 825 275
780 830 795 1480
580 20 -15 100
1360 810 780 13801355 5 770 10
0 Out/In Out/In 35 0 Out/In Out/In 305 10030 20
0 Out/In Out/In 10 0 Out/In Out/In 40805 5 1370 30
1385 810 790 1400
-10 40 0 35
1375 770 790 136535 1335 5 35 745 10
40 Out/In Out/In 35 75 Out/In Out/In 1035 20 15 50 0 0 035 15 15 5
70 Out/In Out/In 5 30 Out/In Out/In 155 715 0 40 1345 5
1385 720 765 1390
65 0 45 -30
1450 720 810 14205 1445 15 795
30 Out/In Out/In 0 180 Out/In Out/In 015 25
155 100170 Out/In Out/In 0 125 Out/In Out/In 0
25 705 165 13951600 730 895 1560
-35 5 -20 -20
1565 725 875 15801560 5 870 5
0 Out/In Out/In 10 0 Out/In Out/In 100 5
10 50 Out/In Out/In 10 0 Out/In Out/In 25
725 5 1575 201570 730 875 1595
-240 -5 -100 -5
1330 735 775 16001160 170 680 95
0 Out/In Out/In 130 0 Out/In Out/In 290125 285
5 50 Out/In Out/In 175 0 Out/In Out/In 100
610 5 1315 51165 615 685 1320
-5 95 215 -190
1160 520 900 151020 1135 5 40 850 10
30 Out/In Out/In 10 95 Out/In Out/In 3535 5 30 105 0 0 070 5 55 25
110 Out/In Out/In 15 85 Out/In Out/In 2510 480 5 55 1470 15
1210 495 930 1540
MD 355 MD 355Little Seneca Pkwy Little Seneca Pkwy
TEV:2405 TEV:29403/5/2019 3/5/2019
7:15 - 8:15 AM 5:00 - 6:00 PM
MD 355 MD 355New Cut Rd New Cut RdTEV:2205 TEV:22103/5/2019 3/5/2019
7:15 - 8:15 AM 5:00 - 6:00 PM
MD 355 MD 355Canterfield/Rosecrest Canterfield/Rosecrest
TEV:2200 TEV:22203/5/2019 3/5/2019
7:15 - 8:15 AM 5:00 - 6:00 PM
MD 355 MD 355W Old Baltimore Rd W Old Baltimore Rd
TEV:2350 TEV:24952/13/2019 2/13/2019
7:15 - 8:15 AM 5:00 - 6:00 PM
MD 355 MD 355Greenbrook Dr Greenbrook Dr
TEV:2305 TEV:24803/5/2019 3/5/2019
7:15 - 8:15 AM 5:00 - 6:00 PM
MD 355 MD 355Brink Rd Brink Rd
TEV:2075 TEV:23853/5/2019 3/5/2019
7:15 - 8:15 AM 5:00 - 6:00 PM
3/5/2019 3/5/20197:15 - 8:15 AM 5:00 - 6:00 PM
MD 355 MD 355Milestone Manor Ln Milestone Manor Ln
TEV:1775 TEV:2560

MD 355 Volume Calcs with Widening.xlsx2040 Build 2 w ODE Balanced
Balanced upBalanced down
1015 710 700 1025180 760 75 130 450 120
810 Out/In Out/In 745 615 Out/In Out/In 350130 140 135 65185 425 80 135510 180 175 150
825 Out/In Out/In 370 390 Out/In Out/In 475205 440 110 350 825 275
1450 755 775 1450
0 0 0 0
1450 755 775 14501450 775
0 Out/In Out/In 5 0 Out/In Out/In 105 10
Note: WBL to be restricted0 Out/In Out/In 5 0 Out/In Out/In 30
750 5 1440 301450 755 775 1470
0 0 0 0
1450 755 775 147035 1410 5 35 730 10
40 Out/In Out/In 35 75 Out/In Out/In 1035 20 15 50 0 0 035 15 15 5
70 Out/In Out/In 5 30 Out/In Out/In 155 700 0 40 1450 5
1460 705 750 1495
0 0 0 0
1460 705 750 14955 1455 15 735
30 Out/In Out/In 0 180 Out/In Out/In 015 25
155 100170 Out/In Out/In 0 125 Out/In Out/In 0
25 690 165 14701610 715 835 1635
0 0 0 0
1610 715 835 16351605 5 830 5
0 Out/In Out/In 10 0 Out/In Out/In 100 5
10 50 Out/In Out/In 10 0 Out/In Out/In 25
715 5 1630 201615 720 835 1650
0 0 0 0
1615 720 835 16501445 170 740 95
0 Out/In Out/In 130 0 Out/In Out/In 290125 285
5 50 Out/In Out/In 175 0 Out/In Out/In 100
595 5 1365 51450 600 745 1370
0 0 0 0
1450 600 745 137020 1425 5 40 695 10
30 Out/In Out/In 10 95 Out/In Out/In 3535 5 30 105 0 0 070 5 55 25
110 Out/In Out/In 15 85 Out/In Out/In 2510 560 5 55 1330 15
1500 575 775 1400
3/5/2019 3/5/20197:15 - 8:15 AM 5:00 - 6:00 PM
MD 355 MD 355Little Seneca Pkwy Little Seneca Pkwy
TEV:3340 TEV:2890
MD 355 MD 355New Cut Rd New Cut RdTEV:2210 TEV:22553/5/2019 3/5/2019
7:15 - 8:15 AM 5:00 - 6:00 PM
MD 355 MD 355Canterfield/Rosecrest Canterfield/Rosecrest
TEV:2260 TEV:23103/5/2019 3/5/2019
7:15 - 8:15 AM 5:00 - 6:00 PM
MD 355 MD 355W Old Baltimore Rd W Old Baltimore Rd
TEV:2345 TEV:25102/13/2019 2/13/2019
7:15 - 8:15 AM 5:00 - 6:00 PM
MD 355 MD 355Greenbrook Dr Greenbrook Dr
TEV:2340 TEV:24953/5/2019 3/5/2019
7:15 - 8:15 AM 5:00 - 6:00 PM
MD 355 MD 355Brink Rd Brink Rd
TEV:2345 TEV:24953/5/2019 3/5/2019
7:15 - 8:15 AM 5:00 - 6:00 PM
3/5/2019 3/5/20197:15 - 8:15 AM 5:00 - 6:00 PM
MD 355 MD 355Milestone Manor Ln Milestone Manor Ln
TEV:2145 TEV:2265
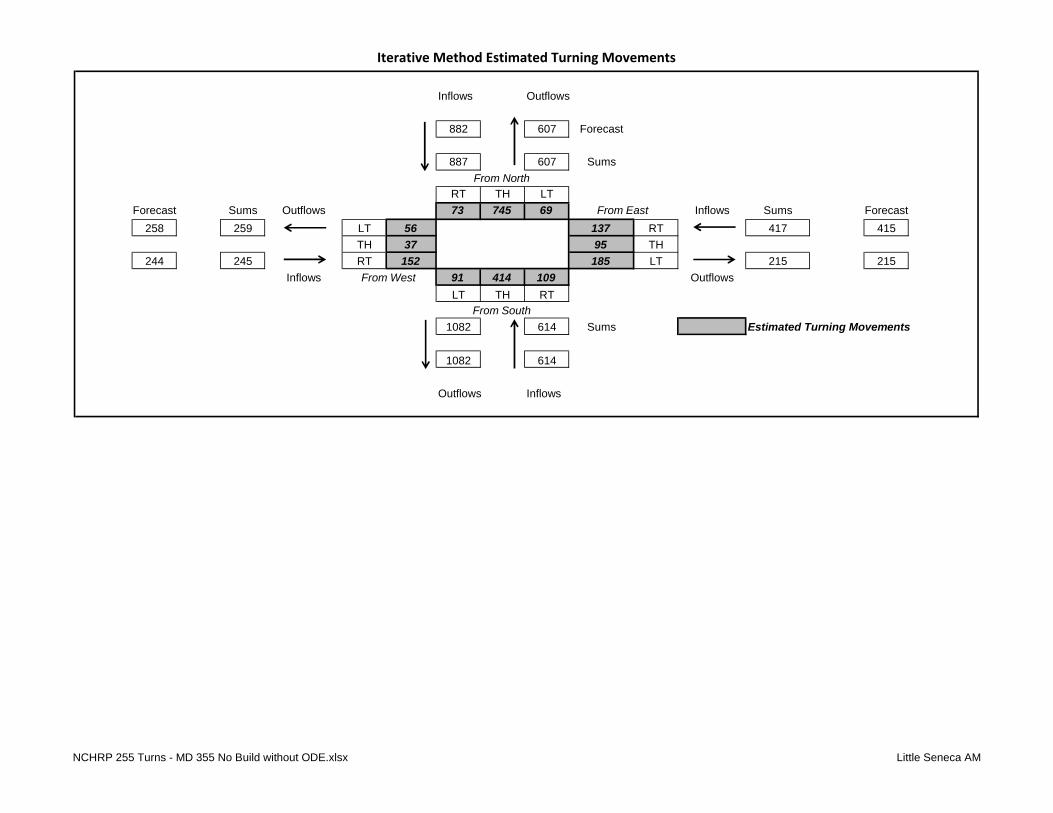
Iterative Method Estimated Turning Movements
Inflows Outflows
882 607 Forecast
887 607 Sums
RT TH LTForecast Sums Outflows 73 745 69 Inflows Sums Forecast
258 259 LT 56 137 RT 417 415TH 37 95 TH
244 245 RT 152 185 LT 215 215Inflows 91 414 109 Outflows
LT TH RT
1082 614 Sums Estimated Turning Movements
1082 614
Outflows Inflows
From West
From South
From North
From East
NCHRP 255 Turns - MD 355 No Build without ODE.xlsx Little Seneca AM

Iterative Method Estimated Turning Movements
Inflows Outflows
478 746 Forecast
487 746 Sums
RT TH LTForecast Sums Outflows 33 364 90 Inflows Sums Forecast
169 169 LT 34 56 RT 229 225TH 18 38 TH
101 103 RT 51 135 LT 326 326Inflows 98 656 218 Outflows
LT TH RT
550 972 Sums Estimated Turning Movements
550 954
Outflows Inflows
From West
From South
From North
From East
NCHRP 255 Turns - MD 355 No Build without ODE.xlsx Little Seneca PM
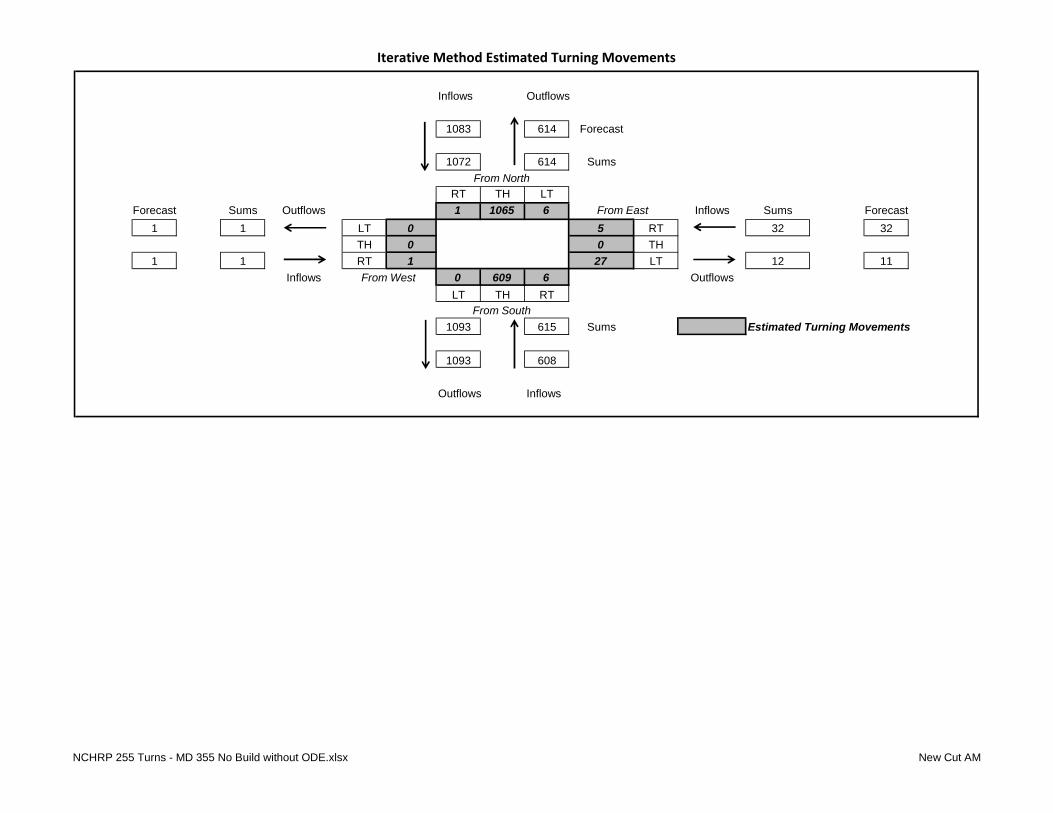
Iterative Method Estimated Turning Movements
Inflows Outflows
1083 614 Forecast
1072 614 Sums
RT TH LTForecast Sums Outflows 1 1065 6 Inflows Sums Forecast
1 1 LT 0 5 RT 32 32TH 0 0 TH
1 1 RT 1 27 LT 12 11Inflows 0 609 6 Outflows
LT TH RT
1093 615 Sums Estimated Turning Movements
1093 608
Outflows Inflows
From West
From South
From North
From East
NCHRP 255 Turns - MD 355 No Build without ODE.xlsx New Cut AM

Iterative Method Estimated Turning Movements
Inflows Outflows
551 954 Forecast
584 954 Sums
RT TH LTForecast Sums Outflows 1 578 5 Inflows Sums Forecast
1 1 LT 0 5 RT 22 21TH 0 0 TH
1 1 RT 1 17 LT 27 27Inflows 0 949 22 Outflows
LT TH RT
596 971 Sums Estimated Turning Movements
596 1030
Outflows Inflows
From West
From South
From North
From East
NCHRP 255 Turns - MD 355 No Build without ODE.xlsx New Cut PM

Iterative Method Estimated Turning Movements
Inflows Outflows
1092 608 Forecast
1102 609 Sums
RT TH LTForecast Sums Outflows 34 1062 6 Inflows Sums Forecast
39 39 LT 32 18 RT 30 30TH 0 0 TH
66 66 RT 34 12 LT 6 6Inflows 5 559 0 Outflows
LT TH RT
1108 564 Sums Estimated Turning Movements
1108 572
Outflows Inflows
From West
From South
From North
From East
NCHRP 255 Turns - MD 355 No Build without ODE.xlsx Canterfield Rosecrest AM

Iterative Method Estimated Turning Movements
Inflows Outflows
595 1030 Forecast
608 1031 Sums
RT TH LTForecast Sums Outflows 28 567 13 Inflows Sums Forecast
72 72 LT 16 7 RT 14 13TH 0 0 TH
33 33 RT 17 7 LT 19 19Inflows 44 1008 6 Outflows
LT TH RT
591 1058 Sums Estimated Turning Movements
592 1082
Outflows Inflows
From West
From South
From North
From East
NCHRP 255 Turns - MD 355 No Build without ODE.xlsx Canterfield Rosecrest PM
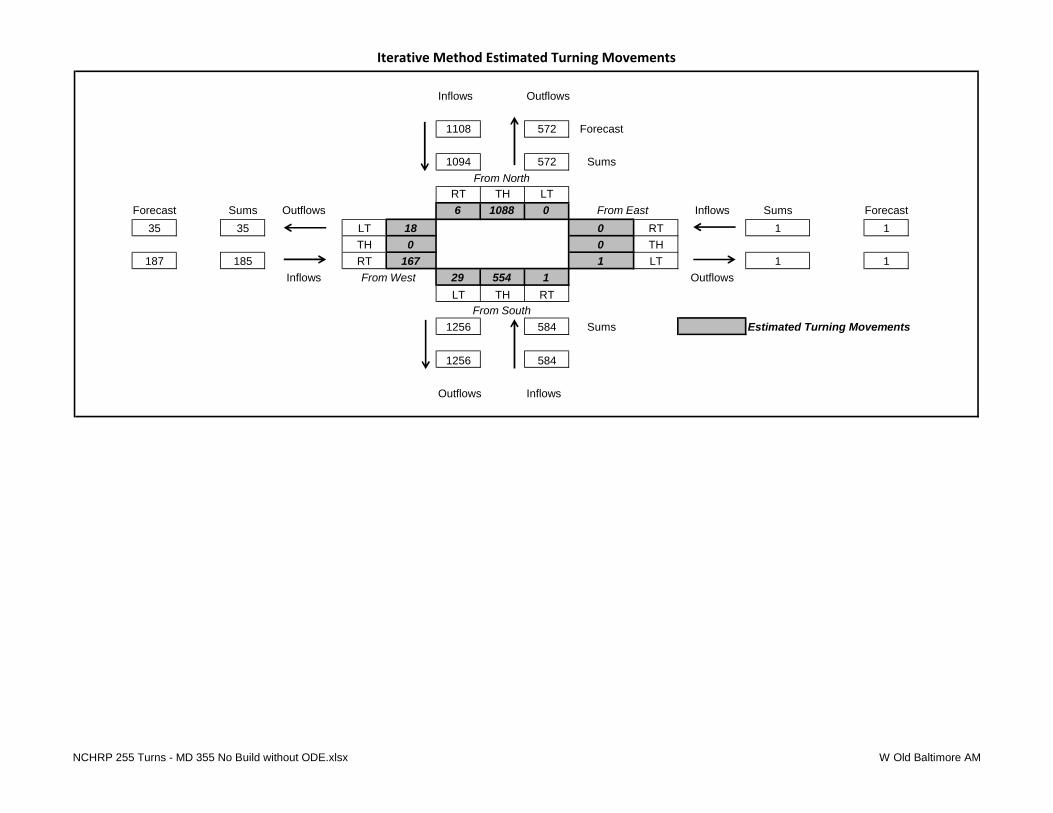
Iterative Method Estimated Turning Movements
Inflows Outflows
1108 572 Forecast
1094 572 Sums
RT TH LTForecast Sums Outflows 6 1088 0 Inflows Sums Forecast
35 35 LT 18 0 RT 1 1TH 0 0 TH
187 185 RT 167 1 LT 1 1Inflows 29 554 1 Outflows
LT TH RT
1256 584 Sums Estimated Turning Movements
1256 584
Outflows Inflows
From West
From South
From North
From East
NCHRP 255 Turns - MD 355 No Build without ODE.xlsx W Old Baltimore AM

Iterative Method Estimated Turning Movements
Inflows Outflows
587 1072 Forecast
577 1072 Sums
RT TH LTForecast Sums Outflows 18 559 0 Inflows Sums Forecast
207 207 LT 36 1 RT 1 1TH 0 0 TH
146 145 RT 109 0 LT 1 1Inflows 189 1035 1 Outflows
LT TH RT
668 1225 Sums Estimated Turning Movements
668 1205
Outflows Inflows
From West
From South
From North
From East
NCHRP 255 Turns - MD 355 No Build without ODE.xlsx W Old Baltimore PM

Iterative Method Estimated Turning Movements
Inflows Outflows
1256 583 Forecast
1256 583 Sums
RT TH LTForecast Sums Outflows 1 1250 5 Inflows Sums Forecast
1 1 LT 0 0 RT 10 10TH 0 0 TH
1 1 RT 1 10 LT 10 10Inflows 0 583 5 Outflows
LT TH RT
1261 588 Sums Estimated Turning Movements
1261 588
Outflows Inflows
From West
From South
From North
From East
NCHRP 255 Turns - MD 355 No Build without ODE.xlsx Greenbrook AM

Iterative Method Estimated Turning Movements
Inflows Outflows
669 1204 Forecast
668 1204 Sums
RT TH LTForecast Sums Outflows 1 662 5 Inflows Sums Forecast
1 1 LT 0 6 RT 12 11TH 0 0 TH
1 1 RT 1 6 LT 27 27Inflows 0 1198 22 Outflows
LT TH RT
669 1220 Sums Estimated Turning Movements
669 1219
Outflows Inflows
From West
From South
From North
From East
NCHRP 255 Turns - MD 355 No Build without ODE.xlsx Greenbrook PM

Iterative Method Estimated Turning Movements
Inflows Outflows
1261 588 Forecast
1225 588 Sums
RT TH LTForecast Sums Outflows 1 1038 186 Inflows Sums Forecast
1 1 LT 0 120 RT 126 124TH 0 0 TH
1 1 RT 1 6 LT 192 192Inflows 0 468 6 Outflows
LT TH RT
1045 474 Sums Estimated Turning Movements
1045 465
Outflows Inflows
From West
From South
From North
From East
NCHRP 255 Turns - MD 355 No Build without ODE.xlsx Brink AM

Iterative Method Estimated Turning Movements
Inflows Outflows
669 1219 Forecast
689 1219 Sums
RT TH LTForecast Sums Outflows 1 587 101 Inflows Sums Forecast
1 1 LT 0 262 RT 268 277TH 0 0 TH
1 1 RT 1 6 LT 107 107Inflows 0 957 6 Outflows
LT TH RT
594 963 Sums Estimated Turning Movements
594 998
Outflows Inflows
From West
From South
From North
From East
NCHRP 255 Turns - MD 355 No Build without ODE.xlsx Brink PM

Iterative Method Estimated Turning Movements
Inflows Outflows
1044 465 Forecast
1045 465 Sums
RT TH LTForecast Sums Outflows 20 1020 5 Inflows Sums Forecast
30 30 LT 30 5 RT 10 10TH 5 0 TH
99 99 RT 64 5 LT 15 15Inflows 10 430 5 Outflows
LT TH RT
1089 445 Sums Estimated Turning Movements
1089 446
Outflows Inflows
From West
From South
From North
From East
NCHRP 255 Turns - MD 355 No Build without ODE.xlsx Milestone Manor AM

Iterative Method Estimated Turning Movements
Inflows Outflows
593 998 Forecast
593 998 Sums
RT TH LTForecast Sums Outflows 26 562 5 Inflows Sums Forecast
62 62 LT 21 5 RT 21 21TH 0 0 TH
57 57 RT 36 16 LT 16 16Inflows 36 972 11 Outflows
LT TH RT
614 1019 Sums Estimated Turning Movements
614 1019
Outflows Inflows
From West
From South
From North
From East
NCHRP 255 Turns - MD 355 No Build without ODE.xlsx Milestone Manor PM
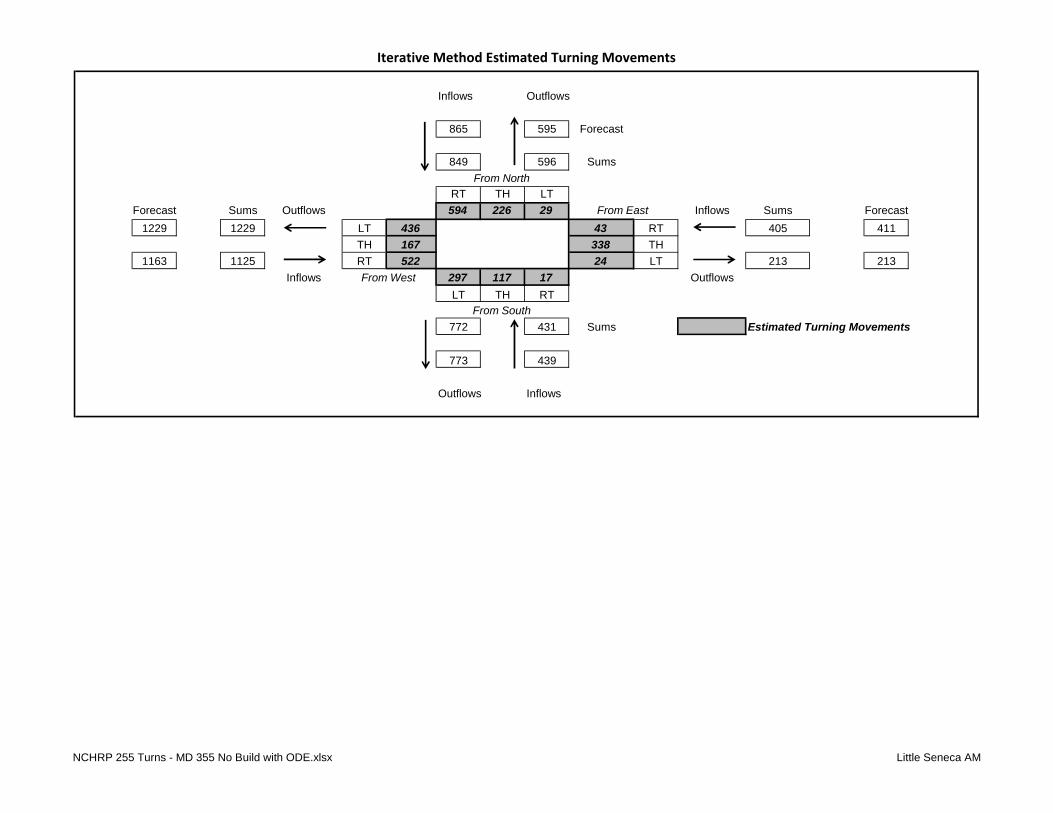
Iterative Method Estimated Turning Movements
Inflows Outflows
865 595 Forecast
849 596 Sums
RT TH LTForecast Sums Outflows 594 226 29 Inflows Sums Forecast
1229 1229 LT 436 43 RT 405 411TH 167 338 TH
1163 1125 RT 522 24 LT 213 213Inflows 297 117 17 Outflows
LT TH RT
772 431 Sums Estimated Turning Movements
773 439
Outflows Inflows
From West
From South
From North
From East
NCHRP 255 Turns - MD 355 No Build with ODE.xlsx Little Seneca AM

Iterative Method Estimated Turning Movements
Inflows Outflows
509 795 Forecast
610 795 Sums
RT TH LTForecast Sums Outflows 283 227 100 Inflows Sums Forecast
801 801 LT 296 48 RT 261 218TH 117 170 TH
481 576 RT 163 43 LT 316 317Inflows 348 451 99 Outflows
LT TH RT
433 898 Sums Estimated Turning Movements
433 751
Outflows Inflows
From West
From South
From North
From East
NCHRP 255 Turns - MD 355 No Build with ODE.xlsx Little Seneca PM
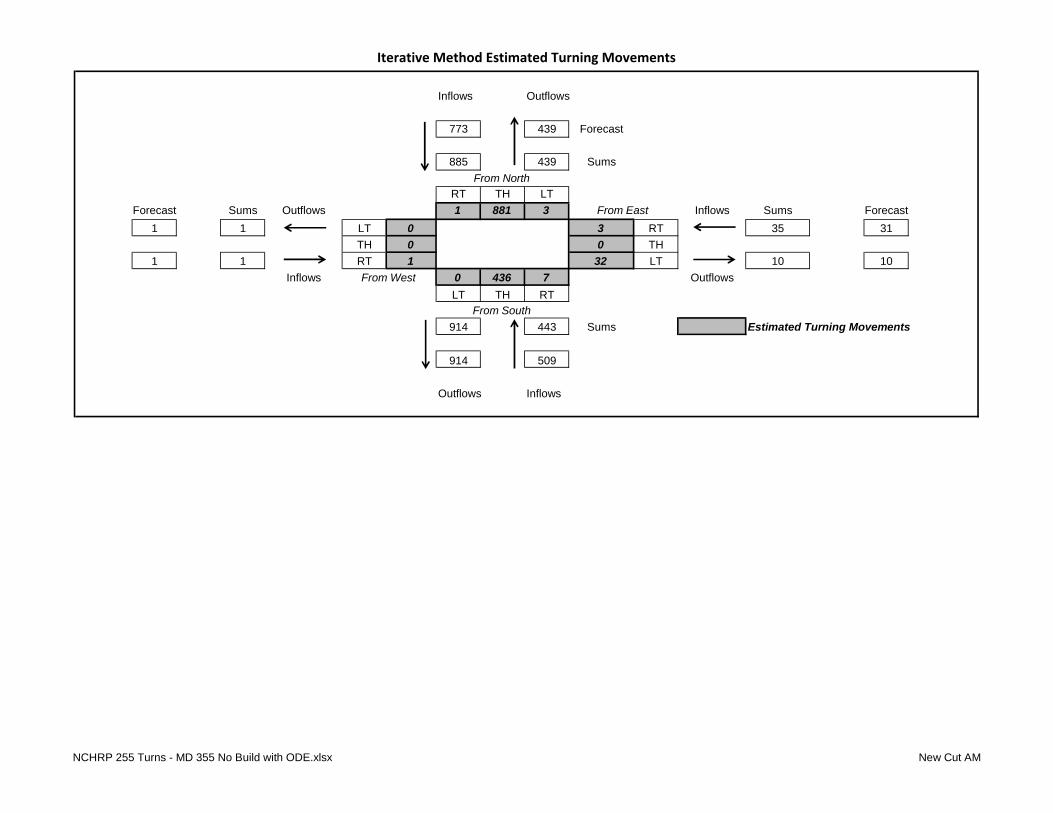
Iterative Method Estimated Turning Movements
Inflows Outflows
773 439 Forecast
885 439 Sums
RT TH LTForecast Sums Outflows 1 881 3 Inflows Sums Forecast
1 1 LT 0 3 RT 35 31TH 0 0 TH
1 1 RT 1 32 LT 10 10Inflows 0 436 7 Outflows
LT TH RT
914 443 Sums Estimated Turning Movements
914 509
Outflows Inflows
From West
From South
From North
From East
NCHRP 255 Turns - MD 355 No Build with ODE.xlsx New Cut AM

Iterative Method Estimated Turning Movements
Inflows Outflows
434 751 Forecast
476 751 Sums
RT TH LTForecast Sums Outflows 1 470 5 Inflows Sums Forecast
1 1 LT 0 5 RT 23 21TH 0 0 TH
1 1 RT 1 18 LT 26 26Inflows 0 746 21 Outflows
LT TH RT
489 767 Sums Estimated Turning Movements
489 845
Outflows Inflows
From West
From South
From North
From East
NCHRP 255 Turns - MD 355 No Build with ODE.xlsx New Cut PM

Iterative Method Estimated Turning Movements
Inflows Outflows
914 509 Forecast
969 509 Sums
RT TH LTForecast Sums Outflows 28 935 6 Inflows Sums Forecast
39 39 LT 21 13 RT 32 32TH 0 0 TH
67 69 RT 48 19 LT 6 6Inflows 11 475 0 Outflows
LT TH RT
1002 486 Sums Estimated Turning Movements
1002 518
Outflows Inflows
From West
From South
From North
From East
NCHRP 255 Turns - MD 355 No Build with ODE.xlsx Canterfield Rosecrest AM

Iterative Method Estimated Turning Movements
Inflows Outflows
488 845 Forecast
522 845 Sums
RT TH LTForecast Sums Outflows 18 497 7 Inflows Sums Forecast
72 72 LT 10 5 RT 14 13TH 0 0 TH
33 34 RT 24 9 LT 19 19Inflows 54 830 12 Outflows
LT TH RT
530 896 Sums Estimated Turning Movements
529 966
Outflows Inflows
From West
From South
From North
From East
NCHRP 255 Turns - MD 355 No Build with ODE.xlsx Canterfield Rosecrest PM

Iterative Method Estimated Turning Movements
Inflows Outflows
1002 518 Forecast
997 518 Sums
RT TH LTForecast Sums Outflows 5 992 0 Inflows Sums Forecast
27 27 LT 14 0 RT 1 1TH 0 0 TH
146 145 RT 131 1 LT 1 1Inflows 22 504 1 Outflows
LT TH RT
1124 527 Sums Estimated Turning Movements
1124 523
Outflows Inflows
From West
From South
From North
From East
NCHRP 255 Turns - MD 355 No Build with ODE.xlsx W Old Baltimore AM

Iterative Method Estimated Turning Movements
Inflows Outflows
529 967 Forecast
521 967 Sums
RT TH LTForecast Sums Outflows 15 506 0 Inflows Sums Forecast
163 163 LT 24 1 RT 1 1TH 0 0 TH
115 114 RT 90 0 LT 1 1Inflows 148 942 1 Outflows
LT TH RT
596 1091 Sums Estimated Turning Movements
596 1075
Outflows Inflows
From West
From South
From North
From East
NCHRP 255 Turns - MD 355 No Build with ODE.xlsx W Old Baltimore PM

Iterative Method Estimated Turning Movements
Inflows Outflows
1124 522 Forecast
1124 522 Sums
RT TH LTForecast Sums Outflows 1 1118 5 Inflows Sums Forecast
1 1 LT 0 0 RT 10 10TH 0 0 TH
1 1 RT 1 10 LT 10 10Inflows 0 522 5 Outflows
LT TH RT
1129 527 Sums Estimated Turning Movements
1129 526
Outflows Inflows
From West
From South
From North
From East
NCHRP 255 Turns - MD 355 No Build with ODE.xlsx Greenbrook AM

Iterative Method Estimated Turning Movements
Inflows Outflows
597 1074 Forecast
597 1074 Sums
RT TH LTForecast Sums Outflows 1 590 6 Inflows Sums Forecast
1 1 LT 0 6 RT 12 11TH 0 0 TH
1 1 RT 1 6 LT 28 28Inflows 0 1068 22 Outflows
LT TH RT
597 1090 Sums Estimated Turning Movements
597 1087
Outflows Inflows
From West
From South
From North
From East
NCHRP 255 Turns - MD 355 No Build with ODE.xlsx Greenbrook PM

Iterative Method Estimated Turning Movements
Inflows Outflows
1129 526 Forecast
1026 526 Sums
RT TH LTForecast Sums Outflows 1 861 164 Inflows Sums Forecast
1 1 LT 0 114 RT 118 109TH 0 0 TH
1 1 RT 1 4 LT 169 169Inflows 0 412 5 Outflows
LT TH RT
866 417 Sums Estimated Turning Movements
866 385
Outflows Inflows
From West
From South
From North
From East
NCHRP 255 Turns - MD 355 No Build with ODE.xlsx Brink AM

Iterative Method Estimated Turning Movements
Inflows Outflows
597 1087 Forecast
592 1087 Sums
RT TH LTForecast Sums Outflows 1 502 89 Inflows Sums Forecast
1 1 LT 0 235 RT 240 240TH 0 0 TH
1 1 RT 1 5 LT 93 93Inflows 0 852 4 Outflows
LT TH RT
508 856 Sums Estimated Turning Movements
508 854
Outflows Inflows
From West
From South
From North
From East
NCHRP 255 Turns - MD 355 No Build with ODE.xlsx Brink PM

Iterative Method Estimated Turning Movements
Inflows Outflows
865 385 Forecast
866 385 Sums
RT TH LTForecast Sums Outflows 17 845 4 Inflows Sums Forecast
25 25 LT 25 4 RT 8 8TH 4 0 TH
82 82 RT 53 4 LT 12 12Inflows 8 356 4 Outflows
LT TH RT
902 368 Sums Estimated Turning Movements
902 369
Outflows Inflows
From West
From South
From North
From East
NCHRP 255 Turns - MD 355 No Build with ODE.xlsx Milestone Manor AM
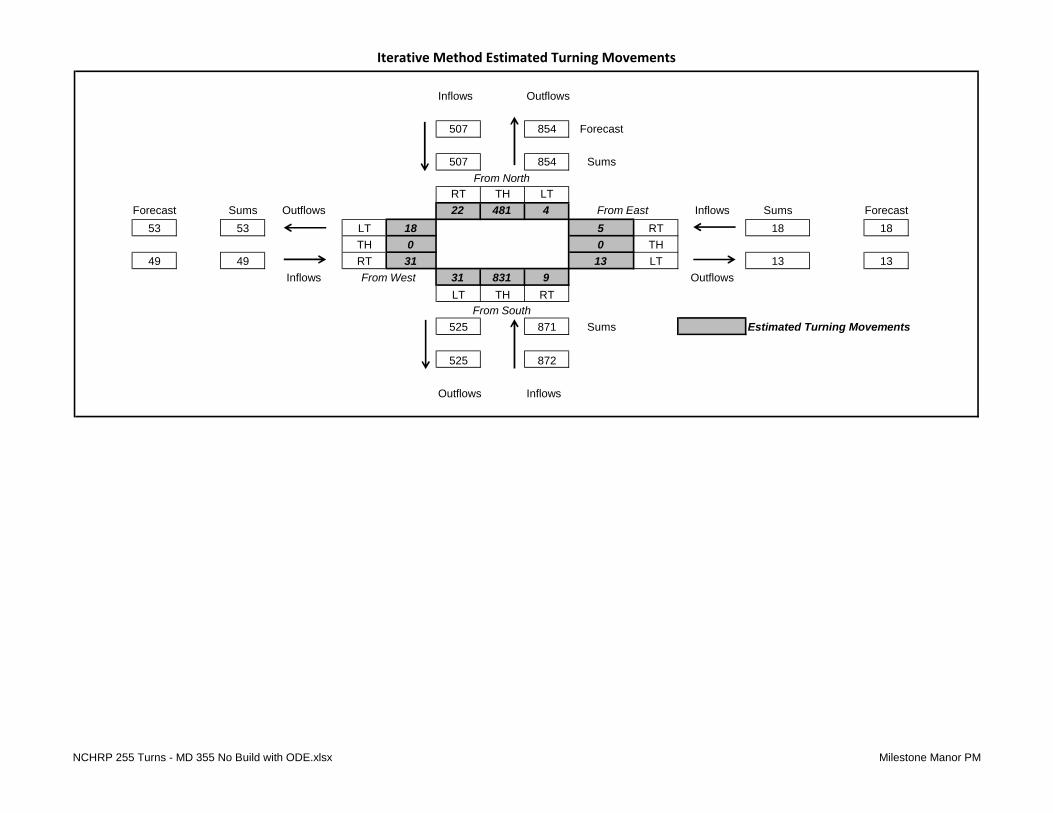
Iterative Method Estimated Turning Movements
Inflows Outflows
507 854 Forecast
507 854 Sums
RT TH LTForecast Sums Outflows 22 481 4 Inflows Sums Forecast
53 53 LT 18 5 RT 18 18TH 0 0 TH
49 49 RT 31 13 LT 13 13Inflows 31 831 9 Outflows
LT TH RT
525 871 Sums Estimated Turning Movements
525 872
Outflows Inflows
From West
From South
From North
From East
NCHRP 255 Turns - MD 355 No Build with ODE.xlsx Milestone Manor PM
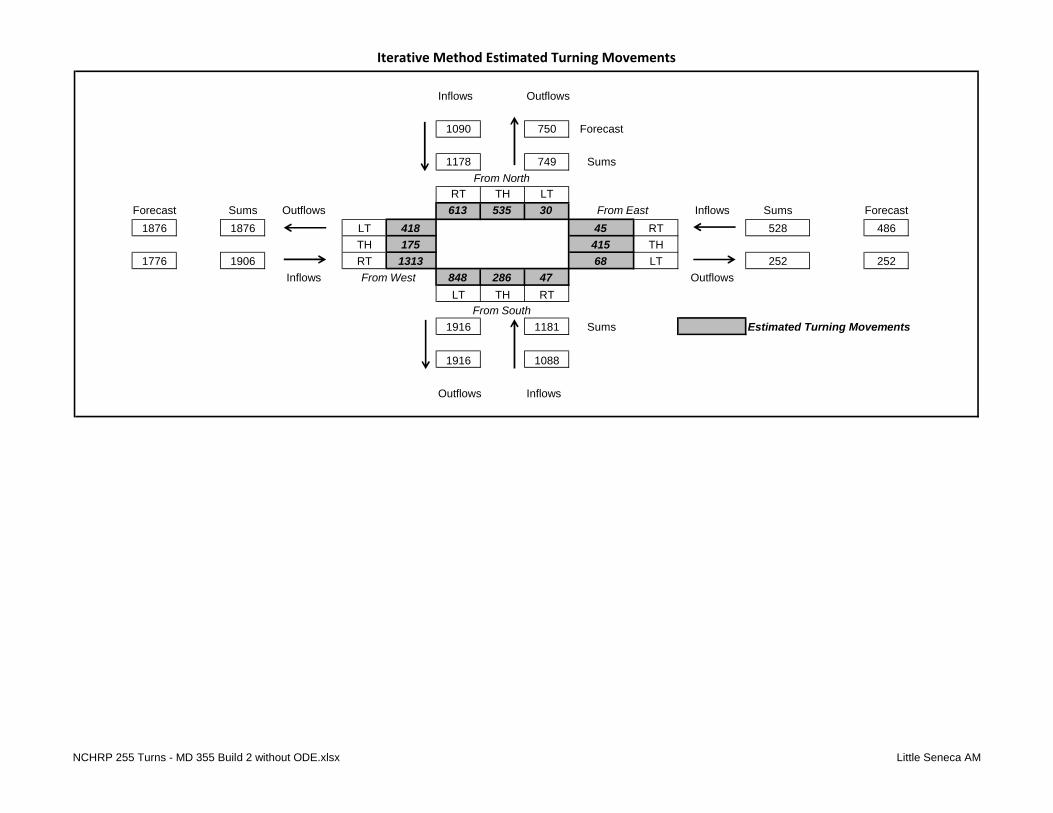
Iterative Method Estimated Turning Movements
Inflows Outflows
1090 750 Forecast
1178 749 Sums
RT TH LTForecast Sums Outflows 613 535 30 Inflows Sums Forecast
1876 1876 LT 418 45 RT 528 486TH 175 415 TH
1776 1906 RT 1313 68 LT 252 252Inflows 848 286 47 Outflows
LT TH RT
1916 1181 Sums Estimated Turning Movements
1916 1088
Outflows Inflows
From West
From South
From North
From East
NCHRP 255 Turns - MD 355 Build 2 without ODE.xlsx Little Seneca AM
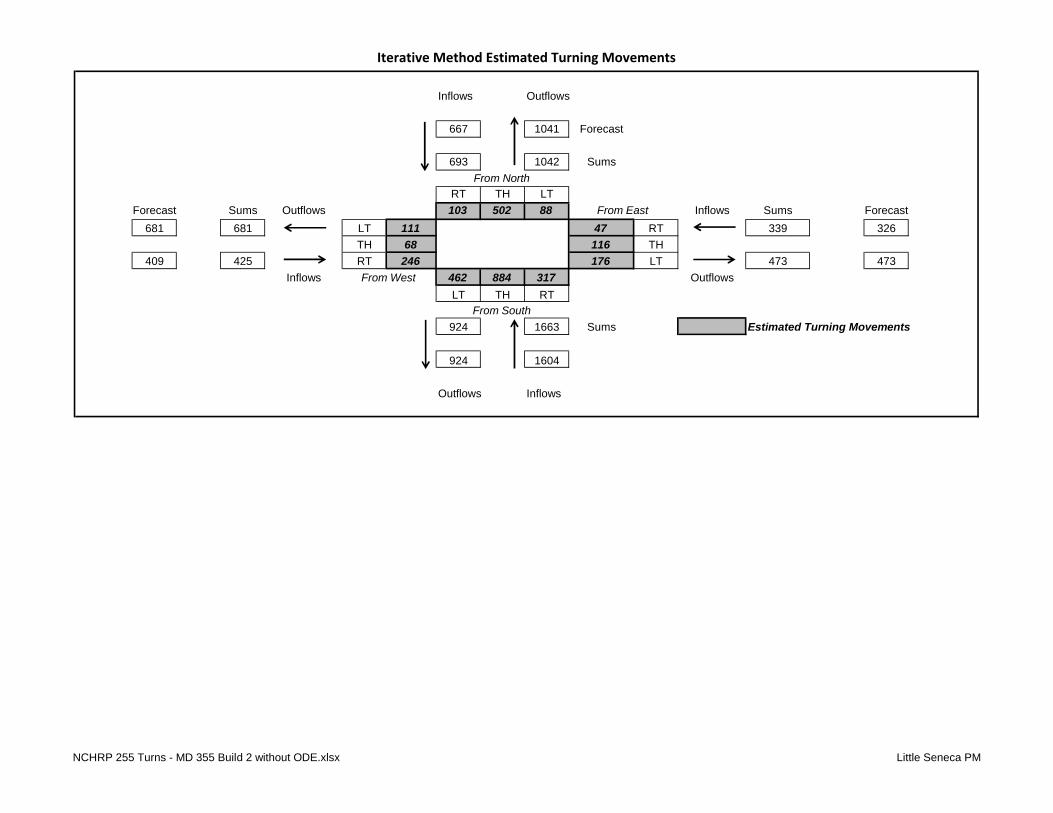
Iterative Method Estimated Turning Movements
Inflows Outflows
667 1041 Forecast
693 1042 Sums
RT TH LTForecast Sums Outflows 103 502 88 Inflows Sums Forecast
681 681 LT 111 47 RT 339 326TH 68 116 TH
409 425 RT 246 176 LT 473 473Inflows 462 884 317 Outflows
LT TH RT
924 1663 Sums Estimated Turning Movements
924 1604
Outflows Inflows
From West
From South
From North
From East
NCHRP 255 Turns - MD 355 Build 2 without ODE.xlsx Little Seneca PM

Iterative Method Estimated Turning Movements
Inflows Outflows
1918 1088 Forecast
1624 1088 Sums
RT TH LTForecast Sums Outflows 1 1614 9 Inflows Sums Forecast
1 1 LT 0 24 RT 38 37TH 0 0 TH
1 1 RT 1 14 LT 12 12Inflows 0 1064 3 Outflows
LT TH RT
1629 1067 Sums Estimated Turning Movements
1629 907
Outflows Inflows
From West
From South
From North
From East
NCHRP 255 Turns - MD 355 Build 2 without ODE.xlsx New Cut AM
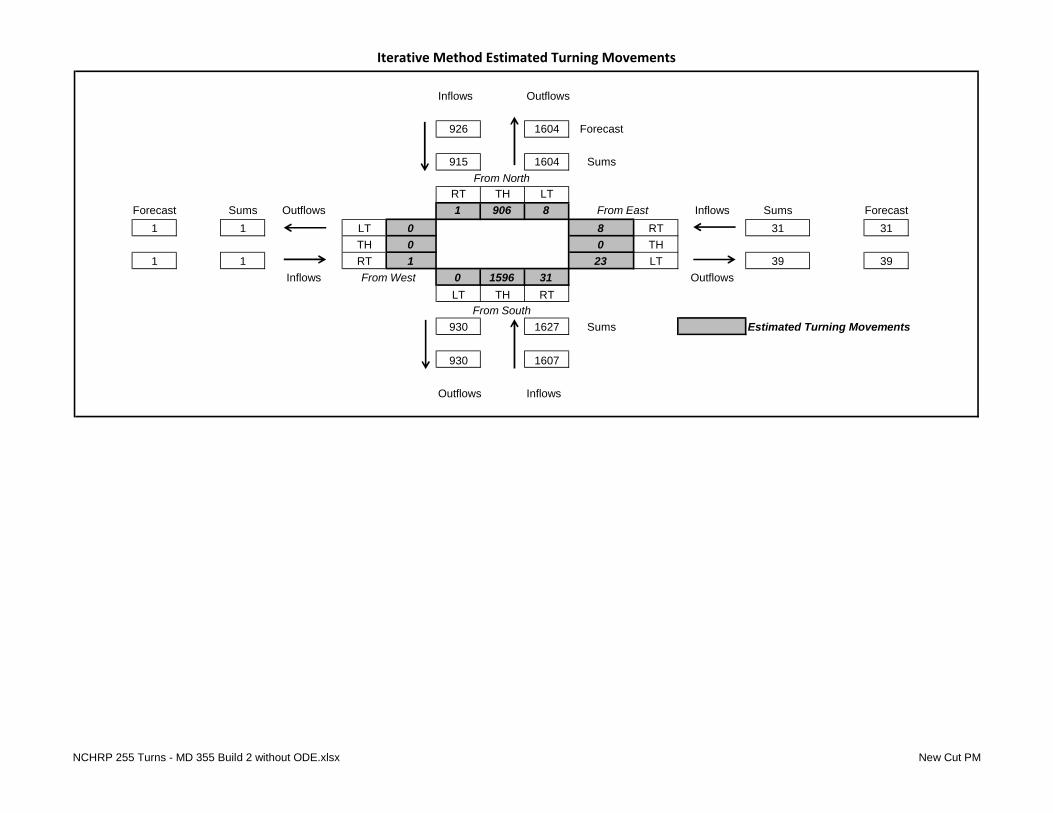
Iterative Method Estimated Turning Movements
Inflows Outflows
926 1604 Forecast
915 1604 Sums
RT TH LTForecast Sums Outflows 1 906 8 Inflows Sums Forecast
1 1 LT 0 8 RT 31 31TH 0 0 TH
1 1 RT 1 23 LT 39 39Inflows 0 1596 31 Outflows
LT TH RT
930 1627 Sums Estimated Turning Movements
930 1607
Outflows Inflows
From West
From South
From North
From East
NCHRP 255 Turns - MD 355 Build 2 without ODE.xlsx New Cut PM

Iterative Method Estimated Turning Movements
Inflows Outflows
1628 907 Forecast
1556 906 Sums
RT TH LTForecast Sums Outflows 34 1516 6 Inflows Sums Forecast
39 39 LT 42 23 RT 33 32TH 0 0 TH
67 68 RT 26 10 LT 6 6Inflows 5 841 0 Outflows
LT TH RT
1552 846 Sums Estimated Turning Movements
1551 801
Outflows Inflows
From West
From South
From North
From East
NCHRP 255 Turns - MD 355 Build 2 without ODE.xlsx Canterfield Rosecrest AM
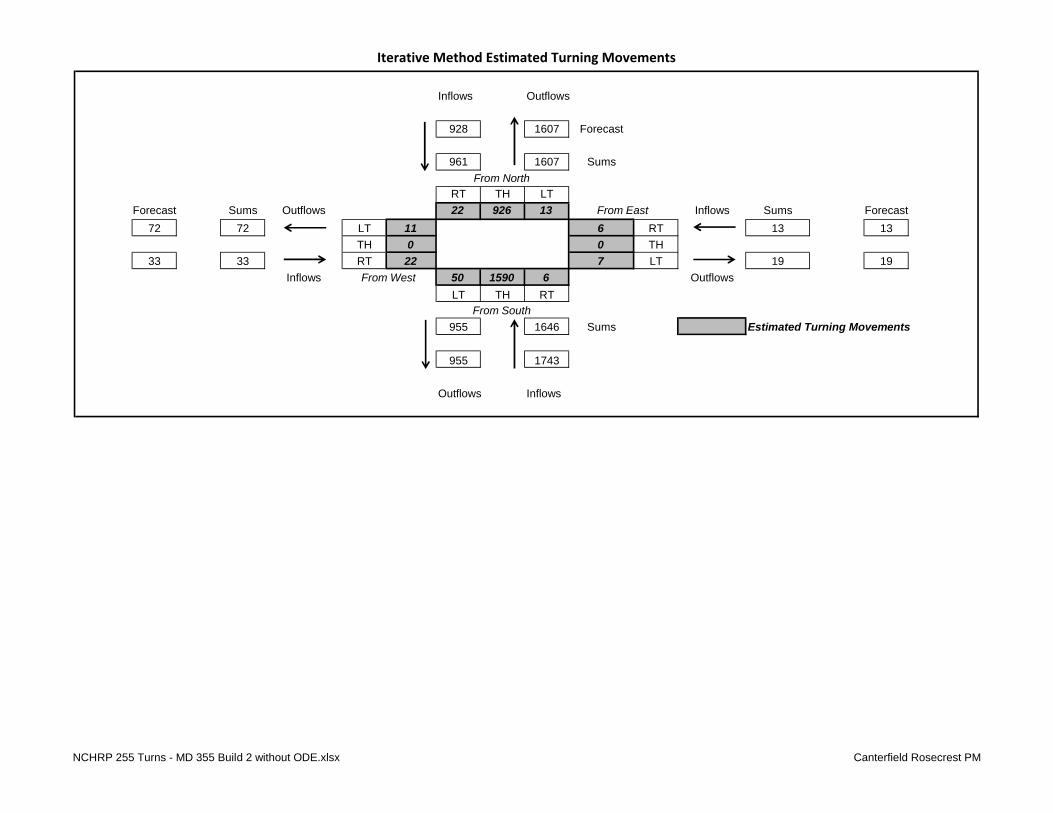
Iterative Method Estimated Turning Movements
Inflows Outflows
928 1607 Forecast
961 1607 Sums
RT TH LTForecast Sums Outflows 22 926 13 Inflows Sums Forecast
72 72 LT 11 6 RT 13 13TH 0 0 TH
33 33 RT 22 7 LT 19 19Inflows 50 1590 6 Outflows
LT TH RT
955 1646 Sums Estimated Turning Movements
955 1743
Outflows Inflows
From West
From South
From North
From East
NCHRP 255 Turns - MD 355 Build 2 without ODE.xlsx Canterfield Rosecrest PM

Iterative Method Estimated Turning Movements
Inflows Outflows
1551 801 Forecast
1605 801 Sums
RT TH LTForecast Sums Outflows 5 1600 0 Inflows Sums Forecast
32 32 LT 16 0 RT 1 1TH 0 0 TH
168 173 RT 157 1 LT 1 1Inflows 27 785 1 Outflows
LT TH RT
1758 813 Sums Estimated Turning Movements
1758 817
Outflows Inflows
From West
From South
From North
From East
NCHRP 255 Turns - MD 355 Build 2 without ODE.xlsx W Old Baltimore AM

Iterative Method Estimated Turning Movements
Inflows Outflows
868 1587 Forecast
892 1587 Sums
RT TH LTForecast Sums Outflows 16 876 0 Inflows Sums Forecast
189 189 LT 22 1 RT 1 1TH 0 0 TH
133 135 RT 113 0 LT 1 1Inflows 173 1564 1 Outflows
LT TH RT
989 1738 Sums Estimated Turning Movements
989 1783
Outflows Inflows
From West
From South
From North
From East
NCHRP 255 Turns - MD 355 Build 2 without ODE.xlsx W Old Baltimore PM
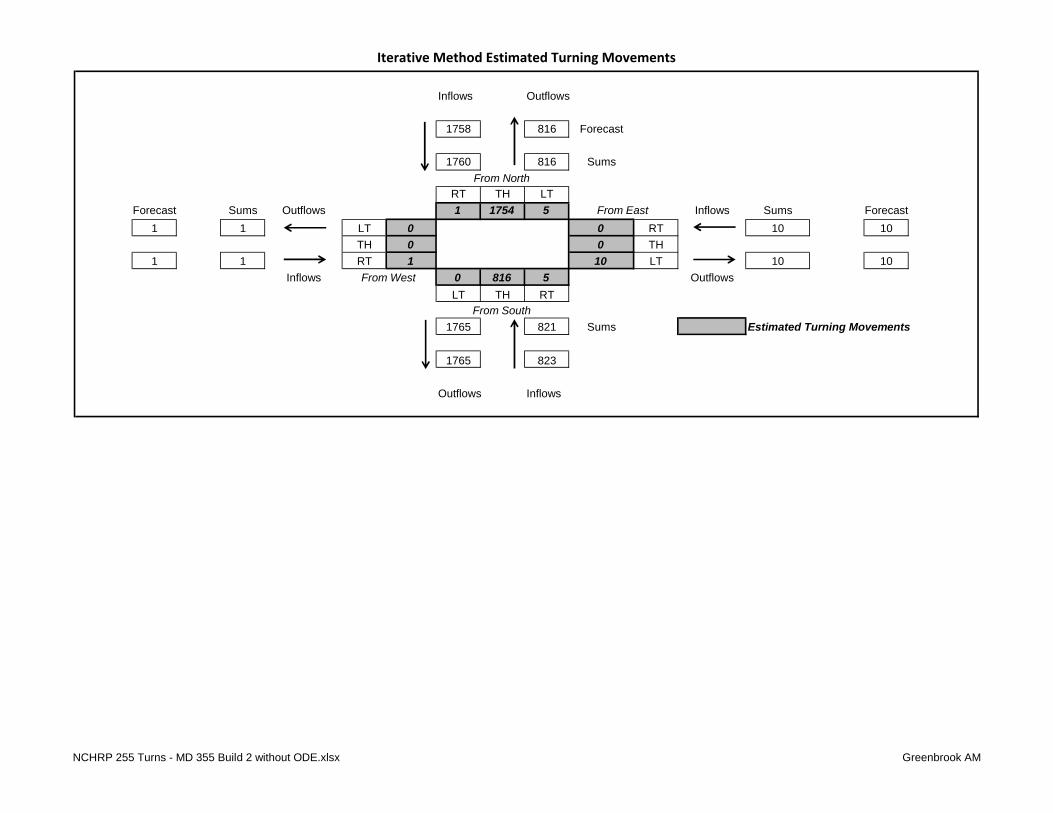
Iterative Method Estimated Turning Movements
Inflows Outflows
1758 816 Forecast
1760 816 Sums
RT TH LTForecast Sums Outflows 1 1754 5 Inflows Sums Forecast
1 1 LT 0 0 RT 10 10TH 0 0 TH
1 1 RT 1 10 LT 10 10Inflows 0 816 5 Outflows
LT TH RT
1765 821 Sums Estimated Turning Movements
1765 823
Outflows Inflows
From West
From South
From North
From East
NCHRP 255 Turns - MD 355 Build 2 without ODE.xlsx Greenbrook AM

Iterative Method Estimated Turning Movements
Inflows Outflows
991 1782 Forecast
991 1782 Sums
RT TH LTForecast Sums Outflows 1 984 6 Inflows Sums Forecast
1 1 LT 0 6 RT 12 12TH 0 0 TH
1 1 RT 1 6 LT 29 29Inflows 0 1776 23 Outflows
LT TH RT
991 1799 Sums Estimated Turning Movements
991 1804
Outflows Inflows
From West
From South
From North
From East
NCHRP 255 Turns - MD 355 Build 2 without ODE.xlsx Greenbrook PM
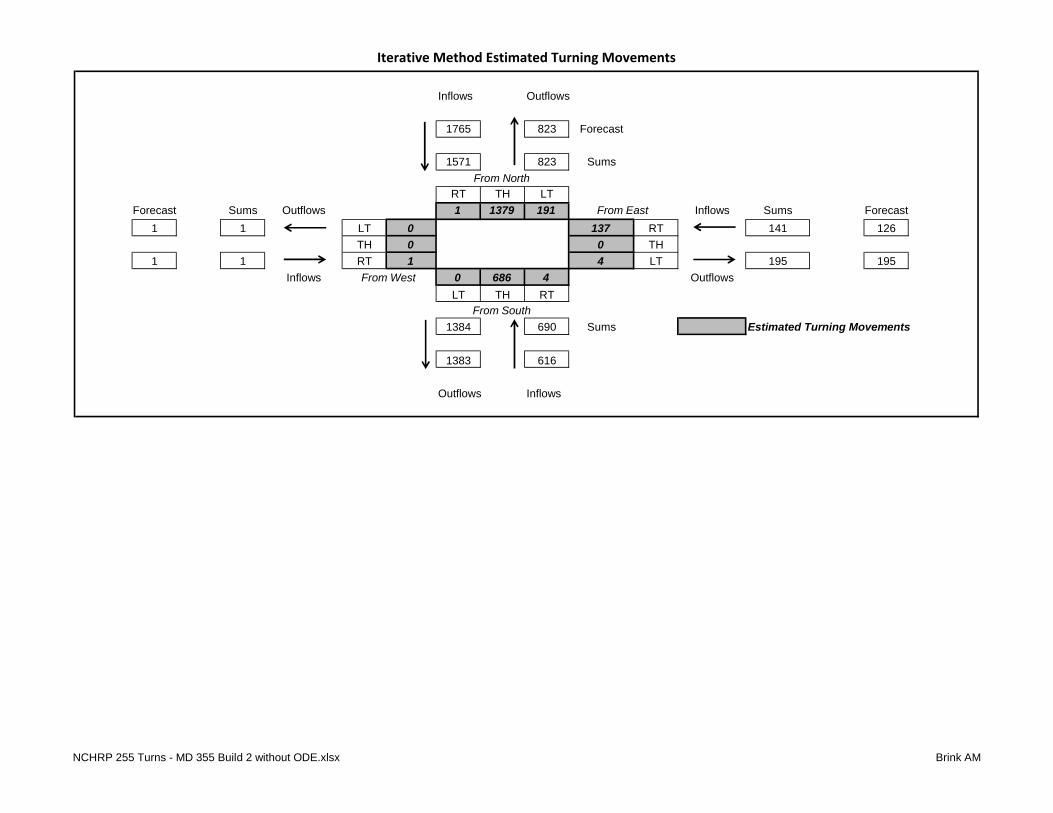
Iterative Method Estimated Turning Movements
Inflows Outflows
1765 823 Forecast
1571 823 Sums
RT TH LTForecast Sums Outflows 1 1379 191 Inflows Sums Forecast
1 1 LT 0 137 RT 141 126TH 0 0 TH
1 1 RT 1 4 LT 195 195Inflows 0 686 4 Outflows
LT TH RT
1384 690 Sums Estimated Turning Movements
1383 616
Outflows Inflows
From West
From South
From North
From East
NCHRP 255 Turns - MD 355 Build 2 without ODE.xlsx Brink AM

Iterative Method Estimated Turning Movements
Inflows Outflows
991 1804 Forecast
926 1804 Sums
RT TH LTForecast Sums Outflows 1 815 110 Inflows Sums Forecast
1 1 LT 0 317 RT 323 299TH 0 0 TH
1 1 RT 1 6 LT 116 116Inflows 0 1487 6 Outflows
LT TH RT
822 1493 Sums Estimated Turning Movements
822 1382
Outflows Inflows
From West
From South
From North
From East
NCHRP 255 Turns - MD 355 Build 2 without ODE.xlsx Brink PM

Iterative Method Estimated Turning Movements
Inflows Outflows
1382 616 Forecast
1382 616 Sums
RT TH LTForecast Sums Outflows 26 1349 7 Inflows Sums Forecast
39 39 LT 39 7 RT 14 13TH 7 0 TH
131 131 RT 85 7 LT 21 20Inflows 13 570 7 Outflows
LT TH RT
1441 590 Sums Estimated Turning Movements
1441 590
Outflows Inflows
From West
From South
From North
From East
NCHRP 255 Turns - MD 355 Build 2 without ODE.xlsx Milestone Manor AM

Iterative Method Estimated Turning Movements
Inflows Outflows
821 1382 Forecast
821 1382 Sums
RT TH LTForecast Sums Outflows 36 778 7 Inflows Sums Forecast
86 86 LT 29 7 RT 29 29TH 0 0 TH
79 79 RT 50 22 LT 22 22Inflows 50 1346 15 Outflows
LT TH RT
850 1411 Sums Estimated Turning Movements
850 1411
Outflows Inflows
From West
From South
From North
From East
NCHRP 255 Turns - MD 355 Build 2 without ODE.xlsx Milestone Manor PM

Iterative Method Estimated Turning Movements
Inflows Outflows
1099 756 Forecast
1125 756 Sums
RT TH LTForecast Sums Outflows 178 877 70 Inflows Sums Forecast
599 599 LT 131 133 RT 508 498TH 76 193 TH
567 580 RT 373 182 LT 258 258Inflows 228 492 112 Outflows
LT TH RT
1432 832 Sums Estimated Turning Movements
1432 813
Outflows Inflows
From West
From South
From North
From East
NCHRP 255 Turns - MD 355 Build 2 with ODE.xlsx Little Seneca AM

Iterative Method Estimated Turning Movements
Inflows Outflows
656 1025 Forecast
699 1025 Sums
RT TH LTForecast Sums Outflows 129 452 118 Inflows Sums Forecast
642 642 LT 137 65 RT 350 328TH 81 135 TH
385 411 RT 193 150 LT 475 476Inflows 378 823 276 Outflows
LT TH RT
795 1477 Sums Estimated Turning Movements
796 1380
Outflows Inflows
From West
From South
From North
From East
NCHRP 255 Turns - MD 355 Build 2 with ODE.xlsx Little Seneca PM

Iterative Method Estimated Turning Movements
Inflows Outflows
1433 813 Forecast
1364 813 Sums
RT TH LTForecast Sums Outflows 1 1356 7 Inflows Sums Forecast
1 1 LT 0 6 RT 36 38TH 0 0 TH
1 1 RT 1 30 LT 14 13Inflows 0 807 7 Outflows
LT TH RT
1387 814 Sums Estimated Turning Movements
1387 772
Outflows Inflows
From West
From South
From North
From East
NCHRP 255 Turns - MD 355 Build 2 with ODE.xlsx New Cut AM

Iterative Method Estimated Turning Movements
Inflows Outflows
797 1380 Forecast
779 1380 Sums
RT TH LTForecast Sums Outflows 1 770 8 Inflows Sums Forecast
1 1 LT 0 8 RT 30 31TH 0 0 TH
1 1 RT 1 22 LT 39 39Inflows 0 1372 31 Outflows
LT TH RT
793 1403 Sums Estimated Turning Movements
793 1370
Outflows Inflows
From West
From South
From North
From East
NCHRP 255 Turns - MD 355 Build 2 with ODE.xlsx New Cut PM

Iterative Method Estimated Turning Movements
Inflows Outflows
1386 772 Forecast
1375 771 Sums
RT TH LTForecast Sums Outflows 33 1335 7 Inflows Sums Forecast
39 39 LT 34 20 RT 33 33TH 0 0 TH
67 68 RT 34 13 LT 7 7Inflows 6 717 0 Outflows
LT TH RT
1382 723 Sums Estimated Turning Movements
1382 714
Outflows Inflows
From West
From South
From North
From East
NCHRP 255 Turns - MD 355 Build 2 with ODE.xlsx Canterfield Rosecrest AM
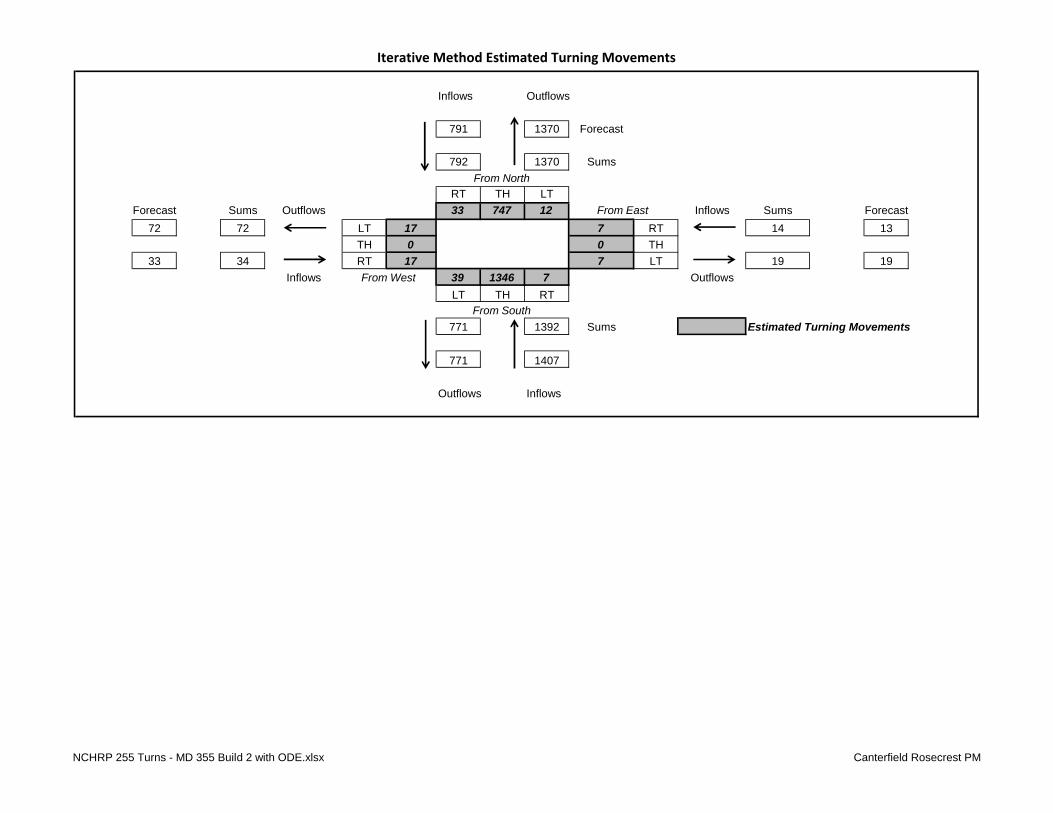
Iterative Method Estimated Turning Movements
Inflows Outflows
791 1370 Forecast
792 1370 Sums
RT TH LTForecast Sums Outflows 33 747 12 Inflows Sums Forecast
72 72 LT 17 7 RT 14 13TH 0 0 TH
33 34 RT 17 7 LT 19 19Inflows 39 1346 7 Outflows
LT TH RT
771 1392 Sums Estimated Turning Movements
771 1407
Outflows Inflows
From West
From South
From North
From East
NCHRP 255 Turns - MD 355 Build 2 with ODE.xlsx Canterfield Rosecrest PM
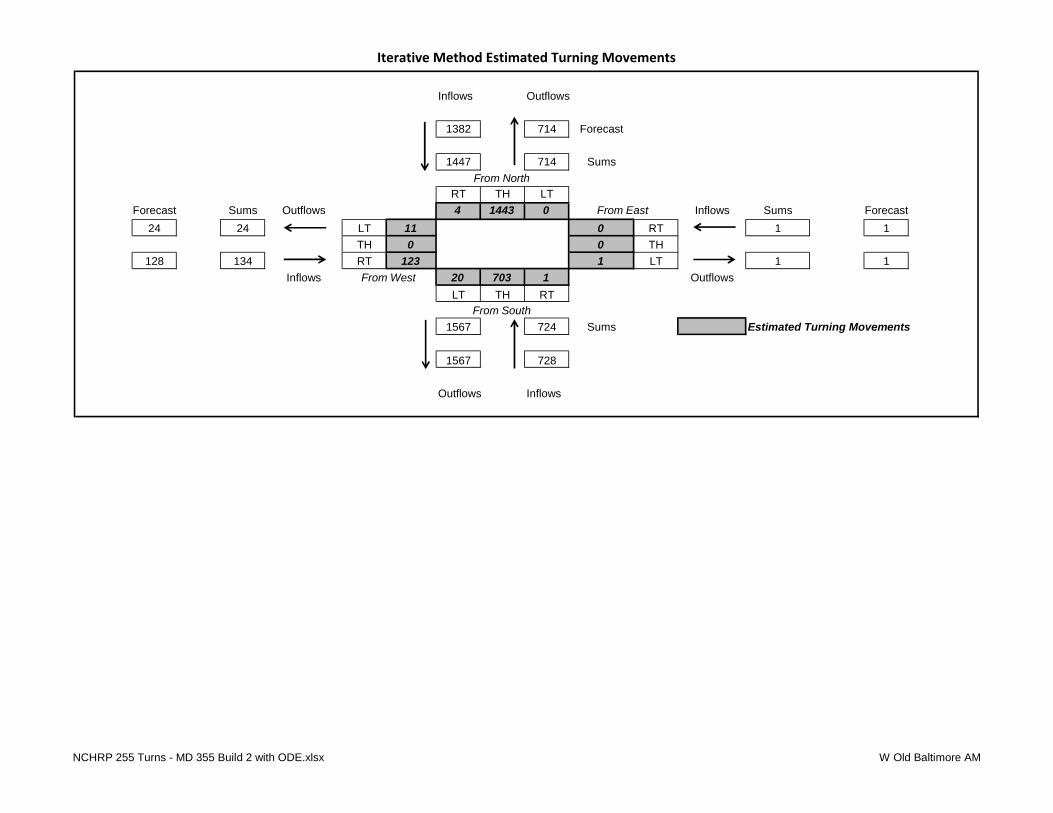
Iterative Method Estimated Turning Movements
Inflows Outflows
1382 714 Forecast
1447 714 Sums
RT TH LTForecast Sums Outflows 4 1443 0 Inflows Sums Forecast
24 24 LT 11 0 RT 1 1TH 0 0 TH
128 134 RT 123 1 LT 1 1Inflows 20 703 1 Outflows
LT TH RT
1567 724 Sums Estimated Turning Movements
1567 728
Outflows Inflows
From West
From South
From North
From East
NCHRP 255 Turns - MD 355 Build 2 with ODE.xlsx W Old Baltimore AM

Iterative Method Estimated Turning Movements
Inflows Outflows
771 1408 Forecast
805 1408 Sums
RT TH LTForecast Sums Outflows 10 795 0 Inflows Sums Forecast
131 131 LT 12 1 RT 1 1TH 0 0 TH
92 95 RT 83 0 LT 1 1Inflows 121 1395 1 Outflows
LT TH RT
878 1517 Sums Estimated Turning Movements
878 1583
Outflows Inflows
From West
From South
From North
From East
NCHRP 255 Turns - MD 355 Build 2 with ODE.xlsx W Old Baltimore PM

Iterative Method Estimated Turning Movements
Inflows Outflows
1567 727 Forecast
1568 727 Sums
RT TH LTForecast Sums Outflows 1 1562 5 Inflows Sums Forecast
1 1 LT 0 0 RT 10 10TH 0 0 TH
1 1 RT 1 10 LT 10 10Inflows 0 727 5 Outflows
LT TH RT
1573 732 Sums Estimated Turning Movements
1573 734
Outflows Inflows
From West
From South
From North
From East
NCHRP 255 Turns - MD 355 Build 2 with ODE.xlsx Greenbrook AM

Iterative Method Estimated Turning Movements
Inflows Outflows
879 1581 Forecast
879 1581 Sums
RT TH LTForecast Sums Outflows 1 872 6 Inflows Sums Forecast
1 1 LT 0 6 RT 12 11TH 0 0 TH
1 1 RT 1 6 LT 28 28Inflows 0 1575 22 Outflows
LT TH RT
879 1597 Sums Estimated Turning Movements
879 1601
Outflows Inflows
From West
From South
From North
From East
NCHRP 255 Turns - MD 355 Build 2 with ODE.xlsx Greenbrook PM

Iterative Method Estimated Turning Movements
Inflows Outflows
1573 734 Forecast
1328 734 Sums
RT TH LTForecast Sums Outflows 1 1159 168 Inflows Sums Forecast
1 1 LT 0 126 RT 129 110TH 0 0 TH
1 1 RT 1 3 LT 171 171Inflows 0 608 3 Outflows
LT TH RT
1163 611 Sums Estimated Turning Movements
1162 517
Outflows Inflows
From West
From South
From North
From East
NCHRP 255 Turns - MD 355 Build 2 with ODE.xlsx Brink AM

Iterative Method Estimated Turning Movements
Inflows Outflows
879 1601 Forecast
777 1601 Sums
RT TH LTForecast Sums Outflows 1 681 95 Inflows Sums Forecast
1 1 LT 0 285 RT 288 252TH 0 0 TH
1 1 RT 1 3 LT 98 98Inflows 0 1316 3 Outflows
LT TH RT
685 1319 Sums Estimated Turning Movements
685 1152
Outflows Inflows
From West
From South
From North
From East
NCHRP 255 Turns - MD 355 Build 2 with ODE.xlsx Brink PM

Iterative Method Estimated Turning Movements
Inflows Outflows
1161 517 Forecast
1161 517 Sums
RT TH LTForecast Sums Outflows 22 1133 6 Inflows Sums Forecast
33 33 LT 33 6 RT 12 11TH 6 0 TH
110 110 RT 71 6 LT 18 17Inflows 11 478 6 Outflows
LT TH RT
1210 495 Sums Estimated Turning Movements
1210 495
Outflows Inflows
From West
From South
From North
From East
NCHRP 255 Turns - MD 355 Build 2 with ODE.xlsx Milestone Manor AM

Iterative Method Estimated Turning Movements
Inflows Outflows
895 1507 Forecast
895 1507 Sums
RT TH LTForecast Sums Outflows 39 848 8 Inflows Sums Forecast
94 94 LT 31 8 RT 31 31TH 0 0 TH
86 86 RT 55 23 LT 24 24Inflows 55 1468 16 Outflows
LT TH RT
926 1539 Sums Estimated Turning Movements
926 1539
Outflows Inflows
From West
From South
From North
From East
NCHRP 255 Turns - MD 355 Build 2 with ODE.xlsx Milestone Manor PM

Appendix C
SimTraffic Reports
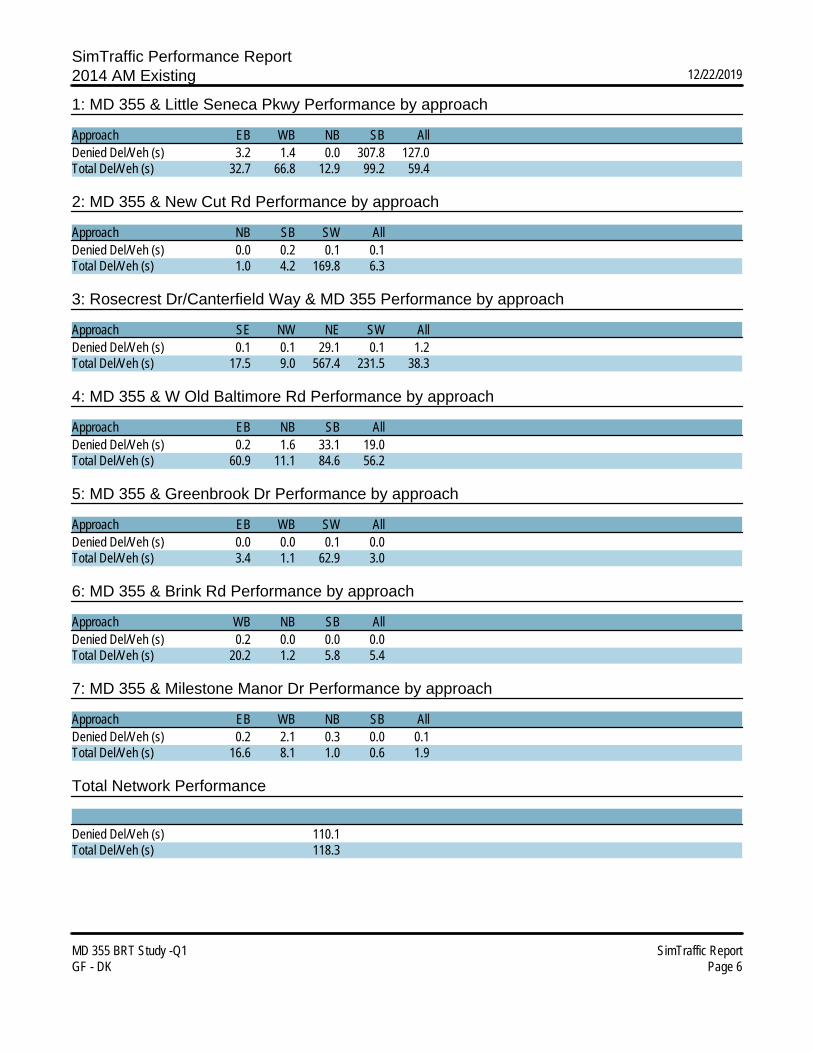
SimTraffic Performance Report2014 AM Existing 12/22/2019
MD 355 BRT Study -Q1 SimTraffic ReportGF - DK Page 6
1: MD 355 & Little Seneca Pkwy Performance by approach
Approach EB WB NB SB AllDenied Del/Veh (s) 3.2 1.4 0.0 307.8 127.0Total Del/Veh (s) 32.7 66.8 12.9 99.2 59.4
2: MD 355 & New Cut Rd Performance by approach
Approach NB SB SW AllDenied Del/Veh (s) 0.0 0.2 0.1 0.1Total Del/Veh (s) 1.0 4.2 169.8 6.3
3: Rosecrest Dr/Canterfield Way & MD 355 Performance by approach
Approach SE NW NE SW AllDenied Del/Veh (s) 0.1 0.1 29.1 0.1 1.2Total Del/Veh (s) 17.5 9.0 567.4 231.5 38.3
4: MD 355 & W Old Baltimore Rd Performance by approach
Approach EB NB SB AllDenied Del/Veh (s) 0.2 1.6 33.1 19.0Total Del/Veh (s) 60.9 11.1 84.6 56.2
5: MD 355 & Greenbrook Dr Performance by approach
Approach EB WB SW AllDenied Del/Veh (s) 0.0 0.0 0.1 0.0Total Del/Veh (s) 3.4 1.1 62.9 3.0
6: MD 355 & Brink Rd Performance by approach
Approach WB NB SB AllDenied Del/Veh (s) 0.2 0.0 0.0 0.0Total Del/Veh (s) 20.2 1.2 5.8 5.4
7: MD 355 & Milestone Manor Dr Performance by approach
Approach EB WB NB SB AllDenied Del/Veh (s) 0.2 2.1 0.3 0.0 0.1Total Del/Veh (s) 16.6 8.1 1.0 0.6 1.9
Total Network Performance
Denied Del/Veh (s) 110.1Total Del/Veh (s) 118.3

SimTraffic Performance Report2014 PM Existing 12/22/2019
MD 355 BRT Study -Q1 SimTraffic ReportGF - DK Page 6
1: MD 355 & Little Seneca Pkwy Performance by approach
Approach EB WB NB SB AllDenied Del/Veh (s) 3.4 1.1 0.0 1.1 0.6Total Del/Veh (s) 35.7 59.3 7.6 8.6 15.8
2: MD 355 & New Cut Road Performance by approach
Approach NB SB SW AllDenied Del/Veh (s) 0.0 0.0 0.1 0.0Total Del/Veh (s) 3.7 0.2 100.7 3.8
3: Rosecrest Dr/Canterfield Way & MD 355 Performance by approach
Approach SE NW NE SW AllDenied Del/Veh (s) 0.0 0.0 0.1 0.1 0.0Total Del/Veh (s) 1.7 7.5 19.4 20.6 5.6
4: MD 355 & W Old Baltimore Rd Performance by approach
Approach EB NB SB AllDenied Del/Veh (s) 0.2 0.5 0.0 0.3Total Del/Veh (s) 48.0 33.9 26.8 32.5
5: MD 355 & Greenbrook Dr Performance by approach
Approach EB WB SW AllDenied Del/Veh (s) 0.0 1.6 0.1 1.0Total Del/Veh (s) 10.9 39.6 110.9 29.3
6: MD 355 & Brink Rd Performance by approach
Approach WB NB SB AllDenied Del/Veh (s) 168.9 1.8 0.0 24.5Total Del/Veh (s) 618.6 81.4 23.7 130.9
7: MD 355 & Milestone Manor Dr Performance by approach
Approach EB WB NB SB AllDenied Del/Veh (s) 27.8 1.1 0.6 0.0 1.4Total Del/Veh (s) 276.2 343.8 18.1 2.1 26.4
Total Network Performance
Denied Del/Veh (s) 21.2Total Del/Veh (s) 195.1

SimTraffic Performance Report2040 AM No Build 02/04/2020
MD 355 BRT Study -Q1 SimTraffic ReportGF - DK Page 1
1: MD 355 & Little Seneca Pkwy Performance by approach
Approach EB WB NB SB AllDenied Del/Veh (s) 3.3 1.5 0.0 141.6 60.2Total Del/Veh (s) 42.5 138.9 13.4 69.8 65.1
2: MD 355 & New Cut Rd Performance by approach
Approach NB SB SW AllDenied Del/Veh (s) 0.0 0.5 540.6 11.5Total Del/Veh (s) 0.8 6.5 2521.6 40.9
3: Rosecrest Dr/Canterfield Way & MD 355 Performance by approach
Approach SE NW NE SW AllDenied Del/Veh (s) 0.2 0.1 1145.8 136.4 44.1Total Del/Veh (s) 26.4 9.2 3121.8 2374.5 100.1
4: W Old Baltimore Rd & MD 355 Performance by approach
Approach NB SB NE AllDenied Del/Veh (s) 0.4 29.1 3.5 16.4Total Del/Veh (s) 7.0 55.1 12.3 33.8
5: MD 355 & Greenbrook Dr Performance by approach
Approach SE NW SW AllDenied Del/Veh (s) 0.1 0.0 0.1 0.1Total Del/Veh (s) 4.1 0.9 96.4 3.8
6: MD 355 & Brink Rd Performance by approach
Approach NB SB SW AllDenied Del/Veh (s) 0.0 0.0 0.1 0.0Total Del/Veh (s) 1.0 1.2 7.7 1.6
7: MD 355 & Milestone Manor Dr Performance by approach
Approach EB WB NB SB AllDenied Del/Veh (s) 0.2 2.3 0.3 0.0 0.1Total Del/Veh (s) 46.6 8.7 1.0 0.6 3.6
Total Network Performance
Denied Del/Veh (s) 89.5Total Del/Veh (s) 165.9

SimTraffic Performance Report2040 PM No Build 02/04/2020
MD 355 BRT Study -Q1 SimTraffic ReportGF - DK Page 1
1: MD 355 & Little Seneca Pkwy Performance by approach
Approach EB WB NB SB AllDenied Del/Veh (s) 3.4 1.0 0.0 1.3 0.7Total Del/Veh (s) 39.6 49.7 8.3 12.8 16.1
2: MD 355 & New Cut Road Performance by approach
Approach NB SB SW AllDenied Del/Veh (s) 0.0 0.0 0.1 0.0Total Del/Veh (s) 6.3 0.2 634.3 11.9
3: Rosecrest Dr/Canterfield Way & MD 355 Performance by approach
Approach SE NW NE SW AllDenied Del/Veh (s) 0.0 0.0 0.1 0.1 0.0Total Del/Veh (s) 1.7 5.2 31.7 32.1 4.5
4: W Old Baltimore Rd & MD 355 Performance by approach
Approach NB SB NE AllDenied Del/Veh (s) 0.0 0.0 3.0 0.2Total Del/Veh (s) 4.5 8.3 20.4 6.7
5: MD 355 & Greenbrook Dr Performance by approach
Approach SE NW SW AllDenied Del/Veh (s) 0.0 0.0 0.1 0.0Total Del/Veh (s) 2.8 2.1 89.6 3.0
6: MD 355 & Brink Rd Performance by approach
Approach WB NB SB AllDenied Del/Veh (s) 2.4 0.0 0.0 0.3Total Del/Veh (s) 32.2 6.2 8.8 10.6
7: MD 355 & Milestone Manor Dr Performance by approach
Approach EB WB NB SB AllDenied Del/Veh (s) 0.1 1.3 0.2 0.0 0.1Total Del/Veh (s) 34.3 27.5 1.2 0.4 2.3
Total Network Performance
Denied Del/Veh (s) 1.1Total Del/Veh (s) 45.9
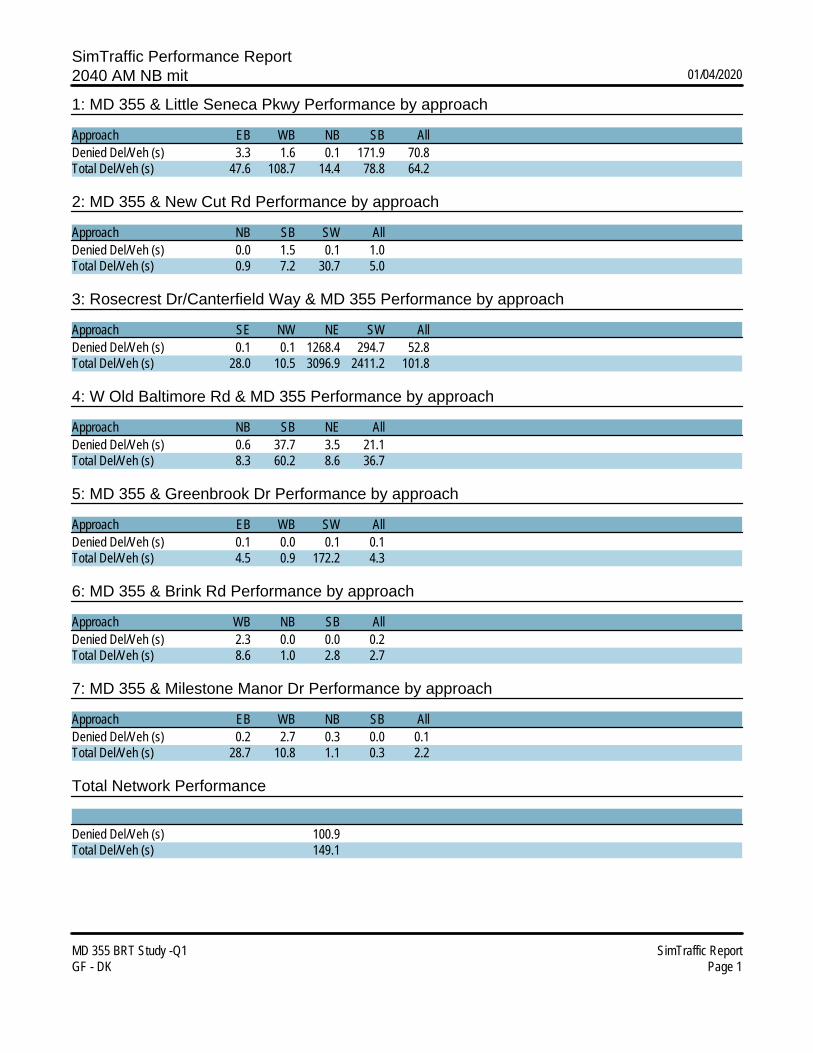
SimTraffic Performance Report2040 AM NB mit 01/04/2020
MD 355 BRT Study -Q1 SimTraffic ReportGF - DK Page 1
1: MD 355 & Little Seneca Pkwy Performance by approach
Approach EB WB NB SB AllDenied Del/Veh (s) 3.3 1.6 0.1 171.9 70.8Total Del/Veh (s) 47.6 108.7 14.4 78.8 64.2
2: MD 355 & New Cut Rd Performance by approach
Approach NB SB SW AllDenied Del/Veh (s) 0.0 1.5 0.1 1.0Total Del/Veh (s) 0.9 7.2 30.7 5.0
3: Rosecrest Dr/Canterfield Way & MD 355 Performance by approach
Approach SE NW NE SW AllDenied Del/Veh (s) 0.1 0.1 1268.4 294.7 52.8Total Del/Veh (s) 28.0 10.5 3096.9 2411.2 101.8
4: W Old Baltimore Rd & MD 355 Performance by approach
Approach NB SB NE AllDenied Del/Veh (s) 0.6 37.7 3.5 21.1Total Del/Veh (s) 8.3 60.2 8.6 36.7
5: MD 355 & Greenbrook Dr Performance by approach
Approach EB WB SW AllDenied Del/Veh (s) 0.1 0.0 0.1 0.1Total Del/Veh (s) 4.5 0.9 172.2 4.3
6: MD 355 & Brink Rd Performance by approach
Approach WB NB SB AllDenied Del/Veh (s) 2.3 0.0 0.0 0.2Total Del/Veh (s) 8.6 1.0 2.8 2.7
7: MD 355 & Milestone Manor Dr Performance by approach
Approach EB WB NB SB AllDenied Del/Veh (s) 0.2 2.7 0.3 0.0 0.1Total Del/Veh (s) 28.7 10.8 1.1 0.3 2.2
Total Network Performance
Denied Del/Veh (s) 100.9Total Del/Veh (s) 149.1

SimTraffic Performance Report2040 PM No Build mit 12/31/2019
MD 355 BRT Study -Q1 SimTraffic ReportGF - DK Page 1
1: MD 355 & Little Seneca Pkwy Performance by approach
Approach EB WB NB SB AllDenied Del/Veh (s) 3.2 1.1 0.0 1.3 0.7Total Del/Veh (s) 37.8 50.2 8.9 13.1 16.9
2: MD 355 & New Cut Road Performance by approach
Approach NB SB SW AllDenied Del/Veh (s) 0.0 0.0 0.1 0.0Total Del/Veh (s) 5.7 0.3 190.6 4.4
3: Rosecrest Dr/Canterfield Way & MD 355 Performance by approach
Approach SE NW NE SW AllDenied Del/Veh (s) 0.0 0.0 0.1 0.1 0.0Total Del/Veh (s) 1.8 5.4 53.2 48.5 5.2
4: W Old Baltimore Rd & MD 355 Performance by approach
Approach NB SB NE AllDenied Del/Veh (s) 0.0 0.0 3.1 0.2Total Del/Veh (s) 4.4 8.4 17.9 6.6
5: MD 355 & Greenbrook Dr Performance by approach
Approach SE NW SW AllDenied Del/Veh (s) 0.0 0.0 0.1 0.0Total Del/Veh (s) 3.4 2.3 202.5 3.6
6: MD 355 & Brink Rd Performance by approach
Approach WB NB SB AllDenied Del/Veh (s) 2.4 0.0 0.0 0.3Total Del/Veh (s) 23.7 5.6 6.5 8.3
7: MD 355 & Milestone Manor Dr Performance by approach
Approach EB WB NB SB AllDenied Del/Veh (s) 0.1 1.2 0.2 0.0 0.1Total Del/Veh (s) 22.8 24.6 1.1 0.4 1.9
Total Network Performance
Denied Del/Veh (s) 1.1Total Del/Veh (s) 40.4

SimTraffic Performance Report2040 AM Four-Lane No Build 12/20/2019
MD 355 SimTraffic ReportWRA/Symmetra Page 1
1: MD 355 & Little Seneca Pkwy Performance by approach
Approach EB WB NB SB AllDenied Del/Veh (s) 62.7 0.2 0.2 0.0 17.5Total Del/Veh (s) 74.4 97.1 37.4 43.9 60.8
2: MD 355 & New Cut Rd Performance by approach
Approach NB SB SW AllDenied Del/Veh (s) 0.0 0.0 0.1 0.0Total Del/Veh (s) 6.7 2.5 31.0 4.2
3: Rosecrest Dr/Canterfield Way & MD 355 Performance by approach
Approach SE NW NE SW AllDenied Del/Veh (s) 0.0 0.0 563.9 0.1 16.3Total Del/Veh (s) 9.1 7.0 1313.0 279.3 36.8
4: W Old Baltimore Rd & MD 355 Performance by approach
Approach NB SB NE AllDenied Del/Veh (s) 0.0 0.1 3.6 0.3Total Del/Veh (s) 3.7 16.0 28.8 11.9
5: MD 355 & Greenbrook Dr Performance by approach
Approach SE NW SW AllDenied Del/Veh (s) 0.0 0.0 0.1 0.0Total Del/Veh (s) 3.2 0.4 62.2 2.4
6: MD 355 & Brink Rd Performance by approach
Approach NB SB SW AllDenied Del/Veh (s) 0.0 0.0 0.1 0.0Total Del/Veh (s) 1.0 0.9 9.9 1.4
7: MD 355 & Milestone Manor Dr Performance by approach
Approach EB WB NB SB AllDenied Del/Veh (s) 143.3 2.3 0.2 0.0 7.1Total Del/Veh (s) 554.5 27.2 1.2 0.9 26.9
Total Network Performance
Denied Del/Veh (s) 152.7Total Del/Veh (s) 104.2
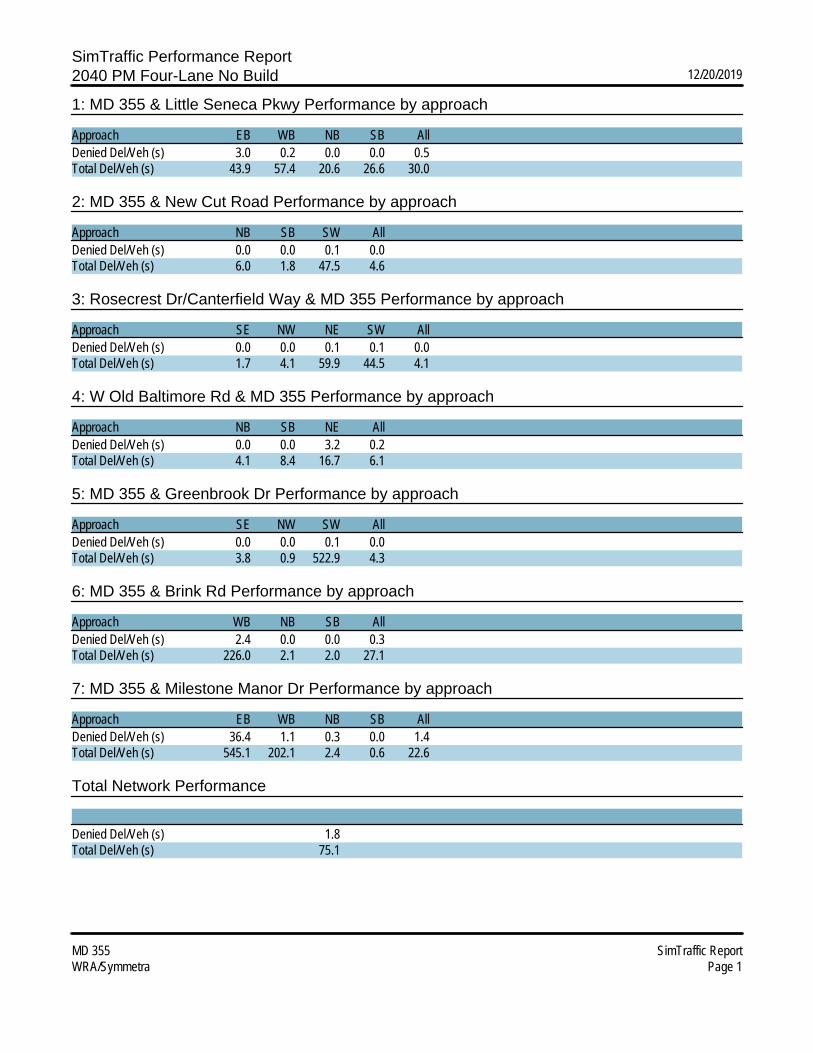
SimTraffic Performance Report2040 PM Four-Lane No Build 12/20/2019
MD 355 SimTraffic ReportWRA/Symmetra Page 1
1: MD 355 & Little Seneca Pkwy Performance by approach
Approach EB WB NB SB AllDenied Del/Veh (s) 3.0 0.2 0.0 0.0 0.5Total Del/Veh (s) 43.9 57.4 20.6 26.6 30.0
2: MD 355 & New Cut Road Performance by approach
Approach NB SB SW AllDenied Del/Veh (s) 0.0 0.0 0.1 0.0Total Del/Veh (s) 6.0 1.8 47.5 4.6
3: Rosecrest Dr/Canterfield Way & MD 355 Performance by approach
Approach SE NW NE SW AllDenied Del/Veh (s) 0.0 0.0 0.1 0.1 0.0Total Del/Veh (s) 1.7 4.1 59.9 44.5 4.1
4: W Old Baltimore Rd & MD 355 Performance by approach
Approach NB SB NE AllDenied Del/Veh (s) 0.0 0.0 3.2 0.2Total Del/Veh (s) 4.1 8.4 16.7 6.1
5: MD 355 & Greenbrook Dr Performance by approach
Approach SE NW SW AllDenied Del/Veh (s) 0.0 0.0 0.1 0.0Total Del/Veh (s) 3.8 0.9 522.9 4.3
6: MD 355 & Brink Rd Performance by approach
Approach WB NB SB AllDenied Del/Veh (s) 2.4 0.0 0.0 0.3Total Del/Veh (s) 226.0 2.1 2.0 27.1
7: MD 355 & Milestone Manor Dr Performance by approach
Approach EB WB NB SB AllDenied Del/Veh (s) 36.4 1.1 0.3 0.0 1.4Total Del/Veh (s) 545.1 202.1 2.4 0.6 22.6
Total Network Performance
Denied Del/Veh (s) 1.8Total Del/Veh (s) 75.1

SimTraffic Performance Report2040 AM Build w/ Observation Ext. 12/31/2019
MD 355 BRT Study -Q1 SimTraffic ReportGF - DK Page 1
1: MD 355 & Little Seneca Pkwy Performance by approach
Approach EB WB NB SB AllDenied Del/Veh (s) 1400.9 1.1 0.0 409.0 457.3Total Del/Veh (s) 466.2 52.8 20.7 91.4 99.2
2: MD 355 & New Cut Rd Performance by approach
Approach NB SB SW AllDenied Del/Veh (s) 0.0 0.1 0.2 0.0Total Del/Veh (s) 1.1 2.6 247.0 8.5
3: Rosecrest Dr/Canterfield Way & MD 355 Performance by approach
Approach SE NW NE SW AllDenied Del/Veh (s) 0.0 0.1 0.2 0.1 0.1Total Del/Veh (s) 13.9 7.8 150.8 61.7 19.6
4: W Old Baltimore Rd & MD 355 Performance by approach
Approach NB SB NE AllDenied Del/Veh (s) 0.3 0.6 3.6 0.8Total Del/Veh (s) 5.1 10.8 9.1 8.4
5: MD 355 & Greenbrook Dr Performance by approach
Approach EB WB SW AllDenied Del/Veh (s) 0.1 0.0 0.1 0.0Total Del/Veh (s) 2.5 0.9 56.4 2.4
6: MD 355 & Brink Rd Performance by approach
Approach WB NB SB AllDenied Del/Veh (s) 2.5 0.0 0.0 0.2Total Del/Veh (s) 5.5 1.0 0.9 1.3
7: MD 355 & Milestone Manor Dr Performance by approach
Approach EB WB NB SB AllDenied Del/Veh (s) 0.2 2.4 0.3 0.0 0.1Total Del/Veh (s) 15.2 8.7 1.0 0.3 1.6
Total Network Performance
Denied Del/Veh (s) 366.6Total Del/Veh (s) 99.0

SimTraffic Performance Report2040 PM Obs Dr Ext 12/31/2019
MD 355 BRT Study -Q1 SimTraffic ReportGF - DK Page 1
1: MD 355 & Little Seneca Pkwy Performance by approach
Approach EB WB NB SB AllDenied Del/Veh (s) 144.6 0.8 0.0 2.2 31.6Total Del/Veh (s) 157.3 57.6 16.5 18.3 51.6
2: MD 355 & New Cut Road Performance by approach
Approach NB SB SW AllDenied Del/Veh (s) 0.0 0.0 17.2 0.3Total Del/Veh (s) 21.6 0.3 1297.0 32.5
3: Rosecrest Dr/Canterfield Way & MD 355 Performance by approach
Approach SE NW NE SW AllDenied Del/Veh (s) 0.0 0.0 0.1 0.1 0.0Total Del/Veh (s) 1.8 5.0 26.3 36.6 4.7
4: W Old Baltimore Rd & MD 355 Performance by approach
Approach NB SB NE AllDenied Del/Veh (s) 0.0 0.0 3.2 0.2Total Del/Veh (s) 3.7 7.5 16.6 5.7
5: MD 355 & Greenbrook Dr Performance by approach
Approach SE NW SW AllDenied Del/Veh (s) 0.0 0.0 0.1 0.0Total Del/Veh (s) 2.6 1.8 69.5 2.5
6: MD 355 & Brink Rd Performance by approach
Approach WB NB SB AllDenied Del/Veh (s) 2.5 0.0 0.0 0.3Total Del/Veh (s) 13.2 4.4 4.7 5.7
7: MD 355 & Milestone Manor Dr Performance by approach
Approach EB WB NB SB AllDenied Del/Veh (s) 0.1 1.3 0.2 0.0 0.1Total Del/Veh (s) 19.1 19.6 1.0 0.5 1.7
Total Network Performance
Denied Del/Veh (s) 26.5Total Del/Veh (s) 74.3

SimTraffic Performance Report2014 AM Build mit 12/31/2019
MD 355 BRT Study -Q1 SimTraffic ReportGF - DK Page 1
1: MD 355 & Little Seneca Pkwy Performance by approach
Approach EB WB NB SB AllDenied Del/Veh (s) 47.7 1.0 0.0 264.8 99.9Total Del/Veh (s) 119.5 99.1 22.3 86.8 83.4
2: MD 355 & New Cut Rd Performance by approach
Approach NB SB SW AllDenied Del/Veh (s) 0.0 0.3 0.1 0.2Total Del/Veh (s) 1.1 4.7 15.4 3.3
3: Rosecrest Dr/Canterfield Way & MD 355 Performance by approach
Approach SE NW NE SW AllDenied Del/Veh (s) 0.0 0.1 397.1 7.3 18.0Total Del/Veh (s) 19.0 8.9 1300.1 657.8 70.8
4: W Old Baltimore Rd & MD 355 Performance by approach
Approach NB SB NE AllDenied Del/Veh (s) 0.6 0.9 3.6 1.1Total Del/Veh (s) 5.4 17.3 11.7 12.4
5: MD 355 & Greenbrook Dr Performance by approach
Approach SE NW SW AllDenied Del/Veh (s) 0.1 0.0 0.1 0.0Total Del/Veh (s) 2.8 0.9 82.2 2.7
6: MD 355 & Brink Rd Performance by approach
Approach NB SB SW AllDenied Del/Veh (s) 0.0 0.0 0.2 0.0Total Del/Veh (s) 1.1 1.0 6.6 1.4
7: MD 355 & Milestone Manor Dr Performance by approach
Approach EB WB NB SB AllDenied Del/Veh (s) 0.2 2.1 0.3 0.0 0.1Total Del/Veh (s) 30.0 11.0 1.0 0.7 2.9
Total Network Performance
Denied Del/Veh (s) 89.6Total Del/Veh (s) 116.3
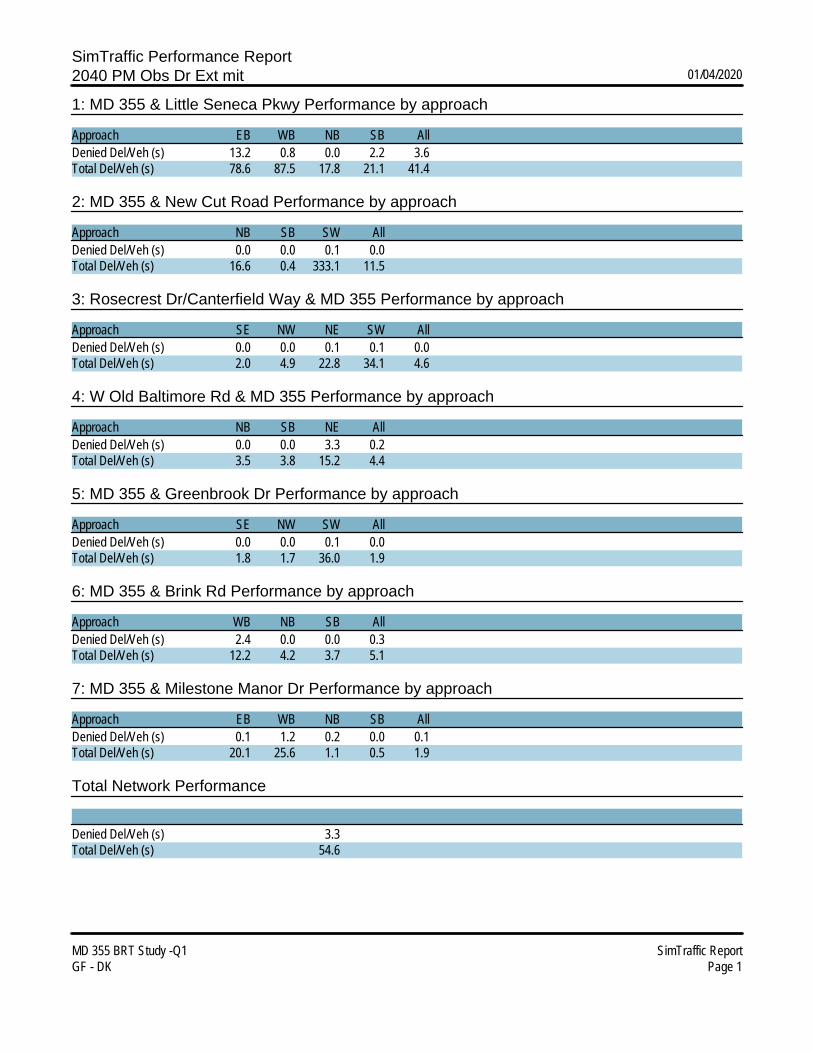
SimTraffic Performance Report2040 PM Obs Dr Ext mit 01/04/2020
MD 355 BRT Study -Q1 SimTraffic ReportGF - DK Page 1
1: MD 355 & Little Seneca Pkwy Performance by approach
Approach EB WB NB SB AllDenied Del/Veh (s) 13.2 0.8 0.0 2.2 3.6Total Del/Veh (s) 78.6 87.5 17.8 21.1 41.4
2: MD 355 & New Cut Road Performance by approach
Approach NB SB SW AllDenied Del/Veh (s) 0.0 0.0 0.1 0.0Total Del/Veh (s) 16.6 0.4 333.1 11.5
3: Rosecrest Dr/Canterfield Way & MD 355 Performance by approach
Approach SE NW NE SW AllDenied Del/Veh (s) 0.0 0.0 0.1 0.1 0.0Total Del/Veh (s) 2.0 4.9 22.8 34.1 4.6
4: W Old Baltimore Rd & MD 355 Performance by approach
Approach NB SB NE AllDenied Del/Veh (s) 0.0 0.0 3.3 0.2Total Del/Veh (s) 3.5 3.8 15.2 4.4
5: MD 355 & Greenbrook Dr Performance by approach
Approach SE NW SW AllDenied Del/Veh (s) 0.0 0.0 0.1 0.0Total Del/Veh (s) 1.8 1.7 36.0 1.9
6: MD 355 & Brink Rd Performance by approach
Approach WB NB SB AllDenied Del/Veh (s) 2.4 0.0 0.0 0.3Total Del/Veh (s) 12.2 4.2 3.7 5.1
7: MD 355 & Milestone Manor Dr Performance by approach
Approach EB WB NB SB AllDenied Del/Veh (s) 0.1 1.2 0.2 0.0 0.1Total Del/Veh (s) 20.1 25.6 1.1 0.5 1.9
Total Network Performance
Denied Del/Veh (s) 3.3Total Del/Veh (s) 54.6

SimTraffic Performance Report2040 AM Four-Lane Build 12/20/2019
2040 AM Four-Lane Build SimTraffic ReportWRA/Symmetra Page 1
1: MD 355 & Little Seneca Pkwy Performance by approach
Approach EB WB NB SB AllDenied Del/Veh (s) 3.0 0.2 0.0 0.0 0.8Total Del/Veh (s) 33.1 48.0 28.2 33.2 35.5
2: MD 355 & New Cut Rd Performance by approach
Approach NB SB SW AllDenied Del/Veh (s) 0.0 0.0 0.1 0.0Total Del/Veh (s) 0.9 2.4 9.3 1.9
3: Rosecrest Dr/Canterfield Way & MD 355 Performance by approach
Approach SE NW NE SW AllDenied Del/Veh (s) 0.0 0.0 16.2 0.1 0.5Total Del/Veh (s) 8.8 3.5 589.1 79.8 25.0
4: W Old Baltimore Rd & MD 355 Performance by approach
Approach NB SB NE AllDenied Del/Veh (s) 0.0 0.1 3.5 0.3Total Del/Veh (s) 3.7 28.8 42.0 21.4
5: MD 355 & Greenbrook Dr Performance by approach
Approach SE NW SW AllDenied Del/Veh (s) 0.1 0.0 0.1 0.0Total Del/Veh (s) 7.1 0.3 148.7 5.7
6: MD 355 & Brink Rd Performance by approach
Approach NB SB SW AllDenied Del/Veh (s) 0.0 0.0 2.3 0.1Total Del/Veh (s) 0.8 1.4 8.4 1.6
7: MD 355 & Milestone Manor Dr Performance by approach
Approach EB WB NB SB AllDenied Del/Veh (s) 10.3 2.2 0.2 0.0 0.6Total Del/Veh (s) 189.2 21.5 0.9 0.6 10.8
Total Network Performance
Denied Del/Veh (s) 4.1Total Del/Veh (s) 72.6

SimTraffic Performance Report2040 PM Four-Lane Build 12/20/2019
MD 355 SimTraffic ReportWRA/Symmetra Page 1
1: MD 355 & Little Seneca Pkwy Performance by approach
Approach EB WB NB SB AllDenied Del/Veh (s) 3.0 0.2 0.0 0.0 0.4Total Del/Veh (s) 37.7 51.1 17.2 18.4 24.6
2: MD 355 & New Cut Road Performance by approach
Approach NB SB SW AllDenied Del/Veh (s) 0.0 0.0 0.1 0.0Total Del/Veh (s) 3.9 1.6 44.7 3.3
3: Rosecrest Dr/Canterfield Way & MD 355 Performance by approach
Approach SE NW NE SW AllDenied Del/Veh (s) 0.0 0.0 0.1 0.1 0.0Total Del/Veh (s) 1.3 3.2 23.3 23.8 2.9
4: W Old Baltimore Rd & MD 355 Performance by approach
Approach NB SB NE AllDenied Del/Veh (s) 0.0 0.0 3.2 0.2Total Del/Veh (s) 2.8 6.0 18.7 4.6
5: MD 355 & Greenbrook Dr Performance by approach
Approach SE NW SW AllDenied Del/Veh (s) 0.0 0.0 0.1 0.0Total Del/Veh (s) 3.0 0.9 279.9 2.8
6: MD 355 & Brink Rd Performance by approach
Approach WB NB SB AllDenied Del/Veh (s) 2.4 0.0 0.0 0.3Total Del/Veh (s) 48.7 1.8 1.4 7.3
7: MD 355 & Milestone Manor Dr Performance by approach
Approach EB WB NB SB AllDenied Del/Veh (s) 0.2 1.4 0.3 0.0 0.2Total Del/Veh (s) 125.3 108.4 2.1 0.6 8.5
Total Network Performance
Denied Del/Veh (s) 0.9Total Del/Veh (s) 41.3

Arterial Level of Service2014 AM Existing 08/08/2019
MD 355 BRT Study -Q1 SimTraffic ReportGF - DK Page 1
Arterial Level of Service: NB MD 355
Delay Travel Dist ArterialCross Street Node (s/veh) time (s) (mi) Speed
361 0.3 6.8 0.1 51Brink Rd 6 1.3 23.4 0.3 41Greenbrook Dr 5 1.0 10.4 0.1 38W Old Baltimore Rd 4 8.9 16.9 0.1 20Canterfield Way 3 9.0 38.9 0.4 38New Cut Rd 2 1.0 18.8 0.2 39
10 1.1 4.0 0.0 22Little Seneca Pkwy 1 12.8 16.8 0.0 10Total 35.3 136.0 1.3 35
Arterial Level of Service: SB MD 355
Delay Travel Dist ArterialCross Street Node (s/veh) time (s) (mi) Speed
10 7.7 12.5 0.0 14New Cut Rd 2 4.2 5.9 0.0 16Rosecrest Dr 3 17.8 37.2 0.2 20W Old Baltimore Rd 4 84.6 150.0 0.4 13Greenbrook Dr 5 3.6 11.0 0.1 27Brink Rd 6 5.5 14.5 0.1 27
361 2.5 22.8 0.3 42Milestone Manor Dr 7 0.6 9.6 0.1 36Total 126.6 263.6 1.3 15

Queuing and Blocking Report2014 AM Existing 08/08/2019
MD 355 BRT Study -Q1 SimTraffic ReportGF - DK Page 2
Intersection: 1: MD 355 & Little Seneca Pkwy
Movement EB EB EB WB WB WB NB NB NB B10 SB SBDirections Served L T R L T R L T R T L TMaximum Queue (ft) 153 124 135 405 181 100 127 250 72 85 274 754Average Queue (ft) 60 41 50 202 80 34 53 135 21 8 99 72195th Queue (ft) 125 92 100 378 156 73 107 241 53 45 276 790Link Distance (ft) 710 957 957 169 169 169 31 705Upstream Blk Time (%) 0 5 1 59Queuing Penalty (veh) 0 11 3 0Storage Bay Dist (ft) 250 300 200 200Storage Blk Time (%) 0 0 57Queuing Penalty (veh) 0 0 91
Intersection: 1: MD 355 & Little Seneca Pkwy
Movement SBDirections Served RMaximum Queue (ft) 225Average Queue (ft) 8695th Queue (ft) 245Link Distance (ft)Upstream Blk Time (%)Queuing Penalty (veh)Storage Bay Dist (ft) 175Storage Blk Time (%)Queuing Penalty (veh)
Intersection: 2: MD 355 & New Cut Rd
Movement NB SB B10 B10 SWDirections Served TR LT T LRMaximum Queue (ft) 33 134 241 107 151Average Queue (ft) 2 91 80 6 5395th Queue (ft) 25 145 207 54 129Link Distance (ft) 979 31 169 169 509Upstream Blk Time (%) 24 1 0Queuing Penalty (veh) 249 7 0Storage Bay Dist (ft)Storage Blk Time (%)Queuing Penalty (veh)

Queuing and Blocking Report2014 AM Existing 08/08/2019
MD 355 BRT Study -Q1 SimTraffic ReportGF - DK Page 3
Intersection: 3: Rosecrest Dr/Canterfield Way & MD 355
Movement SE NW NE SWDirections Served L L LTR LTRMaximum Queue (ft) 22 25 475 184Average Queue (ft) 2 2 259 5695th Queue (ft) 12 14 542 177Link Distance (ft) 605 607Upstream Blk Time (%) 7Queuing Penalty (veh) 0Storage Bay Dist (ft) 150 150Storage Blk Time (%)Queuing Penalty (veh)
Intersection: 4: MD 355 & W Old Baltimore Rd
Movement EB NB NB SBDirections Served LR L T TRMaximum Queue (ft) 232 94 356 1404Average Queue (ft) 103 28 97 83295th Queue (ft) 193 72 270 1449Link Distance (ft) 857 404 2080Upstream Blk Time (%) 0Queuing Penalty (veh) 2Storage Bay Dist (ft) 20Storage Blk Time (%) 32 16Queuing Penalty (veh) 197 6
Intersection: 5: MD 355 & Greenbrook Dr
Movement EB WB SWDirections Served LT TR LRMaximum Queue (ft) 67 41 59Average Queue (ft) 4 2 1495th Queue (ft) 34 23 44Link Distance (ft) 404 526 1230Upstream Blk Time (%)Queuing Penalty (veh)Storage Bay Dist (ft)Storage Blk Time (%)Queuing Penalty (veh)
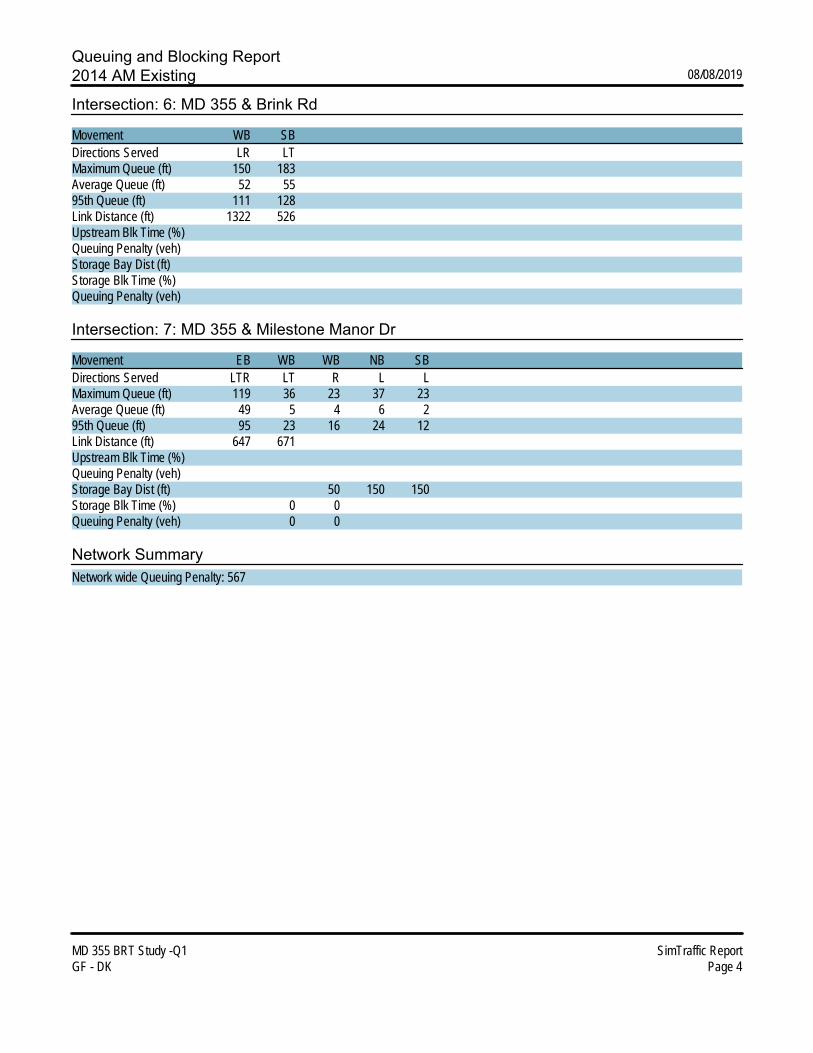
Queuing and Blocking Report2014 AM Existing 08/08/2019
MD 355 BRT Study -Q1 SimTraffic ReportGF - DK Page 4
Intersection: 6: MD 355 & Brink Rd
Movement WB SBDirections Served LR LTMaximum Queue (ft) 150 183Average Queue (ft) 52 5595th Queue (ft) 111 128Link Distance (ft) 1322 526Upstream Blk Time (%)Queuing Penalty (veh)Storage Bay Dist (ft)Storage Blk Time (%)Queuing Penalty (veh)
Intersection: 7: MD 355 & Milestone Manor Dr
Movement EB WB WB NB SBDirections Served LTR LT R L LMaximum Queue (ft) 119 36 23 37 23Average Queue (ft) 49 5 4 6 295th Queue (ft) 95 23 16 24 12Link Distance (ft) 647 671Upstream Blk Time (%)Queuing Penalty (veh)Storage Bay Dist (ft) 50 150 150Storage Blk Time (%) 0 0Queuing Penalty (veh) 0 0
Network SummaryNetwork wide Queuing Penalty: 567

Arterial Level of Service2014 PM Existing 08/08/2019
MD 355 BRT Study -Q1 SimTraffic ReportGF - DK Page 1
Arterial Level of Service: NB MD 355
Delay Travel Dist ArterialCross Street Node (s/veh) time (s) (mi) Speed
9 44.3 53.4 0.1 7Brink Rd 6 81.4 102.4 0.3 9Greenbrook Dr 5 38.9 48.2 0.1 8W Old Baltimore Rd 4 33.4 41.0 0.1 7Canterfield Way 3 7.5 40.5 0.4 37New Cut Road 2 3.7 21.7 0.2 34
10 2.3 5.2 0.0 17Little Seneca Pkwy 1 9.1 13.1 0.0 13Total 220.6 325.4 1.3 15
Arterial Level of Service: SB MD 355
Delay Travel Dist ArterialCross Street Node (s/veh) time (s) (mi) Speed
10 1.5 6.2 0.0 28New Cut Road 2 0.2 1.7 0.0 51Rosecrest Dr 3 1.7 19.2 0.2 38W Old Baltimore Rd 4 27.2 59.3 0.4 25Greenbrook Dr 5 11.0 18.5 0.1 16Brink Rd 6 20.3 29.3 0.1 14
9 2.8 23.2 0.3 39Milestone Manor Dr 7 0.4 9.2 0.1 44Total 64.9 166.6 1.3 28

Queuing and Blocking Report2014 PM Existing 08/08/2019
MD 355 BRT Study -Q1 SimTraffic ReportGF - DK Page 2
Intersection: 1: MD 355 & Little Seneca Pkwy
Movement EB EB EB WB WB WB NB NB NB B10 SB SBDirections Served L T R L T R L T R T L TMaximum Queue (ft) 78 51 51 269 58 52 68 252 92 184 82 258Average Queue (ft) 22 12 17 135 15 18 24 156 26 35 35 8695th Queue (ft) 59 39 41 238 43 43 55 289 63 134 72 196Link Distance (ft) 712 957 957 169 169 169 31 1425Upstream Blk Time (%) 9 4Queuing Penalty (veh) 30 22Storage Bay Dist (ft) 250 300 200 200Storage Blk Time (%) 1Queuing Penalty (veh) 1
Intersection: 1: MD 355 & Little Seneca Pkwy
Movement SBDirections Served RMaximum Queue (ft) 90Average Queue (ft) 695th Queue (ft) 46Link Distance (ft)Upstream Blk Time (%)Queuing Penalty (veh)Storage Bay Dist (ft) 175Storage Blk Time (%)Queuing Penalty (veh)
Intersection: 2: MD 355 & New Cut Road
Movement NB SB B10 SWDirections Served TR LT T LRMaximum Queue (ft) 127 18 6 84Average Queue (ft) 9 0 0 2995th Queue (ft) 62 7 5 72Link Distance (ft) 983 31 169 509Upstream Blk Time (%) 0Queuing Penalty (veh) 0Storage Bay Dist (ft)Storage Blk Time (%)Queuing Penalty (veh)
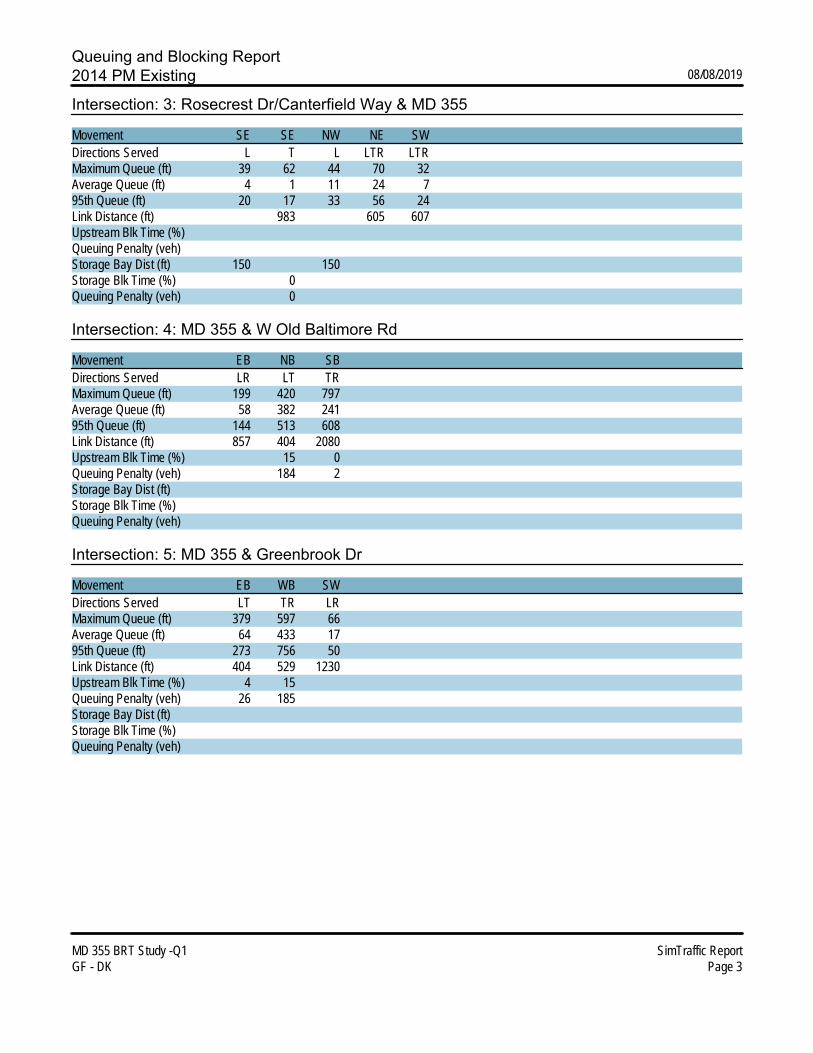
Queuing and Blocking Report2014 PM Existing 08/08/2019
MD 355 BRT Study -Q1 SimTraffic ReportGF - DK Page 3
Intersection: 3: Rosecrest Dr/Canterfield Way & MD 355
Movement SE SE NW NE SWDirections Served L T L LTR LTRMaximum Queue (ft) 39 62 44 70 32Average Queue (ft) 4 1 11 24 795th Queue (ft) 20 17 33 56 24Link Distance (ft) 983 605 607Upstream Blk Time (%)Queuing Penalty (veh)Storage Bay Dist (ft) 150 150Storage Blk Time (%) 0Queuing Penalty (veh) 0
Intersection: 4: MD 355 & W Old Baltimore Rd
Movement EB NB SBDirections Served LR LT TRMaximum Queue (ft) 199 420 797Average Queue (ft) 58 382 24195th Queue (ft) 144 513 608Link Distance (ft) 857 404 2080Upstream Blk Time (%) 15 0Queuing Penalty (veh) 184 2Storage Bay Dist (ft)Storage Blk Time (%)Queuing Penalty (veh)
Intersection: 5: MD 355 & Greenbrook Dr
Movement EB WB SWDirections Served LT TR LRMaximum Queue (ft) 379 597 66Average Queue (ft) 64 433 1795th Queue (ft) 273 756 50Link Distance (ft) 404 529 1230Upstream Blk Time (%) 4 15Queuing Penalty (veh) 26 185Storage Bay Dist (ft)Storage Blk Time (%)Queuing Penalty (veh)

Queuing and Blocking Report2014 PM Existing 08/08/2019
MD 355 BRT Study -Q1 SimTraffic ReportGF - DK Page 4
Intersection: 6: MD 355 & Brink Rd
Movement WB NB B9 B9 SB SBDirections Served LR TR T L TMaximum Queue (ft) 1338 1298 447 380 60 532Average Queue (ft) 1038 679 189 145 29 16395th Queue (ft) 1661 1587 637 528 50 485Link Distance (ft) 1322 1245 526 526 529Upstream Blk Time (%) 47 21 24 14 6Queuing Penalty (veh) 0 203 116 66 40Storage Bay Dist (ft) 10Storage Blk Time (%) 37 0Queuing Penalty (veh) 210 0
Intersection: 7: MD 355 & Milestone Manor Dr
Movement EB WB WB NB NB NB NB SBDirections Served LTR LT R L T T R LMaximum Queue (ft) 318 151 50 115 402 377 35 39Average Queue (ft) 127 63 4 21 79 69 4 795th Queue (ft) 438 245 27 93 436 411 34 42Link Distance (ft) 648 671 1592 1592Upstream Blk Time (%) 5 1 1Queuing Penalty (veh) 0 0 0Storage Bay Dist (ft) 50 150 225 150Storage Blk Time (%) 25 0 0 12 8Queuing Penalty (veh) 2 0 0 4 1
Network SummaryNetwork wide Queuing Penalty: 1091

Arterial Level of Service2040 AM No Build 02/04/2020
MD 355 BRT Study -Q1 SimTraffic ReportGF - DK Page 2
Arterial Level of Service: NB MD 355
Delay Travel Dist ArterialCross Street Node (s/veh) time (s) (mi) Speed
361 0.3 6.8 0.1 51Brink Rd 6 1.0 19.9 0.2 40
11 0.7 4.7 0.0 36Greenbrook Dr 5 0.9 9.7 0.1 41W Old Baltimore Rd 4 4.2 12.4 0.1 31Canterfield Way 3 8.1 37.0 0.4 39New Cut Rd 2 0.8 18.7 0.2 39
10 0.9 3.8 0.0 23Little Seneca Pkwy 1 10.2 14.2 0.0 12Total 27.1 127.2 1.2 37
Arterial Level of Service: SB MD 355
Delay Travel Dist ArterialCross Street Node (s/veh) time (s) (mi) SpeedLittle Seneca Pkwy
10 13.8 18.5 0.0 9New Cut Rd 2 6.5 8.5 0.0 11Rosecrest Dr 3 26.5 45.9 0.2 16W Old Baltimore Rd 4 55.2 114.7 0.4 17Greenbrook Dr 5 4.1 12.4 0.1 30
11 1.3 10.1 0.1 39Brink Rd 6 0.5 4.0 0.0 42
361 1.2 18.0 0.2 44Milestone Manor Dr 7 0.6 9.6 0.1 36Total 109.7 241.6 1.2 17

Queuing and Blocking Report2040 AM No Build 02/04/2020
MD 355 BRT Study -Q1 SimTraffic ReportGF - DK Page 3
Intersection: 1: MD 355 & Little Seneca Pkwy
Movement EB EB EB WB WB WB NB NB NB B10 SB SBDirections Served L T R L T R L T R T L TMaximum Queue (ft) 169 108 202 722 195 123 162 235 59 54 275 754Average Queue (ft) 73 42 82 449 79 37 68 124 20 3 89 68495th Queue (ft) 142 92 165 790 155 85 132 218 48 29 258 878Link Distance (ft) 709 957 957 169 169 169 31 700Upstream Blk Time (%) 1 2 0 44Queuing Penalty (veh) 2 6 2 0Storage Bay Dist (ft) 250 300 200 200Storage Blk Time (%) 0 46Queuing Penalty (veh) 0 83
Intersection: 1: MD 355 & Little Seneca Pkwy
Movement SBDirections Served RMaximum Queue (ft) 225Average Queue (ft) 9795th Queue (ft) 268Link Distance (ft)Upstream Blk Time (%)Queuing Penalty (veh)Storage Bay Dist (ft) 175Storage Blk Time (%) 0Queuing Penalty (veh) 0
Intersection: 2: MD 355 & New Cut Rd
Movement SB B10 B10 SWDirections Served LT T LRMaximum Queue (ft) 145 297 182 522Average Queue (ft) 111 199 23 41195th Queue (ft) 148 347 122 629Link Distance (ft) 31 169 169 509Upstream Blk Time (%) 51 13 0 56Queuing Penalty (veh) 591 75 2 0Storage Bay Dist (ft)Storage Blk Time (%)Queuing Penalty (veh)
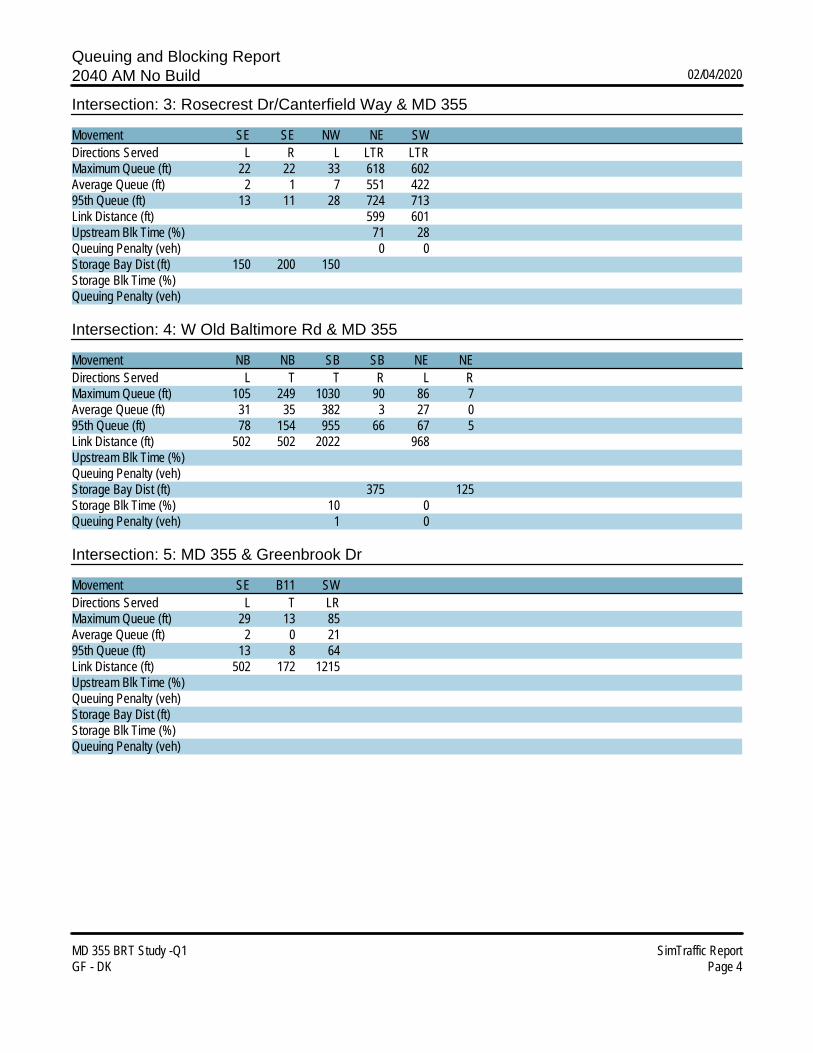
Queuing and Blocking Report2040 AM No Build 02/04/2020
MD 355 BRT Study -Q1 SimTraffic ReportGF - DK Page 4
Intersection: 3: Rosecrest Dr/Canterfield Way & MD 355
Movement SE SE NW NE SWDirections Served L R L LTR LTRMaximum Queue (ft) 22 22 33 618 602Average Queue (ft) 2 1 7 551 42295th Queue (ft) 13 11 28 724 713Link Distance (ft) 599 601Upstream Blk Time (%) 71 28Queuing Penalty (veh) 0 0Storage Bay Dist (ft) 150 200 150Storage Blk Time (%)Queuing Penalty (veh)
Intersection: 4: W Old Baltimore Rd & MD 355
Movement NB NB SB SB NE NEDirections Served L T T R L RMaximum Queue (ft) 105 249 1030 90 86 7Average Queue (ft) 31 35 382 3 27 095th Queue (ft) 78 154 955 66 67 5Link Distance (ft) 502 502 2022 968Upstream Blk Time (%)Queuing Penalty (veh)Storage Bay Dist (ft) 375 125Storage Blk Time (%) 10 0Queuing Penalty (veh) 1 0
Intersection: 5: MD 355 & Greenbrook Dr
Movement SE B11 SWDirections Served L T LRMaximum Queue (ft) 29 13 85Average Queue (ft) 2 0 2195th Queue (ft) 13 8 64Link Distance (ft) 502 172 1215Upstream Blk Time (%)Queuing Penalty (veh)Storage Bay Dist (ft)Storage Blk Time (%)Queuing Penalty (veh)
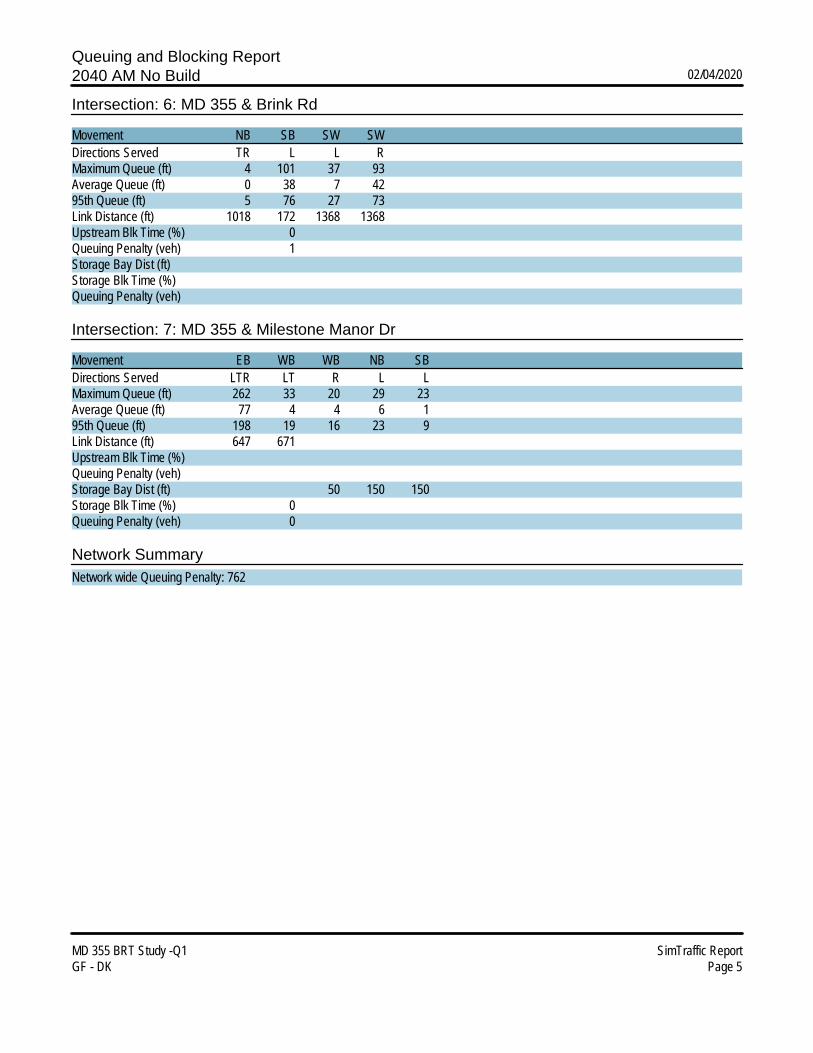
Queuing and Blocking Report2040 AM No Build 02/04/2020
MD 355 BRT Study -Q1 SimTraffic ReportGF - DK Page 5
Intersection: 6: MD 355 & Brink Rd
Movement NB SB SW SWDirections Served TR L L RMaximum Queue (ft) 4 101 37 93Average Queue (ft) 0 38 7 4295th Queue (ft) 5 76 27 73Link Distance (ft) 1018 172 1368 1368Upstream Blk Time (%) 0Queuing Penalty (veh) 1Storage Bay Dist (ft)Storage Blk Time (%)Queuing Penalty (veh)
Intersection: 7: MD 355 & Milestone Manor Dr
Movement EB WB WB NB SBDirections Served LTR LT R L LMaximum Queue (ft) 262 33 20 29 23Average Queue (ft) 77 4 4 6 195th Queue (ft) 198 19 16 23 9Link Distance (ft) 647 671Upstream Blk Time (%)Queuing Penalty (veh)Storage Bay Dist (ft) 50 150 150Storage Blk Time (%) 0Queuing Penalty (veh) 0
Network SummaryNetwork wide Queuing Penalty: 762
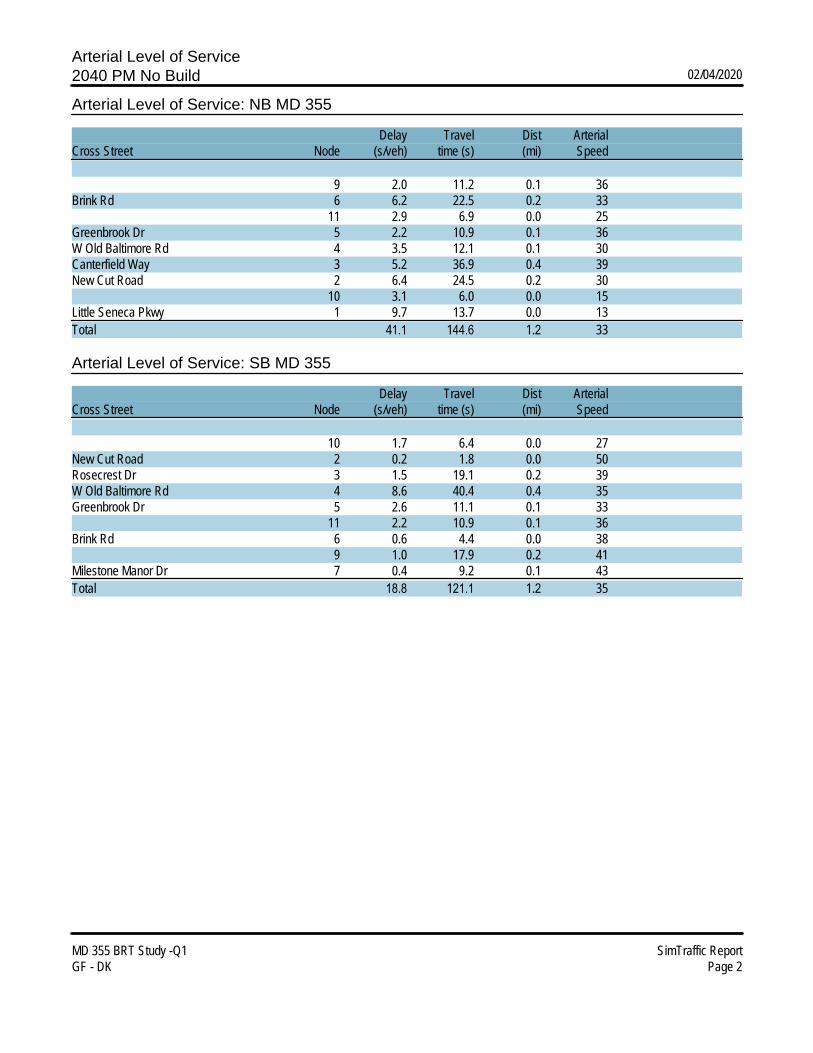
Arterial Level of Service2040 PM No Build 02/04/2020
MD 355 BRT Study -Q1 SimTraffic ReportGF - DK Page 2
Arterial Level of Service: NB MD 355
Delay Travel Dist ArterialCross Street Node (s/veh) time (s) (mi) Speed
9 2.0 11.2 0.1 36Brink Rd 6 6.2 22.5 0.2 33
11 2.9 6.9 0.0 25Greenbrook Dr 5 2.2 10.9 0.1 36W Old Baltimore Rd 4 3.5 12.1 0.1 30Canterfield Way 3 5.2 36.9 0.4 39New Cut Road 2 6.4 24.5 0.2 30
10 3.1 6.0 0.0 15Little Seneca Pkwy 1 9.7 13.7 0.0 13Total 41.1 144.6 1.2 33
Arterial Level of Service: SB MD 355
Delay Travel Dist ArterialCross Street Node (s/veh) time (s) (mi) Speed
10 1.7 6.4 0.0 27New Cut Road 2 0.2 1.8 0.0 50Rosecrest Dr 3 1.5 19.1 0.2 39W Old Baltimore Rd 4 8.6 40.4 0.4 35Greenbrook Dr 5 2.6 11.1 0.1 33
11 2.2 10.9 0.1 36Brink Rd 6 0.6 4.4 0.0 38
9 1.0 17.9 0.2 41Milestone Manor Dr 7 0.4 9.2 0.1 43Total 18.8 121.1 1.2 35

Queuing and Blocking Report2040 PM No Build 02/04/2020
MD 355 BRT Study -Q1 SimTraffic ReportGF - DK Page 3
Intersection: 1: MD 355 & Little Seneca Pkwy
Movement EB EB EB WB WB WB NB NB NB B10 SB SBDirections Served L T R L T R L T R T L TMaximum Queue (ft) 106 82 66 217 102 87 88 263 83 192 201 295Average Queue (ft) 39 20 23 121 32 24 38 186 30 60 58 11995th Queue (ft) 88 58 49 206 75 62 71 299 62 185 122 238Link Distance (ft) 712 957 957 169 169 169 31 1425Upstream Blk Time (%) 12 6Queuing Penalty (veh) 45 37Storage Bay Dist (ft) 250 300 200 200Storage Blk Time (%) 0 3Queuing Penalty (veh) 1 4
Intersection: 1: MD 355 & Little Seneca Pkwy
Movement SBDirections Served RMaximum Queue (ft) 85Average Queue (ft) 1095th Queue (ft) 50Link Distance (ft)Upstream Blk Time (%)Queuing Penalty (veh)Storage Bay Dist (ft) 175Storage Blk Time (%)Queuing Penalty (veh)
Intersection: 2: MD 355 & New Cut Road
Movement NB SB B10 SWDirections Served TR LT T LRMaximum Queue (ft) 292 18 7 200Average Queue (ft) 34 0 0 9995th Queue (ft) 173 6 5 301Link Distance (ft) 982 31 169 509Upstream Blk Time (%) 0Queuing Penalty (veh) 0Storage Bay Dist (ft)Storage Blk Time (%)Queuing Penalty (veh)

Queuing and Blocking Report2040 PM No Build 02/04/2020
MD 355 BRT Study -Q1 SimTraffic ReportGF - DK Page 4
Intersection: 3: Rosecrest Dr/Canterfield Way & MD 355
Movement SE NW NE SWDirections Served L L LTR LTRMaximum Queue (ft) 39 50 96 28Average Queue (ft) 8 14 26 695th Queue (ft) 28 39 66 20Link Distance (ft) 599 601Upstream Blk Time (%)Queuing Penalty (veh)Storage Bay Dist (ft) 150 150Storage Blk Time (%)Queuing Penalty (veh)
Intersection: 4: W Old Baltimore Rd & MD 355
Movement NB NB SB SB NEDirections Served L T T R LMaximum Queue (ft) 146 208 260 16 98Average Queue (ft) 61 68 106 1 3995th Queue (ft) 113 168 217 8 82Link Distance (ft) 501 501 2023 922Upstream Blk Time (%)Queuing Penalty (veh)Storage Bay Dist (ft) 375Storage Blk Time (%) 0 0Queuing Penalty (veh) 0 0
Intersection: 5: MD 355 & Greenbrook Dr
Movement SE B11 B11 SWDirections Served L T LRMaximum Queue (ft) 29 276 41 77Average Queue (ft) 5 34 2 1795th Queue (ft) 22 180 31 55Link Distance (ft) 501 192 192 1215Upstream Blk Time (%) 1 0Queuing Penalty (veh) 10 0Storage Bay Dist (ft)Storage Blk Time (%)Queuing Penalty (veh)

Queuing and Blocking Report2040 PM No Build 02/04/2020
MD 355 BRT Study -Q1 SimTraffic ReportGF - DK Page 5
Intersection: 6: MD 355 & Brink Rd
Movement WB WB NB B9 B9 SB SB B11Directions Served L R TR T L T TMaximum Queue (ft) 495 200 209 127 53 192 53 142Average Queue (ft) 73 98 11 10 5 80 2 1595th Queue (ft) 317 195 94 62 28 187 38 119Link Distance (ft) 1375 1030 526 526 192 192 509Upstream Blk Time (%) 7Queuing Penalty (veh) 26Storage Bay Dist (ft) 125Storage Blk Time (%) 2 14Queuing Penalty (veh) 7 1
Intersection: 7: MD 355 & Milestone Manor Dr
Movement EB WB WB NB NB NB SBDirections Served LTR LT R L T R LMaximum Queue (ft) 168 64 33 43 27 19 21Average Queue (ft) 44 15 5 12 1 1 295th Queue (ft) 120 47 21 36 20 9 11Link Distance (ft) 648 671 1592Upstream Blk Time (%)Queuing Penalty (veh)Storage Bay Dist (ft) 50 150 225 150Storage Blk Time (%) 4 0 0Queuing Penalty (veh) 0 0 0
Network SummaryNetwork wide Queuing Penalty: 131
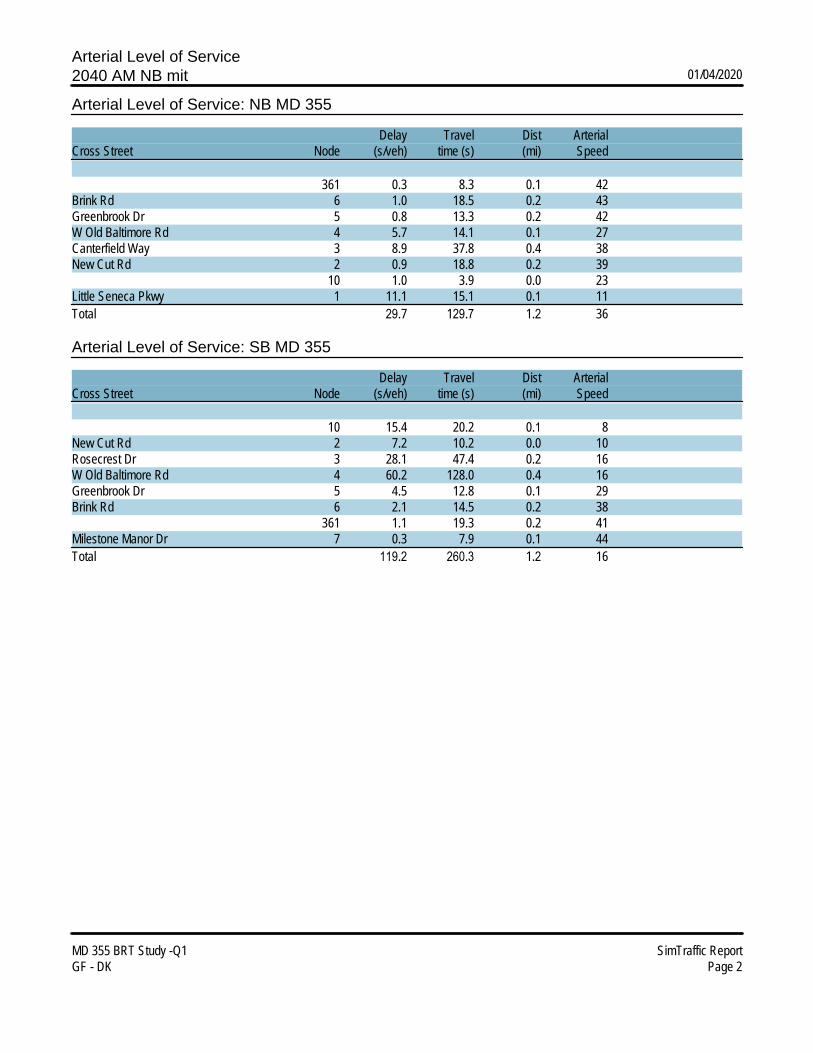
Arterial Level of Service2040 AM NB mit 01/04/2020
MD 355 BRT Study -Q1 SimTraffic ReportGF - DK Page 2
Arterial Level of Service: NB MD 355
Delay Travel Dist ArterialCross Street Node (s/veh) time (s) (mi) Speed
361 0.3 8.3 0.1 42Brink Rd 6 1.0 18.5 0.2 43Greenbrook Dr 5 0.8 13.3 0.2 42W Old Baltimore Rd 4 5.7 14.1 0.1 27Canterfield Way 3 8.9 37.8 0.4 38New Cut Rd 2 0.9 18.8 0.2 39
10 1.0 3.9 0.0 23Little Seneca Pkwy 1 11.1 15.1 0.1 11Total 29.7 129.7 1.2 36
Arterial Level of Service: SB MD 355
Delay Travel Dist ArterialCross Street Node (s/veh) time (s) (mi) Speed
10 15.4 20.2 0.1 8New Cut Rd 2 7.2 10.2 0.0 10Rosecrest Dr 3 28.1 47.4 0.2 16W Old Baltimore Rd 4 60.2 128.0 0.4 16Greenbrook Dr 5 4.5 12.8 0.1 29Brink Rd 6 2.1 14.5 0.2 38
361 1.1 19.3 0.2 41Milestone Manor Dr 7 0.3 7.9 0.1 44Total 119.2 260.3 1.2 16

Queuing and Blocking Report2040 AM NB mit 01/04/2020
MD 355 BRT Study -Q1 SimTraffic ReportGF - DK Page 3
Intersection: 1: MD 355 & Little Seneca Pkwy
Movement EB EB EB WB WB WB NB NB NB B10 SB SBDirections Served L T R L T TR L T R T L TMaximum Queue (ft) 166 178 257 743 474 192 158 241 66 58 275 764Average Queue (ft) 64 44 89 391 102 73 69 137 22 3 110 72495th Queue (ft) 135 132 203 794 334 161 130 231 52 25 306 774Link Distance (ft) 706 957 957 169 169 169 32 703Upstream Blk Time (%) 1 1 0 4 0 52Queuing Penalty (veh) 0 0 1 9 1 0Storage Bay Dist (ft) 250 300 200 200Storage Blk Time (%) 1 0 1 51Queuing Penalty (veh) 1 0 0 91
Intersection: 1: MD 355 & Little Seneca Pkwy
Movement SBDirections Served RMaximum Queue (ft) 225Average Queue (ft) 10195th Queue (ft) 274Link Distance (ft)Upstream Blk Time (%)Queuing Penalty (veh)Storage Bay Dist (ft) 175Storage Blk Time (%)Queuing Penalty (veh)
Intersection: 2: MD 355 & New Cut Rd
Movement NB SB B10 B10 SWDirections Served TR LT T LRMaximum Queue (ft) 6 148 315 204 31Average Queue (ft) 0 118 228 18 695th Queue (ft) 4 143 344 107 23Link Distance (ft) 978 32 169 169 513Upstream Blk Time (%) 59 17 0Queuing Penalty (veh) 701 104 2Storage Bay Dist (ft)Storage Blk Time (%)Queuing Penalty (veh)

Queuing and Blocking Report2040 AM NB mit 01/04/2020
MD 355 BRT Study -Q1 SimTraffic ReportGF - DK Page 4
Intersection: 3: Rosecrest Dr/Canterfield Way & MD 355
Movement SE SE NW NE SWDirections Served L R L LTR LTRMaximum Queue (ft) 21 22 33 615 615Average Queue (ft) 2 1 7 567 44195th Queue (ft) 12 12 28 688 737Link Distance (ft) 599 601Upstream Blk Time (%) 65 39Queuing Penalty (veh) 0 0Storage Bay Dist (ft) 150 200 150Storage Blk Time (%)Queuing Penalty (veh)
Intersection: 4: W Old Baltimore Rd & MD 355
Movement NB NB SB NEDirections Served L T T LMaximum Queue (ft) 108 286 829 68Average Queue (ft) 35 56 332 2195th Queue (ft) 84 205 741 56Link Distance (ft) 503 503 2021 970Upstream Blk Time (%)Queuing Penalty (veh)Storage Bay Dist (ft)Storage Blk Time (%) 7Queuing Penalty (veh) 0
Intersection: 5: MD 355 & Greenbrook Dr
Movement EB SWDirections Served L LRMaximum Queue (ft) 17 87Average Queue (ft) 1 2395th Queue (ft) 11 76Link Distance (ft) 503 1213Upstream Blk Time (%)Queuing Penalty (veh)Storage Bay Dist (ft)Storage Blk Time (%)Queuing Penalty (veh)
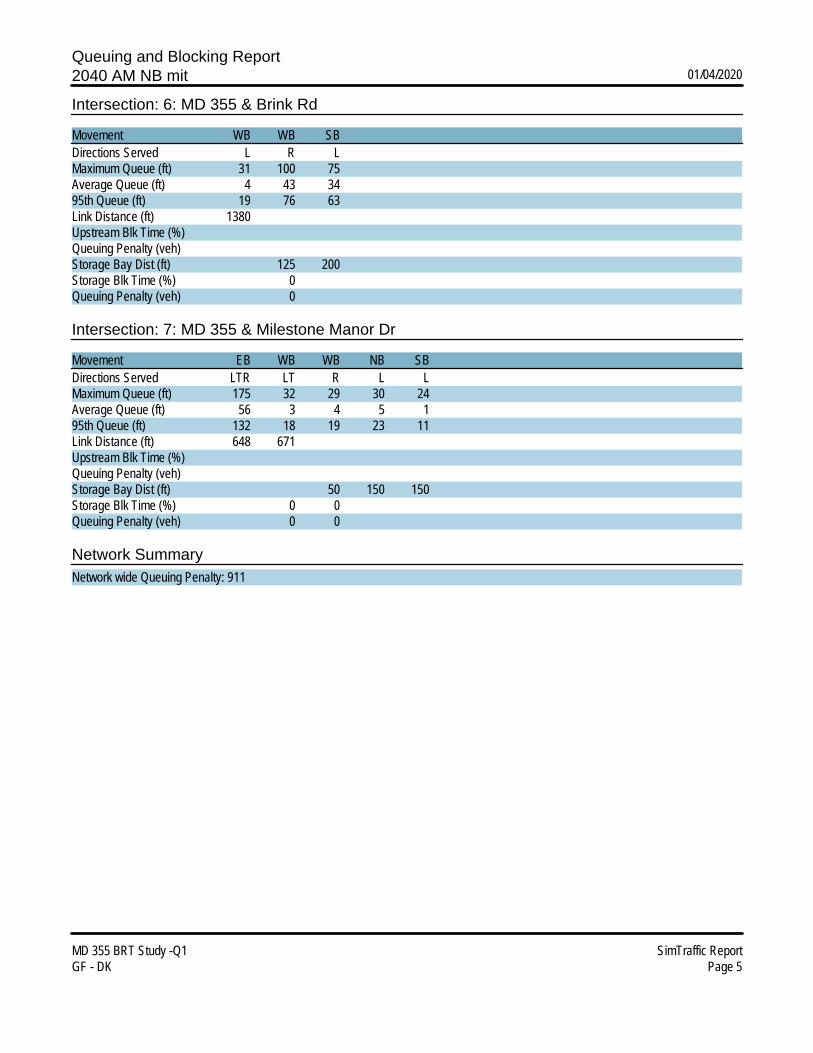
Queuing and Blocking Report2040 AM NB mit 01/04/2020
MD 355 BRT Study -Q1 SimTraffic ReportGF - DK Page 5
Intersection: 6: MD 355 & Brink Rd
Movement WB WB SBDirections Served L R LMaximum Queue (ft) 31 100 75Average Queue (ft) 4 43 3495th Queue (ft) 19 76 63Link Distance (ft) 1380Upstream Blk Time (%)Queuing Penalty (veh)Storage Bay Dist (ft) 125 200Storage Blk Time (%) 0Queuing Penalty (veh) 0
Intersection: 7: MD 355 & Milestone Manor Dr
Movement EB WB WB NB SBDirections Served LTR LT R L LMaximum Queue (ft) 175 32 29 30 24Average Queue (ft) 56 3 4 5 195th Queue (ft) 132 18 19 23 11Link Distance (ft) 648 671Upstream Blk Time (%)Queuing Penalty (veh)Storage Bay Dist (ft) 50 150 150Storage Blk Time (%) 0 0Queuing Penalty (veh) 0 0
Network SummaryNetwork wide Queuing Penalty: 911
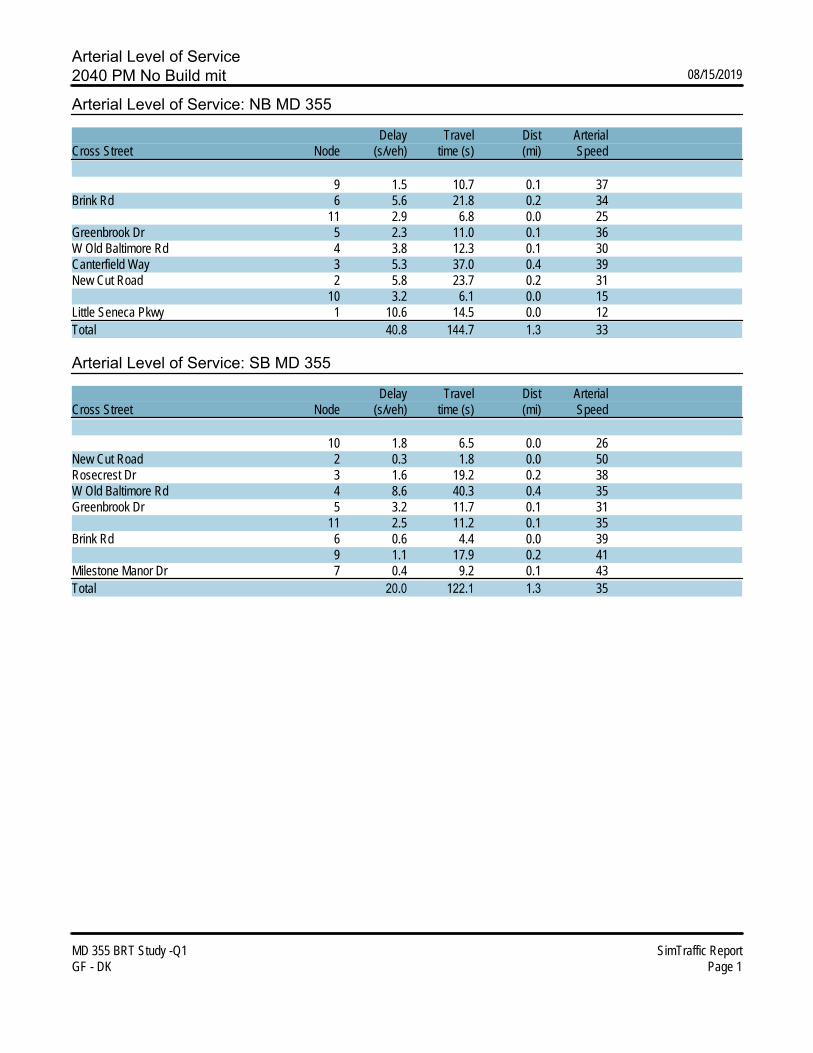
Arterial Level of Service 2040 PM No Build mit 08/15/2019
MD 355 BRT Study -Q1 SimTraffic ReportGF - DK Page 1
Arterial Level of Service: NB MD 355
Delay Travel Dist ArterialCross Street Node (s/veh) time (s) (mi) Speed
9 1.5 10.7 0.1 37Brink Rd 6 5.6 21.8 0.2 34
11 2.9 6.8 0.0 25Greenbrook Dr 5 2.3 11.0 0.1 36W Old Baltimore Rd 4 3.8 12.3 0.1 30Canterfield Way 3 5.3 37.0 0.4 39New Cut Road 2 5.8 23.7 0.2 31
10 3.2 6.1 0.0 15Little Seneca Pkwy 1 10.6 14.5 0.0 12Total 40.8 144.7 1.3 33
Arterial Level of Service: SB MD 355
Delay Travel Dist ArterialCross Street Node (s/veh) time (s) (mi) Speed
10 1.8 6.5 0.0 26New Cut Road 2 0.3 1.8 0.0 50Rosecrest Dr 3 1.6 19.2 0.2 38W Old Baltimore Rd 4 8.6 40.3 0.4 35Greenbrook Dr 5 3.2 11.7 0.1 31
11 2.5 11.2 0.1 35Brink Rd 6 0.6 4.4 0.0 39
9 1.1 17.9 0.2 41Milestone Manor Dr 7 0.4 9.2 0.1 43Total 20.0 122.1 1.3 35

Queuing and Blocking Report 2040 PM No Build mit 08/15/2019
MD 355 BRT Study -Q1 SimTraffic ReportGF - DK Page 2
Intersection: 1: MD 355 & Little Seneca Pkwy
Movement EB EB EB WB WB WB NB NB NB B10 B10 SBDirections Served L T R L T TR L T R T T LMaximum Queue (ft) 106 85 65 265 77 94 94 265 95 24 195 125Average Queue (ft) 35 24 22 137 26 23 40 201 31 1 71 5295th Queue (ft) 82 64 49 230 63 60 80 288 68 21 194 100Link Distance (ft) 712 957 957 169 169 169 31 31Upstream Blk Time (%) 14 8Queuing Penalty (veh) 54 48Storage Bay Dist (ft) 250 300 200 200Storage Blk Time (%)Queuing Penalty (veh)
Intersection: 1: MD 355 & Little Seneca Pkwy
Movement SB SBDirections Served T RMaximum Queue (ft) 282 97Average Queue (ft) 123 1095th Queue (ft) 236 60Link Distance (ft) 1425Upstream Blk Time (%)Queuing Penalty (veh)Storage Bay Dist (ft) 175Storage Blk Time (%) 3Queuing Penalty (veh) 4
Intersection: 2: MD 355 & New Cut Road
Movement NB SB B10 SWDirections Served TR LT T LRMaximum Queue (ft) 301 4 4 48Average Queue (ft) 40 0 0 1195th Queue (ft) 231 4 3 42Link Distance (ft) 982 31 169 509Upstream Blk Time (%) 0Queuing Penalty (veh) 0Storage Bay Dist (ft)Storage Blk Time (%)Queuing Penalty (veh)

Queuing and Blocking Report 2040 PM No Build mit 08/15/2019
MD 355 BRT Study -Q1 SimTraffic ReportGF - DK Page 3
Intersection: 3: Rosecrest Dr/Canterfield Way & MD 355
Movement SE NW NE SWDirections Served L L LTR LTRMaximum Queue (ft) 42 55 92 50Average Queue (ft) 7 16 31 895th Queue (ft) 29 43 74 29Link Distance (ft) 599 601Upstream Blk Time (%)Queuing Penalty (veh)Storage Bay Dist (ft) 150 150Storage Blk Time (%)Queuing Penalty (veh)
Intersection: 4: W Old Baltimore Rd & MD 355
Movement NB NB SB SB NE NEDirections Served L T T R L RMaximum Queue (ft) 134 220 306 6 95 5Average Queue (ft) 51 67 113 0 37 095th Queue (ft) 103 172 244 5 82 4Link Distance (ft) 501 501 2023 922Upstream Blk Time (%)Queuing Penalty (veh)Storage Bay Dist (ft) 375 125Storage Blk Time (%) 0Queuing Penalty (veh) 0
Intersection: 5: MD 355 & Greenbrook Dr
Movement SE SE NW B11 B11 SWDirections Served L T T T LRMaximum Queue (ft) 106 76 3 218 34 86Average Queue (ft) 7 6 0 24 0 2295th Queue (ft) 73 85 3 147 0 88Link Distance (ft) 501 501 509 192 192 1215Upstream Blk Time (%) 0 0 1 0Queuing Penalty (veh) 1 0 6 0Storage Bay Dist (ft)Storage Blk Time (%)Queuing Penalty (veh)
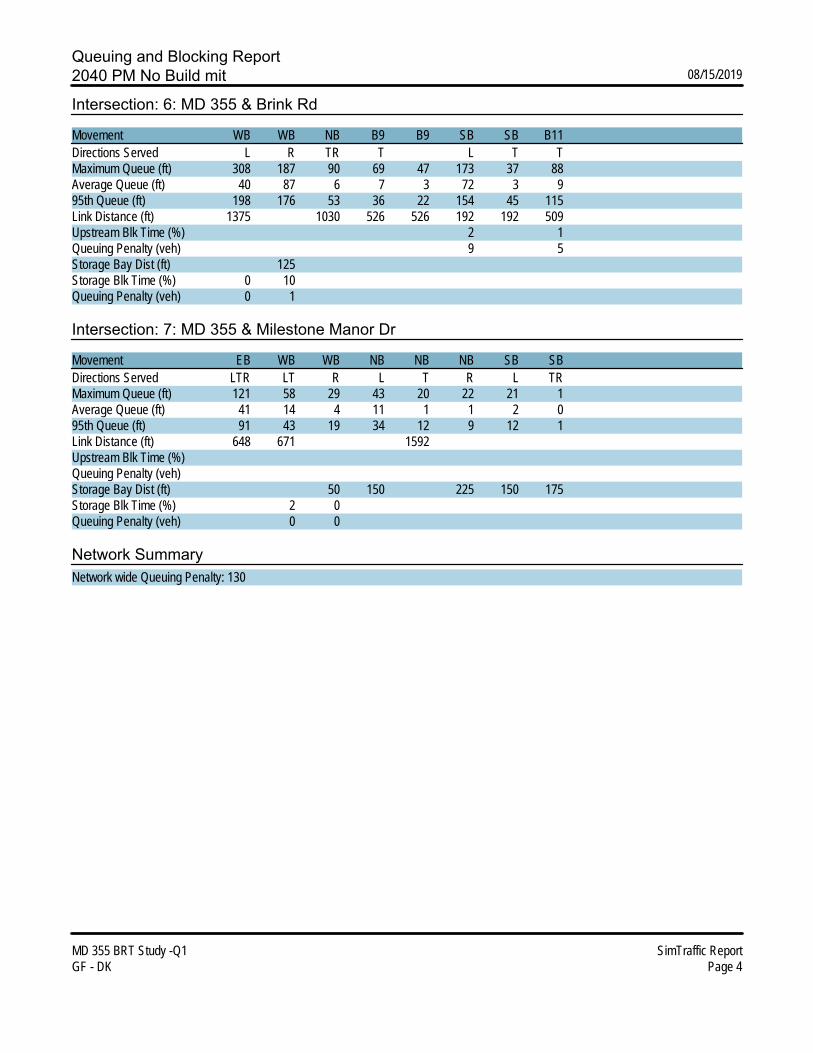
Queuing and Blocking Report 2040 PM No Build mit 08/15/2019
MD 355 BRT Study -Q1 SimTraffic ReportGF - DK Page 4
Intersection: 6: MD 355 & Brink Rd
Movement WB WB NB B9 B9 SB SB B11Directions Served L R TR T L T TMaximum Queue (ft) 308 187 90 69 47 173 37 88Average Queue (ft) 40 87 6 7 3 72 3 995th Queue (ft) 198 176 53 36 22 154 45 115Link Distance (ft) 1375 1030 526 526 192 192 509Upstream Blk Time (%) 2 1Queuing Penalty (veh) 9 5Storage Bay Dist (ft) 125Storage Blk Time (%) 0 10Queuing Penalty (veh) 0 1
Intersection: 7: MD 355 & Milestone Manor Dr
Movement EB WB WB NB NB NB SB SBDirections Served LTR LT R L T R L TRMaximum Queue (ft) 121 58 29 43 20 22 21 1Average Queue (ft) 41 14 4 11 1 1 2 095th Queue (ft) 91 43 19 34 12 9 12 1Link Distance (ft) 648 671 1592Upstream Blk Time (%)Queuing Penalty (veh)Storage Bay Dist (ft) 50 150 225 150 175Storage Blk Time (%) 2 0Queuing Penalty (veh) 0 0
Network SummaryNetwork wide Queuing Penalty: 130
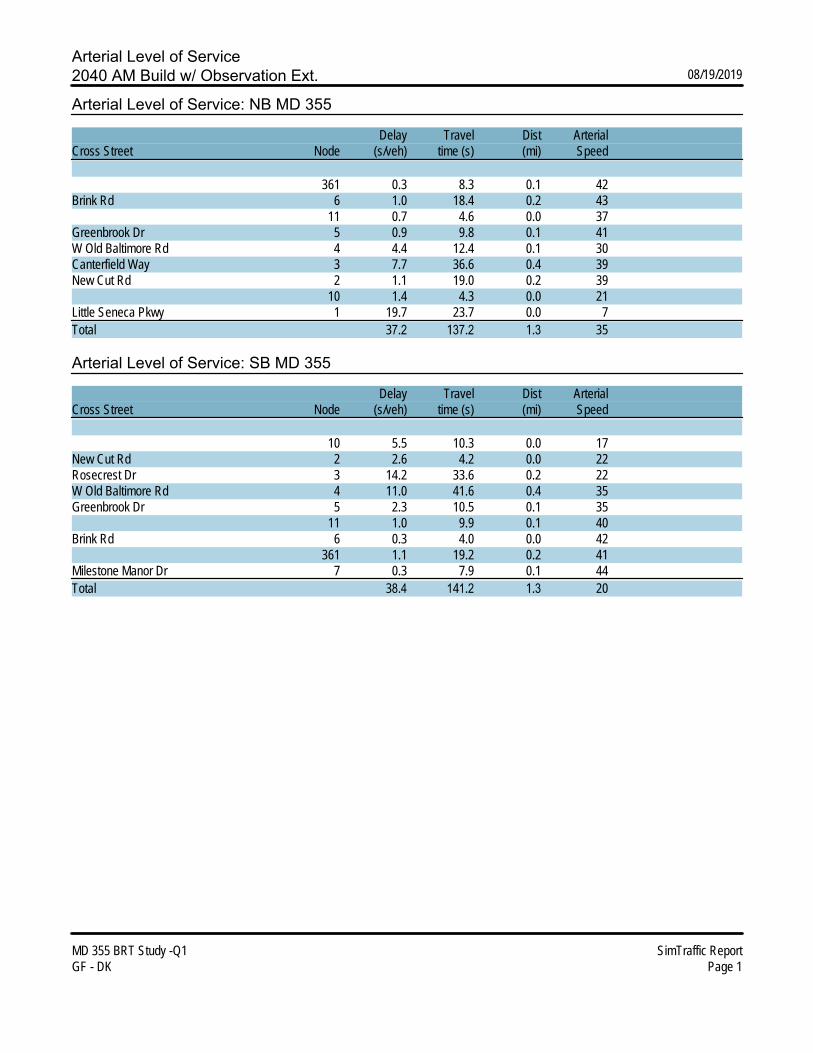
Arterial Level of Service2040 AM Build w/ Observation Ext. 08/19/2019
MD 355 BRT Study -Q1 SimTraffic ReportGF - DK Page 1
Arterial Level of Service: NB MD 355
Delay Travel Dist ArterialCross Street Node (s/veh) time (s) (mi) Speed
361 0.3 8.3 0.1 42Brink Rd 6 1.0 18.4 0.2 43
11 0.7 4.6 0.0 37Greenbrook Dr 5 0.9 9.8 0.1 41W Old Baltimore Rd 4 4.4 12.4 0.1 30Canterfield Way 3 7.7 36.6 0.4 39New Cut Rd 2 1.1 19.0 0.2 39
10 1.4 4.3 0.0 21Little Seneca Pkwy 1 19.7 23.7 0.0 7Total 37.2 137.2 1.3 35
Arterial Level of Service: SB MD 355
Delay Travel Dist ArterialCross Street Node (s/veh) time (s) (mi) Speed
10 5.5 10.3 0.0 17New Cut Rd 2 2.6 4.2 0.0 22Rosecrest Dr 3 14.2 33.6 0.2 22W Old Baltimore Rd 4 11.0 41.6 0.4 35Greenbrook Dr 5 2.3 10.5 0.1 35
11 1.0 9.9 0.1 40Brink Rd 6 0.3 4.0 0.0 42
361 1.1 19.2 0.2 41Milestone Manor Dr 7 0.3 7.9 0.1 44Total 38.4 141.2 1.3 20

Queuing and Blocking Report2040 AM Build w/ Observation Ext. 08/19/2019
MD 355 BRT Study -Q1 SimTraffic ReportGF - DK Page 2
Intersection: 1: MD 355 & Little Seneca Pkwy
Movement EB EB EB WB WB WB NB NB NB B10 SB SBDirections Served L T R L T R L T R T L TMaximum Queue (ft) 325 764 375 432 696 275 189 250 66 119 275 768Average Queue (ft) 323 731 261 130 334 127 93 163 26 10 86 73895th Queue (ft) 330 752 541 307 646 319 163 259 56 56 252 759Link Distance (ft) 710 957 957 169 169 169 32 714Upstream Blk Time (%) 98 1 1 9 2 58Queuing Penalty (veh) 0 0 2 20 5 0Storage Bay Dist (ft) 250 300 200 200Storage Blk Time (%) 100 28 54Queuing Penalty (veh) 370 43 151
Intersection: 1: MD 355 & Little Seneca Pkwy
Movement SBDirections Served RMaximum Queue (ft) 225Average Queue (ft) 14795th Queue (ft) 298Link Distance (ft)Upstream Blk Time (%)Queuing Penalty (veh)Storage Bay Dist (ft) 175Storage Blk Time (%) 0Queuing Penalty (veh) 0
Intersection: 2: MD 355 & New Cut Rd
Movement NB SB B10 B10 SWDirections Served TR LT T LRMaximum Queue (ft) 36 124 106 8 234Average Queue (ft) 2 52 13 0 9195th Queue (ft) 16 118 61 7 216Link Distance (ft) 979 32 169 169 513Upstream Blk Time (%) 9 0Queuing Penalty (veh) 91 0Storage Bay Dist (ft)Storage Blk Time (%)Queuing Penalty (veh)
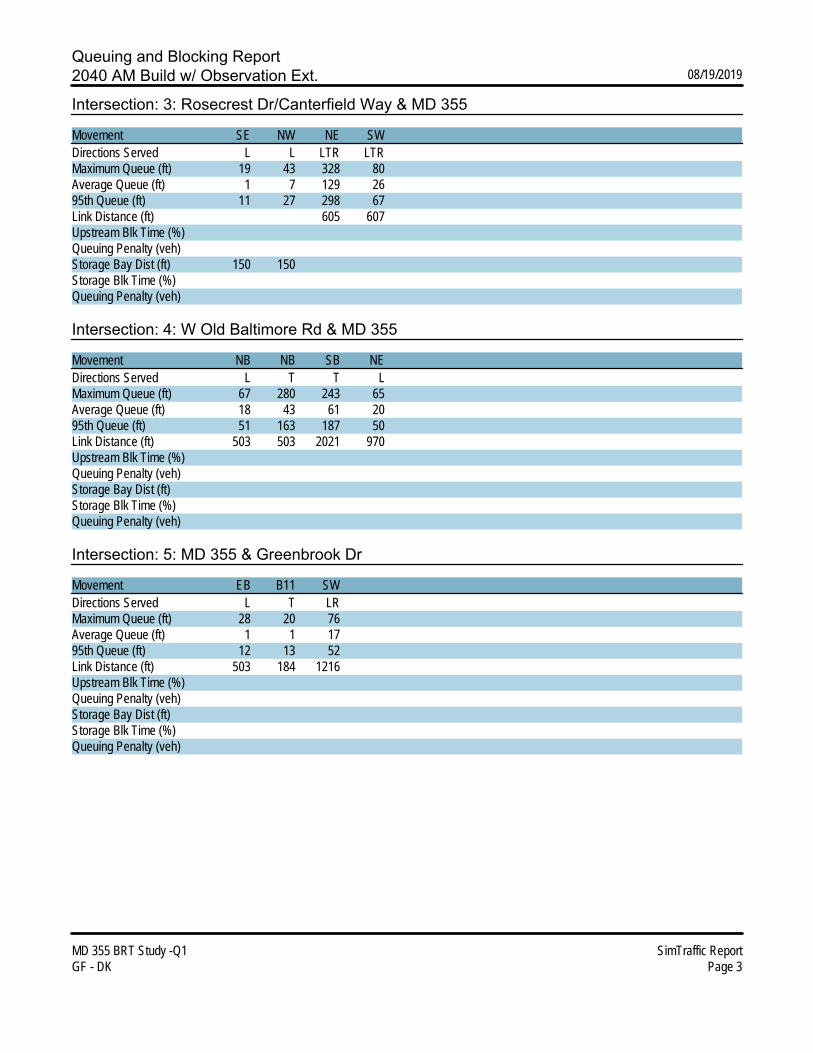
Queuing and Blocking Report2040 AM Build w/ Observation Ext. 08/19/2019
MD 355 BRT Study -Q1 SimTraffic ReportGF - DK Page 3
Intersection: 3: Rosecrest Dr/Canterfield Way & MD 355
Movement SE NW NE SWDirections Served L L LTR LTRMaximum Queue (ft) 19 43 328 80Average Queue (ft) 1 7 129 2695th Queue (ft) 11 27 298 67Link Distance (ft) 605 607Upstream Blk Time (%)Queuing Penalty (veh)Storage Bay Dist (ft) 150 150Storage Blk Time (%)Queuing Penalty (veh)
Intersection: 4: W Old Baltimore Rd & MD 355
Movement NB NB SB NEDirections Served L T T LMaximum Queue (ft) 67 280 243 65Average Queue (ft) 18 43 61 2095th Queue (ft) 51 163 187 50Link Distance (ft) 503 503 2021 970Upstream Blk Time (%)Queuing Penalty (veh)Storage Bay Dist (ft)Storage Blk Time (%)Queuing Penalty (veh)
Intersection: 5: MD 355 & Greenbrook Dr
Movement EB B11 SWDirections Served L T LRMaximum Queue (ft) 28 20 76Average Queue (ft) 1 1 1795th Queue (ft) 12 13 52Link Distance (ft) 503 184 1216Upstream Blk Time (%)Queuing Penalty (veh)Storage Bay Dist (ft)Storage Blk Time (%)Queuing Penalty (veh)
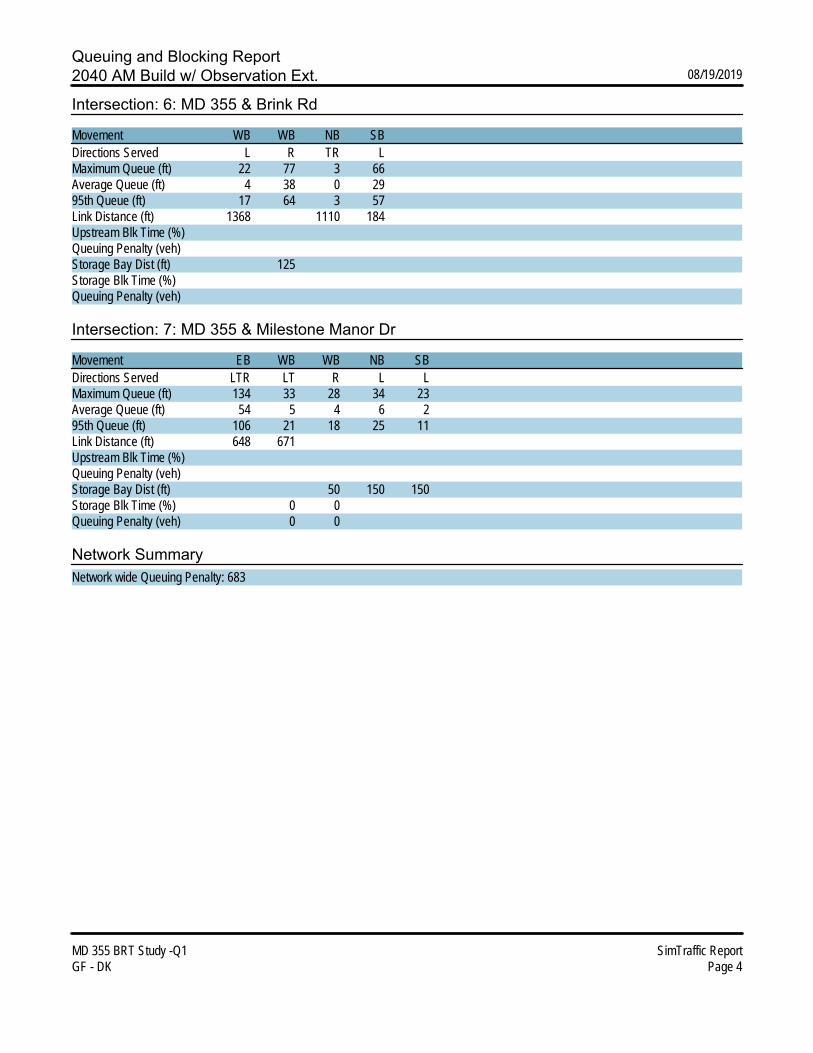
Queuing and Blocking Report2040 AM Build w/ Observation Ext. 08/19/2019
MD 355 BRT Study -Q1 SimTraffic ReportGF - DK Page 4
Intersection: 6: MD 355 & Brink Rd
Movement WB WB NB SBDirections Served L R TR LMaximum Queue (ft) 22 77 3 66Average Queue (ft) 4 38 0 2995th Queue (ft) 17 64 3 57Link Distance (ft) 1368 1110 184Upstream Blk Time (%)Queuing Penalty (veh)Storage Bay Dist (ft) 125Storage Blk Time (%)Queuing Penalty (veh)
Intersection: 7: MD 355 & Milestone Manor Dr
Movement EB WB WB NB SBDirections Served LTR LT R L LMaximum Queue (ft) 134 33 28 34 23Average Queue (ft) 54 5 4 6 295th Queue (ft) 106 21 18 25 11Link Distance (ft) 648 671Upstream Blk Time (%)Queuing Penalty (veh)Storage Bay Dist (ft) 50 150 150Storage Blk Time (%) 0 0Queuing Penalty (veh) 0 0
Network SummaryNetwork wide Queuing Penalty: 683

Arterial Level of Service2040 PM Obs Dr Ext 08/09/2019
MD 355 BRT Study -Q1 SimTraffic ReportGF - DK Page 1
Arterial Level of Service: NB MD 355
Delay Travel Dist ArterialCross Street Node (s/veh) time (s) (mi) Speed
9 1.3 10.5 0.1 38Brink Rd 6 4.4 20.8 0.2 35
11 2.2 6.2 0.0 28Greenbrook Dr 5 1.8 10.5 0.1 37W Old Baltimore Rd 4 2.8 11.4 0.1 32Canterfield Way 3 5.0 36.8 0.4 39New Cut Road 2 21.6 39.6 0.2 19
10 8.1 11.0 0.0 8Little Seneca Pkwy 1 20.0 23.9 0.0 7Total 67.2 170.8 1.3 28
Arterial Level of Service: SB MD 355
Delay Travel Dist ArterialCross Street Node (s/veh) time (s) (mi) Speed
10 2.6 7.3 0.0 23New Cut Road 2 0.3 1.9 0.0 48Rosecrest Dr 3 1.7 19.4 0.2 38W Old Baltimore Rd 4 7.5 39.4 0.4 36Greenbrook Dr 5 2.4 11.0 0.1 33
11 1.7 10.4 0.1 37Brink Rd 6 0.4 4.3 0.0 40
9 1.0 17.8 0.2 41Milestone Manor Dr 7 0.4 9.2 0.1 43Total 18.2 120.6 1.3 33
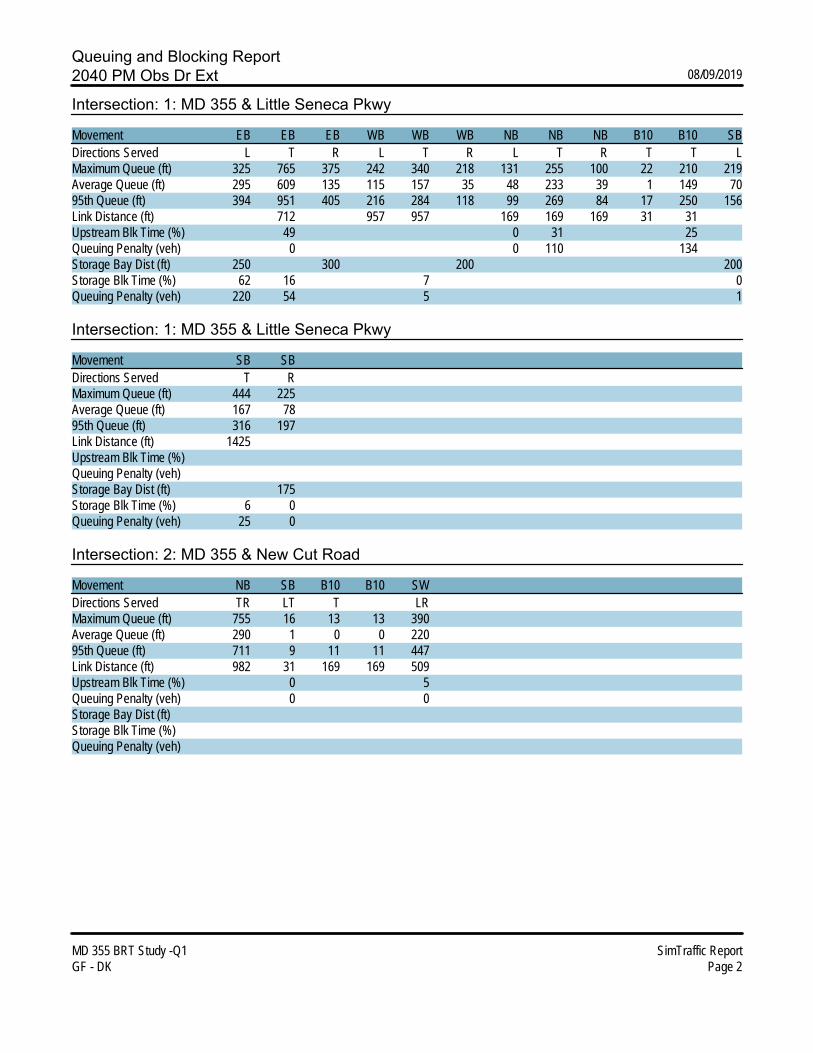
Queuing and Blocking Report2040 PM Obs Dr Ext 08/09/2019
MD 355 BRT Study -Q1 SimTraffic ReportGF - DK Page 2
Intersection: 1: MD 355 & Little Seneca Pkwy
Movement EB EB EB WB WB WB NB NB NB B10 B10 SBDirections Served L T R L T R L T R T T LMaximum Queue (ft) 325 765 375 242 340 218 131 255 100 22 210 219Average Queue (ft) 295 609 135 115 157 35 48 233 39 1 149 7095th Queue (ft) 394 951 405 216 284 118 99 269 84 17 250 156Link Distance (ft) 712 957 957 169 169 169 31 31Upstream Blk Time (%) 49 0 31 25Queuing Penalty (veh) 0 0 110 134Storage Bay Dist (ft) 250 300 200 200Storage Blk Time (%) 62 16 7 0Queuing Penalty (veh) 220 54 5 1
Intersection: 1: MD 355 & Little Seneca Pkwy
Movement SB SBDirections Served T RMaximum Queue (ft) 444 225Average Queue (ft) 167 7895th Queue (ft) 316 197Link Distance (ft) 1425Upstream Blk Time (%)Queuing Penalty (veh)Storage Bay Dist (ft) 175Storage Blk Time (%) 6 0Queuing Penalty (veh) 25 0
Intersection: 2: MD 355 & New Cut Road
Movement NB SB B10 B10 SWDirections Served TR LT T LRMaximum Queue (ft) 755 16 13 13 390Average Queue (ft) 290 1 0 0 22095th Queue (ft) 711 9 11 11 447Link Distance (ft) 982 31 169 169 509Upstream Blk Time (%) 0 5Queuing Penalty (veh) 0 0Storage Bay Dist (ft)Storage Blk Time (%)Queuing Penalty (veh)
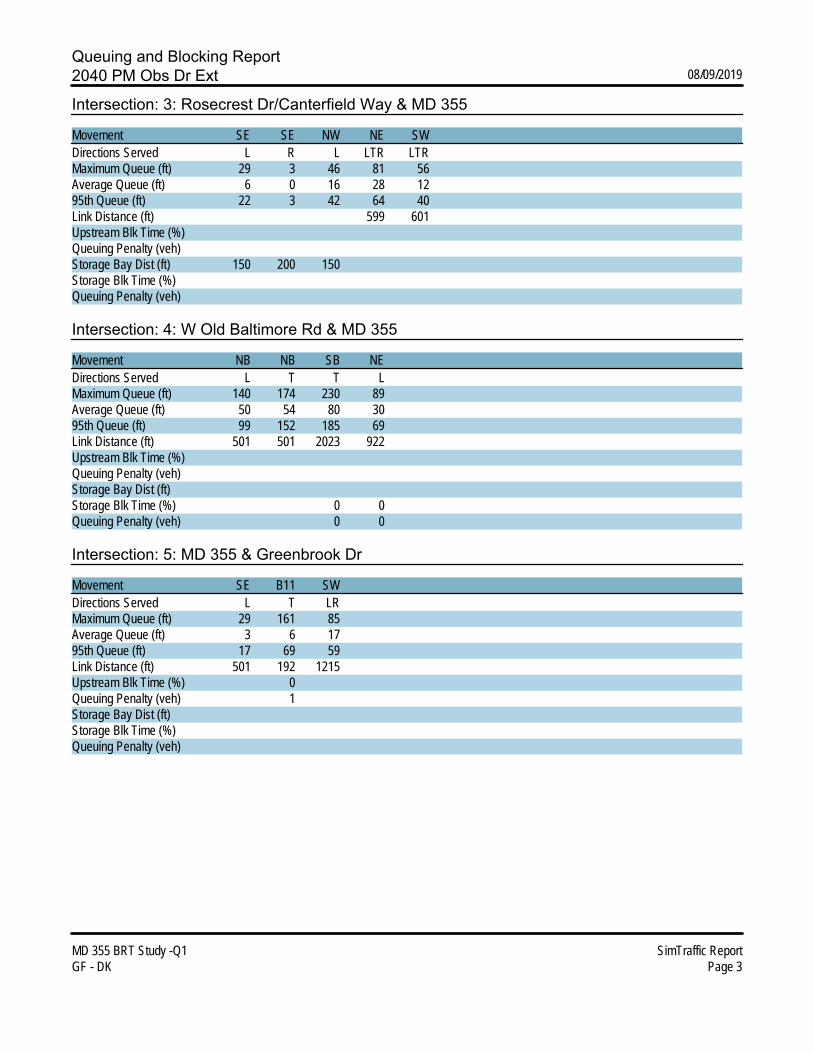
Queuing and Blocking Report2040 PM Obs Dr Ext 08/09/2019
MD 355 BRT Study -Q1 SimTraffic ReportGF - DK Page 3
Intersection: 3: Rosecrest Dr/Canterfield Way & MD 355
Movement SE SE NW NE SWDirections Served L R L LTR LTRMaximum Queue (ft) 29 3 46 81 56Average Queue (ft) 6 0 16 28 1295th Queue (ft) 22 3 42 64 40Link Distance (ft) 599 601Upstream Blk Time (%)Queuing Penalty (veh)Storage Bay Dist (ft) 150 200 150Storage Blk Time (%)Queuing Penalty (veh)
Intersection: 4: W Old Baltimore Rd & MD 355
Movement NB NB SB NEDirections Served L T T LMaximum Queue (ft) 140 174 230 89Average Queue (ft) 50 54 80 3095th Queue (ft) 99 152 185 69Link Distance (ft) 501 501 2023 922Upstream Blk Time (%)Queuing Penalty (veh)Storage Bay Dist (ft)Storage Blk Time (%) 0 0Queuing Penalty (veh) 0 0
Intersection: 5: MD 355 & Greenbrook Dr
Movement SE B11 SWDirections Served L T LRMaximum Queue (ft) 29 161 85Average Queue (ft) 3 6 1795th Queue (ft) 17 69 59Link Distance (ft) 501 192 1215Upstream Blk Time (%) 0Queuing Penalty (veh) 1Storage Bay Dist (ft)Storage Blk Time (%)Queuing Penalty (veh)

Queuing and Blocking Report2040 PM Obs Dr Ext 08/09/2019
MD 355 BRT Study -Q1 SimTraffic ReportGF - DK Page 4
Intersection: 6: MD 355 & Brink Rd
Movement WB WB NB B9 B9 SB B11Directions Served L R TR T L TMaximum Queue (ft) 99 172 18 69 41 163 71Average Queue (ft) 8 74 1 5 3 61 495th Queue (ft) 71 141 7 33 20 129 77Link Distance (ft) 1375 1030 526 526 192 509Upstream Blk Time (%) 1 0Queuing Penalty (veh) 4 0Storage Bay Dist (ft) 125Storage Blk Time (%) 0 4Queuing Penalty (veh) 0 0
Intersection: 7: MD 355 & Milestone Manor Dr
Movement EB WB WB NB NB NB NB SB SB SBDirections Served LTR LT R L T T R L T TRMaximum Queue (ft) 122 59 29 40 27 8 40 26 2 2Average Queue (ft) 38 14 4 9 1 0 2 3 0 095th Queue (ft) 83 44 20 31 13 6 17 17 2 1Link Distance (ft) 648 671 1592 1592 526Upstream Blk Time (%)Queuing Penalty (veh)Storage Bay Dist (ft) 50 150 225 150 175Storage Blk Time (%) 2 0Queuing Penalty (veh) 0 0
Network SummaryNetwork wide Queuing Penalty: 554

Arterial Level of Service2014 AM Build mit 08/16/2019
MD 355 BRT Study -Q1 SimTraffic ReportGF - DK Page 1
Arterial Level of Service: NB MD 355
Delay Travel Dist ArterialCross Street Node (s/veh) time (s) (mi) Speed
361 0.2 6.8 0.1 51Brink Rd 6 1.1 19.9 0.2 40
11 0.7 4.7 0.0 36Greenbrook Dr 5 0.9 9.8 0.1 41W Old Baltimore Rd 4 4.5 12.8 0.1 30Canterfield Way 3 8.3 37.1 0.4 39New Cut Rd 2 1.1 19.0 0.2 39
10 1.4 4.3 0.0 21Little Seneca Pkwy 1 19.6 23.6 0.0 7Total 37.8 138.0 1.3 34
Arterial Level of Service: SB MD 355
Delay Travel Dist ArterialCross Street Node (s/veh) time (s) (mi) Speed
10 9.0 13.8 0.0 12New Cut Rd 2 4.7 6.5 0.0 15Rosecrest Dr 3 19.1 38.4 0.2 19W Old Baltimore Rd 4 17.4 48.7 0.4 30Greenbrook Dr 5 2.6 10.8 0.1 34
11 1.1 9.9 0.1 40Brink Rd 6 0.4 4.0 0.0 42
361 1.1 17.9 0.2 44Milestone Manor Dr 7 0.7 9.6 0.1 36Total 56.0 159.5 1.3 19
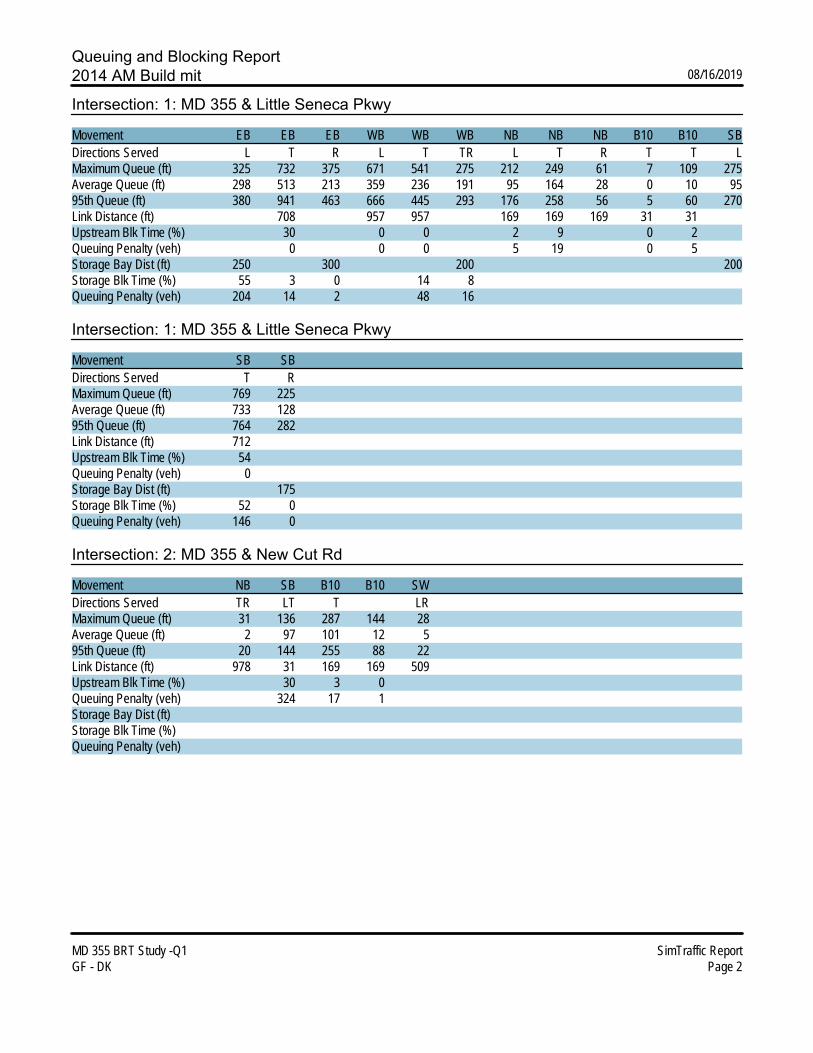
Queuing and Blocking Report2014 AM Build mit 08/16/2019
MD 355 BRT Study -Q1 SimTraffic ReportGF - DK Page 2
Intersection: 1: MD 355 & Little Seneca Pkwy
Movement EB EB EB WB WB WB NB NB NB B10 B10 SBDirections Served L T R L T TR L T R T T LMaximum Queue (ft) 325 732 375 671 541 275 212 249 61 7 109 275Average Queue (ft) 298 513 213 359 236 191 95 164 28 0 10 9595th Queue (ft) 380 941 463 666 445 293 176 258 56 5 60 270Link Distance (ft) 708 957 957 169 169 169 31 31Upstream Blk Time (%) 30 0 0 2 9 0 2Queuing Penalty (veh) 0 0 0 5 19 0 5Storage Bay Dist (ft) 250 300 200 200Storage Blk Time (%) 55 3 0 14 8Queuing Penalty (veh) 204 14 2 48 16
Intersection: 1: MD 355 & Little Seneca Pkwy
Movement SB SBDirections Served T RMaximum Queue (ft) 769 225Average Queue (ft) 733 12895th Queue (ft) 764 282Link Distance (ft) 712Upstream Blk Time (%) 54Queuing Penalty (veh) 0Storage Bay Dist (ft) 175Storage Blk Time (%) 52 0Queuing Penalty (veh) 146 0
Intersection: 2: MD 355 & New Cut Rd
Movement NB SB B10 B10 SWDirections Served TR LT T LRMaximum Queue (ft) 31 136 287 144 28Average Queue (ft) 2 97 101 12 595th Queue (ft) 20 144 255 88 22Link Distance (ft) 978 31 169 169 509Upstream Blk Time (%) 30 3 0Queuing Penalty (veh) 324 17 1Storage Bay Dist (ft)Storage Blk Time (%)Queuing Penalty (veh)

Queuing and Blocking Report2014 AM Build mit 08/16/2019
MD 355 BRT Study -Q1 SimTraffic ReportGF - DK Page 3
Intersection: 3: Rosecrest Dr/Canterfield Way & MD 355
Movement SE SE NW NE SWDirections Served L R L LTR LTRMaximum Queue (ft) 19 6 44 627 352Average Queue (ft) 3 0 8 505 17195th Queue (ft) 15 4 30 761 414Link Distance (ft) 599 601Upstream Blk Time (%) 59 3Queuing Penalty (veh) 0 0Storage Bay Dist (ft) 150 200 150Storage Blk Time (%)Queuing Penalty (veh)
Intersection: 4: W Old Baltimore Rd & MD 355
Movement NB NB SB NEDirections Served L T T LMaximum Queue (ft) 65 248 396 85Average Queue (ft) 20 40 84 2395th Queue (ft) 50 169 299 65Link Distance (ft) 502 502 2022 968Upstream Blk Time (%)Queuing Penalty (veh)Storage Bay Dist (ft)Storage Blk Time (%) 1 0Queuing Penalty (veh) 0 0
Intersection: 5: MD 355 & Greenbrook Dr
Movement SE B11 SWDirections Served L T LRMaximum Queue (ft) 29 2 69Average Queue (ft) 2 0 1695th Queue (ft) 14 2 50Link Distance (ft) 502 172 1215Upstream Blk Time (%)Queuing Penalty (veh)Storage Bay Dist (ft)Storage Blk Time (%)Queuing Penalty (veh)

Queuing and Blocking Report2014 AM Build mit 08/16/2019
MD 355 BRT Study -Q1 SimTraffic ReportGF - DK Page 4
Intersection: 6: MD 355 & Brink Rd
Movement NB SB SW SWDirections Served TR L L RMaximum Queue (ft) 3 70 31 89Average Queue (ft) 0 34 4 4295th Queue (ft) 3 62 19 71Link Distance (ft) 1018 172 1368 1368Upstream Blk Time (%)Queuing Penalty (veh)Storage Bay Dist (ft)Storage Blk Time (%)Queuing Penalty (veh)
Intersection: 7: MD 355 & Milestone Manor Dr
Movement EB WB WB NB SB SBDirections Served LTR LT R L L TMaximum Queue (ft) 207 31 28 33 19 2Average Queue (ft) 68 5 4 6 1 095th Queue (ft) 169 22 18 24 10 2Link Distance (ft) 647 671 356Upstream Blk Time (%)Queuing Penalty (veh)Storage Bay Dist (ft) 50 150 150Storage Blk Time (%) 0 0Queuing Penalty (veh) 0 0
Network SummaryNetwork wide Queuing Penalty: 801

Arterial Level of Service2040 PM Obs Dr Ext mit 01/04/2020
MD 355 BRT Study -Q1 SimTraffic ReportGF - DK Page 2
Arterial Level of Service: NB MD 355
Delay Travel Dist ArterialCross Street Node (s/veh) time (s) (mi) Speed
9 1.2 10.4 0.1 38Brink Rd 6 4.3 20.6 0.2 36
11 2.2 6.2 0.0 28Greenbrook Dr 5 1.8 10.5 0.1 37W Old Baltimore Rd 4 2.8 11.3 0.1 32Canterfield Way 3 4.8 36.4 0.4 39New Cut Road 2 16.6 34.7 0.2 21
10 7.5 10.4 0.0 9Little Seneca Pkwy 1 21.7 25.6 0.1 7Total 62.9 166.2 1.2 29
Arterial Level of Service: SB MD 355
Delay Travel Dist ArterialCross Street Node (s/veh) time (s) (mi) Speed
10 2.8 7.5 0.1 23New Cut Road 2 0.4 1.9 0.0 46Rosecrest Dr 3 1.9 19.5 0.2 38W Old Baltimore Rd 4 3.8 35.5 0.4 40Greenbrook Dr 5 1.6 10.1 0.1 36
11 1.0 9.7 0.1 40Brink Rd 6 0.4 4.2 0.0 41
9 1.1 17.9 0.2 41Milestone Manor Dr 7 0.4 9.2 0.1 43Total 14.5 115.6 1.2 33

Queuing and Blocking Report2040 PM Obs Dr Ext mit 01/04/2020
MD 355 BRT Study -Q1 SimTraffic ReportGF - DK Page 3
Intersection: 1: MD 355 & Little Seneca Pkwy
Movement EB EB EB WB WB WB NB NB NB B10 B10 SBDirections Served L T R L T TR L T R T T LMaximum Queue (ft) 325 702 375 422 188 157 101 270 112 195 109 242Average Queue (ft) 235 364 76 226 107 70 47 240 46 135 4 8095th Queue (ft) 366 722 277 405 178 148 86 267 91 231 47 182Link Distance (ft) 712 957 957 169 169 169 31 31Upstream Blk Time (%) 8 32 25Queuing Penalty (veh) 0 113 132Storage Bay Dist (ft) 250 300 200 200Storage Blk Time (%) 12 22 0 0 0Queuing Penalty (veh) 43 78 0 0 1
Intersection: 1: MD 355 & Little Seneca Pkwy
Movement SB SBDirections Served T RMaximum Queue (ft) 467 225Average Queue (ft) 207 9495th Queue (ft) 378 220Link Distance (ft) 1425Upstream Blk Time (%)Queuing Penalty (veh)Storage Bay Dist (ft) 175Storage Blk Time (%) 11 0Queuing Penalty (veh) 42 0
Intersection: 2: MD 355 & New Cut Road
Movement NB SB B10 SWDirections Served TR LT T LRMaximum Queue (ft) 618 18 12 44Average Queue (ft) 204 1 1 1195th Queue (ft) 553 8 9 47Link Distance (ft) 982 31 169 509Upstream Blk Time (%) 0Queuing Penalty (veh) 0Storage Bay Dist (ft)Storage Blk Time (%)Queuing Penalty (veh)

Queuing and Blocking Report2040 PM Obs Dr Ext mit 01/04/2020
MD 355 BRT Study -Q1 SimTraffic ReportGF - DK Page 4
Intersection: 3: Rosecrest Dr/Canterfield Way & MD 355
Movement SE NW NE SWDirections Served L L LTR LTRMaximum Queue (ft) 28 57 91 44Average Queue (ft) 4 18 30 995th Queue (ft) 20 47 66 31Link Distance (ft) 599 601Upstream Blk Time (%)Queuing Penalty (veh)Storage Bay Dist (ft) 150 150Storage Blk Time (%)Queuing Penalty (veh)
Intersection: 4: W Old Baltimore Rd & MD 355
Movement NB NB SB SB NE NEDirections Served L T T R L RMaximum Queue (ft) 119 200 115 11 98 39Average Queue (ft) 49 60 30 0 28 195th Queue (ft) 95 159 80 8 72 29Link Distance (ft) 501 501 2023 922Upstream Blk Time (%)Queuing Penalty (veh)Storage Bay Dist (ft) 375 125Storage Blk Time (%) 0Queuing Penalty (veh) 0
Intersection: 5: MD 355 & Greenbrook Dr
Movement SE B11 SWDirections Served L T LRMaximum Queue (ft) 28 93 48Average Queue (ft) 4 3 1195th Queue (ft) 18 47 36Link Distance (ft) 501 192 1215Upstream Blk Time (%) 0Queuing Penalty (veh) 0Storage Bay Dist (ft)Storage Blk Time (%)Queuing Penalty (veh)

Queuing and Blocking Report2040 PM Obs Dr Ext mit 01/04/2020
MD 355 BRT Study -Q1 SimTraffic ReportGF - DK Page 5
Intersection: 6: MD 355 & Brink Rd
Movement WB WB NB B9 B9 SBDirections Served L R TR T LMaximum Queue (ft) 204 191 18 52 20 164Average Queue (ft) 13 73 1 3 1 5695th Queue (ft) 95 147 7 25 11 114Link Distance (ft) 1375 1030 526 526 192Upstream Blk Time (%) 0Queuing Penalty (veh) 0Storage Bay Dist (ft) 125Storage Blk Time (%) 4Queuing Penalty (veh) 0
Intersection: 7: MD 355 & Milestone Manor Dr
Movement EB WB WB NB NB NB SB SBDirections Served LTR LT R L T R L TRMaximum Queue (ft) 99 66 30 48 27 13 22 2Average Queue (ft) 39 16 4 10 1 1 3 095th Queue (ft) 74 49 20 34 12 7 15 1Link Distance (ft) 648 671 1592Upstream Blk Time (%)Queuing Penalty (veh)Storage Bay Dist (ft) 50 150 225 150 175Storage Blk Time (%) 4 0Queuing Penalty (veh) 1 0
Network SummaryNetwork wide Queuing Penalty: 410

Arterial Level of Service2040 AM Four-Lane No Build 11/22/2019
MD 355 SimTraffic ReportWRA/Symmetra Page 1
Arterial Level of Service: NB MD 355
Delay Travel Dist ArterialCross Street Node (s/veh) time (s) (mi) Speed
361 0.3 6.8 0.1 51Brink Rd 6 1.0 19.7 0.2 40
11 0.3 4.2 0.0 40Greenbrook Dr 5 0.4 9.1 0.1 43W Old Baltimore Rd 4 2.7 10.4 0.1 35Canterfield Way 3 6.8 35.1 0.4 41New Cut Rd 2 6.8 24.5 0.2 30Little Seneca Pkwy 1 21.2 27.8 0.1 9
Total 39.5 137.6 1.2 33
Arterial Level of Service: SB MD 355
Delay Travel Dist ArterialCross Street Node (s/veh) time (s) (mi) Speed
New Cut Rd 2 4.2 10.2 0.1 25Rosecrest Dr 3 9.0 28.1 0.2 26W Old Baltimore Rd 4 16.1 46.1 0.4 31Greenbrook Dr 5 2.0 10.1 0.1 36
11 0.8 9.4 0.1 42Brink Rd 6 0.3 3.8 0.0 44
361 1.0 17.6 0.2 45Milestone Manor Dr 7 0.9 9.7 0.1 36Total 34.3 135.1 1.2 21
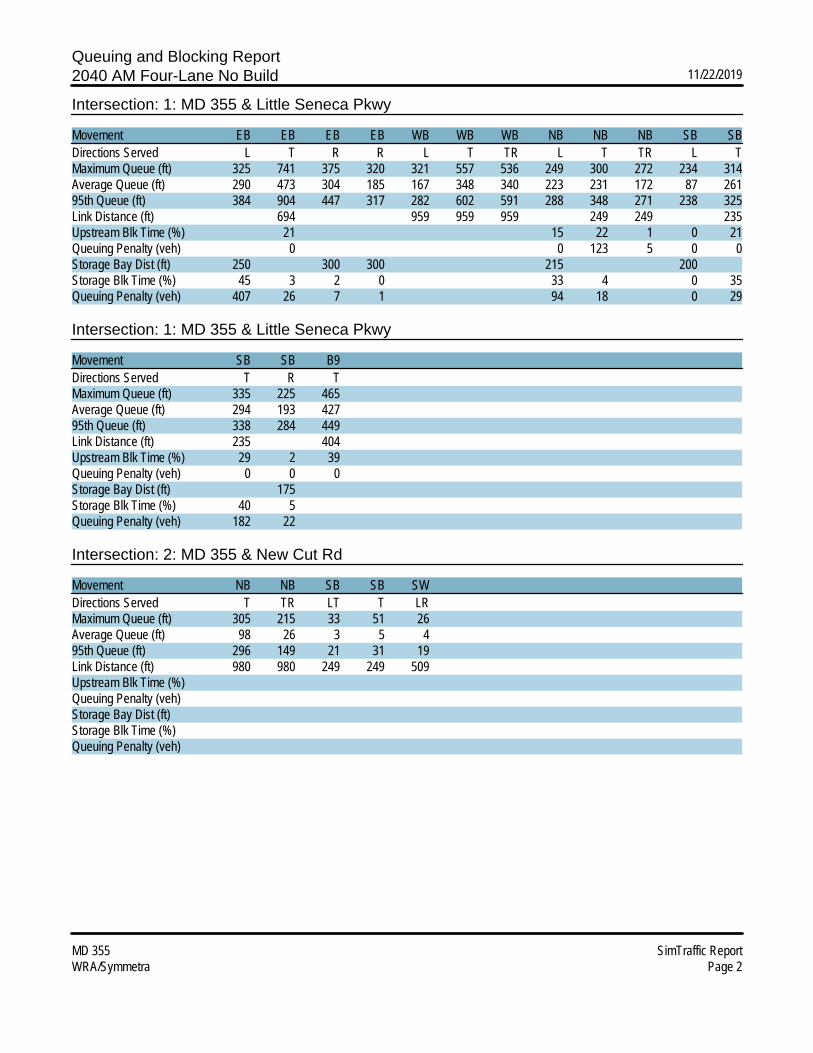
Queuing and Blocking Report2040 AM Four-Lane No Build 11/22/2019
MD 355 SimTraffic ReportWRA/Symmetra Page 2
Intersection: 1: MD 355 & Little Seneca Pkwy
Movement EB EB EB EB WB WB WB NB NB NB SB SBDirections Served L T R R L T TR L T TR L TMaximum Queue (ft) 325 741 375 320 321 557 536 249 300 272 234 314Average Queue (ft) 290 473 304 185 167 348 340 223 231 172 87 26195th Queue (ft) 384 904 447 317 282 602 591 288 348 271 238 325Link Distance (ft) 694 959 959 959 249 249 235Upstream Blk Time (%) 21 15 22 1 0 21Queuing Penalty (veh) 0 0 123 5 0 0Storage Bay Dist (ft) 250 300 300 215 200Storage Blk Time (%) 45 3 2 0 33 4 0 35Queuing Penalty (veh) 407 26 7 1 94 18 0 29
Intersection: 1: MD 355 & Little Seneca Pkwy
Movement SB SB B9Directions Served T R TMaximum Queue (ft) 335 225 465Average Queue (ft) 294 193 42795th Queue (ft) 338 284 449Link Distance (ft) 235 404Upstream Blk Time (%) 29 2 39Queuing Penalty (veh) 0 0 0Storage Bay Dist (ft) 175Storage Blk Time (%) 40 5Queuing Penalty (veh) 182 22
Intersection: 2: MD 355 & New Cut Rd
Movement NB NB SB SB SWDirections Served T TR LT T LRMaximum Queue (ft) 305 215 33 51 26Average Queue (ft) 98 26 3 5 495th Queue (ft) 296 149 21 31 19Link Distance (ft) 980 980 249 249 509Upstream Blk Time (%)Queuing Penalty (veh)Storage Bay Dist (ft)Storage Blk Time (%)Queuing Penalty (veh)
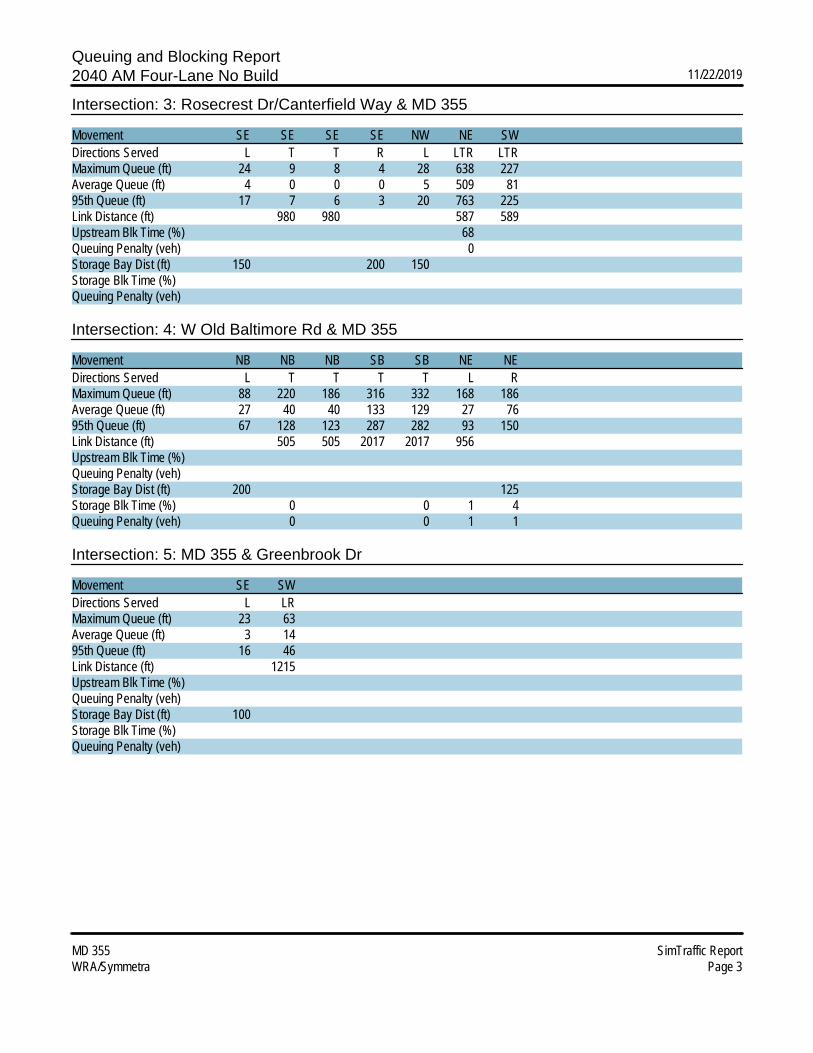
Queuing and Blocking Report2040 AM Four-Lane No Build 11/22/2019
MD 355 SimTraffic ReportWRA/Symmetra Page 3
Intersection: 3: Rosecrest Dr/Canterfield Way & MD 355
Movement SE SE SE SE NW NE SWDirections Served L T T R L LTR LTRMaximum Queue (ft) 24 9 8 4 28 638 227Average Queue (ft) 4 0 0 0 5 509 8195th Queue (ft) 17 7 6 3 20 763 225Link Distance (ft) 980 980 587 589Upstream Blk Time (%) 68Queuing Penalty (veh) 0Storage Bay Dist (ft) 150 200 150Storage Blk Time (%)Queuing Penalty (veh)
Intersection: 4: W Old Baltimore Rd & MD 355
Movement NB NB NB SB SB NE NEDirections Served L T T T T L RMaximum Queue (ft) 88 220 186 316 332 168 186Average Queue (ft) 27 40 40 133 129 27 7695th Queue (ft) 67 128 123 287 282 93 150Link Distance (ft) 505 505 2017 2017 956Upstream Blk Time (%)Queuing Penalty (veh)Storage Bay Dist (ft) 200 125Storage Blk Time (%) 0 0 1 4Queuing Penalty (veh) 0 0 1 1
Intersection: 5: MD 355 & Greenbrook Dr
Movement SE SWDirections Served L LRMaximum Queue (ft) 23 63Average Queue (ft) 3 1495th Queue (ft) 16 46Link Distance (ft) 1215Upstream Blk Time (%)Queuing Penalty (veh)Storage Bay Dist (ft) 100Storage Blk Time (%)Queuing Penalty (veh)

Queuing and Blocking Report2040 AM Four-Lane No Build 11/22/2019
MD 355 SimTraffic ReportWRA/Symmetra Page 4
Intersection: 6: MD 355 & Brink Rd
Movement NB NB SB SW SWDirections Served T TR L L RMaximum Queue (ft) 13 10 118 32 106Average Queue (ft) 1 0 44 3 4995th Queue (ft) 6 6 81 19 86Link Distance (ft) 1021 1021 166 1368 1368Upstream Blk Time (%) 0Queuing Penalty (veh) 0Storage Bay Dist (ft)Storage Blk Time (%)Queuing Penalty (veh)
Intersection: 7: MD 355 & Milestone Manor Dr
Movement EB WB WB NB SBDirections Served LTR LT R L LMaximum Queue (ft) 643 37 28 32 18Average Queue (ft) 491 6 4 10 295th Queue (ft) 799 25 18 30 13Link Distance (ft) 647 671Upstream Blk Time (%) 37Queuing Penalty (veh) 0Storage Bay Dist (ft) 50 150 150Storage Blk Time (%) 1 0Queuing Penalty (veh) 0 0
Intersection: 9: Bend
Movement NB NBDirections Served TMaximum Queue (ft) 168 125Average Queue (ft) 47 2995th Queue (ft) 130 88Link Distance (ft) 235 235Upstream Blk Time (%) 0Queuing Penalty (veh) 0Storage Bay Dist (ft)Storage Blk Time (%)Queuing Penalty (veh)
Network SummaryNetwork wide Queuing Penalty: 915
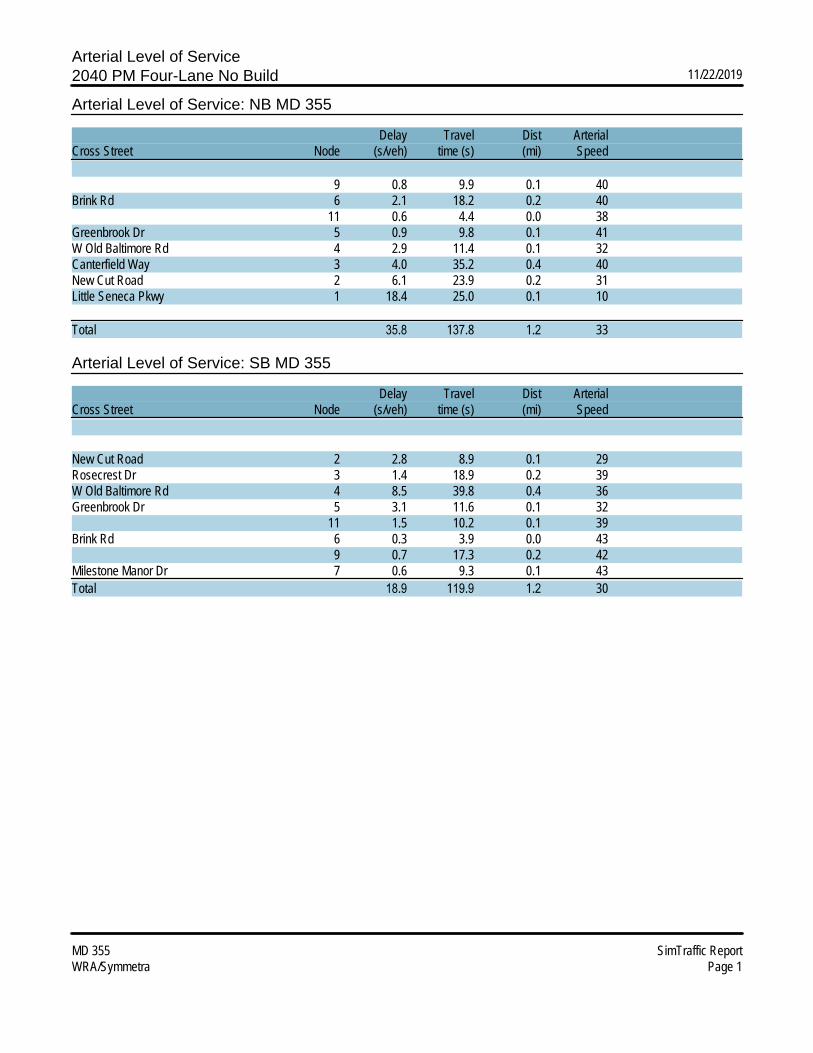
Arterial Level of Service2040 PM Four-Lane No Build 11/22/2019
MD 355 SimTraffic ReportWRA/Symmetra Page 1
Arterial Level of Service: NB MD 355
Delay Travel Dist ArterialCross Street Node (s/veh) time (s) (mi) Speed
9 0.8 9.9 0.1 40Brink Rd 6 2.1 18.2 0.2 40
11 0.6 4.4 0.0 38Greenbrook Dr 5 0.9 9.8 0.1 41W Old Baltimore Rd 4 2.9 11.4 0.1 32Canterfield Way 3 4.0 35.2 0.4 40New Cut Road 2 6.1 23.9 0.2 31Little Seneca Pkwy 1 18.4 25.0 0.1 10
Total 35.8 137.8 1.2 33
Arterial Level of Service: SB MD 355
Delay Travel Dist ArterialCross Street Node (s/veh) time (s) (mi) Speed
New Cut Road 2 2.8 8.9 0.1 29Rosecrest Dr 3 1.4 18.9 0.2 39W Old Baltimore Rd 4 8.5 39.8 0.4 36Greenbrook Dr 5 3.1 11.6 0.1 32
11 1.5 10.2 0.1 39Brink Rd 6 0.3 3.9 0.0 43
9 0.7 17.3 0.2 42Milestone Manor Dr 7 0.6 9.3 0.1 43Total 18.9 119.9 1.2 30
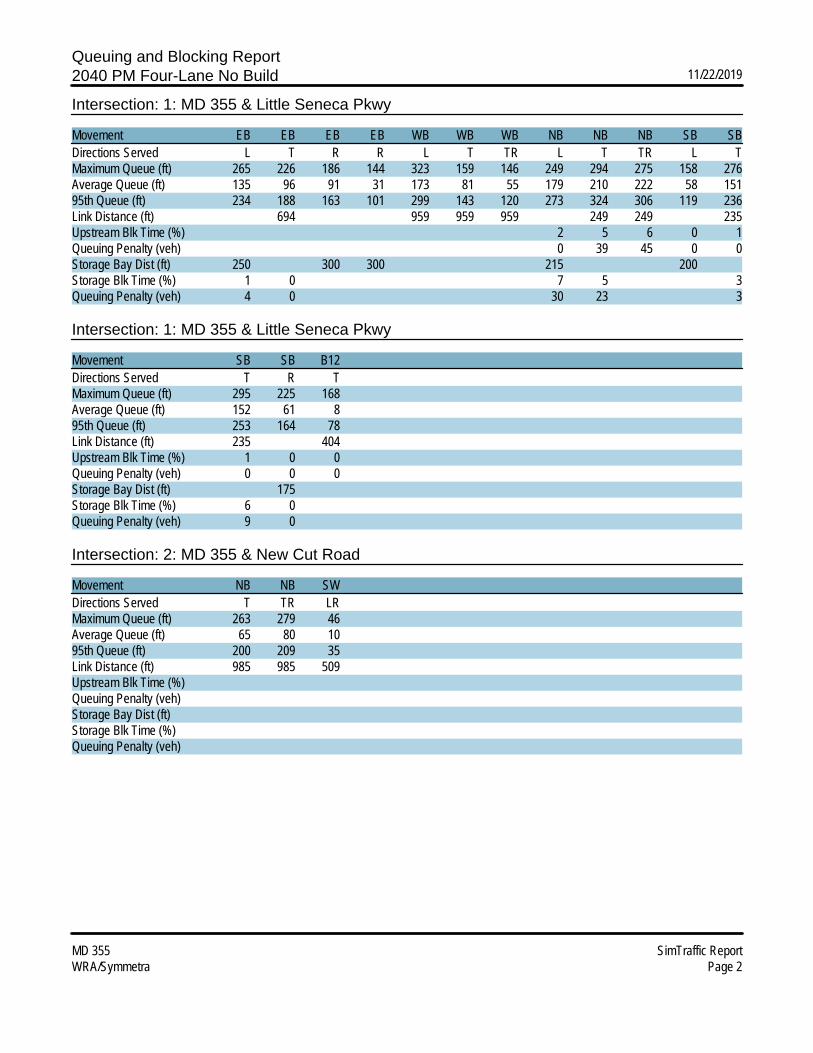
Queuing and Blocking Report2040 PM Four-Lane No Build 11/22/2019
MD 355 SimTraffic ReportWRA/Symmetra Page 2
Intersection: 1: MD 355 & Little Seneca Pkwy
Movement EB EB EB EB WB WB WB NB NB NB SB SBDirections Served L T R R L T TR L T TR L TMaximum Queue (ft) 265 226 186 144 323 159 146 249 294 275 158 276Average Queue (ft) 135 96 91 31 173 81 55 179 210 222 58 15195th Queue (ft) 234 188 163 101 299 143 120 273 324 306 119 236Link Distance (ft) 694 959 959 959 249 249 235Upstream Blk Time (%) 2 5 6 0 1Queuing Penalty (veh) 0 39 45 0 0Storage Bay Dist (ft) 250 300 300 215 200Storage Blk Time (%) 1 0 7 5 3Queuing Penalty (veh) 4 0 30 23 3
Intersection: 1: MD 355 & Little Seneca Pkwy
Movement SB SB B12Directions Served T R TMaximum Queue (ft) 295 225 168Average Queue (ft) 152 61 895th Queue (ft) 253 164 78Link Distance (ft) 235 404Upstream Blk Time (%) 1 0 0Queuing Penalty (veh) 0 0 0Storage Bay Dist (ft) 175Storage Blk Time (%) 6 0Queuing Penalty (veh) 9 0
Intersection: 2: MD 355 & New Cut Road
Movement NB NB SWDirections Served T TR LRMaximum Queue (ft) 263 279 46Average Queue (ft) 65 80 1095th Queue (ft) 200 209 35Link Distance (ft) 985 985 509Upstream Blk Time (%)Queuing Penalty (veh)Storage Bay Dist (ft)Storage Blk Time (%)Queuing Penalty (veh)

Queuing and Blocking Report2040 PM Four-Lane No Build 11/22/2019
MD 355 SimTraffic ReportWRA/Symmetra Page 3
Intersection: 3: Rosecrest Dr/Canterfield Way & MD 355
Movement SE SE NW NE SWDirections Served L R L LTR LTRMaximum Queue (ft) 36 8 56 122 33Average Queue (ft) 9 0 16 31 795th Queue (ft) 30 4 42 87 23Link Distance (ft) 587 589Upstream Blk Time (%)Queuing Penalty (veh)Storage Bay Dist (ft) 150 200 150Storage Blk Time (%)Queuing Penalty (veh)
Intersection: 4: W Old Baltimore Rd & MD 355
Movement NB NB NB SB SB NE NEDirections Served L T T T T L RMaximum Queue (ft) 140 141 134 167 209 78 93Average Queue (ft) 62 41 61 56 110 27 1895th Queue (ft) 108 103 119 136 199 65 63Link Distance (ft) 503 503 2019 2019 910Upstream Blk Time (%)Queuing Penalty (veh)Storage Bay Dist (ft) 100 125Storage Blk Time (%) 3 0 0Queuing Penalty (veh) 24 1 0
Intersection: 5: MD 355 & Greenbrook Dr
Movement SE SWDirections Served L LRMaximum Queue (ft) 34 146Average Queue (ft) 4 4995th Queue (ft) 21 160Link Distance (ft) 1208Upstream Blk Time (%)Queuing Penalty (veh)Storage Bay Dist (ft) 100Storage Blk Time (%)Queuing Penalty (veh)

Queuing and Blocking Report2040 PM Four-Lane No Build 11/22/2019
MD 355 SimTraffic ReportWRA/Symmetra Page 4
Intersection: 6: MD 355 & Brink Rd
Movement WB WB NB NB SBDirections Served L R T TR LMaximum Queue (ft) 920 200 13 35 107Average Queue (ft) 560 190 1 1 5195th Queue (ft) 1218 240 7 14 92Link Distance (ft) 1376 1032 1032 184Upstream Blk Time (%) 0Queuing Penalty (veh) 0Storage Bay Dist (ft) 125Storage Blk Time (%) 86Queuing Penalty (veh) 5
Intersection: 7: MD 355 & Milestone Manor Dr
Movement EB WB WB NB NB NB NB SB SB SB SBDirections Served LTR LT R L T T R L T T TRMaximum Queue (ft) 649 219 108 64 110 80 30 22 13 22 21Average Queue (ft) 358 54 10 20 8 4 1 3 0 1 195th Queue (ft) 734 173 58 49 61 51 13 15 10 12 13Link Distance (ft) 648 671 1592 1592 526 526Upstream Blk Time (%) 17Queuing Penalty (veh) 0Storage Bay Dist (ft) 50 150 225 150 175Storage Blk Time (%) 31 0 0 0Queuing Penalty (veh) 3 0 0 0
Intersection: 12: Bend
Movement NB NBDirections Served TMaximum Queue (ft) 265 165Average Queue (ft) 104 5695th Queue (ft) 235 129Link Distance (ft) 235 235Upstream Blk Time (%) 1Queuing Penalty (veh) 5Storage Bay Dist (ft)Storage Blk Time (%)Queuing Penalty (veh)
Network SummaryNetwork wide Queuing Penalty: 193

Arterial Level of Service2040 AM Four-Lane Build 11/22/2019
2040 AM Four-Lane Build SimTraffic ReportWRA/Symmetra Page 1
Arterial Level of Service: NB MD 355
Delay Travel Dist ArterialCross Street Node (s/veh) time (s) (mi) Speed
361 0.2 6.7 0.1 52Brink Rd 6 0.8 19.5 0.2 41
11 0.3 4.1 0.0 41Greenbrook Dr 5 0.3 9.0 0.1 44W Old Baltimore Rd 4 2.0 9.6 0.1 38Canterfield Way 3 3.4 31.8 0.4 45New Cut Rd 2 0.9 18.7 0.2 39Little Seneca Pkwy 1 24.3 31.0 0.1 8
Total 7.9 130.4 1.2 35
Arterial Level of Service: SB MD 355
Delay Travel Dist ArterialCross Street Node (s/veh) time (s) (mi) Speed
New Cut Rd 2 3.7 9.8 0.1 27Rosecrest Dr 3 8.7 27.8 0.2 26W Old Baltimore Rd 4 28.8 58.9 0.4 24Greenbrook Dr 5 5.8 14.0 0.1 26
11 4.6 13.2 0.1 30Brink Rd 6 0.9 4.4 0.0 38
361 0.9 17.5 0.2 45Milestone Manor Dr 7 0.6 9.5 0.1 36Total 54.0 155.1 1.4 23

Queuing and Blocking Report2040 AM Four-Lane Build 11/22/2019
2040 AM Four-Lane Build SimTraffic ReportWRA/Symmetra Page 2
Intersection: 1: MD 355 & Little Seneca Pkwy
Movement EB EB EB WB WB WB NB NB NB SB SB SBDirections Served L T R L T TR L T TR L T TMaximum Queue (ft) 228 422 364 307 355 380 244 265 259 234 315 322Average Queue (ft) 100 139 210 157 220 206 128 131 149 71 239 23195th Queue (ft) 186 297 350 282 313 314 219 234 247 199 329 326Link Distance (ft) 693 959 959 959 258 258 235 235Upstream Blk Time (%) 0 0 1 0 12 11Queuing Penalty (veh) 0 1 2 0 0 0Storage Bay Dist (ft) 250 300 215 200Storage Blk Time (%) 0 1 4 2 1 0 22 26Queuing Penalty (veh) 1 4 12 4 2 0 17 49
Intersection: 1: MD 355 & Little Seneca Pkwy
Movement SB B9Directions Served R TMaximum Queue (ft) 225 442Average Queue (ft) 109 16195th Queue (ft) 248 471Link Distance (ft) 404Upstream Blk Time (%) 0 9Queuing Penalty (veh) 0 0Storage Bay Dist (ft) 175Storage Blk Time (%) 0Queuing Penalty (veh) 0
Intersection: 2: MD 355 & New Cut Rd
Movement NB NB SB SB SWDirections Served T TR LT T LRMaximum Queue (ft) 18 17 12 41 28Average Queue (ft) 1 1 0 2 595th Queue (ft) 8 12 6 17 22Link Distance (ft) 980 980 258 258 509Upstream Blk Time (%)Queuing Penalty (veh)Storage Bay Dist (ft)Storage Blk Time (%)Queuing Penalty (veh)
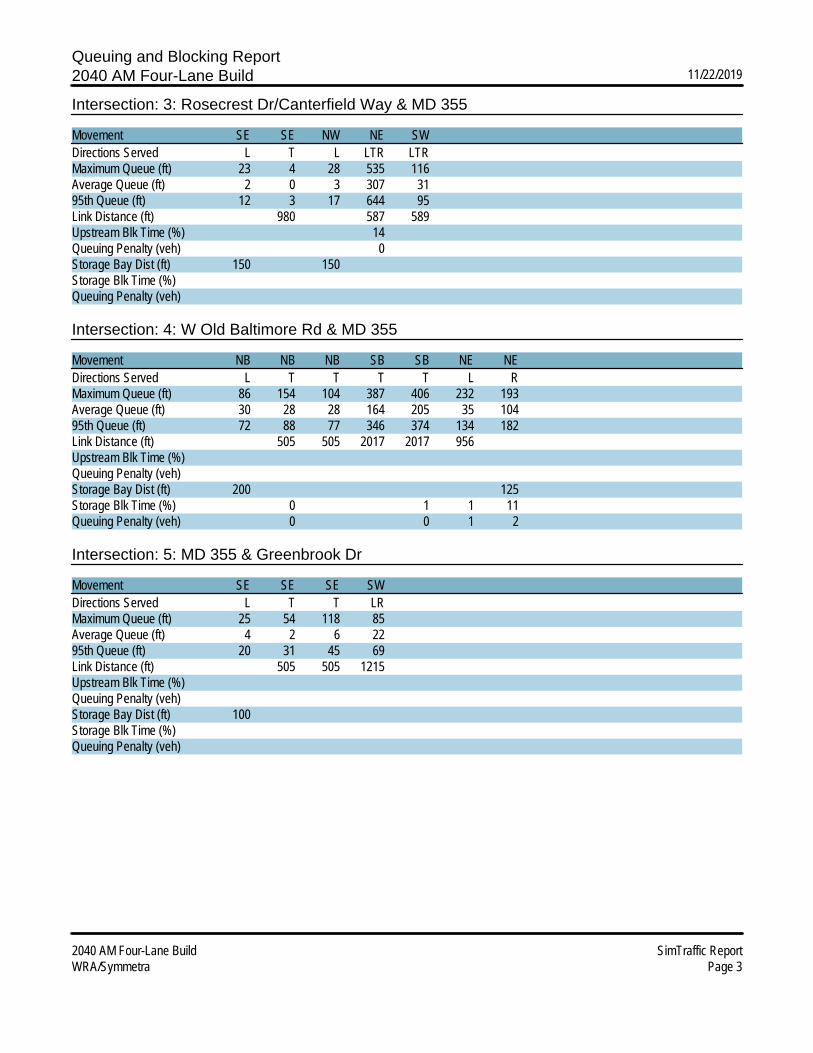
Queuing and Blocking Report2040 AM Four-Lane Build 11/22/2019
2040 AM Four-Lane Build SimTraffic ReportWRA/Symmetra Page 3
Intersection: 3: Rosecrest Dr/Canterfield Way & MD 355
Movement SE SE NW NE SWDirections Served L T L LTR LTRMaximum Queue (ft) 23 4 28 535 116Average Queue (ft) 2 0 3 307 3195th Queue (ft) 12 3 17 644 95Link Distance (ft) 980 587 589Upstream Blk Time (%) 14Queuing Penalty (veh) 0Storage Bay Dist (ft) 150 150Storage Blk Time (%)Queuing Penalty (veh)
Intersection: 4: W Old Baltimore Rd & MD 355
Movement NB NB NB SB SB NE NEDirections Served L T T T T L RMaximum Queue (ft) 86 154 104 387 406 232 193Average Queue (ft) 30 28 28 164 205 35 10495th Queue (ft) 72 88 77 346 374 134 182Link Distance (ft) 505 505 2017 2017 956Upstream Blk Time (%)Queuing Penalty (veh)Storage Bay Dist (ft) 200 125Storage Blk Time (%) 0 1 1 11Queuing Penalty (veh) 0 0 1 2
Intersection: 5: MD 355 & Greenbrook Dr
Movement SE SE SE SWDirections Served L T T LRMaximum Queue (ft) 25 54 118 85Average Queue (ft) 4 2 6 2295th Queue (ft) 20 31 45 69Link Distance (ft) 505 505 1215Upstream Blk Time (%)Queuing Penalty (veh)Storage Bay Dist (ft) 100Storage Blk Time (%)Queuing Penalty (veh)

Queuing and Blocking Report2040 AM Four-Lane Build 11/22/2019
2040 AM Four-Lane Build SimTraffic ReportWRA/Symmetra Page 4
Intersection: 6: MD 355 & Brink Rd
Movement NB SB B11 SW SWDirections Served TR L T L RMaximum Queue (ft) 5 78 226 32 84Average Queue (ft) 0 38 8 7 4395th Queue (ft) 3 64 114 28 72Link Distance (ft) 1021 166 505 1368Upstream Blk Time (%) 0Queuing Penalty (veh) 1Storage Bay Dist (ft) 125Storage Blk Time (%)Queuing Penalty (veh)
Intersection: 7: MD 355 & Milestone Manor Dr
Movement EB WB WB NB SBDirections Served LTR LT R L LMaximum Queue (ft) 481 50 20 42 18Average Queue (ft) 194 6 3 8 295th Queue (ft) 510 26 16 28 12Link Distance (ft) 647 671Upstream Blk Time (%) 3Queuing Penalty (veh) 0Storage Bay Dist (ft) 50 150 150Storage Blk Time (%) 0Queuing Penalty (veh) 0
Intersection: 9: Bend
Movement NB NBDirections Served TMaximum Queue (ft) 121 82Average Queue (ft) 27 1895th Queue (ft) 87 62Link Distance (ft) 235 235Upstream Blk Time (%)Queuing Penalty (veh)Storage Bay Dist (ft)Storage Blk Time (%)Queuing Penalty (veh)
Network SummaryNetwork wide Queuing Penalty: 95

Arterial Level of Service2040 PM Four-Lane Build 11/22/2019
MD 355 SimTraffic ReportWRA/Symmetra Page 1
Arterial Level of Service: NB MD 355
Delay Travel Dist ArterialCross Street Node (s/veh) time (s) (mi) Speed
9 0.7 9.8 0.1 41Brink Rd 6 1.8 17.9 0.2 41
11 0.5 4.4 0.0 38Greenbrook Dr 5 0.9 9.7 0.1 41W Old Baltimore Rd 4 2.1 10.6 0.1 35Canterfield Way 3 3.2 34.4 0.4 41New Cut Road 2 3.9 21.8 0.2 34Little Seneca Pkwy 1 16.9 23.6 0.1 11
Total 30.0 132.2 1.2 35
Arterial Level of Service: SB MD 355
Delay Travel Dist ArterialCross Street Node (s/veh) time (s) (mi) Speed
389
New Cut Road 2 2.3 8.4 0.1 31Rosecrest Dr 3 1.2 18.6 0.2 40W Old Baltimore Rd 4 6.1 37.3 0.4 38Greenbrook Dr 5 2.5 10.9 0.1 34
11 1.1 9.9 0.1 40Brink Rd 6 0.3 3.9 0.0 43
9 0.7 17.3 0.2 43Milestone Manor Dr 7 0.5 9.2 0.1 43Total 14.7 115.5 1.2 34

Queuing and Blocking Report2040 PM Four-Lane Build 11/22/2019
MD 355 SimTraffic ReportWRA/Symmetra Page 2
Intersection: 1: MD 355 & Little Seneca Pkwy
Movement EB EB EB WB WB WB NB NB NB SB SB SBDirections Served L T R L T TR L T TR L T TMaximum Queue (ft) 221 175 83 243 183 181 254 290 275 151 259 215Average Queue (ft) 115 77 40 123 95 66 137 184 210 55 129 9595th Queue (ft) 195 148 72 216 156 141 234 303 314 108 218 185Link Distance (ft) 693 959 959 959 258 258 235 235Upstream Blk Time (%) 1 2 4 0 0 0Queuing Penalty (veh) 0 14 28 0 0 0Storage Bay Dist (ft) 250 300 215 200Storage Blk Time (%) 0 0 2 4 1 1Queuing Penalty (veh) 0 0 9 15 2 1
Intersection: 1: MD 355 & Little Seneca Pkwy
Movement SB B12Directions Served R TMaximum Queue (ft) 111 7Average Queue (ft) 31 095th Queue (ft) 72 5Link Distance (ft) 404Upstream Blk Time (%) 0Queuing Penalty (veh) 0Storage Bay Dist (ft) 175Storage Blk Time (%)Queuing Penalty (veh)
Intersection: 2: MD 355 & New Cut Road
Movement NB NB SWDirections Served T TR LRMaximum Queue (ft) 173 184 51Average Queue (ft) 23 40 1195th Queue (ft) 107 132 39Link Distance (ft) 985 985 509Upstream Blk Time (%)Queuing Penalty (veh)Storage Bay Dist (ft)Storage Blk Time (%)Queuing Penalty (veh)

Queuing and Blocking Report2040 PM Four-Lane Build 11/22/2019
MD 355 SimTraffic ReportWRA/Symmetra Page 3
Intersection: 3: Rosecrest Dr/Canterfield Way & MD 355
Movement SE NW NE SWDirections Served L L LTR LTRMaximum Queue (ft) 31 41 76 27Average Queue (ft) 6 12 25 695th Queue (ft) 23 33 59 21Link Distance (ft) 587 589Upstream Blk Time (%)Queuing Penalty (veh)Storage Bay Dist (ft) 150 150Storage Blk Time (%)Queuing Penalty (veh)
Intersection: 4: W Old Baltimore Rd & MD 355
Movement NB NB NB SB SB NE NEDirections Served L T T T T L RMaximum Queue (ft) 116 136 134 126 186 86 62Average Queue (ft) 48 29 40 24 59 31 995th Queue (ft) 95 93 112 80 142 73 42Link Distance (ft) 503 503 2019 2019 910Upstream Blk Time (%)Queuing Penalty (veh)Storage Bay Dist (ft) 200 125Storage Blk Time (%) 0 0 0Queuing Penalty (veh) 0 0 0
Intersection: 5: MD 355 & Greenbrook Dr
Movement SE SWDirections Served L LRMaximum Queue (ft) 29 102Average Queue (ft) 4 3095th Queue (ft) 20 90Link Distance (ft) 1215Upstream Blk Time (%)Queuing Penalty (veh)Storage Bay Dist (ft) 100Storage Blk Time (%)Queuing Penalty (veh)
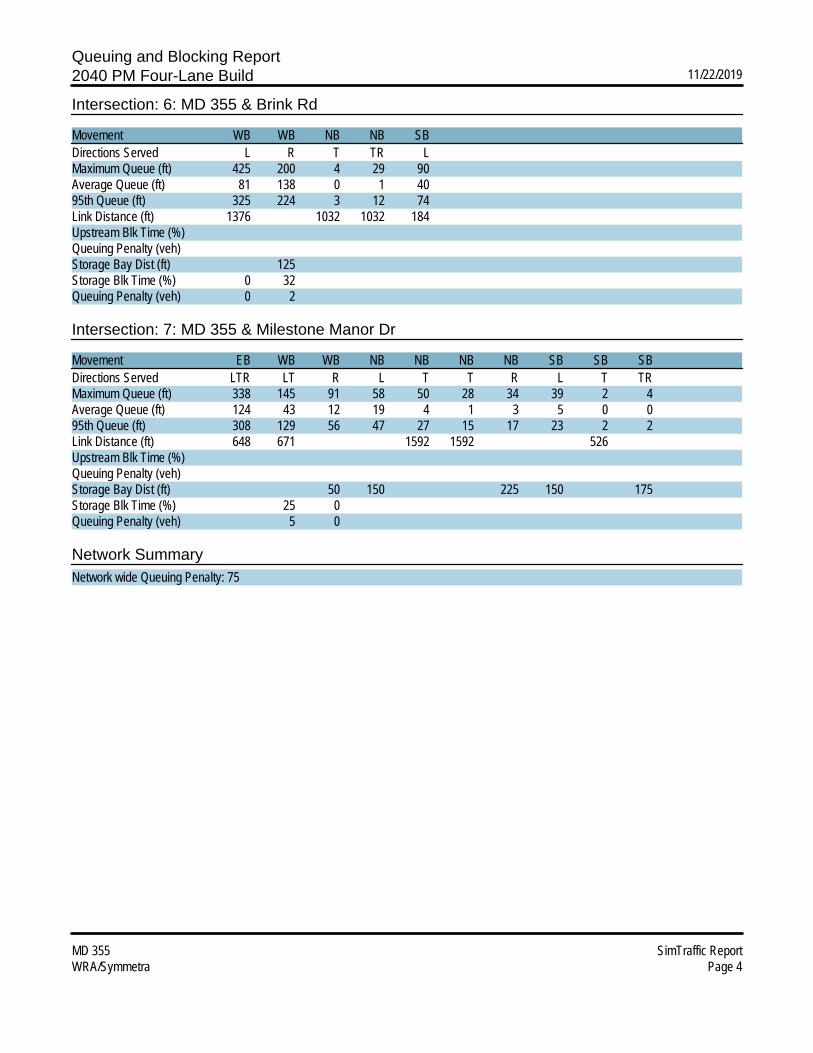
Queuing and Blocking Report2040 PM Four-Lane Build 11/22/2019
MD 355 SimTraffic ReportWRA/Symmetra Page 4
Intersection: 6: MD 355 & Brink Rd
Movement WB WB NB NB SBDirections Served L R T TR LMaximum Queue (ft) 425 200 4 29 90Average Queue (ft) 81 138 0 1 4095th Queue (ft) 325 224 3 12 74Link Distance (ft) 1376 1032 1032 184Upstream Blk Time (%)Queuing Penalty (veh)Storage Bay Dist (ft) 125Storage Blk Time (%) 0 32Queuing Penalty (veh) 0 2
Intersection: 7: MD 355 & Milestone Manor Dr
Movement EB WB WB NB NB NB NB SB SB SBDirections Served LTR LT R L T T R L T TRMaximum Queue (ft) 338 145 91 58 50 28 34 39 2 4Average Queue (ft) 124 43 12 19 4 1 3 5 0 095th Queue (ft) 308 129 56 47 27 15 17 23 2 2Link Distance (ft) 648 671 1592 1592 526Upstream Blk Time (%)Queuing Penalty (veh)Storage Bay Dist (ft) 50 150 225 150 175Storage Blk Time (%) 25 0Queuing Penalty (veh) 5 0
Network SummaryNetwork wide Queuing Penalty: 75

Appendix D
Bus Ridership Data
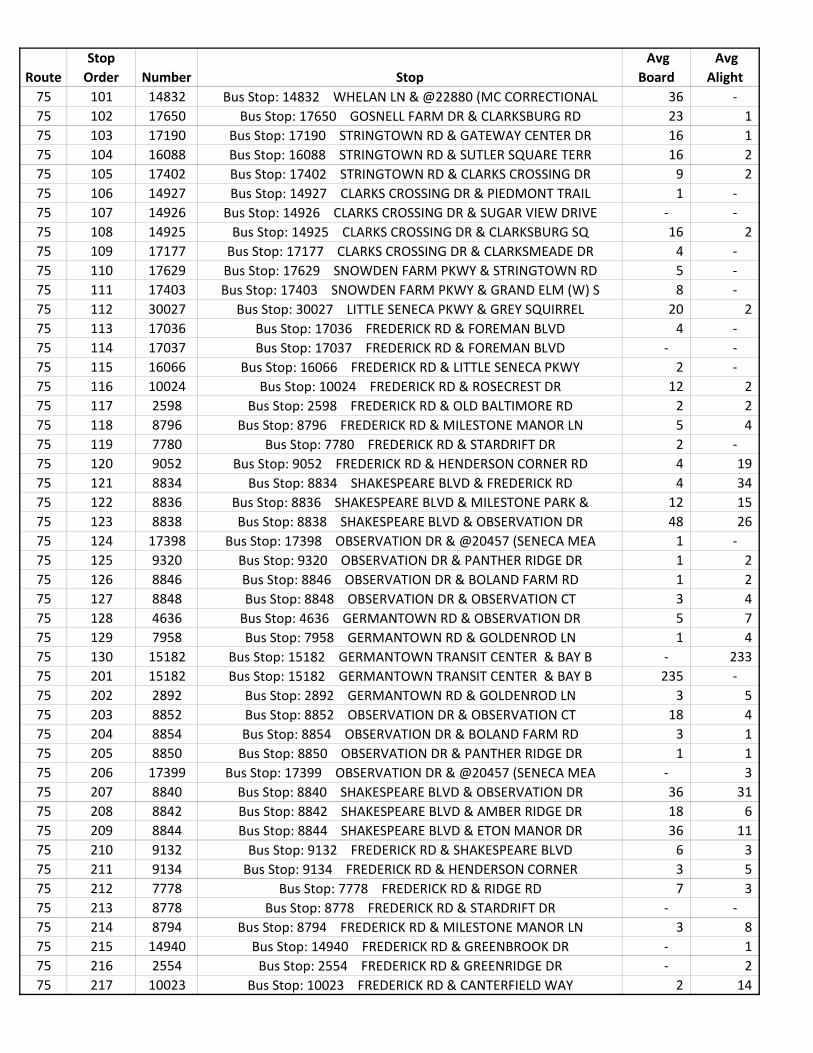
RouteStop
Order Number Stop Avg
Board Avg
Alight 75 101 14832 Bus Stop: 14832 WHELAN LN & @22880 (MC CORRECTIONAL 36 - 75 102 17650 Bus Stop: 17650 GOSNELL FARM DR & CLARKSBURG RD 23 1 75 103 17190 Bus Stop: 17190 STRINGTOWN RD & GATEWAY CENTER DR 16 1 75 104 16088 Bus Stop: 16088 STRINGTOWN RD & SUTLER SQUARE TERR 16 2 75 105 17402 Bus Stop: 17402 STRINGTOWN RD & CLARKS CROSSING DR 9 2 75 106 14927 Bus Stop: 14927 CLARKS CROSSING DR & PIEDMONT TRAIL 1 - 75 107 14926 Bus Stop: 14926 CLARKS CROSSING DR & SUGAR VIEW DRIVE - - 75 108 14925 Bus Stop: 14925 CLARKS CROSSING DR & CLARKSBURG SQ 16 2 75 109 17177 Bus Stop: 17177 CLARKS CROSSING DR & CLARKSMEADE DR 4 - 75 110 17629 Bus Stop: 17629 SNOWDEN FARM PKWY & STRINGTOWN RD 5 - 75 111 17403 Bus Stop: 17403 SNOWDEN FARM PKWY & GRAND ELM (W) S 8 - 75 112 30027 Bus Stop: 30027 LITTLE SENECA PKWY & GREY SQUIRREL 20 2 75 113 17036 Bus Stop: 17036 FREDERICK RD & FOREMAN BLVD 4 - 75 114 17037 Bus Stop: 17037 FREDERICK RD & FOREMAN BLVD - - 75 115 16066 Bus Stop: 16066 FREDERICK RD & LITTLE SENECA PKWY 2 - 75 116 10024 Bus Stop: 10024 FREDERICK RD & ROSECREST DR 12 2 75 117 2598 Bus Stop: 2598 FREDERICK RD & OLD BALTIMORE RD 2 2 75 118 8796 Bus Stop: 8796 FREDERICK RD & MILESTONE MANOR LN 5 4 75 119 7780 Bus Stop: 7780 FREDERICK RD & STARDRIFT DR 2 - 75 120 9052 Bus Stop: 9052 FREDERICK RD & HENDERSON CORNER RD 4 19 75 121 8834 Bus Stop: 8834 SHAKESPEARE BLVD & FREDERICK RD 4 34 75 122 8836 Bus Stop: 8836 SHAKESPEARE BLVD & MILESTONE PARK & 12 15 75 123 8838 Bus Stop: 8838 SHAKESPEARE BLVD & OBSERVATION DR 48 26 75 124 17398 Bus Stop: 17398 OBSERVATION DR & @20457 (SENECA MEA 1 - 75 125 9320 Bus Stop: 9320 OBSERVATION DR & PANTHER RIDGE DR 1 2 75 126 8846 Bus Stop: 8846 OBSERVATION DR & BOLAND FARM RD 1 2 75 127 8848 Bus Stop: 8848 OBSERVATION DR & OBSERVATION CT 3 4 75 128 4636 Bus Stop: 4636 GERMANTOWN RD & OBSERVATION DR 5 7 75 129 7958 Bus Stop: 7958 GERMANTOWN RD & GOLDENROD LN 1 4 75 130 15182 Bus Stop: 15182 GERMANTOWN TRANSIT CENTER & BAY B - 233 75 201 15182 Bus Stop: 15182 GERMANTOWN TRANSIT CENTER & BAY B 235 - 75 202 2892 Bus Stop: 2892 GERMANTOWN RD & GOLDENROD LN 3 5 75 203 8852 Bus Stop: 8852 OBSERVATION DR & OBSERVATION CT 18 4 75 204 8854 Bus Stop: 8854 OBSERVATION DR & BOLAND FARM RD 3 1 75 205 8850 Bus Stop: 8850 OBSERVATION DR & PANTHER RIDGE DR 1 1 75 206 17399 Bus Stop: 17399 OBSERVATION DR & @20457 (SENECA MEA - 3 75 207 8840 Bus Stop: 8840 SHAKESPEARE BLVD & OBSERVATION DR 36 31 75 208 8842 Bus Stop: 8842 SHAKESPEARE BLVD & AMBER RIDGE DR 18 6 75 209 8844 Bus Stop: 8844 SHAKESPEARE BLVD & ETON MANOR DR 36 11 75 210 9132 Bus Stop: 9132 FREDERICK RD & SHAKESPEARE BLVD 6 3 75 211 9134 Bus Stop: 9134 FREDERICK RD & HENDERSON CORNER 3 5 75 212 7778 Bus Stop: 7778 FREDERICK RD & RIDGE RD 7 3 75 213 8778 Bus Stop: 8778 FREDERICK RD & STARDRIFT DR - - 75 214 8794 Bus Stop: 8794 FREDERICK RD & MILESTONE MANOR LN 3 8 75 215 14940 Bus Stop: 14940 FREDERICK RD & GREENBROOK DR - 1 75 216 2554 Bus Stop: 2554 FREDERICK RD & GREENRIDGE DR - 2 75 217 10023 Bus Stop: 10023 FREDERICK RD & CANTERFIELD WAY 2 14

RouteStop
Order Number Stop Avg
Board Avg
Alight 75 218 2556 Bus Stop: 2556 FREDERICK RD & LITTLE SENECA PKWY 8 30 75 219 17037 Bus Stop: 17037 FREDERICK RD & FOREMAN BLVD 2 5 75 220 17037 Bus Stop: 17037 FREDERICK RD & FOREMAN BLVD - - 75 221 30026 Bus Stop: 30026 LITTLE SENECA PKWY & GREY SQUIRELL 5 20 75 222 17404 Bus Stop: 17404 SNOWDEN FARM PKWY & GRAND ELM (W) S 2 12 75 223 17628 Bus Stop: 17628 SNOWDEN FARM PKWY & CLARKSBURG SQ R - 1 75 224 17176 Bus Stop: 17176 CLARKS CROSSING DR & CLARKSMEADE DR 1 5 75 225 17368 Bus Stop: 17368 CLARKS CROSSING DR & CLARKSBURG SQU 6 27 75 226 17367 Bus Stop: 17367 CLARKS CROSSING DR & SUGAR VIEW DR 1 4 75 227 17405 Bus Stop: 17405 STRINGTOWN RD & CLARKS CROSSING DR - 1 75 228 16089 Bus Stop: 16089 STRINGTOWN RD & SUTLER SQUARE TERR 1 14 75 229 17627 Bus Stop: 17627 STRINGTOWN RD & N FREDERICK RD 3 9 75 230 17191 Bus Stop: 17191 STRINGTOWN RD & GATEWAY CENTER DR 1 3 75 231 17651 Bus Stop: 17651 GOSNELL FARM DR & CLARKSBURG RD 20 49 75 232 14832 Bus Stop: 14832 WHELAN LN & @22880 (MC CORRECTIONAL - 31
677 669

Appendix E
Costs/Concepts

105+00
110+00115+00
120+00125+0
0130+00
135+00
140+00
145+00
150+00
155+00
160+00
165+00
170+00
PC 10
0+00.0
0
PT 10
1+76.14
PC 10
6+02.8
2
PT 110
+95.3
5
PC 12
3+91.8
8
PR
C 12
4+82.19
PT 12
6+44.9
9
PC 12
7+25.8
6
PT 12
8+38.7
6
PC 13
3+44.2
3
PT 13
7+34.9
7
PC 14
6+56.0
8
PT 15
0+85.5
6
PC 15
9+25.6
1
PT 16
9+12.5
2
PO
T 17
0+30.0
0
EXISTING PAVEMENT REMOVAL
FLYOVER RAMP PROJECT
PREVIOUSLY CONSTRUCTED DURING
INTERCHANGE PROJECT
PREVIOUSLY CONSTRUCTED DURING
FULL DEPTH CONSTRUCTION
LEGEND
RETAINING WALL
TRAFFIC FLOW
EXISTING RIGHT-OF-WAY
N
LIT
TLE SE
NEC
A PA
RK
WA
Y
LIT
TLE SE
NEC
A PA
RK
WA
Y
NE
W
CU
T R
OA
D
CA
NTERFIE
LD
WA
Y
GREE
NRID
GE
DRIV
E
GREEN
BROO
K DRIV
E
W
OLD
BALTIM
ORE RO
AD
RO
SEC
REST
DRIV
E
BRINK R
OAD
MILESTONE MANOR LANE
MIL
ESTO
NE
MA
NO
R LA
NE
GREENRIDGE BAPTIST CHURCH
MILESTONE
GREENRIDGE ACRES
OF CLARKSBURG
THE GODDARD SCHOOL
RESURFACING
CULVERT EXTENSION
CULVERT EXTENSION
BY EARTHWORK
UTILITY POLES IMPACTED
PROPOSED BRIDGE
GRADING ISSUES
POTENTIAL DRIVEWAY
2% 2% 6%6%
VARIES 2' VARIES2'
MD 355 TYPICAL SECTION
NO SCALE
24'24'6' 12' 12' 6'
VARIES
MD 355Þ CONSTRUCTION
LIT
TLE SE
NEC
A
CREE
K
TRIB
UT
AR
YLIT
TLE SE
NEC
A
CREE
K
NB TRAVEL LANES SB TRAVEL LANESSHLDR
6'
SHLDR
SCALE: 1" = 200'
FEBRUARY 2020
DUALIZATION CONCEPT
LITTLE SENECA DRIVE TO MILESTONE MANOR LANE
MD 355
CUT ROAD TO MD 355
REMOVE ACCESS FROM NEW
HO
USER
DRIV
E

Item No. Description Unit Quantity Unit Cost Total Cost Notes
CLASS 1 EXCAVATION CY 27,000 30.00$ 810,000.00$CLASS 1A EXCAVATION CY 2,700 60.00$ 162,000.00$GEOSYNTHETIC STABILIZED SUBGRADE USING GRADED AGGREGATE BASE CY 2,700 50.00$ 135,000.00$COMMON BORROW CY 15,000 30.00$ 450,000.00$REMOVAL OF EXISTING PAVEMENT CY 2,900 100.00$ 290,000.00$
1,847,000.00$
BRIDGE - MD355 REPLACEMENT LS 1 3,500,000.00$ 3,500,000.00$BOX CULVERT - LITTLE SENECA CREEK TRIBUTARY EXTENSION LS 1 200,000.00$ 200,000.00$
3,700,000.00$
GAP-GRADED ASPHALT SURFACE TON 5,550 100.00$ 555,000.00$ASPHALT BASE TON 15,600 85.00$ 1,326,000.00$6 INCH GRADED AGGREGATE BASE SY 53,000 10.00$ 530,000.00$FINE MILLING SY 20,200 2.00$ 40,400.00$PAVEMENT MARKINGS LF 35,000 3.00$ 105,000.00$
2,556,400.00$
COMBINATION CURB AND GUTTER LF 12,000 35.00$ 420,000.00$REMOVAL OF TRAFFIC BARRIER W-BEAM LF 1,500 3.00$ 4,500.00$TRAFFIC BARRIER W-BEAM LF 2,500 25.00$ 62,500.00$
487,000.00$
LIGHTING LS 1 100,000.00$ 100,000.00$SIGNING LS 1 100,000.00$ 100,000.00$TRAFFIC SIGNAL EA 1 250,000.00$ 250,000.00$
450,000.00$
SubtotalCategory 1: Preliminary 4,890,400.00$ 1,711,640.00$ 35% of Cat. 2, 5, 6Category 1: Maintenance of Traffic 4,890,400.00$ 489,040.00$ 10% of Cat. 2, 5, 6Category 3: Drainage 4,890,400.00$ 1,467,120.00$ 30% of Cat. 2, 5, 6Category 7: Landscape 4,890,400.00$ 489,040.00$ 10% of Cat. 2, 5, 6
13,197,240.00$Contingency 4,619,034.00$ 35% of Subtotal 1
17,816,274.00$
ASSUMPTIONS1. New Cut Road will no longer connect to MD 355, and will tie directly into Houser Drive.2. Instead of widening the bridge deck over Little Seneca Creek, a new bridge will be constructed.3. Drainage items will include extension of the box culverts near Greenbrook Drive and Milestone Manor Lane.4. Landscaping contingency is set at 10% under the assumption that there will be trees planted at regular intervals in the median.5. Utility costs are not included in the estimate.6. Right of way costs are not included in the estimate.
Total
MD 355 DualizationFrom Little Seneca Parkway to Milestone Manor Lane
Conceptual Estimate
Roadway Costs
Category 2: Grading
35%
10%
Subtotal 1
Subtotal
Subtotal
30%
Category 6: Shoulders
Subtotal
Category 8: Traffic
Subtotal
Category 5: Paving
35%
Category 4: Structures
Subtotal
10%
11/25/2020 3:13 PMN:\32164-001\CADD\Plot\Submissions\MD 355 Dualization Concept\MD355 Dualization Concept.xlsx
Page 1 of 1
Related Documents


