Contaduría y Administración 61 (2016) 514–534 www.contaduriayadministracionunam.mx/ Available online at www.sciencedirect.com www.cya.unam.mx/index.php/cya Capital budgeting practices by large Brazilian companies Prácticas de presupuestación de capital por grandes compa˜ nías brasile˜ nas Paula de Souza ∗ , Rogério João Lunkes Universidade Federal de Santa Catarina, Brazil Received 28 February 2015; accepted 28 January 2016 Available online 2 May 2016 Abstract This article aims to analyze the use of capital budgeting practices by large Brazilian companies. The survey technique was used for data collection in 51 companies traded on the Stock Exchange. Descriptive statistics were applied, aiming to improve the basis for discussions. The correlation was used to assess the theoretical assumptions of the research. The results show that companies adopt especially the Payback Period, the Net Present Value and the Internal Rate of Return in the assessment of capital budgeting, with scenario and sensitivity analyses to examine the investment risk. The assessment of theoretical assumptions developed in the study has shown that there is no relationship of cause and effect among the variables to explain the use of more sophisticated budgeting practices. Based on similar studies, it is concluded that there is a general trend of increasing sophistication in the various stages of investments budget in large Brazilian companies. All Rights Reserved © 2016 Universidad Nacional Autónoma de México, Facultad de Contaduría y Administración. This is an open access item distributed under the Creative Commons CC License BY-NC-ND 4.0. JEL classification: E22; M21 Keywords: Capital budgeting; Practices of the capital budgeting; Large Brazilian companies; Stock exchange; Investments ∗ Corresponding author. E-mail address: [email protected] (P. de Souza). Peer Review under the responsibility of Universidad Nacional Autónoma de México. http://dx.doi.org/10.1016/j.cya.2016.01.001 0186-1042/All Rights Reserved © 2016 Universidad Nacional Autónoma de México, Facultad de Contaduría y Administración. This is an open access item distributed under the Creative Commons CC License BY-NC-ND 4.0.

Welcome message from author
This document is posted to help you gain knowledge. Please leave a comment to let me know what you think about it! Share it to your friends and learn new things together.
Transcript
Contaduría y Administración 61 (2016) 514–534www.contaduriayadministracionunam.mx/
Available online at www.sciencedirect.com
www.cya.unam.mx/index.php/cya
Capital budgeting practices by largeBrazilian companies
Prácticas de presupuestación de capital por grandescompanías brasilenas
Paula de Souza ∗, Rogério João LunkesUniversidade Federal de Santa Catarina, Brazil
Received 28 February 2015; accepted 28 January 2016Available online 2 May 2016
Abstract
This article aims to analyze the use of capital budgeting practices by large Brazilian companies. The surveytechnique was used for data collection in 51 companies traded on the Stock Exchange. Descriptive statisticswere applied, aiming to improve the basis for discussions. The correlation was used to assess the theoreticalassumptions of the research. The results show that companies adopt especially the Payback Period, the NetPresent Value and the Internal Rate of Return in the assessment of capital budgeting, with scenario andsensitivity analyses to examine the investment risk. The assessment of theoretical assumptions developed inthe study has shown that there is no relationship of cause and effect among the variables to explain the useof more sophisticated budgeting practices. Based on similar studies, it is concluded that there is a generaltrend of increasing sophistication in the various stages of investments budget in large Brazilian companies.All Rights Reserved © 2016 Universidad Nacional Autónoma de México, Facultad de Contaduría yAdministración. This is an open access item distributed under the Creative Commons CC LicenseBY-NC-ND 4.0.
JEL classification: E22; M21Keywords: Capital budgeting; Practices of the capital budgeting; Large Brazilian companies; Stock exchange; Investments
∗ Corresponding author.E-mail address: [email protected] (P. de Souza).
Peer Review under the responsibility of Universidad Nacional Autónoma de México.
http://dx.doi.org/10.1016/j.cya.2016.01.0010186-1042/All Rights Reserved © 2016 Universidad Nacional Autónoma de México, Facultad de Contaduría yAdministración. This is an open access item distributed under the Creative Commons CC License BY-NC-ND 4.0.
P. de Souza, R.J. Lunkes / Contaduría y Administración 61 (2016) 514–534 515
Resumen
Este artículo se propone analizar el uso de prácticas de presupuestación de capital por grandes companíasbrasilenas. Se utilizó la técnica de encuesta para la compilación de datos en 51 companías que se negocianen la Bolsa de Valores. Se aplicaron estadísticas descriptivas, con el propósito de mejorar la base paradiscusiones. Se empleó la correlación para evaluar los supuestos teóricos de la investigación. Los resultadosmuestran que las companías adoptan especialmente el Periodo de Recuperación, el Valor Presente Neto yla Tasa Interna de Rendimiento para la evaluación del presupuesto de capital, con análisis de escenarioy de sensibilidad para examinar el riesgo de inversión. La evaluación de los supuestos teóricos desarrolladosen el estudio ha mostrado que no hay relación de causa efecto entre las variables para explicar el uso deprácticas de presupuestación más sofisticadas. Con base en estudios similares, se concluye que hay unatendencia general a aumentar la sofisticación en las diversas etapas del presupuesto de inversiones en lasgrandes companías brasilenas.Derechos Reservados © 2016 Universidad Nacional Autónoma de México, Facultad de Contaduría y Admin-istración. Este es un artículo de acceso abierto distribuido bajo los términos de la Licencia Creative CommonsCC BY-NC-ND 4.0.
Códigos JEL: E22; M21Palabras clave: Presupuestos de capital; Prácticas de presupuestación de capital; Grandes companías brasilenas; Bolsade Valores; Inversiones
Introduction
Budgeting has been considered one of the main management tools to guide organizations,measure their performance and motivate people. In addition, it serves as an imperative tool in thestages of planning, execution and control. One of the stages of the budgeting process includespreparation and analysis of capital budgeting, which is the focus of this study.
For Koch, Mayper and Wilner (2009) and Bennouna, Meredith and Marchant (2010), thedecisions inherent to capital budgeting are fundamental to the survival and success of the companyin the long run. In view of this, the decisions of the investment budget are conceptualized asa difficult type (Carmona, Iyer & Reckers, 2011). The complexity is justified because capitalexpenditures require significant resources. In addition, companies should determine the best wayto get and return these resources. And yet, most of the capital budgeting decisions require along-term commitment (Chan, 2004; Olawale, Olumuyiwa & George, 2010).
The relevance of the capital budgeting process for the company lies in the fact that a significantamount of money is committed for a long period. This implies that, after the decision to start aproject has been made, its reversal would probably culminate in partial or total loss of the amountinvested (Hall & Millard, 2010).
In addition, long-term decisions require an assessment of the value of money over time, anda behavior analysis and relevance of costs. In this context, capital budgeting practices are toolsthat assist managers in making long-term decisions. Such practices that make up the budget arecommonly divided into: investment analysis, discount rate setting and risk analysis.
Additionally, Kalhoefer (2010) states that the discussion about the best set of practices to beused in capital budgeting has been extensive and dull. That is because the existence of a singleand comprehensive method to be used is questioned.
It turns out that, in fact, the decision maker must often choose among various practices, basedon numerous criteria, not always having a dominant option. The manager must not only assesseach option and discretion. They must also distinguish the importance related to each option anddiscretion to make the final assessment (Carmona, Iyer & Reckers, 2011).
516 P. de Souza, R.J. Lunkes / Contaduría y Administración 61 (2016) 514–534
The existence of various practices available for analysis of the investment budget has promptedresearchers to check which are the most adopted by organizations in the analysis of this budgetstep. Studies on the subject have had so much simpler goals to identify which practice is used –the more detailed the best –, seeking to explain what discount rates are used, how the cash flowsare measured and also which factors are important in capital budgeting decision.
Capital budgeting practices are generally classified in the literature as: investment analysis,discount rate setting and risk analysis. The more sophisticated practices for analysis of investmentsare the ones of discounted cash flows and comprise Net Present Value (NPV), Internal Rate ofReturn (IRR), the Modified Internal Rate of Return (MIRR) and Profitability Index (PI). In turn,traditional practices include the Payback Period (PP) and the Accounting Rate of Return (ARR).
Regarding the definition of the discount rate, the Weighted Average Cost of Capital (WACC)stands as the most suitable practice to use, compared to the Cost of Capital (CC) and the DebtCost (DC). With regard to risk analysis, the simplest practices comprise setting discount rates.As for the most sophisticated ones, they include sensitivity analysis, scenario analysis, decisiontree, Monte Carlo simulation.
Despite the existence of sophisticated practices, many companies still rely on the simplestones (Brealey & Myers, 2005; Hermes, Smid & Yao, 2007; Peel & Bridge, 1998, 1999; Ross,Westerfield & Jaffe, 2004). It is believed that the justification for the use of traditional practices isattributable to some factors, which are: (i) ease of calculation (Pike, 1996); (ii) lack of financialresources and limited use of computer technology (Hall & Millard, 2010; Ryan & Ryan, 2002);(iii) lack of sophistication from the management (Graham & Harvey, 2001); and (iv) a demandfor a lot of human resources (Lam, Wang & Lam, 2007).
From this context, the following research question guides this work: how does the use ofcapital budgeting practices by large Brazilian companies take place? In order to answer thequestion–problem, this paper presents a general objective, which is: to analyze the use of capitalbudgeting practices by large Brazilian companies.
Due to the existence of more elaborate practices than others, researchers conducted severalstudies to see which ones are being used in relation to the size of the company, as well aslongitudinal studies to identify if there is a change in the choice of managers over the years.
Note the lack of studies linked to the capital budgeting practices used by Brazilian companies,deserving a thorough assault on the topic.
Therefore, this study is justified by the theoretical, scientific and academic contribution, toobtain inputs from leaders of Brazilian companies listed, information and features on the adoptionof the budgeting practices used in the investment budget assessment.
This work also contributes in the business and economic sector, by enabling the identificationof the current situation of the surveyed companies, compared to other countries and the disclosurein which aspects you can improve.
The relevance of the research is the importance of making an allocation based way of resourcesand planned, given that the decisions made during the capital budget, among other factors,determine the growth and future productivity of the company (Olawale et al., 2010).
Theoretical review – capital budgeting
Capital budgeting is the process of investment opportunities analysis in long-term assets, whichare expected to produce benefits for more than a year (Peterson & Fabozzi, 2002).
Thus, one sees that a way of avoiding the execution of compromising investments is to use prac-tices that reduce future risks and errors. To conceptualize such tools, this literature review presents
P. de Souza, R.J. Lunkes / Contaduría y Administración 61 (2016) 514–534 517
the main capital budgeting practices identified in the literature, previous studies examining itsadoption and theoretical assumptions of the research.
Practices for investment analysis
The decision to make an equity investment makes up a process which comprises the analysis andassessment of the various alternatives that meet the company’s specifications. After the verificationof viable alternatives, there will be an examination of which investment analysis methodologieswill be employed.
For Souza and Clemente (2008), practices for investment analysis can be divided into twomajor groups: (i) for screening; and (ii) to select projects.
In the first category are the so-called classification or cutting methods such as, for example, thePayback Period (PP) and the Accounting Rate of Return (ARR). In the second category arethe so- called robust methods, which take into account the time value of money, namely: NetPresent Value (NPV), Internal Rate of Return (IRR), the Modified Internal Rate of Return (MIRR)and Profitability Index (PI) (Brigham & Ehrhardt, 2002).
NPV is the most known and used robust technique of investment analysis (Bennouna et al.,2010; Correia & Cramer, 2008; Hermes and Smid; Maquieira, Preve & Sarria-Allende, 2012;Souza & Clemente, 2008; Truong, Partington & Peat, 2008; Viviers & Cohen, 2011; Hermes,Smid & Yao, 2007). NPV, as its name suggests, is the concentration of all the values expectedfrom a cash flow on date zero.
IRR differs from the NPV method because it determines the potential return on investment.IRR is the rate that will make the present value of the proposed capital expenditure equal to thepresent value of cash inflows (Gitman, 2010; Jackson & Sawyers, 2008).
A proposal to simultaneously eliminate the problem of reinvestment assumption by IRR andthe problem of having multiple IRRs is the methodology of the modified IRR (MIRR) (Brom &Balian, 2007).
MIRR is the discount rate that makes the investment equal to the future value of the investmentcash flows, resulting in an NPV equal to zero (Jackson & Sawyers, 2008; Kierulff, 2008).
The Profitability Index (IR) is the expression of the ratio between the present value of future cashflows and their initial cost (Ross, 2000). In other words, it represents the quotient of the NPV relatedto the initial cost of the investment (Brealey, Myers & Marcus, 2002; Viviers & Cohen, 2011).
Practices in capital investment that recognize the value of money over time and use discountedcash flow techniques are preferred by most decision makers (Jackson & Sawyers, 2008). However,these non-discounted methods are not yet used by some managers in practice. Among the mostcommons are the Payback Period (PP) and the Accounting Rate of Return (ARR) (Hermes et al.,2007; Ross et al., 2004; Ross, 2000).
An indicator widely used in the screening process is PP. In it, the amount of time needed for along-term project to recover or pay the initial investment is assessed. In other words, it measureshow long a project takes to pay itself (Jackson & Sawyers, 2008).
The two main weaknesses of PP lie in the fact of not taking into account the value of moneyover time and disregarding everything that happens after the recovery period. This last restrictionpenalizes all of those projects that have small initial revenues but grow throughout their lives(Souza & Clemente, 2008).
Discounted Payback (DP) concerns the time required for the project to recover the investmentmade, including the minimum return set by the investor, that is, investments and returns areconsidered in present value (Brom & Balian, 2007).
518 P. de Souza, R.J. Lunkes / Contaduría y Administración 61 (2016) 514–534
The Accounting Rate of Return (ARR) is the accounting measure of profit divided by theaccounting amount of the investment (Horngren, Foster & Datar, 2000). Galesne, Fensterseiferand Lamb (1999) claim that the investment analysis that has as ARR a parameter is usuallyemployed by leaders of companies concerned with balance sheet results. In this method, theaverage projected profits after depreciation and taxes are divided by the investment in the projector the corresponding net worth and are then compared with the same measure for the companyas a whole or with a pattern of its choice.
In turn, the analysis of Real Options (RO) is a practice for assessment of investments in realassets that considers the value of embedded options and the flexibility of the dynamic process ofdecision-making (Brealey et al., 2002).
According to Bennouna et al. (2010), one of the main developments in the literature of capitalbudgeting over the last decade has been the RO. That is because much of the capital investmentprojects have options that have value (e.g., the option to expand or abandon).
Still, the empirical literature points out that only a relatively small number of companiesemploys RO (Graham & Harvey, 2001; Block, 2007; Brounen, Jong & Koedijk, 2004; Hermeset al., 2007; Ryan & Ryan, 2002; Truong et al., 2008).
Practices for setting the discount rate
The discount rate or cost of capital is the percentage that companies use to calculate, discountingor composing the value of money of cash flows over time (Brom & Balian, 2007).
To calculate the discount rates, companies can use, among other practices, Debt Cost (DC),Cost of Equity (CE) or Weighted Average Cost of Capital (WACC).
Indeed, it appears that the DC – third parties debt cost – is the discount rate that measures thecurrent cost for the company to take funds for project financing (Damodaran, 2002).
In turn, the CSP – cost of shareholder capital – is the return expected by the investor of theircapital invested in a given investment, and this return would be likely to be obtained in otherapplications of the same market risk (Damodaran, 2002).
WACC may be understood as the most sophisticated required rate of return on any investmentproposal which have the same level of risk, such as the assets of a company (Bennouna et al.,2010). In this stage, Block (2011) claims that WACC is the required rate of return on investmentsuggestions that directs to a balanced capital structure, in which the Debt Cost and the Cost ofEquity are used in a pre-set percentage.
With respect to discount rates, Brigham and Ehrhardt (2002) assert that the companies shouldpreferably use the weighted average cost of various funds and sources, including debt, preferredstocks and joint assets.
In general, it is recommended that companies employ differential rates for investment projects,units or divisions. When analyzing the market return, the company can develop different rates fordifferent and new investments, including projects outside its core business (Damodaran, 2002).
Practices for risk analysis
Investment decisions are and should be taken under conditions of uncertainty. For this reason,the company director must take risks. The risk of failure of the investment is one in which thecompany manager will focus efforts to mitigate it, trying to predict the future evolution of theprofitability of their investment (Galesne et al., 1999).
P. de Souza, R.J. Lunkes / Contaduría y Administración 61 (2016) 514–534 519
The simplest practices of risk analysis for investments comprise setting discount rates. Other-wise, the sophisticated practices include probabilistic risk analyses, such as sensitivity analysis,scenario analysis, decision tree, Monte Carlo simulation, among others.
In the sensitivity analysis, the effect that the variation of the input data may have on theorganization’s results is studied (Gitman, 2010). For this reason, when a variation in a parameterdramatically changes the profitability of a project, it is said that this one is very sensitive to theparameter (Casarotto Filho & Kopittke, 2010).
It is found, therefore, that the scenario analysis is used to assess the impact on the organization’sreturn, due to simultaneous changes in several variables (Gitman, 2010).
As for the decision tree, it is a practice applied in the identification of uncertain cash flows(Ross et al., 2004). It is formed by a diagram of sequential decisions and possible results (Brealeyet al., 2002).
As for the decision tree, it is a practice applied in the identification of uncertain cash flows(Ross et al., 2004). It is formed by a diagram of sequential decisions and possible results (Brealeyet al., 2002).
Casarotto Filho and Kopittke (2010) define decision tree as a graphical way to view theconsequences of current decisions and related random events.
Another sophisticated practice is the Monte Carlo simulation. It takes place in stochasticsimulations with various applications and areas (Hromkovic, 2001). Moore and Weatherford(2006) complement, stating that it is one of several ways to analyze the propagation of uncertainty,where its advantage is to determine how an already known random variation, or an error, affectsthe performance or viability of the project being modeled.
Studies on capital budgeting practices
Studies on capital budgeting practices have been made in recent decades in different continents,countries and regions. The methodology used by the authors to question the companies, namely,respondent managers, involves the use of questionnaires and/or interviews.
Initially, it is noted that there is a peculiarity of time when each search was performed, as wellas the location. Such factors may influence the perception of the results, given the diversity ofsocio- economic scenarios, globalization, opening new markets, crises and technological changes,among others.
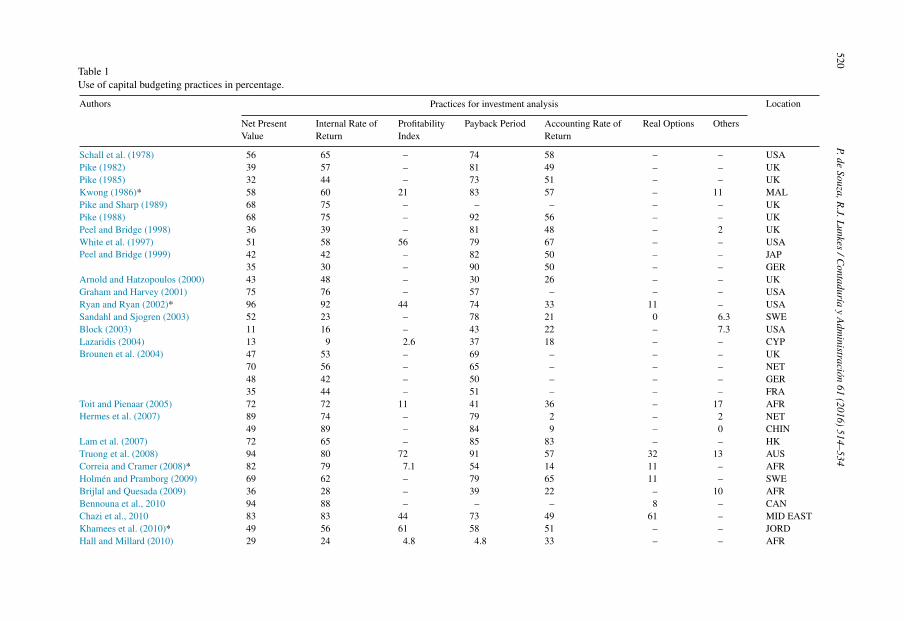
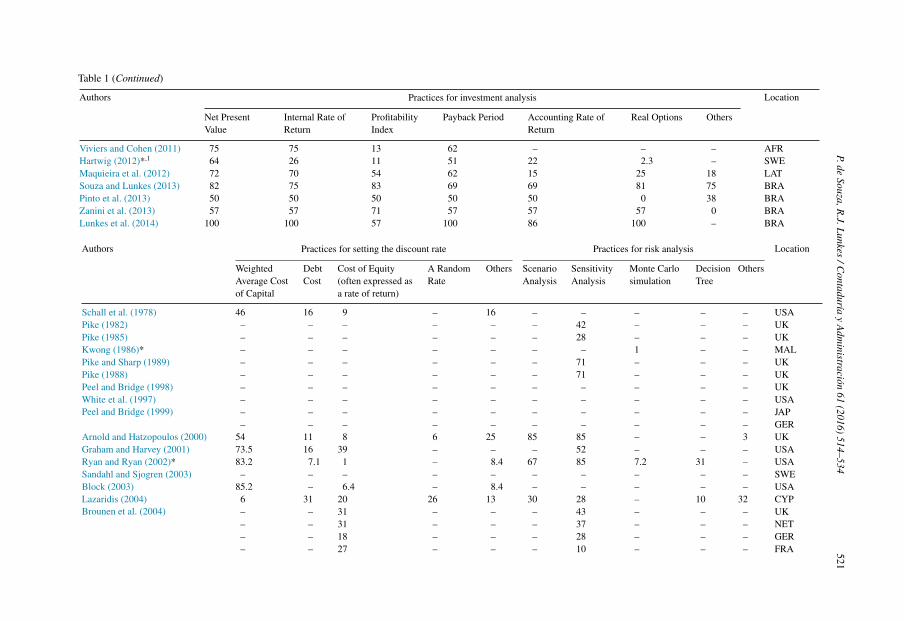
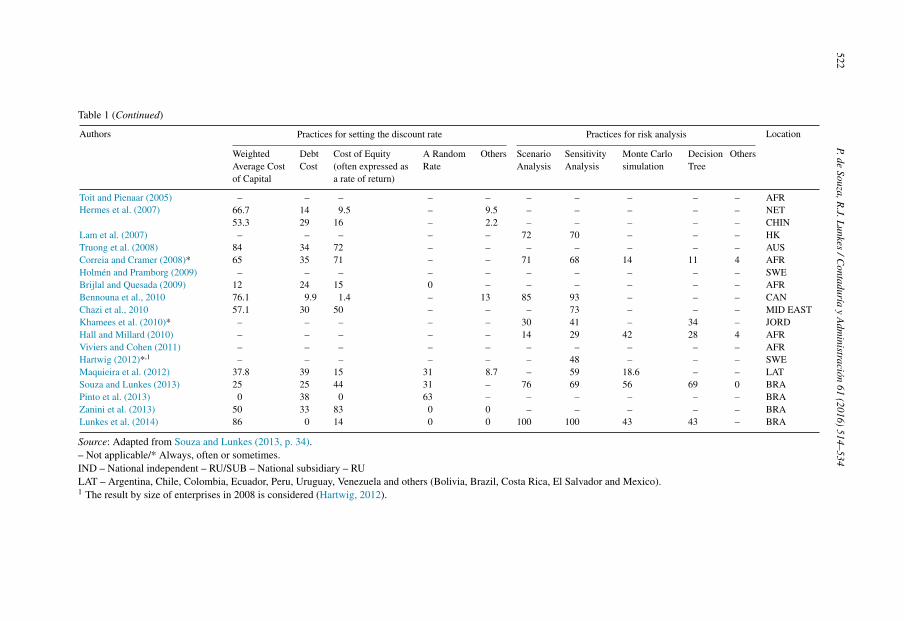
Table 1 shows studies of capital budgeting that were conducted from 1978 to 2012, coveringsome of the practices addressed, namely, for Investment Analysis, Discount Rate Setting and RiskAnalysis.
With regard to practices for investment analysis found in the studies, the Payback Period isnoticed as the most used (Block, 2003; Brijlal & Quesada, 2009; Brounen et al., 2004; Holmén& Pramborg, 2009; Kwong, 1986; Lam et al., 2007; Lazaridis, 2004; Peel & Bridge, 1998, 1999;Pike, 1982, 1985, 1988; Sandahl & Sjogren, 2003; Schall, Sundem & Geijsbeek, 1978; White,Miles & Munilla, 1997).
Also, it can be seen that the methodology of the Net Present Value (NPV) is quite usual fromthe year 2002, being predominant until the year 2012 (Bennouna et al., 2010; Brounen et al.,2004; Correia & Cramer, 2008; Hartwig, 2012; Hermes et al., 2007; Maquieira et al., 2012; Ryan& Ryan, 2002; Truong et al., 2008).
On the other hand, the Real Options (Real Options Valuation, also often termed real optionsanalysis (ROV or ROA)) are among the least practiced in US organizations (Ryan & Ryan, 2002),
520
P. de
Souza, R
.J. L
unkes /
Contaduría
y A
dministración
61 (2016)
514–534Table 1Use of capital budgeting practices in percentage.
Authors Practices for investment analysis Location
Net PresentValue
Internal Rate ofReturn
ProfitabilityIndex
Payback Period Accounting Rate ofReturn
Real Options Others
Schall et al. (1978) 56 65 – 74 58 – – USAPike (1982) 39 57 – 81 49 – – UKPike (1985) 32 44 – 73 51 – – UKKwong (1986)* 58 60 21 83 57 – 11 MALPike and Sharp (1989) 68 75 – – – – – UKPike (1988) 68 75 – 92 56 – – UKPeel and Bridge (1998) 36 39 – 81 48 – 2 UKWhite et al. (1997) 51 58 56 79 67 – – USAPeel and Bridge (1999) 42 42 – 82 50 – – JAP
35 30 – 90 50 – – GERArnold and Hatzopoulos (2000) 43 48 – 30 26 – – UKGraham and Harvey (2001) 75 76 – 57 – – – USARyan and Ryan (2002)* 96 92 44 74 33 11 – USASandahl and Sjogren (2003) 52 23 – 78 21 0 6.3 SWEBlock (2003) 11 16 – 43 22 – 7.3 USALazaridis (2004) 13 9 2.6 37 18 – – CYPBrounen et al. (2004) 47 53 – 69 – – – UK
70 56 – 65 – – – NET48 42 – 50 – – – GER35 44 – 51 – – – FRA
Toit and Pienaar (2005) 72 72 11 41 36 – 17 AFRHermes et al. (2007) 89 74 – 79 2 – 2 NET
49 89 – 84 9 – 0 CHINLam et al. (2007) 72 65 – 85 83 – – HKTruong et al. (2008) 94 80 72 91 57 32 13 AUSCorreia and Cramer (2008)* 82 79 7.1 54 14 11 – AFRHolmén and Pramborg (2009) 69 62 – 79 65 11 – SWEBrijlal and Quesada (2009) 36 28 – 39 22 – 10 AFRBennouna et al., 2010 94 88 – – – 8 – CANChazi et al., 2010 83 83 44 73 49 61 – MID EASTKhamees et al. (2010)* 49 56 61 58 51 – – JORDHall and Millard (2010) 29 24 4.8 4.8 33 – – AFR
P. de
Souza, R
.J. L
unkes /
Contaduría
y A
dministración
61 (2016)
514–534
521Table 1 (Continued)
Authors Practices for investment analysis Location
Net PresentValue
Internal Rate ofReturn
ProfitabilityIndex
Payback Period Accounting Rate ofReturn
Real Options Others
Viviers and Cohen (2011) 75 75 13 62 – – – AFRHartwig (2012)*,1 64 26 11 51 22 2.3 – SWEMaquieira et al. (2012) 72 70 54 62 15 25 18 LATSouza and Lunkes (2013) 82 75 83 69 69 81 75 BRAPinto et al. (2013) 50 50 50 50 50 0 38 BRAZanini et al. (2013) 57 57 71 57 57 57 0 BRALunkes et al. (2014) 100 100 57 100 86 100 – BRA
Authors Practices for setting the discount rate Practices for risk analysis Location
WeightedAverage Costof Capital
DebtCost
Cost of Equity(often expressed asa rate of return)
A RandomRate
Others ScenarioAnalysis
SensitivityAnalysis
Monte Carlosimulation
DecisionTree
Others
Schall et al. (1978) 46 16 9 – 16 – – – – – USAPike (1982) – – – – – – 42 – – – UKPike (1985) – – – – – – 28 – – – UKKwong (1986)* – – – – – – – 1 – – MALPike and Sharp (1989) – – – – – – 71 – – – UKPike (1988) – – – – – – 71 – – – UKPeel and Bridge (1998) – – – – – – – – – – UKWhite et al. (1997) – – – – – – – – – – USAPeel and Bridge (1999) – – – – – – – – – – JAP
– – – – – – – – – – GERArnold and Hatzopoulos (2000) 54 11 8 6 25 85 85 – – 3 UKGraham and Harvey (2001) 73.5 16 39 – – – 52 – – – USARyan and Ryan (2002)* 83.2 7.1 1 – 8.4 67 85 7.2 31 – USASandahl and Sjogren (2003) – – – – – – – – – – SWEBlock (2003) 85.2 – 6.4 – 8.4 – – – – – USALazaridis (2004) 6 31 20 26 13 30 28 – 10 32 CYPBrounen et al. (2004) – – 31 – – – 43 – – – UK
– – 31 – – – 37 – – – NET– – 18 – – – 28 – – – GER– – 27 – – – 10 – – – FRA
522
P. de
Souza, R
.J. L
unkes /
Contaduría
y A
dministración
61 (2016)
514–534
Table 1 (Continued)
Authors Practices for setting the discount rate Practices for risk analysis Location
WeightedAverage Costof Capital
DebtCost
Cost of Equity(often expressed asa rate of return)
A RandomRate
Others ScenarioAnalysis
SensitivityAnalysis
Monte Carlosimulation
DecisionTree
Others
Toit and Pienaar (2005) – – – – – – – – – – AFRHermes et al. (2007) 66.7 14 9.5 – 9.5 – – – – – NET
53.3 29 16 – 2.2 – – – – – CHINLam et al. (2007) – – – – – 72 70 – – – HKTruong et al. (2008) 84 34 72 – – – – – – – AUSCorreia and Cramer (2008)* 65 35 71 – – 71 68 14 11 4 AFRHolmén and Pramborg (2009) – – – – – – – – – – SWEBrijlal and Quesada (2009) 12 24 15 0 – – – – – – AFRBennouna et al., 2010 76.1 9.9 1.4 – 13 85 93 – – – CANChazi et al., 2010 57.1 30 50 – – – 73 – – – MID EASTKhamees et al. (2010)* – – – – – 30 41 – 34 – JORDHall and Millard (2010) – – – – – 14 29 42 28 4 AFRViviers and Cohen (2011) – – – – – – – – – – AFRHartwig (2012)*,1 – – – – – – 48 – – – SWEMaquieira et al. (2012) 37.8 39 15 31 8.7 – 59 18.6 – – LATSouza and Lunkes (2013) 25 25 44 31 – 76 69 56 69 0 BRAPinto et al. (2013) 0 38 0 63 – – – – – – BRAZanini et al. (2013) 50 33 83 0 0 – – – – – BRALunkes et al. (2014) 86 0 14 0 0 100 100 43 43 – BRA
Source: Adapted from Souza and Lunkes (2013, p. 34).– Not applicable/* Always, often or sometimes.IND – National independent – RU/SUB – National subsidiary – RULAT – Argentina, Chile, Colombia, Ecuador, Peru, Uruguay, Venezuela and others (Bolivia, Brazil, Costa Rica, El Salvador and Mexico).1 The result by size of enterprises in 2008 is considered (Hartwig, 2012).
P. de Souza, R.J. Lunkes / Contaduría y Administración 61 (2016) 514–534 523
in Sweden (Holmén & Pramborg, 2009; Sandahl & Sjogren, 2003), in Australia (Truong et al.,2008) and in Canada (Bennouna et al., 2010).
Research previously carried out indicates that there is a preponderance of the WACC method-ology (weighted average cost of capital) used in different countries, such as in the United States(Block, 2003; Graham & Harvey, 2001; Ryan & Ryan, 2002; Schall et al., 1978), United King-dom (Arnold & Hatzopoulos, 2000), The Netherlands and China (Hermes et al., 2007), Australia(Truong et al., 2008), Middle East (Chazi, Terra & Zanella, 2010; Khamees, Al-Fayoumi &Al-Thuneibat, 2010) and Canada (Bennouna et al., 2010).
As for the practices for risk analysis of investment, it is assessed that the analysis of scenariosand sensitivity are the most exploited in companies (Arnold & Hatzopoulos, 2000; Bennounaet al., 2010; Correia & Cramer, 2008; Lam et al., 2007; Ryan & Ryan, 2002).
It can be seen that the main practices in analysis of investments employed are the PaybackPeriod, with a strong preponderance from 1978 to 1999 and the Net Present Value (NPV), espe-cially in the years 2002 to 2012. On the other hand, the Net Present Value (NPV) was the usedless technique during the period from 1978 to 1999. The Weighted Average Cost of Capital isthe most used discount rate in enterprises (12 surveys), while the Cost of Equity (often expressedas a rate of return) appears in 7 of the surveys as the least used. The sensitivity analysis is themost chosen methodology by managers for the risk analysis and the decision tree is the leastchosen.
These findings represent a clue that, over the years, companies have adopted practices thatconsider the value of money over time (Discounted Cash Flow, DCF). In other words, it meansthat the level of sophistication of capital budgeting practices is increasing.
Theoretical assumptions of the research
Several times the researcher has some idea, presumption or thinking about the behavior of avariable or of a possible association between variables. In such cases, theoretical assumptions ofresearch should be developed in a way that allows, from the sample data, to test the validity ofideas about the study population (Barbetta, Reis & Bornia, 2010).
Indeed, the theoretical assumptions of this study are developed from a review of the literatureand empirical work described in the subsection of similar studies.
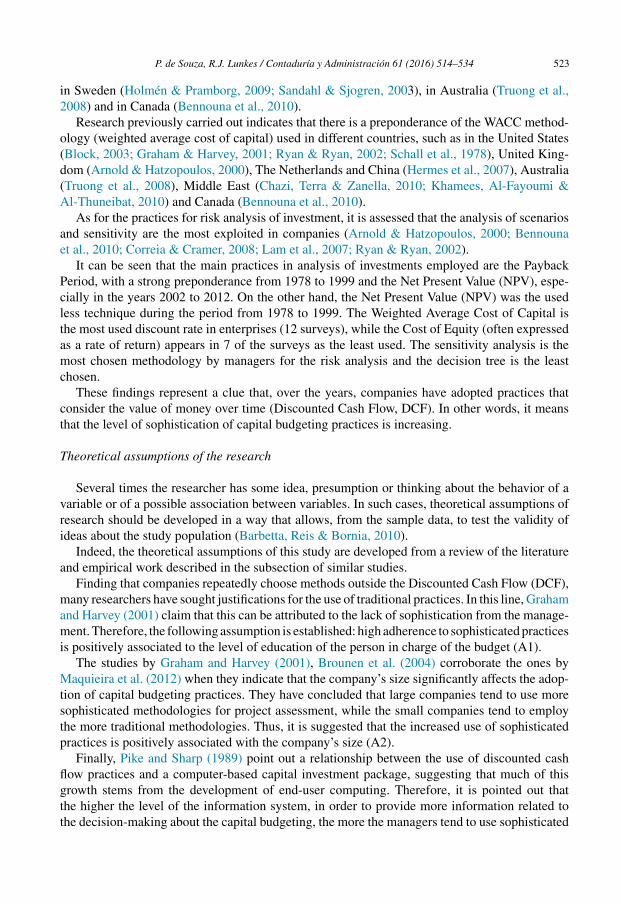
Finding that companies repeatedly choose methods outside the Discounted Cash Flow (DCF),many researchers have sought justifications for the use of traditional practices. In this line, Grahamand Harvey (2001) claim that this can be attributed to the lack of sophistication from the manage-ment. Therefore, the following assumption is established: high adherence to sophisticated practicesis positively associated to the level of education of the person in charge of the budget (A1).
The studies by Graham and Harvey (2001), Brounen et al. (2004) corroborate the ones byMaquieira et al. (2012) when they indicate that the company’s size significantly affects the adop-tion of capital budgeting practices. They have concluded that large companies tend to use moresophisticated methodologies for project assessment, while the small companies tend to employthe more traditional methodologies. Thus, it is suggested that the increased use of sophisticatedpractices is positively associated with the company’s size (A2).
Finally, Pike and Sharp (1989) point out a relationship between the use of discounted cashflow practices and a computer-based capital investment package, suggesting that much of thisgrowth stems from the development of end-user computing. Therefore, it is pointed out thatthe higher the level of the information system, in order to provide more information related tothe decision-making about the capital budgeting, the more the managers tend to use sophisticated
524 P. de Souza, R.J. Lunkes / Contaduría y Administración 61 (2016) 514–534
Table 2Theoretical assumptions of research.
Assumptions References
A1: increased use of sophisticated practices is positively associatedwith the level of education of the person in charge of capitalbudgeting
Graham and Harvey (2001)
A2: the increased use of sophisticated practices is positivelyassociated with the company’s size
Graham and Harvey (2001)Brounen et al. (2004)Maquieira et al. (2012)
A3: the information system level is positively associated with theuse of sophisticated capital budgeting practices
Pike and Sharp (1989)
Source: Developed by the author.
practices. Thus, the following assumption is established: the information system level is positivelyassociated with the use of sophisticated capital budgeting practices (A3).
Table 2 shows the theoretical assumptions of research and the sources that underlie.
Methodological procedures
This section is intended to show the procedures adopted for the preparation of this research.First, it presents its framework. Following, is directed to the explanation about the interventioninstrument, population and sample, the questionnaire was applied, and finally, the correlation.
Development and implementation of the questionnaire
In Table 1 can be seen the practices relating to investment analysis and discount rate and riskanalysis definitions, in addition to best practices in capital budgeting, covering the items presentedin the literature review.
It is noteworthy that such an instrument was originally structured and applied by Souza andLunkes (2013) in hotels in year 2012 and adjustments have been made over years 2013 and 2014.
Other studies were published in events and magazines as initial studies (Lunkes, Belli,Andruchechen & Suave, 2014; Pinto, Ventura, Lunkes & Petri, 2013; Silva, Suave & Codesso,2013; Zanini, Souza & Lunkes, 2013), aiming at improvements suggested by participants andevaluators. Therefore, it must be clarified that the present work is part of a longitudinal study.
Studies in Brazil applied questionnaires to find out which practices managers use in the analysisof investment projects. Unlike these, this study goes further, since it identifies assumptions in theliterature and checks are valid for Brazilian companies. Such assumptions are verified by statisticalcorrelations between the variables, in this case, the practices. Other tests are applied when thereis a correlation.
In the investment analysis practices, the Discounted Payback (DP) was added and the Paybackis used as the first or second method. Both additions were suggested at conferences and byevaluators of articles submitted to journals.
In addition to the practices, the questionnaire comprises aspects relating to management andinvestment expenditures audit, besides the information available by the company informationsystems.
P. de Souza, R.J. Lunkes / Contaduría y Administración 61 (2016) 514–534 525
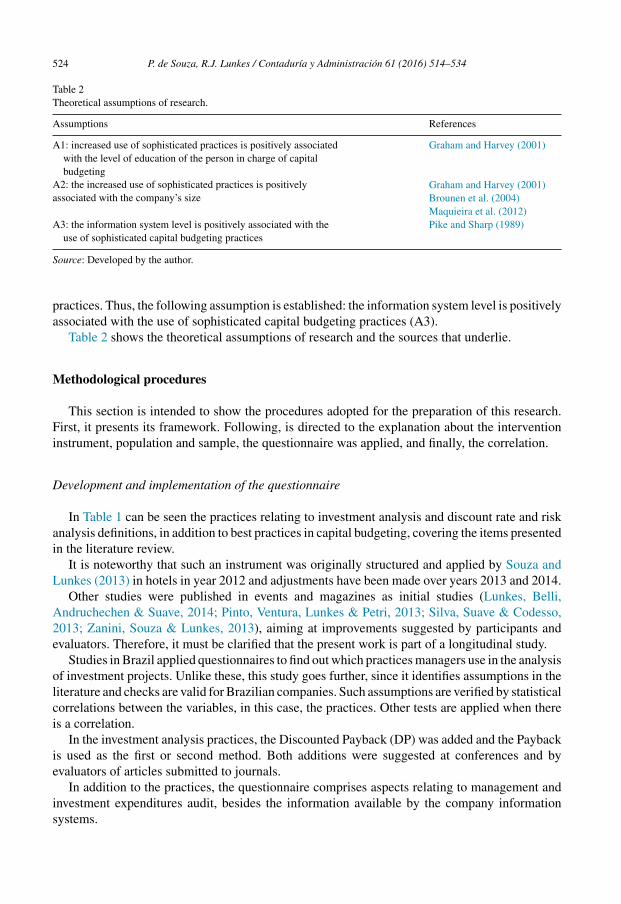
Table 3Respondent companies.
Sector Number of respondentcompanies
BM&F BOVESPA
Industrial goods 13 37Basic materials 13 39Financial and others 8 70Construction and transport 7 61For public use 7 61Consumer cyclicals 2 74Oil, gas and biofuels 1 13
Source: Developed by the author.
Population and sample
In order to achieve the goal of this study, the companies traded at the BM&F BOVESPA (in full,Bolsa de Valores, Mercadorias & Futuros de São Paulo; São Paulo Stock Exchange) (Bovespa)were selected.
On September 23, 2014, the population was composed of 491 Brazilian companies tradedat BM&F BOVESPA, distributed in 10 different economic sectors, except real estate funds andstocks.
To obtain survey responses, the company was first contacted by telephone, in order to reachthe person in charge of capital budgeting. In a second step, the questionnaire was presented andsent by e- mail to the person who would be the respondent. Google form was adopted as a tool.But when inaccessible, an editable text file was sent to the participant.
Thus, the questionnaires were sent during the period from 03/20/2013 to 07/30/2014. Afterthis period, it was found that 28 companies belonged to a group and therefore capital budgetingwas done by the same management. Therefore, the final sample consisted of 463 companies.
On 08/01/2014, it was found that 51 companies had answered to the survey questionnaire,according to Table 3. These companies are part of the analysis of the results.
As seen in Table 3, the sample included companies with different characteristics. As for thetotal assets in the balance sheet of 12/31/2013 published by the companies, 21.57% ended 2013with less than 1.0 billion reais, 31.37% amounted to 1–5 billion reais, 43.13% 5–350 billion reaisand 3.92% from 750 billion to 1.3 trillion reais. Regarding the results, 16 companies lost money,one lost less than 1 million reais in profits, 24 between 1 and 500 million reais and 10 between500 million and 25 billion reais.
Correlation (statistical analyzes)
The correlation is the numeric association between variables with strength or degree of rela-tionship, not necessarily implying cause and effect (Barbetta et al., 2010).
In statistics, the variables are associated when they have similarities in the distribution of thescores, that is, they are related by means of the frequency distribution or the link of variancesharing. The Pearson correlation uses such sharing between two variables in which the increaseor decrease of a variable “A” creates the same effect in variable “B” (Fippgueiredo Filho & SilvaFilho, 2009).
526 P. de Souza, R.J. Lunkes / Contaduría y Administración 61 (2016) 514–534
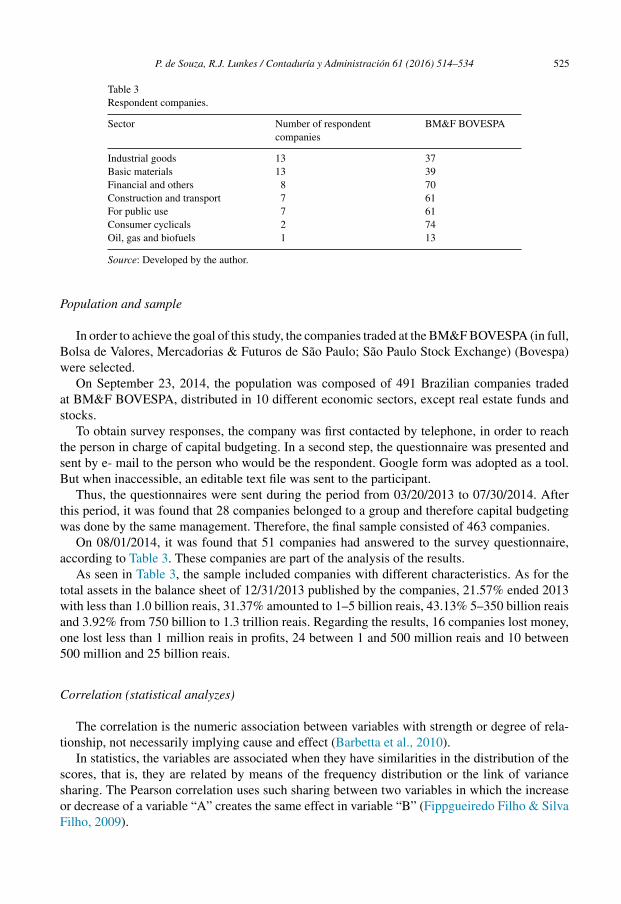
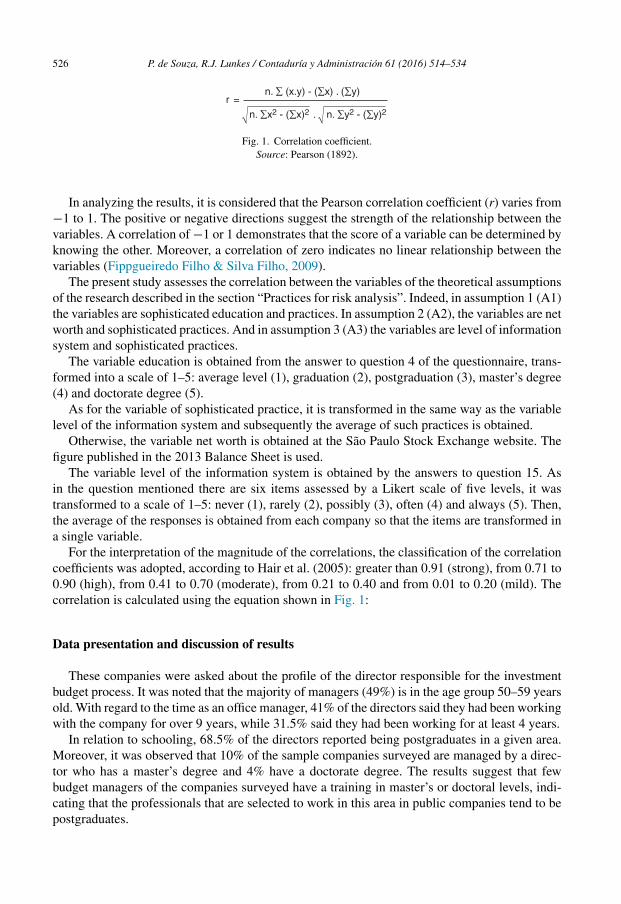
r =n. ∑ (x.y) - ( ∑x) . ( ∑y)
. n. ∑y2 - (∑y)2n. ∑x2 - (∑x)2
Fig. 1. Correlation coefficient.Source: Pearson (1892).
In analyzing the results, it is considered that the Pearson correlation coefficient (r) varies from−1 to 1. The positive or negative directions suggest the strength of the relationship between thevariables. A correlation of −1 or 1 demonstrates that the score of a variable can be determined byknowing the other. Moreover, a correlation of zero indicates no linear relationship between thevariables (Fippgueiredo Filho & Silva Filho, 2009).
The present study assesses the correlation between the variables of the theoretical assumptionsof the research described in the section “Practices for risk analysis”. Indeed, in assumption 1 (A1)the variables are sophisticated education and practices. In assumption 2 (A2), the variables are networth and sophisticated practices. And in assumption 3 (A3) the variables are level of informationsystem and sophisticated practices.
The variable education is obtained from the answer to question 4 of the questionnaire, trans-formed into a scale of 1–5: average level (1), graduation (2), postgraduation (3), master’s degree(4) and doctorate degree (5).
As for the variable of sophisticated practice, it is transformed in the same way as the variablelevel of the information system and subsequently the average of such practices is obtained.
Otherwise, the variable net worth is obtained at the São Paulo Stock Exchange website. Thefigure published in the 2013 Balance Sheet is used.
The variable level of the information system is obtained by the answers to question 15. Asin the question mentioned there are six items assessed by a Likert scale of five levels, it wastransformed to a scale of 1–5: never (1), rarely (2), possibly (3), often (4) and always (5). Then,the average of the responses is obtained from each company so that the items are transformed ina single variable.
For the interpretation of the magnitude of the correlations, the classification of the correlationcoefficients was adopted, according to Hair et al. (2005): greater than 0.91 (strong), from 0.71 to0.90 (high), from 0.41 to 0.70 (moderate), from 0.21 to 0.40 and from 0.01 to 0.20 (mild). Thecorrelation is calculated using the equation shown in Fig. 1:
Data presentation and discussion of results
These companies were asked about the profile of the director responsible for the investmentbudget process. It was noted that the majority of managers (49%) is in the age group 50–59 yearsold. With regard to the time as an office manager, 41% of the directors said they had been workingwith the company for over 9 years, while 31.5% said they had been working for at least 4 years.
In relation to schooling, 68.5% of the directors reported being postgraduates in a given area.Moreover, it was observed that 10% of the sample companies surveyed are managed by a direc-tor who has a master’s degree and 4% have a doctorate degree. The results suggest that fewbudget managers of the companies surveyed have a training in master’s or doctoral levels, indi-cating that the professionals that are selected to work in this area in public companies tend to bepostgraduates.
P. de Souza, R.J. Lunkes / Contaduría y Administración 61 (2016) 514–534 527
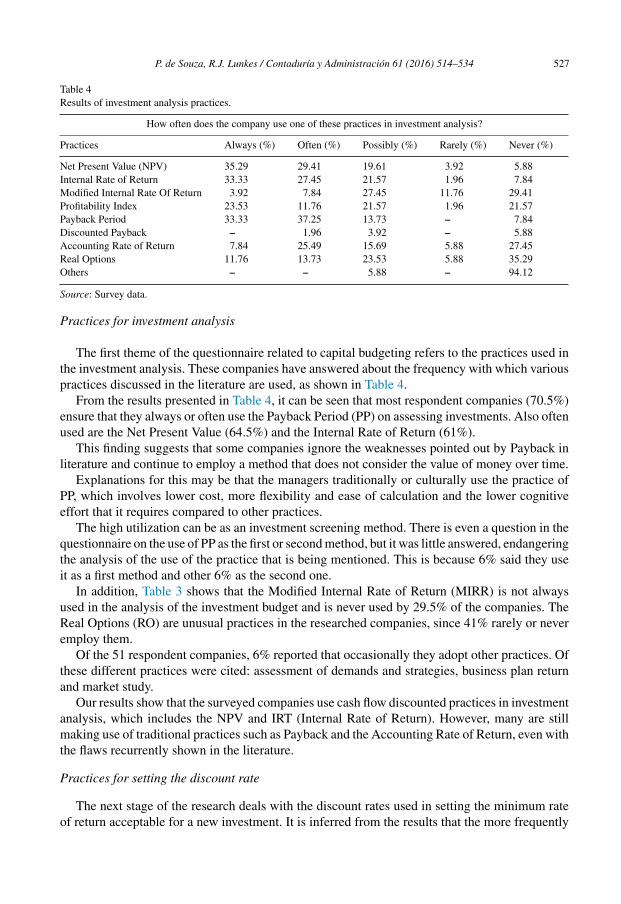
Table 4Results of investment analysis practices.
How often does the company use one of these practices in investment analysis?
Practices Always (%) Often (%) Possibly (%) Rarely (%) Never (%)
Net Present Value (NPV) 35.29 29.41 19.61 3.92 5.88Internal Rate of Return 33.33 27.45 21.57 1.96 7.84Modified Internal Rate Of Return 3.92 7.84 27.45 11.76 29.41Profitability Index 23.53 11.76 21.57 1.96 21.57Payback Period 33.33 37.25 13.73 – 7.84Discounted Payback – 1.96 3.92 – 5.88Accounting Rate of Return 7.84 25.49 15.69 5.88 27.45Real Options 11.76 13.73 23.53 5.88 35.29Others – – 5.88 – 94.12
Source: Survey data.
Practices for investment analysis
The first theme of the questionnaire related to capital budgeting refers to the practices used inthe investment analysis. These companies have answered about the frequency with which variouspractices discussed in the literature are used, as shown in Table 4.
From the results presented in Table 4, it can be seen that most respondent companies (70.5%)ensure that they always or often use the Payback Period (PP) on assessing investments. Also oftenused are the Net Present Value (64.5%) and the Internal Rate of Return (61%).
This finding suggests that some companies ignore the weaknesses pointed out by Payback inliterature and continue to employ a method that does not consider the value of money over time.
Explanations for this may be that the managers traditionally or culturally use the practice ofPP, which involves lower cost, more flexibility and ease of calculation and the lower cognitiveeffort that it requires compared to other practices.
The high utilization can be as an investment screening method. There is even a question in thequestionnaire on the use of PP as the first or second method, but it was little answered, endangeringthe analysis of the use of the practice that is being mentioned. This is because 6% said they useit as a first method and other 6% as the second one.
In addition, Table 3 shows that the Modified Internal Rate of Return (MIRR) is not alwaysused in the analysis of the investment budget and is never used by 29.5% of the companies. TheReal Options (RO) are unusual practices in the researched companies, since 41% rarely or neveremploy them.
Of the 51 respondent companies, 6% reported that occasionally they adopt other practices. Ofthese different practices were cited: assessment of demands and strategies, business plan returnand market study.
Our results show that the surveyed companies use cash flow discounted practices in investmentanalysis, which includes the NPV and IRT (Internal Rate of Return). However, many are stillmaking use of traditional practices such as Payback and the Accounting Rate of Return, even withthe flaws recurrently shown in the literature.
Practices for setting the discount rate
The next stage of the research deals with the discount rates used in setting the minimum rateof return acceptable for a new investment. It is inferred from the results that the more frequently
528 P. de Souza, R.J. Lunkes / Contaduría y Administración 61 (2016) 514–534
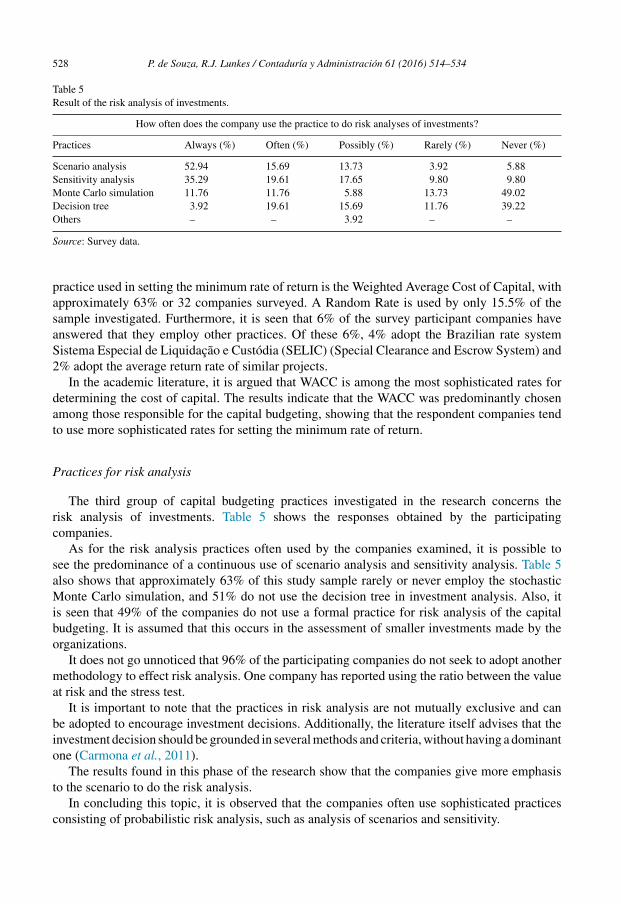
Table 5Result of the risk analysis of investments.
How often does the company use the practice to do risk analyses of investments?
Practices Always (%) Often (%) Possibly (%) Rarely (%) Never (%)
Scenario analysis 52.94 15.69 13.73 3.92 5.88Sensitivity analysis 35.29 19.61 17.65 9.80 9.80Monte Carlo simulation 11.76 11.76 5.88 13.73 49.02Decision tree 3.92 19.61 15.69 11.76 39.22Others – – 3.92 – –
Source: Survey data.
practice used in setting the minimum rate of return is the Weighted Average Cost of Capital, withapproximately 63% or 32 companies surveyed. A Random Rate is used by only 15.5% of thesample investigated. Furthermore, it is seen that 6% of the survey participant companies haveanswered that they employ other practices. Of these 6%, 4% adopt the Brazilian rate systemSistema Especial de Liquidacão e Custódia (SELIC) (Special Clearance and Escrow System) and2% adopt the average return rate of similar projects.
In the academic literature, it is argued that WACC is among the most sophisticated rates fordetermining the cost of capital. The results indicate that the WACC was predominantly chosenamong those responsible for the capital budgeting, showing that the respondent companies tendto use more sophisticated rates for setting the minimum rate of return.
Practices for risk analysis
The third group of capital budgeting practices investigated in the research concerns therisk analysis of investments. Table 5 shows the responses obtained by the participatingcompanies.
As for the risk analysis practices often used by the companies examined, it is possible tosee the predominance of a continuous use of scenario analysis and sensitivity analysis. Table 5also shows that approximately 63% of this study sample rarely or never employ the stochasticMonte Carlo simulation, and 51% do not use the decision tree in investment analysis. Also, itis seen that 49% of the companies do not use a formal practice for risk analysis of the capitalbudgeting. It is assumed that this occurs in the assessment of smaller investments made by theorganizations.
It does not go unnoticed that 96% of the participating companies do not seek to adopt anothermethodology to effect risk analysis. One company has reported using the ratio between the valueat risk and the stress test.
It is important to note that the practices in risk analysis are not mutually exclusive and canbe adopted to encourage investment decisions. Additionally, the literature itself advises that theinvestment decision should be grounded in several methods and criteria, without having a dominantone (Carmona et al., 2011).
The results found in this phase of the research show that the companies give more emphasisto the scenario to do the risk analysis.
In concluding this topic, it is observed that the companies often use sophisticated practicesconsisting of probabilistic risk analysis, such as analysis of scenarios and sensitivity.
P. de Souza, R.J. Lunkes / Contaduría y Administración 61 (2016) 514–534 529
Comparison with similar studies
The managers of Brazilian companies have said that they use mainly the Payback Period,followed by the Net Present Value and the Internal Rate of Return. Less frequently, they employthe Real Options and the Modified Internal Rate of Return.
In similar studies, the Payback Period is shown as a very usual method (Brijlal & Quesada,2009; Brounen et al., 2004; Holmén & Pramborg, 2009; Kwong, 1986; Lam et al., 2007; Lazaridis,2004; Peel & Bridge, 1998, 1999; Pike, 1982, 1985, 1988; Sandahl & Sjogren, 2003; Schall et al.,1978; White et al., 1997). Thus, it appears that the Payback is still commonly used, even with itsweaknesses. Being a traditional method, it must be employed as a secondary practice of cuttingand not as one that will define whether or not the investment will be done.
Moreover, at least in theory, it can be inferred that the Payback has begun to be used in acomplementary way, as the practices of the Net Present Value and Internal Rate of Return arealso usual in companies of this study and of the participants in research carried out in the UnitedKingdom, in the United States, in The Netherlands, in Australia, in South Africa, in Canada inSweden and in certain companies in Latin America.
The low adoption of the practice of Real Options (RO) was already expected. In fact, theempirical literature shows that only a relatively small number of companies employ the RO. Thisfinding corroborates the studies done by Ryan and Ryan (2002), Sandahl and Sjogren (2003),Truong et al. (2008), Holmén and Pramborg (2009), Bennouna et al. (2010), Hartwig (2012), andPinto et al. (2013).
The practice considered as the most sophisticated in the literature for discount rate settingis the Weighted Average Cost of Capital (WACC). The managers of the participating Braziliancompanies have reported using more often the WACC.
Likewise, research previously carried out indicates that there is a preponderance of theWACC methodology (weighted average cost of capital) used in different countries, such as inthe United States, United Kingdom, The Netherlands and China, Australia, Middle East andCanada.
Brazilian companies participating in the research use a scenario and sensitivity analysis forrisk analysis. By the way, these results reinforce other studies that have looked at the prevalence ofthe use of methods of analysis of scenarios and sensitivity in companies (Arnold & Hatzopoulos,2000; Bennouna et al., 2010; Correia & Cramer, 2008; Lam et al., 2007; Ryan & Ryan, 2002).
The stochastic Monte Carlo simulation has a very low percentage of adoption by both therespondent companies as the companies participating in the research by Ryan and Ryan (2002),Maquieira et al. (2012) and Souza and Lunkes (2013). It is suggested that the low percentage ofuse is due to the complexity of the method that, in some cases, can be the cause for the managers’lack of knowledge.
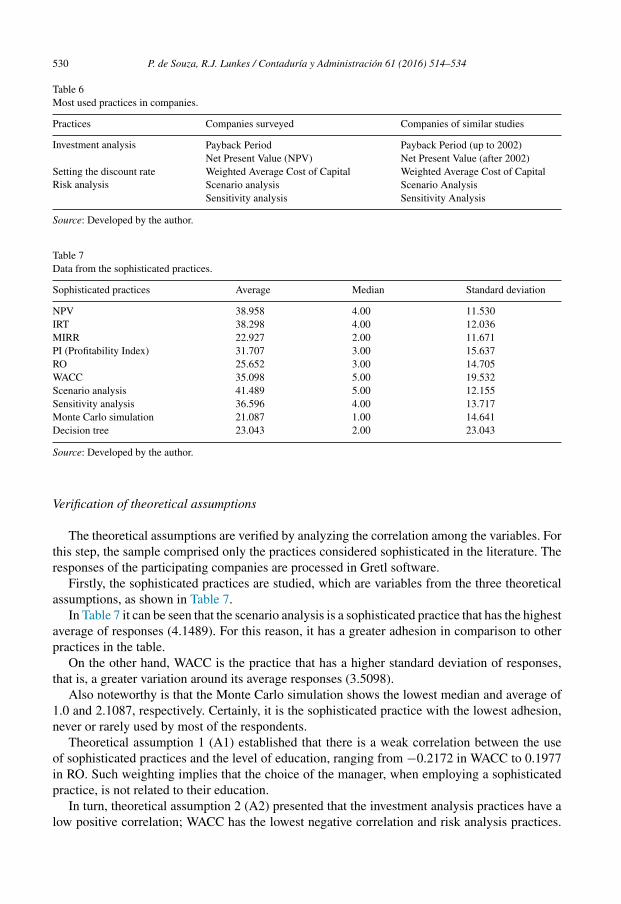
Table 6 summarizes the comparisons of the most common practices among the surveyedcompanies and similar studies.
Finally, it is considered that the majority of the Brazilian publicly traded companies in thesample have shown results converging with research from various countries. Indeed, a large partof both uses sophisticated practices to develop capital budgeting, but still often uses traditionalpractices.
Thus, it is recommended that companies adopt more sophisticated practices to do the analysisof investment projects or that the adoption be related to the relevance of the investment. In thiscourse, it is essential that they use traditional practices as an additional measure and for smallerinvestments, trying to avoid that disastrous investments be done, based on fragile practices.
530 P. de Souza, R.J. Lunkes / Contaduría y Administración 61 (2016) 514–534
Table 6Most used practices in companies.
Practices Companies surveyed Companies of similar studies
Investment analysis Payback Period Payback Period (up to 2002)Net Present Value (NPV) Net Present Value (after 2002)
Setting the discount rate Weighted Average Cost of Capital Weighted Average Cost of CapitalRisk analysis Scenario analysis Scenario Analysis
Sensitivity analysis Sensitivity Analysis
Source: Developed by the author.
Table 7Data from the sophisticated practices.
Sophisticated practices Average Median Standard deviation
NPV 38.958 4.00 11.530IRT 38.298 4.00 12.036MIRR 22.927 2.00 11.671PI (Profitability Index) 31.707 3.00 15.637RO 25.652 3.00 14.705WACC 35.098 5.00 19.532Scenario analysis 41.489 5.00 12.155Sensitivity analysis 36.596 4.00 13.717Monte Carlo simulation 21.087 1.00 14.641Decision tree 23.043 2.00 23.043
Source: Developed by the author.
Verification of theoretical assumptions
The theoretical assumptions are verified by analyzing the correlation among the variables. Forthis step, the sample comprised only the practices considered sophisticated in the literature. Theresponses of the participating companies are processed in Gretl software.
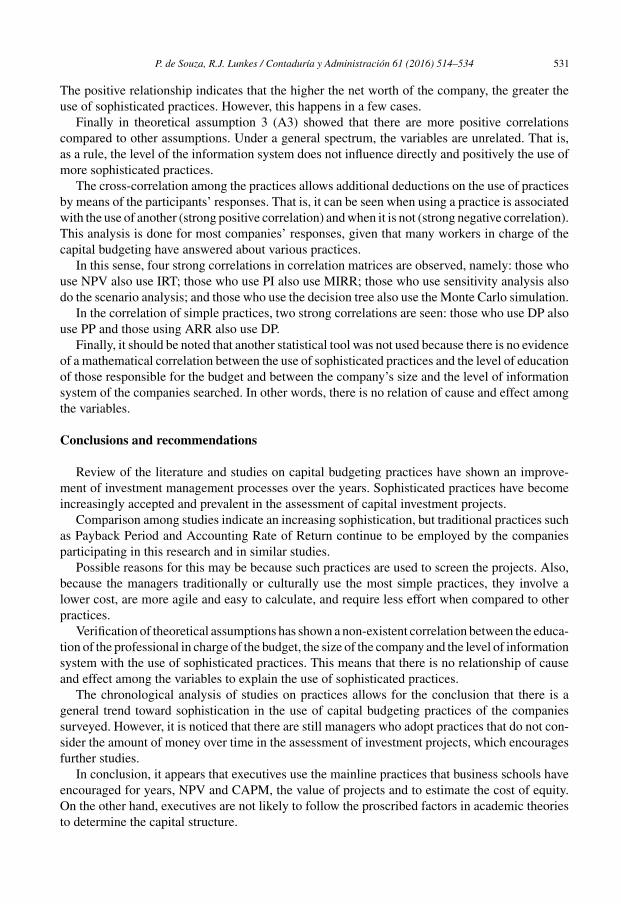
Firstly, the sophisticated practices are studied, which are variables from the three theoreticalassumptions, as shown in Table 7.
In Table 7 it can be seen that the scenario analysis is a sophisticated practice that has the highestaverage of responses (4.1489). For this reason, it has a greater adhesion in comparison to otherpractices in the table.
On the other hand, WACC is the practice that has a higher standard deviation of responses,that is, a greater variation around its average responses (3.5098).
Also noteworthy is that the Monte Carlo simulation shows the lowest median and average of1.0 and 2.1087, respectively. Certainly, it is the sophisticated practice with the lowest adhesion,never or rarely used by most of the respondents.
Theoretical assumption 1 (A1) established that there is a weak correlation between the useof sophisticated practices and the level of education, ranging from −0.2172 in WACC to 0.1977in RO. Such weighting implies that the choice of the manager, when employing a sophisticatedpractice, is not related to their education.
In turn, theoretical assumption 2 (A2) presented that the investment analysis practices have alow positive correlation; WACC has the lowest negative correlation and risk analysis practices.
P. de Souza, R.J. Lunkes / Contaduría y Administración 61 (2016) 514–534 531
The positive relationship indicates that the higher the net worth of the company, the greater theuse of sophisticated practices. However, this happens in a few cases.
Finally in theoretical assumption 3 (A3) showed that there are more positive correlationscompared to other assumptions. Under a general spectrum, the variables are unrelated. That is,as a rule, the level of the information system does not influence directly and positively the use ofmore sophisticated practices.
The cross-correlation among the practices allows additional deductions on the use of practicesby means of the participants’ responses. That is, it can be seen when using a practice is associatedwith the use of another (strong positive correlation) and when it is not (strong negative correlation).This analysis is done for most companies’ responses, given that many workers in charge of thecapital budgeting have answered about various practices.
In this sense, four strong correlations in correlation matrices are observed, namely: those whouse NPV also use IRT; those who use PI also use MIRR; those who use sensitivity analysis alsodo the scenario analysis; and those who use the decision tree also use the Monte Carlo simulation.
In the correlation of simple practices, two strong correlations are seen: those who use DP alsouse PP and those using ARR also use DP.
Finally, it should be noted that another statistical tool was not used because there is no evidenceof a mathematical correlation between the use of sophisticated practices and the level of educationof those responsible for the budget and between the company’s size and the level of informationsystem of the companies searched. In other words, there is no relation of cause and effect amongthe variables.
Conclusions and recommendations
Review of the literature and studies on capital budgeting practices have shown an improve-ment of investment management processes over the years. Sophisticated practices have becomeincreasingly accepted and prevalent in the assessment of capital investment projects.
Comparison among studies indicate an increasing sophistication, but traditional practices suchas Payback Period and Accounting Rate of Return continue to be employed by the companiesparticipating in this research and in similar studies.
Possible reasons for this may be because such practices are used to screen the projects. Also,because the managers traditionally or culturally use the most simple practices, they involve alower cost, are more agile and easy to calculate, and require less effort when compared to otherpractices.
Verification of theoretical assumptions has shown a non-existent correlation between the educa-tion of the professional in charge of the budget, the size of the company and the level of informationsystem with the use of sophisticated practices. This means that there is no relationship of causeand effect among the variables to explain the use of sophisticated practices.
The chronological analysis of studies on practices allows for the conclusion that there is ageneral trend toward sophistication in the use of capital budgeting practices of the companiessurveyed. However, it is noticed that there are still managers who adopt practices that do not con-sider the amount of money over time in the assessment of investment projects, which encouragesfurther studies.
In conclusion, it appears that executives use the mainline practices that business schools haveencouraged for years, NPV and CAPM, the value of projects and to estimate the cost of equity.On the other hand, executives are not likely to follow the proscribed factors in academic theoriesto determine the capital structure.
532 P. de Souza, R.J. Lunkes / Contaduría y Administración 61 (2016) 514–534
If academics are responsible for checking the best methodologies to be employed in the prac-tices of companies, why executives do not use? The non-use, improper or incorrect use of capitalbudgeting practices can cause disastrous financial results for companies, since this budget involvesa high amount of resources. This finding raises possibilities that require reflection and furtherresearch.
Among the limitations of the work is the absence of justification for the managers to continueusing less advanced capital budgeting practices in capital budgeting. The fact that the research isrelated to the research sample object of study, which can distort the results for the other publiclytraded companies.
Another limitation concerns the budgeting practices in the questionnaire, because in the realityof organizations other practices can be employed. It must be highlighted that the result of thisresearch, previous research studies and also the correlation of theoretical assumptions are donefrom questionnaires answered about confidential information of companies and do not alwaysreflect the truth.
Because of the scarcity of studies on capital budgeting, it is recommended that a broaderset of data is taken into account when carrying out further studies, in terms of the number ofcompanies and budgeting practices. Also, an evolvement of this study is suggested, done with othervariables such as sector of the economy, year of conducting the search, country, economic times,etc.
Developing a model of capital budgeting that allows the company to verify its scenario inrelation to the practices used, allowing the identification of strengths and deficits, is also proposed.
References
Arnold, G. C., & Hatzopoulos, P. D. (2000). The theory–practice gap in capital budgeting: Evidence from the UnitedKingdom. Journal of Business Finance and Accounting, 10(5), 603–626. http://dx.doi.org/10.1111/1468-5957.00327
Barbetta, P. A., Reis, M. M., & Bornia, A. C. (2010). Estatística para cursos de engenharia e informática (Ed 3a). SãoPaulo: Atlas.
Bennouna, K., Meredith, G. G., & Marchant, T. (2010). Improved capital budgeting decision making: evidence fromCanada. Management Decision, 48, 225–247. http://dx.doi.org/10.1108/00251741011022590
Block, S. (2003). Divisional cost of capital: A study of its use by major US firms. The Engineering Economist, 48(4),345–362. http://dx.doi.org/10.1080/00137910309408773
Block, S. (2007). Are real options actually used in the real world? The Engineering Economist, 52(3), 255–267.http://dx.doi.org/10.1080/00137910701503910
Block, S. (2011). Does the weighted average cost of capital describe the real-world approach to the discountrate? The Engineering Economist: A Journal Devoted to the Problems of Capital Investment, 56(2), 170–180.http://dx.doi.org/10.1080/0013791X.2011.573618
Brealey, R. A., & Myers, S. (2005). Principles of corporate finance (8th Ed.). New York: McGraw-Hill.Brealey, R. A., Myers, S. C., & Marcus, A. J. (2002). Fundamentos da Administracão Financeira (Ed 3a). Rio de Janeiro:
McGraw-Hill Irwin.Brigham, E. F., & Ehrhardt, M. C. (2002). Financial management: Theory and practice (10th Ed.). South-Western.Brijlal, P., & Quesada, L. (2009). The use of capital budgeting techniques in businesses: A perspective from the Western
Cape. Journal of Applied Business Research, 25, 37–46. http://dx.doi.org/10.2139/ssrn.1259636Brom, L. G., & Balian, J. E. A. (2007). Análise de investimentos e capital de giro: Conceitos e aplicacões. São Paulo:
Saraiva.Brounen, D., Jong, A., & Koedijk, K. (2004). Corporate finance in Europe: Confronting theory with practice. Financial
Management, 33(4), 71–101. http://dx.doi.org/10.2139/ssrn.559415Carmona, S., Iyer, G., & Reckers, P. M. J. (2011). The impact of strategy communications, incentives and national
culture on balanced scorecard implementation. Advances in Accounting, 27, 62–74. http://dx.doi.org/10.1016/j.adiac.2011.01.004
Casarotto Filho, N., & Kopittke, B. H. (2010). Análise de investimentos (Ed 11a). São Paulo: Atlas.
P. de Souza, R.J. Lunkes / Contaduría y Administración 61 (2016) 514–534 533
Chan, Y. L. (2004). Use of capital budgeting techniques to capital investment decisions in Canadian Munici-pal Governments. Journal of Business Finance & Accounting, 24, 40–58. http://dx.doi.org/10.1111/j. 0275-1100.2004.02402003.x
Chazi, A., Terra, P. R. S., & Zanella, F. C. (2010). Theory versus practice: Perspectives of Mid-dle Eastern financial managers. European Business Review, 22, 195–221. http://dx.doi.org/10.1108/09555341011023524
Correia, C., & Cramer, P. (2008). An analysis of cost of capital, capital structure and capital budgeting practices: Asurvey of South African listed companies. Meditari Accountancy Research, 16(2), 31–52. http://dx.doi.org/10.1108/10222529200800011
Damodaran, A. (2002). Investment valuation: Tools and techniques for determining the value of any asset. New York:Jonh Wiley & Sons.
Figueiredo Filho, D. B. F., & Silva Filho, J. A. J. (2009). Desvendando os Mistérios do Coeficiente de Correlacão dePearson (r). Revista Política Hoje, 18(1), 115–146.
Galesne, A., Fensterseifer, J. E., & Lamb, R. (1999). Decisões de investimentos da empresa. São Paulo: Atlas.Gitman, L. J. (2010). Princípios de administracão financeira (Ed 12a). São Paulo: Pearson Education.Graham, J., & Harvey, C. (2001). The theory and practice of corporate finance: Evidence from the field. Journal of
Financial Economics, 60(2/3), 187–243. http://dx.doi.org/10.1016/S0304-405X(01)00044-7Hall, J., & Millard, S. (2010). Capital budgeting practices used by selected listed South African firms. South African
Journal of Economic and Management Sciences, 13, 85–97.Hartwig, F. (2012). The use of capital budgeting and cost of capital estimation methods in Swedish-listed companies. The
Journal of Applied Business Research, 28(6), 1451–1476.Hermes, N., Smid, P., & Yao, L. (2007). Capital budgeting practices: a comparative study of the
Netherlands and China. International Business Review, 16, 630–654. http://dx.doi.org/10.1016/j.ibusrev.2007.05.002
Holmén, M., & Pramborg, B. (2009). Capital budgeting and political risk: Empirical evidence. Journal of InternationalFinancial Management and Accounting, 20, 105–134. http://dx.doi.org/10.1111/j.1467-646X.2009.01028.x
Horngren, C. T., Foster, G., & Datar, S. M. (2000). Contabilidade de Custos (Ed 9a). Rio de Janeiro: LTC.Hromkovic, J. (2001). Algorithms for hard problems: Introduction to combinatorial optimization, randomization, approx-
imation, and heuristics. New York: Springer-Verlag.Jackson, S., & Sawyers, R. (2008). Managerial accounting: A focus on (5th Ed.). Mason: South Western Cengage Learning.Kalhoefer, C. (2010). Ranking of mutually exclusive investment projects – how cash flow differences can solve the ranking
problem. Investment Management and Financial Innovations, 7, 81–86.Khamees, B. A., Al-Fayoumi, N., & Al-Thuneibat, A. A. (2010). Capital budgeting practices in the Jordanian indus-
trial corporations. International Journal of Commerce and Management, 20(1), 49–63. http://dx.doi.org/10.1108/10569211011025952
Kierulff, H. (2008). MIRR: A better measure. Business Horizons, 51, 321–329. http://dx.doi.org/10.1016/j.bushor.2008.02.005
Koch, B. S., Mayper, A. G., & Wilner, N. A. (2009). The Interaction of Accountability and Post-Completion Audits onCapital Budgeting Decisions. Academy of Accounting and Financial Studies Journal, 13, 1–26.
Kwong, H. C. (1986). The sophistication of capital budgeting in Malaysian companies. Omega, 14(2), 175–181.http://dx.doi.org/10.1016/0305-0483(86)90019-8
Lam, K. C., Wang, D., & Lam, M. C. K. (2007). The capital budgeting evaluation practices (2004) of build-ing contractors in Hong Kong. International Journal of Project Management, 25, 824–834. http://dx.doi.org/10.1016/j.ijproman.2007.03.010
Lazaridis, I. T. (2004). Capital budgeting practices: A survey in the businesses of cyprus. Journal of Small BusinessManagement, 42, 427–433. http://dx.doi.org/10.1111/j.1540-627X.2004.00121.x
Lunkes, R. J., Belli, A. P., Andruchechen, J. R., & Suave, R. (2014). Práticas de orcamento de capital no setor de bensindustriais. Revista de Administracão, Contabilidade e Economia da FUNDACE, 9, 1–17.
Maquieira, C. P., Preve, L. A., & Sarria-Allende, V. (2012). Theory and practice of corporate finance: Evidence anddistinctive features in Latin America. Emerging Markets Review, 13, 118–148. http://dx.doi.org/10.1016/j.ememar.2011.11.001
Moore, J., & Weatherford, L. R. (2006). Tomada de decisão em administracão com planilhas eletrônicas (Ed 6a). PortoAlegre: Bookman.
Olawale, F., Olumuyiwa, O., & George, H. (2010). An investigation into the impact of investment appraisal techniqueson the profitability of small manufacturing firms in the Nelson Mandela Bay metropolitan area, South Africa. AfricanJournal of Business Management, 4, 1274–1280.
534 P. de Souza, R.J. Lunkes / Contaduría y Administración 61 (2016) 514–534
Peel, M. J., & Bridge, J. (1998). How planning and capital budgeting improve SME performance. Long Range Planning,31, 848–856. http://dx.doi.org/10.1016/S0024-6301(98)80021-6
Peel, M. J., & Bridge, J. (1999). Planning, business objectives and capital budgeting in Japanese, German and domesticSMEs: Some evidence from the UK manufacturing sector. Journal of Small Business and Enterprise Development,6(4), 350–365. http://dx.doi.org/10.1108/EUM0000000006690
Peterson, P., & Fabozzi, F. J. (2002). Capital budgeting: Theory and practice. Nova York: John Wiley & Sons Inc.Pike, R. H. (1982). Capital budgeting in the 1980. ICMA Occasional Paper Series.Pike, R. H. (1985). Owner-manager conflict and the role of the payback method. Accounting and Business Research,
47–52. http://dx.doi.org/10.1080/00014788.1985.9729294Pike, R. H. (1988). An empirical study of the adoption of sophisticated capital budgeting practices and
decision-making effectiveness. Accounting and Business Research, 18(72), 341–351. http://dx.doi.org/10.1080/00014788.1988.9729381
Pike, R. H. (1996). A longitudinal survey on capital budgeting practices. Journal of Business Finance and Accounting,23(1), 79–92. http://dx.doi.org/10.1111/j. 1468-5957.1996.tb00403.x
Pike, R. H., & Sharp, J. (1989). Trends in the use of management science techniques in capital budgeting. Managerialand Decision Economics, 10(2), 135–140. http://dx.doi.org/10.1002/mde.4090100208
Pinto, H. M., Ventura, C., Lunkes, R. J., & Petri, S. M. (2013). Investigacão da utilizacão dos métodos e técnicas deanálise de projetos de investimento na composicão do orcamento de capital nos bancos públicos brasileiros, Artigo,VII ANPCONT.
Ross, S. A. (2000). Princípios de administracão financeira (Ed 2a). São Paulo: Atlas.Ross, S. A., Westerfield, R. W., & Jaffe, J. F. (2004). Corporate finance (7th Ed.). New York: Mc-Graw- Hill.Ryan, P. A., & Ryan, G. P. (2002). Capital budgeting practices of Fortune 1000: How have things changed? Journal of
Business and Management, 8(4), 355–364.Sandahl, G., & Sjogren, S. (2003). Capital budgeting methods among Sweden’s largest groups of companies: The
state of the art and a comparison with earlier studies. International Journal of Production Economics, 84, 51–69.http://dx.doi.org/10.1016/S0925-5273(02)00379-1
Schall, L. D., Sundem, G. L., & Geijsbeek, J. R. W. R. (1978). Survey and analysis of capital budgeting methods. TheJournal of Finance, 33(1), 281–287. http://dx.doi.org/10.1111/j.1540-6261.1978.tb03404.x
Silva, T. L., Suave, R., & Codesso, M. M. (2013). Práticas de orcamento de capital: Um estudo com empresas de água esaneamento listadas na BM&FBOVESPA, Artigo,VII ANPCONT.
Souza, A., & Clemente, A. (2008). Decisões financeiras e análise de investimentos: fundamentos, técnicas e aplicacões(Ed 6a). São Paulo: Atlas.
Souza, P., & Lunkes, R. J. (2013). Práticas de orcamento de capital: Um estudo em empresas hoteleiras de Florianópolis(SC). Universo Contábil, 9(1), 28–45. http://dx.doi.org/10.4270/ruc.2013102
Toit, M. J., & Pienaar, A. (2005). A review of the capital budgeting behavior of large South African firms. MeditariAccountancy Research, 13, 19–27. http://dx.doi.org/10.1108/10222529200500002
Truong, G., Partington, G., & Peat, M. (2008). Cost-of-capital estimation and capital-budgeting practice in Australia.Australian Journal of Management, 33, 95–121. http://dx.doi.org/10.1002/bse.668
Viviers, S., & Cohen, H. (2011). Perspectives on capital budgeting in the South African motor manufacturing industry.Meditari Accountancy Research, 19(½), 75–93. http://dx.doi.org/10.1108/10222521111178646
White, J. B., Miles, M. P., & Munilla, L. S. (1997). An exploratory study into the adoption of capital budgeting techniquesby agricultural co-operatives. British Food Journal, 99, 128–132. http://dx.doi.org/10.1108/00070709710169067
Zanini, M., Souza, P., & Lunkes, R. J. (2013). Práticas de orcamento de capital: um estudo em empresas hoteleiras de SãoPaulo, Rio de Janeiro e Salvador. Revista Brasileira de Pesquisa em Turismo, 7(3), 436–455.
Related Documents


