Capital Budgeting Practices and Firm Performance: A Comparative Study of Australia and Sri Lanka Pratheepkanth Puwanenthiren Faculty of Business - School of Commerce Federation University Australia PO Box 663 Ballarat Victoria 3353 Australia March 2016

Welcome message from author
This document is posted to help you gain knowledge. Please leave a comment to let me know what you think about it! Share it to your friends and learn new things together.
Transcript
Capital Budgeting Practices and Firm
Performance: A Comparative Study of
Australia and Sri Lanka
Pratheepkanth Puwanenthiren
Faculty of Business - School of Commerce
Federation University Australia
PO Box 663 Ballarat Victoria 3353
Australia
March 2016
i
Capital Budgeting Practices and Firm
Performance: A Comparative Study of
Australia and Sri Lanka
Pratheepkanth Puwanenthiren
(Principal Supervisor: Dr Samanthala Hettihewa;
Associate Supervisor: Dr Gavin Hurst)
This thesis is submitted in total fulfilment of the
requirements for the degree of Doctor of Philosophy
Faculty of Business - School of Commerce
Federation University Australia
PO Box 663 Ballarat Victoria 3353
Australia
Submitted in March 2016
ii
Abstract
This thesis disentangles two elements from the complex interdependent suite of key drivers
of firm sophistication in capital-budgeting. Specifically, the relative sophistication of a firm
(i.e. its nature) and the development level of the nation in which a firm is embedded (i.e.
the nurture experienced by the firm). This research should enhance the development focus
and process of nations (e.g., to what degree should national development be about raising
the ability of individual firms or will raising national development act as a rising tide [that]
raises all boats). The comparative data used in this study comes from 150 Australian
(ASX200-index-listed) firms and 150 Sri Lankan (Colombo-stock-exchange-listed firms).
The research questions are answered via a quantitative research design that uses primary
and secondary data. The response rate to the questionnaire survey of firms was, 45 and 73
completed questionnaires from, respectively, Australia and Sri Lanka (an effective response
rate of, respectively, 31.5 and 48.7 percent). Secondary data for 2003-12 are obtained from
the ASX, CSE’s and SIRCA databases and are used to calculate return on assets, return on
equity, Tobin Q, and earnings per share for the sampled firms. It was found that Australian
firms tend to rely heavily on sophisticated capital-budgeting practices, but Sri Lankan
relatively small firms prefer simple analysis methods and the larger firms tend to be as
adept at sophisticated capital budgeting as their Australian counterparts. The choice of
whether to use more sophisticated practices or simpler alternatives varies with a firm’s
attributes as well as the level of economic and financial market development in its
environment. Also, Australian firms tend to use capital-budget models with good-to-strong
predictive power (except for ROE) and Sri Lankan firms tend to use capital-budget models
with fair-to-poor predictive power. Further, the analysis of Australian firms tends to yield
stronger and more statistically-significant results, than those generated by Sri Lankan firms.

iii
Statement of Authorship
Except where explicit reference is made in the text of the thesis, this thesis contains no
material published elsewhere or extracted in whole or in part from a thesis by which I have
qualified for or been awarded another degree or diploma. No other person’s work has been
relied on or used without due acknowledgement in the main text and references of the thesis.
Dated: March 18, 2016 Dated: March 18, 2016
Pratheepkanth Puwanenthiren Dr Samanthala Hettihewa
Candidate Principal Supervisor

iv
Acknowledgements
First and above all, I would like to express my profound gratitude to the almighty God for
his unparalleled grace, superior protection, supreme love and care and guidance throughout
the lows and highs of this long PhD journey.
First and foremost I want to thank my principal supervisor Dr Samanthala Hettihewa. It has
been an honour to be her PhD student. She has taught me (both consciously and by example)
how good Accounting and Finance research should be done. I appreciate her contributions
of time and ideas, to make my PhD experience productive and stimulating. Especially, she
has always supported me and helped me feel at home here. Her wonderful guidance has
been truly valuable in the progress of this research. I am indebted to her knowledge and
inspiration and have learned so much from her.
I would like to convey my gratitude to my associate supervisor Dr Gavin Hurst for helping
me to develop my research and providing constant assistance, guidance, personal support
and care. I sincerely appreciate his great support.
I would like to express my profound gratitude to Professor Christopher S. Wright, for his
continuous support, stimulating encouragement and valuable suggestions. Especially, he
encouraged and supported me to publish my articles and, also, to attend various domestic
and international conferences. I am truly blessed for his invaluable contextual insights.
I gratefully acknowledge the funding source that made my PhD work possible. I was funded
by the Federation University Australia. I would, also, like to thank research services for
their generous support. Especially, I thank Dr Rob Watson, Dr Janis Webb and Associate
Professor Jim Sillitoe for their unlimited academic support and direction to my PhD

v
journey. I would, also, like to thank the other faculties and departments at Federation
University Australia for their generous support.
I would like to express gratitude to Sarah Murphy, Joanne Benyon, Leona Pike, Debra
Rogers and other staff members in the Federation Business School at Federation University
Australia for their invaluable contribution to the success of this thesis.
My special thanks to all my wonderful friends in Australia; especially, Alan Labas, Evans
Sokro, Josephine Moeti-Lysson, Mohammad Yousuf, Lynda Andeobu, Parisa Salimzadeh
and Rudolph Boy for their endless emotional support and kindness during my study in
Australia; who were always there for me when I needed them.
Last but not least, a special, unique, reverent thanks to my lovely parents, who (in every
aspect of my life) have been understanding and supportive in every moment of my life and
throughout my studying in Australia. When it comes to expressing my debt to my parents,
words fail me. They have given me everything in my life.

vi
Dedication
This thesis is dedicated to my parents (Mr. A. Puwanenthiren, Director of Education
(retired), Jaffna, Sri Lanka and Mrs. A. Puwanenthiren, Teacher (retired), Jaffna, Sri Lanka),
whose love and devotion made everything possible.
vii
Research Outcomes Produced in Connection with this Thesis
Refereed Journal Publications (ABDC Ranked)
1) Pratheepkanth, P., Hettihewa, S., and Wright, C. S. (2015). Capital Budgeting
Practices in Australia and Sri Lanka: A comparative Study. Global Review Journal
of Accounting and Finance, 6(2), 16-30.
2) Pratheepkanth, P., Hettihewa, S., and Wright, C. S. (2016). Corporate Governance
and Financial Performance: The Case of Australia and Sri Lanka. Global Review
Journal of Accounting and Finance, 7(1), 1-12
3) Pratheepkanth, P., Hettihewa, S., and Wright, C. S. (2016). National-Development-
Level Effects on Capital-Budgeting Practices Comparative Study of Nature vs.
Nurture. Accounting & Finance. (Provisionally Accepted)
4) Pratheepkanth, P., Hettihewa, S., and Wright, C. S. (2016). Capital Budgeting, Cost
of Capital and Firm Performance in a Developed Country’s Firms Juxtaposed with
Equivalent Firms in an Emerging Country. Australian Accounting Review. (Under
Review)
viii
Peer-Reviewed International Conferences
1) Pratheepkanth, P., Hettihewa, S., and Wright, C. S. (2014). Capital Budgeting
Practices in Developed and Emerging countries: Divergent or Convergent?
International Business Research Conference (November 24-25) (1-17). Novotel
Hotel, Sydney, Australia: World Business Institute.
2) Pratheepkanth, P., Hettihewa, S., and Wright, C. S. (2014). Capital Budgeting
Practices and Firm Performance: A Comparative Study of Australia and Sri Lanka.
Federation University Australia's Annual Research Conference (November 6) (8).
Mt Helen, Ballarat, Australia: Federation University Australia.
3) Pratheepkanth, P., Hettihewa, S., and Wright, C. S. (2015). Effects of Board
Structure on Firm Performance: A comparison between Australia and Sri Lanka.
4th Global Business and Finance Research Conference (May 25-27) (1-10).
Marriott Hotel, Melbourne, Australia: World Business Institute.
4) Pratheepkanth, P., Hettihewa, S., and Wright, C. S. (2015). Corporate capital
budgeting practices: The Relative Influence of the Nature of the Firm and National-
Development Level. AFAANZ Conference (July 5-7). Hotel Grand Chancellor,
Hobart, Tasmania: Accounting and Finance Association of Australia and New
Zealand .
5) Pratheepkanth, P., Hettihewa, S., and Wright, C. S. (2016). Development Level,
Capital Budgeting Techniques, Cost of Capital and Firm Performance: From a
Developed and Emerging Country Perspective. 2nd International Conference on
Business Management and Economics (19-20th February). Galle Face Hotel,
Colombo, Sri Lanka.
6) Pratheepkanth, P., Hettihewa, S., and Wright, C. S. (2016). Capital Budgeting
Practices in Developed and Developing Countries Context: Theoretical Perspective.
Working Paper, Federation University Australia.
ix
Table of Contents
Abstract .................................................................................................................... ii
Statement of Authorship ........................................................................................ iii
Acknowledgements ................................................................................................. iv
Dedication ............................................................................................................... vi
Research Outcomes Produced in Connection with this Thesis ............................ vii
Table of Contents .................................................................................................... ix
List of Figures ....................................................................................................... xiv
List of Tables ...........................................................................................................xv
List of Abbreviations ........................................................................................... xvii
Chapter One: Introduction ..................................................................................... 1
1.1 Capital Budgeting and Performance ................................................................... 1
1.2 Research Background .......................................................................................... 4
1.3 Research Questions .............................................................................................. 6
1.4 Objectives of this Research ................................................................................. 7
1.5 Motivation for the Research ................................................................................ 8
1.6 Research Approach and Methods ....................................................................... 9
1.7 Significance and Contribution of this Thesis .................................................. 10
1.7.1 Academic Contribution .............................................................................. 10
1.7.2 Practical Contribution ................................................................................ 11
1.8 Structure of this Thesis ...................................................................................... 12
1.9 Chapter Summary .............................................................................................. 13
Chapter Two: Theoretical Considerations and Literature Review ......................14
2.1 Chapter Introduction .......................................................................................... 14
2.2 Capital Budgeting .............................................................................................. 15
2.2.1 Classification of Investments..................................................................... 18
2.2.2 The Importance of Capital Budgeting ....................................................... 19
2.3 Theoretical Constructs and Capital Budgeting ................................................ 21
2.3.1 Contingency Theory in the Context of Capital Budgeting ...................... 21
2.4 Capital Budgeting Process ................................................................................ 23
2.3.1 Empirical Evidence on Capital Budgeting Processes .............................. 26
x
2.4.2 Agency Costs and Asymmetric Information in Capital Budgeting ........ 28
2.5 The Application of Capital Budgeting Appraisal Techniques........................ 30
2.5.1 Capital Budgeting Techniques ................................................................... 30
2.5.2 Empirical Evidence on Capital Budgeting Techniques ........................... 32
2.5.3 Risk Assessment of Capital Budgeting ..................................................... 54
2.6 Proper Use of and Pitfalls in Discounted Cash flow ....................................... 56
2.6.1 Cash Flow Estimation ................................................................................ 56
2.6.2 Cost of Capital ............................................................................................ 58
2.7 Contingent Variables and Capital Budgeting .................................................. 61
2.8 Capital Budgeting and Firm Performance........................................................ 64
2.9 Conceptual Framework ...................................................................................... 65
2.10 Research Gap and Contribution to the Literature ............................................ 66
2.11 Chapter Summary .............................................................................................. 67
Chapter Three: Economic, Financial Situation and Development of Capital
Markets in Australia and Sri Lanka ......................................................................69
3.1 Chapter Introduction .......................................................................................... 69
3.2 Australia at a Glance.......................................................................................... 69
3.2.1 An Overview of Social Environments in Australia ................................. 72
3.2.2 An Overview of Economic Environments in Australia ........................... 73
3.2.3 Australian Financial Markets ..................................................................... 74
3.3 Sri Lanka at a Glance......................................................................................... 76
3.3.1 An Overview of the Social Environment in Sri Lanka ............................ 79
3.3.2 An Overview of Economic Environments in Sri Lanka .......................... 79
3.3.3 Sri Lankan Financial Markets .................................................................... 80
3.4 Chapter Summary .............................................................................................. 83
Chapter Four: Research Approach and Methods .................................................85
4.1 Chapter Introduction .......................................................................................... 85
4.2 Research Paradigm............................................................................................. 86
4.2.1 Research Approach ..................................................................................... 89
4.3 Research Methods .............................................................................................. 92
4.3.1 Research Design ......................................................................................... 92
4.3.2 Population Design....................................................................................... 92
xi
4.3.3 Data Collection ........................................................................................... 93
4.4 Variable Measurement ....................................................................................... 95
4.4.1 Capital Budgeting Practices (CB Practices) ............................................. 95
4.4.2 Firm Performance ....................................................................................... 99
4.5 Hypotheses Development ................................................................................ 101
4.6 Empirical Analysis ........................................................................................... 102
4.6.1 Descriptive Statistics ................................................................................ 103
4.6.2 Correlation Coefficient ............................................................................ 103
4.6.3 Multiple Regression Analysis .................................................................. 104
4.6.4 Analysis of Variance (ANOVA) ............................................................. 105
4.6.5 Independent Samples t-Test ..................................................................... 106
4.7 Ethical Considerations ..................................................................................... 106
4.8 Chapter Summary ............................................................................................ 107
Chapter Five: Analysis and Results ..................................................................... 108
5.1 Chapter Introduction ........................................................................................ 108
5.2 Questionnaire Survey Results ......................................................................... 108
5.2.1 Questionnaire Response ........................................................................... 108
5.2.2 Participants’ Attributes ............................................................................ 109
5.2.3 Firm Attributes .......................................................................................... 113
5.2.4 Corporate Management Attributes .......................................................... 115
5.3 Reliability Analysis ......................................................................................... 118
5.4 Descriptive Analysis: Capital Budgeting Practices ....................................... 118
5.4.1 Long-term Strategic Planning .................................................................. 118
5.4.2 Search for Investment Opportunities ...................................................... 121
5.4.3 Review and Screening .............................................................................. 124
5.4.4 Capital Budgeting Analysis Methods...................................................... 127
5.4.5 Accept/Reject Decision ............................................................................ 132
5.4.6 Implementation ......................................................................................... 134
5.4.7 Expenditure Control and Monitoring ...................................................... 136
5.4.8 Post-audit ................................................................................................... 138
5.5 Cross-Classification of the Survey Results .................................................... 140
5.5.1 Long-term Strategic Planning .................................................................. 140
5.5.2 Search for Investment Opportunities ...................................................... 147
xii
5.5.3 Review and Screening .............................................................................. 154
5.5.4 Accept/Reject Decision ............................................................................ 161
5.5.5 Capital Budgeting Techniques ................................................................. 168
5.5.6 Risk Assessment Techniques ................................................................... 174
5.5.7 Cost of Capital .......................................................................................... 179
5.5.8 Techniques Guide to Long-term-Investment Decision .......................... 184
5.5.9 Implementation ......................................................................................... 188
5.5.10 Expenditure Control and Monitoring .................................................. 195
5.5.11 Post-audit ............................................................................................... 202
5.6 Inferential Analysis .......................................................................................... 209
5.6.1 Independent Samples t-Test ..................................................................... 209
5.6.2 One – Way Analysis of Variance (ANOVA) ......................................... 212
5.6.3 Correlation Analysis ................................................................................. 218
5.6.4 Multiple Regression Analysis .................................................................. 221
5.7 Chapter Summary ............................................................................................ 224
Chapter Six: Findings and Discussion ................................................................. 225
6.1 Chapter Introduction ........................................................................................ 225
6.2 Capital Budgeting Practices in Australia and Sri Lanka ............................... 226
6.2.1 The H1- Hypothesis .................................................................................. 226
6.2.2 The H1a- Sub-Hypothesis ......................................................................... 227
6.2.3 The H1b- Sub-Hypothesis ......................................................................... 228
6.2.4 The H1c- Sub-Hypothesis ......................................................................... 229
6.2.5 The H2- Hypothesis .................................................................................. 230
6.2.6 The H2a- Sub-Hypothesis ......................................................................... 231
6.2.7 The H2b- Sub-Hypothesis ......................................................................... 232
6.3 Chapter Summary ............................................................................................ 233
Chapter Seven: Conclusions, Implications and Future Research Directions .... 234
7.1 Chapter Introduction ........................................................................................ 234
7.2 Findings related to Research Questions ......................................................... 235
7.2.1 Research Question 1 ................................................................................. 235
7.2.2 Research Question 2 ................................................................................. 241
7.3 Implications of the Study ................................................................................ 243
7.4 Contribution of the Study ................................................................................ 245

xiii
7.5 Limitations of the Study .................................................................................. 247
7.6 Recommendations for Future Research ......................................................... 248
7.7 Chapter Summary ............................................................................................ 249
References ............................................................................................................. 250
Appendices ............................................................................................................ 277
Appendix A: Plain Language Statement.............................................................. 277
Appendix B: A Survey Questionnaire .................................................................. 279
Appendix C: HREC Approval ............................................................................. 290
Appendix D: Publication Synopsises ................................................................... 291
xiv
List of Figures
Figure 2.1- Contingent Variable and Capital Budgeting ................................................... 65
Figure 2.2- Conceptual Framework: Capital Budgeting Practices and Firm Performance .......... 66
Figure 4.1- Research Approach ......................................................................................... 89
Figure 4.2- Logic Flows Through and Between Inductive and Deductive Reasoning ...... 91
Figure 5.1- Questionnaire Respondent’s Position in their Firm ...................................... 110
Figure 5.2- Gender of the Questionnaire Respondent...................................................... 110
Figure 5.3- Questionnaire Respondent’s Education Background .................................... 111
Figure 5.4- Questionnaire Respondent’s Age Group ....................................................... 112
Figure 5.5- Questionnaire Respondent’s Experience ....................................................... 112
Figure 5.6- Industrial Sectors of Responding Firms ........................................................ 113
Figure 5.7- Number of Employees in Responding Firms ................................................ 114
Figure 5.8- Share of Income Earned in the Domestic Market – Responding Firms ........ 114
Figure 5.9- Ownership of Responding Firms .................................................................. 115
xv
List of Tables
Table 2.1- Capital Budgeting Appraisal Techniques in Developed Countries .................. 44
Table 2.2- Capital Budgeting Appraisal Techniques in Emerging Countries.................... 53
Table 3.1- Economic and Social Statistics of Australia (2004-12) .................................... 71
Table 3.2- Economic and Social Statistics of Sri Lanka (2004-12) ................................... 78
Table 4.1 -Participating Firms ........................................................................................... 93
Table 4.2- Weights for Capital Budgeting Activities ........................................................ 97
Table 4.3- Dummy Variables Used to Study Firm Attributes. .......................................... 98
Table 4.4- Use of Dummy Variables for Mangers’ Attributes. ......................................... 99
Table 5.1- Questionnaire Response ................................................................................. 109
Table 5.2- Overall Risk Situation .................................................................................... 115
Table 5.3- Risk Factors .................................................................................................... 117
Table 5.4- Firms’ Corporate Objective ............................................................................ 117
Table 5.5- Importance of Stakeholders ............................................................................ 117
Table 5.6 - Reliability Statistics ....................................................................................... 118
Table 5.7- Survey Question# B1: Long-term Strategic Planning .................................... 120
Table 5.8- Survey Question # B2: Search for Investment Opportunities ........................ 123
Table 5.9-Survey Question # B3: Review and Screening ................................................ 126
Table 5.10- Survey Question # B4-B8: Capital Budgeting Analysis Methods ............... 130
Table 5.11- Survey Question # B9: Accept and Reject Decision .................................... 133
Table 5.12-Survey Question # B10: Implementation ...................................................... 135
Table 5.13- Survey Question # B11: Expenditure Control and Monitoring .................... 137
Table 5.14-Survey Question # B12: Post-audit ............................................................... 139
Table 5.15-Long-term Strategic Planning vs. Firm and Its Respondent’s Attributes ...... 142
Table 5.16-Search for Investment Opportunities vs. Firm and Its Respondent’s Attributes ..... 149
xvi
Table 5.17- Review and Screening vs. Firm and Its Respondent’s Attributes ................ 156
Table 5.18-Accept/Reject Decisions vs. Firm and Its Respondent’s Attributes .............. 163
Table 5.19-Capital Budgeting Techniques vs. Firm and Its Respondent’s Attributes ..... 170
Table 5.20-Risk Assessment Techniques vs. Firm and Its Respondent’s Attributes ....... 176
Table 5.21- Cost of Capital vs. Firm and Its Respondent’s Attributes ............................ 181
Table 5.22-Guide Long-term Investment Decision vs. Firm and Its Respondent’s Attributes .. 185
Table 5.23-Implementation vs. Firm and Its Respondent’s Attributes ............................ 190
Table 5.24-Expenditure Control and Monitoring vs. Firm and Respondent’s Attributes 197
Table 5.25-Post-audit vs. Firm and Its Respondent’s Attributes ..................................... 204
Table 5.26- Capital Budgeting Process vs. Country, Gender and Ownership ................. 209
Table 5.27- Capital Budgeting Techniques vs. Country, Gender and Ownership ........... 210
Table 5.28- Risk Assessment Techniques vs. Country, Gender and Ownership ............. 211
Table 5.29- Cost of Capital vs. Country, Gender and Ownership ................................... 211
Table 5.30- Guide Investment vs. Country, Gender and Ownership ............................... 212
Table 5.31- Capital Budgeting Processes vs. Firm and Its Respondent’s Attributes ...... 214
Table 5.32- Capital Budgeting Techniques vs. Firm and Respondent Attributes ........... 217
Table 5.33- Risk Assessment Techniques vs. Firm and Respondent Attributes ............. 217
Table 5.34- Cost of Capital vs. Firm and Respondent Attributes .................................... 217
Table 5.35- Investment Guide vs. Firm and Respondent Attributes ................................ 218
Table 5.36- Correlation Analysis ..................................................................................... 220
Table 5.37- Predictors of ROA, ROE, EPS and TQ – Model summary (Australia) ....... 221
Table 5.38- Coefficients for predictors of ROA, ROE, EPS and TQ (Australia) ............ 222
Table 5.39- Predictors of ROA, ROE, EPS and TQ – Model summary (Sri Lanka) ...... 223
Table 5.40 - Coefficients for predictors of ROA, ROE, EPS and TQ (Sri Lanka) .......... 224
Table 6.1- The CB Processes and Techniques Affected by Respondent and Firm Attributes ... 229

xvii
List of Abbreviations
Abbreviations Title
ARR Accounting Rate of Return
ASX Australian Securities Exchange
ATS Automated Trading System
CAPM Capital Asset Pricing Model
CB Capital Budgeting
CBA Colombo Brokers Association
CBP Capital Budgeting Process
CDS Central Depository System
CEE Central and Eastern Europe
CFO Chief Financial Officer
CPI Corruption Perceptions Index
CSBA Colombo Share Brokers Association
CSE Colombo Stock Exchange
CSR Corporate Social Responsibility
DCF Discounted Cash Flow
EBIT Earnings before Interest and Tax
EPS Earnings per Share
FA Firms’ Attributes
GDP Gross Domestic Product
GFC Global Financial Crises
GT Game Theory
HREC Human Research Ethics Committee

xviii
IRR Internal Rate of Return
MA Managers’ Attributes
NDCF Non-Discounted Cash Flow
NPV Net Present Value
ORR Operating Rate of Return
PBP Payback Period
PPE Property, Plant and Equipment
RO Real Option
ROA Return on Assets
ROE Return on Equity
SAFE South Asian Federation of Exchanges
SEC Securities and Exchange Commission of Sri Lanka
TQ Tobin’s Q
UNDP United Nations development programme
WACC Weighted Average Cost of Capital
WFE World Federation of Exchange

1
Chapter One: Introduction
1.1 Capital Budgeting and Performance
The objective of firm has evolved in response to the corporate social responsibility (CSR)
debate, which goes back to 1950s. The traditional theory of the firm over relied on the now
disputed goal of maximising shareholder wealth. Hettihewa (2016), in discussing this
corporate shift in objectives, noted that the debate over whether firms should focus on
producing economic goods and profits or serve an array of broader social goals. Bowen
(1953) was part of a vanguard that shifted the Theory of the Firm to shareholder theory and
from there to stakeholder theory (Freeman, 1994). The current Theory of the Firm posits
that firms maximise their value by making decisions to maximise the wealth of their
stakeholders 1 (Frino, Hill, & Chen, 2013; Gervais, Heaton, & Odean, 2012; Graham,
Harvey, & Puri, 2015; Hamzah & Zulkafli, 2014; Kalyebara & Islam, 2014). Capital
budgeting (CB), a key input to achieving that goal, is the rational allocation of limited
capital across a plethora of viable prospective investment. In its simplest form financial
management is the acquisition and use of cash by firms to purchase real assets to generate
cash flows that provide a return to stakeholders. A significant part of the process involves
finance managers2 seeking answers to three critical decisions (Bhat, 2008; Dayananda,
Irons, Harrison, Herbohn, & Rowland, 2002; Khan & Jain, 2007; Pindado & Chabela,
2006):
i. The “Investment Decision” is concerned with the choice of assets selected from a
range of possibilities (Petrović, Radović, & Stanković, 2013). To help determine
how much to invest and what to invest in, financial managers generally employ
1 Stakeholders are groups such as shareholders, employees, customers, suppliers, creditors and others who
have a direct economic link to the firm. 2 A finance manager organises and manages firms’ financial portfolio.
2
certain investment evaluation tools within the CB process to help make these
decisions (Baldenius, 2003; Basu & Drew, 2010; Doumpos & Zopounidis, 2014;
Verbeeten, 2006).
ii. The “Financing Decision” is associated with the flow of funds from capital
markets to the corporation and how financial managers make choices between the
use of debt and equity in financing investment projects and opportunities.
(Agrawal & Mandelker, 1987; Donkor & Duffey, 2013; Elsas, Flannery, &
Garfinkel, 2014; Jackson, Keune, & Salzsieder, 2013).
iii. The “Dividend Decision” is concerned with the disposal of profits. How much of
the profits should be returned to owners and what proportion should be retained
to enable future growth (Azhagaiah & Sabari, 2008; Franc-Dabrowska, 2009;
Gugler, 2003).
In this context, decisions made by financial managers are linked by the cash flow identity
(investing decisions–spending money; financing decisions–raising money; and dividend
decisions–distributing money) which restricts their degree of freedom in making financial
decisions. These decisions are key to the survival of firms, can interact with options, and
are greatly influenced by CB; where CB is defined as the practice of analysing investment
opportunities in long-term assets which are expected to harvest benefits for more than one
year (Archer, Choate, & Racette, 1979; Correia, Mayall, O'Grady, & Pang, 2005; Gitman,
Juchau, Flanagan, Pearson, & Clemens, 1998; Hornstein, 2013; Petty et al., 1996; Peterson
& Fabozzi, 2002; Scott, Martin, Petty, & Known, 1988; Schlegel, Frank, & Britzelmaier,
2016). Al-Ajmi, Al-Saleh, and Hussain (2011), also, suggest that CB is the process of
determining which investments will maximise stakeholders wealth. Traditionally, CB
methods have been used to assess and justify advanced manufacturing technology (Ireland,
Hoskisson, & Hitt, 2011; Periasamy, 2013; Proctor & Canada, 1992). In this respect, CB is
the process of analysing opportunities and deciding whether funds should be contributed to
an investment or not (Gurnani, 1984; Hastie, 1998; King, 1975). The fundamental goal of
3
the firm is considered to be maximisation of value, which is generally accepted as the only
rational basis for making CB decisions (Baldenius, Dutta, & Reichelstein, 2007; Hermes,
Smid, & Yao, 2007; Mendes-Da-Silva & Saito, 2014; Slagmulde, Bruggemana, &
Wassenhaveb, 1995).
CB practices are vital to a firm’s success and presents in four distinct manners (Andor,
Mohanty, & Toth, 2015; Baker & Powell, 2005; Boudreaux, Rao, & Das, 2014; Dayananda
et al., 2002; Duchin & Sosyura, 2013; Idowu, 2011; Wnuk-Pel, 2014). First, capital
expenditure typically involves large amount of funds; Second, firms must establish the best
way to raise and repay these funds; Third, most CB decisions need a long-term
commitment; and Fourth, capital scheduling decisions are critical (Atrill, 2012; Brigham,
1992).
Farragher, Kleiman, and Sathu (1999) assert that the effective allocation of scarce resources
is a key part of long-term success. Arnold and Hatzopoulos (2000) suggest that the effective
allocation of scarce resources can be best achieved through a CB process. Such a process
will increase firm performance in making ethical investment decisions by assisting to
confirm that a corporate strategy is followed; that all investment opportunities are
considered and that unplanned/unjustified decision making is minimised. Particularly,
precise and consistent CB is required by firms if they wish to grow, remain competitive and
optimise the worth of the firm (Fatoki, Okubena, & Herbst, 2010).
In practice, finance managers are responsible for increasing firm performance (Daunfeldt
& Hartwig, 2014). Finance managers who find applicable and appropriate capital
investments and, as a result, minimise the cost of finance and maximise the firm’s value,
are rewarded. Strategic management and organisational theory tend to emphasise firm
performance measurements. Performance measures are generally identified and quantified
4
by using accounting data or via the use of certain market measures (Anthony & Ramesh,
1992; Ittner, Larcker, & Randall, 2003; Lambert & Larcker, 1987; Mohana, 2011;
Whittington, 1971). Accounting measures use financial ratios from financial statements in
an attempt to assess how well corporate managers use resources to generate accounting
returns (Anderson & Reeb, 2003; Neely, 2002). Market returns, on the other hand, represent
key measures of performance as they ascertain fluctuations or volatilities that have occurred
throughout the year, particularly whether a stock has improved or fallen in value
(Lilienfeld-Toal & Ruenzi, 2014; Louis, 2004). Market returns, also, consider future
expectations.
Earlier research on the association between CB and performance mostly focused on either
accounting or market information in measuring firm performance (Farragher, Kleiman, &
Sathu, 2001; Haka, 1987; Kim, 1981; Klammer, 1973). Given the strong link between
finance theories (where CB practices seek to maximise firm performance) and stakeholder
wealth maximisation (Beranek, 1975; Grinyer, 1986; Hamzah & Zulkafli, 2014; Woods &
Randall, 1989), good CB practices play a vital role in enhancing firm performance (Vadeei,
Mahmoudi, & Saeid, 2012). Thus, improving/(degrading) firm CB practices can create and
perpetuate a virtuous/(vicious) cycle of rising/(falling) firm and national performance.
1.2 Research Background
Prior studies on the practice of CB in many countries have revealed that firms are
progressively employing more and more refined CB techniques for making investment
decisions (De Andrés, De Fuente, & San Martín, 2015; Farragher et al., 2001; Mooi &
Mustapha, 2001; Klammer, 1973; Klammer & Walker, 1984; Rossi, 2015; Ruhan, 1998;
Schlegel et al., 2016). In addition research into the relationship between CB and
performance has also been frequently conducted in previous years (Farragher et al., 2001;
5
Haka, Lawrence, & George, 1985; Kim, 1981; Pike, 1984). The studies conducted in this
area, have been inconclusive (i.e. mixed results). The mixed outcomes of that research
suggest that a significant gap exists in understanding the nature, intensity and direction of
the relationship between CB practices and firm performance.
This study focuses on the CB practices in two countries at two different stages of economic
development; developed 3 and emerging 4 economies. Although previous research has
scrutinised CB practices, this is one of only a few studies using a comparative approach
(Andor et al., 2015; Brounen, De Jong, & Koedijk, 2004; Graham & Harvey, 2001; Hermes
et al., 2007; Payne, Heath, and Gale, 1999; Peel, 1999) to contrast national development
level with CB choices and firm performance.
This study investigates whether CB practices differ significantly between Australia and Sri
Lanka in terms of firm performance. Australia is a typical example of a developed economy
and albeit in the world arena it is often considered a small open economy, its business
practices are well respected. Further reasons for considering Australia included its ability
to weather the Global Financial Crisis (GFC); its ability to continuously improve its capital
markets through regulations, whilst at the same time maintaining high corporate ethical
standards.
Although Sri Lanka is an emerging economy it is still considered developing. Since the
conclusion of the civil war in 2009, Sri Lanka has witnessed considerable economic
progress despite some ongoing political issues. Post war recovery reform of the financial
system has been pivotal in accelerating economic growth, with Sri Lanka recently adopting
several economic reforms (e.g., infrastructure development, deregulation and fostering
3 An effective rate of industrialisation and per capita income is known as developed country. 4 A slow rate of industrialisation and low per capita income is known as emerging country.
6
integration into international markets). As a result, long-term investment has increased
significantly, as have the range of CB techniques being used by firms.
This study will compare the CB practices of both Australian and Sri Lankan firms in order
to provide insights and evidence of the use of differing investment analysis, techniques and
tools to help managers determine the most appropriate CB portfolio that will help maximise
firm wealth. Particularly, how CB practices impact on firm performance in developed and
developing economies. Moreover, this study would hopefully benefit academics,
researchers, policy-makers and practitioners of both countries and other similar countries
through exploring the impact of CB practices on firm performance, and pursuing strategies
to improve the current status of it.
1.3 Research Questions
In addressing the research gap discussed in Chapter 2, this study uses the following
research questions to develop insight into the managerial use of various CB practices:
a. What are the significant differences between Australian and Sri Lankan firms relating
to their CB practices?
i. What are the CB applications and techniques currently being practiced in
Australian and Sri Lankan listed firms?
ii. What similarities and differences exist in CB practices across industries?
iii. Do the firm and CFO5 attributes influence the choice of CB practice?
b. What is the empirical association between CB practices employed and firm
performance within Australian and Sri Lankan listed firms?
i. What is the impact of CB practices on the performance of these firms?
5 As it would have been too restricting to ask for only the CFO or CEO to respond, the respondent is used as
a proxy for the CFO/CEO. As noted in Figure 5.1, the majority of respondents are the CFO and in the rest,
the vast majority are CEOs, Directors or Senior Executives.
7
1.4 Objectives of this Research
This research seeks to attain the following objectives, to:
i. Analyse CB practices employed by firms in a comparative sense to see whether CB
practices vary significantly between Australian and Sri Lankan firms and whether these
variances can be explained by differences attributed to different stages of economic
progress.
ii. Identify the processes and evaluation techniques employed by finance managers in
their CB practices and whether these practices incorporate sufficient sophistication
capable of sustaining stakeholders’ wealth maximisation and delivering a competitive
advantage.
iii. Examine similarities and differences in the CB practices among industries, so as to
provide useful insights into CB processes and techniques by comparing industrial
sectors in both a developed and an emerging economy.
iv. Examine the extent to which firm attributes and finance managers’ attributes impact
on the CB practices employed and also provide insight into corporate and managerial
views on capital investment selection practices and issues.
v. Investigate the relationship between CB practices and firm performance using both
accounting and market measures with the aim to shed light on the processes and
evaluation techniques employed in CB practices that most influence firm performance
and enhance the efficiency of financial management operations.
vi. Examine the long-term impact of CB practices on firm performance and corporate
finance practices and how this differs according to different stages of economic
development.
This study seeks to highlight the impact of CB practices on firm performance in two
countries at different stages of economic development. Disparities may exist in the level of
sophistication of the CB practices applied depending on the level of development.
Consequently this study seeks to reveal the level, scope and significance of these disparities
and their effect on firm performance. The aim is to provide a useful investigation into the
8
choice and usage of CB practices and to determine if and how they are applied differently
within developed and emerging markets.
1.5 Motivation for the Research
A comparative study of the CB practices employed by both Australian and Sri Lankan firms
and its influence on firm performance was chosen for the following reasons:
i. CB encompasses making investment decisions concerning the financing of capital
investments by firms. Making a strong investment decision is vital because
resources are scarce and the investment is expected to add to the value of the firm.
Also, efficient firms are a cornerstone of an efficient and effective national
economy.
ii. Comparing the CB practises of Sri Lankan firms to those of Australian firms
should provide valuable insights into corporate views on CB practices and firm
performance given the very different economic environments they inhabit.
iii. Sri Lanka is an emerging country of 20.5 million people with a rapidly growing
economy with ongoing economic reforms aimed at regenerating and re-integrating
the economy into international markets which is accompanied by and a mid to high
level of corruption (e.g., its Corruption Perceptions index (CPI) is 38/100, where
100 is no corruption; Transparency International, 2014). With the end to the 30
year ethnic conflict in 2009, the country has a significant opportunity to take
advantage of its peacetime stability, geography, educated workforce and scenic
beauty. The Sri Lankan government has set determined objectives for economic
and human development. With a relatively open investment environment and
financial system, accompanied by a moderately stable monetary policy and a
refining of infrastructure and emerging domestic firms, Sri Lanka has many of the
elements to progress economically. However, Sri Lankan firms still face
significant challenges in their choice of investment opportunities with many firms
making less-than-optimal CB decisions with long-term detrimental consequences.
iv. Australia is a developed nation of approximately 24 million people boasting a
relatively small open economy with institutions capable of weathering crises such
9
as the GFC and where business practices and regulation are respected (e.g., its CPI
is 80/100). Australia has sustained a policy of market openness with full
integration of its markets to international competition with the Australian
Securities Exchange (ASX) being the largest stock exchange in the Australasian
market in terms of market capitalisation. This has delivered significant benefits,
particularly its economic integration within rapidly growing Asian markets which
sees two-thirds of Australia’s trade within the Asia-Pacific region. The Australian
financial system consists of a number of intricate networks and institutions that
facilitate the flow of funds to and from the various sectors of the domestic and
global economy.
v. There is dearth of literature on the effects of developed and emerging-country
economies on CB and its effect on firm performance. In addition, many prior
studies concentrated on CB techniques and applications in different countries
based on purely descriptive statistics. To the best of the researcher’s knowledge,
this research is the first attempt to investigate CB practices on firm performance
in Australia and Sri Lanka.
1.6 Research Approach and Methods
This study lies within the positivism paradigm and adopts a quantitative approach. As
detailed in Chapter 4 (Research Approach and Methods), this study was conducted in two
phases. In phase one, there was a structured questionnaire survey to discover the CB
practices in the context of Australia and Sri Lanka, as an example of a developed and an
emerging market. The findings of this phase provide answers to key research question one,
in line with study objectives one to four. The findings of this phase also provide substantial
evidence on current CB practices among finance managers in Australia and Sri Lanka.
Phase two of this research empirically examines the impact of CB practices on firm
performance and links phase one primary data with secondary data derived from the annual
financial reports of selected firms during the period of 2003-12, using the ASX, CSE’s and
10
SIRCA databases. The findings of this phase provide answers to key research question two
that match research objectives five and six respectively. The results of this phase bridge the
gap in the literature associated with the CB practices and firm performance in a developed
and an emerging market context.
The research approach and methods used in this study are focused on discovering and
enhancing the understanding of CB practices and firm performance in terms of accounting
and market measures in both settings of a developed country like Australia and an emerging
country like Sri Lanka.
1.7 Significance and Contribution of this Thesis
This study has theoretical and practical contributions. Specifically, existing literature has
addressed the association between CB practices and firm performance (Al Mutairi,
Hasan, & Risik, 2011; Farragher et al., 2001; Klammer, 1973: Kim, 1981; Pike, 1984;
Tayles, Pike, & Sofian, 2007). However, the comparative CB choices and their effect on
firm performance are, for Australian and Sri Lankan firms, little researched. This research
will contribute to knowledge by enhancing:
1.7.1 Academic Contribution
i. Scarce research on CB practices and their effect on firm performance that were
carried out in the context of firms operating in emerging and developed economic
environments.
ii. Earlier research on firms in developed environments concentrated on developed
countries such as the US, UK, Australia, Germany and Canada. These studies
focused mostly on the application and enhancement of CB evaluating techniques.
There are only a few studies in Australia focusing on the association between CB
practices and firm performance.
11
iii. Previous research on emerging markets that was conducted in countries such as
Indonesia, Malaysia, India, Singapore and China which are in the higher stratum of
economic performance. Sri Lanka is an emerging country in South Asia with
strategic geographical and economic significance. Due to the decades of internal
political disturbance the economy had not been able to progress to its full potential.
As the internal political climate has been favourable for after the conclusion of the
war, Sri Lanka is now experiencing a high potential environment for development.
Consequently, it is important to understand how CB practices impact on firm
performance in such an emerging market.
iv. This study analyses CB practices and firm performance in a comparative
perspective to see whether country differences matter and in doing so will
investigate whether CB practices differ significantly between Australian and Sri
Lankan firms.
v. Extant literature reveals that industrial sectors were investigated separately in
different countries albeit the failed to investigate the use of different CB practices
across industries. This research improves the literature by investigating whether CB
practices differ across Australian and Sri Lankan firms, by industry groupings.
1.7.2 Practical Contribution
i. Australia is a developed country with strong trade and cultural links with the
developing and emerging countries of Asia. In contrast, Sri Lanka has recently
experienced rapid economic growth after emerging from decades of civil war. Sri
Lanka is still an emerging country with gaps in its development and market
regulations. Therefore, this study considers the similarities and differences in CB
practice in Australian and Sri Lankan firms. The findings provide insights on CB
practices that will help finance mangers in both country to determine the most
appropriate use of investment analysis, techniques and risk models. Particularly,
how environmental differences in developed and emerging economies affect CB
choices and, as a result, influence firm performance.
ii. Also, benefits of this research should flow to investors, decision makers and
researchers and assist policy makers in their design of best CB practices. Moreover
it offers both a useful tool and new platform for future researchers when assessing
CB practices and firm performance in developed and emerging countries.
12
Overall the contribution of this research rests on its provision of a comparison between
economies of different economic development in terms of CB practice and its update of
existing literature in this area.
1.8 Structure of this Thesis
This thesis is presented in seven chapters. The structure and content of each chapter is:
Chapter 1
Introduces the research topic, motivation and the significance of the thesis.
The first chapter also articulates the main research questions and the context
of the study. An explanation of the objectives of the study and justification
of the study as well as the research approach are also briefly discussed.
Chapter 2
Summarises the relevant prior research literature on capital investment
decisions, incorporating investment selection in terms of both processes and
evaluation techniques. It initially provides a general review of corporate
financing theories in the context of CB. The chapter then presents views of
field studies conducted in CB, followed by published empirical evidence on
CB process decisions and practices. The chapter also presents a review of
the concept of CB and existing empirical evidence on the impact of CB
practices and firm performance.
Chapter 3
Explains the social, economic environment, financial situation and
development of capital markets in Australia and Sri Lanka as well as
highlighting the historical development of corporate finance practices in
Australia and Sri Lanka.
Chapter 4
Presents the research design and the methods used for data collection along
with the research model applied in this study. The chapter describes the
theoretical perspective, methodology and epistemology that underpin the
research strategy. Also discussed are the quantitative methods which were
used for analysing the data. It also describes and justifies the choice of data
collection sources, sample size, research design, and variables-
measurement.
Chapter 5
Discusses the quantitative methods and survey based questionnaire
undertaken to explore the CB decisions and practices among executives and
senior managers of listed firms in Australia and Sri Lanka. The chapter, also:
13
presents and discusses the findings of the survey; covers the empirical
evidence from this research in terms of the relationship between CB
practices and firm performance in Australia and Sri Lanka; and concludes
with a discussion of the choice of empirical methods, data collected and
variables.
Chapter 6
Discusses the results of the statistical analysis of the data. It tests the
hypotheses in the study and explains the interaction between the variables.
It also presents a discussion of the integrated results of the statistical
techniques which were used to explain the hypotheses of the study. This
discussion incorporates both the theoretical and empirical evidence
extracted from the literature concerning CB practices and firm performance.
Chapter 7
Concludes the thesis by discussing the implications of the results, the
contribution and limitations of the research findings, and indicates what
possible future research that could be undertaken to advance the knowledge-
base in this area.
1.9 Chapter Summary
This chapter provides a background to this research: CB practices and firm performance.
Specifically, it identifies the research objectives and key research questions based on a
background discussion. Further, it outlines the significance and primary research approach
of this research. The concluding section of this chapter has discussed an outline of the
remaining chapters in this thesis. The next chapter reviews the relevant literature on CB
practices and the related concerns of CB practices in terms of process and appraisal
techniques and firm performance; all relevant literature is reviewed, and a theoretical
framework is set out.

14
Chapter Two: Theoretical Considerations and
Literature Review
2.1 Chapter Introduction
Comprehensive financial management and capital investment decision making are critical
for the survival and long-term success of firms. The GFC confirmed this truth (Bennouna,
Meredith, & Marchant, 2010). The significance of corporate investment decisions lies in
their impact on stakeholders’ wealth (Beranek, 1975; Bosch-Badia, Montllor-Serrats, &
Tarrazon-Rondon, 2014; Cooper & Petry, 1994; Stulz, 1999). In this context, a firm’s
decision to capitalise new investment should be made according to whether the investment
increases the wealth of the firm’s stakeholders (Jensen, 2001). In order to fully understand
CB practices and firm performance, a review of the relevant literature is necessary.
This chapter outlines the findings of a comprehensive review of related CB practices and
firm performance studies. It also considers the main theories and empirical evidence of CB
practices that may affect firm performance. Another goal of this chapter is to identify the
gaps in the literature regarding an understanding of CB practices in terms of process and
evaluation approaches and firm performance and perceptions of capital investment
selection practices among finance managers.
This chapter is organised as follows: Section 2.1 presents a general knowledge of the CB;
Section 2.2 delineates the theoretical constructs of CB; Section 2.3 reviews the generally
accepted and applied CB techniques; Section 2.4 identifies both the proper use of and
pitfalls associated with applying discounted cash flow techniques; Section 2.5 outlines the
contingent variables associated with CB; Section 2.6 presents a review of the empirical
studies that investigate the association between CB practices and firm performance; Section
2.7 addresses the research gap and the contribution of this study to the literature; Section
15
2.8 presents the conceptual framework of this study; and Section 2.9 gives the chapter
summary.
2.2 Capital Budgeting
Firms are continually faced with the issue of deciding whether the current commitment of
resources is likely to create optimal expected future benefits, as measured in present value
(Bierman & Smidt, 2007). If the benefits are likely to accrue reasonably soon after the
expenditure is made, and if both the expenditure and the benefits can be measured in
monetary value, the analysis of the problem is simpler than if the expected benefits accrue
over many years and there is considerable uncertainty as to the amount of these benefits
(Bierman & Smidt, 2007).
The term investment refers to commitments of resources made in the hope of realising
future benefits. It is the process of allocating resources for major capital or investment
expenditures (Bierman & Smidt, 2007) and is seen as being worthwhile to the extent it
creates value for its stakeholders (Aharoni, 1966; Ross, Bianchi, Christensen, Drew,
Westerfield, & Jordan, 2014). In this context, firms frequently invest funds in resources
with the hope of net economic gains to investors via increased firm value leading to
increased share value, or via higher dividend payments, or via a combination thereof. (Atrill,
2012; Götze, Northcott, & Schuster, 2015; Porter, 1992). The invested funds are drawn
from the firm’s capital (i.e. its total resources or assets). The term capital, also, has come
to mean the long-term funds of the firm (Gitman, Juchau, & Flanagan, 2011). When a firm
allocates capital to long-term investments, the outlay is made in the expectation of future
benefits, in the form of future increased cash inflows and/or reduced cash outflows (Frino
et al., 2013). The process of planning and managing a firm’s investments and the allocation
of capital to such investments is known as CB (Ross et al., 2014). CB is essentially a multi-
16
year-capital-planning process (Ermasova, 2013) through which a firm decides on the best
use of limited assets.
In fact, CB is a many-sided activity that includes searching for new and more profitable
investment proposals, e.g. investing in engineering and marketing to predict the
consequences of accepting the investment and determine the profit potential of each
investment proposal (Bierman, 2010; Boquist, Todd, & Anjan, 1998).
CB has evolved over time and is currently defined as a multipart process involving a
number of tasks (Harris & Raviv, 1996; Kahraman, 2008; Mukherjee & Henderson, 1987).
In general, the CB process tends to focus on investment decision-making and that focus
requires decisions concerning the investment of money and expected benefits that arise
from long-term investments.
A capital expenditure occurs when a business spends money either to buy long-term
resources or to add to the value of existing long-term resources. Thus, CB is the process of
identifying and selecting investment opportunities in long-term assets anticipated to yield
benefits for more than one year (Bennouna et al., 2010; Gitman et al., 2011; McConnell &
Muscarella, 1985; Verbeeten, 2006; Zeeman & Naumann, 2005).
Capital budgeting has been defined in various ways, by various researchers, at various
times—i.e. Mullin (2007) suggests that CB practices tie together decisions about the long-
term investment of a firm’s capital and its operations; Major (1995) defines it as a situation
where firms make current resource expenditure for benefits to be realised in the future;
Pandy (1999) calls it a decision to invest a firm’s current resources in an effective way in
the long term, in the expectation of a predictable flow of future merits over a series of years.
In addition, CB is a process planned to achieve the highest profitability and cost
effectiveness of firms in the economy (Fatoki et al., 2010). It is a decision to make a cash
17
outlay in order to derive a benefit in the future through cash inflows (Dayananda et al.,
2002). Decisions made on the allocation of resources in firms require a proper process to
be followed, which entails an analytical approach aimed at providing relevant information
into the decision making process. Accordingly, CB is an important process by which a firm
decides on the optimum use of insufficient resources to decide whether a specific
investment is acceptable (Frino et al., 2013). Capital budgeting denotes the long-term
planning for proposed capital outlays or expenditure for the purpose of maximising return
on investments (Kashyap, 2014).
Capital expenditure can be directed at: 1) increasing returns by updating current resources
and/or developing new resources; and 2) decreasing the costs to achieve a given output.
Capital expenditures are made for a number of reasons with the most notable (per Brigham,
1992; Correia et al., 2005; Mukherjee & Hanif, 2006) being:
a. Expansion: The most common motive for a capital expenditure is to expand the
level of operations, usually through acquisition of non-current assets. A growing
firm often needs to acquire new non-current assets rapidly such as the purchase
of property, plant and equipment (PPE) facilities.
b. Replacement: As a firm’s growth slows and it reaches maturity, most capital
expenditures will be made to replace or renew obsolete or worn-out assets. Each
time a non-current asset requires a major repair, the outlay for the repair should
be compared to the outlay to replace the asset and the benefits of replacement.
c. Renewal: Renewal, an alternative replacement, may involve rebuilding,
overhauling or retrofitting existing non-current assets.
d. Other purposes: Some capital expenditures do not result in the acquisition or
transformation of tangible non-current assets shown on the firm’s financial
position statement. Instead, they involve a long-term commitment of funds in
expansion of a future return.
18
Investment decisions are connected with the process in which funds are raised in capital
markets to produce future net-cash inflows, which contribute to stakeholder returns. The
long-term investment decision normally deals with CB practices such as CB appraisal
(Wnuk-Pel, 2014). Capital budgeting is the controlling of the making and managing of
expenditures on long-term resources (Brigham, 1992).
2.2.1 Classification of Investments
Investments can be sorted into three classifications, based on how they impact capital
investment decision practice—i.e. investments that are independent, mutually exclusive,
and contingent (Antle, Bogetoft, & Stark, 2007; Arora, 2010; Dayananda et al., 2002;
Gitman et al., 2011; Peterson & Fabozzi, 2002).
2.2.1.1 Independent Investments
Independent investments refer to independent investments which are accepted or rejected
on the basis of some minimum return on the investment. Investments are independent if
their cash flows are unrelated (Gitman et al., 2011). When a group of investments under
consideration are independent, then accepting one investment does not eliminate the others
from consideration (Correia et al., 2005; Pandy, 1999; Parrino et al., 2012).
2.2.1.2 Mutually Exclusive Investments
Investments are mutually exclusive if the acceptance of one automatically precludes the
acceptance of the other (Dayananda et al., 2002; Antle, Bogetoft, & Stark, 2007; Correia.,
2005; Peterson & Fabozzi, 2002). Mutual exclusivity between projects can involve more
than one or more resources that must be dedicated to one or the other project; it can also
involve incompatible goals, values, and/or outcomes.
19
2.2.1.3 Contingent Investments
A contingent investment is an investment that is conditional on the choice of one or more
other investments. A contingent investment is one where its acceptance or rejection is
dependent on the decision to accept or reject one or more other investments. Contingent
investments may be complementary or substitutable (Pandy, 1999; Peterson & Fabozzi,
2002; Whitman & Terry, 2012).
2.2.2 The Importance of Capital Budgeting
Capital budgeting appraisals are an essential part of firm finance management (Bennouna
et al., 2010; Hermes et al., 2007; Wnuk-Pel, 2014). The intent of these decisions is to select
investments in real assets that will increase the wealth of the firm (Dayananda et al., 2002)
by generating values that exceed their costs. Capital investments are substantial as they are
usually long term, include significant cash outlays and are not easily reversed. They also
define what the firm is all about, the firm’s lines of business and its inherent business risk.
For better or worse, capital investments produce most of a typical firm’s revenues for years
to come.
Capital budgeting practices support management systematically and analyse potential
investment opportunities in order to decide which are worth undertaking (Stulz, 1999). An
optimal investment decision optimises the present value of stakeholders’ wealth by using
CB procedures (Patterson, 1989; Weston & Copeland, 1992).
In investment analysis, CB is about management’s search for the best capital investments,
i.e. those that add the greatest value to the firm. Over the long term, the most successful
firms are those whose management consistently search for and find capital investment
20
opportunities that increase firm value. Such decisions often attract managers’ time and
interest for the reasons below (Anderson & Sollenberger, 1992):
a. Long-term commitments made. Capital decisions often lock the firm into the assets
acquired for many years. Also, the future is always uncertain. So, the farther into
the future a commitment extends, the greater the uncertainty.
b. Key areas of the firm involved. Many investments affect vital areas of the firm. New
products, new production technology, research investments and computer systems
are all examples of critical investments made to move the firm ahead competitively
or to remove past limits on the firm.
c. Sources of future earnings identified. These investments, made now, represent the
basis for future sales and therefore profits. Investing carefully and with foresight is
the key to the firm’s future financial performance.
d. Difficult management problems confronted. Many capital investments are one of a
kind and involve new technology, untested processes or activities that managers do
not perform regularly. Construction, engineering and financial investment
management may not be managements’ strengths. Therefore, frequent delays, cost
overruns and other difficulties often appear.
e. Scarce capital resources allocated. In most firms, there are always more potential
investments than capital resources. Thus, some rationing process must be applied.
f. All these issues cause capital investment decisions to get management’s attention.
Poor decisions can waste investment resources, lead to a loss of opportunities and
impact on firm profits for many years. Excellent analysis and decisions solve
problems and give the firm capacity, technology, administrative efficiency and the
financing to be a successful competitor.
21
2.3 Theoretical Constructs and Capital Budgeting
2.3.1 Contingency Theory in the Context of Capital Budgeting
Several authors align contingency theory in the setting and design of the CB process: Chen
(1995), Chen (2008), Grinyer, Al‐Bazzaz, and Yasai‐Ardekani (1986), Pike (1986).
Contingency theory suggests that for a firm to be effective there must be a strong fit between
its structure and context. Consequently, resource-distribution efficiency is not individually
achieved via only adopting sophisticated, theoretical best-investment techniques and
procedures, but also entails the fit between the corporate context and the design and
operation of the CB system (Pike, 1984).
Contingency theory focuses on three features of the corporate side which are expected to
be connected with the design and process of a firm’s CB. The first feature is a firm’s
attributes. There are many firm characteristics which may have an effect on CB practices
(Chen, 1995; Daunfeldt & Hartwig, 2014; Hakim & Shimko, 1995; Schall, Gary, &
William, 1978; Waterhouse & Tiessen, 1978)—i.e. firm size is one glimpse of these
differences. Decentralisation (the degree to which decision making authority is diffused)
and more managerially oriented control and monitoring approaches involving a higher
degree of standardisation are attributes of large firms (Baule, 2014; Carleton, Kendall, &
Tandon, 1974). On the other hand, small firms tend to implement interpersonal naive
control systems, albeit certain firms could be decentralised in some decision areas and
centralised in other decision areas (Laux, 2011)—i.e. personnel decisions may be
decentralised while scarce resource allocations may be highly centralised (Haka, 1987). A
further example may occur where either over sophistication or low effectiveness arise when
a highly developed CB system is too strictly administered. Limited flexibility may produce
a constraint on ideas, entrepreneurial flair and risk taking and may also have demotivating
effects on mangers (Pike, 1984). Prior empirical studies also reveal that a firm’s CB
22
practices depend on its size (Block, 2005; De Andrés et al., 2015; Schall & Sundem, 1980;
Schall et al., 1978) and industry (Block, 2005; Schall et al., 1978).
A second feature is uncertainty. The more variable and unpredictable the view of operations
is, the less suitable are highly administrative, automatic CB structures (Chen, 1995; Ho &
Pike, 1998; Schall & Sundem, 1980). Pike (1986) noted that firms working in highly-
uncertain settings are advantaged by using sophisticated CB methods, particularly when it
comes to appraising risk and when the external environmental situation plays a crucial a
role in a firm’s strategy concerning its CB procedures (Verbeeten, 2006). Albeit Haka et al.
(1985) have expressed an opposite opinion and suggested that firms operating in more
consistent and constant environments are advantaged by using sophisticated CB practices.
The third feature considered is the behavioural attributes of management which include the
management style and the degree of expertise applied (Pike, 1986). Tayles et al. (2007)
suggest that administratively oriented CB control strategies are expected to be consistent
with a systematic style of management, a high degree of expertise and a history of
undistinguished investment outcomes. Also pertinent was the extent to which a firm’s
financial position impacted on the design and effort put into CB (Gervais, 2009). These
issues aside, the literature mostly identifies two key CB approaches:
The process approach which takes a wider perspective and attempts to explain
how firms make investment decisions in practice; how investment opportunities
are identified, developed, justified and finally approved (Batra & Verma, 2014;
Hall, 2000; Harris & Raviv, 1996; Mukherjee & Henderson, 1987; Pirttila &
Sandstrom, 1995; Soltani, Nayebzadeh, & Moeinaddin, 2014); and
The evaluation approach, which denotes traditional theory, presents procedures
for how firms should treat investment decisions and focuses more on the financial
appraisal and selection of proposed investments in long-term resources (Arnold &
Hatzopoulos, 2000; Bennouna et al., 2010; Wnuk-Pel, 2014).
23
2.4 Capital Budgeting Process
The CB process is a significant factor concerning the quality of investment decisions and
their implementation (Farragher et al., 2001; Kashyap, 2014); particularly to the extent that
the process determines which investment projects result in the maximisation of shareholder
wealth (Andor et al., 2015; Atrill, 2012; Gitman et al., 2011; Zeeman & Naumann, 2005).
Similarly, the process of CB governs the way in which managers (at different stages)
produce and share information about suggested investments and how decisions are
delegated (to whom and under what constraints) (Harris & Raviv, 1996).
Capital budgeting is the process of planning and managing a firm’s investment in non-
current assets (Ross et al., 2014). It is the process of evaluating and selecting long-term
investments consistent with the firm’s goal. Ross, Westerfield, and Jordan (2009) noted
that CB is a long-term investment appraisal and is used to describe the process of creating
and controlling expenditures on continued assets. Also the investment decision normally
relates with CB methods as an investment appraisal tool. Particularly, one significant
advanced order competency of a firm is to develop and deploy CB processes (Maritan,
2001).
In his 1970 research, Bower sought to established descriptive approaches to the CB process
(based on an examination of actual capital investments, normally in huge multidivisional
firms). Bower’s study serves as a base for many later studies and its key findings are
considered as seminal to studies of the capital investment process. Bower (1970)
differentiates between the business planning process and the investment process. The
business planning process in a firm is a constant process by which a firm searches and
examines its resources and environment to choice opportunities defined in terms of markets
to be served and products to serve them. On the other hand, the investment process deals
24
with how a firm makes separate decisions to invest resources in order to reach considered
corporate objectives. These two processes are expected to be serious, since they deliver a
framework and direction within which other standard activities of the firm take place
(Bower & Gilbert, 2005).
Bower considers that the CB process entails the three different processes of:
Definition is a process by which the simple economic and technical features of
suggested capital investments are determined; It is commonly introduced by a
facility oriented manager in response to an inconsistency created by information
from general management, marketing, accounting, research and development; It
helps make an investment more developed via the use of studies and task forces;
Impetus is the force that moves an investment toward capital funding which Bower
(1986) suggests is the willingness of an executive or a senior manager to make a
commitment; and
Context is a set of firm forces that affect the processes of definition and impetus
and incorporates background structural and situational aspects where situational
aspects refer to features of a historical and personal nature which due to their
individuality cannot be generalised. Context aspects can be better delineated
through the features of corporate structure: formal firm, structure of control and
information used to measure performance of the firm and the systems used to
measure and reward performance of mangers. Structural aspects are, for example,
the formal firm and the system of information and control used to measure both
firms and management performance (Bower, 1986).
All three investment processes (definition, impetus and context) can be further
differentiated by distinguishing between three stages, which are hierarchically related to
each other. Furthermore, the process approach to CB takes a larger context and tries to
explain how firms treat investment decisions in practice; i.e. how investments are
approved (see Farragher et al, 2001; Guerrero-Baena, Gómez-Limón, and Cardozo,
25
2013; Han, 1986; Harris & Raviv, 1996; Mukherjee & Henderson, 1987; Maccarrone,
1996; Kim, 1981; Lam, Wang, and Lam, 2008).
According to Mukherjee and Henderson (1987), CB can be observed as a process that
requires many tasks to be achieved at different phases. Dayananda et al. (2002) identified
these separate stages to include strategic planning, identification of investment
opportunities, preliminary screening of investments, financial appraisal, qualitative
evaluation, the accept/reject decision, implementation and monitoring and post
implementation audit. As noted previously, it is a multi-faceted and loopy process with
several sequential stages (Batra & Verma, 2014, pp. 340-341) which can be identified as:
a. “Strategic planning” an organisation’s process of defining its strategy/direction
and making decisions on allocating its resources to pursue this strategy.
b. “Identification of investment opportunities” which idealy arise from processes
that encourage investment suggestions from within the firm (e.g., employees)
and/or from outside the firm (e.g., consultants).
c. “Preliminary screening of identified projects” to avoid wasting resources (e.g.,
time, money, and effort) by ensuring a fast cull of unsound and marginal proposals
from the identified investment opportunities.
d. “Financial appraisal of screened projects” via a detailed analysis of marketing,
technical, financial, economic and ecological aspects of the proposed investment
projects (via cash flow forecasting techniques, project evaluation or CB, risk
analysis and/or mathematical programming).
e. “Consideration of qualitative factors in project evaluation” including factors like
societal impact on employment, environmental impact, safety issues, political
attitude towards the project, labour management relationships and legal issues.
f. “Final acceptance/rejection decision of investments” is done based on all of the
collected information (e.g., the financial appraisal, qualitative results, and data) and
tempered by the managers’ judgement.
g. “Project implementation” involving setting-up manufacturing facilities, project
and engineering designs, negotiations and contracting, construction and training,
and plant commissioning.
h. “Post implementation audit” that yields feedback for future project appraisal
and/or strategy formulation.
26
2.3.1 Empirical Evidence on Capital Budgeting Processes
Mintzberg, Raisinghini, and Theoret (1976) and Pinches (1982) emphasise a four-stage
model of CB which consists of identification, development, selection and control.
Northcott (1995) notes that the identification phase provided the recognition of an
opportunity for investment and that the generation of the investment project is a significant
phase in the process. The identified investments have to be subjected to a preliminary
screening practice by management to separate unreliable investments. If an investment
moves beyond the analysis phase, a judgement is them made to accept or reject the
investment. Once the investment has passed through the acceptance phase it should then be
implemented by management. Post-implementation audits provide useful feedback for
investment-appraisal analysis.
Some CB studies, (Farragher et al., 2001; Han, 1986; Kim, 1981; Lam et al., 2008)
specifically focus on the CB process from different perspectives. Kim (1981) tested the
empirical relationship between CB practices and earnings performance of US firms and
identified several stages within the CB process. These being the: preparation of a long-term
capital budget; systematic search for alternatives; existence of screening; project
evaluation; management-science techniques; risk analysis; fulltime staff; expenditure
control; and a post-implementation audit. The study incorporated the above stages when
measuring the CB system. By utilising regression analysis, the study found a significant
positive association between CB practices and performance. Consequently, CB practices
were used to make investment decisions aimed at increasing earnings performance.
Furthermore, Kim found that firms with more sophisticated CB systems tended to have
higher levels of operating profit than firms with less sophisticated techniques.
27
Han (1986) showed that discounted-cash-flow capital-investment techniques are
significantly positively connected to a firm’s annual expenditure. The study covered 70
listed firms drawn from the Kuala Lumpur Stock Exchange (KLSE) in 1979. Findings
revealed that a number of firms also used multiple approach methods when appraising huge
capital expenditures. Long-term planning and post-audits for capital investments were also
employed by listed firms in Malaysia.
Hall (2000) endorsed a four-stage model of CB including: project definition and cash flow
estimation; financial analysis and project selection; project implementation; and project
review. Hall (2000) found that the most important, difficult, and risky stage in the CB
process was project definition and cash flow estimation.
Lam et al. (2008) in appraising the strategic asset allocation practices used by firms in the
construction industry of Hong Kong (HK), studied the capital expenditure planning,
monitoring, and control techniques used by construction industries and found that most
firms selected the rate of return as their most frequently used capital planning technique.
Farragher et al. (2001) examined the impact of sophisticated CB practices on corporate
performance in the US and found a positive relationship between CB and firm performance.
In considering the degree of CB sophistication, they incorporated nine procedural activities
such as strategic analysis, specified investment goals, search for investments, forecasting
cost, risk analysis, evaluation of returns, decision making, and implications and post-audit
for measuring CB practices. CB processes should include significant efforts to optimise
agency/asymmetric-information costs as part of the goal of maximising firm (Jensen &
Meckling, 1976; Jung, Kim, & Stulz, 1996).
28
2.4.2 Agency Costs and Asymmetric Information in Capital Budgeting
Agency costs, asymmetric information, risk access, and stakeholder wealth maximisation
play critical roles in CB practices (Beranek, 1975; Bernardo, Cai, & Luo, 2004; Fama,
1977; Froot, 2007; Gordon & Smith, 1992; Marino & Matsusaka, 2005). Agency costs
define the relationship between stakeholders and their firm’s management. Agency cost
exists when managers put their interest ahead of the interests of the owners of the firm
(Peirson, Brown, Easton, Howard, & Pinder, 2011; Shan & Xu, 2012). Agency costs arise
whenever one party (called the agent) has discretionary power to make decisions that affect
the wealth of another (called the principal) (Arnold & De Lange, 2004; Geis, 2007; Makris,
2009) and rests in the flow of asymmetrical information that favours the agent over the
principal (Anwar, Tieu, Gibson, Win, & Berryman, 2014; Geis, 2007; Kalay, 2014). In this
respect the rational utility maximisation by management may not be consistent with
stakeholders’ wealth maximisation (Godfrey, 2005; Harrison, Bosse, & Phillips, 2010).
In most medium-to-large firms, managerial functions are largely done by professional
managers and, accordingly, managerial compensation arrangements should consider and
implement processes to align manager goals and firm goals. In such cases, stakeholders
should monitor management for compliance with these compensation contracts. However,
optimal monitoring expenditures will still leave some residual agency costs, as it will be
infinitely costly to eliminate all agency costs (Fama, 1980; Pejovich, 1995).
The principal-agent problem occurs in many areas of operation in a firm because modern
firms are seen as a nexus of relationships (i.e. numerous formal and informal contracts)
between many stakeholders—e.g., shareholders, bank, management, employees, suppliers,
and customers (Aggarwal & Chandra, 1990). Studies, looking at transaction cost theories
of the firm have focused on the relative efficiency of numerous forms of decentralised
organisational structures as to their business effectiveness and their ability to reduce
29
residual agency costs (Grant, 1996). Firms experience residual agency costs due to
deviations in principal and agent interests despite the use of monitoring and bonding (i.e.
there is a trade-off because the elimination of all residual agency costs would require an
infinitely large amount of monitoring costs).
In their Agency theory research, Fama and Jensen (1985) show that a firm’s organisational
form influences its capital investment decisions. Also, CB procedures should include the
cost of collecting and processing the information needed to make CB decisions
(Easterbrook, 1984; Harris & Raviv, 1996; Kaplan, 1984; Shin & Kim, 2002). The CB
process governs the way in which management at various levels produce and share
information about proposed investments and determines which decisions are delegated, to
whom and under what constraints (Harris & Raviv, 1996). Antle and Eppen (1985) suggest
that some forms of organisation better enable managers to appropriate excess or residual
corporate slack and, as a result, they are also more likely to encourage implicit contracts
and investment having a higher value (Shleifer & Vishny, 1989).
Generally, principals providing funds for investment must rely on agents to winnow the
potential investments and provide information on the expected risk:returns of a limited
selection of investments. As a result, the quality of capital allocation depends on how
effective the decision process is in eliminating agency problems due to information
asymetry (Marino & Matsusaka, 2005). While uncontrolled information asymmetry and
agency costs reduce the efficiency of the CB process in a firm, these imperfections also
reduce what principals are willing to pay to agents. As a result, agents (managers) and
principals (investors) have an interest in their firm having cost-effective CB-appraisal
techniques.
30
2.5 The Application of Capital Budgeting Appraisal Techniques
2.5.1 Capital Budgeting Techniques
The selection of appropriate CB techniques, as part of making capital investment decisions,
is an essential managerial activity (Roubi, Barth, & Faseruk, 2011; Wnuk-Pel, 2014).
Capital investment decisions are connected with the method in which funds are raised
within markets to produce future cash flows and provide a return to stakeholders.
Investment decisions should rely on CB appraisal techniques to evaluate and sort the quality
of investment opportunities (Adler, 2006; Tappura, Sievanen, Heikkila, Jussila, & Nenonen,
2014).
Measuring the extent to which firms employ selected CB techniques has been the general
theme of several studies over the past decades. Most of these studies have concentrated on
a narrowly defined set of CB techniques and have generally entailed an examination of the
appraisal tools in use (Bennouna et al., 2010; Graham & Harvey, 2001; Maroyi & van der
Poll, 2012; Truong, Partington, & Peat, 2008). These techniques can be classified into two
classes: those that take into account the time value of money and those that do not. In the
time value of money techniques, past and future cash flows are discounted, typically to a
present value. Practically, there are two techniques aligned with the use of discounted cash
flow (DCF); net present value (NPV) and the internal rate of return (IRR) (Andor et al.,
2015; Mcdaniel, MCcarty, & Jessell, 1988; Tappura et al., 2014).
The NPV of an investment is equal to the difference between the present value of its
net cash flow and its initial cash outlay, assuming a cash outlay at the beginning of
the investments’ life and a series of net cash flows in the following periods (Peirson
et al., 2011). In NPV analysis, all net cash inflows and outflows are discounted to a
given year (typically, year zero; at the initial investment) identifying/estimating all
cash flows and their timing and then choosing and using an appropriate discount rate
31
to bring the values of the cash flows to a common present value. However, defining
an appropriate discount rate is never straightforward as there are a plethora of choices
(e.g., average cost of capital; marginal cost of capital; investment risk; or an agreed-
on rate).
The IRR gives the discount rate such that the NPV of an investment is equal to zero
and the investment with the highest IRR is the most profitable. The IRR technique
assumption that all cash flows can be reinvested at the IRR is often not possible. Also,
multiple net cash outflows over the project life leads to multiple solutions with no
means to identify one right solution. These serious IRR issues encourage the use of
NPV as the preferred CB technique (Frino et al., 2013; Tappura et al., 2014).
There are two commonly used techniques that do not take into account the time value of
money and are aptly described as non-discounted cash flow techniques:
Payback period (PBP) is the time for the initial cash outlay on an investment to be
recovered from the project’s net cash flows. It is calculated by summing the net
cash flows from an investment in successive years until the total is equal to the
initial cash outlay (Atrill, 2012; Daunfeldt & Hartwig, 2014; Ross et al., 2014).
Because PBP is the time required to recoup the initial investment, it is often
favoured as a simple but good measure of project risk and/or it is used to
supplement a discounted cash flow method. As a result, PBP is perhaps the most
frequently used CB technique and (if the payback time is short) the results are
reasonably accurate.
Accounting rate of return (ARR) is the earnings from an investment, usually after
deducting depreciation and income tax, expressed as a percent of the investment
outlay (Peirson et al., 2011). There are several ways to calculate the ARR,
including on a yearly basis or as a total value (Tappura et al., 2014).
Theoretical developments in finance have suggested that DCF have serious limitations in
appraising investments when information concerning future investment decisions is not
available (Brennan & Suhwartz, 1988; Dixit & Pindyck, 1994; Trigeorgis, 1993). The
application of real options (RO) and game theory (GT) principles can provide analytical
32
methods to evaluate such investments and assist with the overall investment and operating
strategy (Smit & Ankum, 1993). The origins of RO are in corporate finance literature and
it frames investments in terms similar to financial options (Miller & Waller, 2003). Option
value may stem from the option to postpone, grow or develop, to stage or sequence, to
switch inputs or outputs, or to abandon a project. In recent years there has been considerable
interest in the RO approach as most capital investments have options that have value (Ross
et al., 2009). Moreover, conventional DCF analysis should be enhanced to the extent that
RO techniques improve NPV analysis (Amram & Howe, 2002) even though NPV is often
considered without RO considerations (Phelan, 1997). A review of prior finance literature
reveals that only a relatively small number of firms employ RO (Block, 1997; Brounen et
al., 2004; Graham & Harvey, 2001; Ryan & Ryan, 2002; Sandahal & Sjogren, 2003).
2.5.2 Empirical Evidence on Capital Budgeting Techniques
Capital budgeting practices are defined as the methods and techniques used to evaluate and
select an investment (Eljelly & Abuidris, 2001; Pradeep & Lemay, 2009).Capital budgeting
practices assist CFOs to choose an investment based on relative risk and return. Literature
has generally distinguished among sophisticated and simple CB practices (Bennouna et al.,
2010; Haka et al., 1985; Haka, 1987; Ho & Pike, 1991). Simple CB practices (PBP or ARR)
generally do not use cash flows, do not consider the time value of money, and do not
incorporate risk in a systematic manner. Sophisticated CB practices (IRR, or NPV) tend to
consider cash flows, risk, and the time value of money.
CB-technique focused studies have a long tradition in finance literature. Several articles
have dealt with capital appraisal techniques around the world. Most of these studies have
focused on developed countries such as the United States (Graham & Harvey, 2001; Shao
& Alan, 1996), Canada (Baker, Dutta, & Saadi, 2011; Bennouna et al., 2010; Jog &
33
Srivastava, 1995), the United Kingdom (Arnold & Hatzopoulos, 2000; Alkaraan &
Northcott, 2006), and Australia (Freeman & Hobbes, 1991; Truong et al., 2008).
2.5.2.1 The US Experience
Capital budgeting practices in the US have been comprehensively surveyed concerning
their firms’ investment appraisal. These include studies reported by Block (2005), Bierman
and Smidt (2007), Chen (1995), Fremgen (1973), Gittman and Forrestter (1977), Graham
and Harvey (2001), Hendricks (1983), Klammer (1973), Klammer and Walker (1984), Mao
(1970), Payne et al. (1999), Pitty, David, and Bird (1975), Ryan and Ryan (2002), Schall
et al. (1978), Shao and Alan (1996) and Trahan and Gittman (1995). These studies suggest
that NPV and IRR (DCF techniques) are the dominant methods of evaluating and ranking
proposed capital investments in the USA.
Chen (1995) examining the use of CB evaluation techniques across three different types of
investment (expansion of existing products, expansion into new products, and equipment
replacement) found that DCF methods are used more extensively than NDCF methods to
analyse all three types of investments. The study also found that DCF methods are relied
on more heavily in expansion investments than equipment replacement and that non-
financial considerations play a significant role in CB, especially in decisions related to new
products.
Trahan and Gitman (1995) note that (based on a 1992 survey of 58 of the Fortune 500 large
firms and 26 of the Forbes 200 best small firms) most firms use DCF methods as their
primary appraisal tool. Large firms are more likely than small firms to use DCF methods.
While PBP, NPV and IRR methods were used by the selected firms, IRR was more often
used by large Fortune 500 firms and NPV was more often used by smaller 200 firm
respondents. Moreover, capital rationing is a commonly applied technique and often used
34
by responding firms. Possibly the general of understanding and use of the CB methods
listed, many respondents are interested in learning more about the modified internal rate of
return, profitability index and capital rationing.
Shao and Alan (1996) provided a complete analysis of the CB procedures used by
manufacturing firms in the US during the first quarter of 1992. The study found that
manufacturing firms preferred to use multi-capital investment selection techniques (NPV,
ARR, IRR, and profitability index (PI) for the firm’s capital expenditure selection and that
the IRR was the preferred ranking technique.
Chadwell-Hatfield, Goitein, Horvath, and Webster (1996) examined the significance of
PBP, IRR and NPV CB methods for the performance and value measures of firms. Their
study revealed that firms appraising all investments have higher share prices on average
and that, in contrast to the theory of finance, the NPV method was not maximising the value
of the firm. The study results also suggest that it is unwise to rely on any single CB method
but instead to apply all of them or as many of them possible for an investment appraisal.
Graham and Harvey (2001) investigated the theory and practice of corporate finance in the
US. They interviewed 392 CFOs about capital structure, cost of capital and CB and found
the NPV and IRR to be the most popular evaluation techniques in these firms. The results
also revealed a significant difference between small and large firms concerning the
selection of capital investment procedures. Present value techniques were increasingly
accepted methods used by large firms to evaluate CB whereas small firms used less
sophisticated techniques.
A survey by Ryan and Ryan (2002) conducted on the CB practices employed by the Fortune
1000 in the US found these firms consistently applied the NPV method followed by the
35
IRR method with both used at almost the same frequency. Surprisingly, the PBP was used
by only 53 percent of the firms in the survey.
Block (2005) focused exclusively on RO analysis and CB in investigating the same cohort
and found that 14 percent of the firms used RO in their CB process. The study found that
industry classification has a significant relationship to the use of RO but does not have a
significant relationship to the techniques used. The results indicated several reasons for not
using RO; are a lack of top management support given that discounted cash flow is already
a proven method; RO require too much sophistication and encourages excessive risk taking.
On the basis of recent studies in the US, CFOs are not always in agreement as to the best
choice of theoretical method. Klammer (1973) found that whereas only 19 percent of a
sample of large industrial firms used DCF techniques to evaluate proposed capital
investments in 1959, this increased to 38 percent in 1964 and 57 percent in 1970. Hendricks
(1983) reported that the percentage increased to 76 percent by 1981. Bierman and Smidt
(1993) reported that 99 percent of the respondents in their 1992 survey of the 100 largest
Fortune 500 firms used IRR or NPV as either the primary or secondary evaluation measure.
Graham and Harvey (2001) noted that approximately 75 percent of respondents selected
NPV and IRR as their most frequently used CB techniques; and also that small firms
employed the PBP almost as frequently as other DCF techniques. Block (2005) noted that
14 percent of the firms used RO in their CB practices.
36
2.5.2.2 The UK and Western European Experience
During the past few decades many studies of UK CB practices have been undertaken
(Arnold & Hatzopoulos, 2000; Alkaraan & Northcott, 2006; Beattie, Goodacre, &
Thomson, 2006; Drury & Tayles, 1996; Pike, 1988; Pike, 1996; Sangster, 1993; Wilkes,
Samuels, & Greenfield, 1996). These studies have concentrated mainly on the usage of CB
appraisal techniques.
The trend towards greater sophistication in capital investment selection methods and
control process in the UK has been documented by Pike (1988). Based on a sample of 100
large UK firms, the study investigated the CB practices employed between 1975-86. The
study revealed that DCF methods have greatly increased in usage from 58 percent to 84
percent. Moreover 63 percent of firms practiced three or more appraisal techniques
compared with 36 percent in 1981. While eight percent use a NDCF method, 79 percent
used a combination of simple (PBP or ARR) and sophisticated methods.
Sangster (1993) examined capital investment appraisal techniques employed by the largest
firms on Jordan’s Scotland’s top 500 firms. The study found that the most popular method
is PBP with 78 percent usage among the selected firms. It is used by 34 percent more firms
than the IRR, which was the second most popular method. However, PBP used only seven
percent more firms than DCF techniques in general (NPV or IRR or Both). The author also
found that smaller British firms do not employ sophisticated CB techniques to the same
extent as larger British firms.
Ballantine, Galliers, and Stray (1995) discussed the use and imporatnce of financial
appraisal techniques in the IS/IT investment decisions in UK. The study found that 72
percent of firms used cost benefit analysis (CBA) to apprasise their most recent investments
and the next most popular techniques are PBP and ARR at, respectively, 60 and 43 percent.
37
Only a small percent of selected firms use NPV and IRR to apprasie IS/IT investments (24
and 25 percent, repectively).
Pike (1996) undertook a longitudinal survey on CB practices in the UK. The results
indicated that 94 percent of UK firms employed the payback method, and 81 and 74 percent
of firms employed the IRR and NPV methods, respectively. Only 50 percent of the firms
in the UK made use of the accounting rate of return (ARR) method for their CB appraisal.
Drury and Tayles (1996) investigated UK CB practices with results indicating that 63
percent of the selected firms regularly use the IRR; 50 percent use NPV and 30 percent
adopted the PBP method. The survey also indicated that NDCF methods continue to be
used by both smaller and larger firms. Also, the study suggests that theoretically sound
capital budgteing techniques are more likely to be used by larger firms than by smaller
firms.
Wilkes et al. (1996) investigated investment decision making with special reference to 500
of the largest manufacturing firms in UK from 1989-94. The study found that 60 percent of
firms used three or four methods with the most popular three method combination being
PBP, yield and NPV. Notably no one used the ARR alone, only one firm in each case used
IRR or NPV. The study also noted that the PBP is constantly used but there was little
change between 1989 and 1994. Almost 90 percent of firms included the PBP, although it
was not necessarily the most frequently used method.
Arnold and Hatzopoulos (2000), while investigating the gaps in CB theories and practices
in the UK, used a multi-choice questionnaire to review the CB attributes of 300 firms. Most
large firms were using either NPV or IRR techniques while the majority of other firms used
other methods for evaluating CB decisions. More than 90 percent of firms used the NPV
when making long-term decisions.
38
Alkaraan and Northcott (2006) conducted a survey on strategic capital investment decision
making with a special emphasis on assessing the importance of the role of analysis tools.
The study covered 83 large British manufacturing firms representing eight sectors during
2002-03 and adopted a mixed-method research approach. The study highlighted that a
significant number of firms used DCF, the frequent concurrent use of several other methods,
and that the PBP was used as a prime tool.
Trends in the UK over the past four decades are quiet revealing. Pike’s (1988) study noted
that the use of DCF methods had increased from 58 percent in 1975 to 84 percent in 1986
with the IRR being used by 42 percent of the firms compared with 23 percent for the NPV
method. The PBP was the most widely used technique and adopted by 92 percent of the
respondents including 47 percent who stated that they always used this method. Further
studies in the 1990s noted the continued use by UK firms of DCF techniques with Wilkes
et al. (1996) suggesting by 1994 the use of such techniques had risen to around 85 percent
(much more than what was found in most eralier studies). These results indicate that the
theory-practice gap is narrowing. Whereas DCF was used by only 58 percent of large firms
in 1975 most large firms are now using either IRR or NPV with over 90 percent of small
and medium firms also using these methods. Furthermore, one third of large firms in 1975
used one technique, with approximately one third using two techniques and the remaining
one third using three or more techniques. Recent studies show 67 percent of firms now use
three or more techniques for their apprisal (Alkaraan & Northcott, 2006). The general
picture in the UK is that the PBP method is still an important method while DCF methods
seem to have also increased in importance.
Brounen et al. (2004) studied the theory and practice of corporate finance in Europe. The
study responses consisted of questionnaire survey data of 68 firms in the UK, 52 firms in
39
the Netherlands, 132 firms in Germany and 61 French firms from 2002-03. The study
revealed that the PBP was the most frequently used CB technique in European firms. In the
UK, Netherlands, Germany and France, respectively, 69, 64, 50, and 51 percent of CFOs
used PBP as their preferred analysis tool. They also found in Europe that PBP criterion was
immediately followed by the NPV and IRR methods. In the UK, Netherlands, Germany
and France, respectively, 53, 56, 42, and 44 percent of all CFOs used the IRR method while,
respectively, 47, 70, 48, and 35 percent of all CFOs in these countries relied on the NPV
method.
2.5.2.3 The Canadian Experience
Several studies have dealt with CB practices of firms in Canada over the past several
decades. These include studies reported by Baker et al. (2011), Bennouna et al. (2010) and
Jog and Srivastava (1995)
Jog and Srivastava (1995) examined CB practices in Canada by the use of a questionnaire.
Their sample consisted of 133 large foreign and private owned firms. The study indicated
that the CB process included investment evaluation, cash flow estimation and cost of capital
estimation. The results indicated that the DCF method was the principal method for
evaluating investments albeit most of the firms utilised multiple techniques when making
decisions.
Bennouna et al. (2010), also, tested CB practices by surveying the CFOs of the 500 firms
listed in the Financial Post. The study found that the NPV and IRR were more frequently
used than NDCF techniques with the IRR used as the prime model in their capital
investment selection. While NDCFs were still employed, their use had declined.
40
Baker et al. (2011) examined RO practices using a sample drawn from a survey of 847
Canadian firms listed on the Toronto Stock Exchange (TSX) in 2006. They employed a
structured questionnaire to test firm attributes, RO merits, demerits and types of RO used
by the selected firms. The results revealed that only 17 percent of the responding firms
practiced RO for their CB decisions. The three peak types of RO used by these firms in
their CB practices were growth, right to defer and flexibility RO. Further results indicated
that Canadian firms less often made RO valuations in their calculations usually because of
a lack of expertise and knowledge in the area.
DCF has become the main appraisal techniques in Canada (Bennouna et al., 2010; Jog &
Srivastava, 1995). In particular the use of DCF appears to have increased from a low of
around 35 percent in the early 1960s to approximately 90 percent or more in the early 1990s.
NPV is now widely utilised among Candian firms but a sizeable percentage still use IRR
as their primary model in capital decision making. The theory-practice gap remains a
regular theme in the CB Canada based literature, in particular with regard to NPV.
Compared to previous Canadian studies, there has been a narrowing of the theory-practice
gap. While the 2011 survey shows 17 percent of responding firms used RO for their CB
decisions (Baker et al., 2011), the majority of Canadian firms use risk analysis tools with
the main ones being sensitivity analysis, scenario analysis and risk-adjusted discount rates.
Compared to previous research, recent studies show a substantial increase in sensitivity
analysis and use of risk-adjusted discount rates.
41
2.5.2.4 The Australian Experience
A number of studies into the CB practices of Australian firms have been conducted,
including Anderson (1982), Freeman and Hobbes (1991), Kalyebara (1998), Lilleyman
(1984), McMahon (1981) and Truong et al. (2008). These studies cover a range of issues
(e.g., which CB techniques are used, how firms rank the significance of these techniques,
and how discount rates are determined).
McMahon (1981) reviewed the 200 leading firms (in terms of market capitalisation) listed
on the Sydney stock exchange and 20 large private firms. The study found that there was
no significant change in the use of PBP and ARR during the 1970s compared to the results
of earlier surveys. Albeit, this study suggests that there has been an increase in the use of
DCF techniques. The study also investigated the extent to which Australian firms used
formal methods of risk analysis in capital investment decision making. Seventy four percent
of the firms indicated use of DCF techniques and 53 percent used formal risk analysis
techniques such as sensitivity analysis, simulation and measured expected variation in
return.
Lilleyman (1984) sampled 371 firms selected from three different sources, including 250
public firms randomly selected from industrial, oil and mining listed firms, 60 private firms
from Australian businesses and 61 state firms. The study found that aside from extensive
support for the more sophisticated DCF techniques, the PBP technique was used by more
respondents than any other method. However, the usage ratio of DCF (i.e. either the IRR
or NPV) methods was high with respondents regarding these techniques as being the most
significant when evaluating capital investments.
Freeman and Hobbes (1991) published the results of a survey of CB practices utilising the
top 150 firms on the IBIS top 1000 corporate database, which included listed and unlisted

42
firms as well as firms ranked from 351 to 500 on that list. The researchers compared the
results to prior surveys and concluded that there had been a significant growth in the use of
the NPV and IRR methods. There was a decline in the use of the PBP and ARR. However,
they found that these simpler methods were used more often for smaller capital expenditure
decisions.
Truong et al. (2008) investigated the cost of capital estimation and CB practice by
surveying 353 listed Australian firms with results indicating that the majority adopted DCF
for their capital investment selection. RO reports were also undertaken in some long-term
cases with amendments for inflation made to discounting rates to enhance the appraisal of
capital investments.
Comparing the results of studies by Lilleyman (1984) and McMahon (1981) and their study
outcomes, Freeman and Hobbes (1991) found an increase in the use of DCF techniques
from 52 percent of respondents in 1979 to 75 percent in 1989. Kalyebara (1998) also found
that 75 percent of respondents to a 1996 survey used NPV followed by IRR and PBP. While
the study found that the use of DCF techniques dominated, the PBP was still employed in
investment appraisals. A majority of extant studies specify that firms use more than one
technique. More recently, Truong et al. (2008) found that 94 percent of CFOs used NPV,
followed by PBP and IRR. They also noted that RO analysis has gained more relevance in
CB in Australia albeit was not yet part of the main stream.
43
2.5.2.5 The New Zealand, Japan and Poland Experience
There is survey evidence regarding CB practices in other developed nations including New
Zealand: Patterson (1989), Japan: Shinoda (2010) and Poland: Wnuk-Pel (2014).
In investigating firms listed on the New Zealand stock exchange, Patterson (1989) found
that NDCF techniques (e.g., PBP and ARR) are more regularly used than DCF techniques
(e.g., NPV and IRR). However, at least one DCF technique was used at different times by
75 percent of the New Zealand firms. The ARR was used as a main technique by 53 percent
of the sample firms. Less than one third of respondents specified their firms used IRR as
the primary method.
Shinoda (2010) analysed the CB practices used by Tokyo stock exchange listed firms in
Japan from October 2008 to January 2009. The study employed a questionnaire to test the
CB practices in the selected firms and found that 31 percent of firms frequently used NPV.
Japanese firms remained heavily dependent on PBP method with 50 percent of firms
employing PBP and RO reports were used in some long-term decisions.
Wnuk-Pel (2014) analysed the CB practices used by non-manufacturing firms in Poland
and found that 81 percent applied a recognised CB appraisal technique. Sixty one percent
of the firms applied the more sophisticated DCF methods when analysing their investments.
Moreover, consistent with financial theory, approximately 58 percent of the firms regularly
employed the NPV and IRR methods.
These studies indicate that, while DCF techniques have become the dominant method for
evaluating capital investments, NDCF techniques also continue to be used, albeit their use
as a prime appraisal measures has declined. Table 2.1 summarises the major findings on
CB appraisal techniques in developed countries.
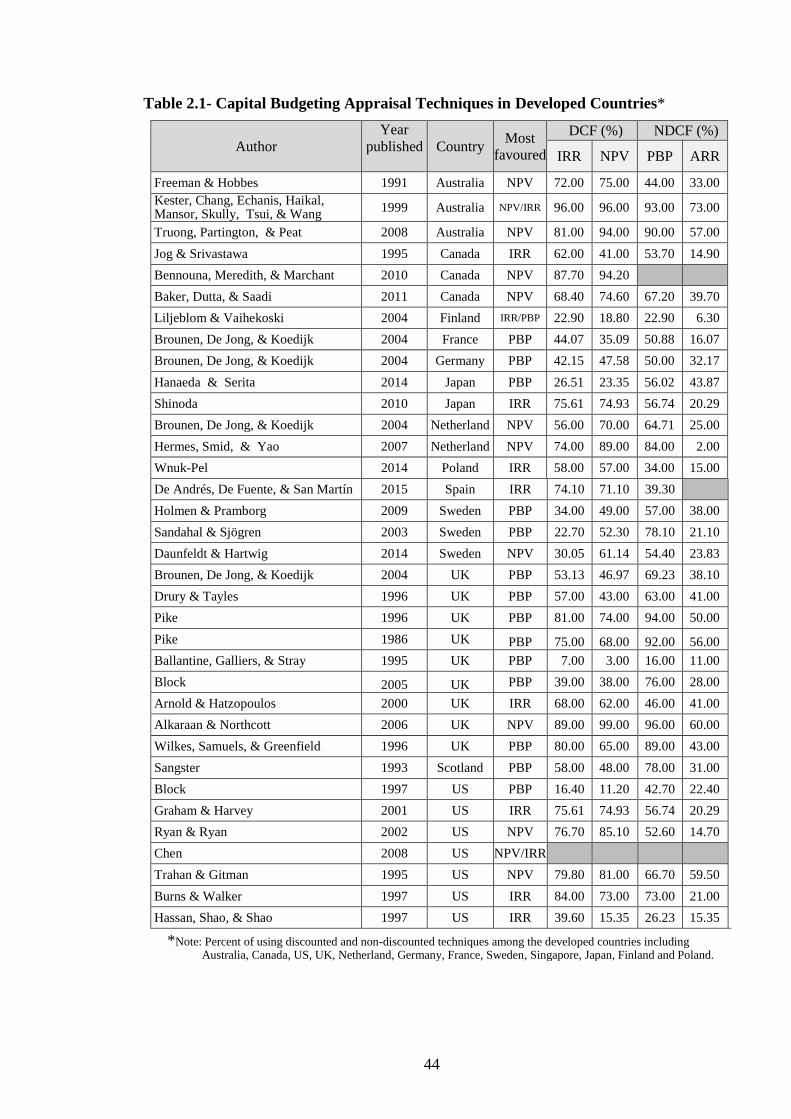
44
Table 2.1- Capital Budgeting Appraisal Techniques in Developed Countries*
Author
Year
published
Country Most
favoured
DCF (%) NDCF (%)
IRR NPV PBP ARR
Freeman & Hobbes 1991 Australia NPV 72.00 75.00 44.00 33.00
Kester, Chang, Echanis, Haikal, Mansor, Skully, Tsui, & Wang
1999 Australia NPV/IRR 96.00 96.00 93.00 73.00
Truong, Partington, & Peat 2008 Australia NPV 81.00 94.00 90.00 57.00
Jog & Srivastawa 1995 Canada IRR 62.00 41.00 53.70 14.90
Bennouna, Meredith, & Marchant 2010 Canada NPV 87.70 94.20
Baker, Dutta, & Saadi 2011 Canada NPV 68.40 74.60 67.20 39.70
Liljeblom & Vaihekoski 2004 Finland IRR/PBP 22.90 18.80 22.90 6.30
Brounen, De Jong, & Koedijk 2004 France PBP 44.07 35.09 50.88 16.07
Brounen, De Jong, & Koedijk 2004 Germany PBP 42.15 47.58 50.00 32.17
Hanaeda & Serita 2014 Japan PBP 26.51 23.35 56.02 43.87
Shinoda 2010 Japan IRR 75.61 74.93 56.74 20.29
Brounen, De Jong, & Koedijk 2004 Netherland NPV 56.00 70.00 64.71 25.00
Hermes, Smid, & Yao 2007 Netherland NPV 74.00 89.00 84.00 2.00
Wnuk-Pel 2014 Poland IRR 58.00 57.00 34.00 15.00
De Andrés, De Fuente, & San Martín 2015 Spain IRR 74.10 71.10 39.30
Holmen & Pramborg 2009 Sweden PBP 34.00 49.00 57.00 38.00
Sandahal & Sjögren 2003 Sweden PBP 22.70 52.30 78.10 21.10
Daunfeldt & Hartwig 2014 Sweden NPV 30.05 61.14 54.40 23.83
Brounen, De Jong, & Koedijk 2004 UK PBP 53.13 46.97 69.23 38.10
Drury & Tayles 1996 UK PBP 57.00 43.00 63.00 41.00
Pike 1996 UK PBP 81.00 74.00 94.00 50.00
Pike 1986 UK PBP 75.00 68.00 92.00 56.00
Ballantine, Galliers, & Stray 1995 UK PBP 7.00 3.00 16.00 11.00
Block 2005 UK PBP 39.00 38.00 76.00 28.00
Arnold & Hatzopoulos 2000 UK IRR 68.00 62.00 46.00 41.00
Alkaraan & Northcott 2006 UK NPV 89.00 99.00 96.00 60.00
Wilkes, Samuels, & Greenfield 1996 UK PBP 80.00 65.00 89.00 43.00
Sangster 1993 Scotland PBP 58.00 48.00 78.00 31.00
Block 1997 US PBP 16.40 11.20 42.70 22.40
Graham & Harvey 2001 US IRR 75.61 74.93 56.74 20.29
Ryan & Ryan 2002 US NPV 76.70 85.10 52.60 14.70
Chen 2008 US NPV/IRR
Trahan & Gitman 1995 US NPV 79.80 81.00 66.70 59.50
Burns & Walker 1997 US IRR 84.00 73.00 73.00 21.00
Hassan, Shao, & Shao 1997 US IRR 39.60 15.35 26.23 15.35
*Note: Percent of using discounted and non-discounted techniques among the developed countries including Australia, Canada, US, UK, Netherland, Germany, France, Sweden, Singapore, Japan, Finland and Poland.
45
2.5.2.6 The Emerging/Developing Country Experience
There are only a limited number of studies emphasising CB evaluation techniques in
emerging countries. Chan, Kamal, and William (2004); Farah, Mansor, and George (2008);
Kester and Chong (1998) placed emphasis on Malaysia, Indonesia, China, and Singapore;
African economies were examined by Coltman (1995); Hassan, Hosny, and Vasilya (2011);
Maroyi and van der Poll (2012); Pradeep and Lemay (2009); Kantudu, (2007) while India
was examined by Manoj (2002); Satish, Sanjeev, and Roopali (2009); Singh, Jain, and
Yadav (2012).
Kester and Chong (1998) examined CB practices used by firms in Singapore. Their study
surveyed 211 listed firms drawn from the Singapore Stock Exchange (SSX) in 1996 and
sought details on CB, discount rates, risk analysis, cost of equity capital and capital
rationing practices. The study found the PBP and IRR where equally the most important
techniques for evaluating investments while two selected firms adopted economic value
added as their assessing method.
Chan et al. (2004) analysed the CB practices used by listed firms in China during the period
2000-01. The questionnaire concerned issues around the CB process, risk and uncertainty,
capital rationing, and capital assessing techniques. Their findings suggest a very large
number of firms use NDCF techniques (e.g., while 89 percent of firms use NPV as their
primary analysis method, 83 percent of firms use PBP as their second evaluating technique).
Farah et al. (2008) investigated the CB practices of listed firms on the Jakarta Stock
Exchange (JSX) in Indonesia (2000-01). The questionnaire concerned issues around capital
investment, project risk, discount rates and the assessment of the cost of equity capital. The
study found that Indonesian firms employed DCF techniques to evaluate their capital
investment decisions. They also reported that the financial controller’s education and the
46
age of listing played a significant role in determining CB techniques but that the type of
ownership, firm size, industry and financial risk appeared to be unrelated as to whether or
not DCF techniques where used.
Limited studies on the perception of CFOs in emerging, particularly the South-eastern Asia,
countries were found. These studies reporting on the results of a survey of firms in
Singapore, China and Indonesia, found that DCF and NDCF are the most frequently used
methods. In Malaysia, Han (1986) found the PBP to be the most frequently used evaluation
technique. Wong, Farragher and Leung (1987) surveyed a large sample of firms in
Malaysia, Hong Kong and Singapore and found significant use of the PBP in Malaysia. In
Hong Kong, they found the PBP and ARR to be equally popular. Though, recent studies
established that firms in South-Eastern Asia employ NDCF techniques and DCF techniques
equally to their long-term decisions.
CB practices studies on African firms indicate a shift in the appraisal techniques employed
by firms. Falusi (1983) chose 60 manufacturing firms (45 of which are listed on the
Nigerian Stock Exchange) to determine the extent to which firms in Nigerian use DCF
techniques. The study found that 89 percent of listed firms made use of the NPV method
while the PBP method was used by the remaining listed firms as well as non-listed firms.
In South Africa, Coltman (1995) found that the most popular method used was PBP, with
92 percent of respondents using this method. The IRR was used by 78 percent of firms; 65
percent used the NPV method; 46 percent used the ARR method with eight percent using
other methods to assess capital investments. The increasing use of NPV and IRR is in line
with financial theory, as the NPV and IRR methods take the time value of money into
account and are based on cash flows.
47
Kantudu (2007) tested the capital investment appraisal practices in Nigeria. The sample
consisted of 200 management and finance staff from 100 quoted firms. The study found
that most firms employed NDCF techniques in evaluating capital expenditure and that the
PBP was the preferred method for ranking. Twenty five and 20 percent of respondents used
return on capital employed and ARR respectively in assessing their investments. The study
also noted that the CB techniques employed rely on simplicity, understandabilty, and
effectiveness.
Pradeep and Lemay (2009) examined CB techniques using a sample drawn from South
Africa. The study consisted of survey data of 600 managers from Western Cape Province
and found that the PBP was the preferred approach in CB decisions although firms still
relied on other DCF techniques. The NPV was seen to be more popular than the IRR.
Simpler CB techniques were more popular amongst medium sized firms while larger firms
utilised the NPV in their decisions.
Maroyi and van der Poll (2012) investigated CB techniques with special reference to listed
mining firms on the Johannesburg Securities Exchange (JSE) in South Africa. The survey
consisted of 20 firms out of the 25 listed on the JSE. The study found that mining firms
preferred naive techniques for evaluating capital plans such as the PBP and the ARR and
that these firms undertook little risk analysis in their long-term capital investment decisions.
The survey also revealed that while South African mining firms made use of some DCF
CB methods there was an unwillingness to use modern methods such as RO.
The results for African firms are consistent with the increasing use of DCF in capital
investment selection. Previous studies on CB practices undertaken in South Africa (e.g.,
Andrews & Butler, 1986; Du Toit & Pienaar 2005) noted that larger firms tend to employ
more sophisticated CB techniques with simpler CB techniques being more popular among
48
small and medium firms. In the case of Nigeria, firms still employ NDCF techniques,
although the use of PBP and ARR methods have declined recently.
A considerable amount of evidence is available about CB practices in Asian countries
through studies by Manoj (2002); Hussaini and Shafique (2013); Satish et al. (2009); Singh
et al. (2012). Manoj (2002) examined corporate finance practices using a sample drawn
from India. The study consisted of 474 private firms and 51 public sector firms. The
researcher employed a questionnaire to test the CB practices, capital structure, dividend
policy and cost of capital of the selected firms. The results revealed that most respondents
consider the objective to maximise earnings before interest and tax (EBIT) and earning per
share (EPS) as their corporate finance practice. Further, DCF methodology was the most
popular method for evaluating CB decisions with the majority of respondents using the
NPV and IRR in their analysis with larger firms more frequently using NPV than their
smaller counterparts.
Satish et al. (2009) examined CB practices in India. The study consisted of 100
manufacturing firms in Hyderabad, Delhi, Mumbai, Calcutta, Chennai, Bangalore, and
Ludhiana. The study noted that the PBP and the NPV were the most popular CB techniques
used while 90 percent of firms used more than one CB technique for evaluating their
investment proposals. The study also revealed that the education of finance staff and their
experience played a vital role in the selection of CB techniques. Highly educated finance
personnel preferred more sophisticated CB techniques such as the NPV and IRR. Many
firms also used the WACC when calculating their cost of capital.
Singh et al. (2012) examined the CB decisions of firms in India. The survey consisted of
166 non-financial firms of the BSE 200 index from 2001 to 2011. The study reported that
all the sample firms were likely to use DCF techniques in conjunction with NDCF
49
techniques. Seventy eight percent of the firms employed the IRR for the capital selection
while still relying on simpler CB techniques such as the PBP and ARR. The findings
indicated that there still remains a theory vs. practice gap in the usage of IRR over NPV.
Over the years certain noteworthy studies in India were conducted. In these studies of India,
NPV criterion was observed to be a widely used CB technique followed by IRR although,
still relying on simple CB techniques such as the PBP and ARR but there usage had
declined.
Hussaini and Shafique (2013) examined the CB decisions of firms in Pakistan. The study
consisted of senior executives from five Islamic banks. Their findings suggested that 80
percent of firms practiced DCF techniques with 94 percent of these using the NPV and 88
percent also using the IRR.
Hassan et al. (2011) examined the capital investment practices of large corporations in an
emerging market. The study tested the use of different CB techniques to assess the capital
investments in 167 listed firms on the Kuwait Stock Exchange (KSE) and 344 unlisted
firms in Kuwait. The researchers used a structured multi-choice questionnaire to determine
the capital investment techniques employed by Kuwaiti firms. The study reported that the
NPV and PBP methods were the most popular techniques to assess capital investment but
also found that listed and unlisted firms also applied multiple CB techniques to assist with
their capital investment decisions. The results revealed significant differences in capital
selection techniques between corporations from different industries and different capital
sizes, albeit the number of investments assessed did not show any significant differences in
applying different techniques and there was little significant difference between listed and
unlisted firms in their CB practices.
50
Mutairi, Tian, and Tan (2009) examined the CB practices, cost of capital, capital structure,
and dividend policy of several Kuwaiti listed firms. The study reported that 97 percent of
those firms use IRR, followed by 96 percent using of the NPV method when making
investment appraisal decisions. The ARR and PBP methods are less popular, although the
PBP is utilised by 54 percent of firms; its criterion is popular with privately and publicly
owned firms that are managed by CFO with non-MBA with a medium tenure. The findings
also revealed that corporate finance practices varied depending on firm and its management
attributes.
In summary, various studies have surveyed firms in many countries regarding their use of
CB methods. In the US, survey results noted that the sophistication of CB methods used by
CFOs have increased over time. Similarly, some earlier studies of CB practices in South-
east Asia (Malaysia, Hong Kong, Philippines, and Singapore) ascribe equal significance to
DCF and NDCF methods. It appears that Asian and African CFOs tend to rely more on
NDCF methods than sophisticted methods, when selecting long-term investments. Lee and
Ip (1984) revealed that the PBP and the NPV were the most regularly used techniques in
Hong Kong. Wong et al. (1987) revealed that the PBP was the most prevalent prime method
used in Malaysia. In a prior study of Malaysian firms, Han (1986) found that the most
prevalent techniques for adjusting for risk were shortening the PBP and requiring higher
rates of return for riskier investments. Kester and Chong (1998) and Kester et al. (1999)
suggested that CFOs of Singaporean firms found the PBP and IRR to be equally significant
for ranking and analysing long-term investments. The studies, also, suggest that these
results are similar for firms in Australia, Hong Kong, Indonesia, Malaysia and the
Philippines. While there are clear limitations to the literature review, it suggests that a
majority of CB studies are focused on developed markets and that there is a scarcity of
serious analyses of the situation in emerging markets.
51
Aside from the aforementioned studies there are those that attempted to investigate CB
techniques in a comparative manner (Andor et al., 2015; George, 2011; Hermes et al., 2007;
Wong et al., 1987). Wijewardena and De Zoysa (1999) investigated management
accounting practices and found that, while Japanese firms highly relied on ARR and PBP,
Australian firms favoured the use of PBP and NPV. Also, the results indicated that the ARR
and NPV respectively are less preferred methods used by Australian and Japanese firms.
Compared to Australian firms, Japanese firms frequently use NDCF methods when
evaluating capital investment projects.
Wong et al. (1987) examined the capital investment practices of 250, 270 and 240 listed
large firms in, respectively, Malaysia, Singapore, and Hong Kong respectively and found
that the PBP was the most popular means to rank capital investment projects. However,
most firms used other simple or sophisticated techniques when assessing capital projects.
Firms in all three countries undertook little investigation of the risk involved in the
investments and often failed to monitor the implementation of accepted investment
proposals.
Hermes et al. (2007) examined the CB practices of firms drawn from the Netherlands and
China. The study consisted of survey data of 42 Dutch and 45 Chinese firms from 2003-04.
The results revealed that the NPV was more important in Dutch firms than Chinese firms,
Chinese firms rely heavily on the ARR as a tool of evaluating capital investment selection,
and the use of the IRR method does not differ materially between Dutch and Chinese firms.
Chinese firms use cost of equity valuations less often than Dutch firms.
Andor et al. (2015) examined the CB practices using Central and Eastern European firms
(CEE). They investigated 400 firms in 10 CEE countries. The study found that the choice
of CB techniques relates to a country’s environment, geographical regions, and income
52
level. According to the results, 61 percent of firms practice DCF techniques for their capital
investment decisions with the remaining firms using NDCFs such as PBP and ARR. The
survey indicates that corporate finance practices are influenced mostly by firm size,
multinational management culture and ownership. George (2011) examined the effect of
CB practices on economic development using 225 Western European and 120 West African
listed and non-listed firms during 2006-07. The study employed multiple-choice
questionnaires relating to CB practices, firm attributes and respondent’s experiences. The
results suggest that Western European firms use NPV significantly more than West Africa
firms with the ARR being the most favoured technique for West Africa firms. The study
found that choice of CB techniques is significantly influenced by economic development,
financial, human development and technological advancement. Table 2.2 lists the major
findings on CB appraisal techniques in emerging countries.
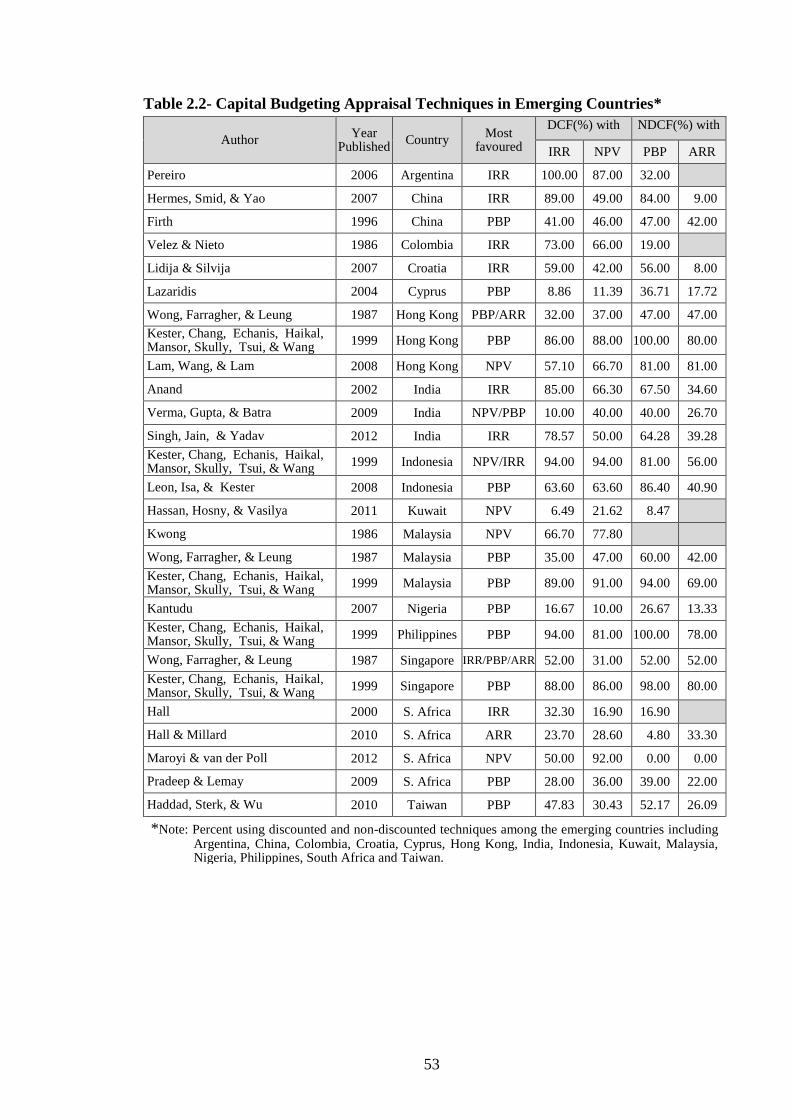
53
Table 2.2- Capital Budgeting Appraisal Techniques in Emerging Countries*
Author Year
Published Country
Most favoured
DCF(%) with NDCF(%) with
IRR NPV PBP ARR
Pereiro 2006 Argentina IRR 100.00 87.00 32.00
Hermes, Smid, & Yao 2007 China IRR 89.00 49.00 84.00 9.00
Firth 1996 China PBP 41.00 46.00 47.00 42.00
Velez & Nieto 1986 Colombia IRR 73.00 66.00 19.00
Lidija & Silvija 2007 Croatia IRR 59.00 42.00 56.00 8.00
Lazaridis 2004 Cyprus PBP 8.86 11.39 36.71 17.72
Wong, Farragher, & Leung 1987 Hong Kong PBP/ARR 32.00 37.00 47.00 47.00
Kester, Chang, Echanis, Haikal, Mansor, Skully, Tsui, & Wang
1999 Hong Kong PBP 86.00 88.00 100.00 80.00
Lam, Wang, & Lam 2008 Hong Kong NPV 57.10 66.70 81.00 81.00
Anand 2002 India IRR 85.00 66.30 67.50 34.60
Verma, Gupta, & Batra 2009 India NPV/PBP 10.00 40.00 40.00 26.70
Singh, Jain, & Yadav 2012 India IRR 78.57 50.00 64.28 39.28
Kester, Chang, Echanis, Haikal, Mansor, Skully, Tsui, & Wang
1999 Indonesia NPV/IRR 94.00 94.00 81.00 56.00
Leon, Isa, & Kester 2008 Indonesia PBP 63.60 63.60 86.40 40.90
Hassan, Hosny, & Vasilya 2011 Kuwait NPV 6.49 21.62 8.47
Kwong 1986 Malaysia NPV 66.70 77.80
Wong, Farragher, & Leung 1987 Malaysia PBP 35.00 47.00 60.00 42.00
Kester, Chang, Echanis, Haikal, Mansor, Skully, Tsui, & Wang
1999 Malaysia PBP 89.00 91.00 94.00 69.00
Kantudu 2007 Nigeria PBP 16.67 10.00 26.67 13.33
Kester, Chang, Echanis, Haikal, Mansor, Skully, Tsui, & Wang
1999 Philippines PBP 94.00 81.00 100.00 78.00
Wong, Farragher, & Leung 1987 Singapore IRR/PBP/ARR 52.00 31.00 52.00 52.00
Kester, Chang, Echanis, Haikal, Mansor, Skully, Tsui, & Wang
1999 Singapore PBP 88.00 86.00 98.00 80.00
Hall 2000 S. Africa IRR 32.30 16.90 16.90
Hall & Millard 2010 S. Africa ARR 23.70 28.60 4.80 33.30
Maroyi & van der Poll 2012 S. Africa NPV 50.00 92.00 0.00 0.00
Pradeep & Lemay 2009 S. Africa PBP 28.00 36.00 39.00 22.00
Haddad, Sterk, & Wu 2010 Taiwan PBP 47.83 30.43 52.17 26.09
*Note: Percent using discounted and non-discounted techniques among the emerging countries including Argentina, China, Colombia, Croatia, Cyprus, Hong Kong, India, Indonesia, Kuwait, Malaysia, Nigeria, Philippines, South Africa and Taiwan.
54
2.5.3 Risk Assessment of Capital Budgeting
Risk analysis of investments is a critical aspect of CB decisions (Chadwell-Hatfield et al.,
1996; Gitman et al, 2011; Ho & Pike, 1991; Ho & Pike, 1998; Zinn, Lesso, & Motazed,
1977). The use of formal risk assessment of investments and the adjustment for risk in
evaluating investments are growing. As the future becomes more uncertain, the chance (or
risk) that estimates made concerning the future will not occur increase (Atrill, 2012;
Brigham, 1992). Risk in terms of CB may be defined as the variability in actual returns
emanating from an investment, over its working life, in relation to estimated returns as
forecasted at the time of the initial CB decision (Jain, Singh, & Yadav, 2013). Risk analysis
is particularly important in investment decisions (Arrow & Lind, 2014; Petty et al., 1996;
Zeeman & Naumann, 2005). Effective capital investment decisions require not only the use
of DCF techniques, proper cash flows, and discount rate estimates, but also risk analysis
(Brigham & Ehrhardt, 2002). This is due to the time scales involved being very long—as a
result, there is more than enough time for things to go wrong between making the decision
and the culmination of the investment. If things do go wrong the impact can be both
significant and lasting (Peter, 2012).
In considering the risk feature of CB, CFOs should apply risk analysis methods to long-
term investments that contribute to the general risk of the firm’s business operations. If the
risk connected with assets proposed for capital investment is greater than normal, the
investment should be subjected to a quicker PBP or a higher hurdle rate. Likewise, if the
investment is exceptionally routine and perhaps even less risky than the norm, the CFOs
should employ less challenging hurdles. Unfortunately, the risk of investment is relatively
challenging for stakeholders and policy makers, as no required disclosure rules apply. This
55
may open the door for agency conflicts, as finance managers underestimate risk and accept
capital investments that should be rejected.
The measurement of return in CB brings with it, its own special challenges. Appraising
future cash flows, their timing, and the level of their uncertainty presents the largest
challenge as return and risk must be measured together by CFOs when employing
techniques (Bennouna et al., 2010).
Finance theory states that firms must take into account risk factors when analysing capital
investments. Drury and Tayles (1996) found UK firms relied on sensitivity analysis as their
favourite means of dealing with investment risk assessment. In the US, Graham and Harvey
(2001) demonstrated that CFOs use a firm-wide discount rate to assess investments which
may have different risk features. Researchers, also, noted that large firms were most likely
to use a risk-adjusted discount rate rather than small firms. Freeman and Hobbes (1991)
noted that Australian CFOs typically use sensitivity analysis as well as comparing best case
and worst case scenarios.
Ryan and Ryan (2002) found the use of quantitative techniques in the US (to analysis
investment risk) was similar with Australia—although there was an increasing use of
scenario analysis, mainly via simulation. Canadian CFOs were seen to use risk analysis
techniques, with the prime ones being scenario analysis, sensitivity analysis and the risk-
adjusted discount rate (Bennouna et al., 2010). The results were similar to the Australian,
Indonesian, Hong Kong, Malaysian, Singaporean and Philippine study by Kester et al.
(1999) who found that sensitivity and scenario methods were the most substantial
techniques used for investment risk assessment. They, also found that the majority of
Australian CFOs use the CAPM; Indonesian and Pilipino CFOs use the cost of debt plus
risk premium method and Hong Kong CFOs use the dividend yield plus growth rate method.
56
Black, Parry, Anderson, and Bennett (2002) note that the majority of New Zealand CFOs
use CAPM, whereas the majority of Chinese, Kuwaiti and Singaporean CFOs use
sensitivity and scenario analysis methods when valuing risk of investments (Chan et al.,
2004; Kester & Chong, 1998; Mutairi et al., 2009). In India, Anand (2002) noted that a
majority of CFOs use sensitivity analysis and scenario analysis when analysing capital
investments, while a few CFOs relied on a risk-adjusted discount rate, Monte Carlo
simulation and decision-tree analysis. Anand, also, noted that large public sector and large
firms were more likely to use scenario analysis for assessing investment risk than private
and smaller firms. Also, large firms were more likely to use decision-tree analysis than
small firms. Brounen et al. (2004) found that large firms were more likely to use NPV and
the CAPM when calculating the discount rate in the UK, the Netherlands, Germany and
France.
2.6 Proper Use of and Pitfalls in Discounted Cash flow
2.6.1 Cash Flow Estimation
Assessment of cash flows requires immense understanding of the investment before it is
implemented (Brigham, 1992; Kashyap, 2014; Modigliani & Miller, 1958). Clearly the
most significant stage in analysing a possible investment is estimating its cash flows and
the investment outlays that will be required as well as the net cash inflows the investment
will produce. Many variables are involved in cash flow forecasting and many individuals
and sections of the firm participate in the process (Brigham & Gapenski, 1997). Cash flow
estimation can be considered from two different angles; cash inflows and outflows that:
Are represented by the increase in revenue that is attributable to the investment
under review; These also arise as savings in future costs resulting from the purchase
of an item of plant or business arrangement (Wilson & Keers, 2003),
57
Result from future costs and expenses associated with an investment; In estimating
these cash flows, any interest or finance charges on funds acquired should be
ignored (Wilson & Keers, 2003).
In terms of specific characteristics of CB practice, DCF techniques should be based on cash
flows and not accounting income (Brealey & Myers, 2003). Estimating cash flows properly
is more vital than fine-tuning the other investment estimations. It is difficult to estimate
most investments’ tangible cash flows accurately. DCF calculations do not call for accurate
estimates but for accurate assessments of the mean of possible outcomes (Myers, 1984).
Common issues in estimating discounted cash flows are deducting from accounting
income: non-cash expenses (e.g., depreciation); an allocation of existing overhead costs;
interest expenses, and income tax (Nicholson & Ffolliott, 1966). Such errors make it
extremely difficult for top management to verify the true cash flows, risks and the present
value of capital investment proposals. Moreover, firms are expected to recognise inflation
in CB decisions (Brigham & Ehrhardt, 2011). Inflation impacts not only on an investment’s
future cash flows but also the opportunity cost used as the discount rate (Menachem &
Venetia, 1983). In the UK, inflation was properly treated in DCF analysis by only 27
percent of firms (Drury & Tayles, 1996) and also Pike (1996) found that there had been a
significant increase in the number of firms making explicit adjustments for inflation: 58
percent of firms made adjustments for changes in general inflation while 56 percent of firms
specified different rates for all costs and revenues. Pike (1996) also found that 70 percent
of firms estimated future cash flows at constant prices and discounted the investment cash
flows at real discount rates. This method is only consistent with financial theory if the
assumptions apply, in that future cash flows are expected to increase at the general rate of
inflation and income tax and therefore the results indicated are surprising in relation to the
increasing sophistication of CB techniques employed. According to Ryan and Ryan (2002)
only 31 percent of the firms in the US always or often use inflation adjusted cash flows.
58
McLaney, Pointon, Thomas, and Tucker (2004) noted that 67 percent of UK firms took tax
effects into account when estimating the cost of capital, while Truong et al. (2008) revealed
that in most Australian firms, investment analysis took no account of the value of
imputation tax credits.
2.6.2 Cost of Capital
The cost of capital is the expected rate of return that is needed to draw market participants
to a particular investment (Frino et al., 2013; Gitman et al., 2011; Zeeman & Naumann,
2005). In economic terms, the cost of capital for a given investment is the opportunity cost
of forgoing the next best alternative investment (Petty, et al., 1996; Pratt & Grabowski,
2008). The cost of capital is the main parameter of DCF calculation (Bennouna et al., 2010).
The firm’s cost of capital expressed as a decimal or percent is used in two ways in CB: i)
as a minimum profitability rate that prospective investment returns must exceed; and ii) as
a discount rate applied to cash flows. The cost of capital is a factor in compensation plans,
with bonuses dependent on whether the firm’s return on invested capital exceeds the cost
of capital (Brigham & Ehrhardt, 2011). The cost of capital is a crucial issue for the firm as
it provides the discount rate in the evaluation of capital investment. The intuitive appeal of
the capital asset pricing model (CAPM) and weighted average cost of capital (WACC)
methods ensures their sustained popularity in firms (McLaney et al., 2004; Zeeman &
Naumann, 2005).
CFOs regularly employ the CAPM as a technique to assess the viability of investment
proposals and estimate the cost of capital for which they need to know the market risk
premium. In the CAPM model, the cost of capital of an investment can be predicted based
on the beta of the investment and the market risk premium. Another method also used to
estimate cost of capital is the WACC. This WACC is a vital metric in the traditional
59
literature of corporate finance. The WACC is intended to be the cut-off point in CB
decisions. CFOs tend to view investments that equal or exceed the hurdle rate as
contributing to stakeholder wealth maximisation, while those that fail are viewed as being
dilutive to value.
Various studies have considered the way in which the cost of capital has been calculated
and employed as the discount rate in CB. Westwick and Shohet (1976) found that in UK
the most popular method for selecting the minimum rate of return for use in investment
appraisal decisions was to use the firm’s bank overdraft rate while less than 10 percent
firms mentioned the use of a WACC. This has changed significantly over the subsequent
years. Hodgkinson (1989) found that 36 percent of large firms in the UK used the WACC
as the discount rate. In more recent years, slightly over half of the UK firms employ a
WACC estimate. Arnold and Hatzopoulos (2000); McLaney et al. (2004) note that the
WACC is the most popular approach used in estimating the cost of capital. Interestingly, a
significant minority of smaller firms are still using the interest rate payable on debt. Graham
and Harvey (2001) reported that only 47 percent of firms surveyed in the UK used the
CAPM compared to 73 percent usage of the CAPM in the US. In Canada, Payne et al.
(1999) compared the CB practice of US and Canadian firms and found that the WACC is
more popular in the US than in Canada. This considerable preference for the CAPM has
also been confirmed through other studies in Canada (Bennouna et al., 2010; Jog and
Srivastava, 1995) and Central and Eastern Europe (CEE) countries (Andor et al., 2015). In
Australia, Freeman and Hobbes (1991) found that only 40 percent of firms use the WACC
to evaluate investment while 39 percent of firms use the cost of borrowing. However,
Truong et al. (2008) noted that the CAPM is the most common method used in estimating
the cost of capital in Australia. The next most popular method is the cost of debt plus some
premium for equity. It seems that alternative asset pricing models are not being adopted by
60
Australian firms. This study supports the Kester et al. (1999) assertion of increasing usage
of the CAPM for estimating the cost of capital. The Australian results are similar to Graham
and Harvey’s (2001) study in the US.
Usage of the CAPM in Australia is substantially higher than in the UK (McLaney et al.,
2004), or Canada (Jog & Srivastava, 1995). In the European context, Brounen et al. (2004)
found a slightly different practice in the use of CAPM relative to findings from other
countries. Nevertheless, rule-of-thumb techniques continue to enjoy extensive use. The
WACC is widely used as a discount rate in estimating the cost of capital. A survey of
Paksitani firms by Hussaini and Shafique (2013) found the WACC method to be dominant.
Research in India noted that the CAPM was the most popular method with 54 percent of
firms estimating a cost of capital (Anand, 2002). The second and the third most popular
methods are Gordon’s dividend discount model and earnings yield. In a comparative study
between Dutch and Chinese firms, the results indicated that 67 percent of Dutch firms used
the WACC for discounting purpose while only 10 percent of Dutch firms used a project
dependent (risk-adjusted) cost of capital. Similarly, with Chinese firms, 53 percent of firms
frequently used the WACC, with 29 percent firms mentioning the use of the cost of debt.
16 percent of firms suggested the use of a project dependent cost of capital. Chinese firms
appear to use the cost of debt more often (Hermes et al., 2007). Kester and Chong (1998)
report that 52 percent of Singaporean firms use a single discount rate while the remaining
firms rely on the WACC. In a South African survey, Pocock, Correia, and Wormald (1991)
found that 35 percent of firms employ the cost of the specific source of finance for the
investment as the discount rate. In Indonesia, 47 percent of firms use risk premium methods
to calculate their cost of equity while risk-adjusted discount rates and the CAPM are less
frequently used (Farah et al., 2008).
61
2.7 Contingent Variables and Capital Budgeting
Identifying contingent variables for CB decisions is a very delicate and a somewhat difficult
task, that needs to consider all the complex interrelationships between CB practices and
performance (Gordon & Miller, 1976; Maccarrone, 1996; Pike & Ho, 1991). The problem
is very hard to resolve because a large number of factors influence CB practices and
investment outcomes.
Some of these factors are quantifiable while others are internal and managerial.
Contingency theories of finance classify a number of different types of variables. The
existing literature shows that important characteristics (contingencies) affecting firm
structure include; firm characteristics, environmental uncertainty and behavioural
characteristics (Covaleski, Dirsminth, & Samuel, 1996; Mitchell, 2002; Reid & Smith,
2000).
Capital-budgeting focused studies have an extensive tradition in corporate finance literature.
Mainly these studies focus on developed and emerging nations, some studies include
contingent constructs which explore interconnections between CB practices and contingent
attributes.
Firm attributes such as size, capital concentration, risk and uncertainty, ownership and
industry attention are considered important determinants of CB practices (Abdel-Kader &
Luther, 2008; Chen, 1995; Pike, 1983). Firm size reflects the resources available to the firm.
The amount of economic activity a firm can engage in is directly influenced by its size.
Generally, firm size is an important factor that can affect structure and other control
arrangements of the firm (Abdel-Kader & Luther, 2008; Hall & Weiss, 1967; Marcus,
1969). Haldma and Lääts (2002) argue that the sophistication in CB practices tends to
increase in line with firm size. Moving from simple to more sophisticated practices requires
62
resources and specialists which tend to be more affordable by large firms. Existing studies
have shown that large firms employ the NPV method more often and to a greater extent
than the IRR method (Arnold & Hatzopoulos, 2000; Mutairi et al., 2009). Drury and Tayles
(1996) reported that DCF techniqhes are used far more extensively by larger firms than
smaller firms. Further analysis revealed that 90 percent of the larger firms and 35 percent
of the smaller firms widely use either NPV or IRR discounting methods. Hermes et al.
(2007) also found that larger firms most frequently use the NPV method to a larger extent
than smaller firms. In Australia, Freeman and Hobbes (1991) note that the use of DCF
methods increased with the size of the capital expenditure. Ryan and Ryan (2002) found a
positive relationship, in the US, between the use of the NPV and IRR methods and the size
of the capital budget. However, PBP was used by a greater percentage of firms with smaller
capital budgets. These results are similar to the findings by Trahan and Gitman (1995),
Graham and Harvey (2001) and Mutairi et al. (2009) and reveal a link between the use of
DCF methods and the size of the firm or the level of the firm’s capital intensity. The more
capital intensive a firm is, the more likely it will use DCF methods. Moreover, Graham and
Harvey (2001) note that highly levered firms were significantly more likely to use NPV
and IRR than firms with small debt ratios. The study found significant differences between
high and low leverage in small firms as well as high and low leverage in large firms.
Determining which firm-specific and environmental factors affect a firm’s CB practices is
difficult and a clear understanding of a firm’s internal and external environments is
necessary (Hassan, Shao, & Shao, 1997). The environment of the firm is conceptualised in
terms of perceived uncertainties (Duncan, 1972). Piper (1978) noted that if the investment
projects are either failing or are not being completed on schedule; they suggest that one of
the reasons for these failures relates to poor financial control structure. Also, Daft and
Maclntosh (1978) identified task variety and task knowledge as factors affecting the design
63
of management information systems. Studies conducted by Hopwood (1972) and Otley
(1978) show that a firm’s structure affects the manner in which budgetary information is
best used. Segelod (1998) confirmed that there were differences in the use of sophisticated
CB practices among industrial sectors. While capital intensive industries appear to rely on
such techniques as decision-making tools, knowledge-intensive industries (in particular
professional service firms) hardly make use of CB techniques in their investment decisions.
Hence, industry adjustment can be considered very relevant, when estimating the
relationship between firm performance and CB practices.
A measure of the expertise level of the CFOs is necessary, since it may be predictable that
CFOs with higher skills (a higher level of education, experience and maturity, etc.) will
have less difficulty in understanding and using sophisticated CB techniques. Hermes et al.
(2007) assert that highly educated, younger CFOs are more likely to use the NPV method,
as compared to less educated, older CFOs. Also, firms with over-seas operations had a
significantly higher usage for NPV than firms with no over-seas operations. Graham and
Harvey (2001) found that CFOs with an MBA were more likely to use the PBP criterion,
which was also popular among more mature CFOs. In addition, CFOs with MBAs were
more likely to use a single factor CAPM or the CAPM with extra risk factors than non-
MBA CFOs. Similarly, in the Kuwait setting, the PBP criterion was very popular among
privately and publicly-owned firms managed by CFOs with non-MBA who had medium
tenures. More mature CFOs were more likely to use scenario analysis, decision analysis
and probabilistic analysis than younger CFOs (Mutairi et al., 2009).
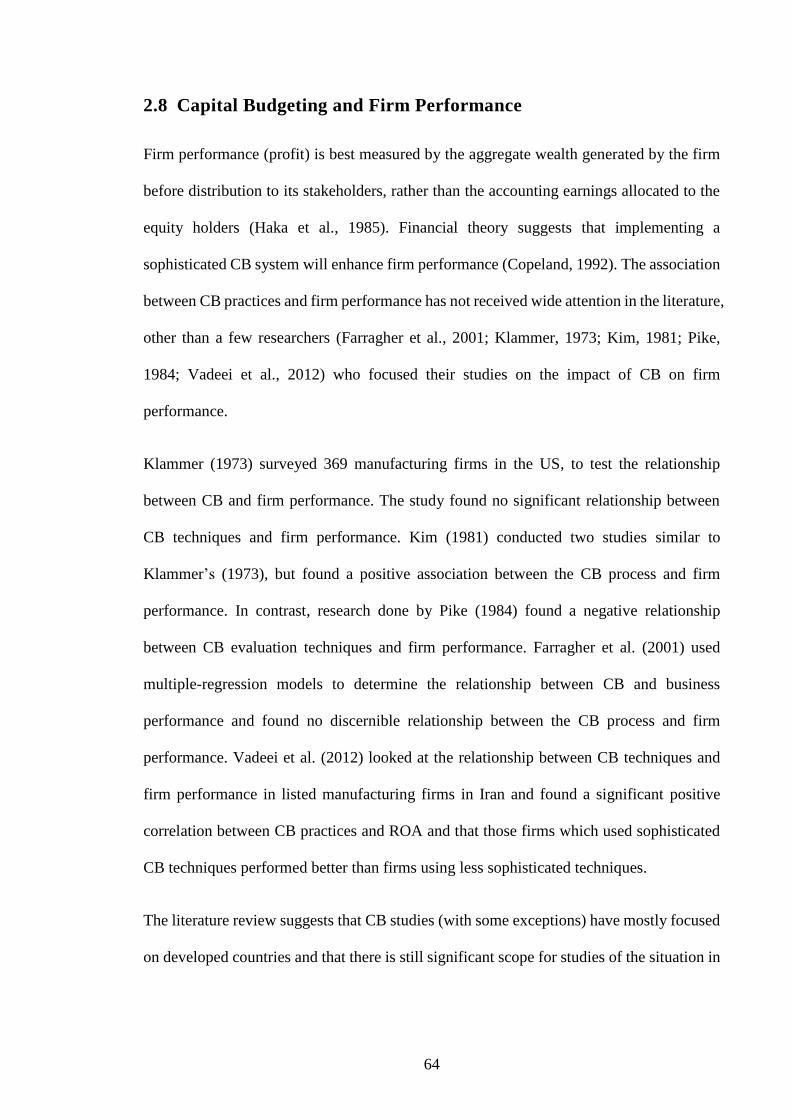
64
2.8 Capital Budgeting and Firm Performance
Firm performance (profit) is best measured by the aggregate wealth generated by the firm
before distribution to its stakeholders, rather than the accounting earnings allocated to the
equity holders (Haka et al., 1985). Financial theory suggests that implementing a
sophisticated CB system will enhance firm performance (Copeland, 1992). The association
between CB practices and firm performance has not received wide attention in the literature,
other than a few researchers (Farragher et al., 2001; Klammer, 1973; Kim, 1981; Pike,
1984; Vadeei et al., 2012) who focused their studies on the impact of CB on firm
performance.
Klammer (1973) surveyed 369 manufacturing firms in the US, to test the relationship
between CB and firm performance. The study found no significant relationship between
CB techniques and firm performance. Kim (1981) conducted two studies similar to
Klammer’s (1973), but found a positive association between the CB process and firm
performance. In contrast, research done by Pike (1984) found a negative relationship
between CB evaluation techniques and firm performance. Farragher et al. (2001) used
multiple-regression models to determine the relationship between CB and business
performance and found no discernible relationship between the CB process and firm
performance. Vadeei et al. (2012) looked at the relationship between CB techniques and
firm performance in listed manufacturing firms in Iran and found a significant positive
correlation between CB practices and ROA and that those firms which used sophisticated
CB techniques performed better than firms using less sophisticated techniques.
The literature review suggests that CB studies (with some exceptions) have mostly focused
on developed countries and that there is still significant scope for studies of the situation in
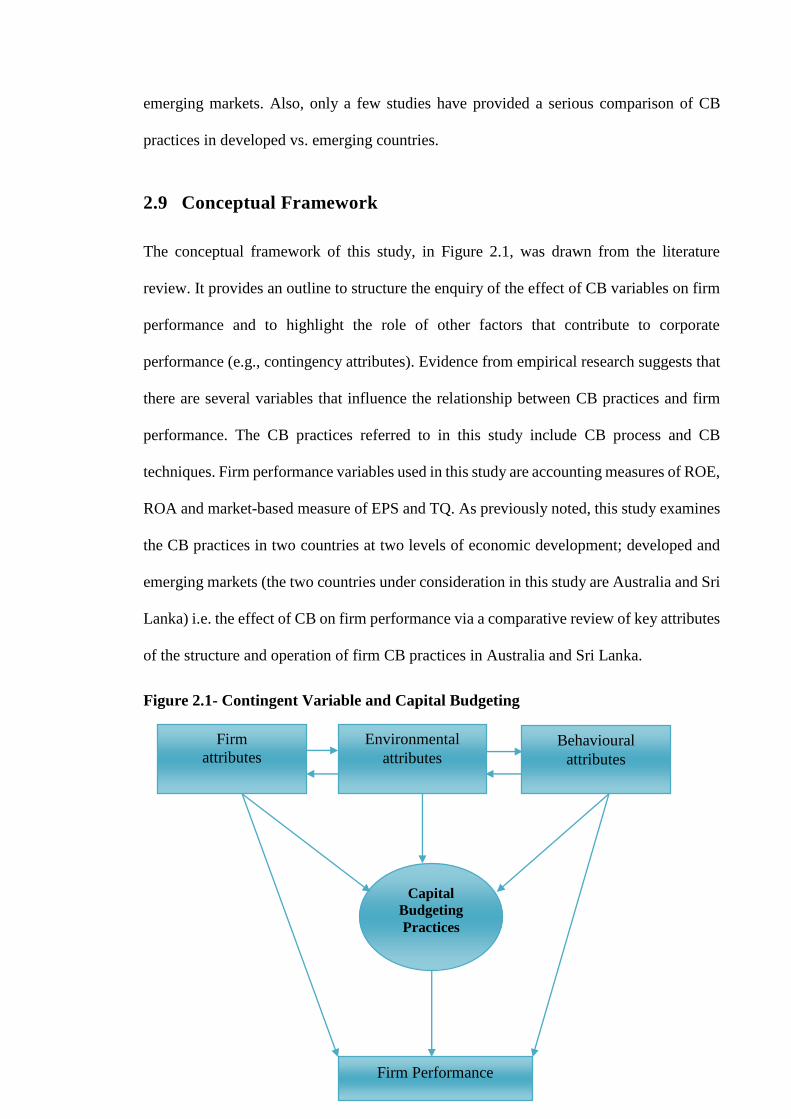
65
emerging markets. Also, only a few studies have provided a serious comparison of CB
practices in developed vs. emerging countries.
2.9 Conceptual Framework
The conceptual framework of this study, in Figure 2.1, was drawn from the literature
review. It provides an outline to structure the enquiry of the effect of CB variables on firm
performance and to highlight the role of other factors that contribute to corporate
performance (e.g., contingency attributes). Evidence from empirical research suggests that
there are several variables that influence the relationship between CB practices and firm
performance. The CB practices referred to in this study include CB process and CB
techniques. Firm performance variables used in this study are accounting measures of ROE,
ROA and market-based measure of EPS and TQ. As previously noted, this study examines
the CB practices in two countries at two levels of economic development; developed and
emerging markets (the two countries under consideration in this study are Australia and Sri
Lanka) i.e. the effect of CB on firm performance via a comparative review of key attributes
of the structure and operation of firm CB practices in Australia and Sri Lanka.
Figure 2.1- Contingent Variable and Capital Budgeting
Capital
Budgeting
Practices
Firm
attributes
Environmental
attributes Behavioural
attributes
Firm Performance

66
Figure 2.2- Conceptual Framework: Capital Budgeting Practices and Firm Performance
2.10 Research Gap and Contribution to the Literature
This research seeks to reduce a gap in the extant literature on the relationship between CB
practices and firm performance by documenting and performing a comparative analysis on
CB practices, processes, techniques, and outcomes. Many researchers have over the years
made extensive efforts to survey and identify the quantitative techniques used by firms
around the world. Early and recent research in CB in the US (Graham & Harvey, 2001),
UK (Arnold & Hatzopoulos, 2000), Sweden (Sandahal & Sjogren, 2003), UK, Netherlands,
Germany and France (Brounen et al., 2004), Netherlands and China (Hermes et al., 2007)
and Australia (Truong et al., 2008), have reported that, over time, firms are increasingly
adopting more refined CB practices. However, for the most part, these studies have focused
on the application and enhancement of modelling techniques. The trend towards the
adoption of more refined CB practices has led researchers to consider whether these
refinements have actually improved firm performance and profitability. Studies conducted
in this area have yielded mixed results Specifically, while Christy, (1966); Farragher et al.
(2001); Klammer (1973); Pike (1984) found that merely adopting refined CB practices does
not enhance firm performance, other studies identified an association between CB practices
67
and firm performance (Kim, 1981; Vadeei et al., 2012). These mixed outcomes, in the
extant literature, point to a gap in the understanding of the relationship between CB
practices and firm performance, especially in terms of differences between firms in
developed and emerging countries.
This study seeks to reduce the above gap by studying similarities and differences in the
relationship between CB practices and firm performance in a developed country (Australia)
and in a emerging country (Sri Lanka). This study and its findings should provide a
framework than can contribute to firms in both developed and emerging countries and, also,
help structure future research on a relatively large sample of firms from developed and
emerging countries. Thus, this study seeks insights that will prepare the way for general
rules and outcomes in future research.
2.11 Chapter Summary
This chapter reviewed the extant literature in relation to CB practices and firm performance
in developed and emerging countries and is a foundation for subsequent work, presented in
the following chapters. The extant literature reviewed includes works on: CB theoretical
constructs, processes, and evaluation approaches; along with: agency costs, asymmetric
information effects, risk assessment issues, and firm performance.
The significant role that CB practices play in corporate finance is well established by reams
of research articles. Some of this research considers CB processes, some uses an evaluation
approach in examining: CB appraisal techniques, cost of capital, and risk assessment issues.
There appears to be a somewhat limited number of studies undertaken on emerging
countries with most focusing on an empirical analysis of CB appraisal and even less

68
research that identifies similarities and differences in CB practices and firm performance
in developed and emerging countries.
The mixed outcomes in the extant literature and a dearth of comparative studies suggest a
significant gap in understanding CB practices and firm performance, especially in terms of
similarities and differences in developed and emerging countries. This study seeks to fill
this gap by examining the impact of CB practices and firm performance of the listed firms
in Australia and Sri Lanka. The next chapter presents a brief review of the capital market
situation and context in Australia and Sri Lanka.

69
Chapter Three: Economic, Financial Situation and
Development of Capital Markets in Australia and Sri
Lanka
3.1 Chapter Introduction
As previously noted, the objective of this study is to contrast the CB practices of firms in a
developed country with the CB practices made by their counterparts in an emerging country
and to investigate their differences and similarities via selected samples of Australian and
Sri Lankan listed firms. Accordingly, this chapter provides the Australian and Sri Lankan
background and the attributes of both economies in general and in particular, their capital
markets. This chapter also presents the features of the Australian and Sri Lankan financial
markets that may affect an investment decision and firm performance. Furthermore, this
chapter highlights important issue that is, the structure of listed firms in both countries, as
it provides a safeguard for investors and stakeholders. Additionally, the chapter investigates
the financial and economic stability of both countries, because it is considered a vital
substance of business’s domains in today’s global economy. This chapter is organised as
follows: Section 3.1 provides a background of Australia. Section 3.2 provides a background
of Sri Lanka. The chapter ends with a summary.
3.2 Australia at a Glance
Australia is the sixth largest country in the world in terms of its geographical area
(Rawlings-Way, 2011). It is the smallest of the continents and the largest island (Beck,
2015; Rajkumar & Hoolahan, 2004; Schiller, Herzfeld, Brinkman, & Stuart, 2014).
Australia is situated within Oceania which borders both the Indian Ocean and the South
Pacific Ocean. Australia is comprised of mainland Australia, the island of Tasmania and
several small islands in the Indian and Pacific oceans with a total area of 7,686,850 km²

70
and 25,760 km of coastline (Oliver, 1989). Australia is a stable, culturally diverse and
democratic society with one of the strongest performing economics in the world (Secombe
& Smolicz, 2015). Australia is a developed nation with: a relatively small open economy,
a population of around 24 million residents in 2013/14, business practices and regulations
that are respected (e.g., its Corruption Perceptions index6 (CPI) is 80/100 where 100 is no
corruption), strong institutions that helped Australia comfortably weather the GFC.
Interestingly, while Australia acknowledged its ability to weather the GFC, it continuously
improves its capital markets via regulations and encouraging high corporate ethical
standards (Hugo, 2014). Australia is home to one of the world’s oldest living cultures with
its native aboriginal people having arrived 40,000 to 60,000 years before European contact
(Rose, 2014). Since European settlement in the late 18th century, Australia identities,
population and cultural makeup evolved from British roots, but in changed direction in
response to two world wars, mass migration, and Australia’s rising Asia-Pacific and global
partnerships and responsibilities. As a result, Australia is among the world’s most ethnically
diverse cultural mosaics (Turner, 2003). Industrial and manufactured goods account for
much of Australia’s Gross Domestic Product (GDP)7 (Pietroforte & Gregori, 2003) and its
main industries include: mining, food processing, and manufacturing (industrial and
transportation equipment, chemicals, iron and steel, textiles, machinery and motor vehicles).
The Australian (2004-12) socio-economic conditions are listed in Table 3.1.
6 The corruption perception index was created in 1995 by Transparency International, annually ranking
countries by their perceived levels of corruption, as determined by expert assessments and opinion surveys. 7 GDP is the monetary value of all the finished goods and services produced within a country's borders in a
specific time period.
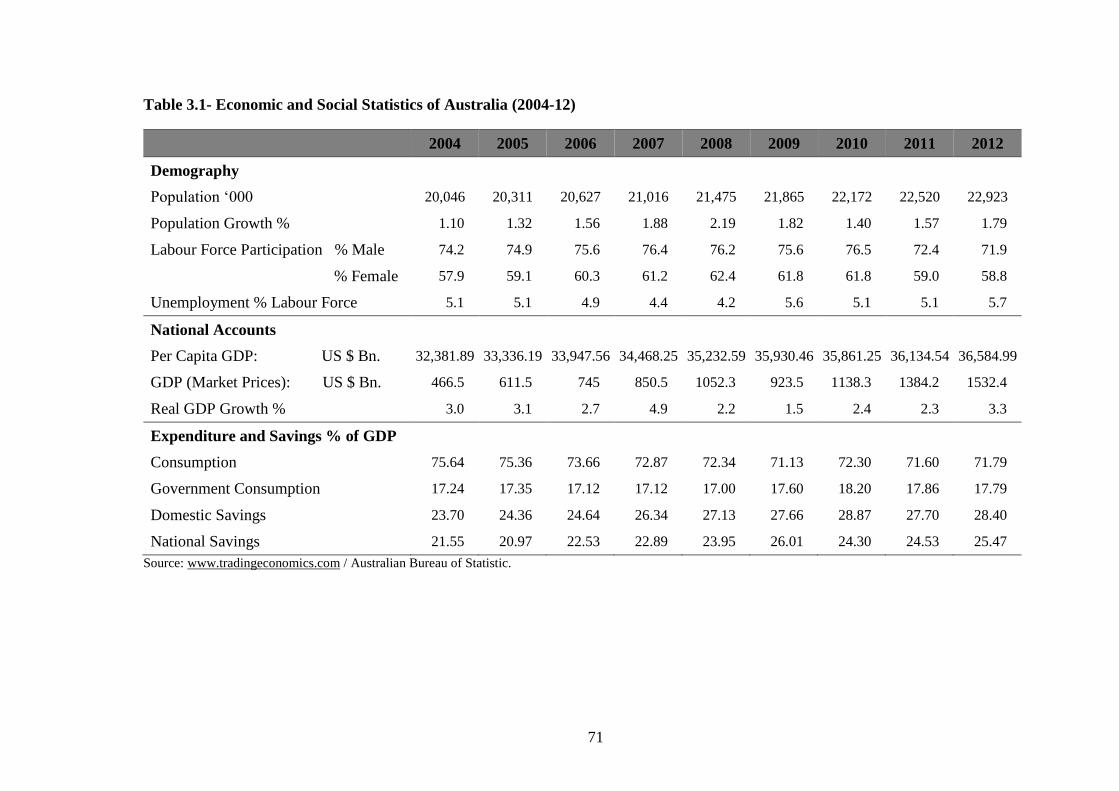
71
Table 3.1- Economic and Social Statistics of Australia (2004-12)
2004 2005 2006 2007 2008 2009 2010 2011 2012
Demography
Population ‘000 20,046 20,311 20,627 21,016 21,475 21,865 22,172 22,520 22,923
Population Growth % 1.10 1.32 1.56 1.88 2.19 1.82 1.40 1.57 1.79
Labour Force Participation % Male 74.2 74.9 75.6 76.4 76.2 75.6 76.5 72.4 71.9
% Female 57.9 59.1 60.3 61.2 62.4 61.8 61.8 59.0 58.8
Unemployment % Labour Force 5.1 5.1 4.9 4.4 4.2 5.6 5.1 5.1 5.7
National Accounts
Per Capita GDP: US $ Bn. 32,381.89 33,336.19 33,947.56 34,468.25 35,232.59 35,930.46 35,861.25 36,134.54 36,584.99
GDP (Market Prices): US $ Bn. 466.5 611.5 745 850.5 1052.3 923.5 1138.3 1384.2 1532.4
Real GDP Growth % 3.0 3.1 2.7 4.9 2.2 1.5 2.4 2.3 3.3
Expenditure and Savings % of GDP
Consumption 75.64 75.36 73.66 72.87 72.34 71.13 72.30 71.60 71.79
Government Consumption 17.24 17.35 17.12 17.12 17.00 17.60 18.20 17.86 17.79
Domestic Savings 23.70 24.36 24.64 26.34 27.13 27.66 28.87 27.70 28.40
National Savings 21.55 20.97 22.53 22.89 23.95 26.01 24.30 24.53 25.47
Source: www.tradingeconomics.com / Australian Bureau of Statistic.
72
3.2.1 An Overview of Social Environments in Australia
Australia is the only country to govern a whole continent; it is the earth’s biggest island; it
is a compact continent that is approximately 3,900 km from east to west and about 3,220
km from north to south at its widest and largest points (Morgan, 2012). About a third of
the continent is classified as arid (receiving less than 250 mm average annual rainfall) and
another third is semi-arid (250 to 500 mm). However, Australia’s coastal areas have
climates ranging from tropical to Mediterranean-style to temperate and usually receive
regular rainfall (Alexander, Hope, Collins, Lynch, & Nicholls, 2007). Australia, one of the
world’s most multicultural countries, is rich in indigenous and immigrant cultures (Smolicz,
1997). Over a quarter of Australia’s population was born overseas (Human Development
Report, 2011). The total population in Australia was last recorded at 22.8 million residents
in 2012 from 10.3 million in 1960, changing 122 percent during the last 50 years
(Krockenberger, 2015). Australia is a multi-ethnic, multi-religious country with a diverse
and rich culture. The majority of its peoples are of European heritage, making up 92 percent
of the country’s population. Other ethnic groups that are part of the country’s social fabric
are Asians (seven percent), aboriginal and others (one percent). The age-dependency ratio
(percent of working-age people) in Australia was 49.11 in 2012 (World Bank, 2013). The
life expectancy8 at birth has, on average, been higher for females than males—e.g., a boy
born in 2009-11 can expect to live, on avaerge 79.7 years, while a girl born in 2009-11 can
expect to live 84.2 years (ABS, 2015).
8 Life dependency ratio is the ratio of dependent people younger than 15 or older than 64 to the working age
population those ages 15-64.
73
3.2.2 An Overview of Economic Environments in Australia
In terms of output (GDP), Australia is a relatively large economy (estimated, in 2015, to be
the world’s 13th largest national economy; Eslake, 2002) with only 0.3 percent of the
world’s population. At US$ 1.5 trillion, Australia’s nominal GDP is two percent of the
global economy (ATC, 2015) and the Australian economy has experienced continuous
growth over the last few decades (McLean, 2004). While Australia’s economy is dominated
by services (e.g., 80 percent of economic output), its economic success is based on an
abundance of agricultural and mineral resources (McLachlan, Clark, & Monday, 2002).
Australia’s comparative advantage in the export of primary products is a reflection of the
natural wealth of the Australian continent, its former status as a British coloney, and its
small domestic market. The country is, also, a major regional financial centre and a vital
part of the global financial system. In 2012, Australia’s economic growth put it among the
fastest growing advanced nations (ABS, 2015). Investment has, in recent years, risen very
high (relative to GDP) and is one of the highest among developed economies (Nicholls &
Rosewall, 2015). Employment growth has also been strong.
Australia’s relatively good growth over the past couple of decades (ABS, 2015) flowed
from a long sucession of economic reforms and the adoption of prudent and disciplined
economic policies. However, slowing productivity growth caused GDP growth in the latest
decade to not be as fast as it was in the previous decade. Even though there is significant
variation in growth across states and industries, the benefits of growth are spread relatively
widely across states, regions, and the population.
74
3.2.3 Australian Financial Markets
Australia’s powerful financial markets provide ready access to a wide range of financial
products and services, including money exchange and derivatives.
The ASX Group's origin as a national exchange goes back to 1987, when “The Australian
Stock Exchange Limited” was formed by legislation drafted by the Australian Parliament
to amalgamate six independent state-based stock exchanges. Each of those exchanges
brought with it a history of share trading dating back to the 19th century. In 2006 The
Australian Stock Exchange merged with the Sydney Futures Exchange and originally
operated under the name Australian Securities Exchange. Later, however, ASX launched a
new group structure to better position it in the contemporary financial market environment.
From August 1, 2010 the Australian Securities Exchange has been known as the ASX
Group (Australian Stock Exchange, 1996; ASX, 2016).
The early trading history of the Australian stock exchanges was associated with the
provision of long-term funds for mines, railways, banks and insurance firms. During the
early 1920’s the exchange played a significant role as a medium for the raising of funds for
the Australian Government, which had previously relied on funds from Britain. In 1988,
1,429 firms were listed on the ASX; by 1999 the number had declined to 1,159 and by July
2012 the number was above 2,205 with a total value of AU$ 1,228,855 million. The
Australian Stock Exchange (ASX) is a very large securities market, with approximately
578,000 trades per day. Australia has the highest participation rate of any country in the
share market and the ASX reports that more than 41 percent of adult Australians now own
shares (Ross, et al., 2014).
The ASX is the central marketplace in which Australian corporations raise funds. It offers
investors an efficient facility for buying and selling shares and other listed securities. The
75
ASX is one of the world’s leading financial market exchanges, offering a full range of
services, including listings, trading, clearing and settlement, across a comprehensive range
of asset classes. As the first major financial market open every day, ASX is a world leader
in raising capital, consistently ranking among the top five exchanges globally.
With a total market capitalisation of around AU$ 1.5 trillion, the ASX is home to some of
the world’s leading resource, finance and technology firms. The ASX’s network and data
centres are connected to leading financial hubs, speed, reliability, state of the art technology
and the diversity of the user community are fundamental to the success of the Sydney based
ASX Australian liquidity centre. The ASX operates in a world-class regulatory
environment with over 150 years of exchange experience and has almost 2,200 listed firms
and issuers.
Approximately 125 taxes (including commonwealth taxes such as income tax) make the
Australian taxation system highly complex. Many different organisations play different and
varied roles within the system and ensure its integrity, including equitable treatment of all
Australians (ABS, 2015). Moreover, The ASX corporate governance council was formed
in August 2002 and has been chaired by the ASX Group (ASX) since its inception (ASX,
2016). This document marks the first revision of the Council’s corporate governance
principles and recommendations since they were issued in March 2003. Since 2003, the
Council has developed and released recommendations on the corporate governance
practices to be adopted by ASX listed companies designed to promote investor confidence
and to assist listed companies to meet stakeholder expectations (ABS, 2015).
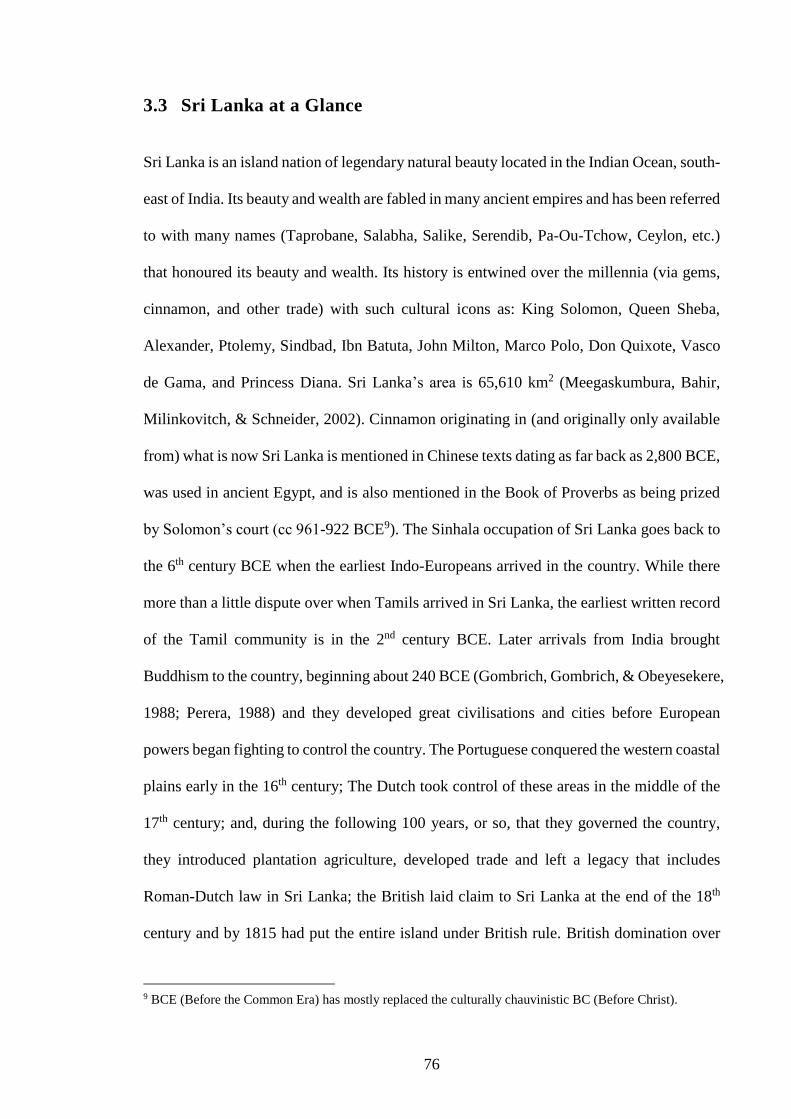
76
3.3 Sri Lanka at a Glance
Sri Lanka is an island nation of legendary natural beauty located in the Indian Ocean, south-
east of India. Its beauty and wealth are fabled in many ancient empires and has been referred
to with many names (Taprobane, Salabha, Salike, Serendib, Pa-Ou-Tchow, Ceylon, etc.)
that honoured its beauty and wealth. Its history is entwined over the millennia (via gems,
cinnamon, and other trade) with such cultural icons as: King Solomon, Queen Sheba,
Alexander, Ptolemy, Sindbad, Ibn Batuta, John Milton, Marco Polo, Don Quixote, Vasco
de Gama, and Princess Diana. Sri Lanka’s area is 65,610 km2 (Meegaskumbura, Bahir,
Milinkovitch, & Schneider, 2002). Cinnamon originating in (and originally only available
from) what is now Sri Lanka is mentioned in Chinese texts dating as far back as 2,800 BCE,
was used in ancient Egypt, and is also mentioned in the Book of Proverbs as being prized
by Solomon’s court (cc 961-922 BCE9). The Sinhala occupation of Sri Lanka goes back to
the 6th century BCE when the earliest Indo-Europeans arrived in the country. While there
more than a little dispute over when Tamils arrived in Sri Lanka, the earliest written record
of the Tamil community is in the 2nd century BCE. Later arrivals from India brought
Buddhism to the country, beginning about 240 BCE (Gombrich, Gombrich, & Obeyesekere,
1988; Perera, 1988) and they developed great civilisations and cities before European
powers began fighting to control the country. The Portuguese conquered the western coastal
plains early in the 16th century; The Dutch took control of these areas in the middle of the
17th century; and, during the following 100 years, or so, that they governed the country,
they introduced plantation agriculture, developed trade and left a legacy that includes
Roman-Dutch law in Sri Lanka; the British laid claim to Sri Lanka at the end of the 18th
century and by 1815 had put the entire island under British rule. British domination over
9 BCE (Before the Common Era) has mostly replaced the culturally chauvinistic BC (Before Christ).
77
the next 150 years saw the introduction of coffee, tea, rubber and coconut plantations and
efficient administration. In 1948, Sri Lanka became a self-governing dominion within the
British Commonwealth (De Silva, 1981; Peebles, 2006).
The development strategies that shaped Sri Lanka’s economy over the six decades
following independence can be gathered into two eras.
1948 to 1976, during which economic policies were aimed at import substitution
oriented industrialisation, and
Post 1976, during which the economy shifted toward a free market strategy.
Sri Lanka has made substantial progress in such areas as education—e.g., the literacy rates
are 92.8 and 90 percent for males and females, respectively (CBSL, 2013). Table 3.2 shows
the economic and social indicators for Sri Lanka during the period 2004-12.
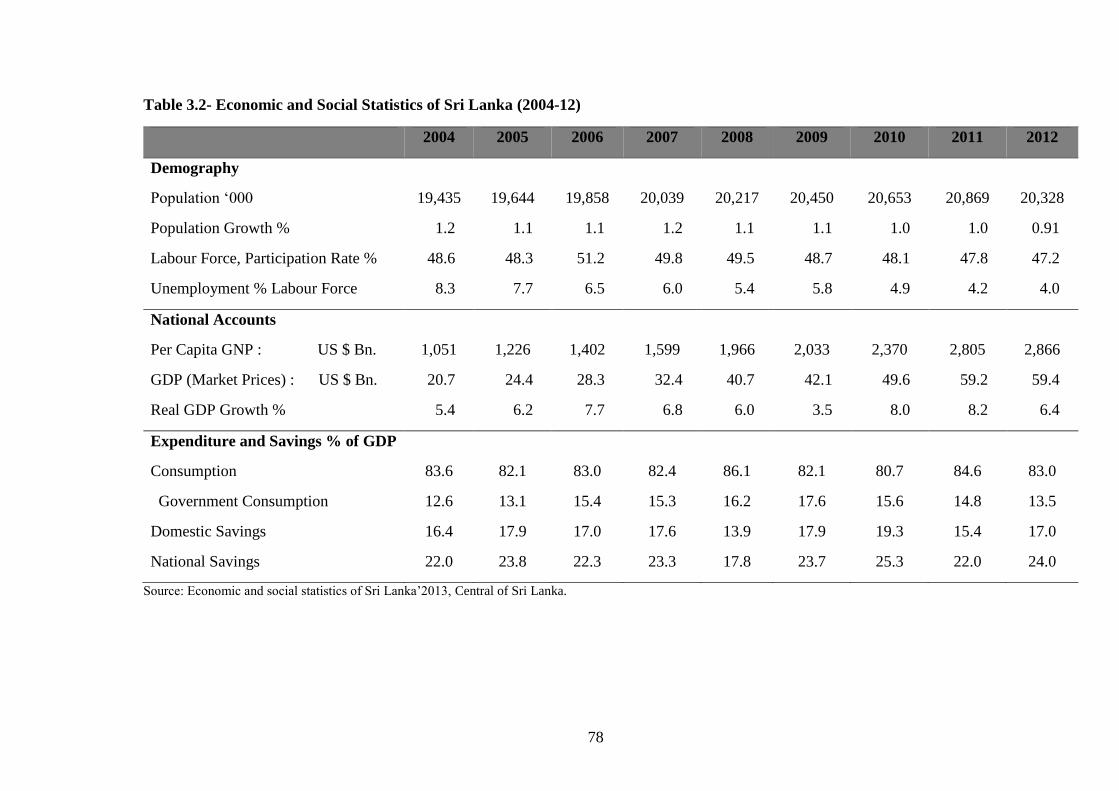
78
Table 3.2- Economic and Social Statistics of Sri Lanka (2004-12)
2004 2005 2006 2007 2008 2009 2010 2011 2012
Demography
Population ‘000 19,435 19,644 19,858 20,039 20,217 20,450 20,653 20,869 20,328
Population Growth % 1.2 1.1 1.1 1.2 1.1 1.1 1.0 1.0 0.91
Labour Force, Participation Rate % 48.6 48.3 51.2 49.8 49.5 48.7 48.1 47.8 47.2
Unemployment % Labour Force 8.3 7.7 6.5 6.0 5.4 5.8 4.9 4.2 4.0
National Accounts
Per Capita GNP : US $ Bn. 1,051 1,226 1,402 1,599 1,966 2,033 2,370 2,805 2,866
GDP (Market Prices) : US $ Bn. 20.7 24.4 28.3 32.4 40.7 42.1 49.6 59.2 59.4
Real GDP Growth % 5.4 6.2 7.7 6.8 6.0 3.5 8.0 8.2 6.4
Expenditure and Savings % of GDP
Consumption 83.6 82.1 83.0 82.4 86.1 82.1 80.7 84.6 83.0
Government Consumption 12.6 13.1 15.4 15.3 16.2 17.6 15.6 14.8 13.5
Domestic Savings 16.4 17.9 17.0 17.6 13.9 17.9 19.3 15.4 17.0
National Savings 22.0 23.8 22.3 23.3 17.8 23.7 25.3 22.0 24.0
Source: Economic and social statistics of Sri Lanka’2013, Central of Sri Lanka.
79
3.3.1 An Overview of the Social Environment in Sri Lanka
As noted previously, Sri Lanka known as the “pearl of the Indian Ocean” is an island state
of 65,610 km2, located in the Indian Ocean, to the south-east of the Indian sub-continent.
Sri Lanka’s population in 2012 was 20,328,000, a decline of 541,000 (2.7 percent) from
2011. Sri Lanka is a mosaic of many cultures with 73.8, 12.6, 7.2, 5.5, and 0.9 percent,
respectively, Sinhalese, Sri Lankan Tamil, Sri Lankan Moor, Indian Tamil, and Burgher,
Malay, and others (Department of Census and Statistics, 2012). There are strong but not
immutable links between ethnicity and religion with Sinhalese being mostly Buddhist,
Tamils most Hindu and Moors mostly Muslim. The Sinhalese are divided into up-country
(Kandyans) and low-country communities. Low-country Sinhala (mostly in the southern
and western low-country coastal regions) represent 62 percent of the total Sinhalese
population (42.8 percent of the national population) and up-country Sinhalese constitute
25.8 percent of the national population. Sri Lanka is classified as a middle income country
by the United Nations Development Programme (UNDP), and is ranked 93 out of 177
countries in terms of the human development index (CIA, 2010). Despite over 30 years of
secessionist civil conflict in the North-Eastern province, the nation has had some notable
developmental achievements, including over 90 percent adult literacy and a life expectancy
of 74 years.
3.3.2 An Overview of Economic Environments in Sri Lanka
South-Asian nations are continuing to liberalise their economies so as to better integrate
into the world economy and have increased regional economic integration via the South
Asian Association for Regional Cooperation (SAARC) (Economic Research Department,
2008). The Sri Lankan economy has seen healthy annual growth at 6.4 percent during 2003-
12 (CBSL, 2012), which is well above other nations in its region. The end of the 30-year
80
civil conflict in 2009 saw growth in Sri Lanka rise initially to 8 percent per annum which
may have reflected a peace dividend that was strengthened by increased confidence driving
robust private consumption and investment). Over the past few decades, the economy has
grown by an average of 5 percent pa and for the last three years it recorded a growth of well
above 6 percent pa. In 2014, the Sri Lankan economy achieved a real GDP growth of 7.4
percent per annum, up from 7.2 percent in 2013 (CBSL, 2013). These growth achievements
were attained despite high inflation, continuous current account deficits (about 3 percent of
GDP), and a fiscal deficit of about 8.5 percent of GDP that has raised public debt to around
95 percent of GDP. Much of the high inflation was driven by funding of the civil-war effort.
Since peace in 2009, inflation has fallen from an average in the mid-teens (1980-2008) to
an average of around 6 percent (2009-13) to 3.3 percent in 2014 (GE, 2016). The steady
decline in the unemployment rate from 14.7 percent in 1991 to 4.2 percent in of 2013 (GE,
2016) leads to a question of just what is the current natural rate of unemployment in Sri
Lanka and does it differ from the equivalent rate in developed countries. The age-
dependency ratio declined from 0.8749 in 1960 to a minimum of 0.4808 in 2006 and has
since risen slightly to 0.5071 in 2013.
3.3.3 Sri Lankan Financial Markets
Sri Lankan financial markets have become increasingly important over recent years and
capital market capitalisation currently sits at around 30 percent of GDP (CBSL, 2013). The
Sri Lankan capital market is an indicator of the booming and organised economy, where
prior to the establishment of the Colombo Stock Market; shares of some publicly owned
firms were traded in an unorganised market through private brokers. The prompt
development of the capital market during the past few years has attracted a large number
of investors as an alternate way of investment. The contribution of the capital market to the
81
economy has been heavily debated. The Colombo Stock Exchange (CSE), a firm limited
by guarantee, was established under the Firms Act no.17 of 1982 and is licensed by the
Securities and Exchange Commission of Sri Lanka (SEC). The CSE’s roots flow from the
1896 inception of the Colombo Share Brokers Association (CSBA). In 1904, the CSBA
changed its name to the Colombo Brokers Association (CBA). In 1999, the CSE formed a
regional office in Matara in the Southern Province of Sri Lanka and currently operate
branches in Kandy, Kurunegala, Negombo, Jaffna, Anuadhapura, and Ratnapura. The share
market was opened to the public in July 1984. A public trading floor was established with
an open outcry system of trading, instead of the closed door system of trading utilised
previously. In 1985, a formal stock exchange was established in Sri Lanka. It was then
called the Colombo Securities Exchange limited and in 1990 came to be known as the
Colombo Stock Exchange. The CSE was one of the first exchanges in the region to have a
depository for listed securities with the implementation of its clearing and settlement house
and in 1991 successfully installed an automated electronic clearing and settlement system-
central depository system (CDS). The CSE introduction of its automated trading system
(ATS) in 1997 has enhanced the transparency and efficiency of the Sri Lankan securities
market. In recognition of the technology, systems and regulation, the CSE was admitted to
the World Federation of Exchange (WFE) in 1998, becoming its first South Asian member.
It was also a founding member of the South Asian Federation of Exchanges (SAFE) in
2000. The CSE is a mutual exchange and has 15 full members and 13 trading members
licensed to trade both equity and debt securities and two members licensed to trade in debt
securities only. All members are licensed by the SEC to operate as stockbrokers. All
members are corporate entities and some are subsidiaries of large financial institutions
(CSE, 2014). At present, the CSE functions as a market operator and through its fully
owned subsidiary, Central Depository Systems (PVT) limited, acts as a clearing and

82
settlement system facilitator. In the course of its operations, the CSE interacts with many
customers and stakeholders which include issuers (such as firms, corporations and unit
trusts) commercial banks, investment banks, fund managers, stockbrokers, financial
advisers, market data vendors and investors (CSE, 2014). The CSE has generated a total
turnover of LKR 200.5 billion in 2013 (down from LKR 213.8 billion during the same
period in 2012). The market value of listed firms or market capitalisation of the CSE stood
at LKR 2,459.9 billion as at the end of 2013 reflecting an increase of 13.5 percent. The CSE
has shown a decline in the level of market liquidity, as measured by the turnover velocity.
Turnover velocity is calculated as turnover divided by average market capitalisation.
Turnover velocity decreased from 9.8 percent in 2012 to 8.7 percent during 2013. During
2013, the CSE was a significant source of finance for listed firms and helped raise
approximately LKR 68,756.7 million from equity and debt initial public offerings and LKR
25,493.8 million via rights issues. A firm that wishes its securities to be listed on the CSE
must have: 1) Stated capital of not less than five hundred million (LKR 500,000,000) rupees
at the time of listing; 2) Net profit after tax for three consecutive years immediately
preceding the date of application; 3) Positive net assets as (per their consolidated audited
financial statements) for the two financial years immediately preceding the application
date; 4) A minimum public holding of 25 percent of the total number of listed shares. The
CSE has 294 firms across 20 industry sectors, as at February 2013, and a market
capitalisation of LKR 2,673.02 billion. Public firms incorporated under the Firms Act no.
7 of 2007 or any other statutory corporation, incorporated or established under the laws of
Sri Lanka or established under the laws of any other state are eligible to seek a listing on
the CSE to raise debt or equity. Firms desiring to be admitted to the official list of the
exchange and to secure a listing of their securities will be required to comply with the
83
relevant provisions of the above act and the Securities and Exchange Commission act no.
36 of 1987 and the listing rules of the exchange.
Since the late 1980s, corporate failures in Sri Lanka have also increased the attention on
proper corporate governance. The legal system of Sri Lanka is a mixture of common law
and civil law due to the influence of Dutch and British colonization (CSE, 2014). In 1996,
the Chartered Accountants of Sri Lanka (CASL) set up a committee to make
recommendations relating to the financial aspects of corporate governance in Sri Lanka,
with the support of the CSE, SEC, Ceylon Chamber of Commerce and Institute of Directors
of Sri Lanka (CBSL, 2013). The CASL published the first report on the Code of Best
Practice on Matters Relating to Financial Aspects of Corporate Governance in 1997. To
strengthen the corporate governance framework in Sri Lanka, a revision to the corporate
governance code of 1997 was issued in 2003 by the CASL in March 2003 which is
fundamental to the efficiency of the operation of financial markets.
3.4 Chapter Summary
This chapter discussed the overall research setting of the study, including an overview of
Australia and Sri Lanka in terms of their respective social and economic environments.
Australia has established business practices with corporate ethics standards that are
perceived as being mostly a high calibre. Sri Lanka, as an emerging economy, is still
enhancing its attributes/standards. The effects of socio-economic features are discussed at
length for Australia and Sri Lanka, as are their effects on the performance of firms and
contribution to investment decisions. This chapter also provided an overview of financial
market development in Australia and Sri Lanka, along with the substantial role that
development has on investment decisions, and the flow-through impact on firm
performance. Australia and Sri Lanka have a strong long-standing mutually beneficial
84
relationship in terms of trade, business, and development. There is considerable potential
for growth in bilateral trade and investment between the two countries. Specifically,
Australian firms have more recently become involved in investments in several industries
in Sri Lanka (e.g., energy, tourism, water management and dairy industries). Social,
economic and cultural factors affect investment decisions and, in turn, impact firm
performance. Thus, the factors affecting firm performance in emerging markets may differ
from those that operate in developed markets. Therefore, this study seeks insight on the CB
practices applied by executives and senior managers in Australia and in Sri Lanka and how
these differences impact firm performance in a developed and an emerging economy. The
next chapter focuses on the research methods and approach.
85
Chapter Four: Research Approach and Methods
4.1 Chapter Introduction
This research seeks to determine whether CB practices and/or their effect on firm
performance differ significantly between Australia and Sri Lanka. Consequently, the choice
and design of an appropriate research methodology was predicated on extant research
concerning these relationships. Research methodology provides insight into the procedures
by which researchers go about systematically solving research problems by describing,
measuring, explaining, and predicting phenomenon (Kothari, 2004; Rajasekar,
Philominathan, & Chinnathambi, 2006; Singleton, Straits, & Straits, 1993). Particularly it
provides the underpinning theoretical and philosophical assumptions on which research is
based and their implications for the method or methods adopted (Saunders, Lewis, &
Thornhill, 2012).
This chapter delineates the research approach adopted within this study and is structured as
follows: Section 4.1 discusses the research methodologies employed and introduces the
different research methods available and justifies the research method adopted in this study;
Section 4.2 discusses the research method; Section 4.3 explains the choice of variables
employed and the design for measurement and operationalisation; Section 4.4 reports the
design of the hypotheses; Section 4.5 discusses the statistical methods used to analyse the
data; Section 4.6 then provides on ethical consideration; and Section 4.7 concludes the
chapter.
86
4.2 Research Paradigm
In addressing the gap discussed in the previous chapters, this study focuses on two key
drivers of CB sophistication, the:
1) Relative sophistication of the firms conducting the CB; and
2) Development level of the nations in which the firms are embedded.
The issue can also be described as nature vs. nurture. Specifically, does a firm’s nature
trump the nurture of the development level of the nation in which it is embedded? A
researcher’s choice of a particular paradigm embodies that individual’s assumptions,
perceptions and interpretation of the world (Saunders et al., 2012).
The concept of a paradigm refers to a way of examining social phenomena from which
particular understanding can be gained and explanations attempted. A research paradigm
enables a researcher to work within the context, scientific thinking, and practices within a
given conceptual framework. In this sense, Denzin and Lincoln (2011) suggest that the
researcher’s epistemological, ontological and methodological premises may be termed and
embedded within the research paradigm (the interpretive framework.) Principally, it
envisages that the theory gives meaning to facts, rather than, simply arising from them. In
this context, a research paradigm helps determine the selection of what is to be studied,
how research should be conducted, what should be studied, what data should be collected
and how it should be interpreted. It also allows the researcher to identify the relationship
between variables and specify appropriate methods for conducting the research (Saunders
et al., 2012). The major research philosophies considered in economic and social research
are pragmatism, interpretivism, realism and positivism.

87
Pragmatism is the philosophical assumption of choice for numerous social researchers as
it allows them to mix quantitative and qualitative approaches (Johnson & Onwuegbuzie,
2004; Onwuegbuzie, 2002; Tashakkori & Teddlie, 1998). It entails a practical approach,
integrating different perspectives to help collect and interpret data and is considered a
concrete methodology aimed at answering research problems (Saunders et al., 2012).
Morgan (2007, pp.73) noted that:
“…the great strength of this pragmatic approach to social science research
methodology is its emphasis on the connection between epistemological concerns
about the nature of the knowledge that produce and technical methodology is its
emphasis on the connection between epistemological concerns about the nature of
the knowledge that we produce and technical concerns about the methods that we
use to generate that knowledge”.
Tashakkori and Teddlie (1998) contend that pragmatism is intuitively appealing, as it
avoids the researcher engaging in what they see as rather pointless debates about side issues
such as truth and reality. However, this research approach does not provide a study context
for financial and capital markets and the economic and political settings in Australia and
Sri Lanka and, as a result, is not suitable for this research.
Interpretivism seeks to emphasise the meaningful nature of social interaction and assumes
that people create and associate their own subjective and inter subjective meanings as they
interact with the world around them (Johnson & Murray, 2006). Interpretivism advocates
that it is necessary for the researcher to understand the differences and nuances associated
with the role of humans as social actors. In this respect, it emphasises natural settings
together with individual and group perceptions of events and interactions within those
settings (Williamson & Johanson, 2013). Its central tenant emphasises the difference
between conducting research among people vs research of objects (e.g., trucks, computers,
buildings) and looks for “…culturally derived and historically situated interpretations of
the social life world” (Crotty, 1998). There is no, direct, one-to-one relationship between
88
subjects and the object. Given the nature of this research, interpretivism is not suitable, as
it deals with the choices and actions of the individuals, not corporations.
Realism is a philosophical position relating to scientific enquiry which acknowledges a
reality independent of senses that are accessible to the researcher’s tools and theoretical
speculations (Bryman & Emma, 2003). Ideologically, it opposes the idealism concept that
only the mind and its contents exist. The essence of realism is that what the senses show us
as reality is the truth: Realism posits that there is a reality quite independent of the mind
and that objects have an existence independent of the human mind. This assumption
underpins the collection of data and the understanding of that data. Further, clarity of this
meaning (and in particular the relevance of data and management research) is evident when
two forms of realism (Direct and Critical) are contrasted. Direct realism contends that what
you see is what you get: that what is experienced via the senses portrays the world
accurately. Critical realism, on the other hand, contends that what is experienced are
sensations, the images of the things in the real world, not the things directly (Saunders et
al., 2012). Given the extent to which this study considers quantitatively measurable and
objective concepts, this paradigm was deemed inappropriate for this study.
Positivism, suggests a two-pronged approach is needed. There is a need: first to study the
literature to establish a relevant theory; which can then be used to develop appropriate
hypotheses or propositions; which can then be tested for association by deducing logical
consequences; that are tested against empirical evidence (Mark, Richard, & Andy, 1999).
This approach (per Gray, 2009) suggests that an external reality exists outside of, and
independent to, that perceived by the researcher and should be investigated through the
rigorous process of scientific inquiry. The aim of positivist researchers is to verify their
hypotheses (Lincoln, Lynham, & Guba, 2011). Saunders et al. (2012) contend that the use
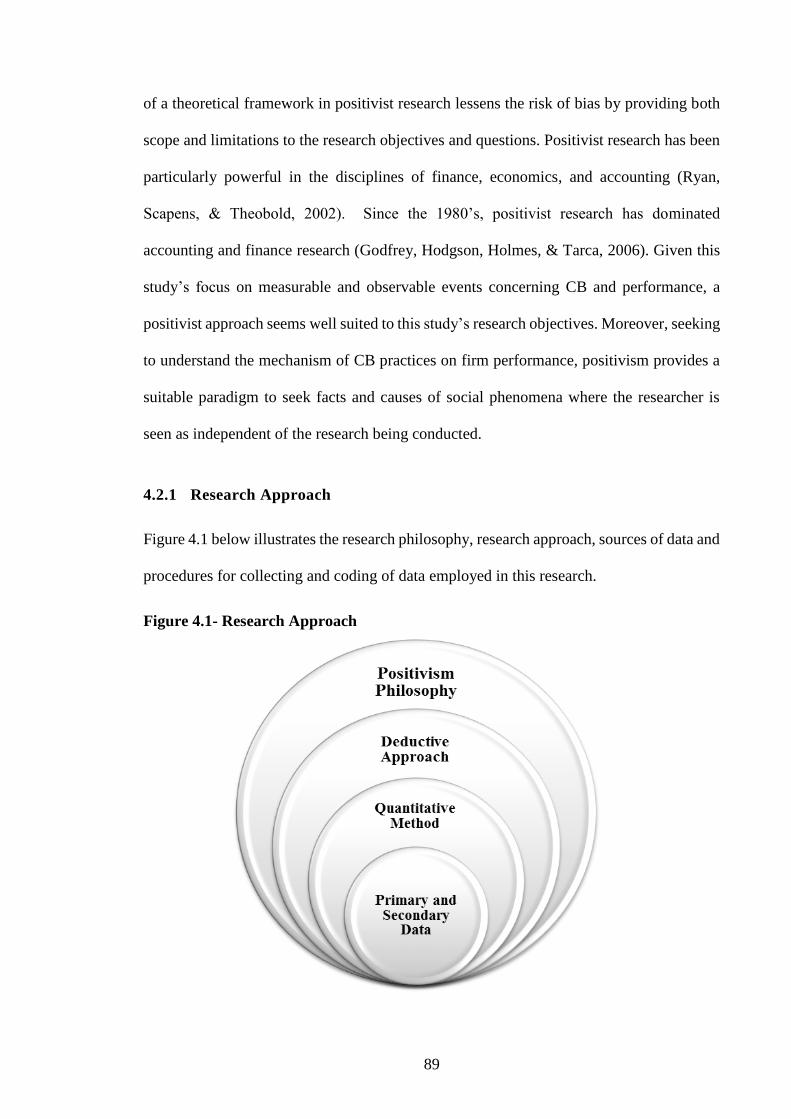
89
of a theoretical framework in positivist research lessens the risk of bias by providing both
scope and limitations to the research objectives and questions. Positivist research has been
particularly powerful in the disciplines of finance, economics, and accounting (Ryan,
Scapens, & Theobold, 2002). Since the 1980’s, positivist research has dominated
accounting and finance research (Godfrey, Hodgson, Holmes, & Tarca, 2006). Given this
study’s focus on measurable and observable events concerning CB and performance, a
positivist approach seems well suited to this study’s research objectives. Moreover, seeking
to understand the mechanism of CB practices on firm performance, positivism provides a
suitable paradigm to seek facts and causes of social phenomena where the researcher is
seen as independent of the research being conducted.
4.2.1 Research Approach
Figure 4.1 below illustrates the research philosophy, research approach, sources of data and
procedures for collecting and coding of data employed in this research.
Figure 4.1- Research Approach
90
Quantitative and qualitative methods are the two main approaches used in research. The
distinction between qualitative and quantitative research includes: analytical objectives,
types of research questions, data analysis and flexibility in the design of the research (Mack,
Woodsong, MacQueen, Guest, & Namey, 2005). A qualitative method examines how
individuals think and react and is directed towards a deep understanding of their
experiences, motivations and values. The qualitative approach involves deep, rich and non-
numerical interpretation of social phenomena for discovering the underlying meaning of
relationships. Quantitative methods adopt the collection of objective data, rigorous
measurement and the use of statistical methods of analysis. Quantitative research involves
objective and standardised data, measurement, and its focus is on the analysis of casual
relationships between variables rather than processes (Bryman & Emma, 2003; Sheard,
2013). The mixed method incorporates both quantitative and qualitative data-collection
techniques and analysis procedures; it may also combine quantitative and qualitative
methods in other phases of the research (Saunders et al., 2012). Each approach has strengths
and weaknesses that both lead to inherent biases, blind spots, and limitations—e.g., a purely
qualitative approach may be inappropriate for exploring CB practices and performance, as
it is often too subjective, biased, and lacking consistency. After careful consideration, a
quantitative methods approach was adopted in this study.
Research design tends to be either inductive or deductive; where the inductive approach is
concerned with the development of new theories garnered from the collection of data (i.e.
it flows from specific observations to general principles); and the deductive approach is
aimed at testing the predicted outcome of a formulated theory or model of how something
works to what is observed (i.e. it flows from general principles to specific predictions which
are then validated or refuted by specific observations).
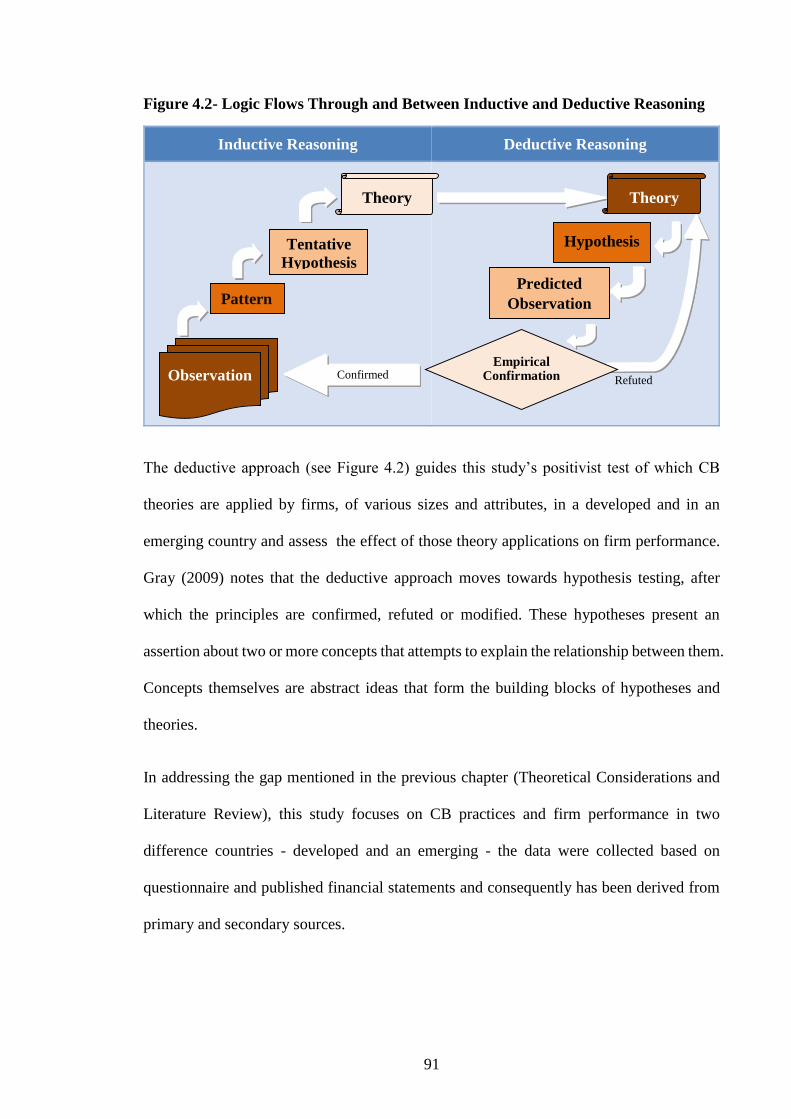
91
Figure 4.2- Logic Flows Through and Between Inductive and Deductive Reasoning
Inductive Reasoning Deductive Reasoning
The deductive approach (see Figure 4.2) guides this study’s positivist test of which CB
theories are applied by firms, of various sizes and attributes, in a developed and in an
emerging country and assess the effect of those theory applications on firm performance.
Gray (2009) notes that the deductive approach moves towards hypothesis testing, after
which the principles are confirmed, refuted or modified. These hypotheses present an
assertion about two or more concepts that attempts to explain the relationship between them.
Concepts themselves are abstract ideas that form the building blocks of hypotheses and
theories.
In addressing the gap mentioned in the previous chapter (Theoretical Considerations and
Literature Review), this study focuses on CB practices and firm performance in two
difference countries - developed and an emerging - the data were collected based on
questionnaire and published financial statements and consequently has been derived from
primary and secondary sources.
Pattern
Tentative
Hypothesis
Theory Theory
Hypothesis
Predicted
Observation
Confirmed Refuted
Observation
Empirical Confirmation
92
4.3 Research Methods
4.3.1 Research Design
Research design is a means to focus the achievement of research goals by depicting the
theoretical frameworks, questions, research, generalisations and presentational goals with
each other and to the chosen research methods and resources available (Flick, 2014).
4.3.2 Population Design
The population of interest in this study is (initially) the 200 listed firms on the Australian
Securities Exchange (ASX) from S&P/ASX200 and the 289 listed firms on the Colombo
Stock Exchange (CSE), as at February 2013. While, there are two indices in Australia, the
difficulties in reconciling data from both indices precludes the use of both. The S&P/ASX
200 Index was judged as being (overall) a more appropriate benchmark for the Australian
equity market as it better meets the need of investment managers to benchmark against a
portfolio characterised by sufficient size (market capitalisation) and liquidity (ASX, 2015).
Whilst, CSE has recently recorded a remarkable rate of growth and grabbed the attention
of policymakers as a key factor in the economic development (CSE, 2014). Therefore, this
study seeks insight on the CB practices applied by CFOs in Australia and in Sri Lanka and
how these differences impact firm performance in a developed and an emerging economy.
In selecting the population, this study excludes financial, investment and securities sector
firms because their unique financial attributes, intensity of regulation, and/or intensive use
of leverage are likely to confound the outcomes being studied. Also, the risk of missing
data was minimised by excluding firms that were not listed throughout the review period.
After the eliminations, 150 Australian listed firms and 150 Sri Lankan listed firms remained
in the population. Table 4.1 (below) classifies the participating firms via the Global
Industry Classification Standards (GICS).
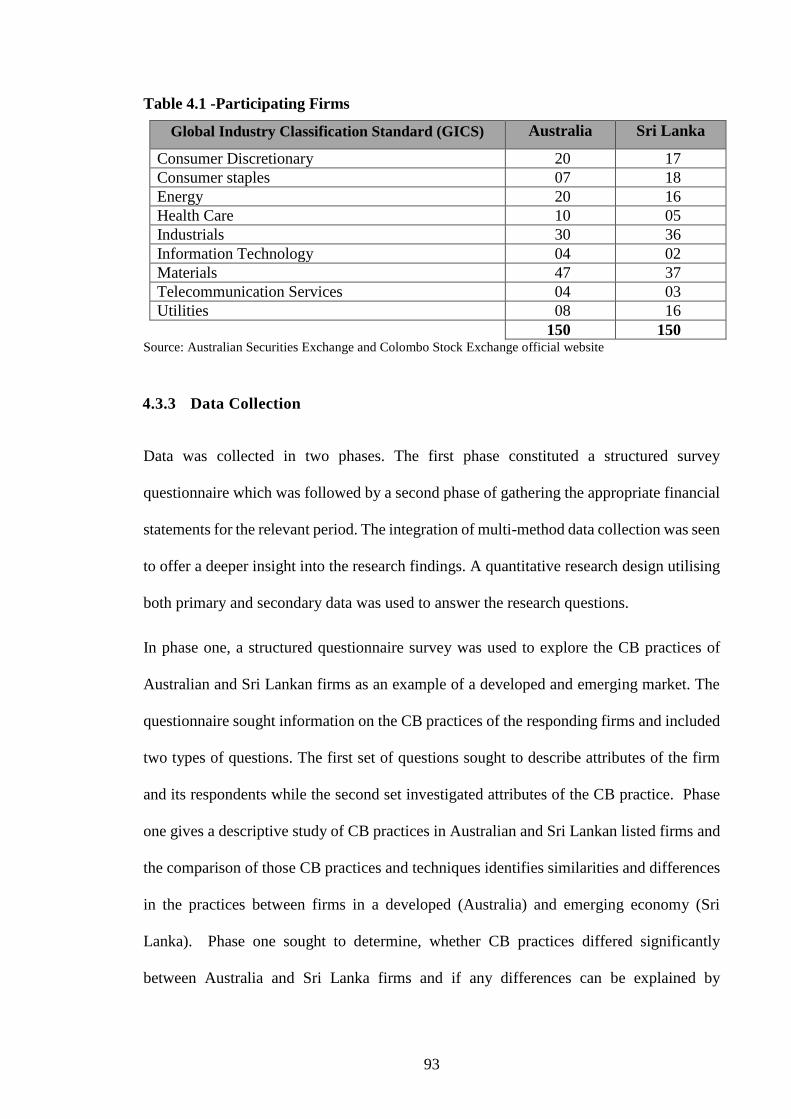
93
Table 4.1 -Participating Firms
Global Industry Classification Standard (GICS) Australia Sri Lanka
Consumer Discretionary 20 17
Consumer staples 07 18
Energy 20 16
Health Care 10 05
Industrials 30 36
Information Technology 04 02
Materials 47 37
Telecommunication Services 04 03
Utilities 08 16
150 150 Source: Australian Securities Exchange and Colombo Stock Exchange official website
4.3.3 Data Collection
Data was collected in two phases. The first phase constituted a structured survey
questionnaire which was followed by a second phase of gathering the appropriate financial
statements for the relevant period. The integration of multi-method data collection was seen
to offer a deeper insight into the research findings. A quantitative research design utilising
both primary and secondary data was used to answer the research questions.
In phase one, a structured questionnaire survey was used to explore the CB practices of
Australian and Sri Lankan firms as an example of a developed and emerging market. The
questionnaire sought information on the CB practices of the responding firms and included
two types of questions. The first set of questions sought to describe attributes of the firm
and its respondents while the second set investigated attributes of the CB practice. Phase
one gives a descriptive study of CB practices in Australian and Sri Lankan listed firms and
the comparison of those CB practices and techniques identifies similarities and differences
in the practices between firms in a developed (Australia) and emerging economy (Sri
Lanka). Phase one sought to determine, whether CB practices differed significantly
between Australia and Sri Lanka firms and if any differences can be explained by
94
differences in levels of national economic development after adjusting for conflating
factors such as firm and CFO attributes.
Phase two examines CB practices via the lens of a process approach and an evaluation
approach; which allows for a connection between these different perspectives and firm
performance in Australian and Sri Lankan-listed firms. Phase two links the primary data
gathered in phase one with secondary data, annual reports of the relevant firms during 2003-
12, taken from the ASX,CSE’s and SIRCA database to provide: return on assets (ROA),
return on equity (ROE), Tobin’s Q (TQ), and earnings per share (EPS). The intention of
phase two is to explore for relationships between (on one hand) the CB process and choice
of appraisal techniques used by developed and emerging countries and (on the other) firm
performance (both from an accounting and a market perspective). It was considered that
these findings would assist CFOs in shedding light on the numerous corporate finance
theories associated with firm performance and the stakeholders’ wealth of the firm in
Australia and Sri Lanka. Thus, the data used in the quantitative stage of this study was
gathered in two phases:
Phase one: A structured survey questionnaire of CB practices and its appraisal techniques
among Australian and Sri Lankan listed firms.
Phase two: A study of the relationships between CB practices and firm performance in
Australian and Sri Lankan listed firms.
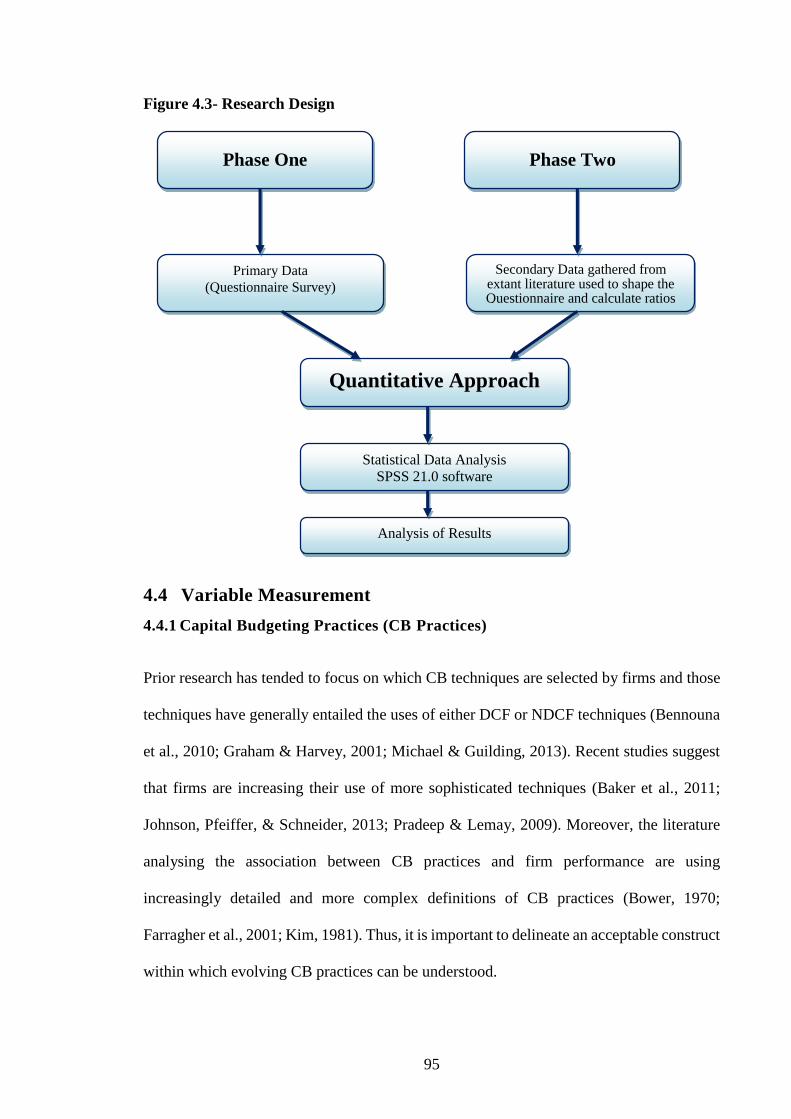
95
Figure 4.3- Research Design
4.4 Variable Measurement
4.4.1 Capital Budgeting Practices (CB Practices)
Prior research has tended to focus on which CB techniques are selected by firms and those
techniques have generally entailed the uses of either DCF or NDCF techniques (Bennouna
et al., 2010; Graham & Harvey, 2001; Michael & Guilding, 2013). Recent studies suggest
that firms are increasing their use of more sophisticated techniques (Baker et al., 2011;
Johnson, Pfeiffer, & Schneider, 2013; Pradeep & Lemay, 2009). Moreover, the literature
analysing the association between CB practices and firm performance are using
increasingly detailed and more complex definitions of CB practices (Bower, 1970;
Farragher et al., 2001; Kim, 1981). Thus, it is important to delineate an acceptable construct
within which evolving CB practices can be understood.
Phase One Phase Two
Primary Data
(Questionnaire Survey)
Secondary Data gathered from extant literature used to shape the Questionnaire and calculate ratios
Quantitative Approach
Statistical Data Analysis
SPSS 21.0 software
Analysis of Results
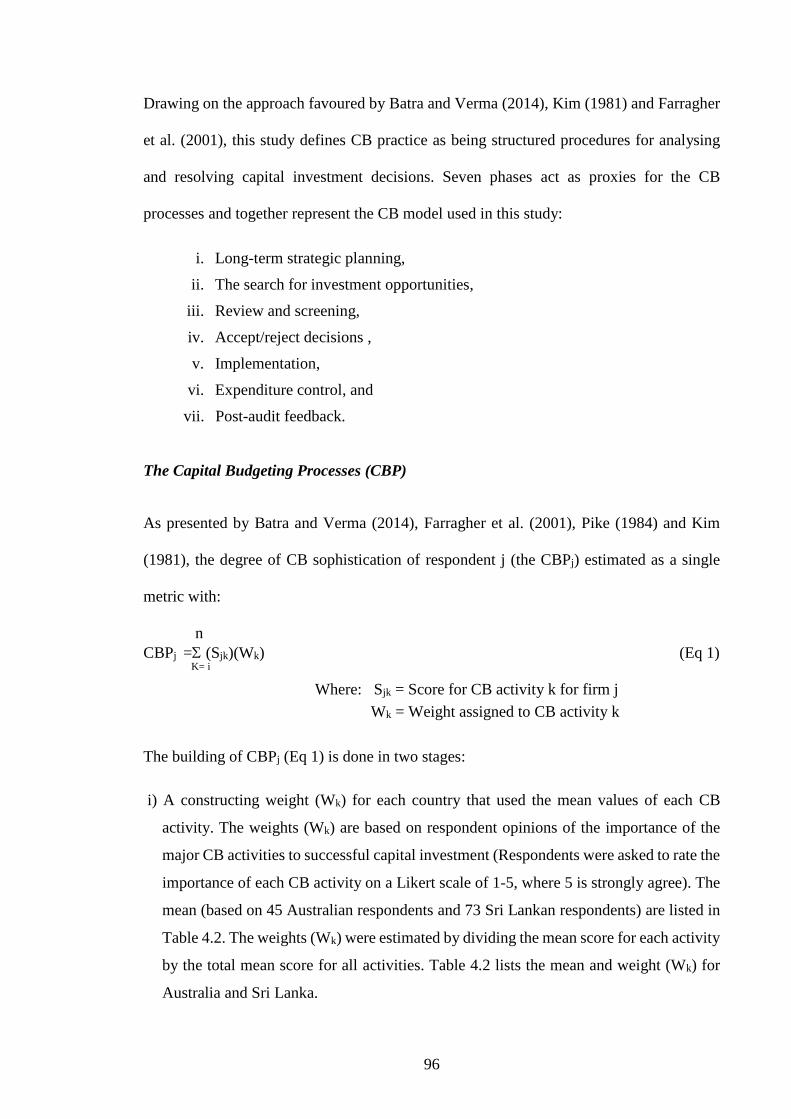
96
Drawing on the approach favoured by Batra and Verma (2014), Kim (1981) and Farragher
et al. (2001), this study defines CB practice as being structured procedures for analysing
and resolving capital investment decisions. Seven phases act as proxies for the CB
processes and together represent the CB model used in this study:
i. Long-term strategic planning,
ii. The search for investment opportunities,
iii. Review and screening,
iv. Accept/reject decisions ,
v. Implementation,
vi. Expenditure control, and
vii. Post-audit feedback.
The Capital Budgeting Processes (CBP)
As presented by Batra and Verma (2014), Farragher et al. (2001), Pike (1984) and Kim
(1981), the degree of CB sophistication of respondent j (the CBPj) estimated as a single
metric with:
n
CBPj = (Sjk)(Wk) (Eq 1)
K= i
Where: Sjk = Score for CB activity k for firm j
Wk = Weight assigned to CB activity k
The building of CBPj (Eq 1) is done in two stages:
i) A constructing weight (Wk) for each country that used the mean values of each CB
activity. The weights (Wk) are based on respondent opinions of the importance of the
major CB activities to successful capital investment (Respondents were asked to rate the
importance of each CB activity on a Likert scale of 1-5, where 5 is strongly agree). The
mean (based on 45 Australian respondents and 73 Sri Lankan respondents) are listed in
Table 4.2. The weights (Wk) were estimated by dividing the mean score for each activity
by the total mean score for all activities. Table 4.2 lists the mean and weight (Wk) for
Australia and Sri Lanka.
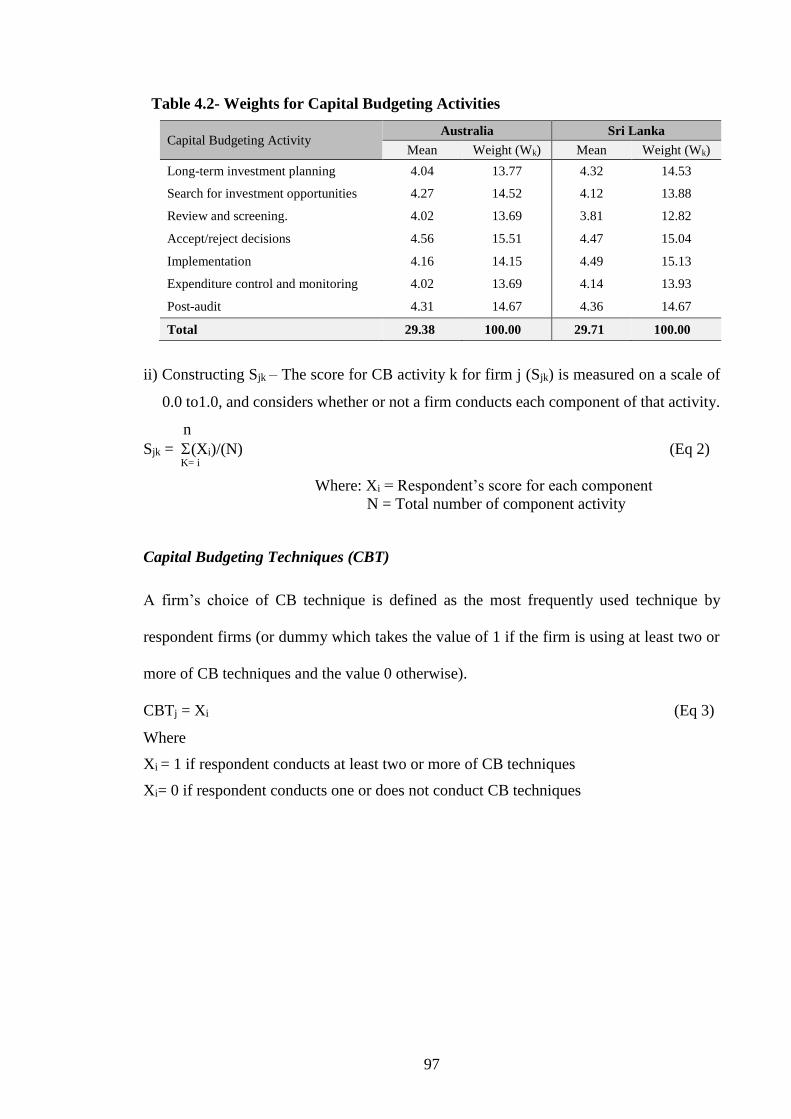
97
Table 4.2- Weights for Capital Budgeting Activities
Capital Budgeting Activity Australia Sri Lanka
Mean Weight (Wk) Mean Weight (Wk)
Long-term investment planning 4.04 13.77 4.32 14.53
Search for investment opportunities 4.27 14.52 4.12 13.88
Review and screening. 4.02 13.69 3.81 12.82
Accept/reject decisions 4.56 15.51 4.47 15.04
Implementation 4.16 14.15 4.49 15.13
Expenditure control and monitoring 4.02 13.69 4.14 13.93
Post-audit 4.31 14.67 4.36 14.67
Total 29.38 100.00 29.71 100.00
ii) Constructing Sjk – The score for CB activity k for firm j (Sjk) is measured on a scale of
0.0 to1.0, and considers whether or not a firm conducts each component of that activity.
n
Sjk = (Xi)/(N) (Eq 2) K= i
Where: Xi = Respondent’s score for each component
N = Total number of component activity
Capital Budgeting Techniques (CBT)
A firm’s choice of CB technique is defined as the most frequently used technique by
respondent firms (or dummy which takes the value of 1 if the firm is using at least two or
more of CB techniques and the value 0 otherwise).
CBTj = Xi (Eq 3)
Where
Xi = 1 if respondent conducts at least two or more of CB techniques
Xi= 0 if respondent conducts one or does not conduct CB techniques
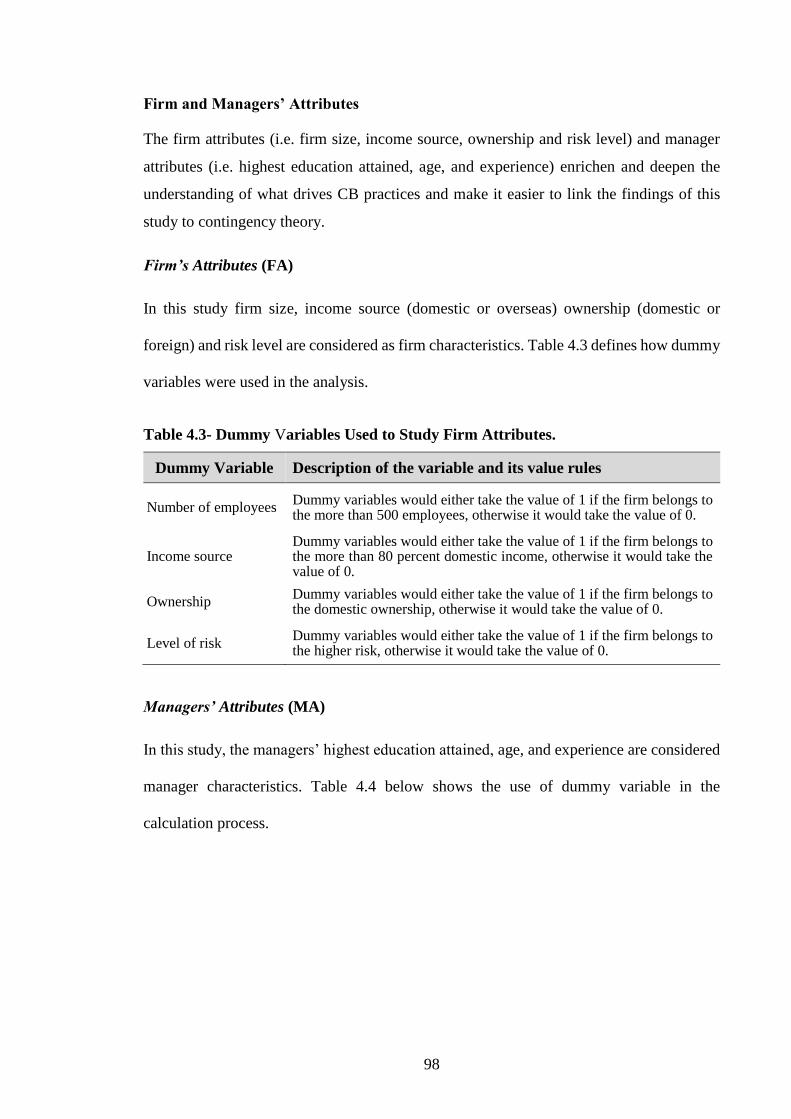
98
Firm and Managers’ Attributes
The firm attributes (i.e. firm size, income source, ownership and risk level) and manager
attributes (i.e. highest education attained, age, and experience) enrichen and deepen the
understanding of what drives CB practices and make it easier to link the findings of this
study to contingency theory.
Firm’s Attributes (FA)
In this study firm size, income source (domestic or overseas) ownership (domestic or
foreign) and risk level are considered as firm characteristics. Table 4.3 defines how dummy
variables were used in the analysis.
Table 4.3- Dummy Variables Used to Study Firm Attributes.
Managers’ Attributes (MA)
In this study, the managers’ highest education attained, age, and experience are considered
manager characteristics. Table 4.4 below shows the use of dummy variable in the
calculation process.
Dummy Variable Description of the variable and its value rules
Number of employees Dummy variables would either take the value of 1 if the firm belongs to the more than 500 employees, otherwise it would take the value of 0.
Income source Dummy variables would either take the value of 1 if the firm belongs to the more than 80 percent domestic income, otherwise it would take the value of 0.
Ownership Dummy variables would either take the value of 1 if the firm belongs to the domestic ownership, otherwise it would take the value of 0.
Level of risk Dummy variables would either take the value of 1 if the firm belongs to the higher risk, otherwise it would take the value of 0.
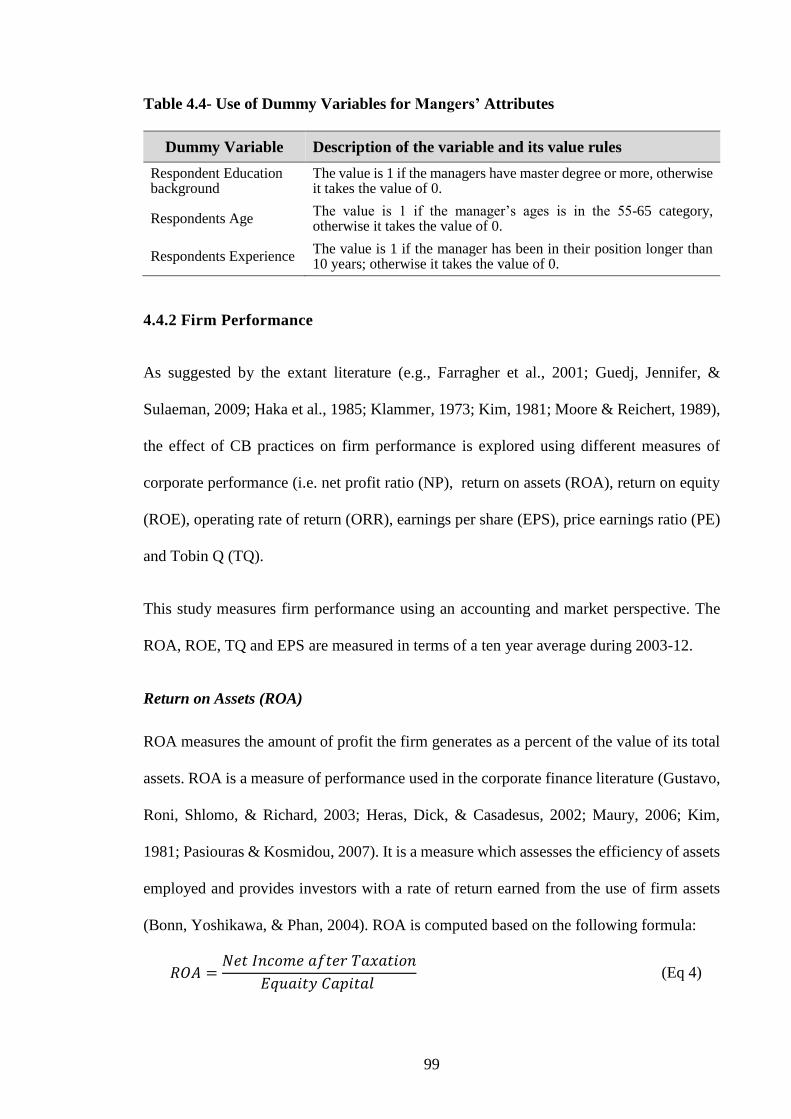
99
Table 4.4- Use of Dummy Variables for Mangers’ Attributes
4.4.2 Firm Performance
As suggested by the extant literature (e.g., Farragher et al., 2001; Guedj, Jennifer, &
Sulaeman, 2009; Haka et al., 1985; Klammer, 1973; Kim, 1981; Moore & Reichert, 1989),
the effect of CB practices on firm performance is explored using different measures of
corporate performance (i.e. net profit ratio (NP), return on assets (ROA), return on equity
(ROE), operating rate of return (ORR), earnings per share (EPS), price earnings ratio (PE)
and Tobin Q (TQ).
This study measures firm performance using an accounting and market perspective. The
ROA, ROE, TQ and EPS are measured in terms of a ten year average during 2003-12.
Return on Assets (ROA)
ROA measures the amount of profit the firm generates as a percent of the value of its total
assets. ROA is a measure of performance used in the corporate finance literature (Gustavo,
Roni, Shlomo, & Richard, 2003; Heras, Dick, & Casadesus, 2002; Maury, 2006; Kim,
1981; Pasiouras & Kosmidou, 2007). It is a measure which assesses the efficiency of assets
employed and provides investors with a rate of return earned from the use of firm assets
(Bonn, Yoshikawa, & Phan, 2004). ROA is computed based on the following formula:
𝑅𝑂𝐴 =𝑁𝑒𝑡 𝐼𝑛𝑐𝑜𝑚𝑒 𝑎𝑓𝑡𝑒𝑟 𝑇𝑎𝑥𝑎𝑡𝑖𝑜𝑛
𝐸𝑞𝑢𝑎𝑖𝑡𝑦 𝐶𝑎𝑝𝑖𝑡𝑎𝑙 (Eq 4)
Dummy Variable Description of the variable and its value rules
Respondent Education background
The value is 1 if the managers have master degree or more, otherwise it takes the value of 0.
Respondents Age The value is 1 if the manager’s ages is in the 55-65 category, otherwise it takes the value of 0.
Respondents Experience The value is 1 if the manager has been in their position longer than 10 years; otherwise it takes the value of 0.
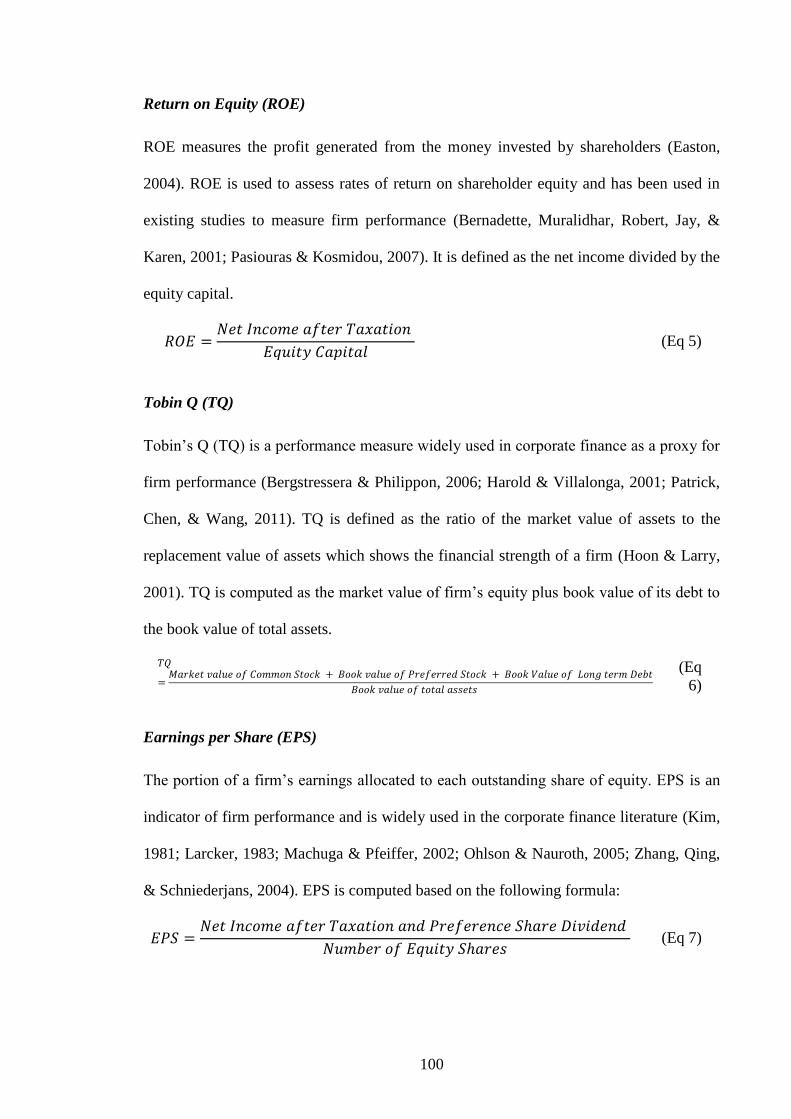
100
Return on Equity (ROE)
ROE measures the profit generated from the money invested by shareholders (Easton,
2004). ROE is used to assess rates of return on shareholder equity and has been used in
existing studies to measure firm performance (Bernadette, Muralidhar, Robert, Jay, &
Karen, 2001; Pasiouras & Kosmidou, 2007). It is defined as the net income divided by the
equity capital.
𝑅𝑂𝐸 =𝑁𝑒𝑡 𝐼𝑛𝑐𝑜𝑚𝑒 𝑎𝑓𝑡𝑒𝑟 𝑇𝑎𝑥𝑎𝑡𝑖𝑜𝑛
𝐸𝑞𝑢𝑖𝑡𝑦 𝐶𝑎𝑝𝑖𝑡𝑎𝑙 (Eq 5)
Tobin Q (TQ)
Tobin’s Q (TQ) is a performance measure widely used in corporate finance as a proxy for
firm performance (Bergstressera & Philippon, 2006; Harold & Villalonga, 2001; Patrick,
Chen, & Wang, 2011). TQ is defined as the ratio of the market value of assets to the
replacement value of assets which shows the financial strength of a firm (Hoon & Larry,
2001). TQ is computed as the market value of firm’s equity plus book value of its debt to
the book value of total assets.
𝑇𝑄
=𝑀𝑎𝑟𝑘𝑒𝑡 𝑣𝑎𝑙𝑢𝑒 𝑜𝑓 𝐶𝑜𝑚𝑚𝑜𝑛 𝑆𝑡𝑜𝑐𝑘 + 𝐵𝑜𝑜𝑘 𝑣𝑎𝑙𝑢𝑒 𝑜𝑓 𝑃𝑟𝑒𝑓𝑒𝑟𝑟𝑒𝑑 𝑆𝑡𝑜𝑐𝑘 + 𝐵𝑜𝑜𝑘 𝑉𝑎𝑙𝑢𝑒 𝑜𝑓 𝐿𝑜𝑛𝑔 𝑡𝑒𝑟𝑚 𝐷𝑒𝑏𝑡
𝐵𝑜𝑜𝑘 𝑣𝑎𝑙𝑢𝑒 𝑜𝑓 𝑡𝑜𝑡𝑎𝑙 𝑎𝑠𝑠𝑒𝑡𝑠
(Eq
6)
Earnings per Share (EPS)
The portion of a firm’s earnings allocated to each outstanding share of equity. EPS is an
indicator of firm performance and is widely used in the corporate finance literature (Kim,
1981; Larcker, 1983; Machuga & Pfeiffer, 2002; Ohlson & Nauroth, 2005; Zhang, Qing,
& Schniederjans, 2004). EPS is computed based on the following formula:
𝐸𝑃𝑆 =𝑁𝑒𝑡 𝐼𝑛𝑐𝑜𝑚𝑒 𝑎𝑓𝑡𝑒𝑟 𝑇𝑎𝑥𝑎𝑡𝑖𝑜𝑛 𝑎𝑛𝑑 𝑃𝑟𝑒𝑓𝑒𝑟𝑒𝑛𝑐𝑒 𝑆ℎ𝑎𝑟𝑒 𝐷𝑖𝑣𝑖𝑑𝑒𝑛𝑑
𝑁𝑢𝑚𝑏𝑒𝑟 𝑜𝑓 𝐸𝑞𝑢𝑖𝑡𝑦 𝑆ℎ𝑎𝑟𝑒𝑠 (Eq 7)
101
4.5 Hypotheses Development
Based on the literature the following alternative hypotheses are proposed to be tested.
CB focused studies have a broad tradition in corporate finance literature. This research
mainly focuses on developed nations. Specifically: Graham and Harvey (2001) and Shao
and Alan (1996) for: the USA; Baker, Dutta, and Samir (2011), Bennouna et al., (2010),
Vijay and Ashwani (1995) for Canada; Alkaraan and Northcott (2006), Arnold and
Hatzopoulos (2000) for the UK; and Truong, Partington, and Peat (2008), Freeman and
Hobbes (1991) for Australia. Only a few studies emphasise CB evaluation techniques in
emerging countries (e.g. Malaysia, Indonesia, China, and Singapore were considered by:
Farah, Mansor, & George, 2008; Chan, Kamal, & William, 2004; and Kester & Chong,
1998; and African economies were studied by: Maroyi & van der Poll, 2012; Hassan, Hosny,
& Vasilya, 2011; Pradeep & Lemay, 2009; Sulaiman, 2007, and Coltman, 1995; and India
was looked at by: Manoj (2002); Satish, Sanjeev, & Roopali, 2009; Singh, Jain, & Yadav,
2012). Although previous research has considered CB practices, this study is among only
a few studies using a comparative approach (Andor et al., 2015; Brounen, De Jong, &
Koedijk, 2004; Graham & Harvey, 2001; Hermes et al., 2007; Payne, Heath, & Gale, 1999;
Peel, 1999) to contrast national development level with CB choices. Thus, hypotheses H1
(H1a; H1b; H1c) are:
H1: Capital budgeting practices are applied more extensively in developed countries than
in emerging countries.
H1a: There are significant differences in the application of CB practices between
industrial sectors.
H1b: There is a significant difference in CB practices between high risk and low
risk firms.
H1c: Firms and respondents attributes have an effect on the choice of CB practices
employed.
102
Financial theory suggests that sophisticated CB systems should enhance firm performance,
but empirical testing of this assertion appears to have been very limited. Vadeei et al.,
(2012), Farragher et al. (2001), Pike (1984), Kim (1981), and Klammer (1973) looked at
the impact of CB on firm performance. Klammer (1973), in a survey of 369 USA
manufacturing firms, found no significant relationship between CB techniques and firm
performance. In contrast, Kim (1981) and Vadeei et al., (2012) find a positive association
between the CB process and firm performance. In other research, Pike (1984) find a
negative association between CB evaluation techniques and firm performance and
Farragher et al., (2001), Pike (1984), and Christy (1966) find no significant relationship
between the sophistication of CB processes and firm performance. Thus, for the most part,
these studies focus on the application and enhancement of the applied modelling techniques.
The trend towards adoption of more refined CB practices has led researchers to consider
whether such refinements enhance performance and profitability. The mixed outcomes of
the research suggests that a significant gap exists in understanding the nature, intensity, and
direction of the relationship between CB practises and performance.
Hypetheses H2 (H2a; H2b) follow:
H2: The use of more sophisticated CB practices leads to higher performance than that of
firms using less sophisticated CB practices.
H2a: Capital budgeting processes significantly affect firm performance.
H2b: A firm’s CB techniques are expected to have a positive influence on a firm’s
performance.
4.6 Empirical Analysis
The statistical analysis of the quantitative results used social science software 22.1 (SPSS)
and the analysis includes descriptive statistics, correlation analysis, multiple regression
analysis, analysis of variance and T-test.
103
4.6.1 Descriptive Statistics
Descriptive statistics are widely used in extant research on CB practices (De Andrés et al.,
2015; Arnold & Hatzopoulos, 2000; Bennouna et al., 2010; Chen, 1995; Fremgen, 1973;
Hussaini & Shafique, 2013; Truong et al., 2008; Wnuk-Pel, 2014). Descriptive statistics
summarise or characterise a data set (Berenson et al., 2013). When describing data for both
samples and population quantitatively it is usual to reveal certain measures of central
tendency (e.g., arithmetic mean, mode or median). The mean is the most significant
measure of central tendency and is often considered the gate-way to understanding
statistical formulas (Nolan & Heinzen, 2014).
Descriptive statistics are used to orgainse and describe the attributes of a data set (Salkind,
2000), and assist in identifying trends and patterns of data, and offer bases for comparing
variables. In this research, descriptive statistics offer an appraisal of the CB practices
among Australian and Sri Lankan respondents and also connects with the attributes of the
firm and its respondents. Particularly, they assist in quantifying the extent to which firms
have adopted more sophisticated practices on CB and the trends in firm performance. It is
expected that firms will have a higher mean value for CB parctices if they are using highly
sophisticated CB processes.
4.6.2 Correlation Coefficient
Statistical research of the type is heavily predicated on using correlation analysis of CB
practices and firm performance (Haka, 1987; Pike, 1984; Ross, 1986; Verbeeten, 2006). A
correlation reflects the dynamic quality of the relationship between variables and allows a
researcher to understand whether variables move independently or in the same or opposite
direction (Salkind, 2000). The correlation coefficient is a statistic that quantifies the
relationship between two variables and quantifies the relationship as nil, positive, or
104
negative. Positive correlation is an association between two variables such that CB
practices with high scores on variables tends to have high scores on firm performance
variables as well, and those with low scores on CB variables tend to have low scores on the
firm performance variables.
4.6.3 Multiple Regression Analysis
Much of the existing CB literature employs a multiple regression analysis as part of its
discourse (De Andrés et al., 2015; Farragher et al., 2001; Klammer, 1973; Pike, 1984).
Multiple regression is simply an extension of bivariate regression to include two or more
independent variables (Cohen, Cohen, West, & Aiken, 2013). It provides information on
the impact of an independent variable on the dependent variable while simultaneously
controlling for any conflating effects of other independent variables. Regression models are
developed in this study to address the impact of CB practices on firm performance. The
variables CB process and techniques that affect a firm’s performance (Farragher et al. 2001;
Pike, 1984; Kim, 1981; Klammer, 1973), are expected to be positively related to firm
performance, in Australia and Sri Lanka. The following estimation models are used to
examine the impact of CB practices on firm performance.
ROA (performance) = βo + β1 CBPj + β2CBTj + β3EDU + β4AGE + β5EXP + β6 SOE + β7
DI + β8 OWN + β9RL + ε (Eq 8)
ROE (performance) = o + 1 CBPj + 2CBTj + 3EDU + 4AGE + 5EXP + 6SOE +
7 DI+ 8 OWN + 9RL + ε (Eq 9)
EPS (performance) = o + 1 CBPj + 2CBTj + 3EDU + 4AGE + 5EXP + 6SOE +
7 DI+ 8 OWN + 9RL + ε (Eq 10)
TQ (performance) = λo + λ1 CBPj + λ2CBTj + λ3EDU + λ4AGE + λ5EXP + λ6SOE + λ7DI+
λ8 OWN + λ9RL + ε (Eq 11)
105
Where: βo, o, o, λo = Constant terms
β1- β9, 1- 9, 1- 9, and λ1 – λ9 = Regression coefficients
CBPj = Capital budgeting practices for firm j
CBTj = Choice of CB techniques for firm j
EDU = Respondent highest education level
AGE = Respondent age
EXP = Respondent experience
SOE = Firm size by number of employees
DI = Firm level of domestic focus
OWN = Firm Ownership (domestic vs. foreign)
RL = Firm Risk level
ε = Error term
4.6.4 Analysis of Variance (ANOVA)
ANOVA is an analysis that tests differences among sets of means that are grouped by more
than one classifying variable/factor. It examines the cross-tabulation of means and
determines whether the observed differences are significant. ANOVA is used when there
are a number of independent variables and each contributes to some aspect of the make-up
of the phenomenon. It tests if there are differences in the mean scores on the dependent
variables, across the groups. The strength of ANOVA lies in its capacity to distinguish
effects on a response from among many different sources of variations compared
simultaneously or in certain cases through time. It can identify interacting factors and it can
measure the scale of variation within a hierarchy of effects. Extend literature considering
CB has often incorporated an ANOVA procedure to determine whether there are any
significant effects of CB practices on control variables (Chen, 1995; Lam et al., 2008;
Hassan et al., 1997; Schulz & Cheng, 2002). In this research, a one-way ANOVA procedure
was used to determine if there are significant differences in CB practices, including process
and evaluation approach between firms and its Respondents attributes.
106
4.6.5 Independent Samples t-Test
Another important tool employed by researchers is the t-test. Independent sample t-tests
can be used to determine whether there is a significant difference between two sets of
means—in this study, a t-test is used to determine if there are significant differences
between Australian and Sri Lankan CB practices. Normality distributed data is required for
t-tests. Gordon and Smith (1992) and Hermes et al. (2007) used a similar analysis in their
studies on CB practices in a comparative perspective.
4.7 Ethical Considerations
Data has been derived from both primary and secondary sources. In order to conduct the
primary data collection (i.e. the questionnaire) this research follows the ethics guidelines
of the Federation University Human Research Ethics Committee (HREC). The objectives
ensure that questions are designed according to the standard requirements of the ethics
committee and confirm that no demeaning questions are asked. The approval of ethical
considerations protects the information privacy and confidentiality of all participants. It
was agreed that the participants through completion of the survey granted informed consent
and the involvement in the study is voluntary. Participants were advised that they could
withdraw at any time by discontinuing completion of the survey. As secondary data has
been derived from the annual financial reports of the Australian and Sri Lankan firms
(published in the SIRCA database and CSE website) ethical approval is not required (see
Appendix C for an ethics approval form).

107
4.8 Chapter Summary
This chapter reviews the research methodology behind this study and explores CB practices
and firm performance research methods. The choice of a positivism philosophy and
quantitative approach are justified. The population design choices, data collection and the
variable measurements are also discussed—as are the research methods employed to collect
the data and the statistical techniques used to analyse the data to answer the research
questions. The next section discusses the study findings.
108
Chapter Five: Analysis and Results
5.1 Chapter Introduction
This study investigates whether CB practices differ significantly between Australia and Sri
Lanka in terms of its effect on firm performance. The effect of environmental differences
in developed and emerging economics on CB practices and the flow-on effects to firm
performance are of particular interest. This chapter gives details of the statistical tests
including a detailed analysis of the influence of CB practices on firm performance. The
organisation of this chapter is as follows: Section 5.1 gives the questionnaire survey results;
Section 5.2 reports reliability and validity of test results; Section 5.3 presents the descriptive
analysis of capital budgeting practices; a cross classification of the survey results is given
in Section 5.4; Section 5.5 reports inferential analysis; and Section 5.6 summarises the
chapter.
5.2 Questionnaire Survey Results
5.2.1 Questionnaire Response
The questionnaires posted to 150 Australian- and 150 Sri Lankan-listed firms from Jun-Sep
/2014 asked about firm and respondent demographics along with various aspects of CB
practices. Australian seven questionnaires (i.e. it was assumed that firms that could not be
reached were no longer part of the population) were returned without response, resulting in
an effective population of 143. In order to increase the response rate, after a month, a
reminder letter was sent to the Australian and Sri Lankan firms who did not respond to the
questionnaires. The questionnaire response rates are categorised and given in Table 5.1,
with 118 questionnaires completed and returned. The 45 and 73 returned questionnaires
from, respectively, Australian and Sri Lankan firms give a response rate of 31.5 and 48.7
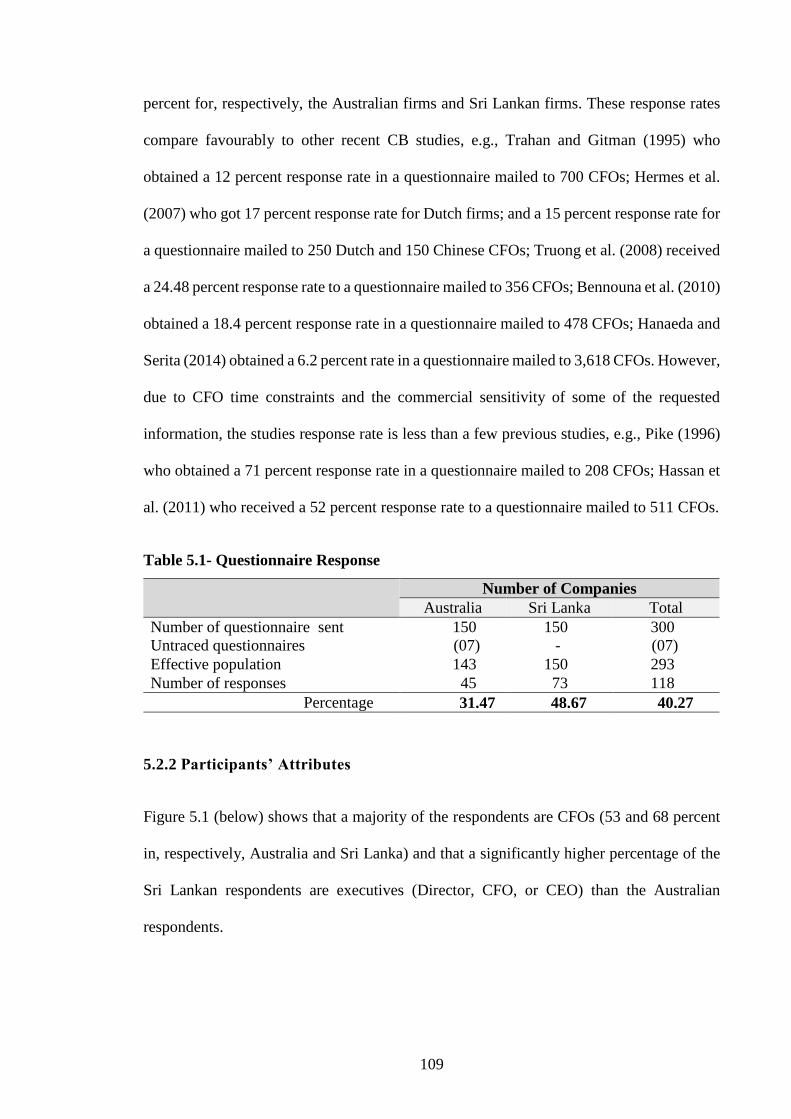
109
percent for, respectively, the Australian firms and Sri Lankan firms. These response rates
compare favourably to other recent CB studies, e.g., Trahan and Gitman (1995) who
obtained a 12 percent response rate in a questionnaire mailed to 700 CFOs; Hermes et al.
(2007) who got 17 percent response rate for Dutch firms; and a 15 percent response rate for
a questionnaire mailed to 250 Dutch and 150 Chinese CFOs; Truong et al. (2008) received
a 24.48 percent response rate to a questionnaire mailed to 356 CFOs; Bennouna et al. (2010)
obtained a 18.4 percent response rate in a questionnaire mailed to 478 CFOs; Hanaeda and
Serita (2014) obtained a 6.2 percent rate in a questionnaire mailed to 3,618 CFOs. However,
due to CFO time constraints and the commercial sensitivity of some of the requested
information, the studies response rate is less than a few previous studies, e.g., Pike (1996)
who obtained a 71 percent response rate in a questionnaire mailed to 208 CFOs; Hassan et
al. (2011) who received a 52 percent response rate to a questionnaire mailed to 511 CFOs.
Table 5.1- Questionnaire Response
5.2.2 Participants’ Attributes
Figure 5.1 (below) shows that a majority of the respondents are CFOs (53 and 68 percent
in, respectively, Australia and Sri Lanka) and that a significantly higher percentage of the
Sri Lankan respondents are executives (Director, CFO, or CEO) than the Australian
respondents.
Number of Companies
Australia Sri Lanka Total
Number of questionnaire sent 150 150 300
Untraced questionnaires (07) - (07)
Effective population 143 150 293
Number of responses 45 73 118
Percentage 31.47 48.67 40.27
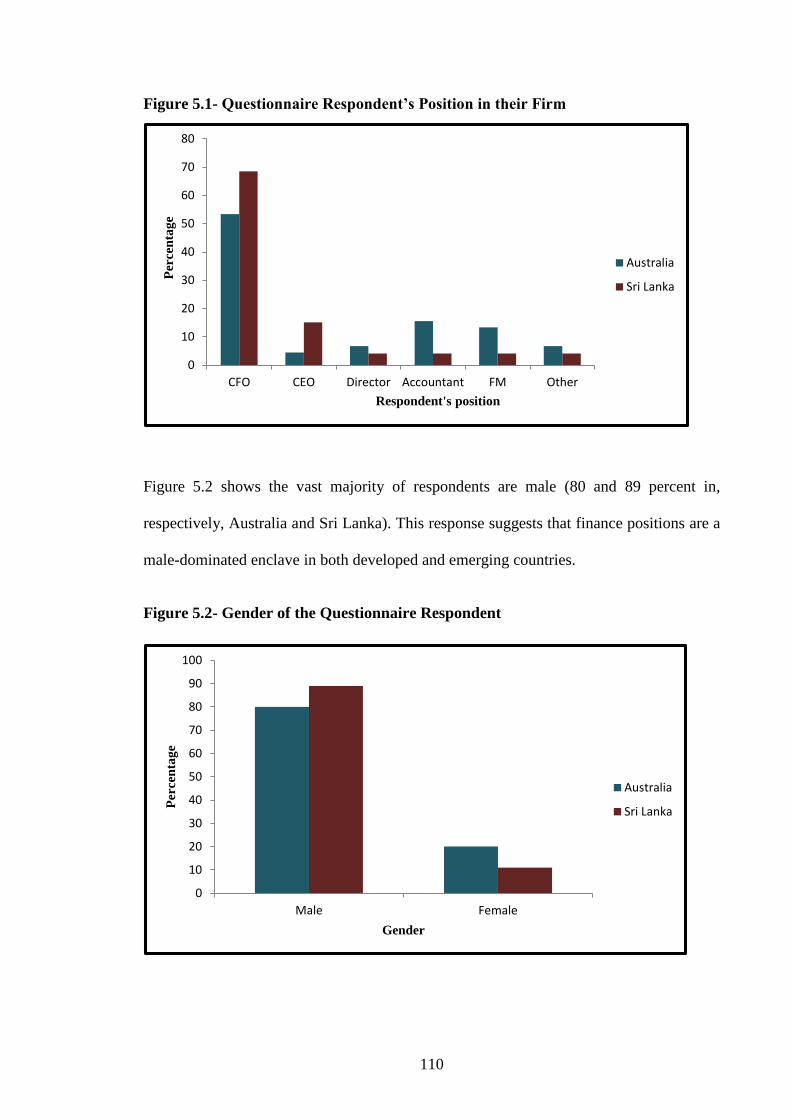
110
Figure 5.1- Questionnaire Respondent’s Position in their Firm
Figure 5.2 shows the vast majority of respondents are male (80 and 89 percent in,
respectively, Australia and Sri Lanka). This response suggests that finance positions are a
male-dominated enclave in both developed and emerging countries.
Figure 5.2- Gender of the Questionnaire Respondent
0
10
20
30
40
50
60
70
80
CFO CEO Director Accountant FM Other
Per
cen
tag
e
Respondent's position
Australia
Sri Lanka
0
10
20
30
40
50
60
70
80
90
100
Male Female
Percen
tag
e
Gender
Australia
Sri Lanka
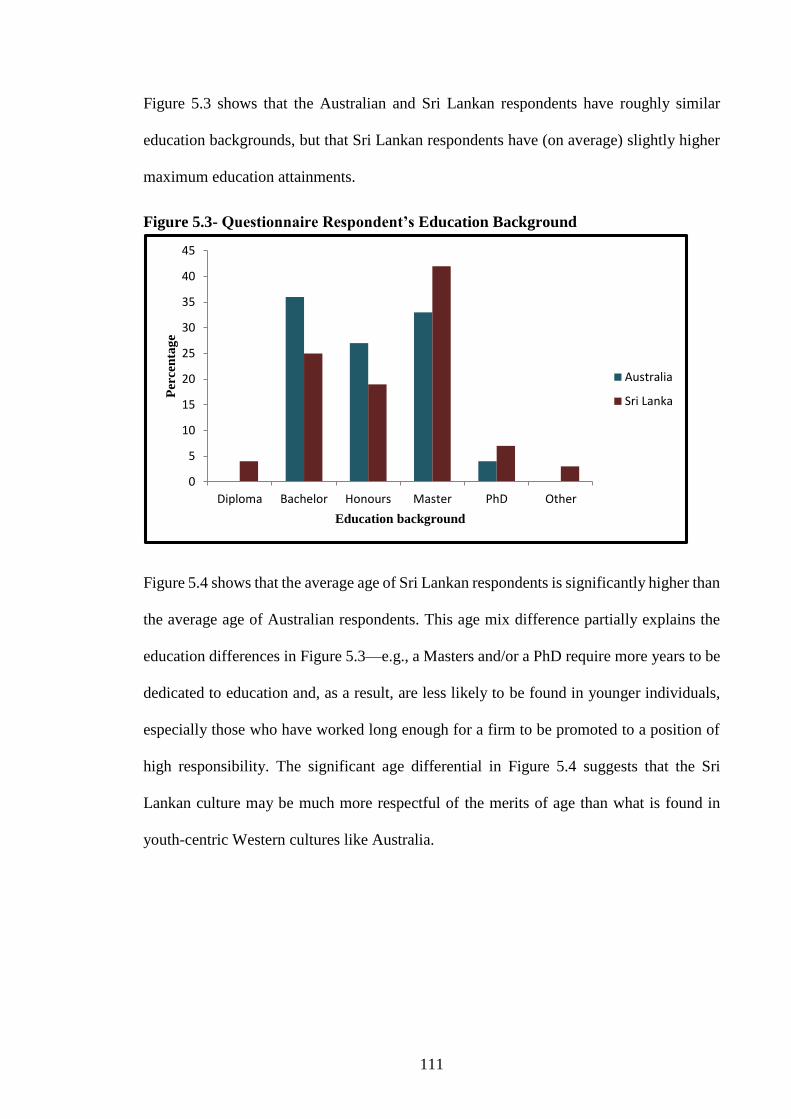
111
Figure 5.3 shows that the Australian and Sri Lankan respondents have roughly similar
education backgrounds, but that Sri Lankan respondents have (on average) slightly higher
maximum education attainments.
Figure 5.3- Questionnaire Respondent’s Education Background
Figure 5.4 shows that the average age of Sri Lankan respondents is significantly higher than
the average age of Australian respondents. This age mix difference partially explains the
education differences in Figure 5.3—e.g., a Masters and/or a PhD require more years to be
dedicated to education and, as a result, are less likely to be found in younger individuals,
especially those who have worked long enough for a firm to be promoted to a position of
high responsibility. The significant age differential in Figure 5.4 suggests that the Sri
Lankan culture may be much more respectful of the merits of age than what is found in
youth-centric Western cultures like Australia.
0
5
10
15
20
25
30
35
40
45
Diploma Bachelor Honours Master PhD Other
Percen
tag
e
Education background
Australia
Sri Lanka
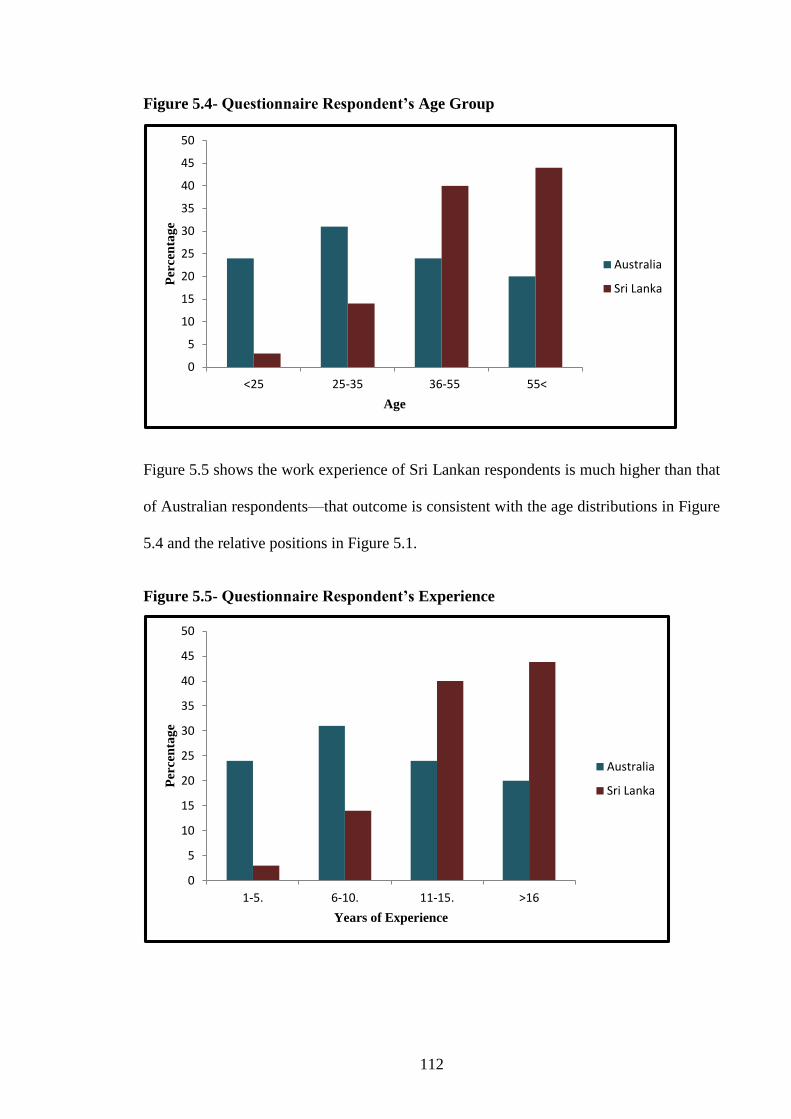
112
Figure 5.4- Questionnaire Respondent’s Age Group
Figure 5.5 shows the work experience of Sri Lankan respondents is much higher than that
of Australian respondents—that outcome is consistent with the age distributions in Figure
5.4 and the relative positions in Figure 5.1.
Figure 5.5- Questionnaire Respondent’s Experience
0
5
10
15
20
25
30
35
40
45
50
<25 25-35 36-55 55<
Per
cen
tag
e
Age
Australia
Sri Lanka
0
5
10
15
20
25
30
35
40
45
50
1-5. 6-10. 11-15. >16
Percen
tag
e
Years of Experience
Australia
Sri Lanka
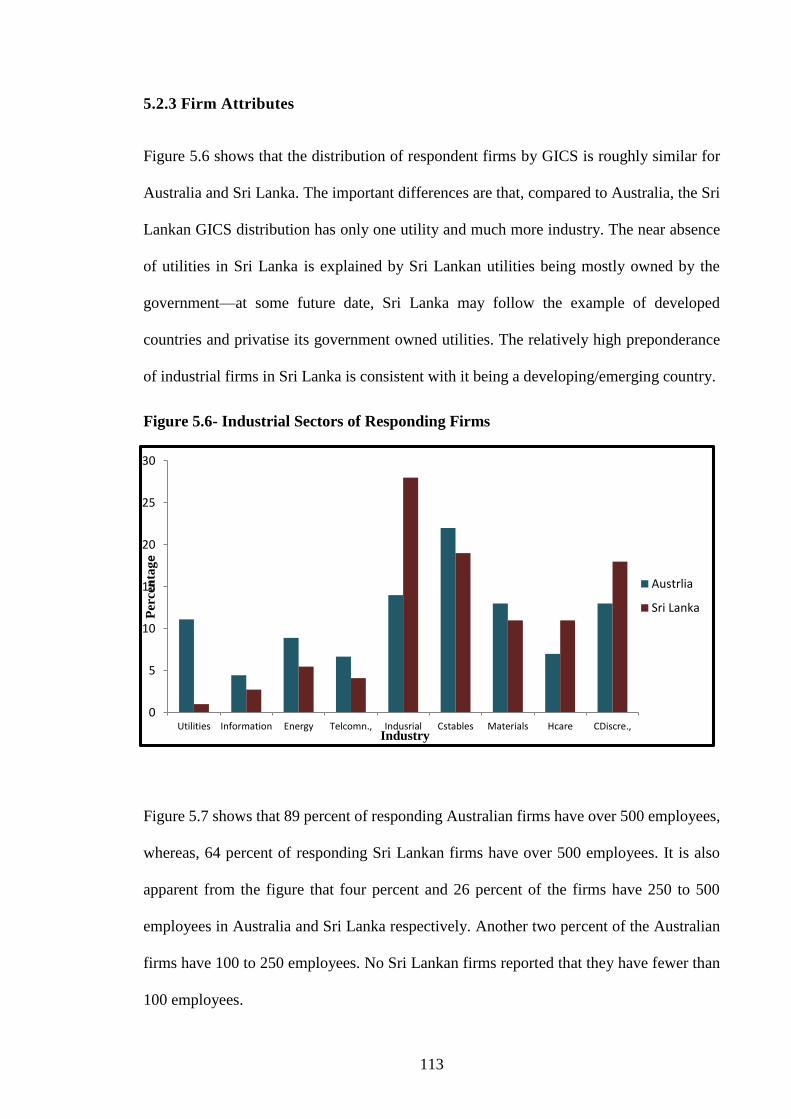
113
5.2.3 Firm Attributes
Figure 5.6 shows that the distribution of respondent firms by GICS is roughly similar for
Australia and Sri Lanka. The important differences are that, compared to Australia, the Sri
Lankan GICS distribution has only one utility and much more industry. The near absence
of utilities in Sri Lanka is explained by Sri Lankan utilities being mostly owned by the
government—at some future date, Sri Lanka may follow the example of developed
countries and privatise its government owned utilities. The relatively high preponderance
of industrial firms in Sri Lanka is consistent with it being a developing/emerging country.
Figure 5.6- Industrial Sectors of Responding Firms
Figure 5.7 shows that 89 percent of responding Australian firms have over 500 employees,
whereas, 64 percent of responding Sri Lankan firms have over 500 employees. It is also
apparent from the figure that four percent and 26 percent of the firms have 250 to 500
employees in Australia and Sri Lanka respectively. Another two percent of the Australian
firms have 100 to 250 employees. No Sri Lankan firms reported that they have fewer than
100 employees.
0
5
10
15
20
25
30
Utilities Information Energy Telcomn., Indusrial Cstables Materials Hcare CDiscre.,
Per
cen
tage
Industry
Austrlia
Sri Lanka
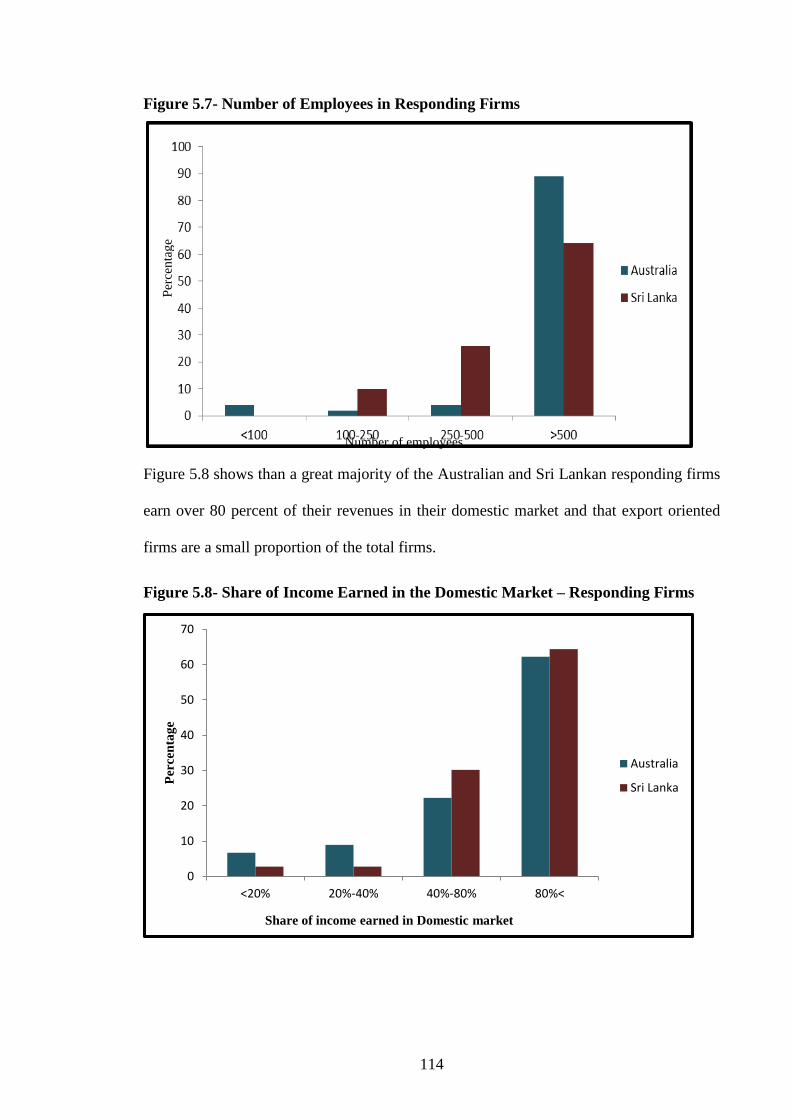
114
Figure 5.7- Number of Employees in Responding Firms
Figure 5.8 shows than a great majority of the Australian and Sri Lankan responding firms
earn over 80 percent of their revenues in their domestic market and that export oriented
firms are a small proportion of the total firms.
Figure 5.8- Share of Income Earned in the Domestic Market – Responding Firms
0
10
20
30
40
50
60
70
<20% 20%-40% 40%-80% 80%<
Per
cen
tag
e
Share of income earned in Domestic market
Australia
Sri Lanka
Per
cen
tag
e
Number of employees
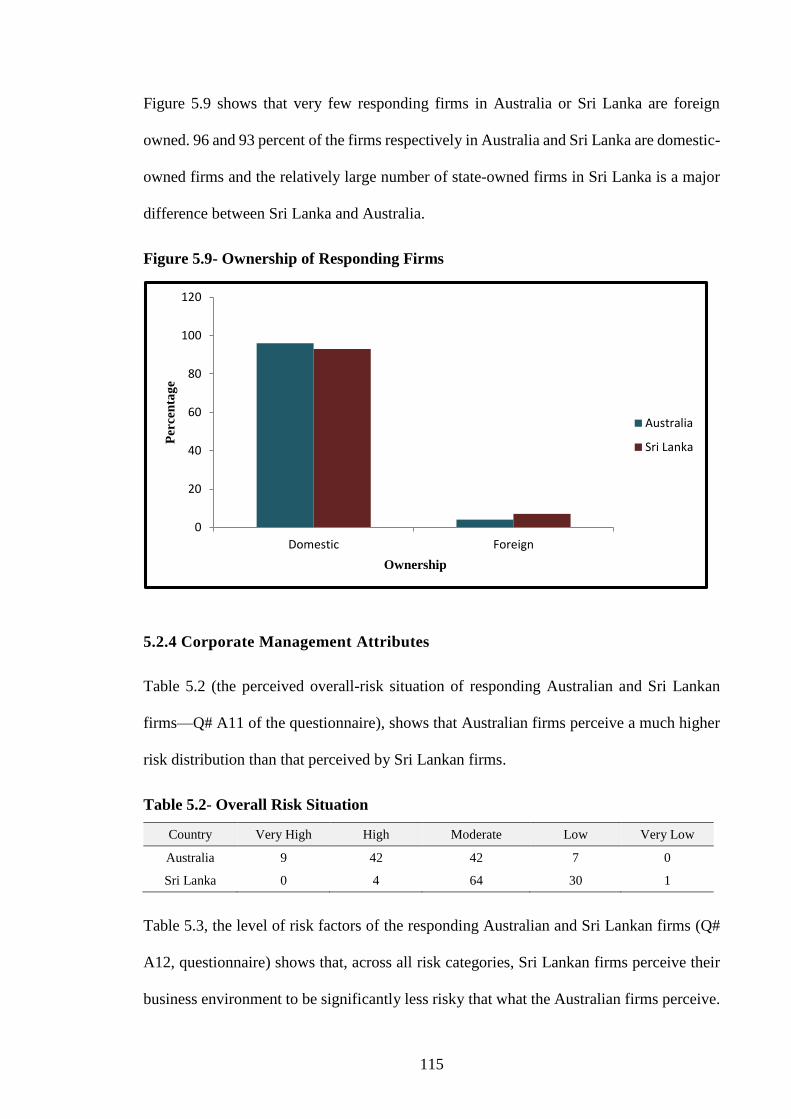
115
Figure 5.9 shows that very few responding firms in Australia or Sri Lanka are foreign
owned. 96 and 93 percent of the firms respectively in Australia and Sri Lanka are domestic-
owned firms and the relatively large number of state-owned firms in Sri Lanka is a major
difference between Sri Lanka and Australia.
Figure 5.9- Ownership of Responding Firms
5.2.4 Corporate Management Attributes
Table 5.2 (the perceived overall-risk situation of responding Australian and Sri Lankan
firms—Q# A11 of the questionnaire), shows that Australian firms perceive a much higher
risk distribution than that perceived by Sri Lankan firms.
Table 5.2- Overall Risk Situation
Country Very High High Moderate Low Very Low
Australia 9 42 42 7 0
Sri Lanka 0 4 64 30 1
Table 5.3, the level of risk factors of the responding Australian and Sri Lankan firms (Q#
A12, questionnaire) shows that, across all risk categories, Sri Lankan firms perceive their
business environment to be significantly less risky that what the Australian firms perceive.
0
20
40
60
80
100
120
Domestic Foreign
Per
cen
tag
e
Ownership
Australia
Sri Lanka
116
These perceptions suggest that Australian firms face relatively higher costs (e.g., wages and
taxes) and much higher internal and international competition than what their counterparts
in Sri Lanka face.
Table 5.4, the ranking of the corporates objectives of the responding Australian and Sri
Lankan firms (Q# A13, questionnaire) show both groups of firms are more likely to
perceive a goal as important rather than very important and both groups of firms rank
sustainability as being slightly more vital than profitability. Also, neither group of firms
have a clear gradient in their ranking of objects (i.e. when the values under important and
very important are added, no objectives were ranked as being significantly less important
than the others).
Table 5.5; in ranking the importance of their stakeholders (Q# A14, questionnaire), the Sri
Lankan firms do not show a clear gradient (i.e. when the values under important and very
important are added, none of the stakeholders were ranked as being significantly less
important than the others—this is very close to the Ethical Branch of Stakeholder Theory).
The Australian firms rank suppliers and the government as significantly less important than
other stakeholders (i.e. with combined important and very important ranks of, respectively,
75 and 53). It is, also, interesting that Australian firms rank customers as being somewhat
less important than employees or shareholders—i.e. the combined important and very
important ranks are, respectively, 85, 93, and 94. The equivalent rankings by Sri Lankan
firms for customers, employees, and shareholders are, respectively, 96, 96, and 92 and for
suppliers and the government are, respectively, 91 and 88. The relative importance of
suppliers and the government in Sri Lanka likely reveals a lot about the nature of the Sri
Lankan business environment.
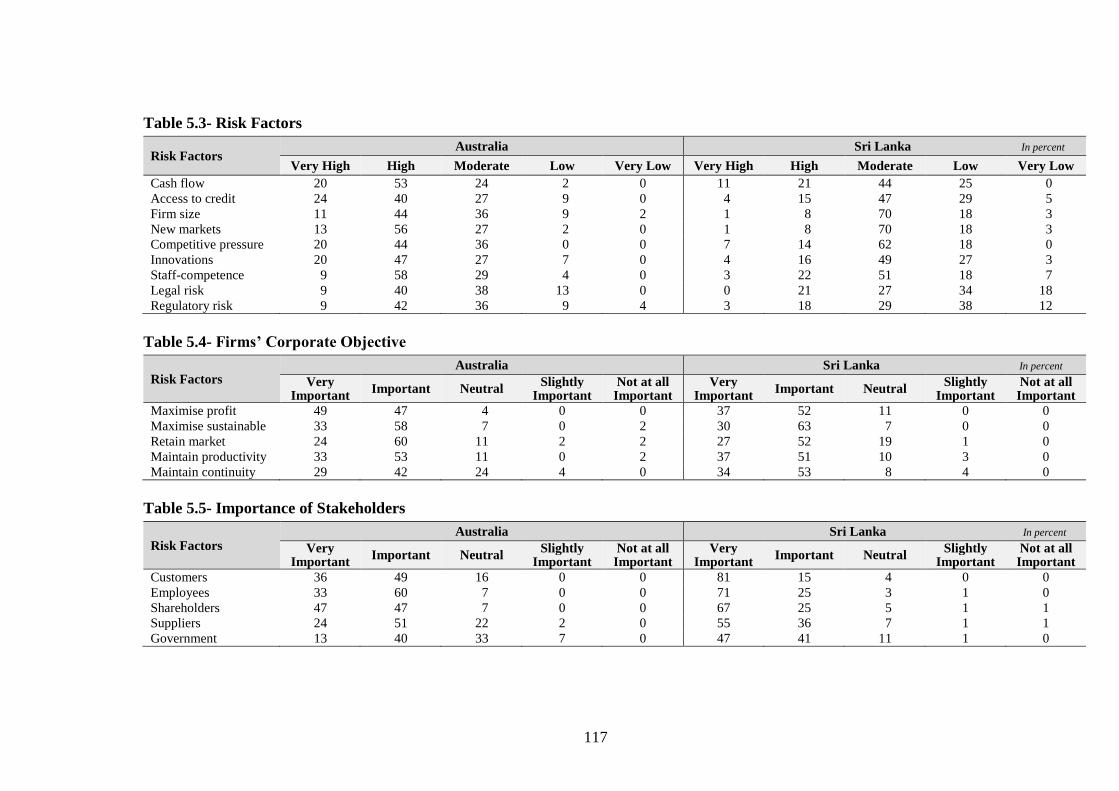
117
Table 5.3- Risk Factors
Table 5.4- Firms’ Corporate Objective
Table 5.5- Importance of Stakeholders
Risk Factors Australia Sri Lanka In percent
Very High High Moderate Low Very Low Very High High Moderate Low Very Low
Cash flow 20 53 24 2 0 11 21 44 25 0
Access to credit 24 40 27 9 0 4 15 47 29 5
Firm size 11 44 36 9 2 1 8 70 18 3
New markets 13 56 27 2 0 1 8 70 18 3
Competitive pressure 20 44 36 0 0 7 14 62 18 0
Innovations 20 47 27 7 0 4 16 49 27 3
Staff-competence 9 58 29 4 0 3 22 51 18 7
Legal risk 9 40 38 13 0 0 21 27 34 18
Regulatory risk 9 42 36 9 4 3 18 29 38 12
Risk Factors Australia Sri Lanka In percent
Very Important
Important Neutral Slightly
Important Not at all
Important Very
Important Important Neutral
Slightly Important
Not at all Important
Maximise profit 49 47 4 0 0 37 52 11 0 0
Maximise sustainable 33 58 7 0 2 30 63 7 0 0
Retain market 24 60 11 2 2 27 52 19 1 0
Maintain productivity 33 53 11 0 2 37 51 10 3 0
Maintain continuity 29 42 24 4 0 34 53 8 4 0
Risk Factors Australia Sri Lanka In percent
Very Important
Important Neutral Slightly
Important Not at all
Important Very
Important Important Neutral
Slightly Important
Not at all Important
Customers 36 49 16 0 0 81 15 4 0 0
Employees 33 60 7 0 0 71 25 3 1 0
Shareholders 47 47 7 0 0 67 25 5 1 1
Suppliers 24 51 22 2 0 55 36 7 1 1
Government 13 40 33 7 0 47 41 11 1 0
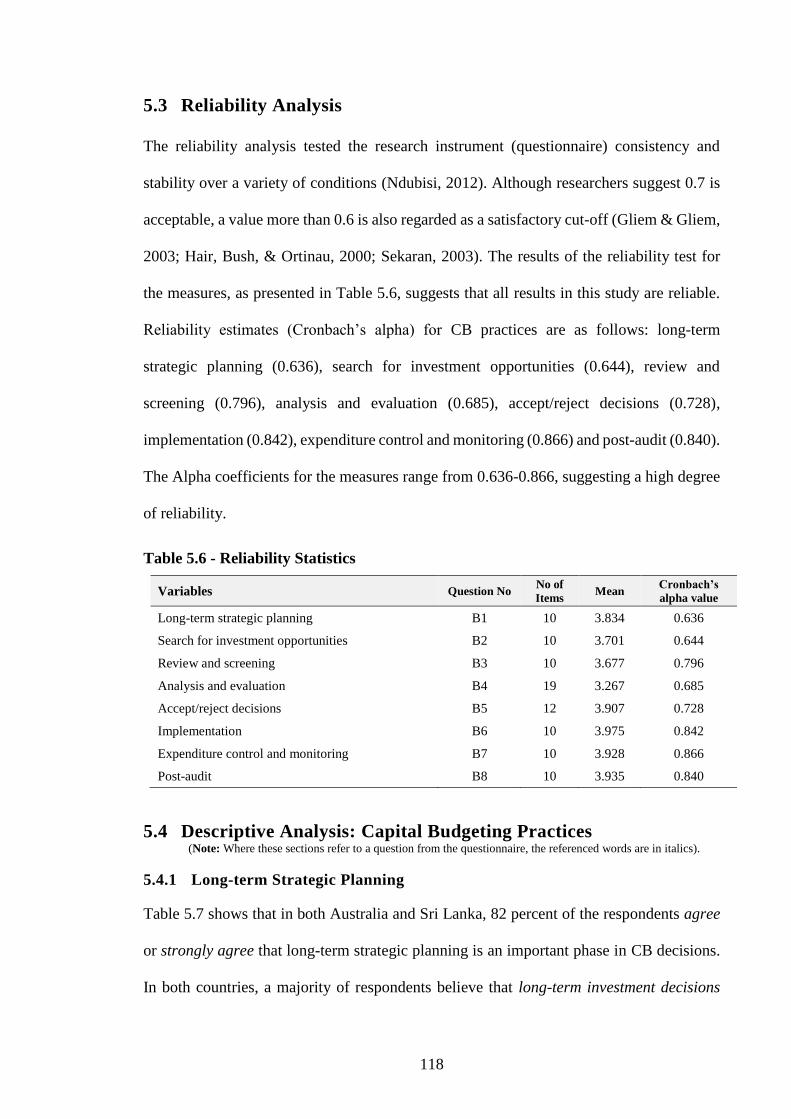
118
5.3 Reliability Analysis
The reliability analysis tested the research instrument (questionnaire) consistency and
stability over a variety of conditions (Ndubisi, 2012). Although researchers suggest 0.7 is
acceptable, a value more than 0.6 is also regarded as a satisfactory cut-off (Gliem & Gliem,
2003; Hair, Bush, & Ortinau, 2000; Sekaran, 2003). The results of the reliability test for
the measures, as presented in Table 5.6, suggests that all results in this study are reliable.
Reliability estimates (Cronbach’s alpha) for CB practices are as follows: long-term
strategic planning (0.636), search for investment opportunities (0.644), review and
screening (0.796), analysis and evaluation (0.685), accept/reject decisions (0.728),
implementation (0.842), expenditure control and monitoring (0.866) and post-audit (0.840).
The Alpha coefficients for the measures range from 0.636-0.866, suggesting a high degree
of reliability.
Table 5.6 - Reliability Statistics
Variables Question No No of
Items Mean
Cronbach’s
alpha value
Long-term strategic planning B1 10 3.834 0.636
Search for investment opportunities B2 10 3.701 0.644
Review and screening B3 10 3.677 0.796
Analysis and evaluation B4 19 3.267 0.685
Accept/reject decisions B5 12 3.907 0.728
Implementation B6 10 3.975 0.842
Expenditure control and monitoring B7 10 3.928 0.866
Post-audit B8 10 3.935 0.840
5.4 Descriptive Analysis: Capital Budgeting Practices (Note: Where these sections refer to a question from the questionnaire, the referenced words are in italics).
5.4.1 Long-term Strategic Planning
Table 5.7 shows that in both Australia and Sri Lanka, 82 percent of the respondents agree
or strongly agree that long-term strategic planning is an important phase in CB decisions.
In both countries, a majority of respondents believe that long-term investment decisions
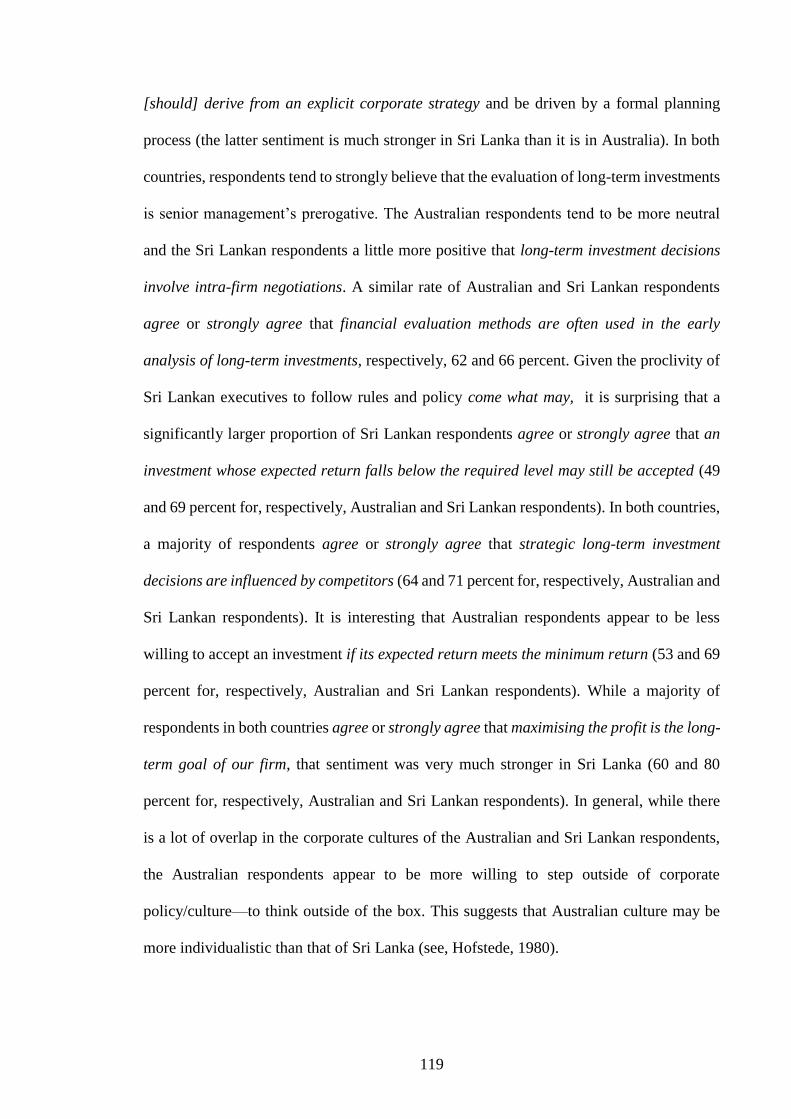
119
[should] derive from an explicit corporate strategy and be driven by a formal planning
process (the latter sentiment is much stronger in Sri Lanka than it is in Australia). In both
countries, respondents tend to strongly believe that the evaluation of long-term investments
is senior management’s prerogative. The Australian respondents tend to be more neutral
and the Sri Lankan respondents a little more positive that long-term investment decisions
involve intra-firm negotiations. A similar rate of Australian and Sri Lankan respondents
agree or strongly agree that financial evaluation methods are often used in the early
analysis of long-term investments, respectively, 62 and 66 percent. Given the proclivity of
Sri Lankan executives to follow rules and policy come what may, it is surprising that a
significantly larger proportion of Sri Lankan respondents agree or strongly agree that an
investment whose expected return falls below the required level may still be accepted (49
and 69 percent for, respectively, Australian and Sri Lankan respondents). In both countries,
a majority of respondents agree or strongly agree that strategic long-term investment
decisions are influenced by competitors (64 and 71 percent for, respectively, Australian and
Sri Lankan respondents). It is interesting that Australian respondents appear to be less
willing to accept an investment if its expected return meets the minimum return (53 and 69
percent for, respectively, Australian and Sri Lankan respondents). While a majority of
respondents in both countries agree or strongly agree that maximising the profit is the long-
term goal of our firm, that sentiment was very much stronger in Sri Lanka (60 and 80
percent for, respectively, Australian and Sri Lankan respondents). In general, while there
is a lot of overlap in the corporate cultures of the Australian and Sri Lankan respondents,
the Australian respondents appear to be more willing to step outside of corporate
policy/culture—to think outside of the box. This suggests that Australian culture may be
more individualistic than that of Sri Lanka (see, Hofstede, 1980).
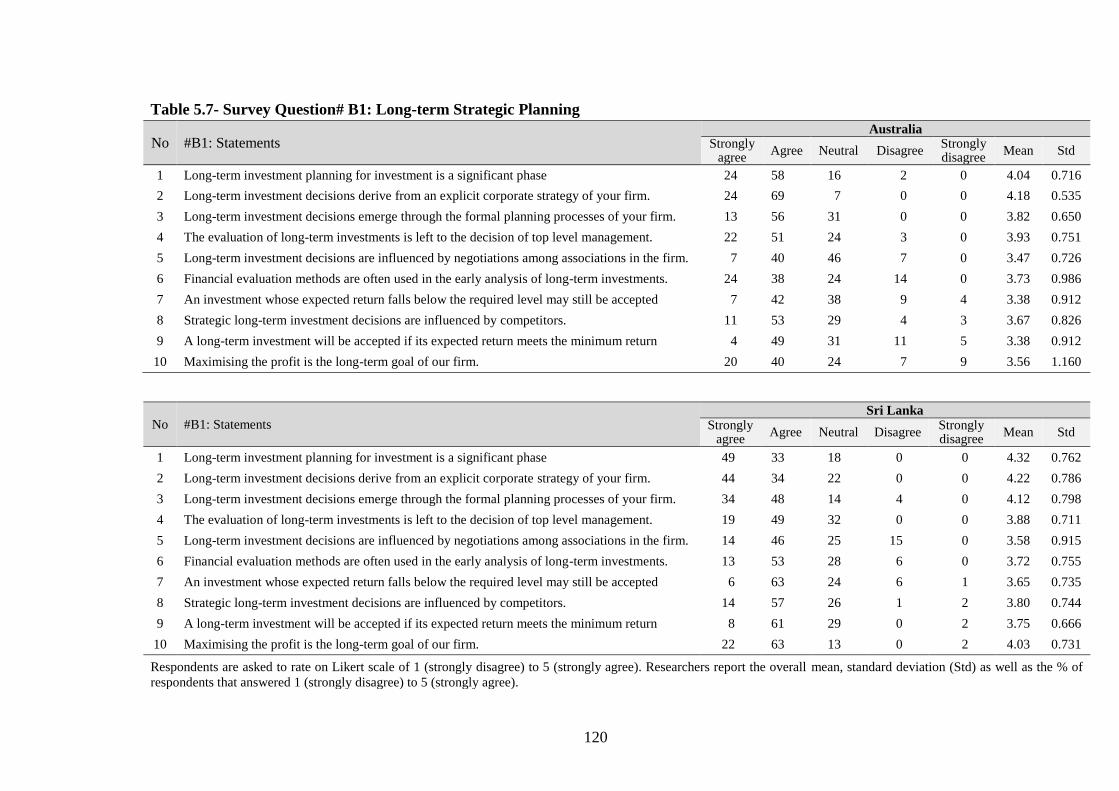
120
Table 5.7- Survey Question# B1: Long-term Strategic Planning
No #B1: Statements Australia
Strongly agree
Agree Neutral Disagree Strongly disagree
Mean Std
1 Long-term investment planning for investment is a significant phase 24 58 16 2 0 4.04 0.716
2 Long-term investment decisions derive from an explicit corporate strategy of your firm. 24 69 7 0 0 4.18 0.535
3 Long-term investment decisions emerge through the formal planning processes of your firm. 13 56 31 0 0 3.82 0.650
4 The evaluation of long-term investments is left to the decision of top level management. 22 51 24 3 0 3.93 0.751
5 Long-term investment decisions are influenced by negotiations among associations in the firm. 7 40 46 7 0 3.47 0.726
6 Financial evaluation methods are often used in the early analysis of long-term investments. 24 38 24 14 0 3.73 0.986
7 An investment whose expected return falls below the required level may still be accepted 7 42 38 9 4 3.38 0.912
8 Strategic long-term investment decisions are influenced by competitors. 11 53 29 4 3 3.67 0.826
9 A long-term investment will be accepted if its expected return meets the minimum return 4 49 31 11 5 3.38 0.912
10 Maximising the profit is the long-term goal of our firm. 20 40 24 7 9 3.56 1.160
No #B1: Statements Sri Lanka
Strongly agree
Agree Neutral Disagree Strongly disagree
Mean Std
1 Long-term investment planning for investment is a significant phase 49 33 18 0 0 4.32 0.762
2 Long-term investment decisions derive from an explicit corporate strategy of your firm. 44 34 22 0 0 4.22 0.786
3 Long-term investment decisions emerge through the formal planning processes of your firm. 34 48 14 4 0 4.12 0.798
4 The evaluation of long-term investments is left to the decision of top level management. 19 49 32 0 0 3.88 0.711
5 Long-term investment decisions are influenced by negotiations among associations in the firm. 14 46 25 15 0 3.58 0.915
6 Financial evaluation methods are often used in the early analysis of long-term investments. 13 53 28 6 0 3.72 0.755
7 An investment whose expected return falls below the required level may still be accepted 6 63 24 6 1 3.65 0.735
8 Strategic long-term investment decisions are influenced by competitors. 14 57 26 1 2 3.80 0.744
9 A long-term investment will be accepted if its expected return meets the minimum return 8 61 29 0 2 3.75 0.666
10 Maximising the profit is the long-term goal of our firm. 22 63 13 0 2 4.03 0.731
Respondents are asked to rate on Likert scale of 1 (strongly disagree) to 5 (strongly agree). Researchers report the overall mean, standard deviation (Std) as well as the % of
respondents that answered 1 (strongly disagree) to 5 (strongly agree).
121
5.4.2 Search for Investment Opportunities
In Table 5.8, 95 and 75 percent of the respondents from, respectively, Australia and Sri
Lanka either strongly agree or agree that the search for investment opportunities is a
significant phase for long-term investment decisions. The process of matching the search
for investments to strategic goals is considered important by respondents in both countries
(82 and 77 percent for, respectively, Australian and Sri Lankan respondents).
Australian respondents appear to be more willing than Sri Lankan respondents to change
corporate strategy to accommodate beneficial projects that are identified (53 and 46 percent
for, respectively, Australian and Sri Lankan respondents). However, respondents from both
countries appear to be equally accepting that if an excellent investment presents itself the
corporate vision may be changed to accommodate it (47 and 46 percent for, respectively,
Australian and Sri Lankan respondents). The Australian firms appear to be more active than
Sri Lankan firms in constantly searching into attractive investment opportunities (62 and
45 percent for, respectively, Australian and Sri Lankan respondents). Finding alternatives
of each investment opportunities before the final decision appears to be less essential to
Australian respondents (55 and 66 percent for, respectively, Australian and Sri Lankan
respondents).
Sri Lankan respondents tend to be neutral or to disagree with the idea that a profitable
investment proposal is not just born; someone has to suggest it (53 and 11 percent agree or
strongly agree for, respectively, Australian and Sri Lankan respondents). Australian and
Sri Lankan respondents tend to agree on the usefulness of rewards as a significant tool for
identifying potential investments (the sum of strongly agree and agree is 51 and 54 percent
for, respectively, Australian and Sri Lankan respondents). Sri Lankan respondents are more
likely to believe that investment opportunities are identified and proposed by top level

122
management (the sum of strongly agree and agree is 45 and 76 percent for, respectively,
Australian and Sri Lankan respondents). Sri Lankan respondents are more likely to believe
that the firm should ensure that it has identified potentially profitable investment
opportunities (the sum of strongly agree or agree is 65 and 73 percent for, respectively,
Australian and Sri Lankan respondents). The forgoing results suggest that Australian
managers may be significantly more flexible, confident, and willing to take calculated risks
than their Sri Lankan counterparts.
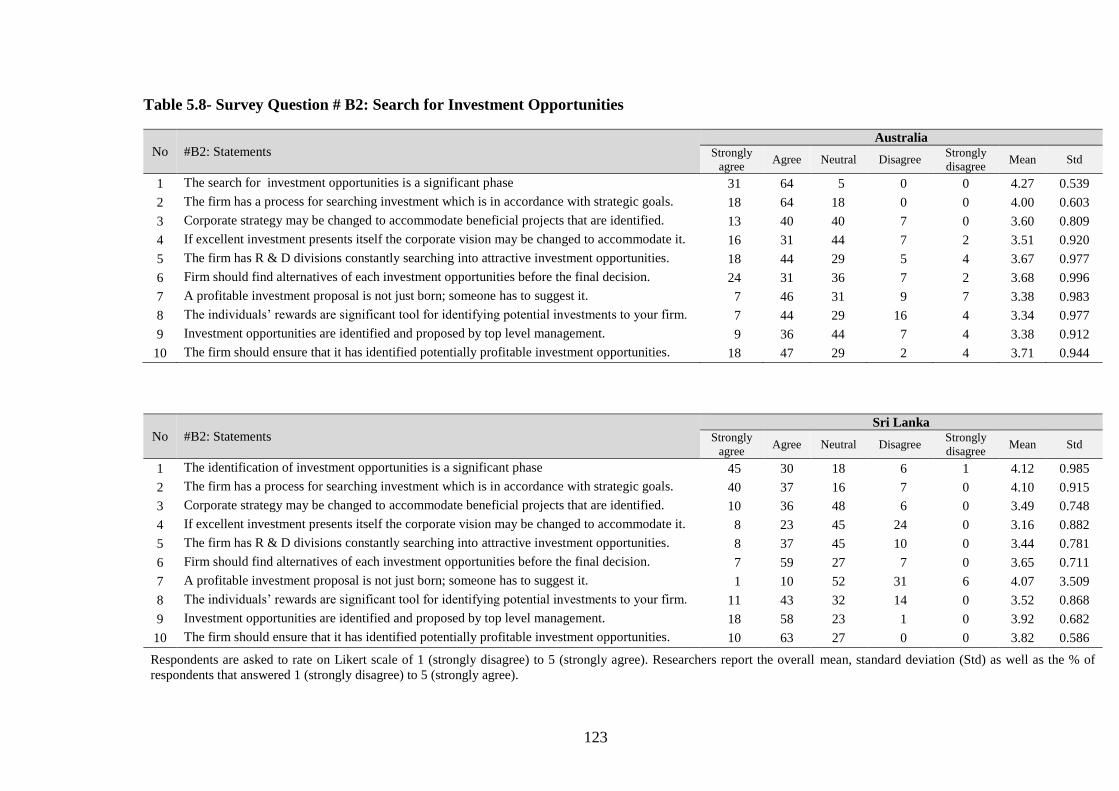
123
Table 5.8- Survey Question # B2: Search for Investment Opportunities
No #B2: Statements Australia
Strongly
agree Agree Neutral Disagree
Strongly
disagree Mean Std
1 The search for investment opportunities is a significant phase 31 64 5 0 0 4.27 0.539
2 The firm has a process for searching investment which is in accordance with strategic goals. 18 64 18 0 0 4.00 0.603
3 Corporate strategy may be changed to accommodate beneficial projects that are identified. 13 40 40 7 0 3.60 0.809
4 If excellent investment presents itself the corporate vision may be changed to accommodate it. 16 31 44 7 2 3.51 0.920
5 The firm has R & D divisions constantly searching into attractive investment opportunities. 18 44 29 5 4 3.67 0.977
6 Firm should find alternatives of each investment opportunities before the final decision. 24 31 36 7 2 3.68 0.996
7 A profitable investment proposal is not just born; someone has to suggest it. 7 46 31 9 7 3.38 0.983
8 The individuals’ rewards are significant tool for identifying potential investments to your firm. 7 44 29 16 4 3.34 0.977
9 Investment opportunities are identified and proposed by top level management. 9 36 44 7 4 3.38 0.912
10 The firm should ensure that it has identified potentially profitable investment opportunities. 18 47 29 2 4 3.71 0.944
No #B2: Statements Sri Lanka
Strongly
agree Agree Neutral Disagree
Strongly
disagree Mean Std
1 The identification of investment opportunities is a significant phase 45 30 18 6 1 4.12 0.985
2 The firm has a process for searching investment which is in accordance with strategic goals. 40 37 16 7 0 4.10 0.915
3 Corporate strategy may be changed to accommodate beneficial projects that are identified. 10 36 48 6 0 3.49 0.748
4 If excellent investment presents itself the corporate vision may be changed to accommodate it. 8 23 45 24 0 3.16 0.882
5 The firm has R & D divisions constantly searching into attractive investment opportunities. 8 37 45 10 0 3.44 0.781
6 Firm should find alternatives of each investment opportunities before the final decision. 7 59 27 7 0 3.65 0.711
7 A profitable investment proposal is not just born; someone has to suggest it. 1 10 52 31 6 4.07 3.509
8 The individuals’ rewards are significant tool for identifying potential investments to your firm. 11 43 32 14 0 3.52 0.868
9 Investment opportunities are identified and proposed by top level management. 18 58 23 1 0 3.92 0.682
10 The firm should ensure that it has identified potentially profitable investment opportunities. 10 63 27 0 0 3.82 0.586
Respondents are asked to rate on Likert scale of 1 (strongly disagree) to 5 (strongly agree). Researchers report the overall mean, standard deviation (Std) as well as the % of
respondents that answered 1 (strongly disagree) to 5 (strongly agree).
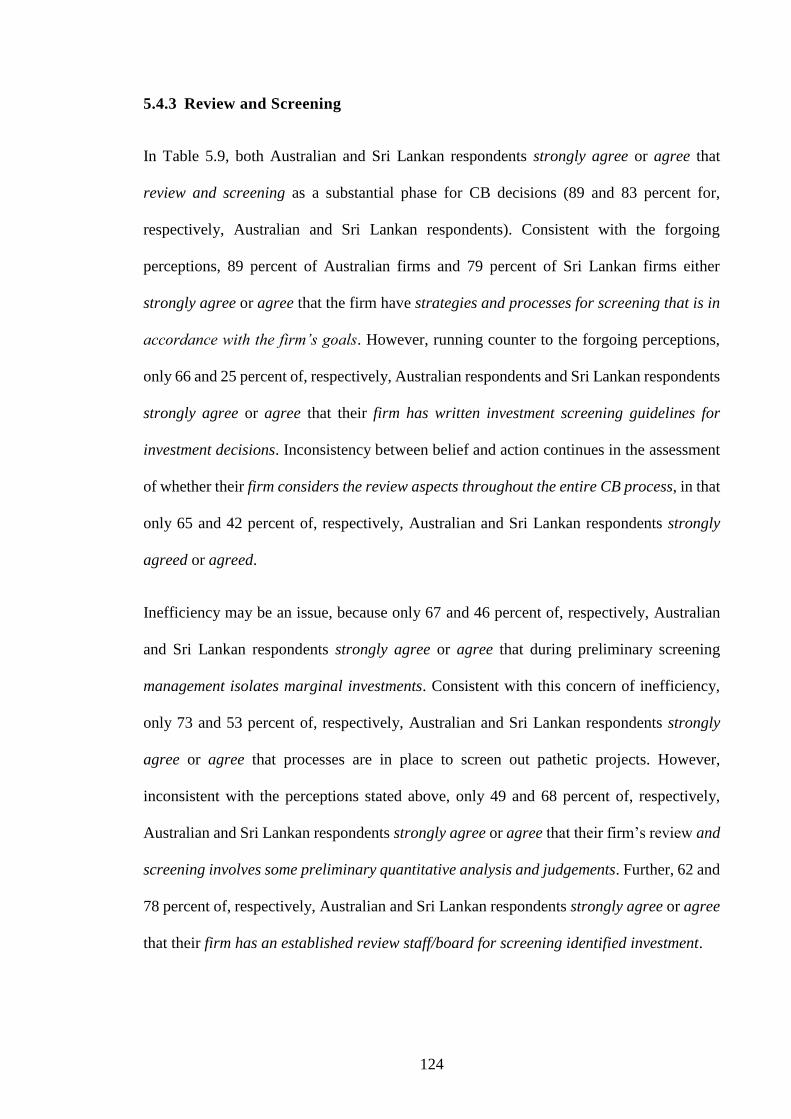
124
5.4.3 Review and Screening
In Table 5.9, both Australian and Sri Lankan respondents strongly agree or agree that
review and screening as a substantial phase for CB decisions (89 and 83 percent for,
respectively, Australian and Sri Lankan respondents). Consistent with the forgoing
perceptions, 89 percent of Australian firms and 79 percent of Sri Lankan firms either
strongly agree or agree that the firm have strategies and processes for screening that is in
accordance with the firm’s goals. However, running counter to the forgoing perceptions,
only 66 and 25 percent of, respectively, Australian respondents and Sri Lankan respondents
strongly agree or agree that their firm has written investment screening guidelines for
investment decisions. Inconsistency between belief and action continues in the assessment
of whether their firm considers the review aspects throughout the entire CB process, in that
only 65 and 42 percent of, respectively, Australian and Sri Lankan respondents strongly
agreed or agreed.
Inefficiency may be an issue, because only 67 and 46 percent of, respectively, Australian
and Sri Lankan respondents strongly agree or agree that during preliminary screening
management isolates marginal investments. Consistent with this concern of inefficiency,
only 73 and 53 percent of, respectively, Australian and Sri Lankan respondents strongly
agree or agree that processes are in place to screen out pathetic projects. However,
inconsistent with the perceptions stated above, only 49 and 68 percent of, respectively,
Australian and Sri Lankan respondents strongly agree or agree that their firm’s review and
screening involves some preliminary quantitative analysis and judgements. Further, 62 and
78 percent of, respectively, Australian and Sri Lankan respondents strongly agree or agree
that their firm has an established review staff/board for screening identified investment.

125
Sri Lankan respondents strongly believe that the investment review and screening phase
decision clearly affects the success or failure of the firm (i.e. 48 and 81 percent of,
respectively, Australian and Sri Lankan respondents strongly agreed or agreed). Both the
Australian and Sri Lankan respondents strongly agree or agree (66 percent) that their firm
has regular and pre-decided procedures.
While both the Australian and Sri Lankan respondents strongly agree that review, analysis,
and screening are essential to their firm’s success, a majority of Sri Lankan firms do not
appear to have written investment screening guidelines for investment decisions. Also, Sri
Lankan firms appear to be more likely to engage in preliminary quantitative analysis and
judgements on investment projects and are more likely to have an established review
staff/board for screening identified investments. However, even though Sri Lankan firms
appear to have more means to evaluate projects, Sri Lankan respondents appear to be much
less confident than Australian respondents in the ability of their firm to isolate marginal
investments or to sort out pathetic projects.
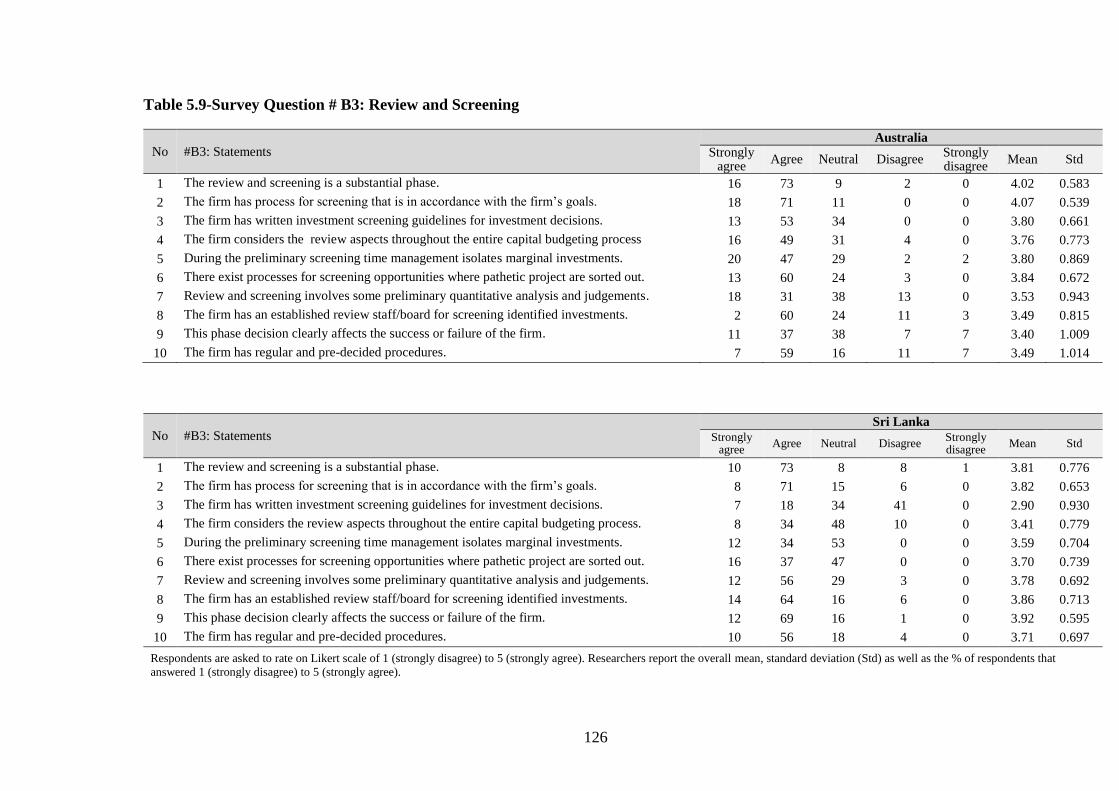
126
Table 5.9-Survey Question # B3: Review and Screening
No #B3: Statements Australia
Strongly agree
Agree Neutral Disagree Strongly disagree
Mean Std
1 The review and screening is a substantial phase. 16 73 9 2 0 4.02 0.583
2 The firm has process for screening that is in accordance with the firm’s goals. 18 71 11 0 0 4.07 0.539
3 The firm has written investment screening guidelines for investment decisions. 13 53 34 0 0 3.80 0.661
4 The firm considers the review aspects throughout the entire capital budgeting process 16 49 31 4 0 3.76 0.773
5 During the preliminary screening time management isolates marginal investments. 20 47 29 2 2 3.80 0.869
6 There exist processes for screening opportunities where pathetic project are sorted out. 13 60 24 3 0 3.84 0.672
7 Review and screening involves some preliminary quantitative analysis and judgements. 18 31 38 13 0 3.53 0.943
8 The firm has an established review staff/board for screening identified investments. 2 60 24 11 3 3.49 0.815
9 This phase decision clearly affects the success or failure of the firm. 11 37 38 7 7 3.40 1.009
10 The firm has regular and pre-decided procedures. 7 59 16 11 7 3.49 1.014
No #B3: Statements Sri Lanka
Strongly agree
Agree Neutral Disagree Strongly disagree
Mean Std
1 The review and screening is a substantial phase. 10 73 8 8 1 3.81 0.776
2 The firm has process for screening that is in accordance with the firm’s goals. 8 71 15 6 0 3.82 0.653
3 The firm has written investment screening guidelines for investment decisions. 7 18 34 41 0 2.90 0.930
4 The firm considers the review aspects throughout the entire capital budgeting process. 8 34 48 10 0 3.41 0.779
5 During the preliminary screening time management isolates marginal investments. 12 34 53 0 0 3.59 0.704
6 There exist processes for screening opportunities where pathetic project are sorted out. 16 37 47 0 0 3.70 0.739
7 Review and screening involves some preliminary quantitative analysis and judgements. 12 56 29 3 0 3.78 0.692
8 The firm has an established review staff/board for screening identified investments. 14 64 16 6 0 3.86 0.713
9 This phase decision clearly affects the success or failure of the firm. 12 69 16 1 0 3.92 0.595
10 The firm has regular and pre-decided procedures. 10 56 18 4 0 3.71 0.697
Respondents are asked to rate on Likert scale of 1 (strongly disagree) to 5 (strongly agree). Researchers report the overall mean, standard deviation (Std) as well as the % of respondents that
answered 1 (strongly disagree) to 5 (strongly agree).

127
5.4.4 Capital Budgeting Analysis Methods
As can be seen in Table 5.10, the NPV and IRR methods are now widely used techniques
among the Australian firms participating in the survey. NPV and IRR are the two most
popular techniques, with 98 percent of the firms reporting they use these techniques,
although, PBP is also prevalent (83 percent) in Australia. Although, most Sri Lankan
respondents selected PBP and IRR as their most regularly used CB techniques, a substantial
percentage uses PBP as their primary method in CB decisions. The NPV method is less
preferred in Sri Lanka, with only 56 percent of the respondents noting that they use PBP
always. Interestingly, a large percentage of Australian and Sri Lankan firms still use PBP.
In contrast to this, other CB techniques such as discounted payback period (DPP) and ARR
are less frequently used in Australia. However, only 51 percent of Australian firms use
ARR as the prevalent CB techniques. While the DPP and ARR techniques are clearly the
least popular in Sri Lanka, only 30 percent and 24 percent respectively of the Sri Lanka
respondents use these methods. The mean values for NPV and IRR techniques are 4.62
followed by PBP technique (4.16) in Australia whereas the mean value for the PBP and
IRR are 4.01 and 3.78 of the Sri Lankan firms respectively.
The results also illustrate that scenario approach and sensitivity analyses are the most
extensively used techniques for assessing the capital investments risk in Australia. The
results indicate that among Australian respondents, 76 percent of the respondents use
scenario approach or sensitivity analysis, 31 percent use decision tree approach while 26
percent respondents employ probabilistic (Monte Carlo) simulation. For Sri Lankan firms,
79 percent of respondents indicate that they use a scenario approach most widely, 34 percent
of respondents mentioned sensitivity analyses, while 29 percent of respondents stated that
they use a risk adjusted discount rate most often. Compared to Australian firms, Sri Lankan
128
firms appear to use the scenario approach more often. Interestingly, few firms in Sri Lanka
would use decision tree approach and probabilistic (Monte Carlo) simulation to evaluate
their risk. Twelve percent and 13 percent of the respondents would usually use the decision
tree approach and probabilistic (Monte Carlo) simulation respectively while only 16 percent
of Australian respondents considered using a risk adjusted discount rate. The results also
present the mean values for the scenario approach and sensitivity analyses as 4.04 and 3.94
followed by decision tree approach with 3.04 in Australia whereas the mean value for the
scenario approach is 4.25 for Sri Lankan firms.
In estimating the cost of capital, 85 percent of Australian firms rely to some extent on the
WACC; 75 percent use the CAPM most frequently, 49 percent mention using interest
payable on debt capital, 33 percent use the earnings yield on shares, 24 percent note that
they use the dividend yield on shares method most often. In Sri Lanka, 85 percent of
respondents use the WACC most commonly, 64 percent use the interest payable on debt
capital, while 37 percent state that they use the earnings yield on shares most often.
Compared to the Sri Lankan firms, Australian firms appear to use the WACC and CAPM
more often. Thus, the WACC has clearly established its position as the most popular
method in both countries and dividend yield on shares method and CAPM method are used
much less; 24 and 31 percent of the Australian and Sri Lankan firms report they use these
methods frequently. The results also shows the mean values for WACC and CAPM are
4.24 and 4.04 followed by interest payable on debt capital with 3.38 in Australia whereas
the mean value for the WACC is 3.93 of the Sri Lankan firms.
Table 5.10 presents the results of the survey on the techniques used by Australian and Sri
Lankan firms to guide long-term investment decisions. As shown in the table, most of the
firms in Australia adhere to the RO analysis over the other techniques. The RO analysis is
129
highly ranked as frequently/mostly practiced in CB with 73 percent in Australia, while 30
percent of Sri Lankan firms indicated that they frequently/mostly use this technique. Thus,
the RO analysis is used more often by Australian firms than by Sri Lankan firms. Forty two
percent of firms in Australia stated that they use game theory most often. For the Sri Lankan
firms, game theory technique is used much less; only four percent of the Respondents
accepted they use this method most often. Twenty percent and 13 percent of Australian
firms reported that they use balanced scorecard and value chain analysis, respectively.
Similar to Australian firms, these methods are the least popular for Sri Lankan firms. On
the other hand, about 17-18 percent of firms in Sri Lanka prefer balanced scorecard and
value chain analysis as a guide to long-term investment decisions. The results also show
the mean values for the RO and game theory as 3.58 and 3.09 followed by balanced
scorecard with 2.69 in Australia—the mean value for the RO is 2.79 for Sri Lankan firms.
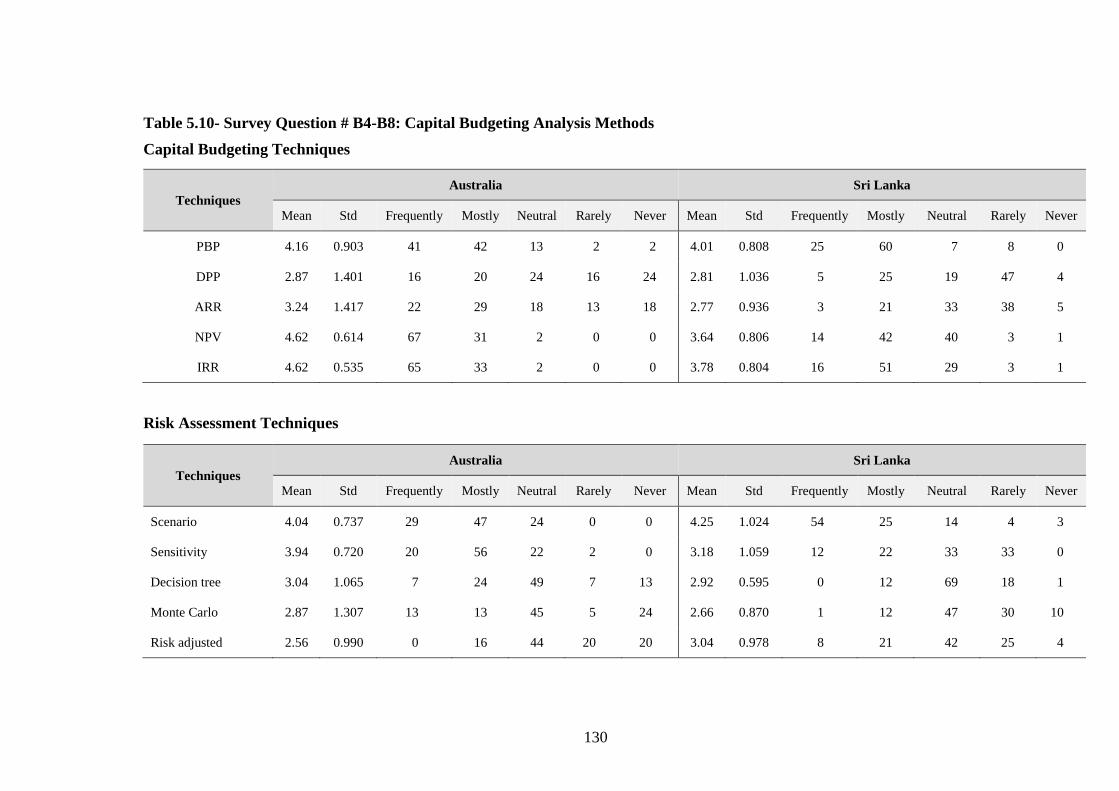
130
Table 5.10- Survey Question # B4-B8: Capital Budgeting Analysis Methods
Capital Budgeting Techniques
Risk Assessment Techniques
Techniques Australia Sri Lanka
Mean Std Frequently Mostly Neutral Rarely Never Mean Std Frequently Mostly Neutral Rarely Never
Scenario 4.04 0.737 29 47 24 0 0 4.25 1.024 54 25 14 4 3
Sensitivity 3.94 0.720 20 56 22 2 0 3.18 1.059 12 22 33 33 0
Decision tree 3.04 1.065 7 24 49 7 13 2.92 0.595 0 12 69 18 1
Monte Carlo 2.87 1.307 13 13 45 5 24 2.66 0.870 1 12 47 30 10
Risk adjusted 2.56 0.990 0 16 44 20 20 3.04 0.978 8 21 42 25 4
Techniques Australia Sri Lanka
Mean Std Frequently Mostly Neutral Rarely Never Mean Std Frequently Mostly Neutral Rarely Never
PBP 4.16 0.903 41 42 13 2 2 4.01 0.808 25 60 7 8 0
DPP 2.87 1.401 16 20 24 16 24 2.81 1.036 5 25 19 47 4
ARR 3.24 1.417 22 29 18 13 18 2.77 0.936 3 21 33 38 5
NPV 4.62 0.614 67 31 2 0 0 3.64 0.806 14 42 40 3 1
IRR 4.62 0.535 65 33 2 0 0 3.78 0.804 16 51 29 3 1
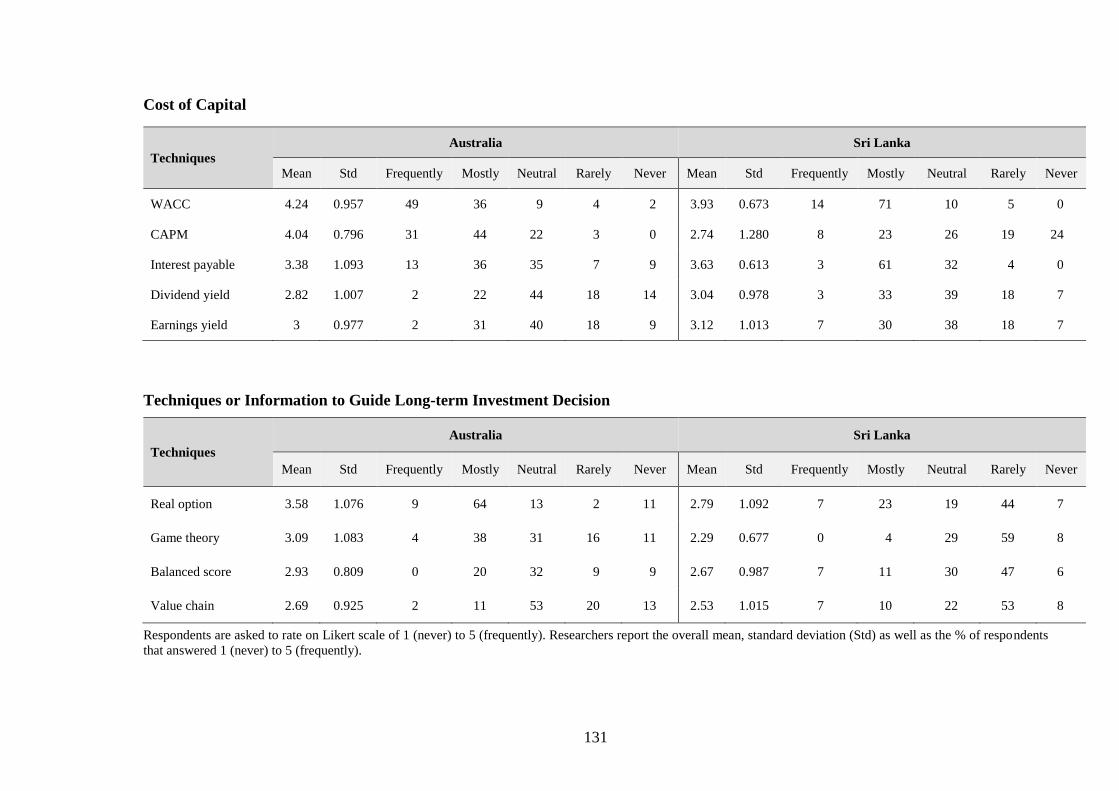
131
Cost of Capital
Techniques or Information to Guide Long-term Investment Decision
Techniques Australia Sri Lanka
Mean Std Frequently Mostly Neutral Rarely Never Mean Std Frequently Mostly Neutral Rarely Never
Real option 3.58 1.076 9 64 13 2 11 2.79 1.092 7 23 19 44 7
Game theory 3.09 1.083 4 38 31 16 11 2.29 0.677 0 4 29 59 8
Balanced score 2.93 0.809 0 20 32 9 9 2.67 0.987 7 11 30 47 6
Value chain 2.69 0.925 2 11 53 20 13 2.53 1.015 7 10 22 53 8
Respondents are asked to rate on Likert scale of 1 (never) to 5 (frequently). Researchers report the overall mean, standard deviation (Std) as well as the % of respondents
that answered 1 (never) to 5 (frequently).
Techniques Australia Sri Lanka
Mean Std Frequently Mostly Neutral Rarely Never Mean Std Frequently Mostly Neutral Rarely Never
WACC 4.24 0.957 49 36 9 4 2 3.93 0.673 14 71 10 5 0
CAPM 4.04 0.796 31 44 22 3 0 2.74 1.280 8 23 26 19 24
Interest payable 3.38 1.093 13 36 35 7 9 3.63 0.613 3 61 32 4 0
Dividend yield 2.82 1.007 2 22 44 18 14 3.04 0.978 3 33 39 18 7
Earnings yield 3 0.977 2 31 40 18 9 3.12 1.013 7 30 38 18 7
132
5.4.5 Accept/Reject Decision
In Table 5.11, 98 and 97 percent of, respectively, Australian and Sri Lankan respondents
said that the accept/reject decision…phase is very important or important. Quantitative
analysis judgment is described as being very important or important by 96 of Australian
and Sri Lankan respondents. Consistency with corporate strategy is very important or
important for 91 and 89 percent of, respectively, Australian and Sri Lankan respondents.
Improved market image for the firm is seen as very important or important by 85 percent
of Australian and Sri Lankan respondents; who also see improved competitive position as
being very important or important (85 and 76 percent of, respectively, Australian and Sri
Lankan respondents). The ability to expand in the future is ranked as very important or
important by 85 and 76 percent of, respectively, Australian and Sri Lankan respondents.
Increased market share is slightly less important (64 and 72 percent of, respectively,
Australian and Sri Lankan respondents see it as very important or important). Australian
and Sri Lankan respondents have very similar views on: Business expansion/development;
Increased saving from disposable expenses; Risk position; and Environmental factors.
Competitive advantage appears to be somewhat more important to Sri Lankan firms (it is
very important or important to 60 and 70 percent of, respectively, Australian and Sri
Lankan respondents). This last set of perceptions appears to be converse to that expressed
by Australian respondents on improved competitive position.
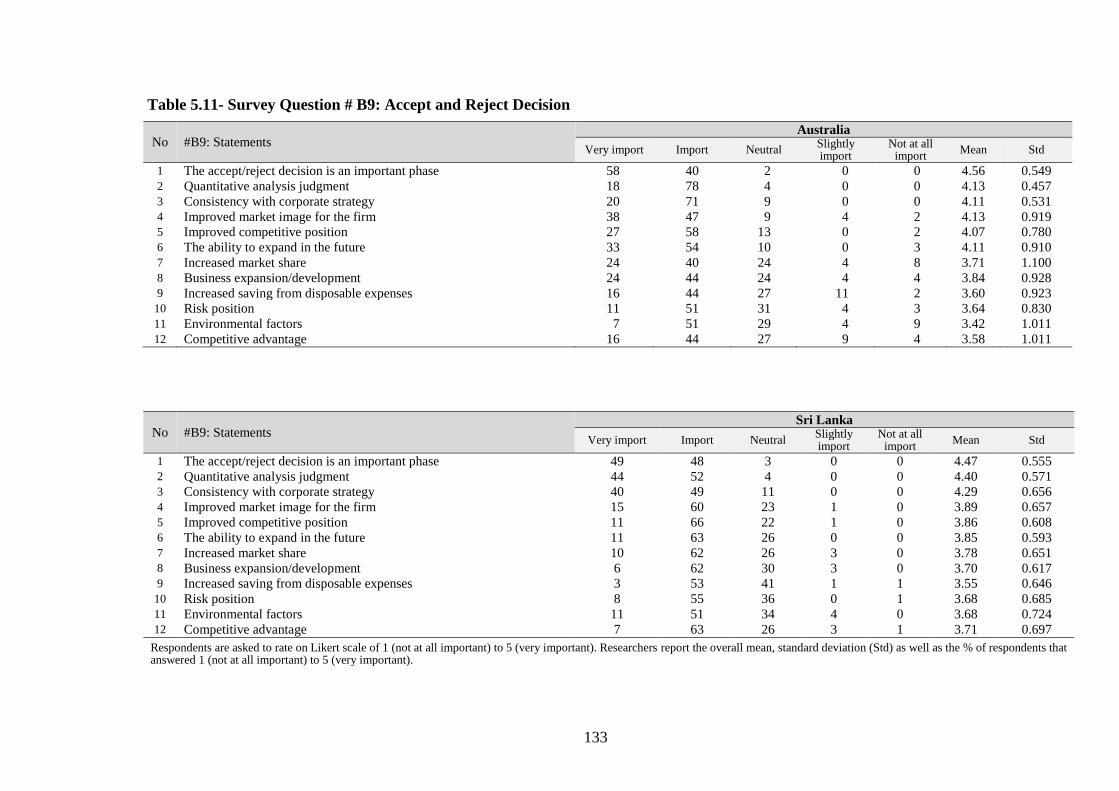
133
Table 5.11- Survey Question # B9: Accept and Reject Decision
No #B9: Statements Australia
Very import Import Neutral Slightly import
Not at all import
Mean Std
1 The accept/reject decision is an important phase 58 40 2 0 0 4.56 0.549 2 Quantitative analysis judgment 18 78 4 0 0 4.13 0.457 3 Consistency with corporate strategy 20 71 9 0 0 4.11 0.531 4 Improved market image for the firm 38 47 9 4 2 4.13 0.919 5 Improved competitive position 27 58 13 0 2 4.07 0.780 6 The ability to expand in the future 33 54 10 0 3 4.11 0.910 7 Increased market share 24 40 24 4 8 3.71 1.100 8 Business expansion/development 24 44 24 4 4 3.84 0.928 9 Increased saving from disposable expenses 16 44 27 11 2 3.60 0.923
10 Risk position 11 51 31 4 3 3.64 0.830 11 Environmental factors 7 51 29 4 9 3.42 1.011 12 Competitive advantage 16 44 27 9 4 3.58 1.011
No #B9: Statements Sri Lanka
Very import Import Neutral Slightly import
Not at all import
Mean Std
1 The accept/reject decision is an important phase 49 48 3 0 0 4.47 0.555 2 Quantitative analysis judgment 44 52 4 0 0 4.40 0.571 3 Consistency with corporate strategy 40 49 11 0 0 4.29 0.656 4 Improved market image for the firm 15 60 23 1 0 3.89 0.657 5 Improved competitive position 11 66 22 1 0 3.86 0.608 6 The ability to expand in the future 11 63 26 0 0 3.85 0.593 7 Increased market share 10 62 26 3 0 3.78 0.651 8 Business expansion/development 6 62 30 3 0 3.70 0.617 9 Increased saving from disposable expenses 3 53 41 1 1 3.55 0.646
10 Risk position 8 55 36 0 1 3.68 0.685 11 Environmental factors 11 51 34 4 0 3.68 0.724 12 Competitive advantage 7 63 26 3 1 3.71 0.697
Respondents are asked to rate on Likert scale of 1 (not at all important) to 5 (very important). Researchers report the overall mean, standard deviation (Std) as well as the % of respondents that answered 1 (not at all important) to 5 (very important).
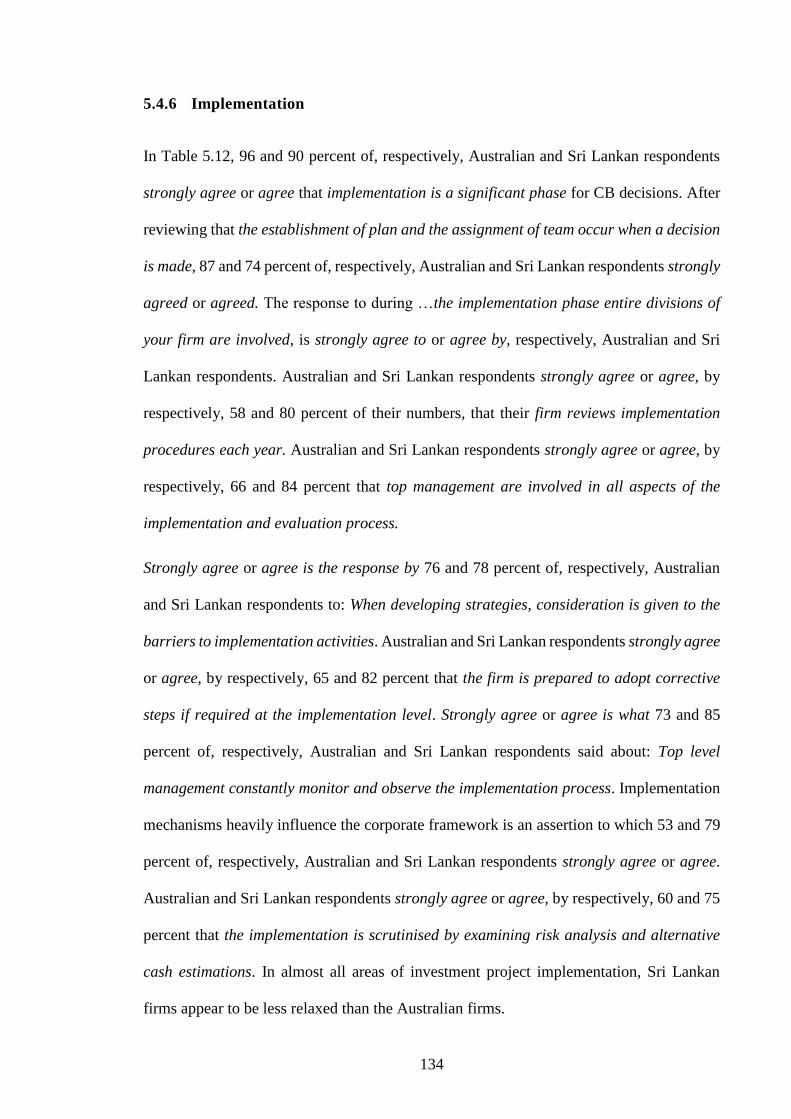
134
5.4.6 Implementation
In Table 5.12, 96 and 90 percent of, respectively, Australian and Sri Lankan respondents
strongly agree or agree that implementation is a significant phase for CB decisions. After
reviewing that the establishment of plan and the assignment of team occur when a decision
is made, 87 and 74 percent of, respectively, Australian and Sri Lankan respondents strongly
agreed or agreed. The response to during …the implementation phase entire divisions of
your firm are involved, is strongly agree to or agree by, respectively, Australian and Sri
Lankan respondents. Australian and Sri Lankan respondents strongly agree or agree, by
respectively, 58 and 80 percent of their numbers, that their firm reviews implementation
procedures each year. Australian and Sri Lankan respondents strongly agree or agree, by
respectively, 66 and 84 percent that top management are involved in all aspects of the
implementation and evaluation process.
Strongly agree or agree is the response by 76 and 78 percent of, respectively, Australian
and Sri Lankan respondents to: When developing strategies, consideration is given to the
barriers to implementation activities. Australian and Sri Lankan respondents strongly agree
or agree, by respectively, 65 and 82 percent that the firm is prepared to adopt corrective
steps if required at the implementation level. Strongly agree or agree is what 73 and 85
percent of, respectively, Australian and Sri Lankan respondents said about: Top level
management constantly monitor and observe the implementation process. Implementation
mechanisms heavily influence the corporate framework is an assertion to which 53 and 79
percent of, respectively, Australian and Sri Lankan respondents strongly agree or agree.
Australian and Sri Lankan respondents strongly agree or agree, by respectively, 60 and 75
percent that the implementation is scrutinised by examining risk analysis and alternative
cash estimations. In almost all areas of investment project implementation, Sri Lankan
firms appear to be less relaxed than the Australian firms.
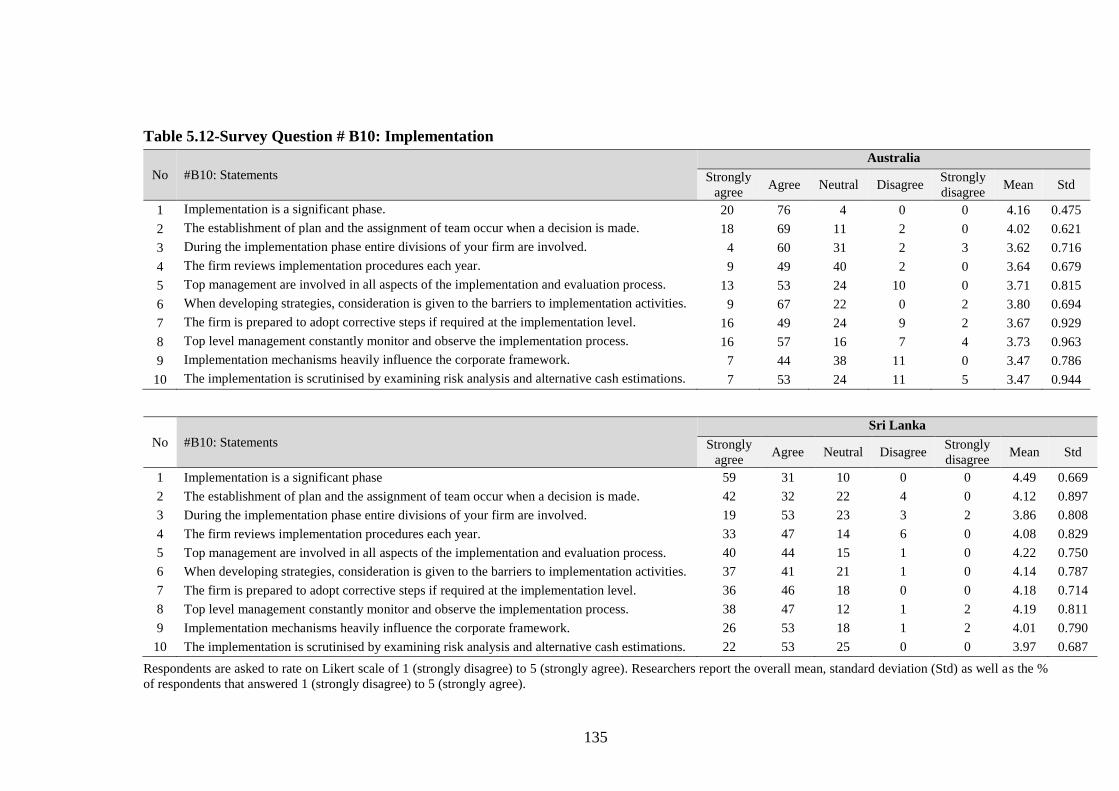
135
Table 5.12-Survey Question # B10: Implementation
Respondents are asked to rate on Likert scale of 1 (strongly disagree) to 5 (strongly agree). Researchers report the overall mean, standard deviation (Std) as well as the %
of respondents that answered 1 (strongly disagree) to 5 (strongly agree).
No #B10: Statements
Australia
Strongly
agree Agree Neutral Disagree
Strongly
disagree Mean Std
1 Implementation is a significant phase. 20 76 4 0 0 4.16 0.475
2 The establishment of plan and the assignment of team occur when a decision is made. 18 69 11 2 0 4.02 0.621
3 During the implementation phase entire divisions of your firm are involved. 4 60 31 2 3 3.62 0.716
4 The firm reviews implementation procedures each year. 9 49 40 2 0 3.64 0.679
5 Top management are involved in all aspects of the implementation and evaluation process. 13 53 24 10 0 3.71 0.815
6 When developing strategies, consideration is given to the barriers to implementation activities. 9 67 22 0 2 3.80 0.694
7 The firm is prepared to adopt corrective steps if required at the implementation level. 16 49 24 9 2 3.67 0.929
8 Top level management constantly monitor and observe the implementation process. 16 57 16 7 4 3.73 0.963
9 Implementation mechanisms heavily influence the corporate framework. 7 44 38 11 0 3.47 0.786
10 The implementation is scrutinised by examining risk analysis and alternative cash estimations. 7 53 24 11 5 3.47 0.944
No #B10: Statements
Sri Lanka
Strongly
agree Agree Neutral Disagree
Strongly
disagree Mean Std
1 Implementation is a significant phase 59 31 10 0 0 4.49 0.669
2 The establishment of plan and the assignment of team occur when a decision is made. 42 32 22 4 0 4.12 0.897
3 During the implementation phase entire divisions of your firm are involved. 19 53 23 3 2 3.86 0.808
4 The firm reviews implementation procedures each year. 33 47 14 6 0 4.08 0.829
5 Top management are involved in all aspects of the implementation and evaluation process. 40 44 15 1 0 4.22 0.750
6 When developing strategies, consideration is given to the barriers to implementation activities. 37 41 21 1 0 4.14 0.787
7 The firm is prepared to adopt corrective steps if required at the implementation level. 36 46 18 0 0 4.18 0.714
8 Top level management constantly monitor and observe the implementation process. 38 47 12 1 2 4.19 0.811
9 Implementation mechanisms heavily influence the corporate framework. 26 53 18 1 2 4.01 0.790
10 The implementation is scrutinised by examining risk analysis and alternative cash estimations. 22 53 25 0 0 3.97 0.687
136
5.4.7 Expenditure Control and Monitoring
In Table 5.13, 93 and 91 percent of, respectively, Australian and Sri Lankan respondents
strongly agree or agree that: Expenditure control is an important phase in the CB practice.
In terms of: There is constant monitoring of progress of investments with the strategic
planning of the firm, 92 and 89 percent of, respectively, Australian and Sri Lankan
respondents strongly agree or agree. Strongly agree or agree is the response by 71 and 91
percent of, respectively, Australian and Sri Lankan respondents to: Deviations from the
estimated cash flows are monitored on a regular basis. In terms of: Top management
usually support expenditure control and monitoring processes, 60 and 90 percent of,
respectively, Australian and Sri Lankan respondents strongly agree or agree. Strongly
agree or agree is the response by 60 and 89 percent of, respectively, Australian and Sri
Lankan respondents to: CFOs can receive progress reports at regular intervals concerning
the project monitoring. The response to: The firm has the ability to assess the effect of
inflation factors on financial decisions is 65 and 75 percent of, respectively, Australian and
Sri Lankan respondents strongly agree or agree. In terms of: The firm has an established
effective operational internal control system, 65 and 77 percent of, respectively, Australian
and Sri Lankan respondents strongly agree or agree. The response to: The firm updates its
monitoring procedures on a timely basis, are 60 and 82 percent of, respectively, Australian
and Sri Lankan respondents strongly agree or agree. Strongly agree or agree is the
response by 51 and 89 percent of, respectively, Australian and Sri Lankan respondents to:
The firm’s accounting system provides break-downs to enable analysis of variances.
Australian and Sri Lankan respondents strongly agree or agree by, respectively, 71 and 81
percent that: Variations in future cash flows from forecasts should be reported to top
management. In almost all areas of investment project expenditure control and monitoring,
Sri Lankan firms appear to be less relaxed than Australian firms.
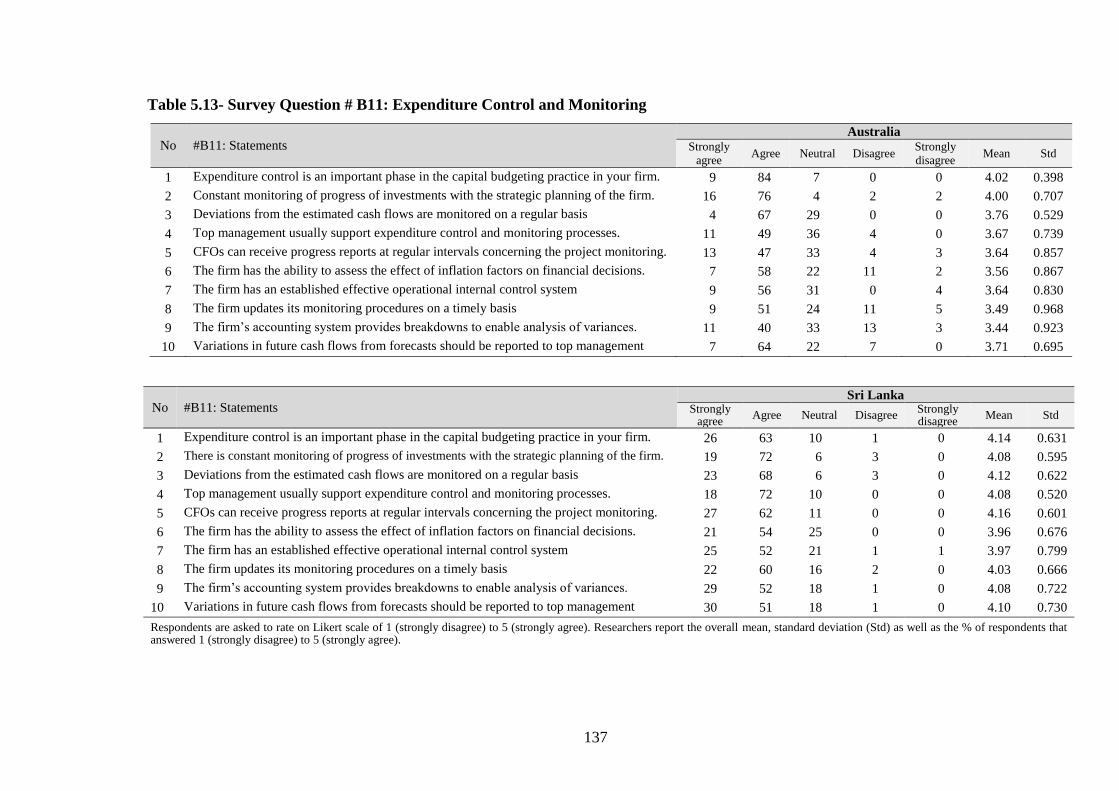
137
Table 5.13- Survey Question # B11: Expenditure Control and Monitoring
No #B11: Statements Australia
Strongly
agree Agree Neutral Disagree
Strongly
disagree Mean Std
1 Expenditure control is an important phase in the capital budgeting practice in your firm. 9 84 7 0 0 4.02 0.398
2 Constant monitoring of progress of investments with the strategic planning of the firm. 16 76 4 2 2 4.00 0.707
3 Deviations from the estimated cash flows are monitored on a regular basis 4 67 29 0 0 3.76 0.529
4 Top management usually support expenditure control and monitoring processes. 11 49 36 4 0 3.67 0.739
5 CFOs can receive progress reports at regular intervals concerning the project monitoring. 13 47 33 4 3 3.64 0.857
6 The firm has the ability to assess the effect of inflation factors on financial decisions. 7 58 22 11 2 3.56 0.867
7 The firm has an established effective operational internal control system 9 56 31 0 4 3.64 0.830
8 The firm updates its monitoring procedures on a timely basis 9 51 24 11 5 3.49 0.968
9 The firm’s accounting system provides breakdowns to enable analysis of variances. 11 40 33 13 3 3.44 0.923
10 Variations in future cash flows from forecasts should be reported to top management 7 64 22 7 0 3.71 0.695
No #B11: Statements Sri Lanka
Strongly agree
Agree Neutral Disagree Strongly disagree
Mean Std
1 Expenditure control is an important phase in the capital budgeting practice in your firm. 26 63 10 1 0 4.14 0.631
2 There is constant monitoring of progress of investments with the strategic planning of the firm. 19 72 6 3 0 4.08 0.595
3 Deviations from the estimated cash flows are monitored on a regular basis 23 68 6 3 0 4.12 0.622
4 Top management usually support expenditure control and monitoring processes. 18 72 10 0 0 4.08 0.520
5 CFOs can receive progress reports at regular intervals concerning the project monitoring. 27 62 11 0 0 4.16 0.601
6 The firm has the ability to assess the effect of inflation factors on financial decisions. 21 54 25 0 0 3.96 0.676
7 The firm has an established effective operational internal control system 25 52 21 1 1 3.97 0.799
8 The firm updates its monitoring procedures on a timely basis 22 60 16 2 0 4.03 0.666
9 The firm’s accounting system provides breakdowns to enable analysis of variances. 29 52 18 1 0 4.08 0.722
10 Variations in future cash flows from forecasts should be reported to top management 30 51 18 1 0 4.10 0.730
Respondents are asked to rate on Likert scale of 1 (strongly disagree) to 5 (strongly agree). Researchers report the overall mean, standard deviation (Std) as well as the % of respondents that answered 1 (strongly disagree) to 5 (strongly agree).
138
5.4.8 Post-audit
In Table 5.14, 96 and 89 percent of, respectively, Australian and Sri Lankan respondents
strongly agree or agree that: The post-audit is an important phase of long-term investment
decision making. The Australian and Sri Lankan respondents strongly agree or agree by 89
percent that: The auditor discusses key results with the CFO during the progress of the
review of decisions. Strongly agree or agree is the response by 67 and 85 percent of,
respectively, Australian and Sri Lankan respondents to: The firm satisfies the purpose,
scope, conduct, and results of the post completion audit. In terms of: the firm has regular
and pre-agreed procedures for the post-audit, 65 and 72 percent of, respectively, Australian
and Sri Lankan respondents strongly agree or agree. Strongly agree or agree is the
response by 67 and 84 percent of, respectively, Australian and Sri Lankan respondents to:
The results of post-audits assist to evaluate projects and to improve future forecasts. In the
survey, 71 and 82 percent of, respectively, Australian and Sri Lankan respondents strongly
agree or agree that: a post implementation audit provides useful feedback to investment
appraisal. Strongly agree or agree is the response by 57 and 81 percent of, respectively,
Australian and Sri Lankan respondents to: Audit information prompts management to
consider a thorough review of the strategic plan. In terms of: Post-audits relate to the
current long-term decisions support process of the implementation, 58 and 81 percent of,
respectively, Australian and Sri Lankan respondents strongly agree or agree. The
Australian and Sri Lankan respondents reviewed: Audits contribute to improvement of
investment decision by analysing past rights and wrongs and, respectively, 67 and 80
percent strongly agree or agree. In their review of: post-audit conclusions and opinion are
logical and well documented, 73 and 85 percent of, respectively, Australian and Sri Lankan
respondents strongly agree or agree. In almost all areas of investment project post-audits,
Sri Lankan firms appear to have more faith in their internal review process than Australian
firms.
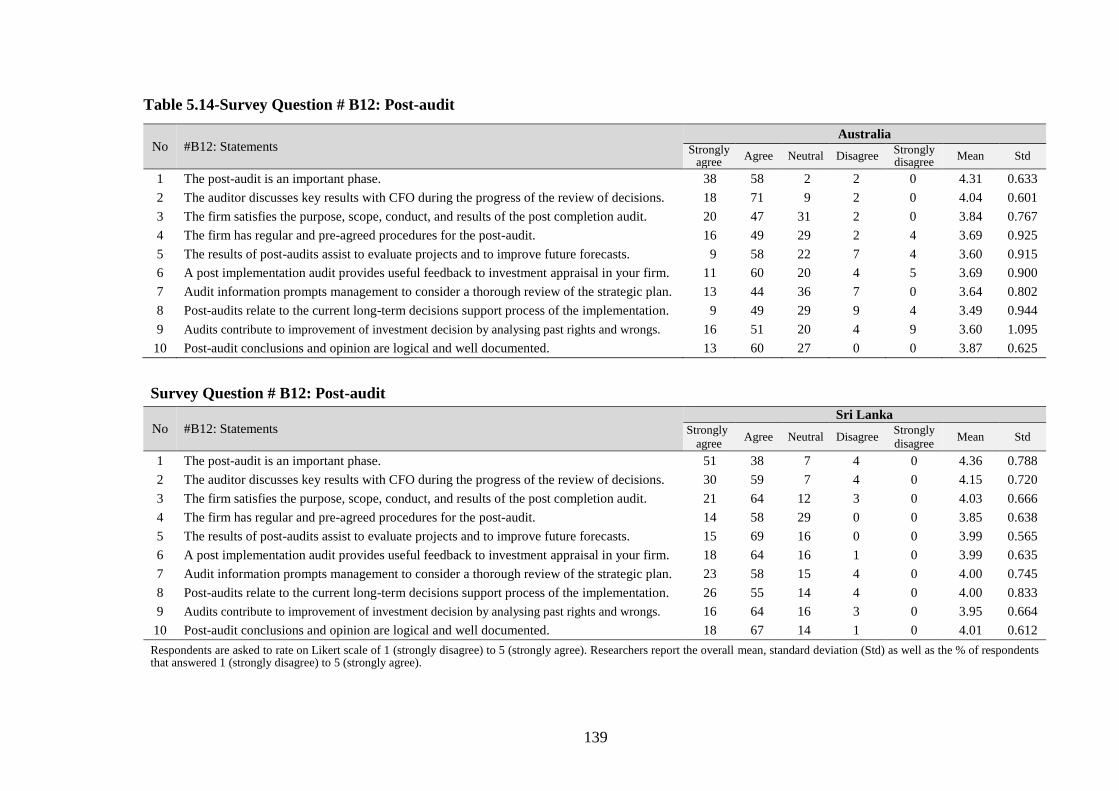
139
Table 5.14-Survey Question # B12: Post-audit
No #B12: Statements Australia
Strongly agree
Agree Neutral Disagree Strongly disagree
Mean Std
1 The post-audit is an important phase. 38 58 2 2 0 4.31 0.633
2 The auditor discusses key results with CFO during the progress of the review of decisions. 18 71 9 2 0 4.04 0.601
3 The firm satisfies the purpose, scope, conduct, and results of the post completion audit. 20 47 31 2 0 3.84 0.767
4 The firm has regular and pre-agreed procedures for the post-audit. 16 49 29 2 4 3.69 0.925
5 The results of post-audits assist to evaluate projects and to improve future forecasts. 9 58 22 7 4 3.60 0.915
6 A post implementation audit provides useful feedback to investment appraisal in your firm. 11 60 20 4 5 3.69 0.900
7 Audit information prompts management to consider a thorough review of the strategic plan. 13 44 36 7 0 3.64 0.802
8 Post-audits relate to the current long-term decisions support process of the implementation. 9 49 29 9 4 3.49 0.944
9 Audits contribute to improvement of investment decision by analysing past rights and wrongs. 16 51 20 4 9 3.60 1.095
10 Post-audit conclusions and opinion are logical and well documented. 13 60 27 0 0 3.87 0.625
Survey Question # B12: Post-audit
No #B12: Statements Sri Lanka
Strongly
agree Agree Neutral Disagree
Strongly
disagree Mean Std
1 The post-audit is an important phase. 51 38 7 4 0 4.36 0.788
2 The auditor discusses key results with CFO during the progress of the review of decisions. 30 59 7 4 0 4.15 0.720
3 The firm satisfies the purpose, scope, conduct, and results of the post completion audit. 21 64 12 3 0 4.03 0.666
4 The firm has regular and pre-agreed procedures for the post-audit. 14 58 29 0 0 3.85 0.638
5 The results of post-audits assist to evaluate projects and to improve future forecasts. 15 69 16 0 0 3.99 0.565
6 A post implementation audit provides useful feedback to investment appraisal in your firm. 18 64 16 1 0 3.99 0.635
7 Audit information prompts management to consider a thorough review of the strategic plan. 23 58 15 4 0 4.00 0.745
8 Post-audits relate to the current long-term decisions support process of the implementation. 26 55 14 4 0 4.00 0.833
9 Audits contribute to improvement of investment decision by analysing past rights and wrongs. 16 64 16 3 0 3.95 0.664
10 Post-audit conclusions and opinion are logical and well documented. 18 67 14 1 0 4.01 0.612
Respondents are asked to rate on Likert scale of 1 (strongly disagree) to 5 (strongly agree). Researchers report the overall mean, standard deviation (Std) as well as the % of respondents that answered 1 (strongly disagree) to 5 (strongly agree).
140
5.5 Cross-Classification of the Survey Results
5.5.1 Long-term Strategic Planning
The respondents of the participating firms in both countries were asked to express their
opinion on long-term strategic planning as a phase to the CB process. As shown in Table
5.15(a), respondents with a Bachelor degree in Australia mostly agree that long-term
strategic planning is an important phase in CB decisions as compared to respondents with
other degrees. While respondents with Bachelor/Honours in Sri Lanka significantly agree
with above at the 5% level, as compared to those with other degrees. An investment with an
expected return below the required level may still be accepted because of non-cash benefits
is significantly agreed to by respondents with a Masters degree in Australia. This result is
similar with those for the respondents with PhD in Sri Lanka. Table 5.15(b) shows those of
the Australian firms, the statements with regard to long-term strategic planning were
significantly agreed by middle-aged respondents (25-35 years) while all these statements
received significant mean score among adult aged Sri Lankan respondents (35-55 years).
The results in Table 5.15(c) indicate that Australian respondents (except those with over 16
years of experience) significantly agreed that long-term strategic planning for investment
is a substantial phase of CB practices, while the Sri Lankan respondents except those with
under five years of experience significantly agreed. In Australia, statements about long-
term strategic planning were significantly agreed by junior (1-5 years) and middle (6-10
years) experienced respondents while middle (6-10) and high (11-15) experienced
respondents, significantly agreed. As shown in Table 5.15(d), the significant convention
with long-term strategic planning practices is clearly visible among consumer staples and
consumer discretionary sectors in Australia while a comparable result observed among
utilities, industrial, material, consumer staples, health care and consumer discretionary
sectors in Sri Lanka. Table 5.16(e) shows that firms with 100-250 employees are
141
significantly more likely to agree on long-term strategic planning as a practice of CB
process. All long-term strategic planning practices excluding long term investment
decisions are influenced by negotiations among associations and are wieldy agreed by
firms that have 250-500 employees in Sri Lanka. In Australia, only a few long-term
strategic planning practices including an investment whose expected return falls below the
required level may still be accepted for intentional reasons, long-term investment decisions
are influenced by negotiations among associations, a long-term investment will be accepted
if its expected return meets the minimum requirements of return on investment and
maximising the profit is the long-term goal are preferred significantly by firms which have
more than 500 employees. Table 5.15 (f) indicates that Australian and Sri Lankan firms
with 40-80 percent of their revenues from their domestic market are more likely to agree
with long-term strategic planning as a substantial phase. Whereas, long-term investment
decisions derive from an explicit corporate strategy are most favoured by Australian firms
except domestic-sales focused firms (>80). Table 5.15(g) illustrates, domestic-owned firms
from Australia and Sri Lanka are more motivated to consent to the long-term strategic
planning practices. Table 5.15(h) shows that there seems to be quite some differences with
respect to agreeing with long-term strategic planning as a significant phase between
moderate risk firms and other firms in both countries.
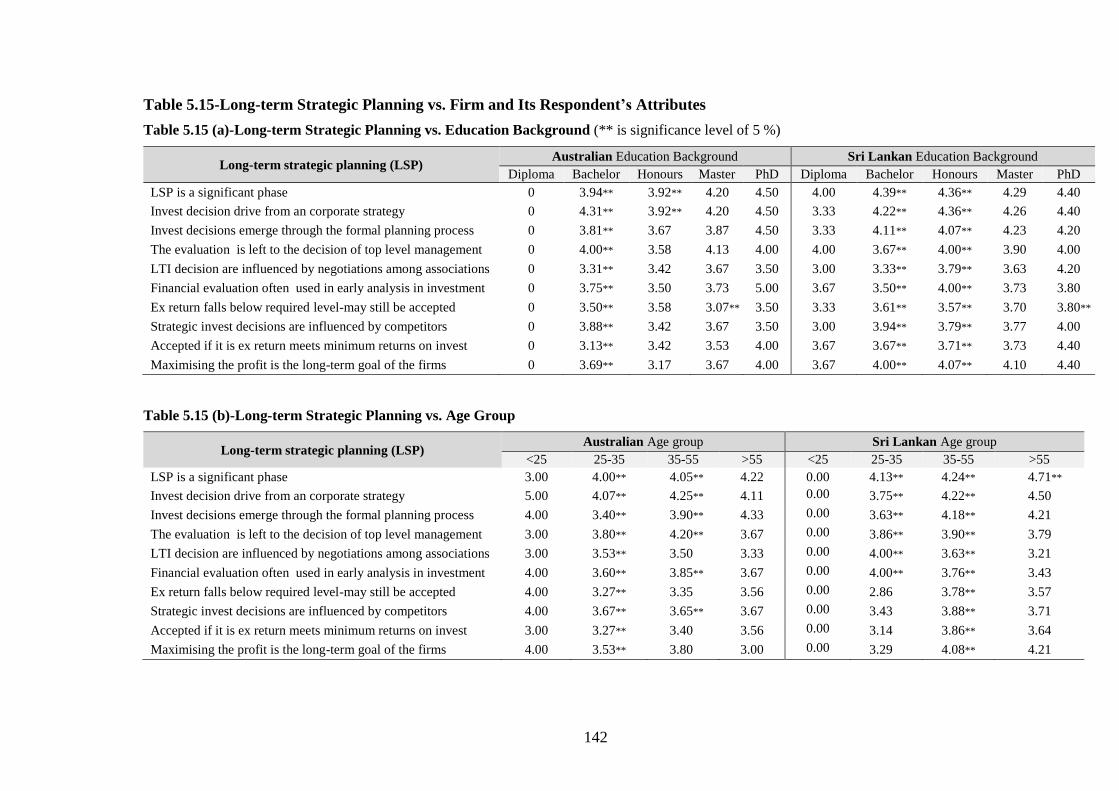
142
Table 5.15-Long-term Strategic Planning vs. Firm and Its Respondent’s Attributes
Table 5.15 (a)-Long-term Strategic Planning vs. Education Background (** is significance level of 5 %)
Long-term strategic planning (LSP) Australian Education Background Sri Lankan Education Background
Diploma Bachelor Honours Master PhD Diploma Bachelor Honours Master PhD
LSP is a significant phase 0 3.94** 3.92** 4.20 4.50 4.00 4.39** 4.36** 4.29 4.40
Invest decision drive from an corporate strategy 0 4.31** 3.92** 4.20 4.50 3.33 4.22** 4.36** 4.26 4.40
Invest decisions emerge through the formal planning process 0 3.81** 3.67 3.87 4.50 3.33 4.11** 4.07** 4.23 4.20
The evaluation is left to the decision of top level management 0 4.00** 3.58 4.13 4.00 4.00 3.67** 4.00** 3.90 4.00
LTI decision are influenced by negotiations among associations 0 3.31** 3.42 3.67 3.50 3.00 3.33** 3.79** 3.63 4.20
Financial evaluation often used in early analysis in investment 0 3.75** 3.50 3.73 5.00 3.67 3.50** 4.00** 3.73 3.80
Ex return falls below required level-may still be accepted 0 3.50** 3.58 3.07** 3.50 3.33 3.61** 3.57** 3.70 3.80**
Strategic invest decisions are influenced by competitors 0 3.88** 3.42 3.67 3.50 3.00 3.94** 3.79** 3.77 4.00
Accepted if it is ex return meets minimum returns on invest 0 3.13** 3.42 3.53 4.00 3.67 3.67** 3.71** 3.73 4.40
Maximising the profit is the long-term goal of the firms 0 3.69** 3.17 3.67 4.00 3.67 4.00** 4.07** 4.10 4.40
Table 5.15 (b)-Long-term Strategic Planning vs. Age Group
Long-term strategic planning (LSP) Australian Age group Sri Lankan Age group
<25 25-35 35-55 >55 <25 25-35 35-55 >55
LSP is a significant phase 3.00 4.00** 4.05** 4.22 0.00 4.13** 4.24** 4.71**
Invest decision drive from an corporate strategy 5.00 4.07** 4.25** 4.11 0.00 3.75** 4.22** 4.50
Invest decisions emerge through the formal planning process 4.00 3.40** 3.90** 4.33 0.00 3.63** 4.18** 4.21
The evaluation is left to the decision of top level management 3.00 3.80** 4.20** 3.67 0.00 3.86** 3.90** 3.79
LTI decision are influenced by negotiations among associations 3.00 3.53** 3.50 3.33 0.00 4.00** 3.63** 3.21
Financial evaluation often used in early analysis in investment 4.00 3.60** 3.85** 3.67 0.00 4.00** 3.76** 3.43
Ex return falls below required level-may still be accepted 4.00 3.27** 3.35 3.56 0.00 2.86 3.78** 3.57
Strategic invest decisions are influenced by competitors 4.00 3.67** 3.65** 3.67 0.00 3.43 3.88** 3.71
Accepted if it is ex return meets minimum returns on invest 3.00 3.27** 3.40 3.56 0.00 3.14 3.86** 3.64
Maximising the profit is the long-term goal of the firms 4.00 3.53** 3.80 3.00 0.00 3.29 4.08** 4.21
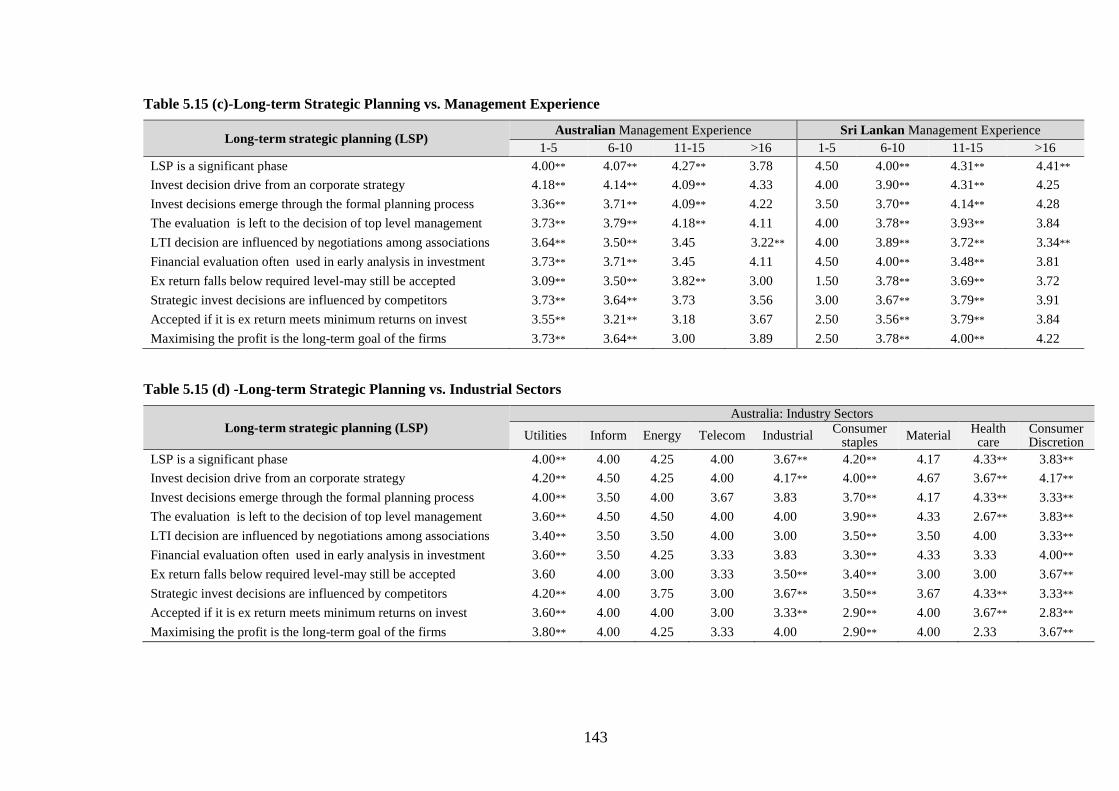
143
Table 5.15 (c)-Long-term Strategic Planning vs. Management Experience
Long-term strategic planning (LSP) Australian Management Experience Sri Lankan Management Experience
1-5 6-10 11-15 >16 1-5 6-10 11-15 >16
LSP is a significant phase 4.00** 4.07** 4.27** 3.78 4.50 4.00** 4.31** 4.41**
Invest decision drive from an corporate strategy 4.18** 4.14** 4.09** 4.33 4.00 3.90** 4.31** 4.25
Invest decisions emerge through the formal planning process 3.36** 3.71** 4.09** 4.22 3.50 3.70** 4.14** 4.28
The evaluation is left to the decision of top level management 3.73** 3.79** 4.18** 4.11 4.00 3.78** 3.93** 3.84
LTI decision are influenced by negotiations among associations 3.64** 3.50** 3.45 3.22** 4.00 3.89** 3.72** 3.34**
Financial evaluation often used in early analysis in investment 3.73** 3.71** 3.45 4.11 4.50 4.00** 3.48** 3.81
Ex return falls below required level-may still be accepted 3.09** 3.50** 3.82** 3.00 1.50 3.78** 3.69** 3.72
Strategic invest decisions are influenced by competitors 3.73** 3.64** 3.73 3.56 3.00 3.67** 3.79** 3.91
Accepted if it is ex return meets minimum returns on invest 3.55** 3.21** 3.18 3.67 2.50 3.56** 3.79** 3.84
Maximising the profit is the long-term goal of the firms 3.73** 3.64** 3.00 3.89 2.50 3.78** 4.00** 4.22
Table 5.15 (d) -Long-term Strategic Planning vs. Industrial Sectors
Long-term strategic planning (LSP) Australia: Industry Sectors
Utilities Inform Energy Telecom Industrial Consumer
staples Material
Health care
Consumer Discretion
LSP is a significant phase 4.00** 4.00 4.25 4.00 3.67** 4.20** 4.17 4.33** 3.83**
Invest decision drive from an corporate strategy 4.20** 4.50 4.25 4.00 4.17** 4.00** 4.67 3.67** 4.17**
Invest decisions emerge through the formal planning process 4.00** 3.50 4.00 3.67 3.83 3.70** 4.17 4.33** 3.33**
The evaluation is left to the decision of top level management 3.60** 4.50 4.50 4.00 4.00 3.90** 4.33 2.67** 3.83**
LTI decision are influenced by negotiations among associations 3.40** 3.50 3.50 4.00 3.00 3.50** 3.50 4.00 3.33**
Financial evaluation often used in early analysis in investment 3.60** 3.50 4.25 3.33 3.83 3.30** 4.33 3.33 4.00**
Ex return falls below required level-may still be accepted 3.60 4.00 3.00 3.33 3.50** 3.40** 3.00 3.00 3.67**
Strategic invest decisions are influenced by competitors 4.20** 4.00 3.75 3.00 3.67** 3.50** 3.67 4.33** 3.33**
Accepted if it is ex return meets minimum returns on invest 3.60** 4.00 4.00 3.00 3.33** 2.90** 4.00 3.67** 2.83**
Maximising the profit is the long-term goal of the firms 3.80** 4.00 4.25 3.33 4.00 2.90** 4.00 2.33 3.67**
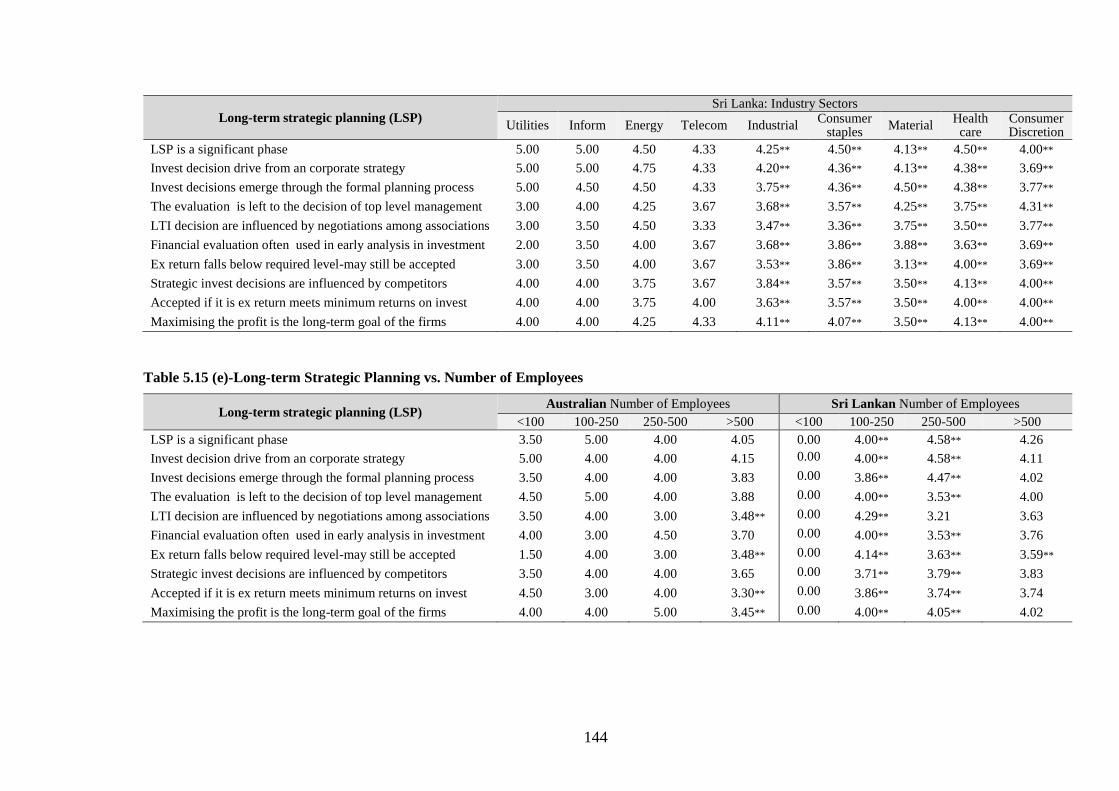
144
Long-term strategic planning (LSP) Sri Lanka: Industry Sectors
Utilities Inform Energy Telecom Industrial Consumer
staples Material
Health care
Consumer Discretion
LSP is a significant phase 5.00 5.00 4.50 4.33 4.25** 4.50** 4.13** 4.50** 4.00**
Invest decision drive from an corporate strategy 5.00 5.00 4.75 4.33 4.20** 4.36** 4.13** 4.38** 3.69**
Invest decisions emerge through the formal planning process 5.00 4.50 4.50 4.33 3.75** 4.36** 4.50** 4.38** 3.77**
The evaluation is left to the decision of top level management 3.00 4.00 4.25 3.67 3.68** 3.57** 4.25** 3.75** 4.31**
LTI decision are influenced by negotiations among associations 3.00 3.50 4.50 3.33 3.47** 3.36** 3.75** 3.50** 3.77**
Financial evaluation often used in early analysis in investment 2.00 3.50 4.00 3.67 3.68** 3.86** 3.88** 3.63** 3.69**
Ex return falls below required level-may still be accepted 3.00 3.50 4.00 3.67 3.53** 3.86** 3.13** 4.00** 3.69**
Strategic invest decisions are influenced by competitors 4.00 4.00 3.75 3.67 3.84** 3.57** 3.50** 4.13** 4.00**
Accepted if it is ex return meets minimum returns on invest 4.00 4.00 3.75 4.00 3.63** 3.57** 3.50** 4.00** 4.00**
Maximising the profit is the long-term goal of the firms 4.00 4.00 4.25 4.33 4.11** 4.07** 3.50** 4.13** 4.00**
Table 5.15 (e)-Long-term Strategic Planning vs. Number of Employees
Long-term strategic planning (LSP) Australian Number of Employees Sri Lankan Number of Employees
<100 100-250 250-500 >500 <100 100-250 250-500 >500
LSP is a significant phase 3.50 5.00 4.00 4.05 0.00 4.00** 4.58** 4.26
Invest decision drive from an corporate strategy 5.00 4.00 4.00 4.15 0.00 4.00** 4.58** 4.11
Invest decisions emerge through the formal planning process 3.50 4.00 4.00 3.83 0.00 3.86** 4.47** 4.02
The evaluation is left to the decision of top level management 4.50 5.00 4.00 3.88 0.00 4.00** 3.53** 4.00
LTI decision are influenced by negotiations among associations 3.50 4.00 3.00 3.48** 0.00 4.29** 3.21 3.63
Financial evaluation often used in early analysis in investment 4.00 3.00 4.50 3.70 0.00 4.00** 3.53** 3.76
Ex return falls below required level-may still be accepted 1.50 4.00 3.00 3.48** 0.00 4.14** 3.63** 3.59**
Strategic invest decisions are influenced by competitors 3.50 4.00 4.00 3.65 0.00 3.71** 3.79** 3.83
Accepted if it is ex return meets minimum returns on invest 4.50 3.00 4.00 3.30** 0.00 3.86** 3.74** 3.74
Maximising the profit is the long-term goal of the firms 4.00 4.00 5.00 3.45** 0.00 4.00** 4.05** 4.02
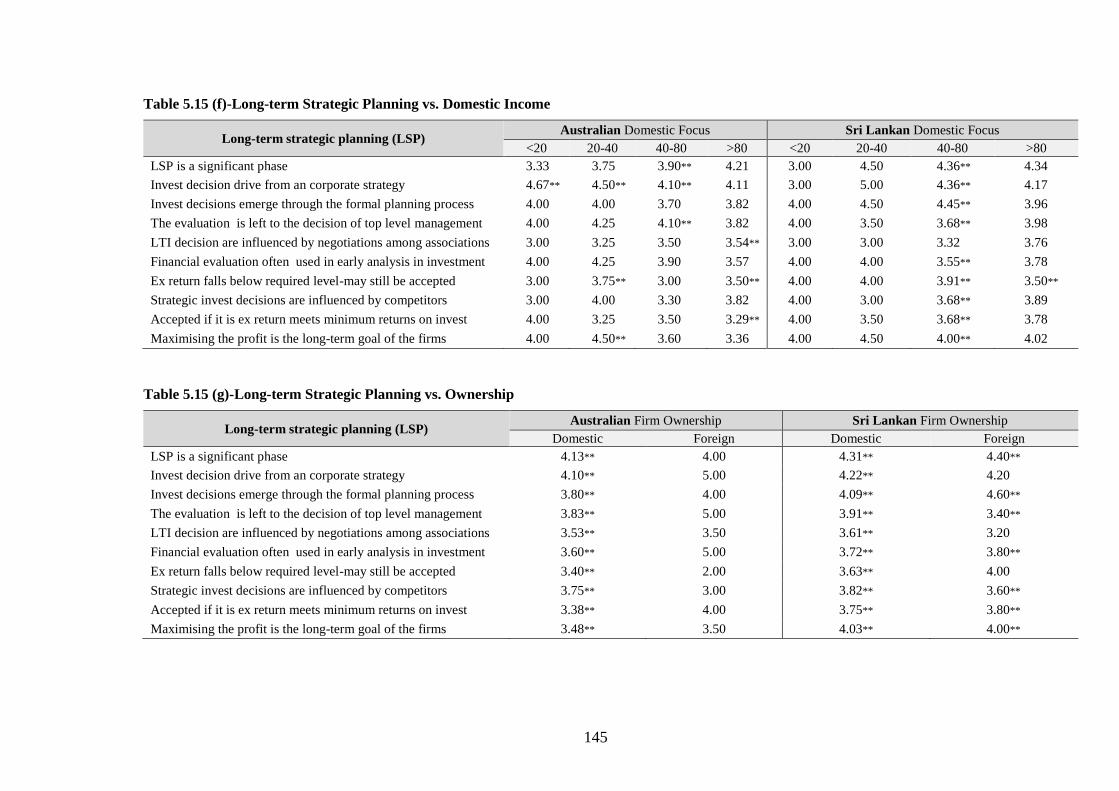
145
Table 5.15 (f)-Long-term Strategic Planning vs. Domestic Income
Long-term strategic planning (LSP) Australian Domestic Focus Sri Lankan Domestic Focus
<20 20-40 40-80 >80 <20 20-40 40-80 >80
LSP is a significant phase 3.33 3.75 3.90** 4.21 3.00 4.50 4.36** 4.34
Invest decision drive from an corporate strategy 4.67** 4.50** 4.10** 4.11 3.00 5.00 4.36** 4.17
Invest decisions emerge through the formal planning process 4.00 4.00 3.70 3.82 4.00 4.50 4.45** 3.96
The evaluation is left to the decision of top level management 4.00 4.25 4.10** 3.82 4.00 3.50 3.68** 3.98
LTI decision are influenced by negotiations among associations 3.00 3.25 3.50 3.54** 3.00 3.00 3.32 3.76
Financial evaluation often used in early analysis in investment 4.00 4.25 3.90 3.57 4.00 4.00 3.55** 3.78
Ex return falls below required level-may still be accepted 3.00 3.75** 3.00 3.50** 4.00 4.00 3.91** 3.50**
Strategic invest decisions are influenced by competitors 3.00 4.00 3.30 3.82 4.00 3.00 3.68** 3.89
Accepted if it is ex return meets minimum returns on invest 4.00 3.25 3.50 3.29** 4.00 3.50 3.68** 3.78
Maximising the profit is the long-term goal of the firms 4.00 4.50** 3.60 3.36 4.00 4.50 4.00** 4.02
Table 5.15 (g)-Long-term Strategic Planning vs. Ownership
Long-term strategic planning (LSP) Australian Firm Ownership Sri Lankan Firm Ownership
Domestic Foreign Domestic Foreign
LSP is a significant phase 4.13** 4.00 4.31** 4.40**
Invest decision drive from an corporate strategy 4.10** 5.00 4.22** 4.20
Invest decisions emerge through the formal planning process 3.80** 4.00 4.09** 4.60**
The evaluation is left to the decision of top level management 3.83** 5.00 3.91** 3.40**
LTI decision are influenced by negotiations among associations 3.53** 3.50 3.61** 3.20
Financial evaluation often used in early analysis in investment 3.60** 5.00 3.72** 3.80**
Ex return falls below required level-may still be accepted 3.40** 2.00 3.63** 4.00
Strategic invest decisions are influenced by competitors 3.75** 3.00 3.82** 3.60**
Accepted if it is ex return meets minimum returns on invest 3.38** 4.00 3.75** 3.80**
Maximising the profit is the long-term goal of the firms 3.48** 3.50 4.03** 4.00**
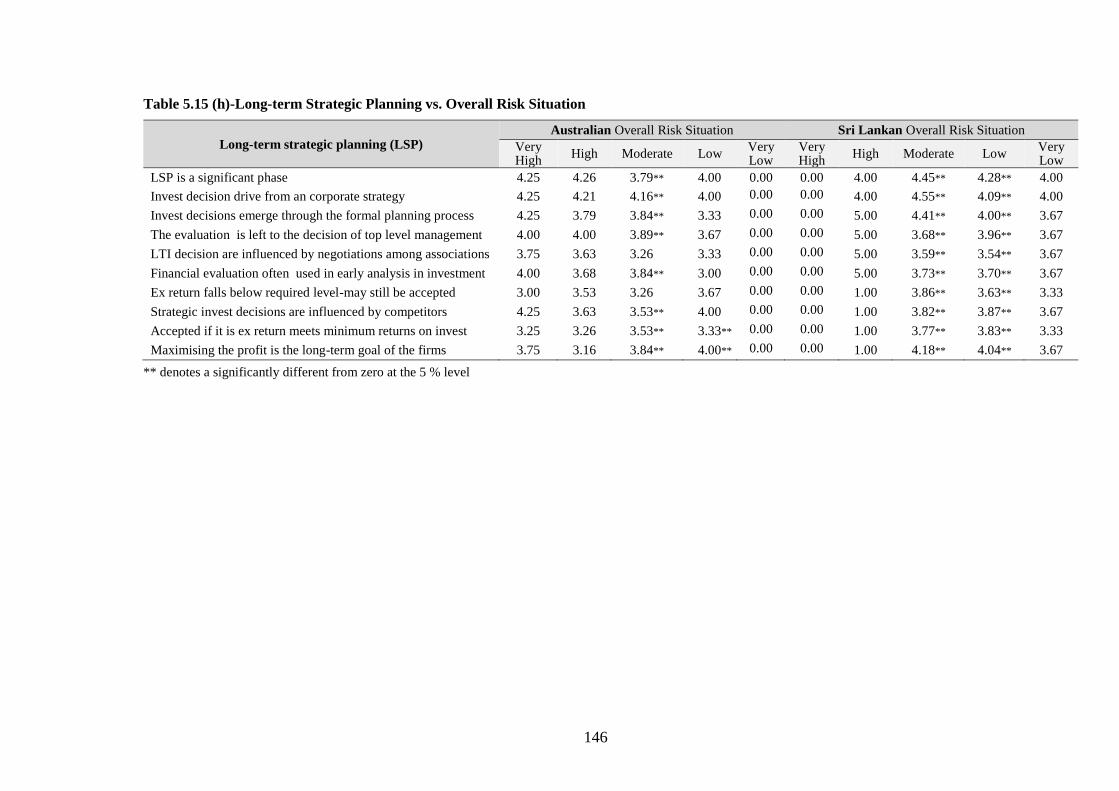
146
Table 5.15 (h)-Long-term Strategic Planning vs. Overall Risk Situation
Long-term strategic planning (LSP) Australian Overall Risk Situation Sri Lankan Overall Risk Situation
Very High
High Moderate Low Very Low
Very High
High Moderate Low Very Low
LSP is a significant phase 4.25 4.26 3.79** 4.00 0.00 0.00 4.00 4.45** 4.28** 4.00
Invest decision drive from an corporate strategy 4.25 4.21 4.16** 4.00 0.00 0.00 4.00 4.55** 4.09** 4.00
Invest decisions emerge through the formal planning process 4.25 3.79 3.84** 3.33 0.00 0.00 5.00 4.41** 4.00** 3.67
The evaluation is left to the decision of top level management 4.00 4.00 3.89** 3.67 0.00 0.00 5.00 3.68** 3.96** 3.67
LTI decision are influenced by negotiations among associations 3.75 3.63 3.26 3.33 0.00 0.00 5.00 3.59** 3.54** 3.67
Financial evaluation often used in early analysis in investment 4.00 3.68 3.84** 3.00 0.00 0.00 5.00 3.73** 3.70** 3.67
Ex return falls below required level-may still be accepted 3.00 3.53 3.26 3.67 0.00 0.00 1.00 3.86** 3.63** 3.33
Strategic invest decisions are influenced by competitors 4.25 3.63 3.53** 4.00 0.00 0.00 1.00 3.82** 3.87** 3.67
Accepted if it is ex return meets minimum returns on invest 3.25 3.26 3.53** 3.33** 0.00 0.00 1.00 3.77** 3.83** 3.33
Maximising the profit is the long-term goal of the firms 3.75 3.16 3.84** 4.00** 0.00 0.00 1.00 4.18** 4.04** 3.67
** denotes a significantly different from zero at the 5 % level
147
5.5.2 Search for Investment Opportunities
This section delivers an analysis of respondent insights on practices with respect to the
search for investment opportunities in Australia and Sri Lanka. As shown in Table 5.16(a),
the search for investment opportunities as a phase is more likely to be seen as important
by respondents with Bachelor or Honours degree in Australia and Sri Lanka—the, search
for investment opportunities’ statements is seen as being more important by respondents
with a Bachelor degree over respondents with other degree in Australia. For Sri Lankan
firms, all practices with regard to search for investment opportunities except for a profitable
investment is not just born; someone has to suggest it were significantly agreed by
respondents with bachelor degree. The firm has research and development department
constantly searching and researching into attractive investments and opportunities that
tend to agree more by respondents without diploma in Sri Lanka—this result is consistent
with that of respondents with a Bachelor or Honours degree in Australia. Table 5.16(b)
also shows that the search for investment opportunities as a phase is being applied mostly
by young adult (25-35) or middle-aged (35-55) respondents in Australia, and is also true
for over 25 years of age respondents in Sri Lanka. These practices received significantly
higher mean scores among middle aged (25-35) respondents in Australia. These practices,
except for firm has research and development divisions constantly searching and
researching into attractive investment opportunities, are favoured by middle-age (25-35)
respondents in Sri Lanka. The search for investment opportunities is a significant phase in
the CB practices was most favoured by respondents with over 16 years of experience in
Australia and over six years’ experience in Sri Lanka. Table 5.16 (c) indicates that
respondents in Australia, with 1-10 years of experience, agreed significantly with all
practices of search for investment opportunities, as compared to other respondents—this is
true for those in Sri Lanka who have over 10 years of experience. Table 5.16(d) shows that,
148
in Australia, firms in utilities, consumer staples, health care, and consumer discretionary
markets are more likely to agree with the need to search for investment opportunities. In
Sri Lanka, firms in industrial, consumer staples, material, health care and consumer
discretionary markets tended to agree with the need to search for investment opportunities.
Table 5.16 (e) notes that firms in Australia with over 500 employees, mostly agree with all
the practices for search for investment opportunities; except the firm has research and
development divisions constantly searching and researching into attractive investment
opportunities. Conversely small firms (100-250 employees) in Sri Lanka are more likely to
agree to all of these practices; except search for investment opportunities is a significant
phase. In addition Table 5.16(f) shows that respondents from firms with domestic income
focus of under 20 or 40-80 percent, are significantly more likely to agree with the search
for investment opportunities as a significant phase to CB practices. Sri Lankan firms with
a domestic income focus of 40-80 percent are more likely to agree to the need to search for
investment opportunities. As shown in Table 5.16(g), respondents in domestic-owned firms
in Australia and Sri Lanka mostly agree with all the practices for search for investment
opportunities, as compared to respondents from foreign-owned firms. Table 5.16 (h)
reports that firms in Australia with moderate risk levels mostly agree with search of
investment opportunities as a significant phase, as compared to the other firms. While Sri
Lankan firms with moderate and lower risk levels mostly agree with search of investment
opportunities as a significant phase, as compared to the other firms.
.
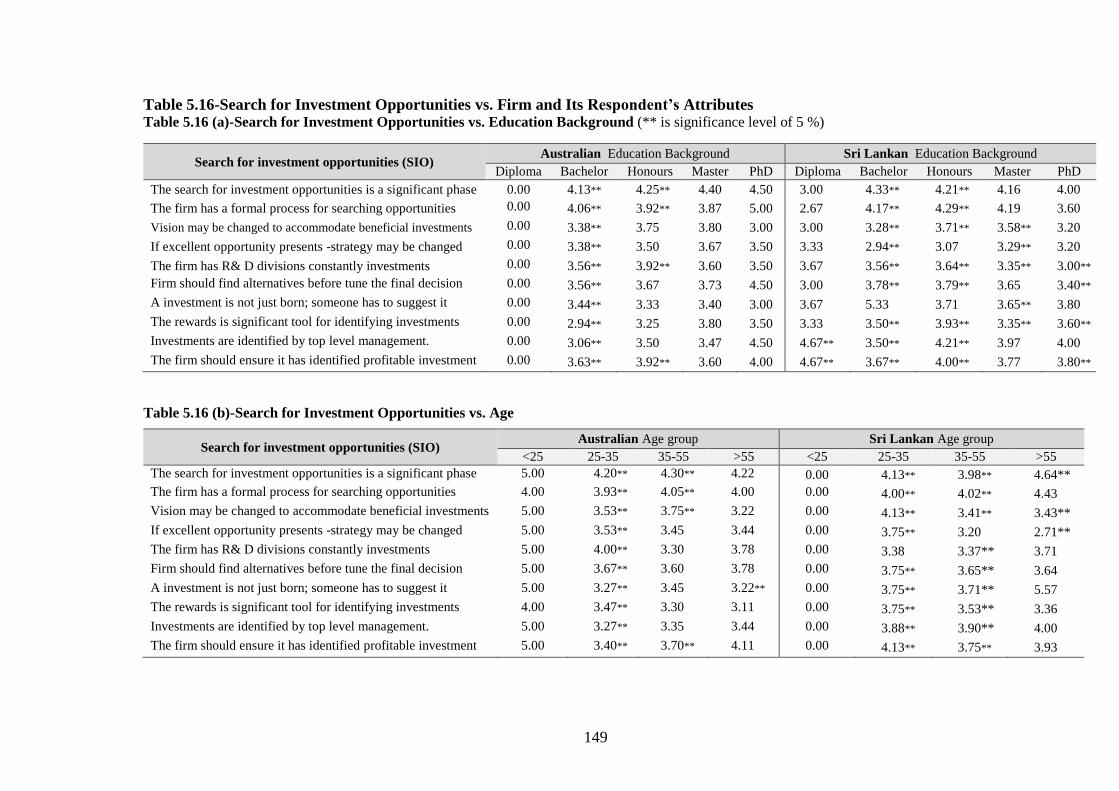
149
Table 5.16-Search for Investment Opportunities vs. Firm and Its Respondent’s Attributes Table 5.16 (a)-Search for Investment Opportunities vs. Education Background (** is significance level of 5 %)
Table 5.16 (b)-Search for Investment Opportunities vs. Age
Search for investment opportunities (SIO) Australian Age group Sri Lankan Age group
<25 25-35 35-55 >55 <25 25-35 35-55 >55
The search for investment opportunities is a significant phase 5.00 4.20** 4.30** 4.22 0.00 4.13** 3.98** 4.64**
The firm has a formal process for searching opportunities 4.00 3.93** 4.05** 4.00 0.00 4.00** 4.02** 4.43
Vision may be changed to accommodate beneficial investments 5.00 3.53** 3.75** 3.22 0.00 4.13** 3.41** 3.43**
If excellent opportunity presents -strategy may be changed 5.00 3.53** 3.45 3.44 0.00 3.75** 3.20 2.71**
The firm has R& D divisions constantly investments 5.00 4.00** 3.30 3.78 0.00 3.38 3.37** 3.71
Firm should find alternatives before tune the final decision 5.00 3.67** 3.60 3.78 0.00 3.75** 3.65** 3.64
A investment is not just born; someone has to suggest it 5.00 3.27** 3.45 3.22** 0.00 3.75** 3.71** 5.57
The rewards is significant tool for identifying investments 4.00 3.47** 3.30 3.11 0.00 3.75** 3.53** 3.36
Investments are identified by top level management. 5.00 3.27** 3.35 3.44 0.00 3.88** 3.90** 4.00
The firm should ensure it has identified profitable investment 5.00 3.40** 3.70** 4.11 0.00 4.13** 3.75** 3.93
Search for investment opportunities (SIO) Australian Education Background Sri Lankan Education Background
Diploma Bachelor Honours Master PhD Diploma Bachelor Honours Master PhD
The search for investment opportunities is a significant phase 0.00 4.13** 4.25** 4.40 4.50 3.00 4.33** 4.21** 4.16 4.00
The firm has a formal process for searching opportunities 0.00 4.06** 3.92** 3.87 5.00 2.67 4.17** 4.29** 4.19 3.60
Vision may be changed to accommodate beneficial investments 0.00 3.38** 3.75 3.80 3.00 3.00 3.28** 3.71** 3.58** 3.20
If excellent opportunity presents -strategy may be changed 0.00 3.38** 3.50 3.67 3.50 3.33 2.94** 3.07 3.29** 3.20
The firm has R& D divisions constantly investments 0.00 3.56** 3.92** 3.60 3.50 3.67 3.56** 3.64** 3.35** 3.00**
Firm should find alternatives before tune the final decision 0.00 3.56** 3.67 3.73 4.50 3.00 3.78** 3.79** 3.65 3.40**
A investment is not just born; someone has to suggest it 0.00 3.44** 3.33 3.40 3.00 3.67 5.33 3.71 3.65** 3.80
The rewards is significant tool for identifying investments 0.00 2.94** 3.25 3.80 3.50 3.33 3.50** 3.93** 3.35** 3.60**
Investments are identified by top level management. 0.00 3.06** 3.50 3.47 4.50 4.67** 3.50** 4.21** 3.97 4.00
The firm should ensure it has identified profitable investment 0.00 3.63** 3.92** 3.60 4.00 4.67** 3.67** 4.00** 3.77 3.80**
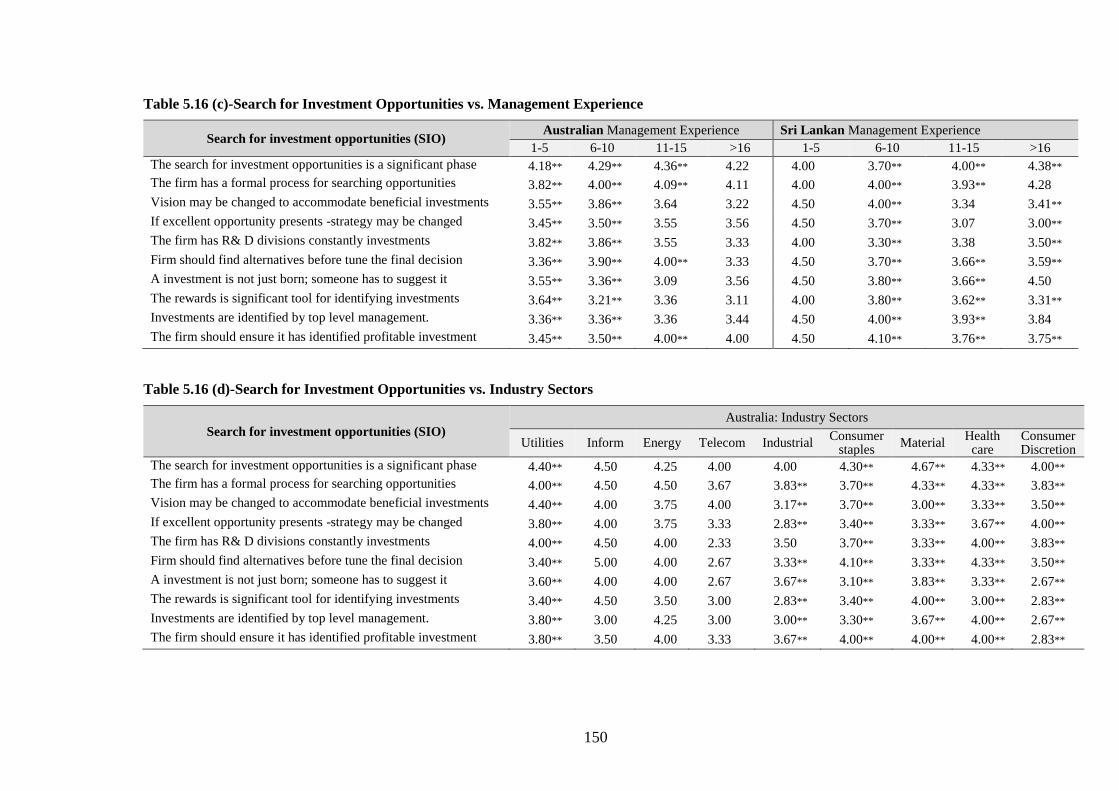
150
Table 5.16 (c)-Search for Investment Opportunities vs. Management Experience
Search for investment opportunities (SIO) Australian Management Experience Sri Lankan Management Experience
1-5 6-10 11-15 >16 1-5 6-10 11-15 >16
The search for investment opportunities is a significant phase 4.18** 4.29** 4.36** 4.22 4.00 3.70** 4.00** 4.38**
The firm has a formal process for searching opportunities 3.82** 4.00** 4.09** 4.11 4.00 4.00** 3.93** 4.28
Vision may be changed to accommodate beneficial investments 3.55** 3.86** 3.64 3.22 4.50 4.00** 3.34 3.41**
If excellent opportunity presents -strategy may be changed 3.45** 3.50** 3.55 3.56 4.50 3.70** 3.07 3.00**
The firm has R& D divisions constantly investments 3.82** 3.86** 3.55 3.33 4.00 3.30** 3.38 3.50**
Firm should find alternatives before tune the final decision 3.36** 3.90** 4.00** 3.33 4.50 3.70** 3.66** 3.59**
A investment is not just born; someone has to suggest it 3.55** 3.36** 3.09 3.56 4.50 3.80** 3.66** 4.50
The rewards is significant tool for identifying investments 3.64** 3.21** 3.36 3.11 4.00 3.80** 3.62** 3.31**
Investments are identified by top level management. 3.36** 3.36** 3.36 3.44 4.50 4.00** 3.93** 3.84
The firm should ensure it has identified profitable investment 3.45** 3.50** 4.00** 4.00 4.50 4.10** 3.76** 3.75**
Table 5.16 (d)-Search for Investment Opportunities vs. Industry Sectors
Search for investment opportunities (SIO) Australia: Industry Sectors
Utilities Inform Energy Telecom Industrial Consumer
staples Material
Health care
Consumer Discretion
The search for investment opportunities is a significant phase 4.40** 4.50 4.25 4.00 4.00 4.30** 4.67** 4.33** 4.00**
The firm has a formal process for searching opportunities 4.00** 4.50 4.50 3.67 3.83** 3.70** 4.33** 4.33** 3.83**
Vision may be changed to accommodate beneficial investments 4.40** 4.00 3.75 4.00 3.17** 3.70** 3.00** 3.33** 3.50**
If excellent opportunity presents -strategy may be changed 3.80** 4.00 3.75 3.33 2.83** 3.40** 3.33** 3.67** 4.00**
The firm has R& D divisions constantly investments 4.00** 4.50 4.00 2.33 3.50 3.70** 3.33** 4.00** 3.83**
Firm should find alternatives before tune the final decision 3.40** 5.00 4.00 2.67 3.33** 4.10** 3.33** 4.33** 3.50**
A investment is not just born; someone has to suggest it 3.60** 4.00 4.00 2.67 3.67** 3.10** 3.83** 3.33** 2.67**
The rewards is significant tool for identifying investments 3.40** 4.50 3.50 3.00 2.83** 3.40** 4.00** 3.00** 2.83**
Investments are identified by top level management. 3.80** 3.00 4.25 3.00 3.00** 3.30** 3.67** 4.00** 2.67**
The firm should ensure it has identified profitable investment 3.80** 3.50 4.00 3.33 3.67** 4.00** 4.00** 4.00** 2.83**
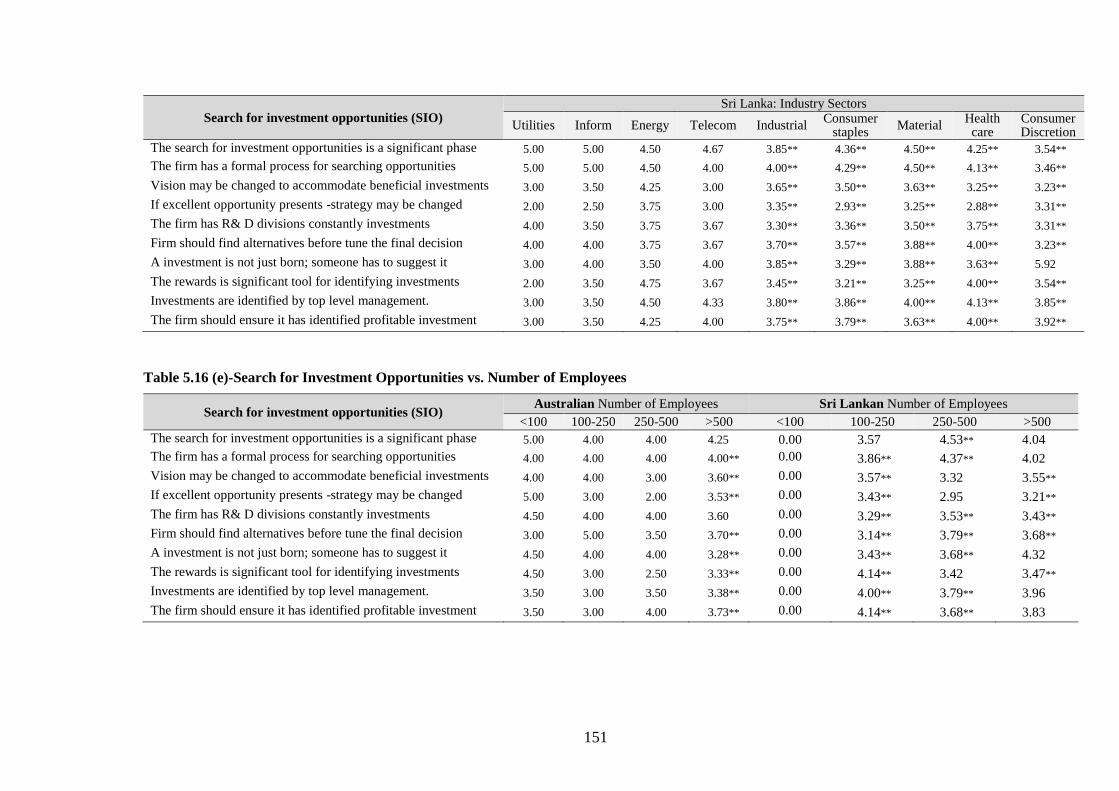
151
Search for investment opportunities (SIO) Sri Lanka: Industry Sectors
Utilities Inform Energy Telecom Industrial Consumer
staples Material
Health care
Consumer Discretion
The search for investment opportunities is a significant phase 5.00 5.00 4.50 4.67 3.85** 4.36** 4.50** 4.25** 3.54**
The firm has a formal process for searching opportunities 5.00 5.00 4.50 4.00 4.00** 4.29** 4.50** 4.13** 3.46**
Vision may be changed to accommodate beneficial investments 3.00 3.50 4.25 3.00 3.65** 3.50** 3.63** 3.25** 3.23**
If excellent opportunity presents -strategy may be changed 2.00 2.50 3.75 3.00 3.35** 2.93** 3.25** 2.88** 3.31**
The firm has R& D divisions constantly investments 4.00 3.50 3.75 3.67 3.30** 3.36** 3.50** 3.75** 3.31**
Firm should find alternatives before tune the final decision 4.00 4.00 3.75 3.67 3.70** 3.57** 3.88** 4.00** 3.23**
A investment is not just born; someone has to suggest it 3.00 4.00 3.50 4.00 3.85** 3.29** 3.88** 3.63** 5.92
The rewards is significant tool for identifying investments 2.00 3.50 4.75 3.67 3.45** 3.21** 3.25** 4.00** 3.54**
Investments are identified by top level management. 3.00 3.50 4.50 4.33 3.80** 3.86** 4.00** 4.13** 3.85**
The firm should ensure it has identified profitable investment 3.00 3.50 4.25 4.00 3.75** 3.79** 3.63** 4.00** 3.92**
Table 5.16 (e)-Search for Investment Opportunities vs. Number of Employees
Search for investment opportunities (SIO) Australian Number of Employees Sri Lankan Number of Employees
<100 100-250 250-500 >500 <100 100-250 250-500 >500
The search for investment opportunities is a significant phase 5.00 4.00 4.00 4.25 0.00 3.57 4.53** 4.04
The firm has a formal process for searching opportunities 4.00 4.00 4.00 4.00** 0.00 3.86** 4.37** 4.02
Vision may be changed to accommodate beneficial investments 4.00 4.00 3.00 3.60** 0.00 3.57** 3.32 3.55**
If excellent opportunity presents -strategy may be changed 5.00 3.00 2.00 3.53** 0.00 3.43** 2.95 3.21**
The firm has R& D divisions constantly investments 4.50 4.00 4.00 3.60 0.00 3.29** 3.53** 3.43**
Firm should find alternatives before tune the final decision 3.00 5.00 3.50 3.70** 0.00 3.14** 3.79** 3.68**
A investment is not just born; someone has to suggest it 4.50 4.00 4.00 3.28** 0.00 3.43** 3.68** 4.32
The rewards is significant tool for identifying investments 4.50 3.00 2.50 3.33** 0.00 4.14** 3.42 3.47**
Investments are identified by top level management. 3.50 3.00 3.50 3.38** 0.00 4.00** 3.79** 3.96
The firm should ensure it has identified profitable investment 3.50 3.00 4.00 3.73** 0.00 4.14** 3.68** 3.83
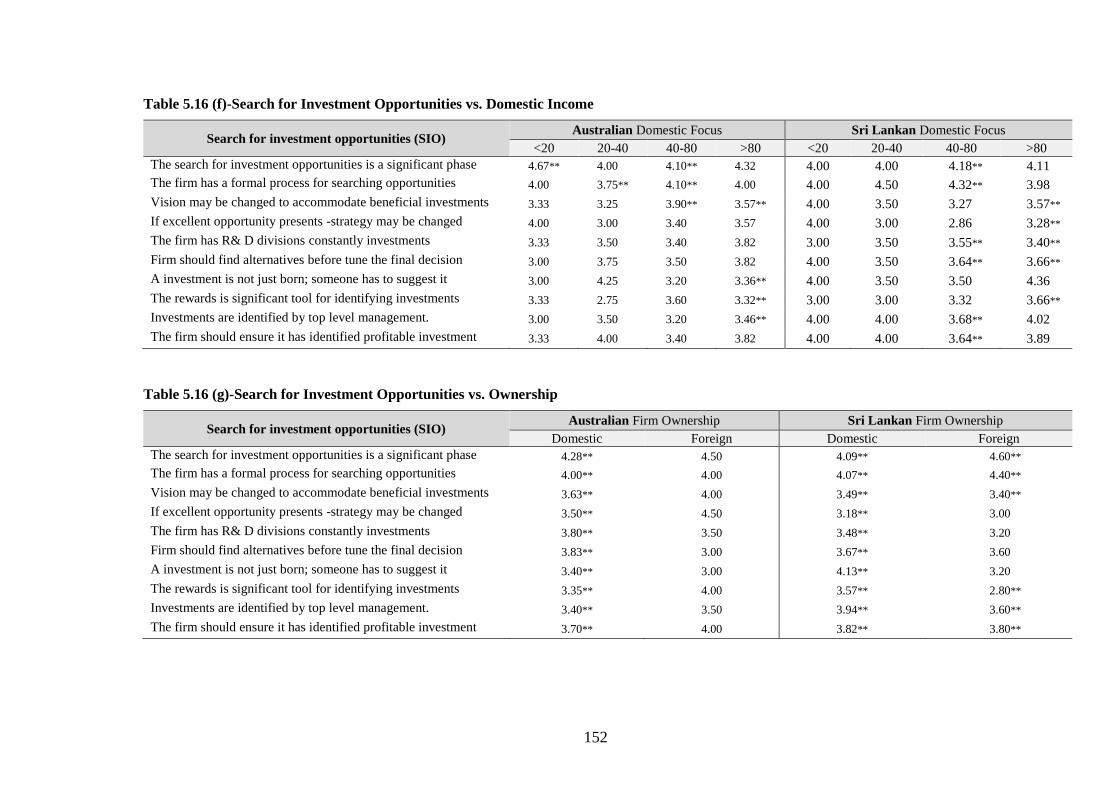
152
Table 5.16 (f)-Search for Investment Opportunities vs. Domestic Income
Search for investment opportunities (SIO) Australian Domestic Focus Sri Lankan Domestic Focus
<20 20-40 40-80 >80 <20 20-40 40-80 >80
The search for investment opportunities is a significant phase 4.67** 4.00 4.10** 4.32 4.00 4.00 4.18** 4.11
The firm has a formal process for searching opportunities 4.00 3.75** 4.10** 4.00 4.00 4.50 4.32** 3.98
Vision may be changed to accommodate beneficial investments 3.33 3.25 3.90** 3.57** 4.00 3.50 3.27 3.57**
If excellent opportunity presents -strategy may be changed 4.00 3.00 3.40 3.57 4.00 3.00 2.86 3.28**
The firm has R& D divisions constantly investments 3.33 3.50 3.40 3.82 3.00 3.50 3.55** 3.40**
Firm should find alternatives before tune the final decision 3.00 3.75 3.50 3.82 4.00 3.50 3.64** 3.66**
A investment is not just born; someone has to suggest it 3.00 4.25 3.20 3.36** 4.00 3.50 3.50 4.36
The rewards is significant tool for identifying investments 3.33 2.75 3.60 3.32** 3.00 3.00 3.32 3.66**
Investments are identified by top level management. 3.00 3.50 3.20 3.46** 4.00 4.00 3.68** 4.02
The firm should ensure it has identified profitable investment 3.33 4.00 3.40 3.82 4.00 4.00 3.64** 3.89
Table 5.16 (g)-Search for Investment Opportunities vs. Ownership
Search for investment opportunities (SIO) Australian Firm Ownership Sri Lankan Firm Ownership
Domestic Foreign Domestic Foreign
The search for investment opportunities is a significant phase 4.28** 4.50 4.09** 4.60**
The firm has a formal process for searching opportunities 4.00** 4.00 4.07** 4.40**
Vision may be changed to accommodate beneficial investments 3.63** 4.00 3.49** 3.40**
If excellent opportunity presents -strategy may be changed 3.50** 4.50 3.18** 3.00
The firm has R& D divisions constantly investments 3.80** 3.50 3.48** 3.20
Firm should find alternatives before tune the final decision 3.83** 3.00 3.67** 3.60
A investment is not just born; someone has to suggest it 3.40** 3.00 4.13** 3.20
The rewards is significant tool for identifying investments 3.35** 4.00 3.57** 2.80**
Investments are identified by top level management. 3.40** 3.50 3.94** 3.60**
The firm should ensure it has identified profitable investment 3.70** 4.00 3.82** 3.80**
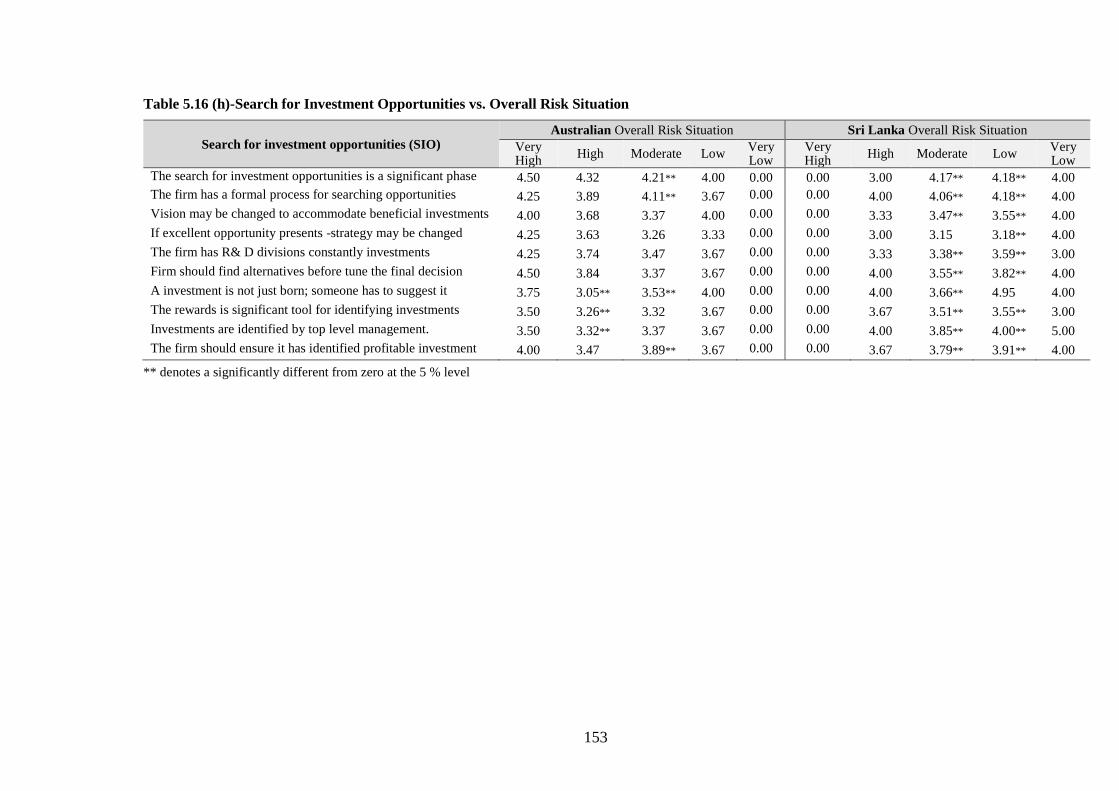
153
Table 5.16 (h)-Search for Investment Opportunities vs. Overall Risk Situation
Search for investment opportunities (SIO) Australian Overall Risk Situation Sri Lanka Overall Risk Situation
Very High
High Moderate Low Very Low
Very High
High Moderate Low Very Low
The search for investment opportunities is a significant phase 4.50 4.32 4.21** 4.00 0.00 0.00 3.00 4.17** 4.18** 4.00
The firm has a formal process for searching opportunities 4.25 3.89 4.11** 3.67 0.00 0.00 4.00 4.06** 4.18** 4.00
Vision may be changed to accommodate beneficial investments 4.00 3.68 3.37 4.00 0.00 0.00 3.33 3.47** 3.55** 4.00
If excellent opportunity presents -strategy may be changed 4.25 3.63 3.26 3.33 0.00 0.00 3.00 3.15 3.18** 4.00
The firm has R& D divisions constantly investments 4.25 3.74 3.47 3.67 0.00 0.00 3.33 3.38** 3.59** 3.00
Firm should find alternatives before tune the final decision 4.50 3.84 3.37 3.67 0.00 0.00 4.00 3.55** 3.82** 4.00
A investment is not just born; someone has to suggest it 3.75 3.05** 3.53** 4.00 0.00 0.00 4.00 3.66** 4.95 4.00
The rewards is significant tool for identifying investments 3.50 3.26** 3.32 3.67 0.00 0.00 3.67 3.51** 3.55** 3.00
Investments are identified by top level management. 3.50 3.32** 3.37 3.67 0.00 0.00 4.00 3.85** 4.00** 5.00
The firm should ensure it has identified profitable investment 4.00 3.47 3.89** 3.67 0.00 0.00 3.67 3.79** 3.91** 4.00
** denotes a significantly different from zero at the 5 % level
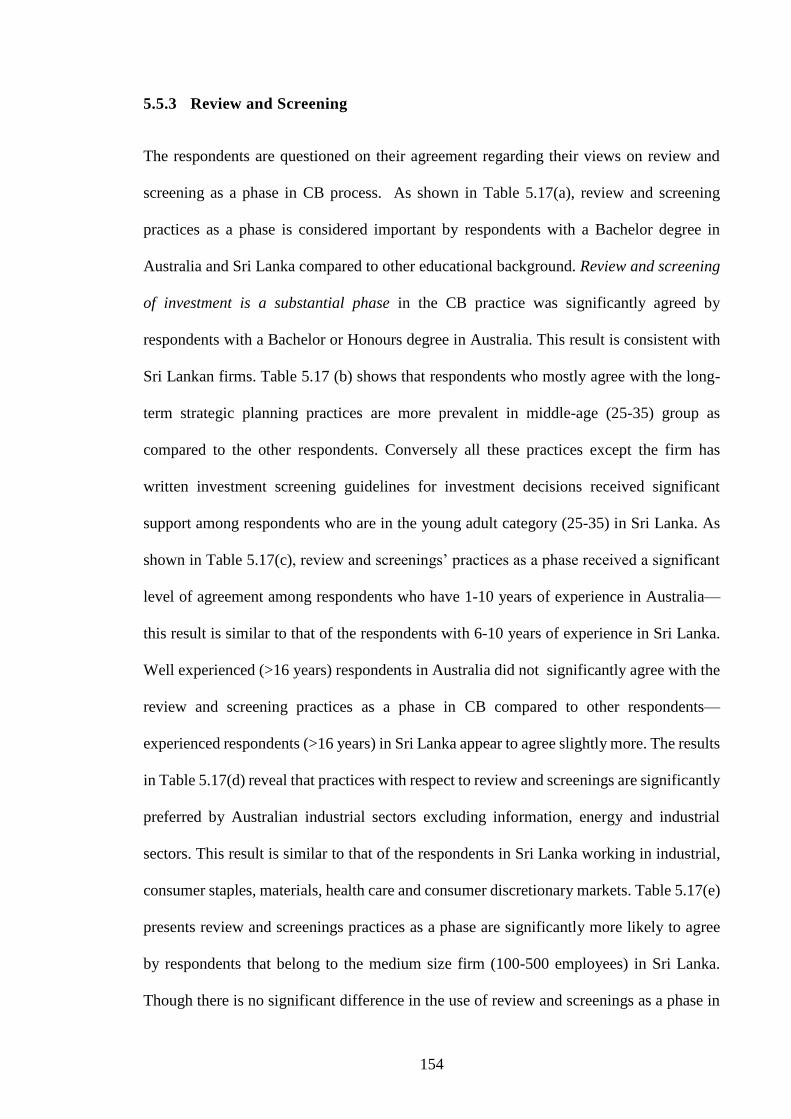
154
5.5.3 Review and Screening
The respondents are questioned on their agreement regarding their views on review and
screening as a phase in CB process. As shown in Table 5.17(a), review and screening
practices as a phase is considered important by respondents with a Bachelor degree in
Australia and Sri Lanka compared to other educational background. Review and screening
of investment is a substantial phase in the CB practice was significantly agreed by
respondents with a Bachelor or Honours degree in Australia. This result is consistent with
Sri Lankan firms. Table 5.17 (b) shows that respondents who mostly agree with the long-
term strategic planning practices are more prevalent in middle-age (25-35) group as
compared to the other respondents. Conversely all these practices except the firm has
written investment screening guidelines for investment decisions received significant
support among respondents who are in the young adult category (25-35) in Sri Lanka. As
shown in Table 5.17(c), review and screenings’ practices as a phase received a significant
level of agreement among respondents who have 1-10 years of experience in Australia—
this result is similar to that of the respondents with 6-10 years of experience in Sri Lanka.
Well experienced (>16 years) respondents in Australia did not significantly agree with the
review and screening practices as a phase in CB compared to other respondents—
experienced respondents (>16 years) in Sri Lanka appear to agree slightly more. The results
in Table 5.17(d) reveal that practices with respect to review and screenings are significantly
preferred by Australian industrial sectors excluding information, energy and industrial
sectors. This result is similar to that of the respondents in Sri Lanka working in industrial,
consumer staples, materials, health care and consumer discretionary markets. Table 5.17(e)
presents review and screenings practices as a phase are significantly more likely to agree
by respondents that belong to the medium size firm (100-500 employees) in Sri Lanka.
Though there is no significant difference in the use of review and screenings as a phase in
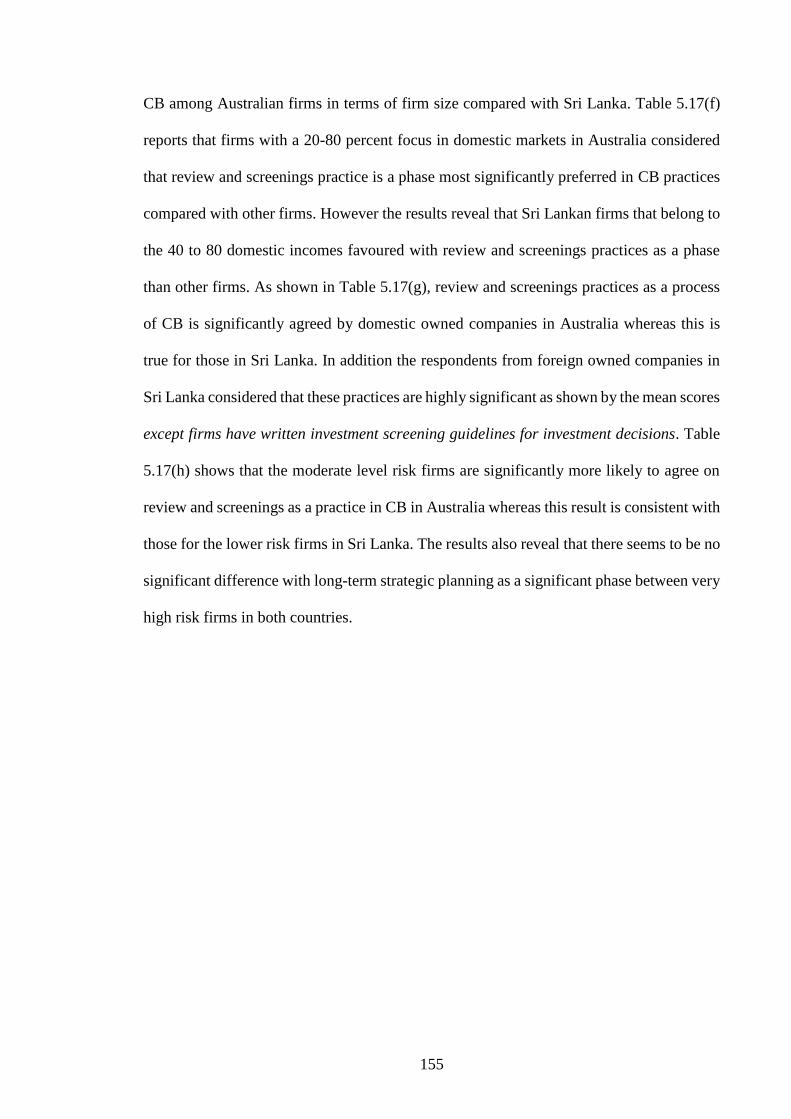
155
CB among Australian firms in terms of firm size compared with Sri Lanka. Table 5.17(f)
reports that firms with a 20-80 percent focus in domestic markets in Australia considered
that review and screenings practice is a phase most significantly preferred in CB practices
compared with other firms. However the results reveal that Sri Lankan firms that belong to
the 40 to 80 domestic incomes favoured with review and screenings practices as a phase
than other firms. As shown in Table 5.17(g), review and screenings practices as a process
of CB is significantly agreed by domestic owned companies in Australia whereas this is
true for those in Sri Lanka. In addition the respondents from foreign owned companies in
Sri Lanka considered that these practices are highly significant as shown by the mean scores
except firms have written investment screening guidelines for investment decisions. Table
5.17(h) shows that the moderate level risk firms are significantly more likely to agree on
review and screenings as a practice in CB in Australia whereas this result is consistent with
those for the lower risk firms in Sri Lanka. The results also reveal that there seems to be no
significant difference with long-term strategic planning as a significant phase between very
high risk firms in both countries.
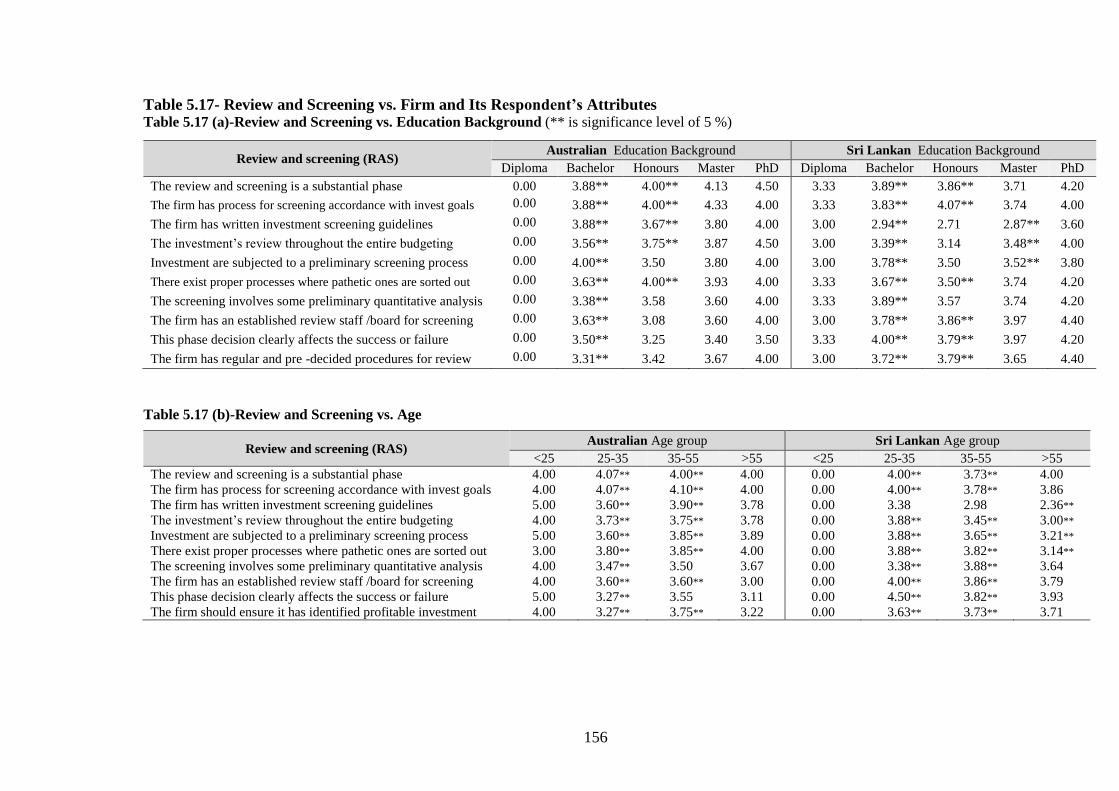
156
Table 5.17- Review and Screening vs. Firm and Its Respondent’s Attributes Table 5.17 (a)-Review and Screening vs. Education Background (** is significance level of 5 %)
Table 5.17 (b)-Review and Screening vs. Age
Review and screening (RAS) Australian Age group Sri Lankan Age group
<25 25-35 35-55 >55 <25 25-35 35-55 >55
The review and screening is a substantial phase 4.00 4.07** 4.00** 4.00 0.00 4.00** 3.73** 4.00
The firm has process for screening accordance with invest goals 4.00 4.07** 4.10** 4.00 0.00 4.00** 3.78** 3.86
The firm has written investment screening guidelines 5.00 3.60** 3.90** 3.78 0.00 3.38 2.98 2.36**
The investment’s review throughout the entire budgeting 4.00 3.73** 3.75** 3.78 0.00 3.88** 3.45** 3.00**
Investment are subjected to a preliminary screening process 5.00 3.60** 3.85** 3.89 0.00 3.88** 3.65** 3.21**
There exist proper processes where pathetic ones are sorted out 3.00 3.80** 3.85** 4.00 0.00 3.88** 3.82** 3.14**
The screening involves some preliminary quantitative analysis 4.00 3.47** 3.50 3.67 0.00 3.38** 3.88** 3.64
The firm has an established review staff /board for screening 4.00 3.60** 3.60** 3.00 0.00 4.00** 3.86** 3.79
This phase decision clearly affects the success or failure 5.00 3.27** 3.55 3.11 0.00 4.50** 3.82** 3.93
The firm should ensure it has identified profitable investment 4.00 3.27** 3.75** 3.22 0.00 3.63** 3.73** 3.71
Review and screening (RAS) Australian Education Background Sri Lankan Education Background
Diploma Bachelor Honours Master PhD Diploma Bachelor Honours Master PhD
The review and screening is a substantial phase 0.00 3.88** 4.00** 4.13 4.50 3.33 3.89** 3.86** 3.71 4.20
The firm has process for screening accordance with invest goals 0.00 3.88** 4.00** 4.33 4.00 3.33 3.83** 4.07** 3.74 4.00
The firm has written investment screening guidelines 0.00 3.88** 3.67** 3.80 4.00 3.00 2.94** 2.71 2.87** 3.60
The investment’s review throughout the entire budgeting 0.00 3.56** 3.75** 3.87 4.50 3.00 3.39** 3.14 3.48** 4.00
Investment are subjected to a preliminary screening process 0.00 4.00** 3.50 3.80 4.00 3.00 3.78** 3.50 3.52** 3.80
There exist proper processes where pathetic ones are sorted out 0.00 3.63** 4.00** 3.93 4.00 3.33 3.67** 3.50** 3.74 4.20
The screening involves some preliminary quantitative analysis 0.00 3.38** 3.58 3.60 4.00 3.33 3.89** 3.57 3.74 4.20
The firm has an established review staff /board for screening 0.00 3.63** 3.08 3.60 4.00 3.00 3.78** 3.86** 3.97 4.40
This phase decision clearly affects the success or failure 0.00 3.50** 3.25 3.40 3.50 3.33 4.00** 3.79** 3.97 4.20
The firm has regular and pre -decided procedures for review 0.00 3.31** 3.42 3.67 4.00 3.00 3.72** 3.79** 3.65 4.40
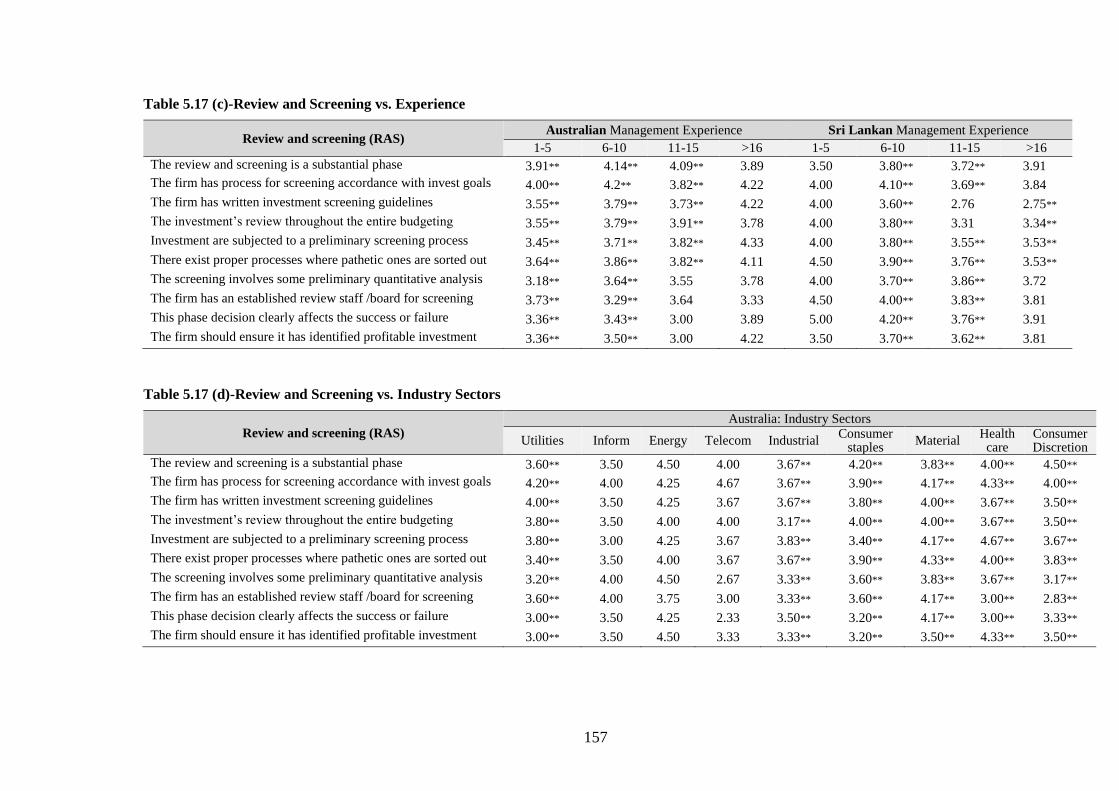
157
Table 5.17 (c)-Review and Screening vs. Experience
Review and screening (RAS) Australian Management Experience Sri Lankan Management Experience
1-5 6-10 11-15 >16 1-5 6-10 11-15 >16
The review and screening is a substantial phase 3.91** 4.14** 4.09** 3.89 3.50 3.80** 3.72** 3.91
The firm has process for screening accordance with invest goals 4.00** 4.2** 3.82** 4.22 4.00 4.10** 3.69** 3.84
The firm has written investment screening guidelines 3.55** 3.79** 3.73** 4.22 4.00 3.60** 2.76 2.75**
The investment’s review throughout the entire budgeting 3.55** 3.79** 3.91** 3.78 4.00 3.80** 3.31 3.34**
Investment are subjected to a preliminary screening process 3.45** 3.71** 3.82** 4.33 4.00 3.80** 3.55** 3.53**
There exist proper processes where pathetic ones are sorted out 3.64** 3.86** 3.82** 4.11 4.50 3.90** 3.76** 3.53**
The screening involves some preliminary quantitative analysis 3.18** 3.64** 3.55 3.78 4.00 3.70** 3.86** 3.72
The firm has an established review staff /board for screening 3.73** 3.29** 3.64 3.33 4.50 4.00** 3.83** 3.81
This phase decision clearly affects the success or failure 3.36** 3.43** 3.00 3.89 5.00 4.20** 3.76** 3.91
The firm should ensure it has identified profitable investment 3.36** 3.50** 3.00 4.22 3.50 3.70** 3.62** 3.81
Table 5.17 (d)-Review and Screening vs. Industry Sectors
Review and screening (RAS) Australia: Industry Sectors
Utilities Inform Energy Telecom Industrial Consumer
staples Material
Health care
Consumer Discretion
The review and screening is a substantial phase 3.60** 3.50 4.50 4.00 3.67** 4.20** 3.83** 4.00** 4.50**
The firm has process for screening accordance with invest goals 4.20** 4.00 4.25 4.67 3.67** 3.90** 4.17** 4.33** 4.00**
The firm has written investment screening guidelines 4.00** 3.50 4.25 3.67 3.67** 3.80** 4.00** 3.67** 3.50**
The investment’s review throughout the entire budgeting 3.80** 3.50 4.00 4.00 3.17** 4.00** 4.00** 3.67** 3.50**
Investment are subjected to a preliminary screening process 3.80** 3.00 4.25 3.67 3.83** 3.40** 4.17** 4.67** 3.67**
There exist proper processes where pathetic ones are sorted out 3.40** 3.50 4.00 3.67 3.67** 3.90** 4.33** 4.00** 3.83**
The screening involves some preliminary quantitative analysis 3.20** 4.00 4.50 2.67 3.33** 3.60** 3.83** 3.67** 3.17**
The firm has an established review staff /board for screening 3.60** 4.00 3.75 3.00 3.33** 3.60** 4.17** 3.00** 2.83**
This phase decision clearly affects the success or failure 3.00** 3.50 4.25 2.33 3.50** 3.20** 4.17** 3.00** 3.33**
The firm should ensure it has identified profitable investment 3.00** 3.50 4.50 3.33 3.33** 3.20** 3.50** 4.33** 3.50**
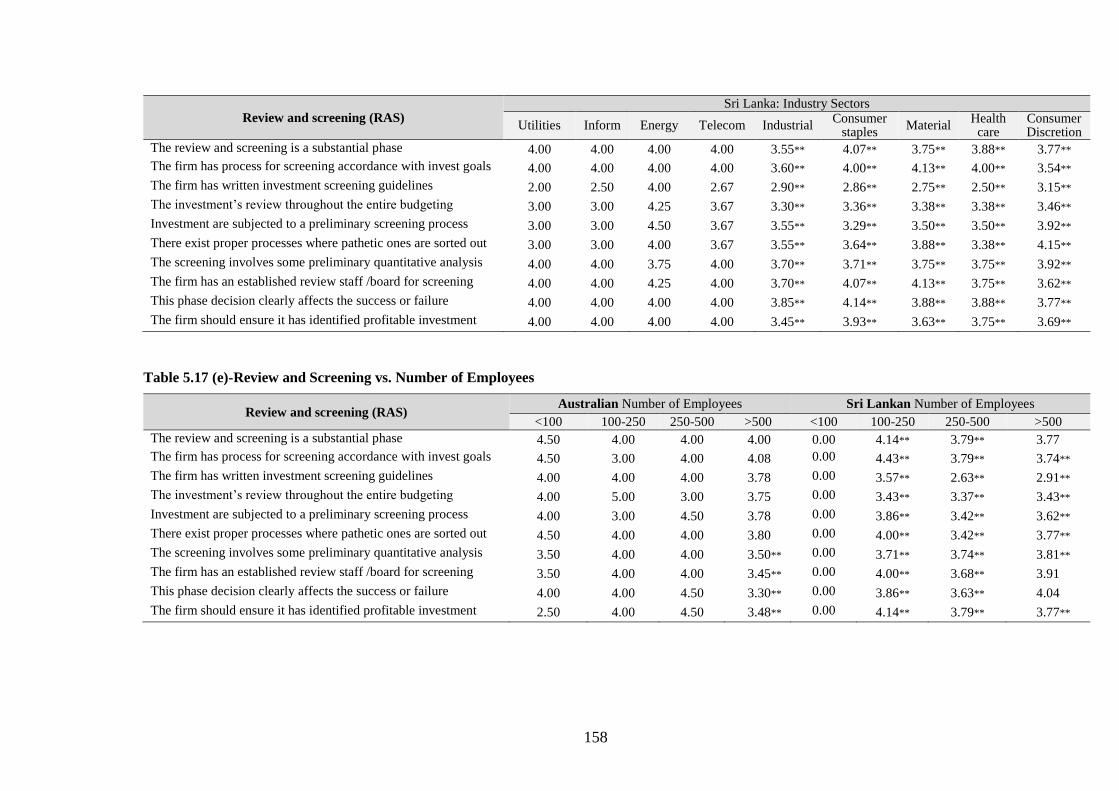
158
Review and screening (RAS) Sri Lanka: Industry Sectors
Utilities Inform Energy Telecom Industrial Consumer
staples Material
Health care
Consumer Discretion
The review and screening is a substantial phase 4.00 4.00 4.00 4.00 3.55** 4.07** 3.75** 3.88** 3.77**
The firm has process for screening accordance with invest goals 4.00 4.00 4.00 4.00 3.60** 4.00** 4.13** 4.00** 3.54**
The firm has written investment screening guidelines 2.00 2.50 4.00 2.67 2.90** 2.86** 2.75** 2.50** 3.15**
The investment’s review throughout the entire budgeting 3.00 3.00 4.25 3.67 3.30** 3.36** 3.38** 3.38** 3.46**
Investment are subjected to a preliminary screening process 3.00 3.00 4.50 3.67 3.55** 3.29** 3.50** 3.50** 3.92**
There exist proper processes where pathetic ones are sorted out 3.00 3.00 4.00 3.67 3.55** 3.64** 3.88** 3.38** 4.15**
The screening involves some preliminary quantitative analysis 4.00 4.00 3.75 4.00 3.70** 3.71** 3.75** 3.75** 3.92**
The firm has an established review staff /board for screening 4.00 4.00 4.25 4.00 3.70** 4.07** 4.13** 3.75** 3.62**
This phase decision clearly affects the success or failure 4.00 4.00 4.00 4.00 3.85** 4.14** 3.88** 3.88** 3.77**
The firm should ensure it has identified profitable investment 4.00 4.00 4.00 4.00 3.45** 3.93** 3.63** 3.75** 3.69**
Table 5.17 (e)-Review and Screening vs. Number of Employees
Review and screening (RAS) Australian Number of Employees Sri Lankan Number of Employees
<100 100-250 250-500 >500 <100 100-250 250-500 >500
The review and screening is a substantial phase 4.50 4.00 4.00 4.00 0.00 4.14** 3.79** 3.77
The firm has process for screening accordance with invest goals 4.50 3.00 4.00 4.08 0.00 4.43** 3.79** 3.74**
The firm has written investment screening guidelines 4.00 4.00 4.00 3.78 0.00 3.57** 2.63** 2.91**
The investment’s review throughout the entire budgeting 4.00 5.00 3.00 3.75 0.00 3.43** 3.37** 3.43**
Investment are subjected to a preliminary screening process 4.00 3.00 4.50 3.78 0.00 3.86** 3.42** 3.62**
There exist proper processes where pathetic ones are sorted out 4.50 4.00 4.00 3.80 0.00 4.00** 3.42** 3.77**
The screening involves some preliminary quantitative analysis 3.50 4.00 4.00 3.50** 0.00 3.71** 3.74** 3.81**
The firm has an established review staff /board for screening 3.50 4.00 4.00 3.45** 0.00 4.00** 3.68** 3.91
This phase decision clearly affects the success or failure 4.00 4.00 4.50 3.30** 0.00 3.86** 3.63** 4.04
The firm should ensure it has identified profitable investment 2.50 4.00 4.50 3.48** 0.00 4.14** 3.79** 3.77**
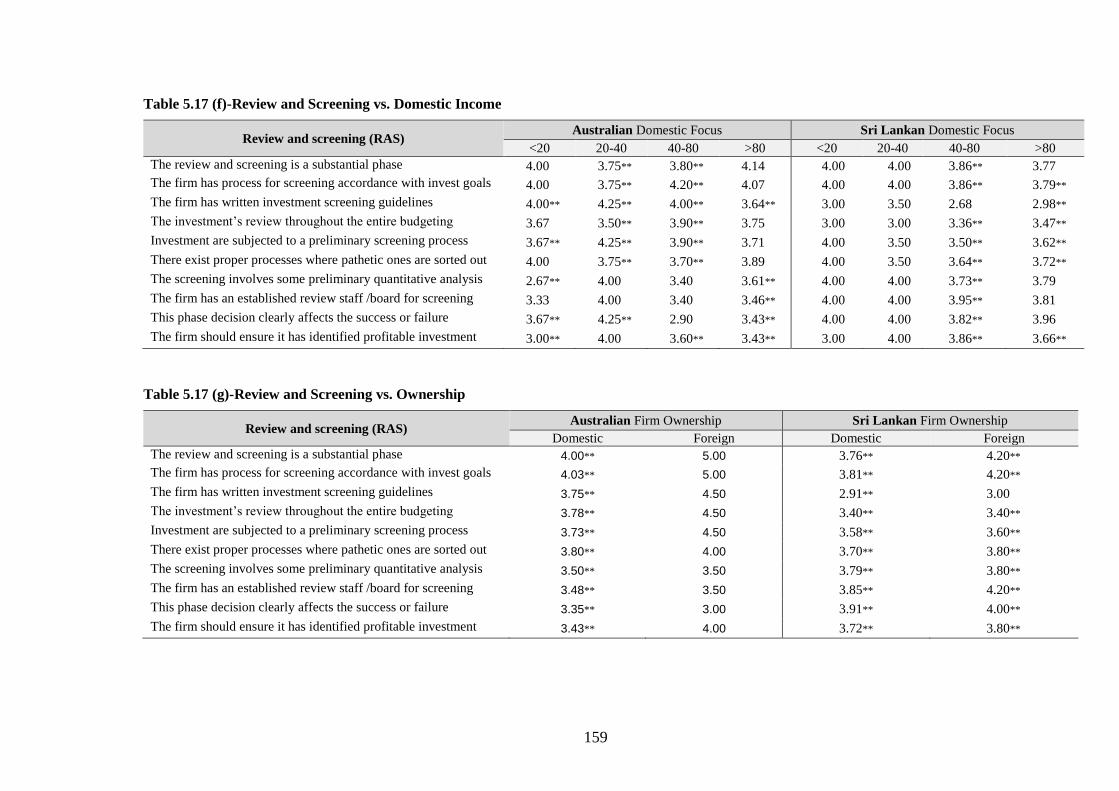
159
Table 5.17 (f)-Review and Screening vs. Domestic Income
Review and screening (RAS) Australian Domestic Focus Sri Lankan Domestic Focus
<20 20-40 40-80 >80 <20 20-40 40-80 >80
The review and screening is a substantial phase 4.00 3.75** 3.80** 4.14 4.00 4.00 3.86** 3.77
The firm has process for screening accordance with invest goals 4.00 3.75** 4.20** 4.07 4.00 4.00 3.86** 3.79**
The firm has written investment screening guidelines 4.00** 4.25** 4.00** 3.64** 3.00 3.50 2.68 2.98**
The investment’s review throughout the entire budgeting 3.67 3.50** 3.90** 3.75 3.00 3.00 3.36** 3.47**
Investment are subjected to a preliminary screening process 3.67** 4.25** 3.90** 3.71 4.00 3.50 3.50** 3.62**
There exist proper processes where pathetic ones are sorted out 4.00 3.75** 3.70** 3.89 4.00 3.50 3.64** 3.72**
The screening involves some preliminary quantitative analysis 2.67** 4.00 3.40 3.61** 4.00 4.00 3.73** 3.79
The firm has an established review staff /board for screening 3.33 4.00 3.40 3.46** 4.00 4.00 3.95** 3.81
This phase decision clearly affects the success or failure 3.67** 4.25** 2.90 3.43** 4.00 4.00 3.82** 3.96
The firm should ensure it has identified profitable investment 3.00** 4.00 3.60** 3.43** 3.00 4.00 3.86** 3.66**
Table 5.17 (g)-Review and Screening vs. Ownership
Review and screening (RAS) Australian Firm Ownership Sri Lankan Firm Ownership
Domestic Foreign Domestic Foreign
The review and screening is a substantial phase 4.00** 5.00 3.76** 4.20**
The firm has process for screening accordance with invest goals 4.03** 5.00 3.81** 4.20**
The firm has written investment screening guidelines 3.75** 4.50 2.91** 3.00
The investment’s review throughout the entire budgeting 3.78** 4.50 3.40** 3.40**
Investment are subjected to a preliminary screening process 3.73** 4.50 3.58** 3.60**
There exist proper processes where pathetic ones are sorted out 3.80** 4.00 3.70** 3.80**
The screening involves some preliminary quantitative analysis 3.50** 3.50 3.79** 3.80**
The firm has an established review staff /board for screening 3.48** 3.50 3.85** 4.20**
This phase decision clearly affects the success or failure 3.35** 3.00 3.91** 4.00**
The firm should ensure it has identified profitable investment 3.43** 4.00 3.72** 3.80**
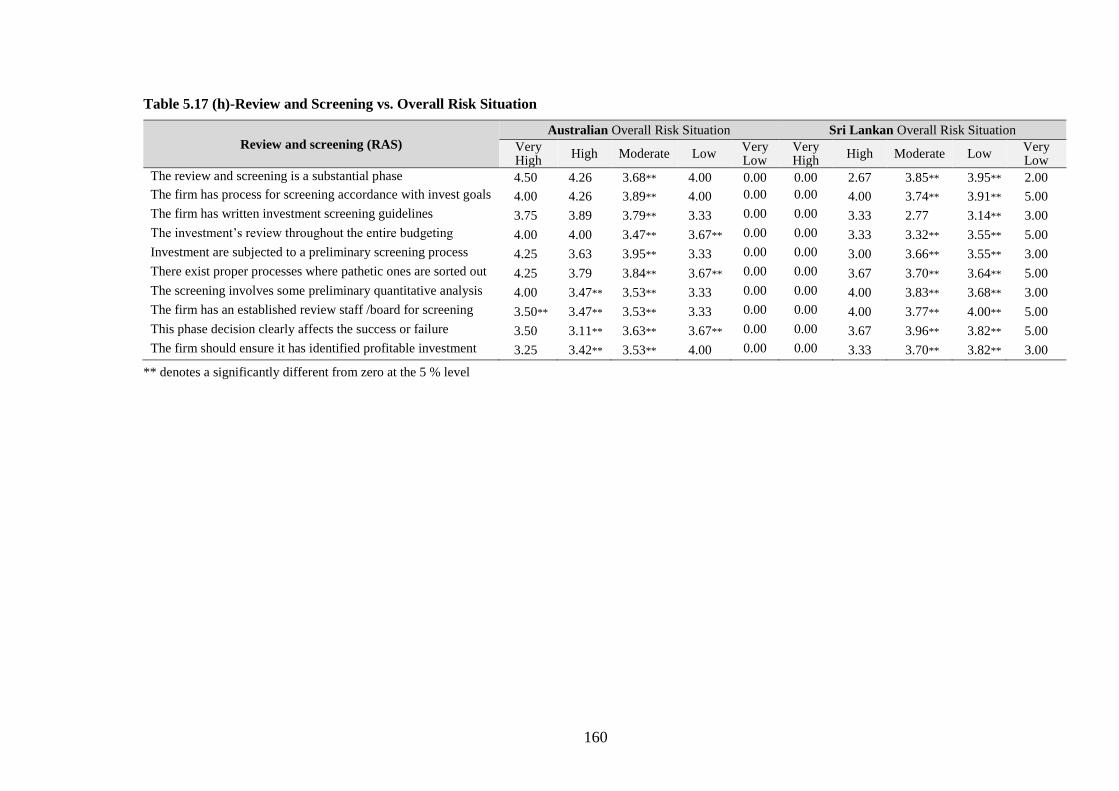
160
Table 5.17 (h)-Review and Screening vs. Overall Risk Situation
Review and screening (RAS) Australian Overall Risk Situation Sri Lankan Overall Risk Situation
Very High
High Moderate Low Very Low
Very High
High Moderate Low Very Low
The review and screening is a substantial phase 4.50 4.26 3.68** 4.00 0.00 0.00 2.67 3.85** 3.95** 2.00
The firm has process for screening accordance with invest goals 4.00 4.26 3.89** 4.00 0.00 0.00 4.00 3.74** 3.91** 5.00
The firm has written investment screening guidelines 3.75 3.89 3.79** 3.33 0.00 0.00 3.33 2.77 3.14** 3.00
The investment’s review throughout the entire budgeting 4.00 4.00 3.47** 3.67** 0.00 0.00 3.33 3.32** 3.55** 5.00
Investment are subjected to a preliminary screening process 4.25 3.63 3.95** 3.33 0.00 0.00 3.00 3.66** 3.55** 3.00
There exist proper processes where pathetic ones are sorted out 4.25 3.79 3.84** 3.67** 0.00 0.00 3.67 3.70** 3.64** 5.00
The screening involves some preliminary quantitative analysis 4.00 3.47** 3.53** 3.33 0.00 0.00 4.00 3.83** 3.68** 3.00
The firm has an established review staff /board for screening 3.50** 3.47** 3.53** 3.33 0.00 0.00 4.00 3.77** 4.00** 5.00
This phase decision clearly affects the success or failure 3.50 3.11** 3.63** 3.67** 0.00 0.00 3.67 3.96** 3.82** 5.00
The firm should ensure it has identified profitable investment 3.25 3.42** 3.53** 4.00 0.00 0.00 3.33 3.70** 3.82** 3.00
** denotes a significantly different from zero at the 5 % level

161
5.5.4 Accept/Reject Decision
This section explores the views of respondents on the importance of the accept/reject
decision as a phase of the CB process. As shown in Table 5.18(a), respondents without a
PhD rely to some extent on the accept/reject decision as a phase of CB process in Australia
and Sri Lanka. In Australia the highest mean score for this phase is 4.18 among respondents
who hold an Honours degree. This result is quite similar for Sri Lanka. For Australian firms,
an accept/reject decision practices are more popular among respondents with a Bachelor
degree, whereas, the accept/reject decision practice is consistently popular among
respondents with Diploma, Bachelor or Honours degree in Sri Lanka. Compared to the
Australian respondents with a PhD, Sri Lankan respondents with a PhD consider future
cash flow, market share, business development, risk position, environmental factors and
competitive advantage significantly more useful to their accept/reject decision. Table
5.18(b) shows young adult respondents (25-35) are more likely to apply all the factors in
line with accept/reject decisions than other age clusters in Australia. In Sri Lanka, these
factors are considered more by young adult (25-35) or middle age (35-55) respondents. Risk
position, environmental factors, and competitive advantage are favoured mostly by the
mature respondents in Australia, while quantitative analysis judgment, business expansion,
disposable expenses and consistency with corporate strategy tend to be used more by
mature respondents in Australia than other factors. The results in Table 5.18(c) show less
experienced (1-10) Australian respondents are likely to consider all these factors for their
accept/reject decision—this result is consistent with those for the 6-15 years experienced
respondents in Sri Lanka. All these practices except consistency with corporate strategy,
improved market image, competitive position and ability to expand in the future are also
consistently more popular among highly experienced (>16) Sri Lankan respondents over
respondents in Australia. Table 5.18(d) illustrates that these proxies are the most widely
162
considered by firms in utilities, consumables, materials, and consumer discretionary
markets for finalising the accept/reject decision—in Sri Lanka, all of these factors are a
significant part of the accept/reject decision for firms in the industrial, consumables,
materials, health care and consumer discretionary markets. There is no obvious difference
between energy sectors in Australia and Sri Lanka in terms of the accept/reject decision.
As shown in Table 5.18(e), accept/reject decision practices are significantly employed by
Sri Lankan firms (100 – 500 employees). The table also indicates that large Sri Lanka firms
(>500 employees) are more motivated to apply all the factors of the accept/reject decision
excluding consistency with corporate strategy, improved market image and improved
competitive position. In contrast to the Australian firms, however, only large Sri Lankan
firms (>500 employees) consider accept/reject decision as a major phase for the CB process.
Also, these Sri Lankan firms are more likely to consider quantitative analysis,
environmental factors and disposable expenses in their investment selection. Table 5.18(f)
shows that Sri Lankan domestic focused firms (40-80 percent) are more likely to consider
all the factors concerning accept/reject decisions. While, highly focused Sri Lankan
domestic firms (>80 percent) are more inclined to consider all these elements except
improved market image and improved competitive position for decision. The results in
Table 5.18(g) explain that Australian domestic-owned firms are more likely to use a more
complete range of factors when making long-term CB decisions. This result is consistent
with Sri Lankan firms. Table 5.18 (h) shows that respondents who mostly agree on the
accept/reject factors are more prevalent in firms with moderate to lower-risk position, as
compared to the other firms. While in Australia, high-risk firms are more likely to consider
competitive advantage and market share in their long-term CB decisions.
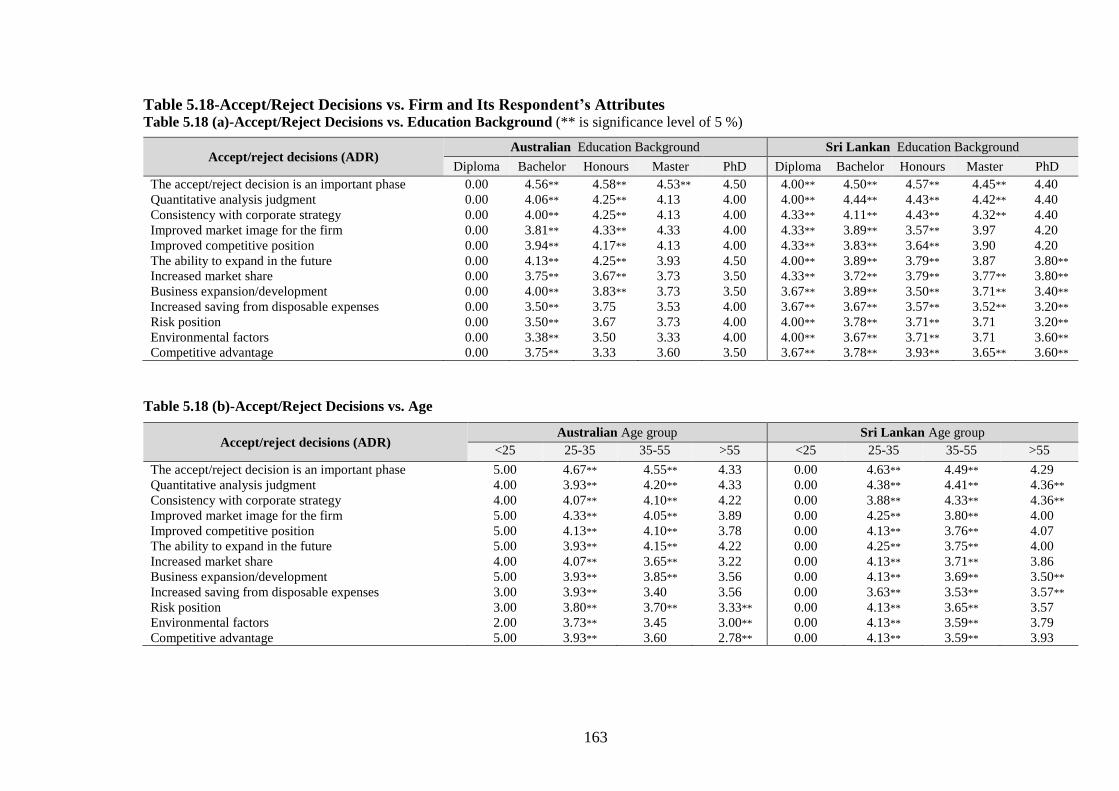
163
Table 5.18-Accept/Reject Decisions vs. Firm and Its Respondent’s Attributes Table 5.18 (a)-Accept/Reject Decisions vs. Education Background (** is significance level of 5 %)
Table 5.18 (b)-Accept/Reject Decisions vs. Age
Accept/reject decisions (ADR) Australian Age group Sri Lankan Age group
<25 25-35 35-55 >55 <25 25-35 35-55 >55
The accept/reject decision is an important phase 5.00 4.67** 4.55** 4.33 0.00 4.63** 4.49** 4.29
Quantitative analysis judgment 4.00 3.93** 4.20** 4.33 0.00 4.38** 4.41** 4.36**
Consistency with corporate strategy 4.00 4.07** 4.10** 4.22 0.00 3.88** 4.33** 4.36**
Improved market image for the firm 5.00 4.33** 4.05** 3.89 0.00 4.25** 3.80** 4.00
Improved competitive position 5.00 4.13** 4.10** 3.78 0.00 4.13** 3.76** 4.07
The ability to expand in the future 5.00 3.93** 4.15** 4.22 0.00 4.25** 3.75** 4.00
Increased market share 4.00 4.07** 3.65** 3.22 0.00 4.13** 3.71** 3.86
Business expansion/development 5.00 3.93** 3.85** 3.56 0.00 4.13** 3.69** 3.50**
Increased saving from disposable expenses 3.00 3.93** 3.40 3.56 0.00 3.63** 3.53** 3.57**
Risk position 3.00 3.80** 3.70** 3.33** 0.00 4.13** 3.65** 3.57
Environmental factors 2.00 3.73** 3.45 3.00** 0.00 4.13** 3.59** 3.79
Competitive advantage 5.00 3.93** 3.60 2.78** 0.00 4.13** 3.59** 3.93
Accept/reject decisions (ADR) Australian Education Background Sri Lankan Education Background
Diploma Bachelor Honours Master PhD Diploma Bachelor Honours Master PhD
The accept/reject decision is an important phase 0.00 4.56** 4.58** 4.53** 4.50 4.00** 4.50** 4.57** 4.45** 4.40
Quantitative analysis judgment 0.00 4.06** 4.25** 4.13 4.00 4.00** 4.44** 4.43** 4.42** 4.40
Consistency with corporate strategy 0.00 4.00** 4.25** 4.13 4.00 4.33** 4.11** 4.43** 4.32** 4.40
Improved market image for the firm 0.00 3.81** 4.33** 4.33 4.00 4.33** 3.89** 3.57** 3.97 4.20
Improved competitive position 0.00 3.94** 4.17** 4.13 4.00 4.33** 3.83** 3.64** 3.90 4.20
The ability to expand in the future 0.00 4.13** 4.25** 3.93 4.50 4.00** 3.89** 3.79** 3.87 3.80**
Increased market share 0.00 3.75** 3.67** 3.73 3.50 4.33** 3.72** 3.79** 3.77** 3.80**
Business expansion/development 0.00 4.00** 3.83** 3.73 3.50 3.67** 3.89** 3.50** 3.71** 3.40**
Increased saving from disposable expenses 0.00 3.50** 3.75 3.53 4.00 3.67** 3.67** 3.57** 3.52** 3.20**
Risk position 0.00 3.50** 3.67 3.73 4.00 4.00** 3.78** 3.71** 3.71 3.20**
Environmental factors 0.00 3.38** 3.50 3.33 4.00 4.00** 3.67** 3.71** 3.71 3.60**
Competitive advantage 0.00 3.75** 3.33 3.60 3.50 3.67** 3.78** 3.93** 3.65** 3.60**
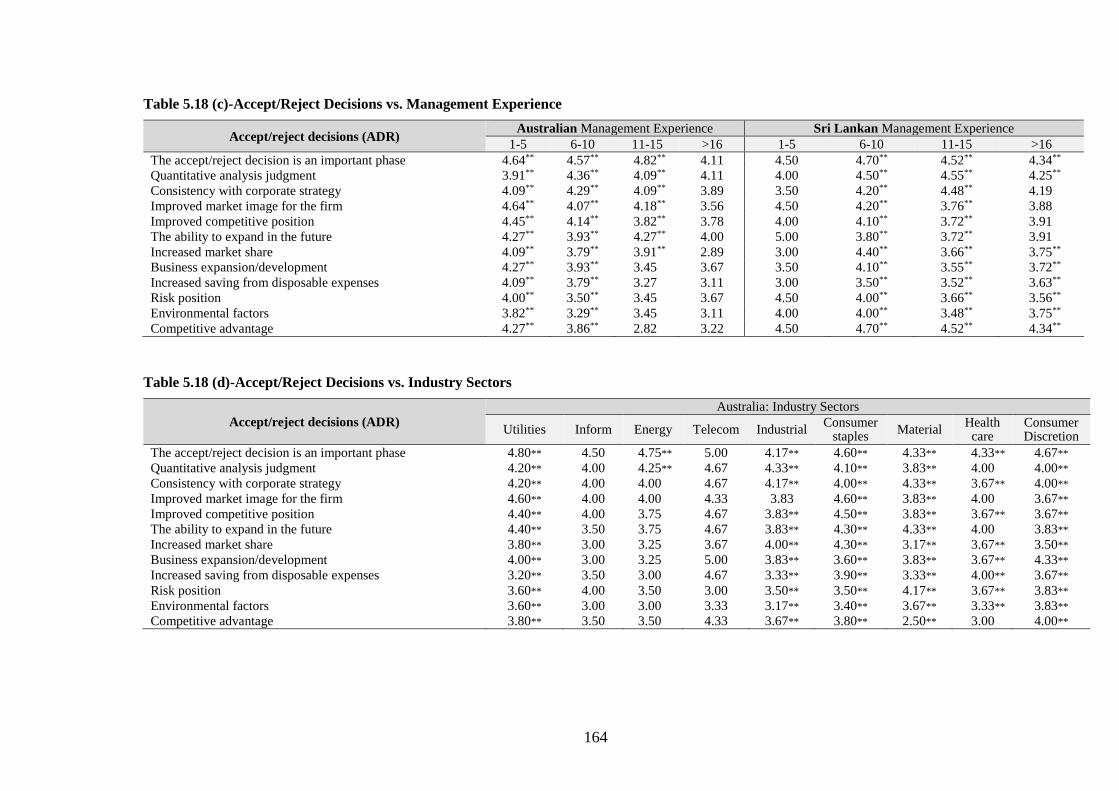
164
Table 5.18 (c)-Accept/Reject Decisions vs. Management Experience
Accept/reject decisions (ADR) Australian Management Experience Sri Lankan Management Experience
1-5 6-10 11-15 >16 1-5 6-10 11-15 >16
The accept/reject decision is an important phase 4.64** 4.57** 4.82** 4.11 4.50 4.70** 4.52** 4.34**
Quantitative analysis judgment 3.91** 4.36** 4.09** 4.11 4.00 4.50** 4.55** 4.25**
Consistency with corporate strategy 4.09** 4.29** 4.09** 3.89 3.50 4.20** 4.48** 4.19
Improved market image for the firm 4.64** 4.07** 4.18** 3.56 4.50 4.20** 3.76** 3.88
Improved competitive position 4.45** 4.14** 3.82** 3.78 4.00 4.10** 3.72** 3.91
The ability to expand in the future 4.27** 3.93** 4.27** 4.00 5.00 3.80** 3.72** 3.91
Increased market share 4.09** 3.79** 3.91** 2.89 3.00 4.40** 3.66** 3.75**
Business expansion/development 4.27** 3.93** 3.45 3.67 3.50 4.10** 3.55** 3.72**
Increased saving from disposable expenses 4.09** 3.79** 3.27 3.11 3.00 3.50** 3.52** 3.63**
Risk position 4.00** 3.50** 3.45 3.67 4.50 4.00** 3.66** 3.56**
Environmental factors 3.82** 3.29** 3.45 3.11 4.00 4.00** 3.48** 3.75**
Competitive advantage 4.27** 3.86** 2.82 3.22 4.50 4.70** 4.52** 4.34**
Table 5.18 (d)-Accept/Reject Decisions vs. Industry Sectors
Accept/reject decisions (ADR)
Australia: Industry Sectors
Utilities Inform Energy Telecom Industrial Consumer
staples Material
Health care
Consumer Discretion
The accept/reject decision is an important phase 4.80** 4.50 4.75** 5.00 4.17** 4.60** 4.33** 4.33** 4.67**
Quantitative analysis judgment 4.20** 4.00 4.25** 4.67 4.33** 4.10** 3.83** 4.00 4.00**
Consistency with corporate strategy 4.20** 4.00 4.00 4.67 4.17** 4.00** 4.33** 3.67** 4.00**
Improved market image for the firm 4.60** 4.00 4.00 4.33 3.83 4.60** 3.83** 4.00 3.67**
Improved competitive position 4.40** 4.00 3.75 4.67 3.83** 4.50** 3.83** 3.67** 3.67**
The ability to expand in the future 4.40** 3.50 3.75 4.67 3.83** 4.30** 4.33** 4.00 3.83**
Increased market share 3.80** 3.00 3.25 3.67 4.00** 4.30** 3.17** 3.67** 3.50**
Business expansion/development 4.00** 3.00 3.25 5.00 3.83** 3.60** 3.83** 3.67** 4.33**
Increased saving from disposable expenses 3.20** 3.50 3.00 4.67 3.33** 3.90** 3.33** 4.00** 3.67**
Risk position 3.60** 4.00 3.50 3.00 3.50** 3.50** 4.17** 3.67** 3.83**
Environmental factors 3.60** 3.00 3.00 3.33 3.17** 3.40** 3.67** 3.33** 3.83**
Competitive advantage 3.80** 3.50 3.50 4.33 3.67** 3.80** 2.50** 3.00 4.00**
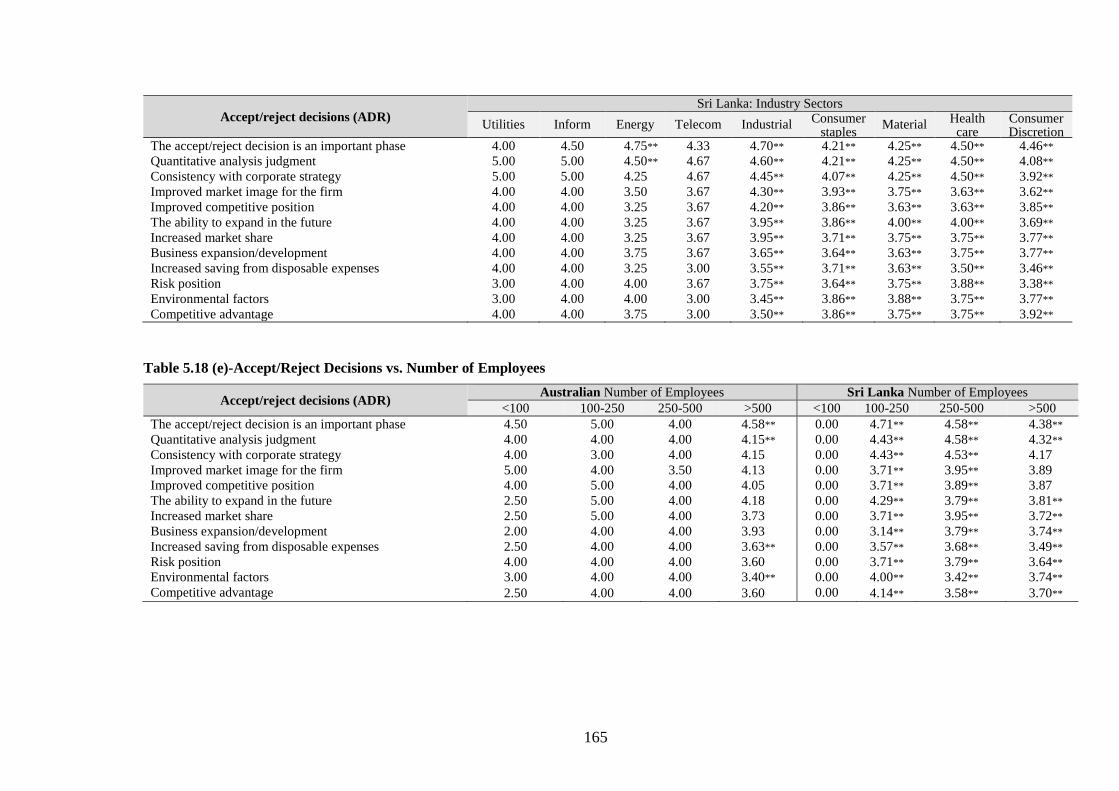
165
Accept/reject decisions (ADR) Sri Lanka: Industry Sectors
Utilities Inform Energy Telecom Industrial Consumer
staples Material
Health care
Consumer Discretion
The accept/reject decision is an important phase 4.00 4.50 4.75** 4.33 4.70** 4.21** 4.25** 4.50** 4.46**
Quantitative analysis judgment 5.00 5.00 4.50** 4.67 4.60** 4.21** 4.25** 4.50** 4.08**
Consistency with corporate strategy 5.00 5.00 4.25 4.67 4.45** 4.07** 4.25** 4.50** 3.92**
Improved market image for the firm 4.00 4.00 3.50 3.67 4.30** 3.93** 3.75** 3.63** 3.62**
Improved competitive position 4.00 4.00 3.25 3.67 4.20** 3.86** 3.63** 3.63** 3.85**
The ability to expand in the future 4.00 4.00 3.25 3.67 3.95** 3.86** 4.00** 4.00** 3.69**
Increased market share 4.00 4.00 3.25 3.67 3.95** 3.71** 3.75** 3.75** 3.77**
Business expansion/development 4.00 4.00 3.75 3.67 3.65** 3.64** 3.63** 3.75** 3.77**
Increased saving from disposable expenses 4.00 4.00 3.25 3.00 3.55** 3.71** 3.63** 3.50** 3.46**
Risk position 3.00 4.00 4.00 3.67 3.75** 3.64** 3.75** 3.88** 3.38**
Environmental factors 3.00 4.00 4.00 3.00 3.45** 3.86** 3.88** 3.75** 3.77**
Competitive advantage 4.00 4.00 3.75 3.00 3.50** 3.86** 3.75** 3.75** 3.92**
Table 5.18 (e)-Accept/Reject Decisions vs. Number of Employees
Accept/reject decisions (ADR) Australian Number of Employees Sri Lanka Number of Employees
<100 100-250 250-500 >500 <100 100-250 250-500 >500
The accept/reject decision is an important phase 4.50 5.00 4.00 4.58** 0.00 4.71** 4.58** 4.38**
Quantitative analysis judgment 4.00 4.00 4.00 4.15** 0.00 4.43** 4.58** 4.32**
Consistency with corporate strategy 4.00 3.00 4.00 4.15 0.00 4.43** 4.53** 4.17
Improved market image for the firm 5.00 4.00 3.50 4.13 0.00 3.71** 3.95** 3.89
Improved competitive position 4.00 5.00 4.00 4.05 0.00 3.71** 3.89** 3.87
The ability to expand in the future 2.50 5.00 4.00 4.18 0.00 4.29** 3.79** 3.81**
Increased market share 2.50 5.00 4.00 3.73 0.00 3.71** 3.95** 3.72**
Business expansion/development 2.00 4.00 4.00 3.93 0.00 3.14** 3.79** 3.74**
Increased saving from disposable expenses 2.50 4.00 4.00 3.63** 0.00 3.57** 3.68** 3.49**
Risk position 4.00 4.00 4.00 3.60 0.00 3.71** 3.79** 3.64**
Environmental factors 3.00 4.00 4.00 3.40** 0.00 4.00** 3.42** 3.74**
Competitive advantage 2.50 4.00 4.00 3.60 0.00 4.14** 3.58** 3.70**
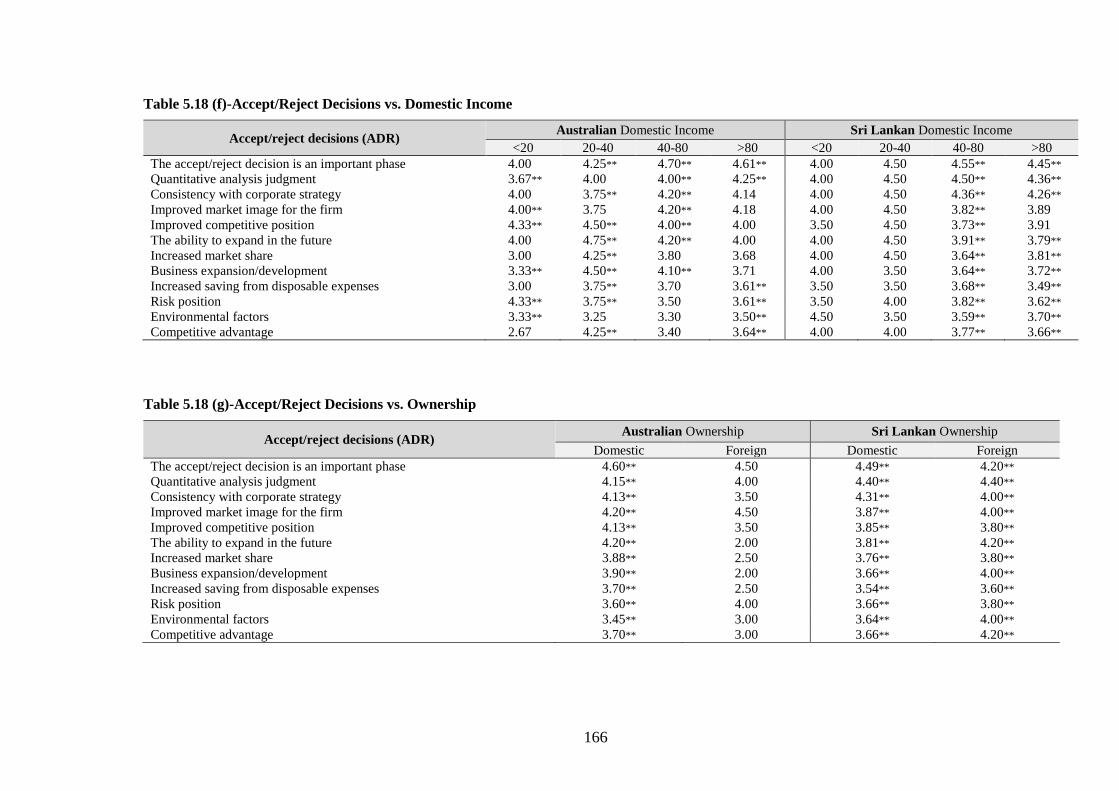
166
Table 5.18 (f)-Accept/Reject Decisions vs. Domestic Income
Accept/reject decisions (ADR) Australian Domestic Income Sri Lankan Domestic Income
<20 20-40 40-80 >80 <20 20-40 40-80 >80
The accept/reject decision is an important phase 4.00 4.25** 4.70** 4.61** 4.00 4.50 4.55** 4.45**
Quantitative analysis judgment 3.67** 4.00 4.00** 4.25** 4.00 4.50 4.50** 4.36**
Consistency with corporate strategy 4.00 3.75** 4.20** 4.14 4.00 4.50 4.36** 4.26**
Improved market image for the firm 4.00** 3.75 4.20** 4.18 4.00 4.50 3.82** 3.89
Improved competitive position 4.33** 4.50** 4.00** 4.00 3.50 4.50 3.73** 3.91
The ability to expand in the future 4.00 4.75** 4.20** 4.00 4.00 4.50 3.91** 3.79**
Increased market share 3.00 4.25** 3.80 3.68 4.00 4.50 3.64** 3.81**
Business expansion/development 3.33** 4.50** 4.10** 3.71 4.00 3.50 3.64** 3.72**
Increased saving from disposable expenses 3.00 3.75** 3.70 3.61** 3.50 3.50 3.68** 3.49**
Risk position 4.33** 3.75** 3.50 3.61** 3.50 4.00 3.82** 3.62**
Environmental factors 3.33** 3.25 3.30 3.50** 4.50 3.50 3.59** 3.70**
Competitive advantage 2.67 4.25** 3.40 3.64** 4.00 4.00 3.77** 3.66**
Table 5.18 (g)-Accept/Reject Decisions vs. Ownership
Accept/reject decisions (ADR) Australian Ownership Sri Lankan Ownership
Domestic Foreign Domestic Foreign
The accept/reject decision is an important phase 4.60** 4.50 4.49** 4.20**
Quantitative analysis judgment 4.15** 4.00 4.40** 4.40**
Consistency with corporate strategy 4.13** 3.50 4.31** 4.00**
Improved market image for the firm 4.20** 4.50 3.87** 4.00**
Improved competitive position 4.13** 3.50 3.85** 3.80**
The ability to expand in the future 4.20** 2.00 3.81** 4.20**
Increased market share 3.88** 2.50 3.76** 3.80**
Business expansion/development 3.90** 2.00 3.66** 4.00**
Increased saving from disposable expenses 3.70** 2.50 3.54** 3.60**
Risk position 3.60** 4.00 3.66** 3.80**
Environmental factors 3.45** 3.00 3.64** 4.00**
Competitive advantage 3.70** 3.00 3.66** 4.20**
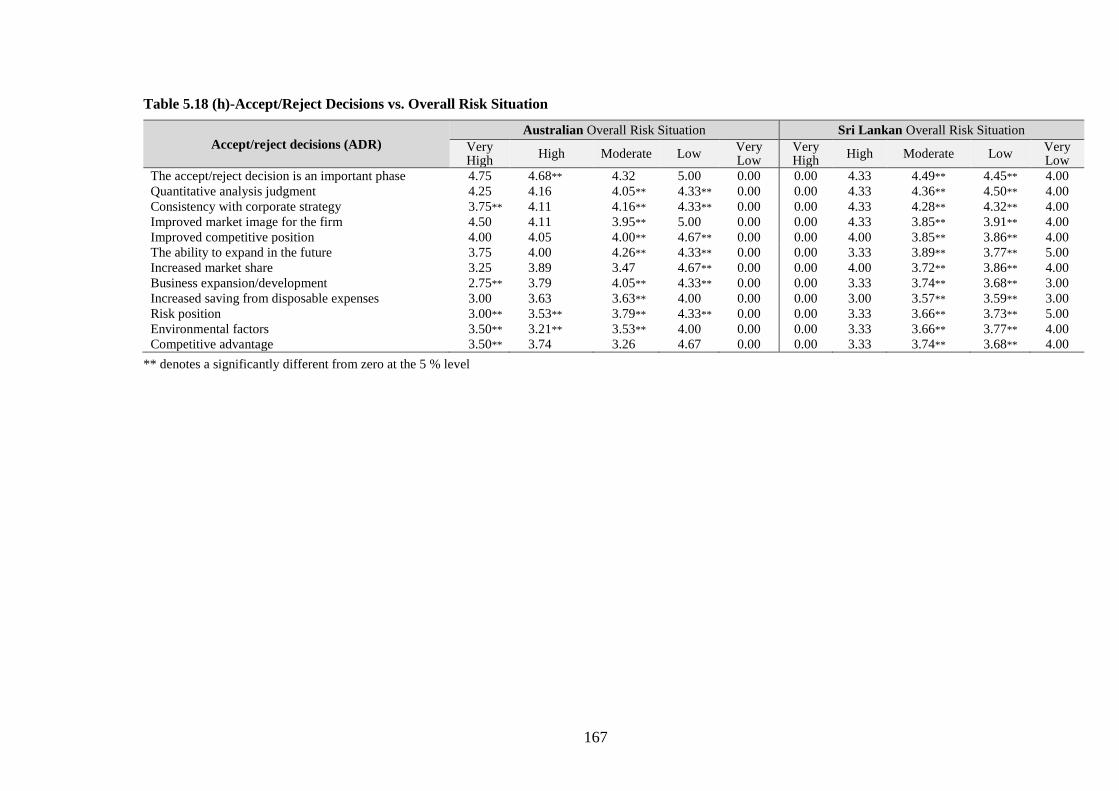
167
Table 5.18 (h)-Accept/Reject Decisions vs. Overall Risk Situation
Accept/reject decisions (ADR) Australian Overall Risk Situation Sri Lankan Overall Risk Situation
Very High
High Moderate Low Very Low
Very High
High Moderate Low Very Low
The accept/reject decision is an important phase 4.75 4.68** 4.32 5.00 0.00 0.00 4.33 4.49** 4.45** 4.00
Quantitative analysis judgment 4.25 4.16 4.05** 4.33** 0.00 0.00 4.33 4.36** 4.50** 4.00
Consistency with corporate strategy 3.75** 4.11 4.16** 4.33** 0.00 0.00 4.33 4.28** 4.32** 4.00
Improved market image for the firm 4.50 4.11 3.95** 5.00 0.00 0.00 4.33 3.85** 3.91** 4.00
Improved competitive position 4.00 4.05 4.00** 4.67** 0.00 0.00 4.00 3.85** 3.86** 4.00
The ability to expand in the future 3.75 4.00 4.26** 4.33** 0.00 0.00 3.33 3.89** 3.77** 5.00
Increased market share 3.25 3.89 3.47 4.67** 0.00 0.00 4.00 3.72** 3.86** 4.00
Business expansion/development 2.75** 3.79 4.05** 4.33** 0.00 0.00 3.33 3.74** 3.68** 3.00
Increased saving from disposable expenses 3.00 3.63 3.63** 4.00 0.00 0.00 3.00 3.57** 3.59** 3.00
Risk position 3.00** 3.53** 3.79** 4.33** 0.00 0.00 3.33 3.66** 3.73** 5.00
Environmental factors 3.50** 3.21** 3.53** 4.00 0.00 0.00 3.33 3.66** 3.77** 4.00
Competitive advantage 3.50** 3.74 3.26 4.67 0.00 0.00 3.33 3.74** 3.68** 4.00
** denotes a significantly different from zero at the 5 % level
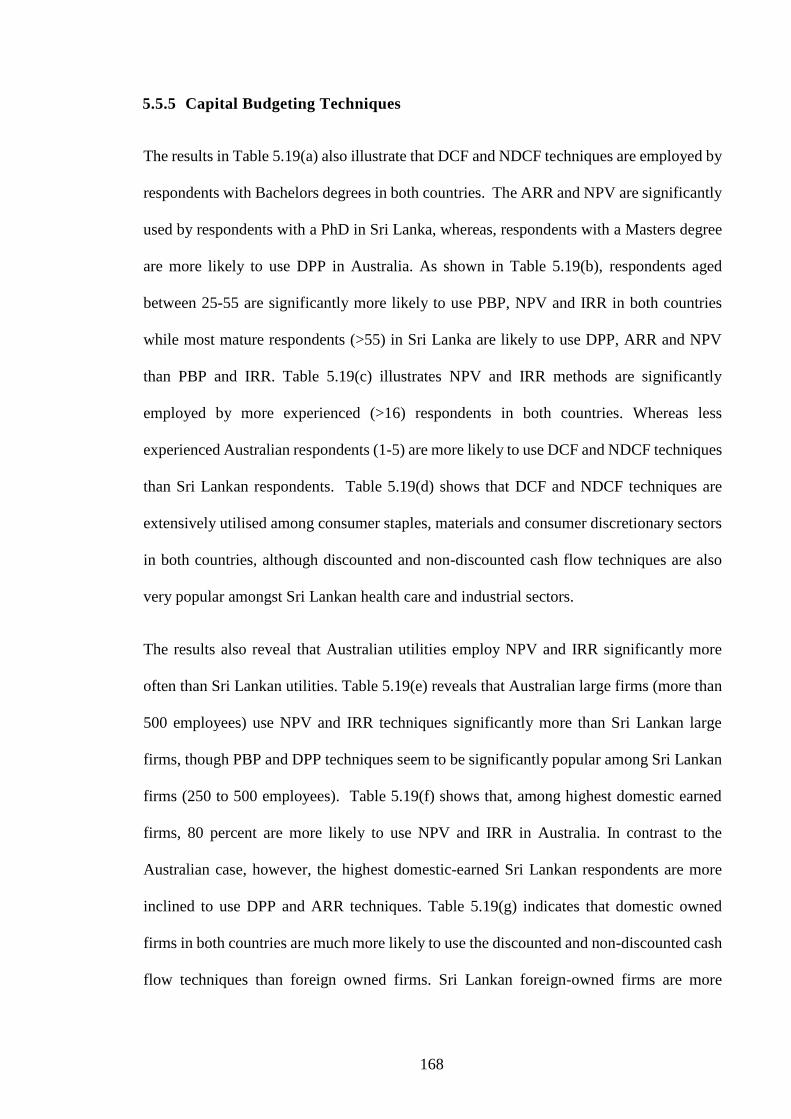
168
5.5.5 Capital Budgeting Techniques
The results in Table 5.19(a) also illustrate that DCF and NDCF techniques are employed by
respondents with Bachelors degrees in both countries. The ARR and NPV are significantly
used by respondents with a PhD in Sri Lanka, whereas, respondents with a Masters degree
are more likely to use DPP in Australia. As shown in Table 5.19(b), respondents aged
between 25-55 are significantly more likely to use PBP, NPV and IRR in both countries
while most mature respondents (>55) in Sri Lanka are likely to use DPP, ARR and NPV
than PBP and IRR. Table 5.19(c) illustrates NPV and IRR methods are significantly
employed by more experienced (>16) respondents in both countries. Whereas less
experienced Australian respondents (1-5) are more likely to use DCF and NDCF techniques
than Sri Lankan respondents. Table 5.19(d) shows that DCF and NDCF techniques are
extensively utilised among consumer staples, materials and consumer discretionary sectors
in both countries, although discounted and non-discounted cash flow techniques are also
very popular amongst Sri Lankan health care and industrial sectors.
The results also reveal that Australian utilities employ NPV and IRR significantly more
often than Sri Lankan utilities. Table 5.19(e) reveals that Australian large firms (more than
500 employees) use NPV and IRR techniques significantly more than Sri Lankan large
firms, though PBP and DPP techniques seem to be significantly popular among Sri Lankan
firms (250 to 500 employees). Table 5.19(f) shows that, among highest domestic earned
firms, 80 percent are more likely to use NPV and IRR in Australia. In contrast to the
Australian case, however, the highest domestic-earned Sri Lankan respondents are more
inclined to use DPP and ARR techniques. Table 5.19(g) indicates that domestic owned
firms in both countries are much more likely to use the discounted and non-discounted cash
flow techniques than foreign owned firms. Sri Lankan foreign-owned firms are more

169
inclined to use the IRR method. Accordingly, Table 5.19(h) shows that high-risk firms in
Australia are significantly stating that they use NPV, IRR and DPP compared to Sri Lankan
high-risk firms. These results note that there seems to be quite some differences with respect
to the use of CB techniques between Sri Lankan low-risk and high-risk firms.
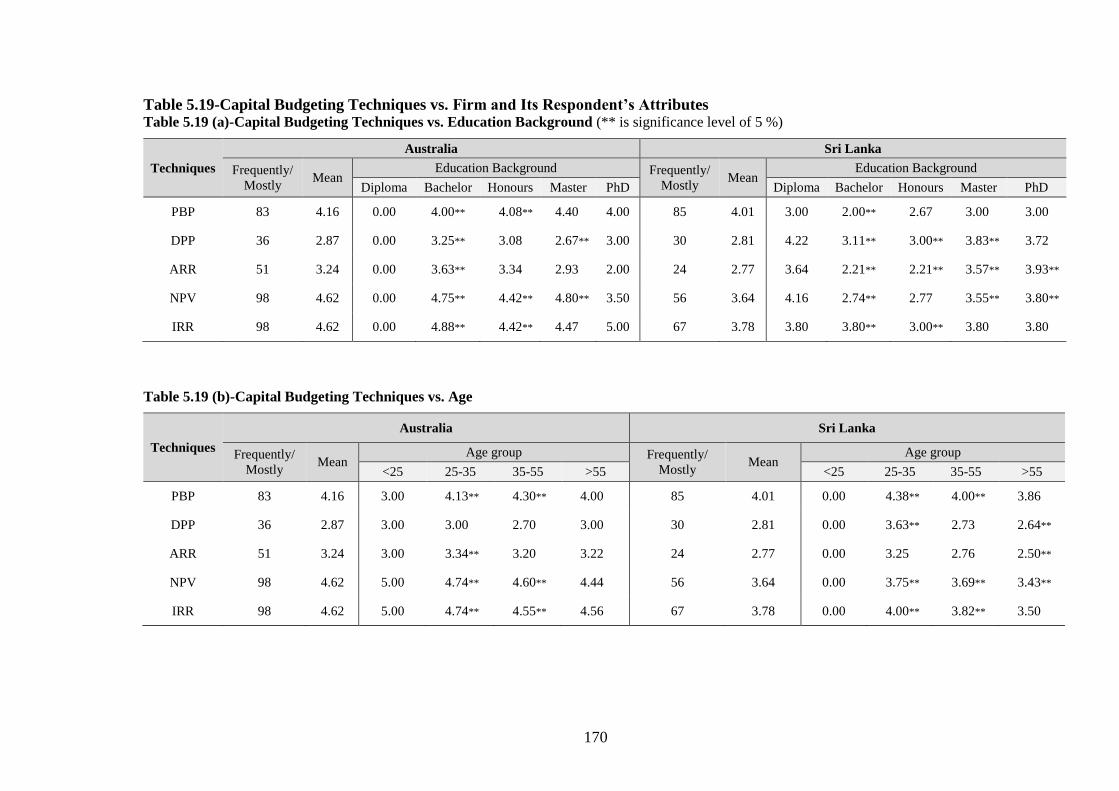
170
Table 5.19-Capital Budgeting Techniques vs. Firm and Its Respondent’s Attributes Table 5.19 (a)-Capital Budgeting Techniques vs. Education Background (** is significance level of 5 %)
Techniques
Australia Sri Lanka
Frequently/
Mostly Mean
Education Background Frequently/
Mostly Mean
Education Background
Diploma Bachelor Honours Master PhD Diploma Bachelor Honours Master PhD
PBP 83 4.16 0.00 4.00** 4.08** 4.40 4.00 85 4.01 3.00 2.00** 2.67 3.00 3.00
DPP 36 2.87 0.00 3.25** 3.08 2.67** 3.00 30 2.81 4.22 3.11** 3.00** 3.83** 3.72
ARR 51 3.24 0.00 3.63** 3.34 2.93 2.00 24 2.77 3.64 2.21** 2.21** 3.57** 3.93**
NPV 98 4.62 0.00 4.75** 4.42** 4.80** 3.50 56 3.64 4.16 2.74** 2.77 3.55** 3.80**
IRR 98 4.62 0.00 4.88** 4.42** 4.47 5.00 67 3.78 3.80 3.80** 3.00** 3.80 3.80
Table 5.19 (b)-Capital Budgeting Techniques vs. Age
Techniques
Australia Sri Lanka
Frequently/
Mostly Mean
Age group Frequently/
Mostly Mean
Age group
<25 25-35 35-55 >55 <25 25-35 35-55 >55
PBP 83 4.16 3.00 4.13** 4.30** 4.00 85 4.01 0.00 4.38** 4.00** 3.86
DPP 36 2.87 3.00 3.00 2.70 3.00 30 2.81 0.00 3.63** 2.73 2.64**
ARR 51 3.24 3.00 3.34** 3.20 3.22 24 2.77 0.00 3.25 2.76 2.50**
NPV 98 4.62 5.00 4.74** 4.60** 4.44 56 3.64 0.00 3.75** 3.69** 3.43**
IRR 98 4.62 5.00 4.74** 4.55** 4.56 67 3.78 0.00 4.00** 3.82** 3.50
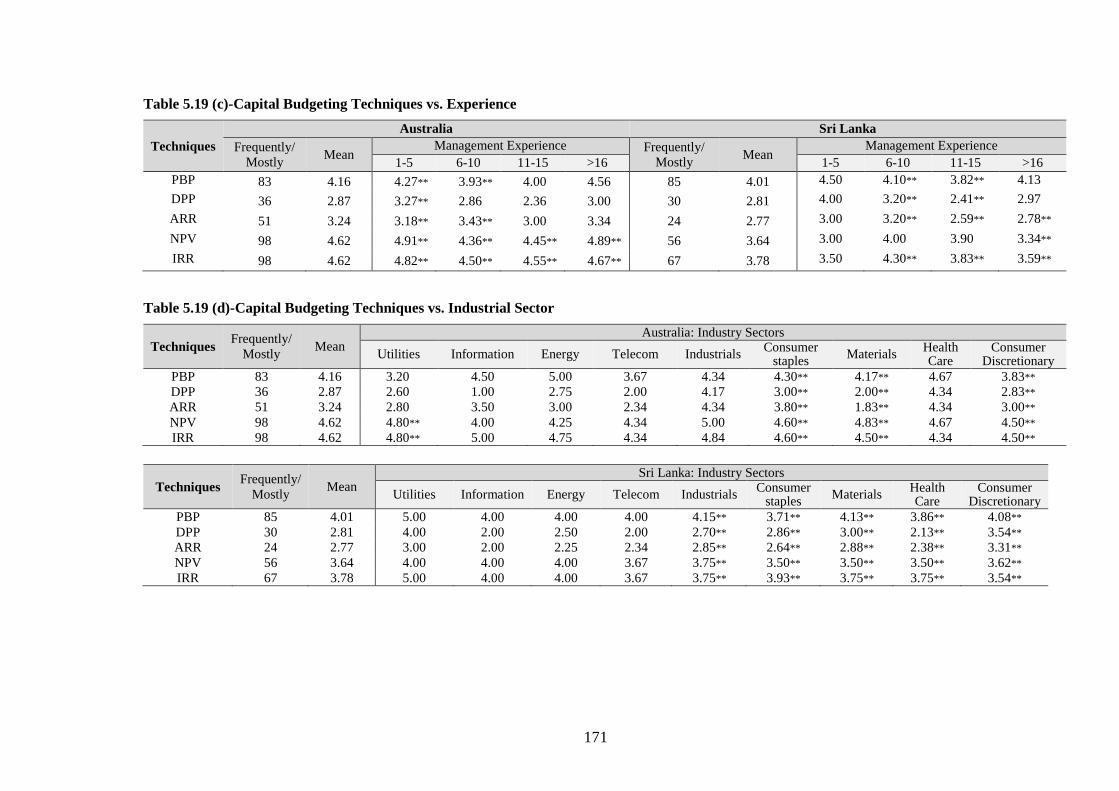
171
Table 5.19 (c)-Capital Budgeting Techniques vs. Experience
Techniques
Australia Sri Lanka
Frequently/
Mostly Mean
Management Experience Frequently/
Mostly Mean
Management Experience
1-5 6-10 11-15 >16 1-5 6-10 11-15 >16
PBP 83 4.16 4.27** 3.93** 4.00 4.56 85 4.01 4.50 4.10** 3.82** 4.13
DPP 36 2.87 3.27** 2.86 2.36 3.00 30 2.81 4.00 3.20** 2.41** 2.97
ARR 51 3.24 3.18** 3.43** 3.00 3.34 24 2.77 3.00 3.20** 2.59** 2.78**
NPV 98 4.62 4.91** 4.36** 4.45** 4.89** 56 3.64 3.00 4.00 3.90 3.34**
IRR 98 4.62 4.82** 4.50** 4.55** 4.67** 67 3.78 3.50 4.30** 3.83** 3.59**
Table 5.19 (d)-Capital Budgeting Techniques vs. Industrial Sector
Techniques Frequently/
Mostly Mean
Australia: Industry Sectors
Utilities Information Energy Telecom Industrials Consumer
staples Materials
Health Care
Consumer Discretionary
PBP 83 4.16 3.20 4.50 5.00 3.67 4.34 4.30** 4.17** 4.67 3.83**
DPP 36 2.87 2.60 1.00 2.75 2.00 4.17 3.00** 2.00** 4.34 2.83**
ARR 51 3.24 2.80 3.50 3.00 2.34 4.34 3.80** 1.83** 4.34 3.00**
NPV 98 4.62 4.80** 4.00 4.25 4.34 5.00 4.60** 4.83** 4.67 4.50**
IRR 98 4.62 4.80** 5.00 4.75 4.34 4.84 4.60** 4.50** 4.34 4.50**
Techniques Frequently/
Mostly Mean
Sri Lanka: Industry Sectors
Utilities Information Energy Telecom Industrials Consumer
staples Materials
Health Care
Consumer Discretionary
PBP 85 4.01 5.00 4.00 4.00 4.00 4.15** 3.71** 4.13** 3.86** 4.08**
DPP 30 2.81 4.00 2.00 2.50 2.00 2.70** 2.86** 3.00** 2.13** 3.54**
ARR 24 2.77 3.00 2.00 2.25 2.34 2.85** 2.64** 2.88** 2.38** 3.31**
NPV 56 3.64 4.00 4.00 4.00 3.67 3.75** 3.50** 3.50** 3.50** 3.62**
IRR 67 3.78 5.00 4.00 4.00 3.67 3.75** 3.93** 3.75** 3.75** 3.54**
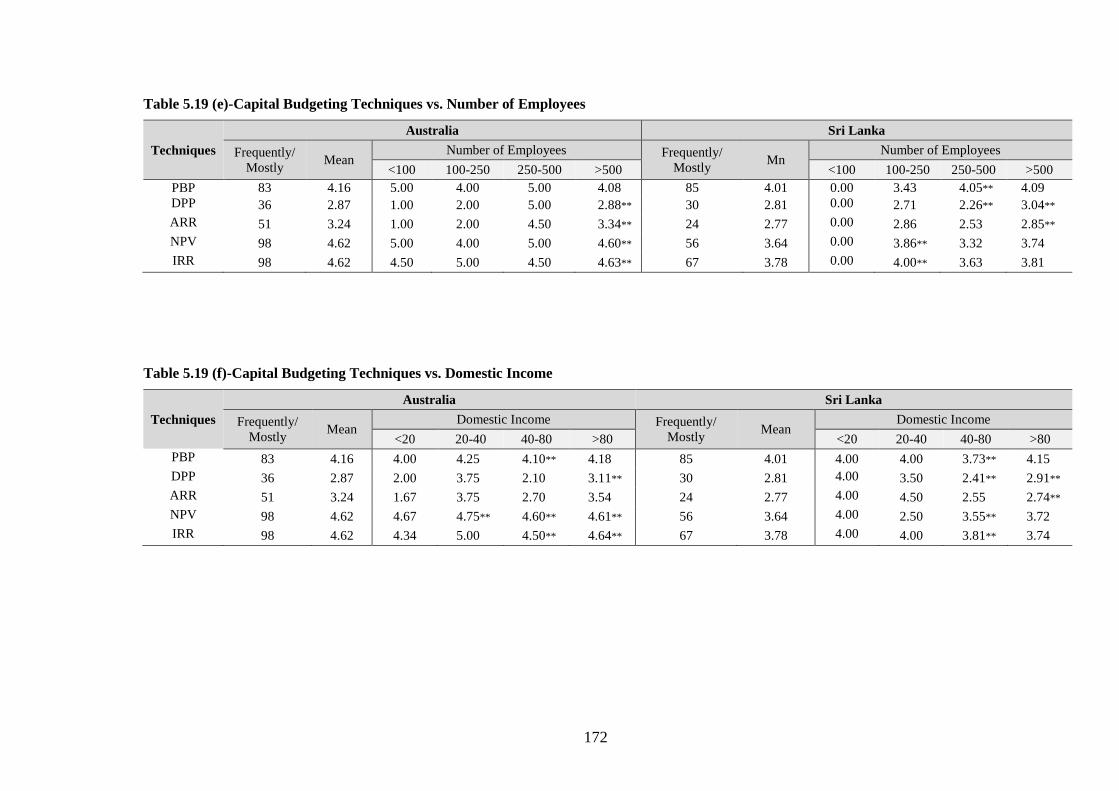
172
Table 5.19 (e)-Capital Budgeting Techniques vs. Number of Employees
Techniques
Australia Sri Lanka
Frequently/
Mostly Mean
Number of Employees Frequently/
Mostly Mn
Number of Employees
<100 100-250 250-500 >500 <100 100-250 250-500 >500
PBP 83 4.16 5.00 4.00 5.00 4.08 85 4.01 0.00 3.43 4.05** 4.09
DPP 36 2.87 1.00 2.00 5.00 2.88** 30 2.81 0.00 2.71 2.26** 3.04**
ARR 51 3.24 1.00 2.00 4.50 3.34** 24 2.77 0.00 2.86 2.53 2.85**
NPV 98 4.62 5.00 4.00 5.00 4.60** 56 3.64 0.00 3.86** 3.32 3.74
IRR 98 4.62 4.50 5.00 4.50 4.63** 67 3.78 0.00 4.00** 3.63 3.81
Table 5.19 (f)-Capital Budgeting Techniques vs. Domestic Income
Techniques
Australia Sri Lanka
Frequently/
Mostly Mean
Domestic Income Frequently/
Mostly Mean
Domestic Income
<20 20-40 40-80 >80 <20 20-40 40-80 >80
PBP 83 4.16 4.00 4.25 4.10** 4.18 85 4.01 4.00 4.00 3.73** 4.15
DPP 36 2.87 2.00 3.75 2.10 3.11** 30 2.81 4.00 3.50 2.41** 2.91**
ARR 51 3.24 1.67 3.75 2.70 3.54 24 2.77 4.00 4.50 2.55 2.74**
NPV 98 4.62 4.67 4.75** 4.60** 4.61** 56 3.64 4.00 2.50 3.55** 3.72
IRR 98 4.62 4.34 5.00 4.50** 4.64** 67 3.78 4.00 4.00 3.81** 3.74
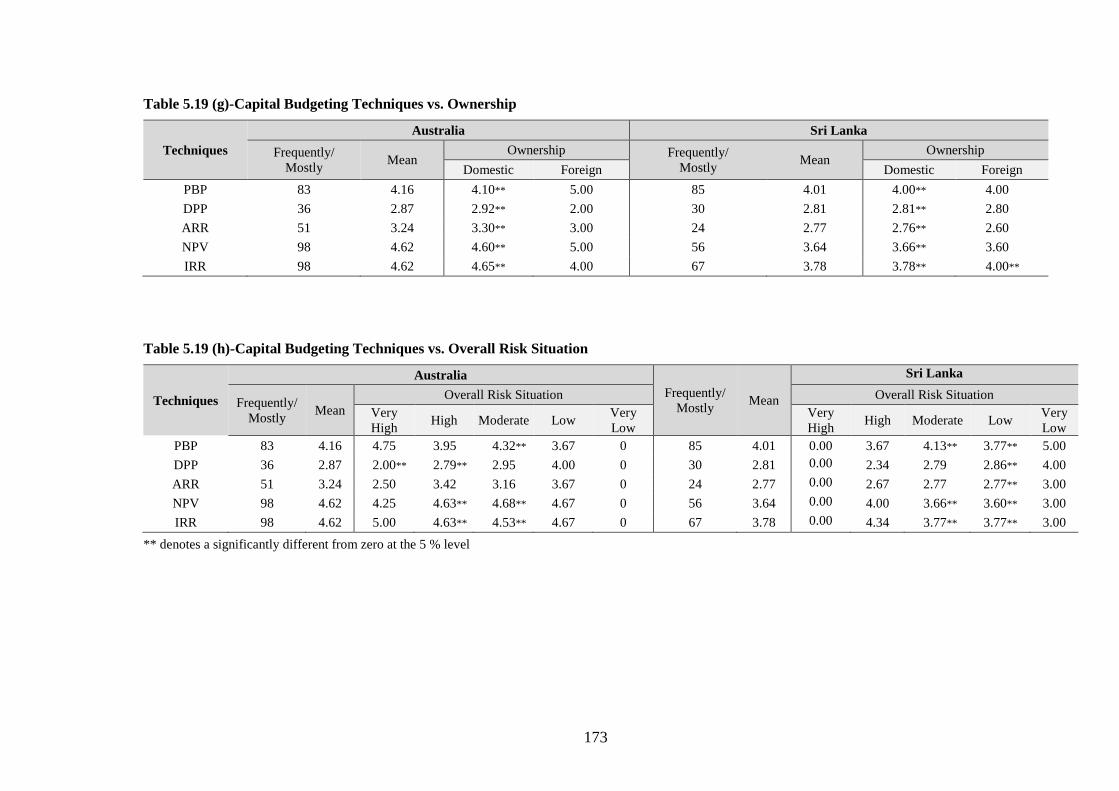
173
Table 5.19 (g)-Capital Budgeting Techniques vs. Ownership
Techniques
Australia Sri Lanka
Frequently/
Mostly Mean
Ownership Frequently/
Mostly Mean
Ownership
Domestic Foreign Domestic Foreign
PBP 83 4.16 4.10** 5.00 85 4.01 4.00** 4.00
DPP 36 2.87 2.92** 2.00 30 2.81 2.81** 2.80
ARR 51 3.24 3.30** 3.00 24 2.77 2.76** 2.60
NPV 98 4.62 4.60** 5.00 56 3.64 3.66** 3.60
IRR 98 4.62 4.65** 4.00 67 3.78 3.78** 4.00**
Table 5.19 (h)-Capital Budgeting Techniques vs. Overall Risk Situation
Techniques
Australia
Frequently/
Mostly Mean
Sri Lanka
Frequently/
Mostly Mean
Overall Risk Situation Overall Risk Situation
Very
High High Moderate Low
Very
Low
Very
High High Moderate Low
Very
Low
PBP 83 4.16 4.75 3.95 4.32** 3.67 0 85 4.01 0.00 3.67 4.13** 3.77** 5.00
DPP 36 2.87 2.00** 2.79** 2.95 4.00 0 30 2.81 0.00 2.34 2.79 2.86** 4.00
ARR 51 3.24 2.50 3.42 3.16 3.67 0 24 2.77 0.00 2.67 2.77 2.77** 3.00
NPV 98 4.62 4.25 4.63** 4.68** 4.67 0 56 3.64 0.00 4.00 3.66** 3.60** 3.00
IRR 98 4.62 5.00 4.63** 4.53** 4.67 0 67 3.78 0.00 4.34 3.77** 3.77** 3.00
** denotes a significantly different from zero at the 5 % level

174
5.5.6 Risk Assessment Techniques
The results in Table 5.20(a) also provides evidence that sensitivity analyses and decision
tree approach and both scenario and decision tree approaches are significantly preferred by
respondents with Bachelors degree in both countries. Whereas, respondents with a Masters
degree are most likely to use probabilistic (Monte Carlo) simulation and risk adjusted
discount rate in both countries. Compared to the Australian respondents with a PhD degree,
Sri Lankan respondents with PhD use probabilistic (Monte Carlo) simulation more often.
Table 5.20(b) reports that the use of a scenario approach and sensitivity analyses are
significantly more popular among 25-35 and 35-55 age groups in Australia while more
mature respondents (>55) are more inclined to use sensitivity analysis, decision tree
approach, probabilistic (Monte Carlo) simulation and risk adjusted discount rate in Sri
Lanka than Australian mature respondents.
Table 5.20(c) noted that the use of a scenario approach, sensitivity analysis, decision tree
approach, probabilistic (Monte Carlo) simulation and risk adjusted discount rate are quite
significant among less experienced (1-5) Australian respondents than less experienced (1-
5) Sri Lankan respondents in terms of their mean values. Whereas highest experience (>16)
Sri Lankan respondents are significantly more likely to use all these risk assessment
techniques. Table 5.20(d) shows that all of these five risk assessment tools are significantly
employed by the consumables, materials and consumer discretionary sectors in both
countries while the risk adjusted discount rate is significantly used by the health care sector
in Australia. Although the scenario approach, the sensitivity analysis and risk adjusted
discount rate are the most prevalent tools among utilities and industrial sectors in Australia.
Table 5.20(e) illustrates that large firms (more than 500 employees) are more inclined to
use a decision tree approach, probabilistic (Monte Carlo) simulation and risk adjusted

175
discount rate as compared to Sri Lankan large companies while the scenario approach seems
to be significantly prevalent among Sri Lankan firms (250-500 employees). Table 5.20(f)
reveals that the highest domestic earned firms (80 percent) are more likely to use decision
tree approach, probabilistic (Monte Carlo) simulation and risk adjusted discount rate in both
countries. Table 5.20(g) indicates that domestic owned firms in both countries are much
more likely to use the all of these risk assessment tools, but Sri Lankan foreign owned firms
are more inclined to use a scenario approach. As shown in Table 5.20(h), high-risk firms
in Australia are significantly stating they use risk adjusted discount rate as compared to Sri
Lankan high-risk firms.
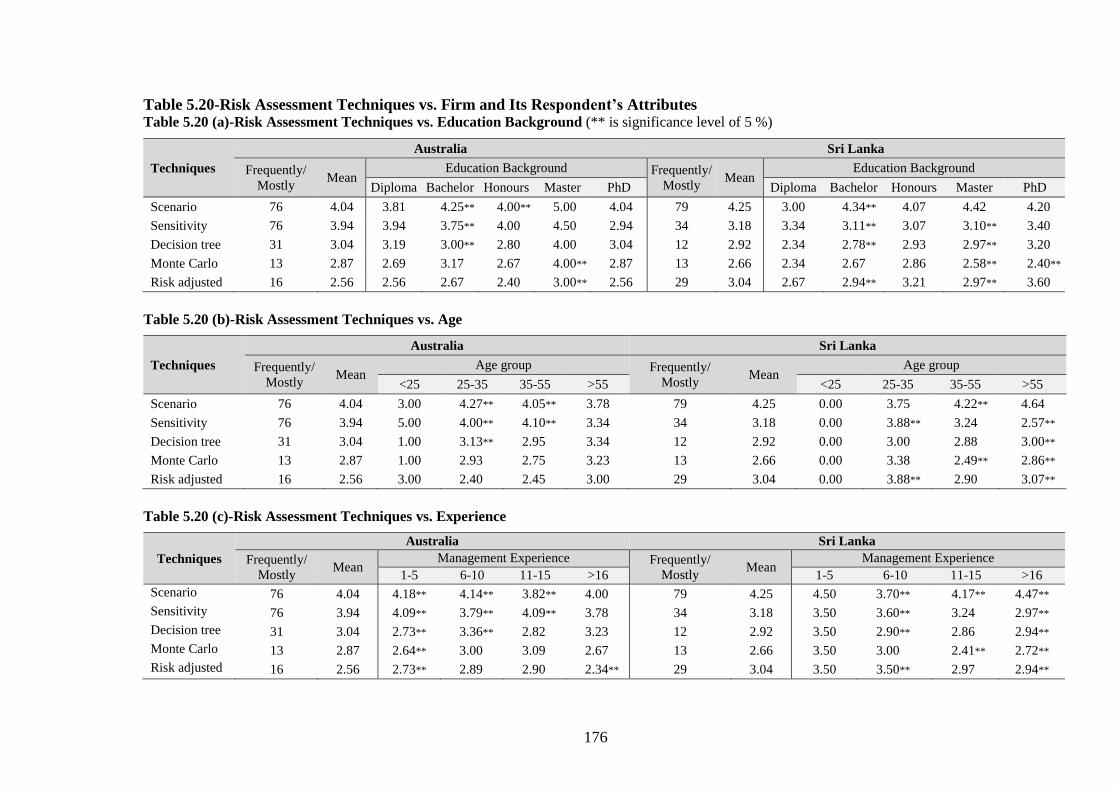
176
Table 5.20-Risk Assessment Techniques vs. Firm and Its Respondent’s Attributes Table 5.20 (a)-Risk Assessment Techniques vs. Education Background (** is significance level of 5 %)
Techniques
Australia Sri Lanka
Frequently/
Mostly Mean
Education Background Frequently/
Mostly Mean
Education Background
Diploma Bachelor Honours Master PhD Diploma Bachelor Honours Master PhD
Scenario 76 4.04 3.81 4.25** 4.00** 5.00 4.04 79 4.25 3.00 4.34** 4.07 4.42 4.20
Sensitivity 76 3.94 3.94 3.75** 4.00 4.50 2.94 34 3.18 3.34 3.11** 3.07 3.10** 3.40
Decision tree 31 3.04 3.19 3.00** 2.80 4.00 3.04 12 2.92 2.34 2.78** 2.93 2.97** 3.20
Monte Carlo 13 2.87 2.69 3.17 2.67 4.00** 2.87 13 2.66 2.34 2.67 2.86 2.58** 2.40**
Risk adjusted 16 2.56 2.56 2.67 2.40 3.00** 2.56 29 3.04 2.67 2.94** 3.21 2.97** 3.60
Table 5.20 (b)-Risk Assessment Techniques vs. Age
Techniques
Australia Sri Lanka
Frequently/
Mostly Mean
Age group Frequently/
Mostly Mean
Age group
<25 25-35 35-55 >55 <25 25-35 35-55 >55
Scenario 76 4.04 3.00 4.27** 4.05** 3.78 79 4.25 0.00 3.75 4.22** 4.64
Sensitivity 76 3.94 5.00 4.00** 4.10** 3.34 34 3.18 0.00 3.88** 3.24 2.57**
Decision tree 31 3.04 1.00 3.13** 2.95 3.34 12 2.92 0.00 3.00 2.88 3.00**
Monte Carlo 13 2.87 1.00 2.93 2.75 3.23 13 2.66 0.00 3.38 2.49** 2.86**
Risk adjusted 16 2.56 3.00 2.40 2.45 3.00 29 3.04 0.00 3.88** 2.90 3.07**
Table 5.20 (c)-Risk Assessment Techniques vs. Experience
Techniques
Australia Sri Lanka
Frequently/
Mostly Mean
Management Experience Frequently/
Mostly Mean
Management Experience
1-5 6-10 11-15 >16 1-5 6-10 11-15 >16
Scenario 76 4.04 4.18** 4.14** 3.82** 4.00 79 4.25 4.50 3.70** 4.17** 4.47**
Sensitivity 76 3.94 4.09** 3.79** 4.09** 3.78 34 3.18 3.50 3.60** 3.24 2.97**
Decision tree 31 3.04 2.73** 3.36** 2.82 3.23 12 2.92 3.50 2.90** 2.86 2.94**
Monte Carlo 13 2.87 2.64** 3.00 3.09 2.67 13 2.66 3.50 3.00 2.41** 2.72**
Risk adjusted 16 2.56 2.73** 2.89 2.90 2.34** 29 3.04 3.50 3.50** 2.97 2.94**
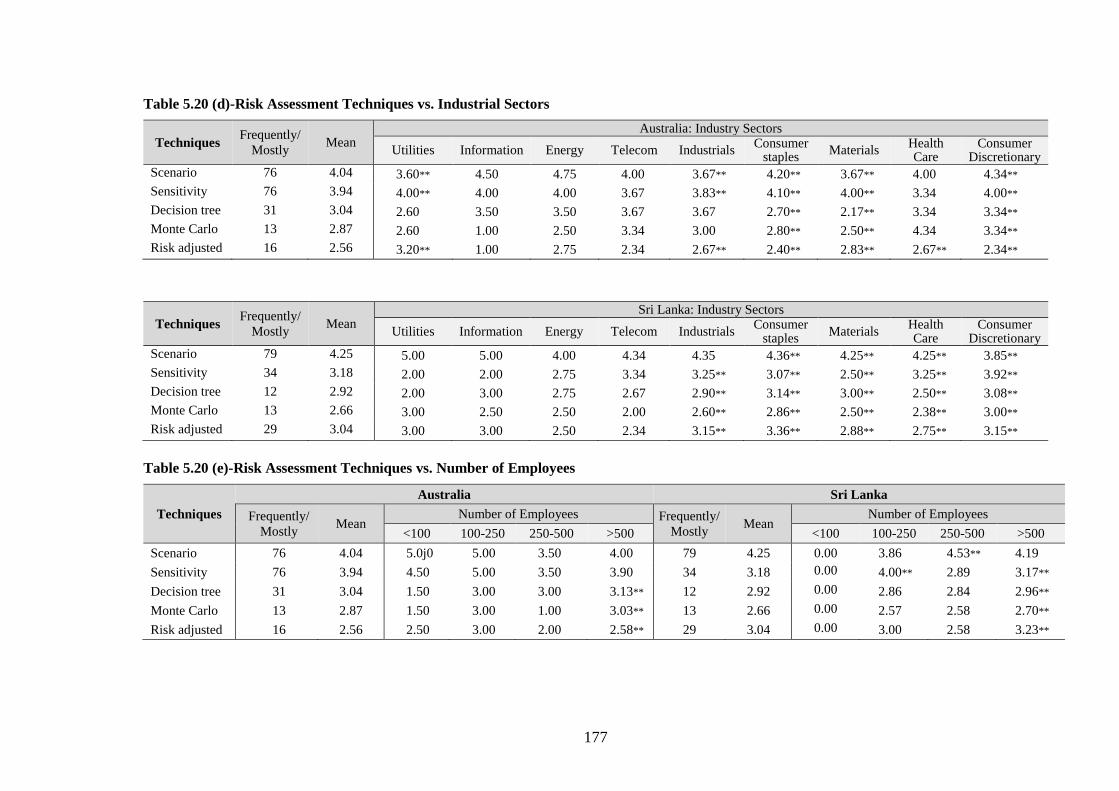
177
Table 5.20 (d)-Risk Assessment Techniques vs. Industrial Sectors
Techniques Frequently/
Mostly Mean
Australia: Industry Sectors
Utilities Information Energy Telecom Industrials Consumer
staples Materials
Health Care
Consumer Discretionary
Scenario 76 4.04 3.60** 4.50 4.75 4.00 3.67** 4.20** 3.67** 4.00 4.34**
Sensitivity 76 3.94 4.00** 4.00 4.00 3.67 3.83** 4.10** 4.00** 3.34 4.00**
Decision tree 31 3.04 2.60 3.50 3.50 3.67 3.67 2.70** 2.17** 3.34 3.34**
Monte Carlo 13 2.87 2.60 1.00 2.50 3.34 3.00 2.80** 2.50** 4.34 3.34**
Risk adjusted 16 2.56 3.20** 1.00 2.75 2.34 2.67** 2.40** 2.83** 2.67** 2.34**
Techniques Frequently/
Mostly Mean
Sri Lanka: Industry Sectors
Utilities Information Energy Telecom Industrials Consumer
staples Materials
Health Care
Consumer Discretionary
Scenario 79 4.25 5.00 5.00 4.00 4.34 4.35 4.36** 4.25** 4.25** 3.85**
Sensitivity 34 3.18 2.00 2.00 2.75 3.34 3.25** 3.07** 2.50** 3.25** 3.92**
Decision tree 12 2.92 2.00 3.00 2.75 2.67 2.90** 3.14** 3.00** 2.50** 3.08**
Monte Carlo 13 2.66 3.00 2.50 2.50 2.00 2.60** 2.86** 2.50** 2.38** 3.00**
Risk adjusted 29 3.04 3.00 3.00 2.50 2.34 3.15** 3.36** 2.88** 2.75** 3.15**
Table 5.20 (e)-Risk Assessment Techniques vs. Number of Employees
Techniques
Australia Sri Lanka
Frequently/
Mostly Mean
Number of Employees Frequently/
Mostly Mean
Number of Employees
<100 100-250 250-500 >500 <100 100-250 250-500 >500
Scenario 76 4.04 5.0j0 5.00 3.50 4.00 79 4.25 0.00 3.86 4.53** 4.19
Sensitivity 76 3.94 4.50 5.00 3.50 3.90 34 3.18 0.00 4.00** 2.89 3.17**
Decision tree 31 3.04 1.50 3.00 3.00 3.13** 12 2.92 0.00 2.86 2.84 2.96**
Monte Carlo 13 2.87 1.50 3.00 1.00 3.03** 13 2.66 0.00 2.57 2.58 2.70**
Risk adjusted 16 2.56 2.50 3.00 2.00 2.58** 29 3.04 0.00 3.00 2.58 3.23**
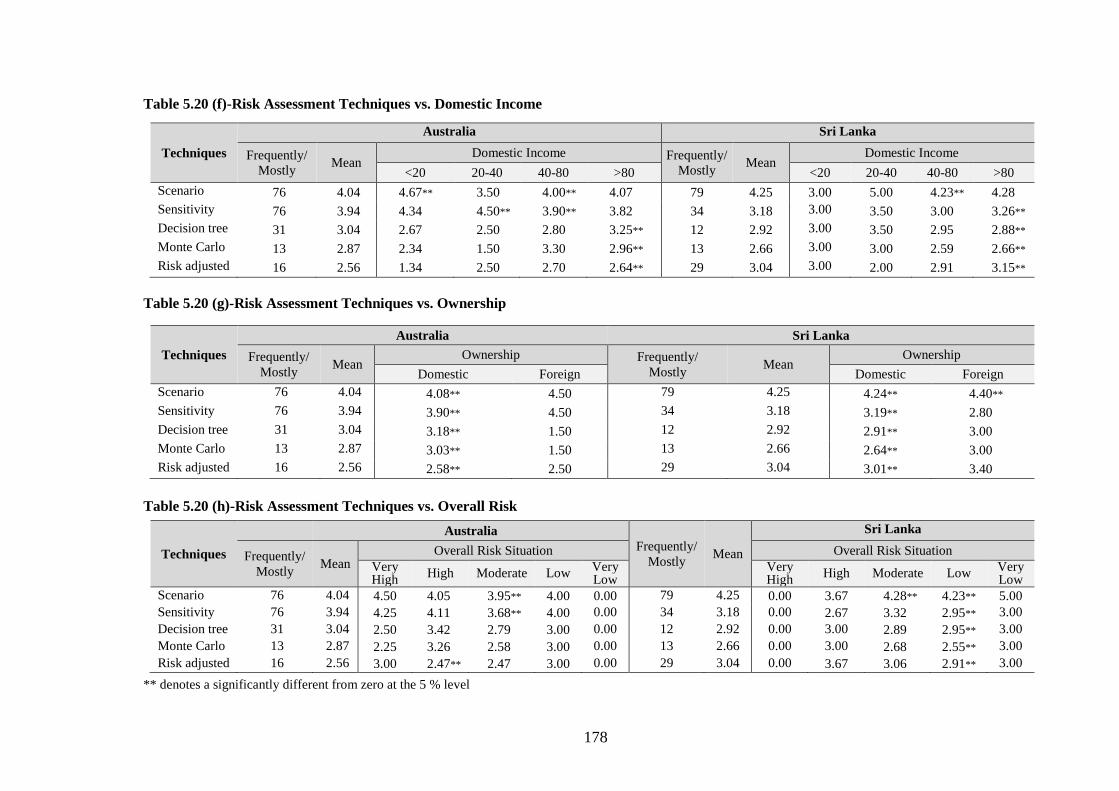
178
Table 5.20 (f)-Risk Assessment Techniques vs. Domestic Income
Table 5.20 (g)-Risk Assessment Techniques vs. Ownership
Table 5.20 (h)-Risk Assessment Techniques vs. Overall Risk
** denotes a significantly different from zero at the 5 % level
Techniques
Australia Sri Lanka
Frequently/
Mostly Mean
Domestic Income Frequently/
Mostly Mean
Domestic Income
<20 20-40 40-80 >80 <20 20-40 40-80 >80
Scenario 76 4.04 4.67** 3.50 4.00** 4.07 79 4.25 3.00 5.00 4.23** 4.28
Sensitivity 76 3.94 4.34 4.50** 3.90** 3.82 34 3.18 3.00 3.50 3.00 3.26**
Decision tree 31 3.04 2.67 2.50 2.80 3.25** 12 2.92 3.00 3.50 2.95 2.88**
Monte Carlo 13 2.87 2.34 1.50 3.30 2.96** 13 2.66 3.00 3.00 2.59 2.66**
Risk adjusted 16 2.56 1.34 2.50 2.70 2.64** 29 3.04 3.00 2.00 2.91 3.15**
Techniques
Australia Sri Lanka
Frequently/
Mostly Mean
Ownership Frequently/
Mostly Mean
Ownership
Domestic Foreign Domestic Foreign
Scenario 76 4.04 4.08** 4.50 79 4.25 4.24** 4.40**
Sensitivity 76 3.94 3.90** 4.50 34 3.18 3.19** 2.80
Decision tree 31 3.04 3.18** 1.50 12 2.92 2.91** 3.00
Monte Carlo 13 2.87 3.03** 1.50 13 2.66 2.64** 3.00
Risk adjusted 16 2.56 2.58** 2.50 29 3.04 3.01** 3.40
Techniques
Australia
Frequently/
Mostly Mean
Sri Lanka
Frequently/
Mostly Mean
Overall Risk Situation Overall Risk Situation
Very High
High Moderate Low Very Low
Very High
High Moderate Low Very Low
Scenario 76 4.04 4.50 4.05 3.95** 4.00 0.00 79 4.25 0.00 3.67 4.28** 4.23** 5.00
Sensitivity 76 3.94 4.25 4.11 3.68** 4.00 0.00 34 3.18 0.00 2.67 3.32 2.95** 3.00 Decision tree 31 3.04 2.50 3.42 2.79 3.00 0.00 12 2.92 0.00 3.00 2.89 2.95** 3.00 Monte Carlo 13 2.87 2.25 3.26 2.58 3.00 0.00 13 2.66 0.00 3.00 2.68 2.55** 3.00 Risk adjusted 16 2.56 3.00 2.47** 2.47 3.00 0.00 29 3.04 0.00 3.67 3.06 2.91** 3.00
179
5.5.7 Cost of Capital
As seen in Table 5.21(a), in Australia, the WACC, CAPM, interest payable on debt capital
and earnings yield on shares are significantly preferred by respondents with a Bachelors
degree while the dividend yield on shares method is more likely to be used by respondents
with a Masters degree. In Sri Lanka, the WACC is preferred by respondents with a
Bachelors degree whilst respondents with a Masters or PhD degree prefer the CAPM. Table
5.21(b) shows young-adult respondents (25-35) prefer to use the WACC, CAPM, and
interest payable on debt capital to estimate the cost of equity capital in Australia and Sri
Lanka. In addition, older respondents (>55) use the earnings yield on shares more often
than other age groups in Australia. In contrast, mature Sri Lankan respondents (>55) are
more likely to use the CAPM, dividend yield on shares and earnings yield on share. Table
5.21(c) suggest that less experienced Australian respondents (1-5) seem to use all these
tools quite often to estimate the cost of equity. Very experienced respondents (>16), in both
countries, seem to prefer to use the dividend yield on shares and earnings yield on shares.
Table 5.21(d) illustrates that the WACC and CAPM are consistently more popular among
firms in the consumables, materials and consumer discretionary markets in Australia and
Sri Lanka—respondents in the health care market in Australia are more likely to use the
earnings yield on shares. In Sri Lanka, all these methods are preferred in the industrials,
consumables, materials, health care and consumer discretionary markets. Table 5.21(e)
shows that the interest payable on debt capital, dividend yield on shares and earnings yield
on share methods are preferred by Australian and Sri Lankan large firms (> 500 employees).
Also, the CAPM and interest payable on debt capital are the methods of choice for large
firms (> 500 employees) as well as for firms with 100-250 employees in Sri Lanka. Table
5.21(f) suggests that highly domestic focused firms prefer the interest payable on debt
180
capital, dividend yield on shares and earnings yield on share methods in both countries. The
WACC and interest payable on debt capital methods are used predominantly by Australian
companies with a 20-40 percent focus on domestic markets and by Sri Lankan firms with
40-80 focus on domestic markets. The results in table 5.21(g), show that domestic owed
companies are more likely to use all these methods than the foreign-owned companies in
both countries. In contrast to Australian firms, however, foreign owned firms in Sri Lanka
are more motivated to use the WACC, dividend yield on shares and earnings yield on share
techniques. As can be seen in Table 5.21(h), high-risk firms are more likely to use the
dividend yield on shares and earnings yield on share methods in Australia than in Sri Lanka.
However, lower-risk Sri Lankan firms are more likely to employ all the techniques than
Australian low-risk firms.
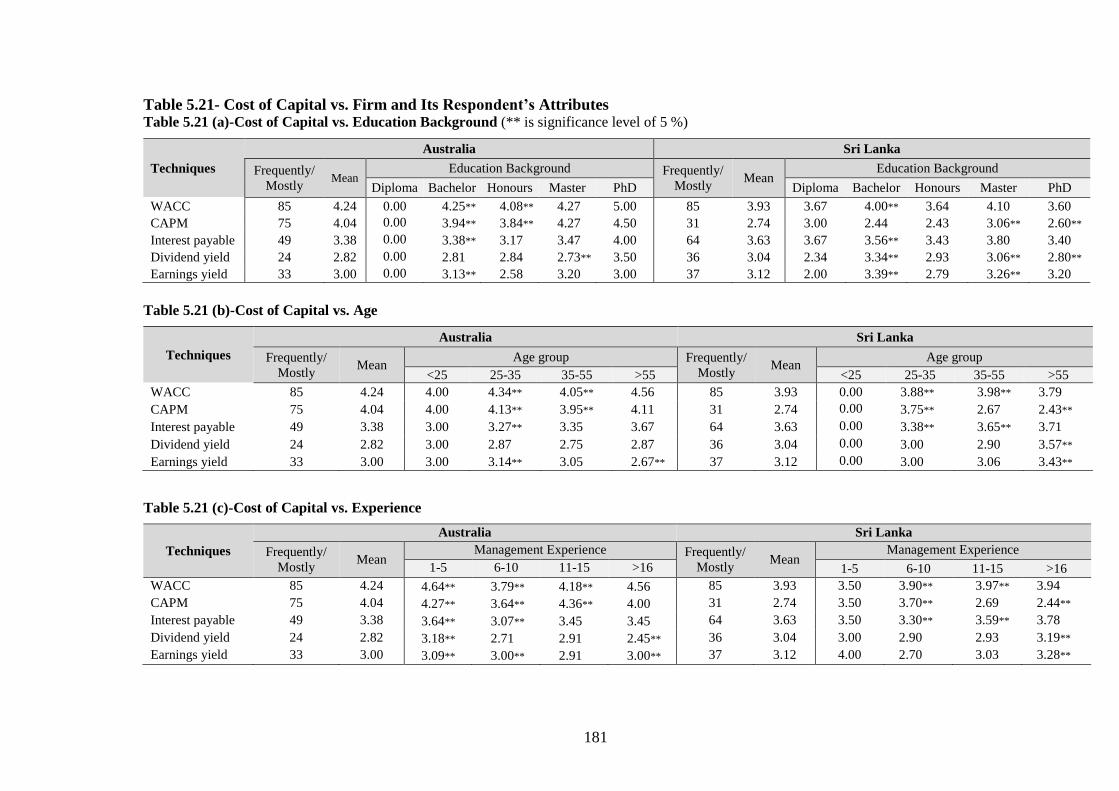
181
Table 5.21- Cost of Capital vs. Firm and Its Respondent’s Attributes Table 5.21 (a)-Cost of Capital vs. Education Background (** is significance level of 5 %)
Techniques
Australia Sri Lanka
Frequently/
Mostly Mean
Education Background Frequently/
Mostly Mean
Education Background
Diploma Bachelor Honours Master PhD Diploma Bachelor Honours Master PhD
WACC 85 4.24 0.00 4.25** 4.08** 4.27 5.00 85 3.93 3.67 4.00** 3.64 4.10 3.60
CAPM 75 4.04 0.00 3.94** 3.84** 4.27 4.50 31 2.74 3.00 2.44 2.43 3.06** 2.60**
Interest payable 49 3.38 0.00 3.38** 3.17 3.47 4.00 64 3.63 3.67 3.56** 3.43 3.80 3.40
Dividend yield 24 2.82 0.00 2.81 2.84 2.73** 3.50 36 3.04 2.34 3.34** 2.93 3.06** 2.80**
Earnings yield 33 3.00 0.00 3.13** 2.58 3.20 3.00 37 3.12 2.00 3.39** 2.79 3.26** 3.20
Table 5.21 (b)-Cost of Capital vs. Age
Techniques
Australia Sri Lanka
Frequently/
Mostly Mean
Age group Frequently/
Mostly Mean
Age group
<25 25-35 35-55 >55 <25 25-35 35-55 >55
WACC 85 4.24 4.00 4.34** 4.05** 4.56 85 3.93 0.00 3.88** 3.98** 3.79
CAPM 75 4.04 4.00 4.13** 3.95** 4.11 31 2.74 0.00 3.75** 2.67 2.43**
Interest payable 49 3.38 3.00 3.27** 3.35 3.67 64 3.63 0.00 3.38** 3.65** 3.71
Dividend yield 24 2.82 3.00 2.87 2.75 2.87 36 3.04 0.00 3.00 2.90 3.57**
Earnings yield 33 3.00 3.00 3.14** 3.05 2.67** 37 3.12 0.00 3.00 3.06 3.43**
Table 5.21 (c)-Cost of Capital vs. Experience
Techniques
Australia Sri Lanka
Frequently/
Mostly Mean
Management Experience Frequently/
Mostly Mean
Management Experience
1-5 6-10 11-15 >16 1-5 6-10 11-15 >16
WACC 85 4.24 4.64** 3.79** 4.18** 4.56 85 3.93 3.50 3.90** 3.97** 3.94
CAPM 75 4.04 4.27** 3.64** 4.36** 4.00 31 2.74 3.50 3.70** 2.69 2.44**
Interest payable 49 3.38 3.64** 3.07** 3.45 3.45 64 3.63 3.50 3.30** 3.59** 3.78
Dividend yield 24 2.82 3.18** 2.71 2.91 2.45** 36 3.04 3.00 2.90 2.93 3.19**
Earnings yield 33 3.00 3.09** 3.00** 2.91 3.00** 37 3.12 4.00 2.70 3.03 3.28**
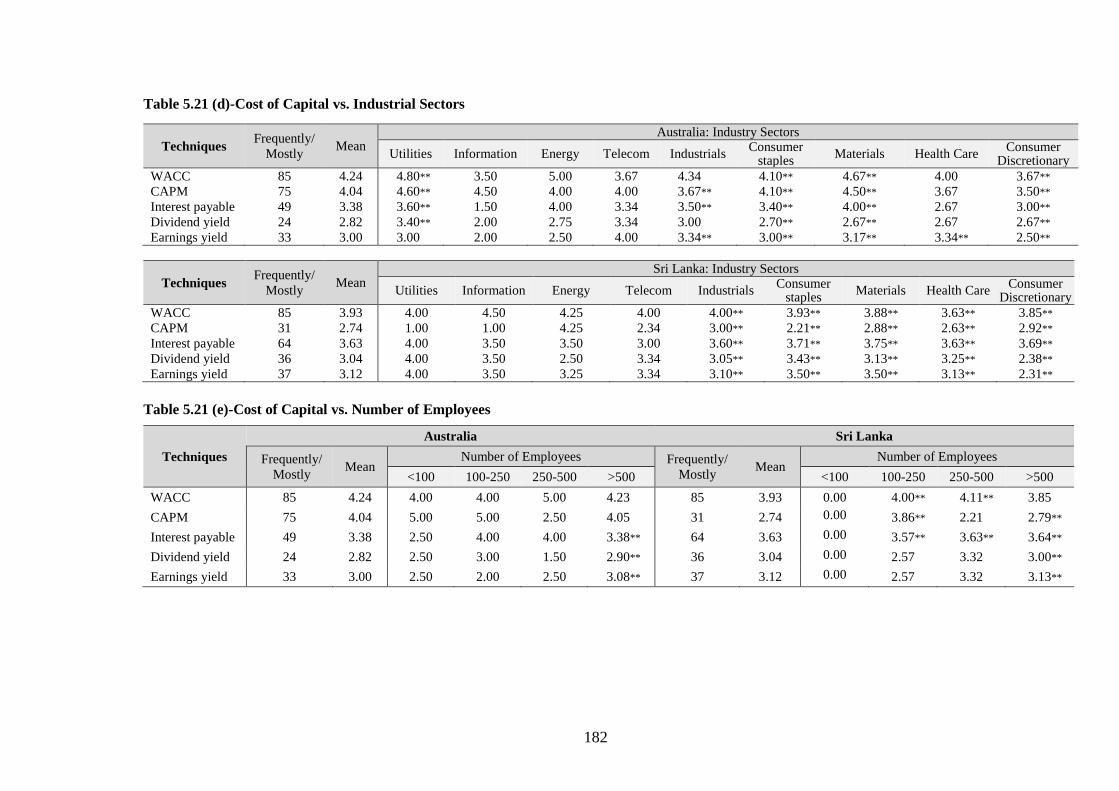
182
Table 5.21 (d)-Cost of Capital vs. Industrial Sectors
Table 5.21 (e)-Cost of Capital vs. Number of Employees
Techniques
Australia Sri Lanka
Frequently/
Mostly Mean
Number of Employees Frequently/
Mostly Mean
Number of Employees
<100 100-250 250-500 >500 <100 100-250 250-500 >500
WACC 85 4.24 4.00 4.00 5.00 4.23 85 3.93 0.00 4.00** 4.11** 3.85
CAPM 75 4.04 5.00 5.00 2.50 4.05 31 2.74 0.00 3.86** 2.21 2.79**
Interest payable 49 3.38 2.50 4.00 4.00 3.38** 64 3.63 0.00 3.57** 3.63** 3.64**
Dividend yield 24 2.82 2.50 3.00 1.50 2.90** 36 3.04 0.00 2.57 3.32 3.00**
Earnings yield 33 3.00 2.50 2.00 2.50 3.08** 37 3.12 0.00 2.57 3.32 3.13**
Techniques Frequently/
Mostly Mean
Australia: Industry Sectors
Utilities Information Energy Telecom Industrials Consumer
staples Materials Health Care
Consumer Discretionary
WACC 85 4.24 4.80** 3.50 5.00 3.67 4.34 4.10** 4.67** 4.00 3.67**
CAPM 75 4.04 4.60** 4.50 4.00 4.00 3.67** 4.10** 4.50** 3.67 3.50**
Interest payable 49 3.38 3.60** 1.50 4.00 3.34 3.50** 3.40** 4.00** 2.67 3.00**
Dividend yield 24 2.82 3.40** 2.00 2.75 3.34 3.00 2.70** 2.67** 2.67 2.67**
Earnings yield 33 3.00 3.00 2.00 2.50 4.00 3.34** 3.00** 3.17** 3.34** 2.50**
Techniques Frequently/
Mostly Mean
Sri Lanka: Industry Sectors
Utilities Information Energy Telecom Industrials Consumer
staples Materials Health Care
Consumer Discretionary
WACC 85 3.93 4.00 4.50 4.25 4.00 4.00** 3.93** 3.88** 3.63** 3.85**
CAPM 31 2.74 1.00 1.00 4.25 2.34 3.00** 2.21** 2.88** 2.63** 2.92**
Interest payable 64 3.63 4.00 3.50 3.50 3.00 3.60** 3.71** 3.75** 3.63** 3.69**
Dividend yield 36 3.04 4.00 3.50 2.50 3.34 3.05** 3.43** 3.13** 3.25** 2.38**
Earnings yield 37 3.12 4.00 3.50 3.25 3.34 3.10** 3.50** 3.50** 3.13** 2.31**
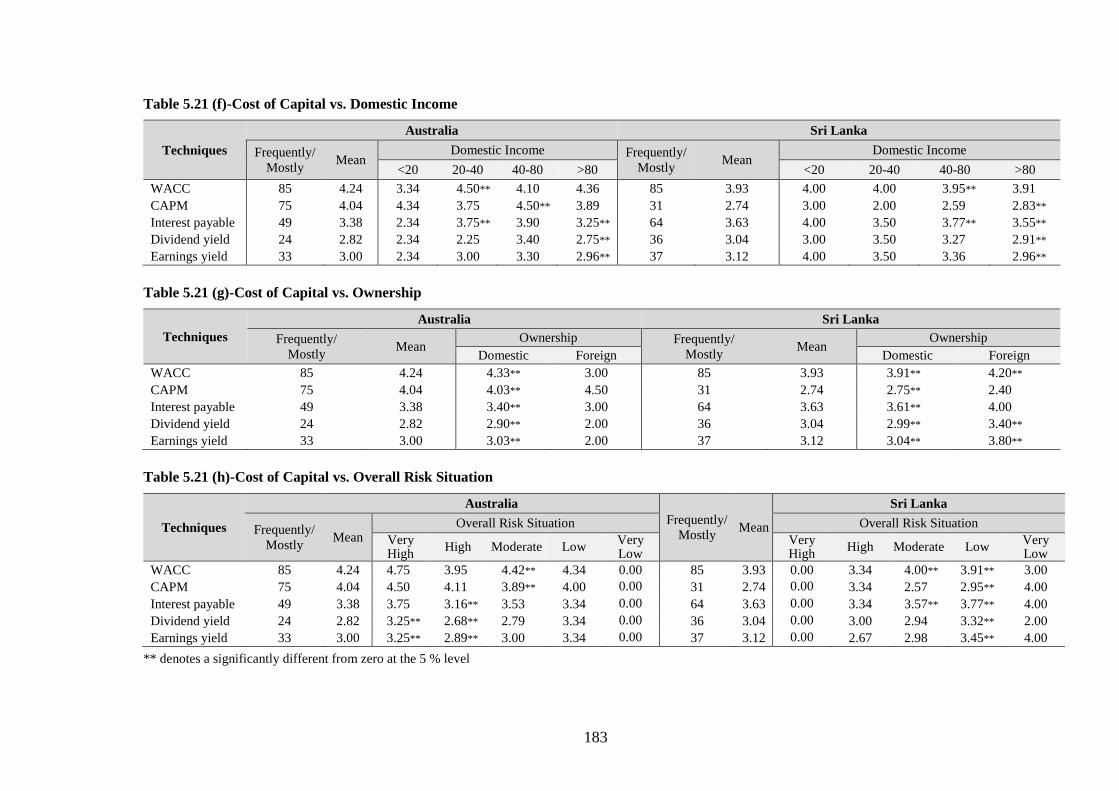
183
Table 5.21 (f)-Cost of Capital vs. Domestic Income
Techniques
Australia Sri Lanka
Frequently/
Mostly Mean
Domestic Income Frequently/
Mostly Mean
Domestic Income
<20 20-40 40-80 >80 <20 20-40 40-80 >80
WACC 85 4.24 3.34 4.50** 4.10 4.36 85 3.93 4.00 4.00 3.95** 3.91
CAPM 75 4.04 4.34 3.75 4.50** 3.89 31 2.74 3.00 2.00 2.59 2.83**
Interest payable 49 3.38 2.34 3.75** 3.90 3.25** 64 3.63 4.00 3.50 3.77** 3.55**
Dividend yield 24 2.82 2.34 2.25 3.40 2.75** 36 3.04 3.00 3.50 3.27 2.91**
Earnings yield 33 3.00 2.34 3.00 3.30 2.96** 37 3.12 4.00 3.50 3.36 2.96**
Table 5.21 (g)-Cost of Capital vs. Ownership
Techniques
Australia Sri Lanka
Frequently/
Mostly Mean
Ownership Frequently/
Mostly Mean
Ownership
Domestic Foreign Domestic Foreign
WACC 85 4.24 4.33** 3.00 85 3.93 3.91** 4.20**
CAPM 75 4.04 4.03** 4.50 31 2.74 2.75** 2.40
Interest payable 49 3.38 3.40** 3.00 64 3.63 3.61** 4.00
Dividend yield 24 2.82 2.90** 2.00 36 3.04 2.99** 3.40**
Earnings yield 33 3.00 3.03** 2.00 37 3.12 3.04** 3.80**
Table 5.21 (h)-Cost of Capital vs. Overall Risk Situation
Techniques
Australia
Frequently/
Mostly Mean
Sri Lanka
Frequently/
Mostly Mean
Overall Risk Situation Overall Risk Situation
Very High
High Moderate Low Very Low
Very High
High Moderate Low Very Low
WACC 85 4.24 4.75 3.95 4.42** 4.34 0.00 85 3.93 0.00 3.34 4.00** 3.91** 3.00
CAPM 75 4.04 4.50 4.11 3.89** 4.00 0.00 31 2.74 0.00 3.34 2.57 2.95** 4.00
Interest payable 49 3.38 3.75 3.16** 3.53 3.34 0.00 64 3.63 0.00 3.34 3.57** 3.77** 4.00
Dividend yield 24 2.82 3.25** 2.68** 2.79 3.34 0.00 36 3.04 0.00 3.00 2.94 3.32** 2.00
Earnings yield 33 3.00 3.25** 2.89** 3.00 3.34 0.00 37 3.12 0.00 2.67 2.98 3.45** 4.00
** denotes a significantly different from zero at the 5 % level
184
5.5.8 Techniques Guide to Long-term-Investment Decision
Table 5.22(a) shows that RO is preferred by respondents with a Bachelors degree in
Australia and in Sri Lanka, all this techniques are preferred by respondents with Master’s
degree. Sri Lankan respondents with a Masters degree appear to prefer using RO analysis.
As shown in Table 5.22(b), RO analysis, game theory and balanced scorecard are used
significantly more often by younger respondents in Australia (25-35) but these techniques
are relatively popular mong mature respondents (>55) in Sri Lanka. Table 5.22(c) shows
that RO analysis is more popular among experienced respondents in Australia, except those
with high experience (>16 years). High experience respondents (> 16 years) appear to rely
more on game theory, balanced score card and value chain in Australia. In Sri Lanka,
respondents who have worked for 6-10 years relied significantly on RO analysis, as
compared to the other respondents. Table 5.22(d) shows that RO, game theory, balanced
score card and value chain are used more by firms in the utilities, consumables, materials
and consumer discretionary markets than firms in other markets. In Sri Lanka, these
methods are favoured by firms in the industrials, consumables, materials, health care and
consumer discretionary markets. Table 5.22(e) shows that large firms in Australia (>500
employees) are more inclined to use the game theory, balanced score card and value chain
than other companies. Also, small Sri Lankan firms (100-250 employees) use RO analysis
more often than Australian small firms. Table 5.22(f) shows that 40-80 percent domestic-
focused firms in Australia use RO analysis significantly more and in Sri Lanka the method
is favoured by firms with over 80 percent domestic sales. Also, Table 5.22(g), domestic-
owned firms are more likely to use all these methods than foreign-owned firms in both
countries. As can be seen in Table 5.22(h), high-risk firms are more likely to use balanced
score card and value chain in Australia than the equivalent firms in Sri Lankan. Low-risk
Sri Lankan firms significantly employ RO analysis as compared to Australian low-risk
firms.
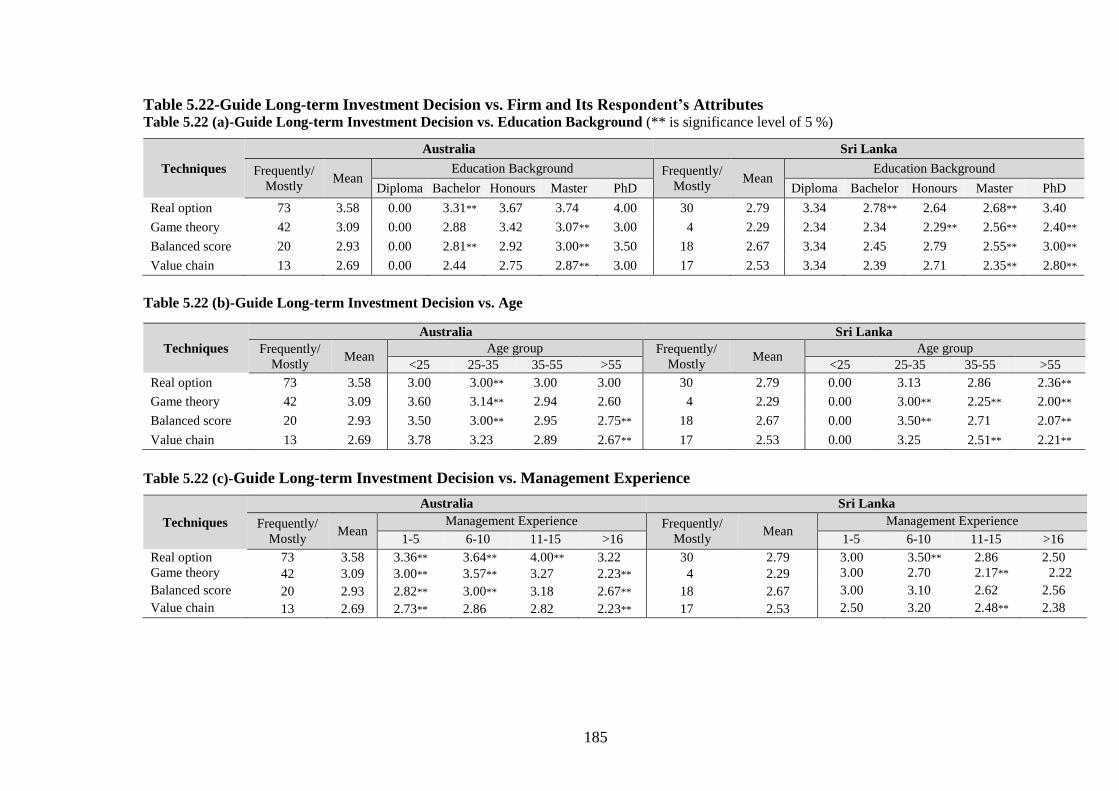
185
Table 5.22-Guide Long-term Investment Decision vs. Firm and Its Respondent’s Attributes Table 5.22 (a)-Guide Long-term Investment Decision vs. Education Background (** is significance level of 5 %)
Techniques
Australia Sri Lanka
Frequently/
Mostly Mean
Education Background Frequently/
Mostly Mean
Education Background
Diploma Bachelor Honours Master PhD Diploma Bachelor Honours Master PhD
Real option 73 3.58 0.00 3.31** 3.67 3.74 4.00 30 2.79 3.34 2.78** 2.64 2.68** 3.40
Game theory 42 3.09 0.00 2.88 3.42 3.07** 3.00 4 2.29 2.34 2.34 2.29** 2.56** 2.40**
Balanced score 20 2.93 0.00 2.81** 2.92 3.00** 3.50 18 2.67 3.34 2.45 2.79 2.55** 3.00**
Value chain 13 2.69 0.00 2.44 2.75 2.87** 3.00 17 2.53 3.34 2.39 2.71 2.35** 2.80**
Table 5.22 (b)-Guide Long-term Investment Decision vs. Age
Table 5.22 (c)-Guide Long-term Investment Decision vs. Management Experience
Techniques
Australia Sri Lanka
Frequently/
Mostly Mean
Management Experience Frequently/
Mostly Mean
Management Experience
1-5 6-10 11-15 >16 1-5 6-10 11-15 >16
Real option 73 3.58 3.36** 3.64** 4.00** 3.22 30 2.79 3.00 3.50** 2.86 2.50
Game theory 42 3.09 3.00** 3.57** 3.27 2.23** 4 2.29 3.00 2.70 2.17** 2.22
Balanced score 20 2.93 2.82** 3.00** 3.18 2.67** 18 2.67 3.00 3.10 2.62 2.56
Value chain 13 2.69 2.73** 2.86 2.82 2.23** 17 2.53 2.50 3.20 2.48** 2.38
Techniques
Australia Sri Lanka
Frequently/
Mostly Mean
Age group Frequently/
Mostly Mean
Age group
<25 25-35 35-55 >55 <25 25-35 35-55 >55
Real option 73 3.58 3.00 3.00** 3.00 3.00 30 2.79 0.00 3.13 2.86 2.36**
Game theory 42 3.09 3.60 3.14** 2.94 2.60 4 2.29 0.00 3.00** 2.25** 2.00**
Balanced score 20 2.93 3.50 3.00** 2.95 2.75** 18 2.67 0.00 3.50** 2.71 2.07**
Value chain 13 2.69 3.78 3.23 2.89 2.67** 17 2.53 0.00 3.25 2.51** 2.21**
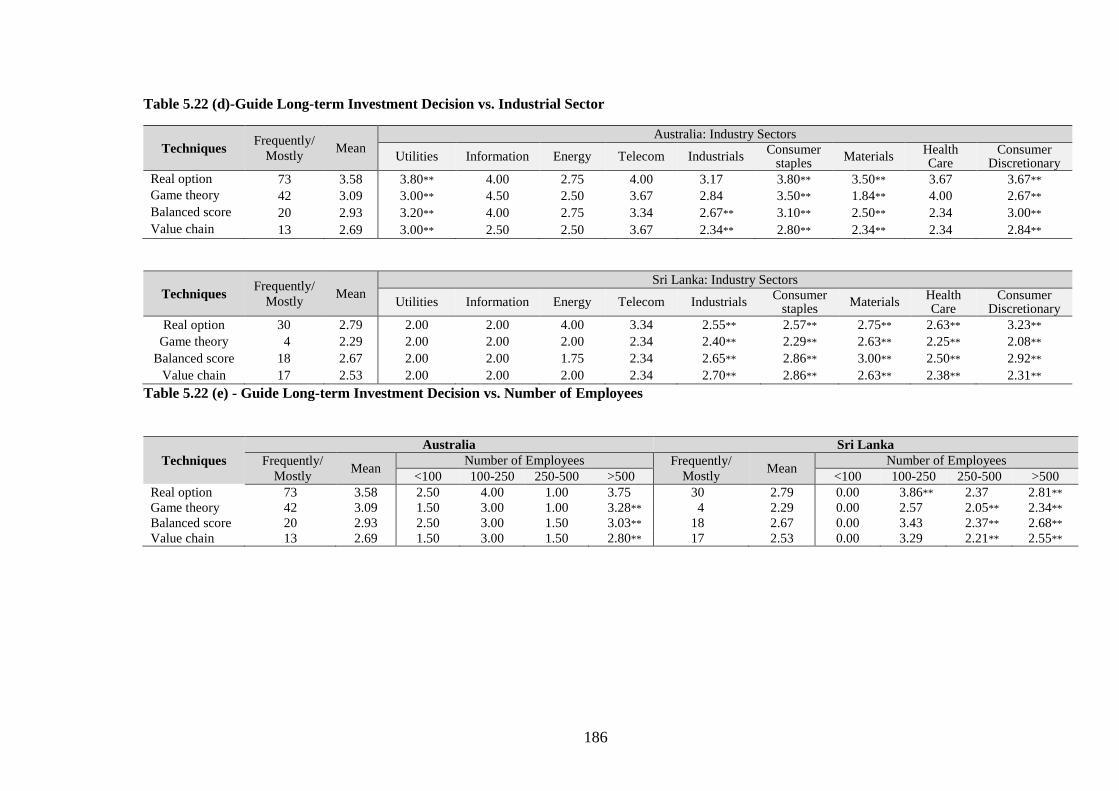
186
Table 5.22 (d)-Guide Long-term Investment Decision vs. Industrial Sector
Techniques Frequently/
Mostly Mean
Australia: Industry Sectors
Utilities Information Energy Telecom Industrials Consumer
staples Materials
Health Care
Consumer Discretionary
Real option 73 3.58 3.80** 4.00 2.75 4.00 3.17 3.80** 3.50** 3.67 3.67**
Game theory 42 3.09 3.00** 4.50 2.50 3.67 2.84 3.50** 1.84** 4.00 2.67**
Balanced score 20 2.93 3.20** 4.00 2.75 3.34 2.67** 3.10** 2.50** 2.34 3.00**
Value chain 13 2.69 3.00** 2.50 2.50 3.67 2.34** 2.80** 2.34** 2.34 2.84**
Table 5.22 (e) - Guide Long-term Investment Decision vs. Number of Employees
Techniques Frequently/
Mostly Mean
Sri Lanka: Industry Sectors
Utilities Information Energy Telecom Industrials Consumer
staples Materials
Health Care
Consumer Discretionary
Real option 30 2.79 2.00 2.00 4.00 3.34 2.55** 2.57** 2.75** 2.63** 3.23**
Game theory 4 2.29 2.00 2.00 2.00 2.34 2.40** 2.29** 2.63** 2.25** 2.08**
Balanced score 18 2.67 2.00 2.00 1.75 2.34 2.65** 2.86** 3.00** 2.50** 2.92**
Value chain 17 2.53 2.00 2.00 2.00 2.34 2.70** 2.86** 2.63** 2.38** 2.31**
Techniques
Australia Sri Lanka
Frequently/
Mostly Mean
Number of Employees Frequently/
Mostly Mean
Number of Employees
<100 100-250 250-500 >500 <100 100-250 250-500 >500
Real option 73 3.58 2.50 4.00 1.00 3.75 30 2.79 0.00 3.86** 2.37 2.81**
Game theory 42 3.09 1.50 3.00 1.00 3.28** 4 2.29 0.00 2.57 2.05** 2.34**
Balanced score 20 2.93 2.50 3.00 1.50 3.03** 18 2.67 0.00 3.43 2.37** 2.68**
Value chain 13 2.69 1.50 3.00 1.50 2.80** 17 2.53 0.00 3.29 2.21** 2.55**
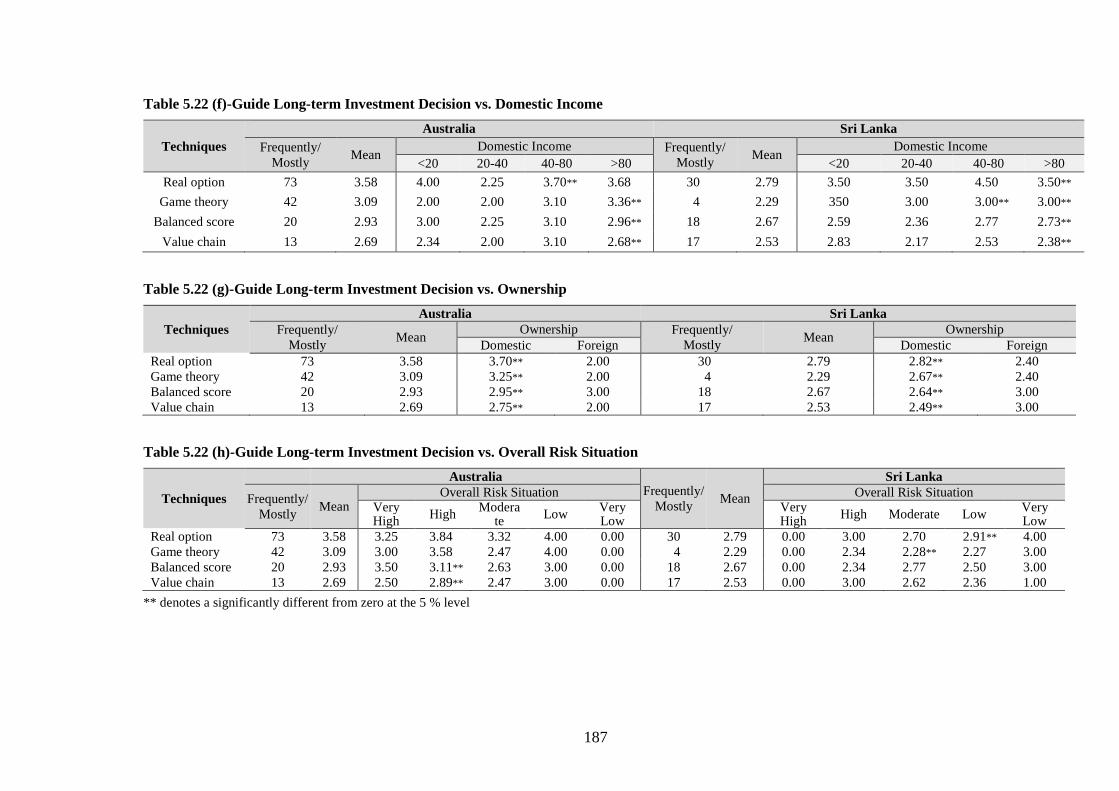
187
Table 5.22 (f)-Guide Long-term Investment Decision vs. Domestic Income
Techniques
Australia Sri Lanka
Frequently/
Mostly Mean
Domestic Income Frequently/
Mostly Mean
Domestic Income
<20 20-40 40-80 >80 <20 20-40 40-80 >80
Real option 73 3.58 4.00 2.25 3.70** 3.68 30 2.79 3.50 3.50 4.50 3.50**
Game theory 42 3.09 2.00 2.00 3.10 3.36** 4 2.29 350 3.00 3.00** 3.00**
Balanced score 20 2.93 3.00 2.25 3.10 2.96** 18 2.67 2.59 2.36 2.77 2.73**
Value chain 13 2.69 2.34 2.00 3.10 2.68** 17 2.53 2.83 2.17 2.53 2.38**
Table 5.22 (g)-Guide Long-term Investment Decision vs. Ownership
Techniques
Australia Sri Lanka
Frequently/
Mostly Mean
Ownership Frequently/
Mostly Mean
Ownership
Domestic Foreign Domestic Foreign
Real option 73 3.58 3.70** 2.00 30 2.79 2.82** 2.40
Game theory 42 3.09 3.25** 2.00 4 2.29 2.67** 2.40
Balanced score 20 2.93 2.95** 3.00 18 2.67 2.64** 3.00
Value chain 13 2.69 2.75** 2.00 17 2.53 2.49** 3.00
Table 5.22 (h)-Guide Long-term Investment Decision vs. Overall Risk Situation
Techniques
Australia Frequently/
Mostly Mean
Sri Lanka
Frequently/
Mostly Mean
Overall Risk Situation Overall Risk Situation Very High
High Modera
te Low
Very Low
Very High
High Moderate Low Very Low
Real option 73 3.58 3.25 3.84 3.32 4.00 0.00 30 2.79 0.00 3.00 2.70 2.91** 4.00
Game theory 42 3.09 3.00 3.58 2.47 4.00 0.00 4 2.29 0.00 2.34 2.28** 2.27 3.00
Balanced score 20 2.93 3.50 3.11** 2.63 3.00 0.00 18 2.67 0.00 2.34 2.77 2.50 3.00
Value chain 13 2.69 2.50 2.89** 2.47 3.00 0.00 17 2.53 0.00 3.00 2.62 2.36 1.00
** denotes a significantly different from zero at the 5 % level
188
5.5.9 Implementation
The respondents were asked to express their opinion on implementation as a phase to the
CB process when analysing investments. Table 5.23(a) shows that the implementation
phase was preferred by Australian respondents with a Bachelors degree than those with
other degrees. In Sri Lanka, respondents with all levels of education are more inclined to
agree that implementation is a significant phase in the CB process. In Sri Lanka, all the
implementation practices are more likely to be considered by respondents with a
Bachelors/Honours degree whereas this is only true for respondents with a Bachelors
degree in Australia. In Table 5.23(b) all these implementation practices are favoured by
young adults (25-35) and middle age (35-55) respondents throughout Australia and Sri
Lanka. Table 5.23(c) shows that implementation practices are favoured by respondents with
1-10 years of experienced, other respondents in Australia. In Sri Lanka, the respondents
with 6-15 years of experienced are most favourable. The more experienced (>16)
Australian respondents have a more favourable impression of their firm’s review
implementation procedures and top management’s involvement in all aspects of the
implementation and evaluation process. Table 5.23(d) reveals that all the implementation
practices are well used by firms in the utilities, consumables, material and industrial
markets in Australia and similar results were found in Sri Lanka for firms in the industrial,
consumables, material, health care, consumer discretionary markets. Firms in the
Australian energy market are significantly more likely to consider the establishment of an
implementation plan and the assignment of a project team when the investment decision is
made. As shown in Table 5.23(e), the small (100-250 employees) and medium size firms
(250-500 employees) are more likely to agree with these implementation practices. In
contrast to Sri Lankan firms, large Australian firms are more inclined to consider all of
these practices except the establishment of an implementation plan and the assignment of
189
a project team when the investment decision is made and when developing implementation
strategies, consideration is given to the barriers to implementation activities. In table
5.23(f), highest domestic-focused Sri Lankan firms (40-80 percent) are more likely to apply
all these practices more often, than other firms, whereas, the highest domestic-focused
Australian firms were neutral or against the notions that: 1) the firm reviews implementation
procedures each year, when developing implementation strategies; 2) consideration is
given to the barriers to implementation activities; 3) implementation mechanisms heavily
influence the corporate framework; and 4) the implementation phase is scrutinised by
examining risk analysis and alternative cash estimations. As shown in Table 5.23(g),
Australian domestic-owned firms significantly agreed on implementation practices than
foreign owned Australian firms. In Sri Lanka, domestic-owned and foreign-owned firms
both significantly agreed. Table 5.23(h) illustrates that moderate risk firms from Australia
and Sri Lanka are more motivated to consent to these implementation practices. In addition,
the implementation practices of the lower-risk firms in Sri Lanka are higher than those for
the lower-risk Australian firms.
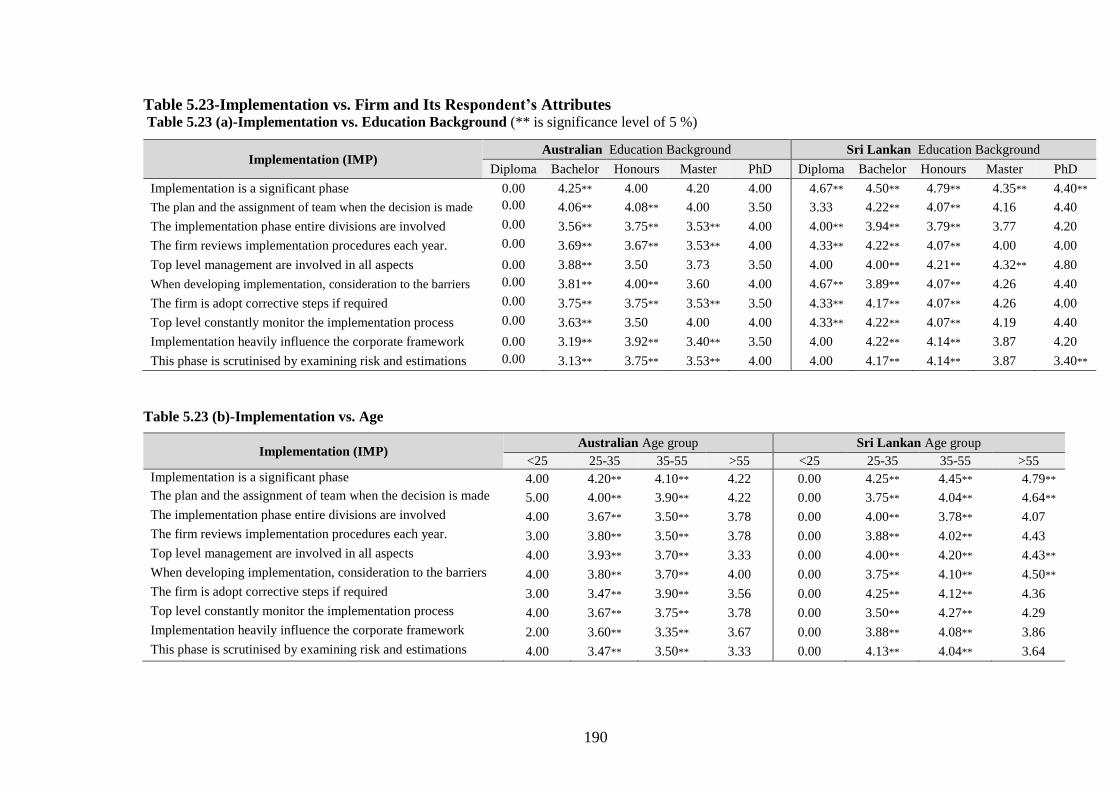
190
Table 5.23-Implementation vs. Firm and Its Respondent’s Attributes Table 5.23 (a)-Implementation vs. Education Background (** is significance level of 5 %)
Table 5.23 (b)-Implementation vs. Age
Implementation (IMP) Australian Age group Sri Lankan Age group
<25 25-35 35-55 >55 <25 25-35 35-55 >55
Implementation is a significant phase 4.00 4.20** 4.10** 4.22 0.00 4.25** 4.45** 4.79**
The plan and the assignment of team when the decision is made 5.00 4.00** 3.90** 4.22 0.00 3.75** 4.04** 4.64**
The implementation phase entire divisions are involved 4.00 3.67** 3.50** 3.78 0.00 4.00** 3.78** 4.07
The firm reviews implementation procedures each year. 3.00 3.80** 3.50** 3.78 0.00 3.88** 4.02** 4.43
Top level management are involved in all aspects 4.00 3.93** 3.70** 3.33 0.00 4.00** 4.20** 4.43**
When developing implementation, consideration to the barriers 4.00 3.80** 3.70** 4.00 0.00 3.75** 4.10** 4.50**
The firm is adopt corrective steps if required 3.00 3.47** 3.90** 3.56 0.00 4.25** 4.12** 4.36
Top level constantly monitor the implementation process 4.00 3.67** 3.75** 3.78 0.00 3.50** 4.27** 4.29
Implementation heavily influence the corporate framework 2.00 3.60** 3.35** 3.67 0.00 3.88** 4.08** 3.86
This phase is scrutinised by examining risk and estimations 4.00 3.47** 3.50** 3.33 0.00 4.13** 4.04** 3.64
Implementation (IMP) Australian Education Background Sri Lankan Education Background
Diploma Bachelor Honours Master PhD Diploma Bachelor Honours Master PhD
Implementation is a significant phase 0.00 4.25** 4.00 4.20 4.00 4.67** 4.50** 4.79** 4.35** 4.40**
The plan and the assignment of team when the decision is made 0.00 4.06** 4.08** 4.00 3.50 3.33 4.22** 4.07** 4.16 4.40
The implementation phase entire divisions are involved 0.00 3.56** 3.75** 3.53** 4.00 4.00** 3.94** 3.79** 3.77 4.20
The firm reviews implementation procedures each year. 0.00 3.69** 3.67** 3.53** 4.00 4.33** 4.22** 4.07** 4.00 4.00
Top level management are involved in all aspects 0.00 3.88** 3.50 3.73 3.50 4.00 4.00** 4.21** 4.32** 4.80
When developing implementation, consideration to the barriers 0.00 3.81** 4.00** 3.60 4.00 4.67** 3.89** 4.07** 4.26 4.40
The firm is adopt corrective steps if required 0.00 3.75** 3.75** 3.53** 3.50 4.33** 4.17** 4.07** 4.26 4.00
Top level constantly monitor the implementation process 0.00 3.63** 3.50 4.00 4.00 4.33** 4.22** 4.07** 4.19 4.40
Implementation heavily influence the corporate framework 0.00 3.19** 3.92** 3.40** 3.50 4.00 4.22** 4.14** 3.87 4.20
This phase is scrutinised by examining risk and estimations 0.00 3.13** 3.75** 3.53** 4.00 4.00 4.17** 4.14** 3.87 3.40**
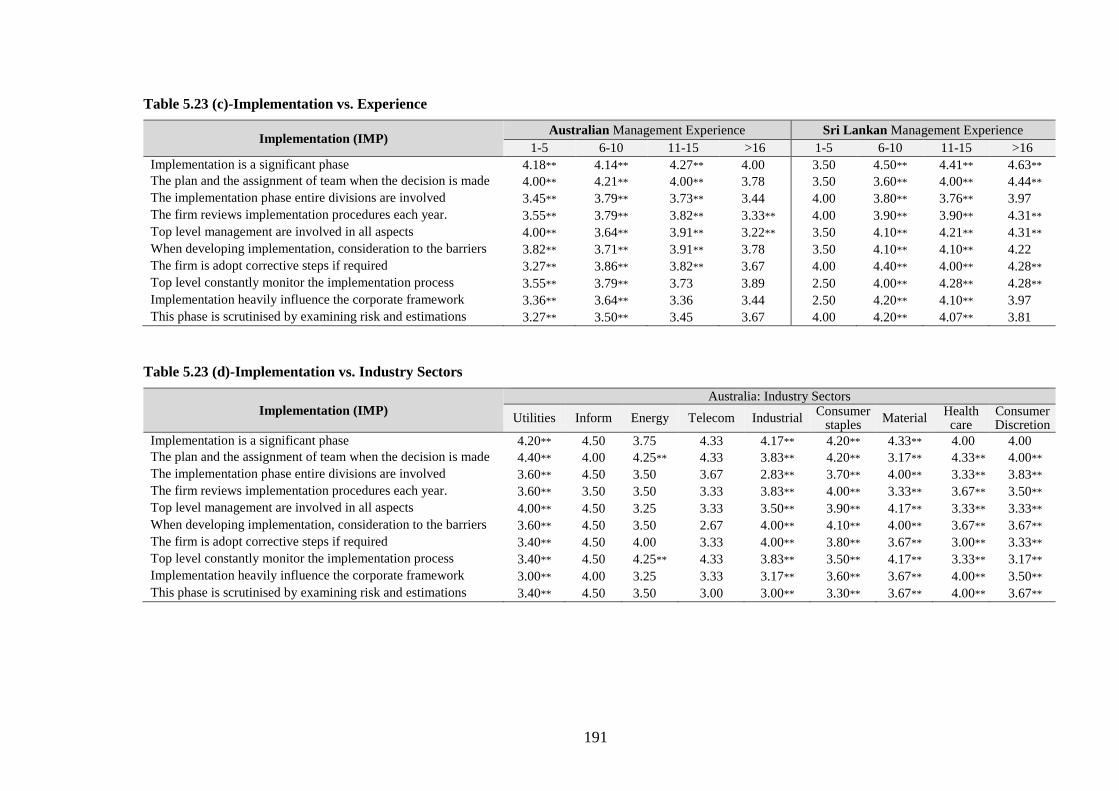
191
Table 5.23 (c)-Implementation vs. Experience
Implementation (IMP) Australian Management Experience Sri Lankan Management Experience
1-5 6-10 11-15 >16 1-5 6-10 11-15 >16
Implementation is a significant phase 4.18** 4.14** 4.27** 4.00 3.50 4.50** 4.41** 4.63**
The plan and the assignment of team when the decision is made 4.00** 4.21** 4.00** 3.78 3.50 3.60** 4.00** 4.44**
The implementation phase entire divisions are involved 3.45** 3.79** 3.73** 3.44 4.00 3.80** 3.76** 3.97
The firm reviews implementation procedures each year. 3.55** 3.79** 3.82** 3.33** 4.00 3.90** 3.90** 4.31**
Top level management are involved in all aspects 4.00** 3.64** 3.91** 3.22** 3.50 4.10** 4.21** 4.31**
When developing implementation, consideration to the barriers 3.82** 3.71** 3.91** 3.78 3.50 4.10** 4.10** 4.22
The firm is adopt corrective steps if required 3.27** 3.86** 3.82** 3.67 4.00 4.40** 4.00** 4.28**
Top level constantly monitor the implementation process 3.55** 3.79** 3.73 3.89 2.50 4.00** 4.28** 4.28**
Implementation heavily influence the corporate framework 3.36** 3.64** 3.36 3.44 2.50 4.20** 4.10** 3.97
This phase is scrutinised by examining risk and estimations 3.27** 3.50** 3.45 3.67 4.00 4.20** 4.07** 3.81
Table 5.23 (d)-Implementation vs. Industry Sectors
Implementation (IMP) Australia: Industry Sectors
Utilities Inform Energy Telecom Industrial Consumer
staples Material
Health care
Consumer Discretion
Implementation is a significant phase 4.20** 4.50 3.75 4.33 4.17** 4.20** 4.33** 4.00 4.00
The plan and the assignment of team when the decision is made 4.40** 4.00 4.25** 4.33 3.83** 4.20** 3.17** 4.33** 4.00**
The implementation phase entire divisions are involved 3.60** 4.50 3.50 3.67 2.83** 3.70** 4.00** 3.33** 3.83**
The firm reviews implementation procedures each year. 3.60** 3.50 3.50 3.33 3.83** 4.00** 3.33** 3.67** 3.50**
Top level management are involved in all aspects 4.00** 4.50 3.25 3.33 3.50** 3.90** 4.17** 3.33** 3.33**
When developing implementation, consideration to the barriers 3.60** 4.50 3.50 2.67 4.00** 4.10** 4.00** 3.67** 3.67**
The firm is adopt corrective steps if required 3.40** 4.50 4.00 3.33 4.00** 3.80** 3.67** 3.00** 3.33**
Top level constantly monitor the implementation process 3.40** 4.50 4.25** 4.33 3.83** 3.50** 4.17** 3.33** 3.17**
Implementation heavily influence the corporate framework 3.00** 4.00 3.25 3.33 3.17** 3.60** 3.67** 4.00** 3.50**
This phase is scrutinised by examining risk and estimations 3.40** 4.50 3.50 3.00 3.00** 3.30** 3.67** 4.00** 3.67**
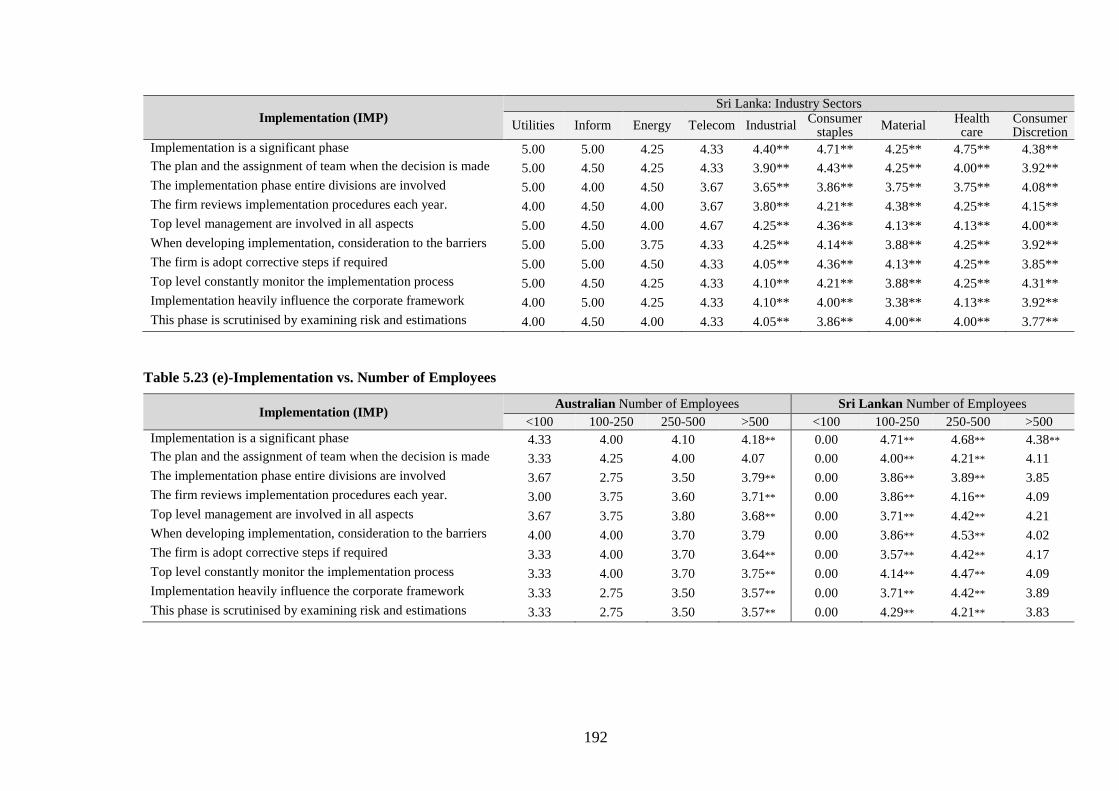
192
Implementation (IMP) Sri Lanka: Industry Sectors
Utilities Inform Energy Telecom Industrial Consumer
staples Material
Health care
Consumer Discretion
Implementation is a significant phase 5.00 5.00 4.25 4.33 4.40** 4.71** 4.25** 4.75** 4.38**
The plan and the assignment of team when the decision is made 5.00 4.50 4.25 4.33 3.90** 4.43** 4.25** 4.00** 3.92**
The implementation phase entire divisions are involved 5.00 4.00 4.50 3.67 3.65** 3.86** 3.75** 3.75** 4.08**
The firm reviews implementation procedures each year. 4.00 4.50 4.00 3.67 3.80** 4.21** 4.38** 4.25** 4.15**
Top level management are involved in all aspects 5.00 4.50 4.00 4.67 4.25** 4.36** 4.13** 4.13** 4.00**
When developing implementation, consideration to the barriers 5.00 5.00 3.75 4.33 4.25** 4.14** 3.88** 4.25** 3.92**
The firm is adopt corrective steps if required 5.00 5.00 4.50 4.33 4.05** 4.36** 4.13** 4.25** 3.85**
Top level constantly monitor the implementation process 5.00 4.50 4.25 4.33 4.10** 4.21** 3.88** 4.25** 4.31**
Implementation heavily influence the corporate framework 4.00 5.00 4.25 4.33 4.10** 4.00** 3.38** 4.13** 3.92**
This phase is scrutinised by examining risk and estimations 4.00 4.50 4.00 4.33 4.05** 3.86** 4.00** 4.00** 3.77**
Table 5.23 (e)-Implementation vs. Number of Employees
Implementation (IMP) Australian Number of Employees Sri Lankan Number of Employees
<100 100-250 250-500 >500 <100 100-250 250-500 >500
Implementation is a significant phase 4.33 4.00 4.10 4.18** 0.00 4.71** 4.68** 4.38**
The plan and the assignment of team when the decision is made 3.33 4.25 4.00 4.07 0.00 4.00** 4.21** 4.11
The implementation phase entire divisions are involved 3.67 2.75 3.50 3.79** 0.00 3.86** 3.89** 3.85
The firm reviews implementation procedures each year. 3.00 3.75 3.60 3.71** 0.00 3.86** 4.16** 4.09
Top level management are involved in all aspects 3.67 3.75 3.80 3.68** 0.00 3.71** 4.42** 4.21
When developing implementation, consideration to the barriers 4.00 4.00 3.70 3.79 0.00 3.86** 4.53** 4.02
The firm is adopt corrective steps if required 3.33 4.00 3.70 3.64** 0.00 3.57** 4.42** 4.17
Top level constantly monitor the implementation process 3.33 4.00 3.70 3.75** 0.00 4.14** 4.47** 4.09
Implementation heavily influence the corporate framework 3.33 2.75 3.50 3.57** 0.00 3.71** 4.42** 3.89
This phase is scrutinised by examining risk and estimations 3.33 2.75 3.50 3.57** 0.00 4.29** 4.21** 3.83
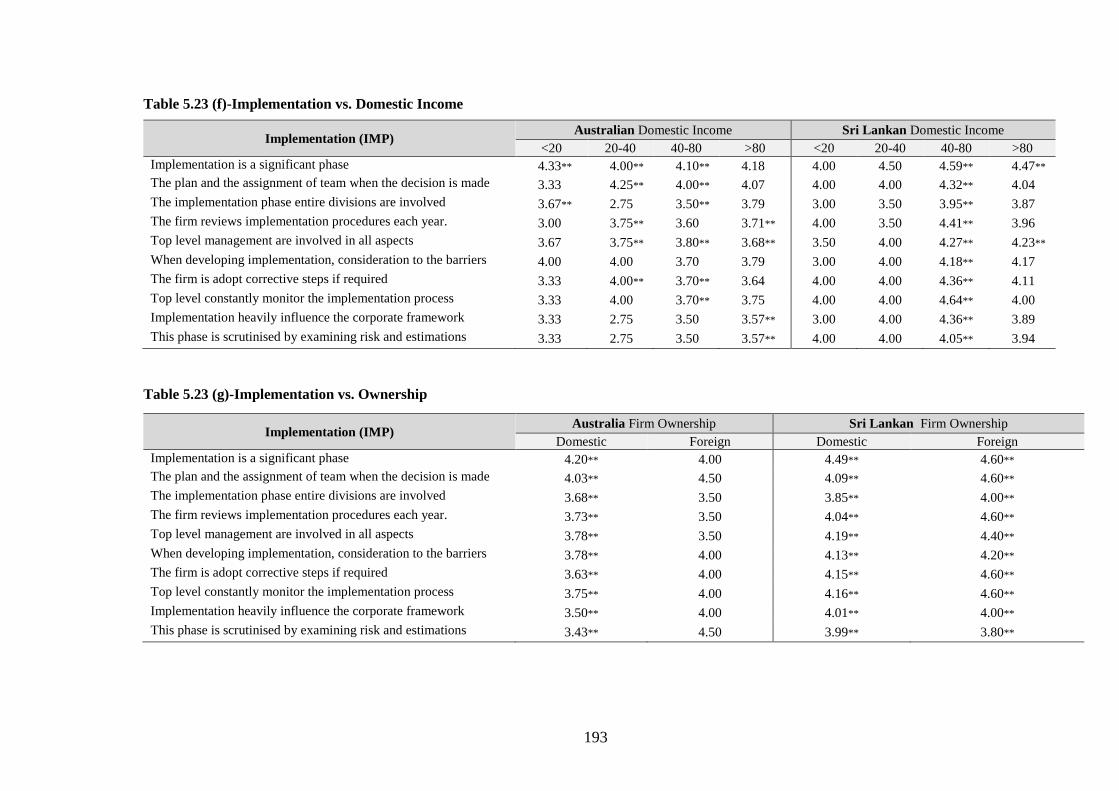
193
Table 5.23 (f)-Implementation vs. Domestic Income
Implementation (IMP) Australian Domestic Income Sri Lankan Domestic Income
<20 20-40 40-80 >80 <20 20-40 40-80 >80
Implementation is a significant phase 4.33** 4.00** 4.10** 4.18 4.00 4.50 4.59** 4.47**
The plan and the assignment of team when the decision is made 3.33 4.25** 4.00** 4.07 4.00 4.00 4.32** 4.04
The implementation phase entire divisions are involved 3.67** 2.75 3.50** 3.79 3.00 3.50 3.95** 3.87
The firm reviews implementation procedures each year. 3.00 3.75** 3.60 3.71** 4.00 3.50 4.41** 3.96
Top level management are involved in all aspects 3.67 3.75** 3.80** 3.68** 3.50 4.00 4.27** 4.23**
When developing implementation, consideration to the barriers 4.00 4.00 3.70 3.79 3.00 4.00 4.18** 4.17
The firm is adopt corrective steps if required 3.33 4.00** 3.70** 3.64 4.00 4.00 4.36** 4.11
Top level constantly monitor the implementation process 3.33 4.00 3.70** 3.75 4.00 4.00 4.64** 4.00
Implementation heavily influence the corporate framework 3.33 2.75 3.50 3.57** 3.00 4.00 4.36** 3.89
This phase is scrutinised by examining risk and estimations 3.33 2.75 3.50 3.57** 4.00 4.00 4.05** 3.94
Table 5.23 (g)-Implementation vs. Ownership
Implementation (IMP) Australia Firm Ownership Sri Lankan Firm Ownership
Domestic Foreign Domestic Foreign
Implementation is a significant phase 4.20** 4.00 4.49** 4.60**
The plan and the assignment of team when the decision is made 4.03** 4.50 4.09** 4.60**
The implementation phase entire divisions are involved 3.68** 3.50 3.85** 4.00**
The firm reviews implementation procedures each year. 3.73** 3.50 4.04** 4.60**
Top level management are involved in all aspects 3.78** 3.50 4.19** 4.40**
When developing implementation, consideration to the barriers 3.78** 4.00 4.13** 4.20**
The firm is adopt corrective steps if required 3.63** 4.00 4.15** 4.60**
Top level constantly monitor the implementation process 3.75** 4.00 4.16** 4.60**
Implementation heavily influence the corporate framework 3.50** 4.00 4.01** 4.00**
This phase is scrutinised by examining risk and estimations 3.43** 4.50 3.99** 3.80**
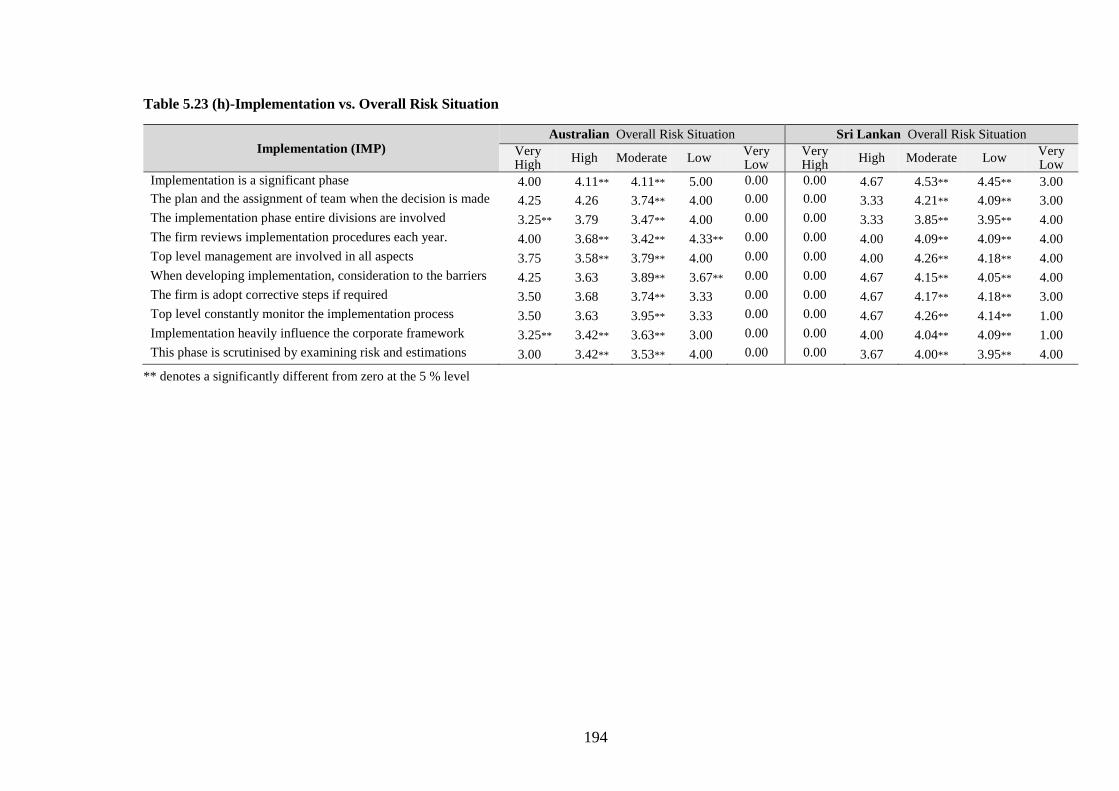
194
Table 5.23 (h)-Implementation vs. Overall Risk Situation
** denotes a significantly different from zero at the 5 % level
Implementation (IMP) Australian Overall Risk Situation Sri Lankan Overall Risk Situation
Very High
High Moderate Low Very Low
Very High
High Moderate Low Very Low
Implementation is a significant phase 4.00 4.11** 4.11** 5.00 0.00 0.00 4.67 4.53** 4.45** 3.00
The plan and the assignment of team when the decision is made 4.25 4.26 3.74** 4.00 0.00 0.00 3.33 4.21** 4.09** 3.00
The implementation phase entire divisions are involved 3.25** 3.79 3.47** 4.00 0.00 0.00 3.33 3.85** 3.95** 4.00
The firm reviews implementation procedures each year. 4.00 3.68** 3.42** 4.33** 0.00 0.00 4.00 4.09** 4.09** 4.00
Top level management are involved in all aspects 3.75 3.58** 3.79** 4.00 0.00 0.00 4.00 4.26** 4.18** 4.00
When developing implementation, consideration to the barriers 4.25 3.63 3.89** 3.67** 0.00 0.00 4.67 4.15** 4.05** 4.00
The firm is adopt corrective steps if required 3.50 3.68 3.74** 3.33 0.00 0.00 4.67 4.17** 4.18** 3.00
Top level constantly monitor the implementation process 3.50 3.63 3.95** 3.33 0.00 0.00 4.67 4.26** 4.14** 1.00
Implementation heavily influence the corporate framework 3.25** 3.42** 3.63** 3.00 0.00 0.00 4.00 4.04** 4.09** 1.00
This phase is scrutinised by examining risk and estimations 3.00 3.42** 3.53** 4.00 0.00 0.00 3.67 4.00** 3.95** 4.00
195
5.5.10 Expenditure Control and Monitoring
The respondents were asked to score how far they agree regarding assertions on the
expenditure control and monitoring phase of CB processes. Table 5.24(a), indicates that
expenditure control and monitoring as a phase received a more favourable ranking among
respondents with a Bachelors/Honours degree in Australia. In Sri Lanka, expenditure
control and monitoring seems to be more popular among respondents with
Diploma/Bachelors/Honours. In addition, all the practices of expenditure control and
monitoring were significantly agreed on by respondents with a Bachelors degree while this
result is consistent with those for the respondents with Diploma, Bachelors, Honours degree
in Sri Lanka. Compared to the respondents with PhD in Australia, respondents with a PhD
in Sri Lanka are more likely to agree that top management usually provides support for the
expenditure control and monitoring process and the firm has an established effective
operational internal control system. Table 5.24(b) shows that all the practices of
expenditure control and monitoring are favourably considered by young adults (25-35) and
middle age (35-55) respondents in Australia and Sri Lanka. Mature aged (>55) respondents
in Australia rely on the fact that the firm’s accounting system provides sufficiently detailed
breakdowns of accounts to enable analysis of variances than other practices. As shown in
Table 5.24(c), less (1-5 years) and middle (6-10 years) experienced respondents deeply
trust the expenditure control and monitoring practices in Australia—that level of trust is
consistent with the attitudes of middle (6-10) and high (11-15) experienced Sri Lankan
respondents. Table 5.24(d) shows that practices on expenditure control and monitoring are
applied more by firms in utilities, consumables and consumer discretionary markets in
Australia. This usage is similar to that of Sri Lankan firms in the industrial, consumables,
material, health care, and consumer discretionary markets. Sri Lankan energy firms
significantly agree that firms have the ability to assess the effect of inflation factors on

196
financial decisions. Table 5.24(e) indicates that large firms (>500) are more likely to apply
all the practices of expenditure control and monitoring, excluding 1) expenditure control is
an important phase in the CB practice of firms and 2) there is constant monitoring of
progress of investments with the strategic planning of firms—in Sri Lanka, medium level
firms (100-500 employees) strongly agreed. Table 5.24(f) shows that expenditure control
and monitoring practices, in Sri Lanka, are consistently more popular among 40-80 percent
domestic-focused firms. In Australia, 40-80 percent domestic-focused firms significantly
agreed to all of these practices except for: 1) respondents can receive progress reports at
regular intervals concerning the project monitoring; 2) the firm updates its monitoring
procedures on a timely basis, particularly when new investments are accepted; and 3) the
firm’s accounting system provides sufficiently detailed breakdowns of accounts to enable
analysis of variances. The moderately domestic-focused firms (20-40 percent) are likely to
agree on practices in line with expenditure control and monitoring except for deviations
from the estimated cash flows are monitored on a regular basis with a view to taking
corrective actions when needed. As shown in Table 5.24(g) domestic-owned Australian
companies significantly considered all expenditure control and monitoring practices. This
result is consistent with those for Sri Lankan firms. Foreign-owned Sri Lankan firms also
significantly agreed to all of these practices. In contrast to the Sri Lankan firms, foreign-
owned Australian firms are more inclined to agree that the firm has the ability to assess the
effect of inflationary factors on financial decisions and that the accounting system of the
firm provides sufficiently detailed breakdowns of accounts to enable analysis of variances.
Table 5.24(h) suggests that moderate-and-lower risk firms are significantly more likely to
agree to all this practices in Sri Lanka. This result is consistent with those for the moderate
risk firms in Australia.
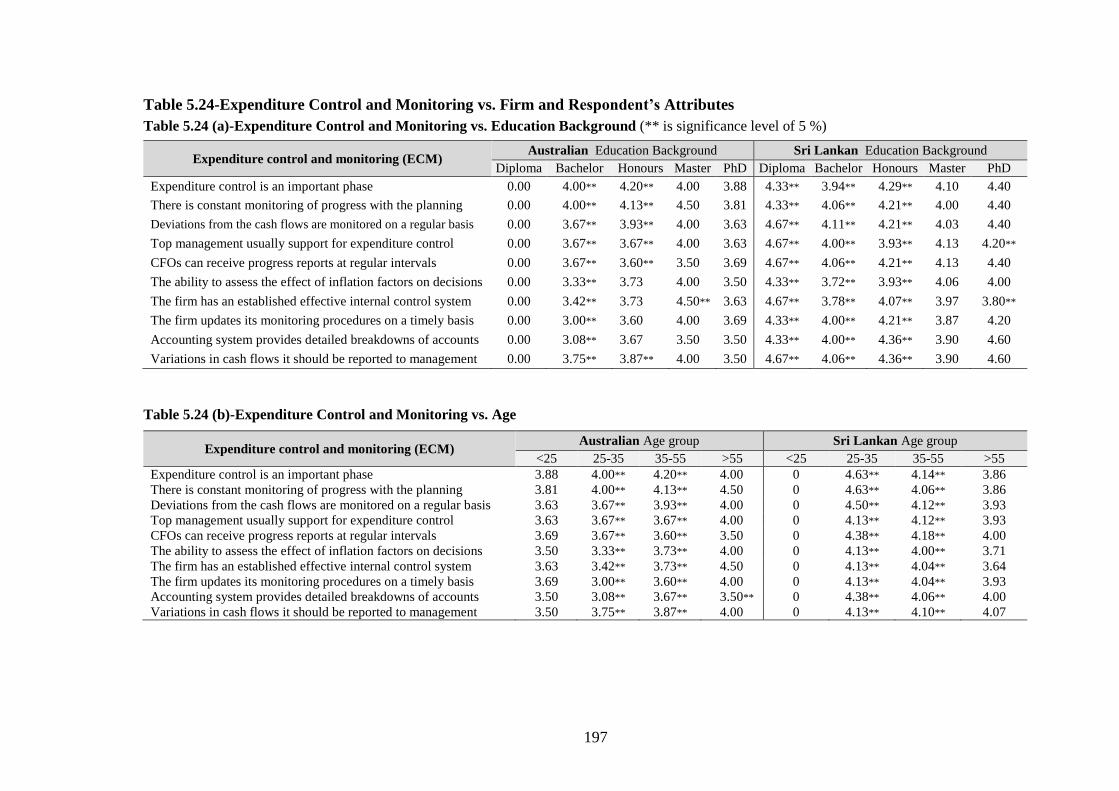
197
Table 5.24-Expenditure Control and Monitoring vs. Firm and Respondent’s Attributes
Table 5.24 (a)-Expenditure Control and Monitoring vs. Education Background (** is significance level of 5 %)
Table 5.24 (b)-Expenditure Control and Monitoring vs. Age
Expenditure control and monitoring (ECM) Australian Age group Sri Lankan Age group
<25 25-35 35-55 >55 <25 25-35 35-55 >55
Expenditure control is an important phase 3.88 4.00** 4.20** 4.00 0 4.63** 4.14** 3.86
There is constant monitoring of progress with the planning 3.81 4.00** 4.13** 4.50 0 4.63** 4.06** 3.86
Deviations from the cash flows are monitored on a regular basis 3.63 3.67** 3.93** 4.00 0 4.50** 4.12** 3.93
Top management usually support for expenditure control 3.63 3.67** 3.67** 4.00 0 4.13** 4.12** 3.93
CFOs can receive progress reports at regular intervals 3.69 3.67** 3.60** 3.50 0 4.38** 4.18** 4.00
The ability to assess the effect of inflation factors on decisions 3.50 3.33** 3.73** 4.00 0 4.13** 4.00** 3.71
The firm has an established effective internal control system 3.63 3.42** 3.73** 4.50 0 4.13** 4.04** 3.64
The firm updates its monitoring procedures on a timely basis 3.69 3.00** 3.60** 4.00 0 4.13** 4.04** 3.93
Accounting system provides detailed breakdowns of accounts 3.50 3.08** 3.67** 3.50** 0 4.38** 4.06** 4.00
Variations in cash flows it should be reported to management 3.50 3.75** 3.87** 4.00 0 4.13** 4.10** 4.07
Expenditure control and monitoring (ECM) Australian Education Background Sri Lankan Education Background
Diploma Bachelor Honours Master PhD Diploma Bachelor Honours Master PhD
Expenditure control is an important phase 0.00 4.00** 4.20** 4.00 3.88 4.33** 3.94** 4.29** 4.10 4.40
There is constant monitoring of progress with the planning 0.00 4.00** 4.13** 4.50 3.81 4.33** 4.06** 4.21** 4.00 4.40
Deviations from the cash flows are monitored on a regular basis 0.00 3.67** 3.93** 4.00 3.63 4.67** 4.11** 4.21** 4.03 4.40
Top management usually support for expenditure control 0.00 3.67** 3.67** 4.00 3.63 4.67** 4.00** 3.93** 4.13 4.20**
CFOs can receive progress reports at regular intervals 0.00 3.67** 3.60** 3.50 3.69 4.67** 4.06** 4.21** 4.13 4.40
The ability to assess the effect of inflation factors on decisions 0.00 3.33** 3.73 4.00 3.50 4.33** 3.72** 3.93** 4.06 4.00
The firm has an established effective internal control system 0.00 3.42** 3.73 4.50** 3.63 4.67** 3.78** 4.07** 3.97 3.80**
The firm updates its monitoring procedures on a timely basis 0.00 3.00** 3.60 4.00 3.69 4.33** 4.00** 4.21** 3.87 4.20
Accounting system provides detailed breakdowns of accounts 0.00 3.08** 3.67 3.50 3.50 4.33** 4.00** 4.36** 3.90 4.60
Variations in cash flows it should be reported to management 0.00 3.75** 3.87** 4.00 3.50 4.67** 4.06** 4.36** 3.90 4.60
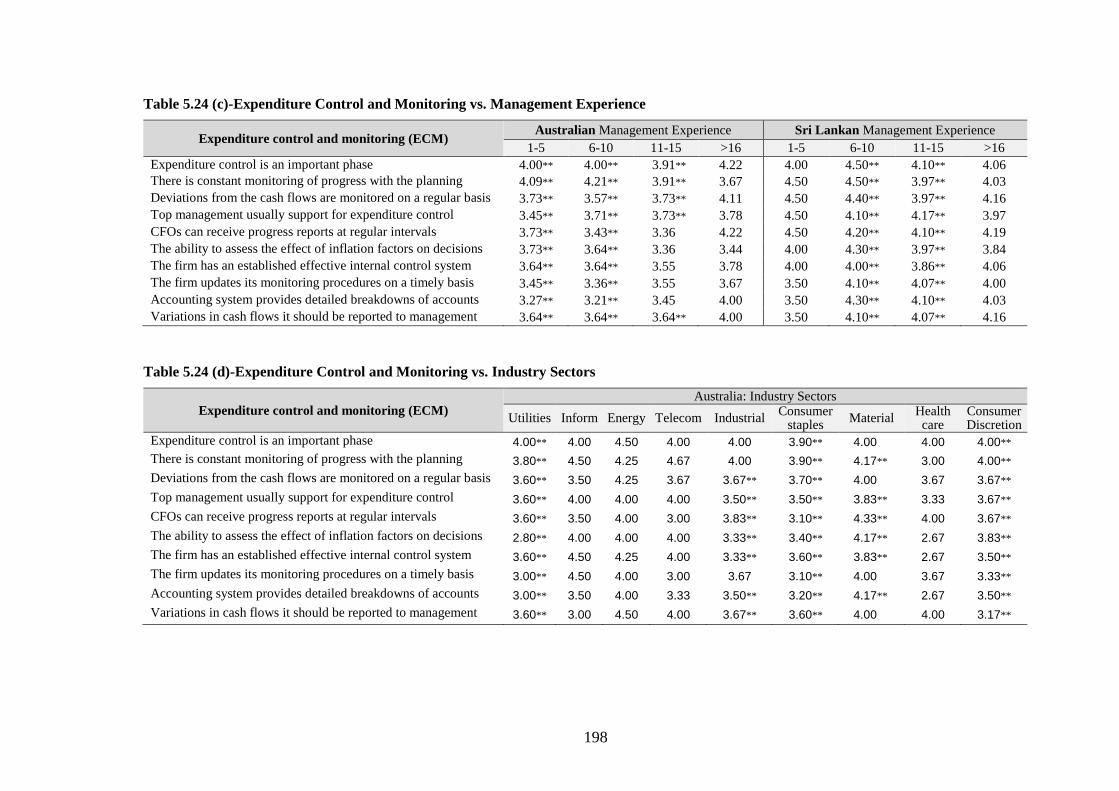
198
Table 5.24 (c)-Expenditure Control and Monitoring vs. Management Experience
Expenditure control and monitoring (ECM) Australian Management Experience Sri Lankan Management Experience
1-5 6-10 11-15 >16 1-5 6-10 11-15 >16
Expenditure control is an important phase 4.00** 4.00** 3.91** 4.22 4.00 4.50** 4.10** 4.06
There is constant monitoring of progress with the planning 4.09** 4.21** 3.91** 3.67 4.50 4.50** 3.97** 4.03
Deviations from the cash flows are monitored on a regular basis 3.73** 3.57** 3.73** 4.11 4.50 4.40** 3.97** 4.16
Top management usually support for expenditure control 3.45** 3.71** 3.73** 3.78 4.50 4.10** 4.17** 3.97
CFOs can receive progress reports at regular intervals 3.73** 3.43** 3.36 4.22 4.50 4.20** 4.10** 4.19
The ability to assess the effect of inflation factors on decisions 3.73** 3.64** 3.36 3.44 4.00 4.30** 3.97** 3.84
The firm has an established effective internal control system 3.64** 3.64** 3.55 3.78 4.00 4.00** 3.86** 4.06
The firm updates its monitoring procedures on a timely basis 3.45** 3.36** 3.55 3.67 3.50 4.10** 4.07** 4.00
Accounting system provides detailed breakdowns of accounts 3.27** 3.21** 3.45 4.00 3.50 4.30** 4.10** 4.03
Variations in cash flows it should be reported to management 3.64** 3.64** 3.64** 4.00 3.50 4.10** 4.07** 4.16
Table 5.24 (d)-Expenditure Control and Monitoring vs. Industry Sectors
Expenditure control and monitoring (ECM) Australia: Industry Sectors
Utilities Inform Energy Telecom Industrial Consumer
staples Material
Health care
Consumer Discretion
Expenditure control is an important phase 4.00** 4.00 4.50 4.00 4.00 3.90** 4.00 4.00 4.00**
There is constant monitoring of progress with the planning 3.80** 4.50 4.25 4.67 4.00 3.90** 4.17** 3.00 4.00**
Deviations from the cash flows are monitored on a regular basis 3.60** 3.50 4.25 3.67 3.67** 3.70** 4.00 3.67 3.67**
Top management usually support for expenditure control 3.60** 4.00 4.00 4.00 3.50** 3.50** 3.83** 3.33 3.67**
CFOs can receive progress reports at regular intervals 3.60** 3.50 4.00 3.00 3.83** 3.10** 4.33** 4.00 3.67**
The ability to assess the effect of inflation factors on decisions 2.80** 4.00 4.00 4.00 3.33** 3.40** 4.17** 2.67 3.83**
The firm has an established effective internal control system 3.60** 4.50 4.25 4.00 3.33** 3.60** 3.83** 2.67 3.50**
The firm updates its monitoring procedures on a timely basis 3.00** 4.50 4.00 3.00 3.67 3.10** 4.00 3.67 3.33**
Accounting system provides detailed breakdowns of accounts 3.00** 3.50 4.00 3.33 3.50** 3.20** 4.17** 2.67 3.50**
Variations in cash flows it should be reported to management 3.60** 3.00 4.50 4.00 3.67** 3.60** 4.00 4.00 3.17**
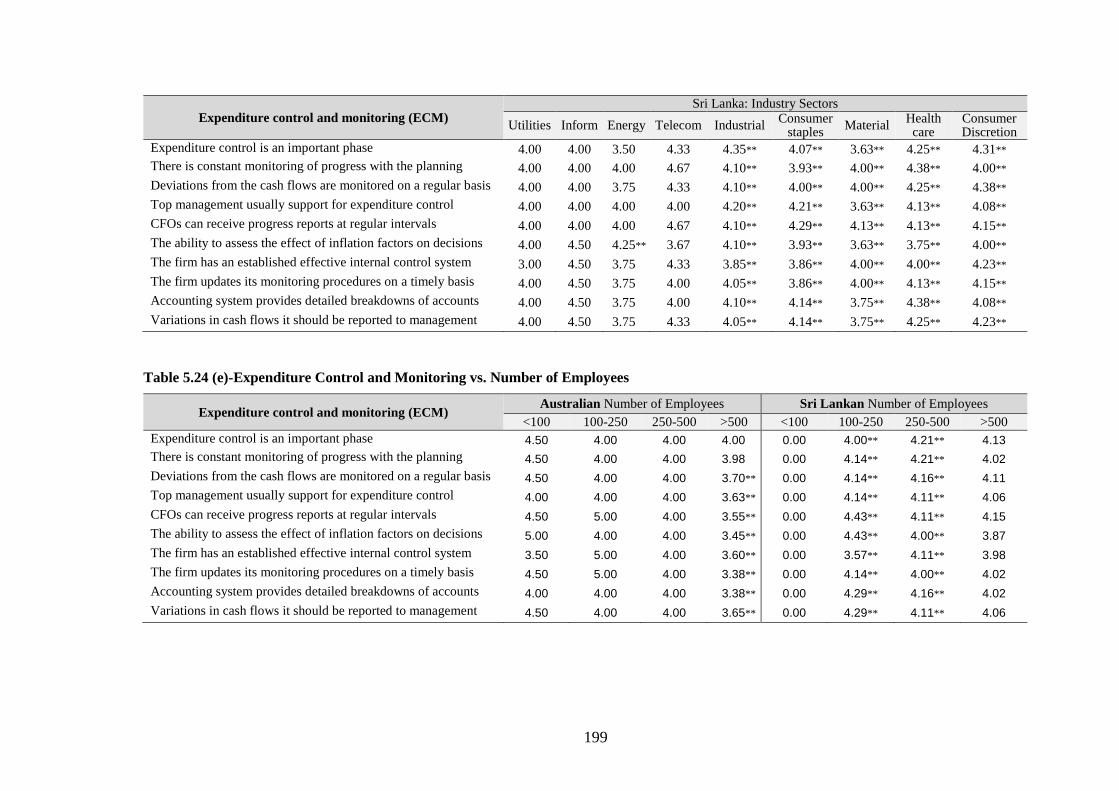
199
Expenditure control and monitoring (ECM) Sri Lanka: Industry Sectors
Utilities Inform Energy Telecom Industrial Consumer
staples Material
Health care
Consumer Discretion
Expenditure control is an important phase 4.00 4.00 3.50 4.33 4.35** 4.07** 3.63** 4.25** 4.31**
There is constant monitoring of progress with the planning 4.00 4.00 4.00 4.67 4.10** 3.93** 4.00** 4.38** 4.00**
Deviations from the cash flows are monitored on a regular basis 4.00 4.00 3.75 4.33 4.10** 4.00** 4.00** 4.25** 4.38**
Top management usually support for expenditure control 4.00 4.00 4.00 4.00 4.20** 4.21** 3.63** 4.13** 4.08**
CFOs can receive progress reports at regular intervals 4.00 4.00 4.00 4.67 4.10** 4.29** 4.13** 4.13** 4.15**
The ability to assess the effect of inflation factors on decisions 4.00 4.50 4.25** 3.67 4.10** 3.93** 3.63** 3.75** 4.00**
The firm has an established effective internal control system 3.00 4.50 3.75 4.33 3.85** 3.86** 4.00** 4.00** 4.23**
The firm updates its monitoring procedures on a timely basis 4.00 4.50 3.75 4.00 4.05** 3.86** 4.00** 4.13** 4.15**
Accounting system provides detailed breakdowns of accounts 4.00 4.50 3.75 4.00 4.10** 4.14** 3.75** 4.38** 4.08**
Variations in cash flows it should be reported to management 4.00 4.50 3.75 4.33 4.05** 4.14** 3.75** 4.25** 4.23**
Table 5.24 (e)-Expenditure Control and Monitoring vs. Number of Employees
Expenditure control and monitoring (ECM) Australian Number of Employees Sri Lankan Number of Employees
<100 100-250 250-500 >500 <100 100-250 250-500 >500
Expenditure control is an important phase 4.50 4.00 4.00 4.00 0.00 4.00** 4.21** 4.13
There is constant monitoring of progress with the planning 4.50 4.00 4.00 3.98 0.00 4.14** 4.21** 4.02
Deviations from the cash flows are monitored on a regular basis 4.50 4.00 4.00 3.70** 0.00 4.14** 4.16** 4.11
Top management usually support for expenditure control 4.00 4.00 4.00 3.63** 0.00 4.14** 4.11** 4.06
CFOs can receive progress reports at regular intervals 4.50 5.00 4.00 3.55** 0.00 4.43** 4.11** 4.15
The ability to assess the effect of inflation factors on decisions 5.00 4.00 4.00 3.45** 0.00 4.43** 4.00** 3.87
The firm has an established effective internal control system 3.50 5.00 4.00 3.60** 0.00 3.57** 4.11** 3.98
The firm updates its monitoring procedures on a timely basis 4.50 5.00 4.00 3.38** 0.00 4.14** 4.00** 4.02
Accounting system provides detailed breakdowns of accounts 4.00 4.00 4.00 3.38** 0.00 4.29** 4.16** 4.02
Variations in cash flows it should be reported to management 4.50 4.00 4.00 3.65** 0.00 4.29** 4.11** 4.06
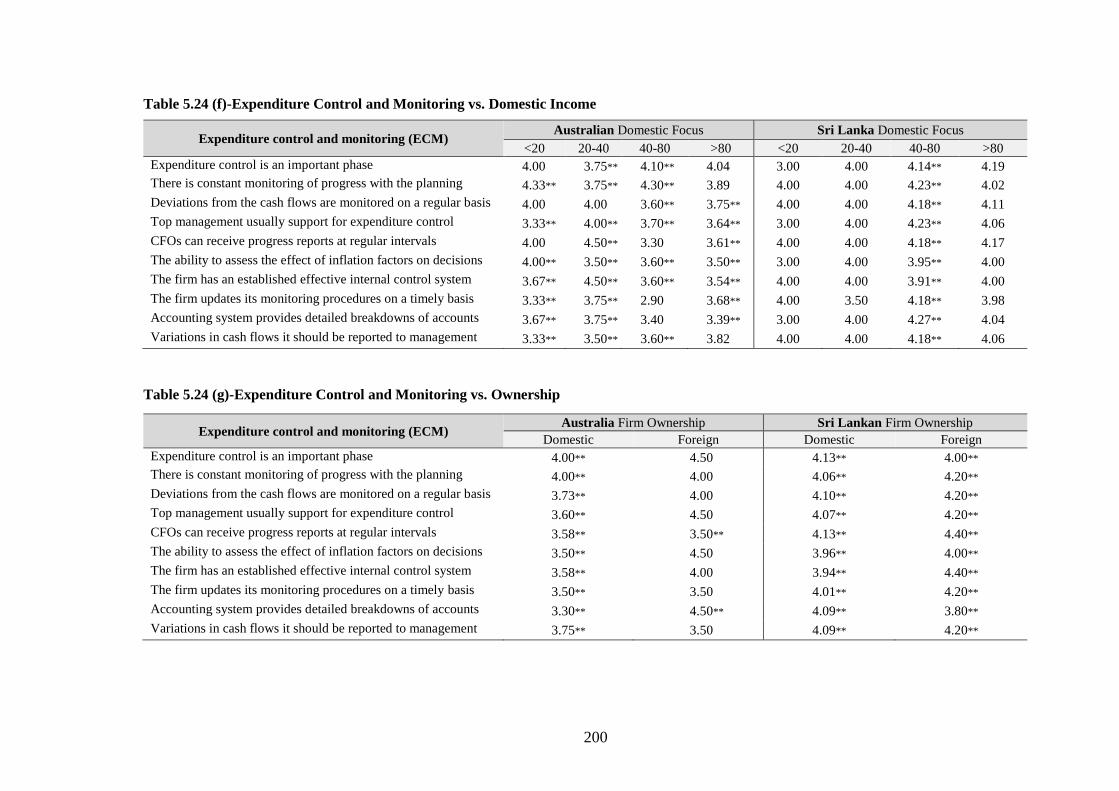
200
Table 5.24 (f)-Expenditure Control and Monitoring vs. Domestic Income
Expenditure control and monitoring (ECM) Australian Domestic Focus Sri Lanka Domestic Focus
<20 20-40 40-80 >80 <20 20-40 40-80 >80
Expenditure control is an important phase 4.00 3.75** 4.10** 4.04 3.00 4.00 4.14** 4.19
There is constant monitoring of progress with the planning 4.33** 3.75** 4.30** 3.89 4.00 4.00 4.23** 4.02
Deviations from the cash flows are monitored on a regular basis 4.00 4.00 3.60** 3.75** 4.00 4.00 4.18** 4.11
Top management usually support for expenditure control 3.33** 4.00** 3.70** 3.64** 3.00 4.00 4.23** 4.06
CFOs can receive progress reports at regular intervals 4.00 4.50** 3.30 3.61** 4.00 4.00 4.18** 4.17
The ability to assess the effect of inflation factors on decisions 4.00** 3.50** 3.60** 3.50** 3.00 4.00 3.95** 4.00
The firm has an established effective internal control system 3.67** 4.50** 3.60** 3.54** 4.00 4.00 3.91** 4.00
The firm updates its monitoring procedures on a timely basis 3.33** 3.75** 2.90 3.68** 4.00 3.50 4.18** 3.98
Accounting system provides detailed breakdowns of accounts 3.67** 3.75** 3.40 3.39** 3.00 4.00 4.27** 4.04
Variations in cash flows it should be reported to management 3.33** 3.50** 3.60** 3.82 4.00 4.00 4.18** 4.06
Table 5.24 (g)-Expenditure Control and Monitoring vs. Ownership
Expenditure control and monitoring (ECM) Australia Firm Ownership Sri Lankan Firm Ownership
Domestic Foreign Domestic Foreign
Expenditure control is an important phase 4.00** 4.50 4.13** 4.00**
There is constant monitoring of progress with the planning 4.00** 4.00 4.06** 4.20**
Deviations from the cash flows are monitored on a regular basis 3.73** 4.00 4.10** 4.20**
Top management usually support for expenditure control 3.60** 4.50 4.07** 4.20**
CFOs can receive progress reports at regular intervals 3.58** 3.50** 4.13** 4.40**
The ability to assess the effect of inflation factors on decisions 3.50** 4.50 3.96** 4.00**
The firm has an established effective internal control system 3.58** 4.00 3.94** 4.40**
The firm updates its monitoring procedures on a timely basis 3.50** 3.50 4.01** 4.20**
Accounting system provides detailed breakdowns of accounts 3.30** 4.50** 4.09** 3.80**
Variations in cash flows it should be reported to management 3.75** 3.50 4.09** 4.20**
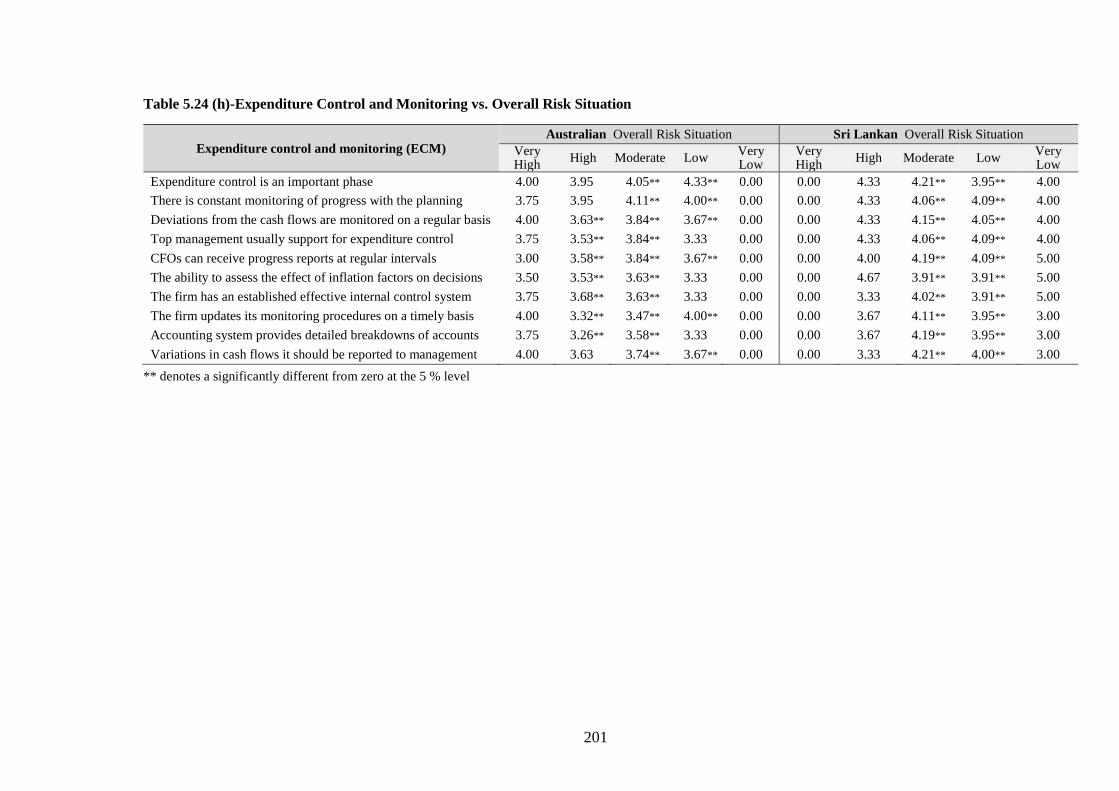
201
Table 5.24 (h)-Expenditure Control and Monitoring vs. Overall Risk Situation
** denotes a significantly different from zero at the 5 % level
Expenditure control and monitoring (ECM) Australian Overall Risk Situation Sri Lankan Overall Risk Situation
Very High
High Moderate Low Very Low
Very High
High Moderate Low Very Low
Expenditure control is an important phase 4.00 3.95 4.05** 4.33** 0.00 0.00 4.33 4.21** 3.95** 4.00
There is constant monitoring of progress with the planning 3.75 3.95 4.11** 4.00** 0.00 0.00 4.33 4.06** 4.09** 4.00
Deviations from the cash flows are monitored on a regular basis 4.00 3.63** 3.84** 3.67** 0.00 0.00 4.33 4.15** 4.05** 4.00
Top management usually support for expenditure control 3.75 3.53** 3.84** 3.33 0.00 0.00 4.33 4.06** 4.09** 4.00
CFOs can receive progress reports at regular intervals 3.00 3.58** 3.84** 3.67** 0.00 0.00 4.00 4.19** 4.09** 5.00
The ability to assess the effect of inflation factors on decisions 3.50 3.53** 3.63** 3.33 0.00 0.00 4.67 3.91** 3.91** 5.00
The firm has an established effective internal control system 3.75 3.68** 3.63** 3.33 0.00 0.00 3.33 4.02** 3.91** 5.00
The firm updates its monitoring procedures on a timely basis 4.00 3.32** 3.47** 4.00** 0.00 0.00 3.67 4.11** 3.95** 3.00
Accounting system provides detailed breakdowns of accounts 3.75 3.26** 3.58** 3.33 0.00 0.00 3.67 4.19** 3.95** 3.00
Variations in cash flows it should be reported to management 4.00 3.63 3.74** 3.67** 0.00 0.00 3.33 4.21** 4.00** 3.00
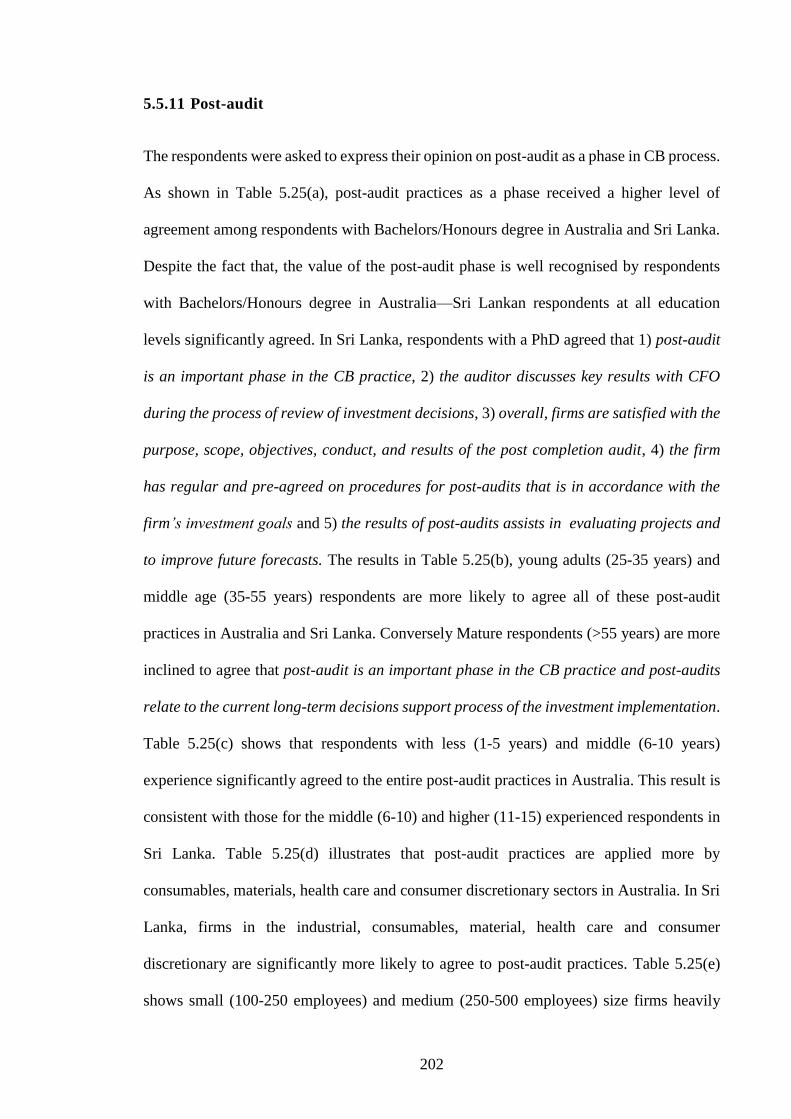
202
5.5.11 Post-audit
The respondents were asked to express their opinion on post-audit as a phase in CB process.
As shown in Table 5.25(a), post-audit practices as a phase received a higher level of
agreement among respondents with Bachelors/Honours degree in Australia and Sri Lanka.
Despite the fact that, the value of the post-audit phase is well recognised by respondents
with Bachelors/Honours degree in Australia—Sri Lankan respondents at all education
levels significantly agreed. In Sri Lanka, respondents with a PhD agreed that 1) post-audit
is an important phase in the CB practice, 2) the auditor discusses key results with CFO
during the process of review of investment decisions, 3) overall, firms are satisfied with the
purpose, scope, objectives, conduct, and results of the post completion audit, 4) the firm
has regular and pre-agreed on procedures for post-audits that is in accordance with the
firm’s investment goals and 5) the results of post-audits assists in evaluating projects and
to improve future forecasts. The results in Table 5.25(b), young adults (25-35 years) and
middle age (35-55 years) respondents are more likely to agree all of these post-audit
practices in Australia and Sri Lanka. Conversely Mature respondents (>55 years) are more
inclined to agree that post-audit is an important phase in the CB practice and post-audits
relate to the current long-term decisions support process of the investment implementation.
Table 5.25(c) shows that respondents with less (1-5 years) and middle (6-10 years)
experience significantly agreed to the entire post-audit practices in Australia. This result is
consistent with those for the middle (6-10) and higher (11-15) experienced respondents in
Sri Lanka. Table 5.25(d) illustrates that post-audit practices are applied more by
consumables, materials, health care and consumer discretionary sectors in Australia. In Sri
Lanka, firms in the industrial, consumables, material, health care and consumer
discretionary are significantly more likely to agree to post-audit practices. Table 5.25(e)
shows small (100-250 employees) and medium (250-500 employees) size firms heavily
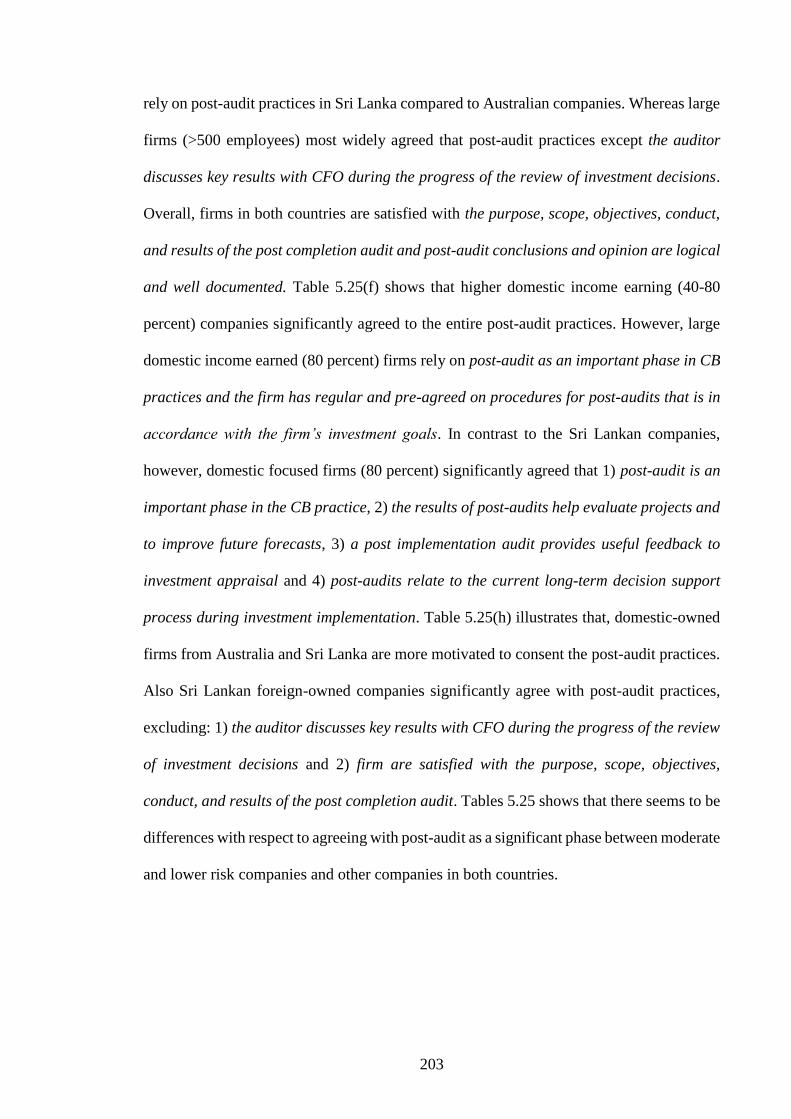
203
rely on post-audit practices in Sri Lanka compared to Australian companies. Whereas large
firms (>500 employees) most widely agreed that post-audit practices except the auditor
discusses key results with CFO during the progress of the review of investment decisions.
Overall, firms in both countries are satisfied with the purpose, scope, objectives, conduct,
and results of the post completion audit and post-audit conclusions and opinion are logical
and well documented. Table 5.25(f) shows that higher domestic income earning (40-80
percent) companies significantly agreed to the entire post-audit practices. However, large
domestic income earned (80 percent) firms rely on post-audit as an important phase in CB
practices and the firm has regular and pre-agreed on procedures for post-audits that is in
accordance with the firm’s investment goals. In contrast to the Sri Lankan companies,
however, domestic focused firms (80 percent) significantly agreed that 1) post-audit is an
important phase in the CB practice, 2) the results of post-audits help evaluate projects and
to improve future forecasts, 3) a post implementation audit provides useful feedback to
investment appraisal and 4) post-audits relate to the current long-term decision support
process during investment implementation. Table 5.25(h) illustrates that, domestic-owned
firms from Australia and Sri Lanka are more motivated to consent the post-audit practices.
Also Sri Lankan foreign-owned companies significantly agree with post-audit practices,
excluding: 1) the auditor discusses key results with CFO during the progress of the review
of investment decisions and 2) firm are satisfied with the purpose, scope, objectives,
conduct, and results of the post completion audit. Tables 5.25 shows that there seems to be
differences with respect to agreeing with post-audit as a significant phase between moderate
and lower risk companies and other companies in both countries.
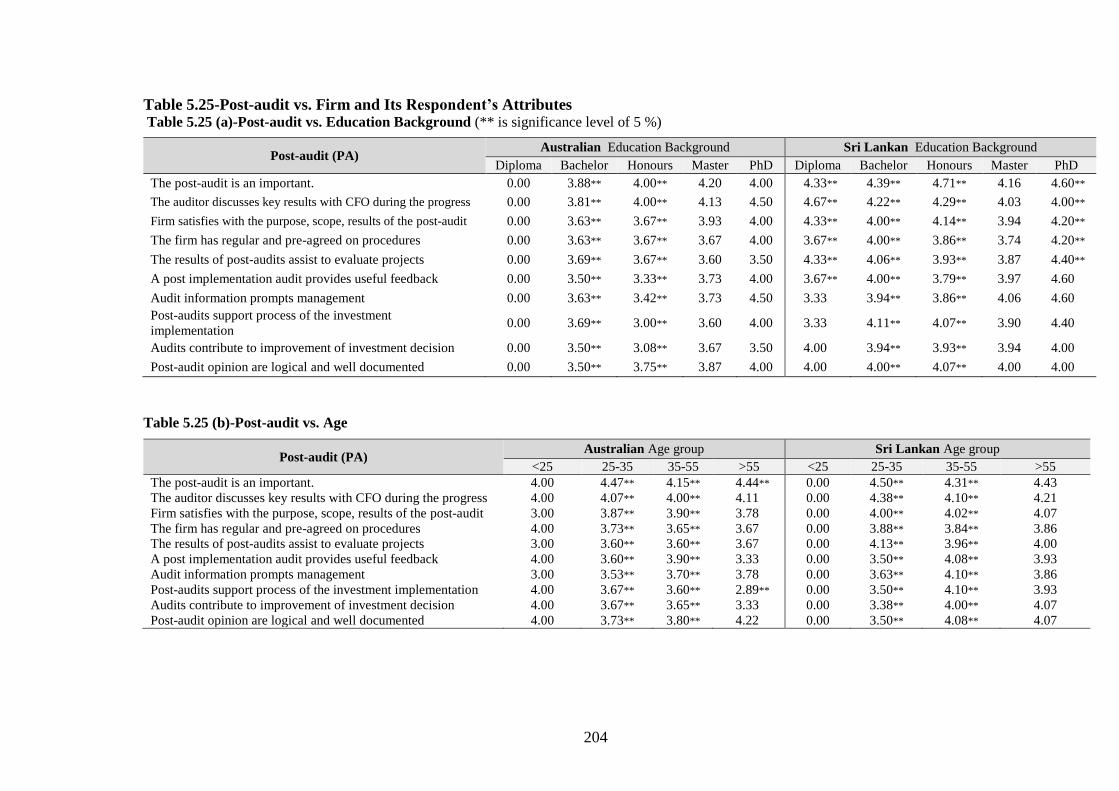
204
Table 5.25-Post-audit vs. Firm and Its Respondent’s Attributes Table 5.25 (a)-Post-audit vs. Education Background (** is significance level of 5 %)
Table 5.25 (b)-Post-audit vs. Age
Post-audit (PA) Australian Age group Sri Lankan Age group
<25 25-35 35-55 >55 <25 25-35 35-55 >55
The post-audit is an important. 4.00 4.47** 4.15** 4.44** 0.00 4.50** 4.31** 4.43
The auditor discusses key results with CFO during the progress 4.00 4.07** 4.00** 4.11 0.00 4.38** 4.10** 4.21
Firm satisfies with the purpose, scope, results of the post-audit 3.00 3.87** 3.90** 3.78 0.00 4.00** 4.02** 4.07
The firm has regular and pre-agreed on procedures 4.00 3.73** 3.65** 3.67 0.00 3.88** 3.84** 3.86
The results of post-audits assist to evaluate projects 3.00 3.60** 3.60** 3.67 0.00 4.13** 3.96** 4.00
A post implementation audit provides useful feedback 4.00 3.60** 3.90** 3.33 0.00 3.50** 4.08** 3.93
Audit information prompts management 3.00 3.53** 3.70** 3.78 0.00 3.63** 4.10** 3.86
Post-audits support process of the investment implementation 4.00 3.67** 3.60** 2.89** 0.00 3.50** 4.10** 3.93
Audits contribute to improvement of investment decision 4.00 3.67** 3.65** 3.33 0.00 3.38** 4.00** 4.07
Post-audit opinion are logical and well documented 4.00 3.73** 3.80** 4.22 0.00 3.50** 4.08** 4.07
Post-audit (PA) Australian Education Background Sri Lankan Education Background
Diploma Bachelor Honours Master PhD Diploma Bachelor Honours Master PhD
The post-audit is an important. 0.00 3.88** 4.00** 4.20 4.00 4.33** 4.39** 4.71** 4.16 4.60**
The auditor discusses key results with CFO during the progress 0.00 3.81** 4.00** 4.13 4.50 4.67** 4.22** 4.29** 4.03 4.00**
Firm satisfies with the purpose, scope, results of the post-audit 0.00 3.63** 3.67** 3.93 4.00 4.33** 4.00** 4.14** 3.94 4.20**
The firm has regular and pre-agreed on procedures 0.00 3.63** 3.67** 3.67 4.00 3.67** 4.00** 3.86** 3.74 4.20**
The results of post-audits assist to evaluate projects 0.00 3.69** 3.67** 3.60 3.50 4.33** 4.06** 3.93** 3.87 4.40**
A post implementation audit provides useful feedback 0.00 3.50** 3.33** 3.73 4.00 3.67** 4.00** 3.79** 3.97 4.60
Audit information prompts management 0.00 3.63** 3.42** 3.73 4.50 3.33 3.94** 3.86** 4.06 4.60
Post-audits support process of the investment
implementation 0.00 3.69** 3.00** 3.60 4.00 3.33 4.11** 4.07** 3.90 4.40
Audits contribute to improvement of investment decision 0.00 3.50** 3.08** 3.67 3.50 4.00 3.94** 3.93** 3.94 4.00
Post-audit opinion are logical and well documented 0.00 3.50** 3.75** 3.87 4.00 4.00 4.00** 4.07** 4.00 4.00
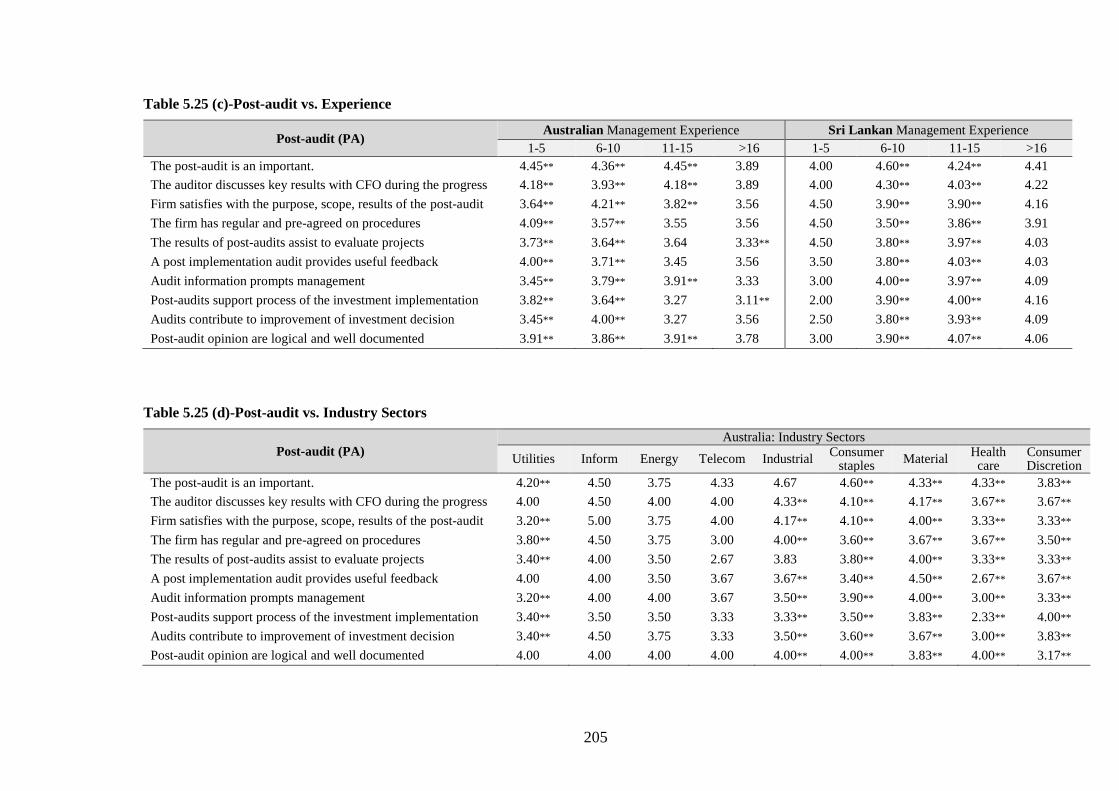
205
Table 5.25 (c)-Post-audit vs. Experience
Post-audit (PA) Australian Management Experience Sri Lankan Management Experience
1-5 6-10 11-15 >16 1-5 6-10 11-15 >16
The post-audit is an important. 4.45** 4.36** 4.45** 3.89 4.00 4.60** 4.24** 4.41
The auditor discusses key results with CFO during the progress 4.18** 3.93** 4.18** 3.89 4.00 4.30** 4.03** 4.22
Firm satisfies with the purpose, scope, results of the post-audit 3.64** 4.21** 3.82** 3.56 4.50 3.90** 3.90** 4.16
The firm has regular and pre-agreed on procedures 4.09** 3.57** 3.55 3.56 4.50 3.50** 3.86** 3.91
The results of post-audits assist to evaluate projects 3.73** 3.64** 3.64 3.33** 4.50 3.80** 3.97** 4.03
A post implementation audit provides useful feedback 4.00** 3.71** 3.45 3.56 3.50 3.80** 4.03** 4.03
Audit information prompts management 3.45** 3.79** 3.91** 3.33 3.00 4.00** 3.97** 4.09
Post-audits support process of the investment implementation 3.82** 3.64** 3.27 3.11** 2.00 3.90** 4.00** 4.16
Audits contribute to improvement of investment decision 3.45** 4.00** 3.27 3.56 2.50 3.80** 3.93** 4.09
Post-audit opinion are logical and well documented 3.91** 3.86** 3.91** 3.78 3.00 3.90** 4.07** 4.06
Table 5.25 (d)-Post-audit vs. Industry Sectors
Post-audit (PA) Australia: Industry Sectors
Utilities Inform Energy Telecom Industrial Consumer
staples Material
Health care
Consumer Discretion
The post-audit is an important. 4.20** 4.50 3.75 4.33 4.67 4.60** 4.33** 4.33** 3.83**
The auditor discusses key results with CFO during the progress 4.00 4.50 4.00 4.00 4.33** 4.10** 4.17** 3.67** 3.67**
Firm satisfies with the purpose, scope, results of the post-audit 3.20** 5.00 3.75 4.00 4.17** 4.10** 4.00** 3.33** 3.33**
The firm has regular and pre-agreed on procedures 3.80** 4.50 3.75 3.00 4.00** 3.60** 3.67** 3.67** 3.50**
The results of post-audits assist to evaluate projects 3.40** 4.00 3.50 2.67 3.83 3.80** 4.00** 3.33** 3.33**
A post implementation audit provides useful feedback 4.00 4.00 3.50 3.67 3.67** 3.40** 4.50** 2.67** 3.67**
Audit information prompts management 3.20** 4.00 4.00 3.67 3.50** 3.90** 4.00** 3.00** 3.33**
Post-audits support process of the investment implementation 3.40** 3.50 3.50 3.33 3.33** 3.50** 3.83** 2.33** 4.00**
Audits contribute to improvement of investment decision 3.40** 4.50 3.75 3.33 3.50** 3.60** 3.67** 3.00** 3.83**
Post-audit opinion are logical and well documented 4.00 4.00 4.00 4.00 4.00** 4.00** 3.83** 4.00** 3.17**
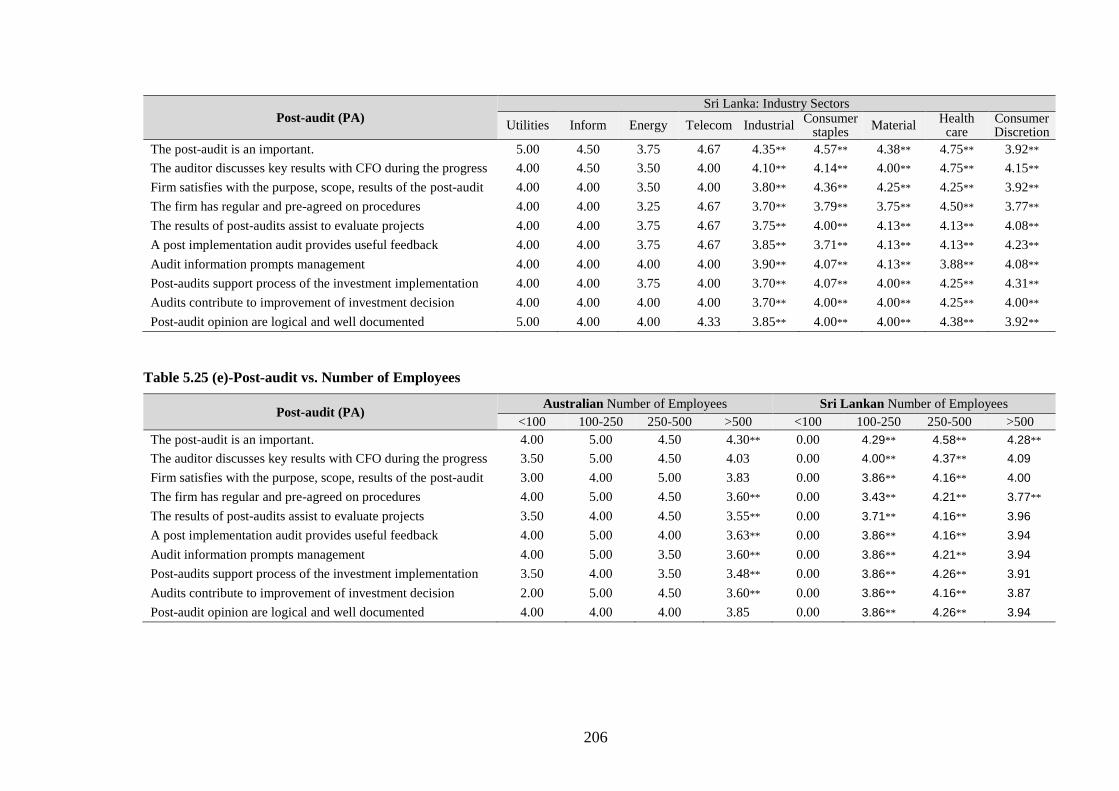
206
Post-audit (PA) Sri Lanka: Industry Sectors
Utilities Inform Energy Telecom Industrial Consumer
staples Material
Health care
Consumer Discretion
The post-audit is an important. 5.00 4.50 3.75 4.67 4.35** 4.57** 4.38** 4.75** 3.92**
The auditor discusses key results with CFO during the progress 4.00 4.50 3.50 4.00 4.10** 4.14** 4.00** 4.75** 4.15**
Firm satisfies with the purpose, scope, results of the post-audit 4.00 4.00 3.50 4.00 3.80** 4.36** 4.25** 4.25** 3.92**
The firm has regular and pre-agreed on procedures 4.00 4.00 3.25 4.67 3.70** 3.79** 3.75** 4.50** 3.77**
The results of post-audits assist to evaluate projects 4.00 4.00 3.75 4.67 3.75** 4.00** 4.13** 4.13** 4.08**
A post implementation audit provides useful feedback 4.00 4.00 3.75 4.67 3.85** 3.71** 4.13** 4.13** 4.23**
Audit information prompts management 4.00 4.00 4.00 4.00 3.90** 4.07** 4.13** 3.88** 4.08**
Post-audits support process of the investment implementation 4.00 4.00 3.75 4.00 3.70** 4.07** 4.00** 4.25** 4.31**
Audits contribute to improvement of investment decision 4.00 4.00 4.00 4.00 3.70** 4.00** 4.00** 4.25** 4.00**
Post-audit opinion are logical and well documented 5.00 4.00 4.00 4.33 3.85** 4.00** 4.00** 4.38** 3.92**
Table 5.25 (e)-Post-audit vs. Number of Employees
Post-audit (PA) Australian Number of Employees Sri Lankan Number of Employees
<100 100-250 250-500 >500 <100 100-250 250-500 >500
The post-audit is an important. 4.00 5.00 4.50 4.30** 0.00 4.29** 4.58** 4.28**
The auditor discusses key results with CFO during the progress 3.50 5.00 4.50 4.03 0.00 4.00** 4.37** 4.09
Firm satisfies with the purpose, scope, results of the post-audit 3.00 4.00 5.00 3.83 0.00 3.86** 4.16** 4.00
The firm has regular and pre-agreed on procedures 4.00 5.00 4.50 3.60** 0.00 3.43** 4.21** 3.77**
The results of post-audits assist to evaluate projects 3.50 4.00 4.50 3.55** 0.00 3.71** 4.16** 3.96
A post implementation audit provides useful feedback 4.00 5.00 4.00 3.63** 0.00 3.86** 4.16** 3.94
Audit information prompts management 4.00 5.00 3.50 3.60** 0.00 3.86** 4.21** 3.94
Post-audits support process of the investment implementation 3.50 4.00 3.50 3.48** 0.00 3.86** 4.26** 3.91
Audits contribute to improvement of investment decision 2.00 5.00 4.50 3.60** 0.00 3.86** 4.16** 3.87
Post-audit opinion are logical and well documented 4.00 4.00 4.00 3.85 0.00 3.86** 4.26** 3.94
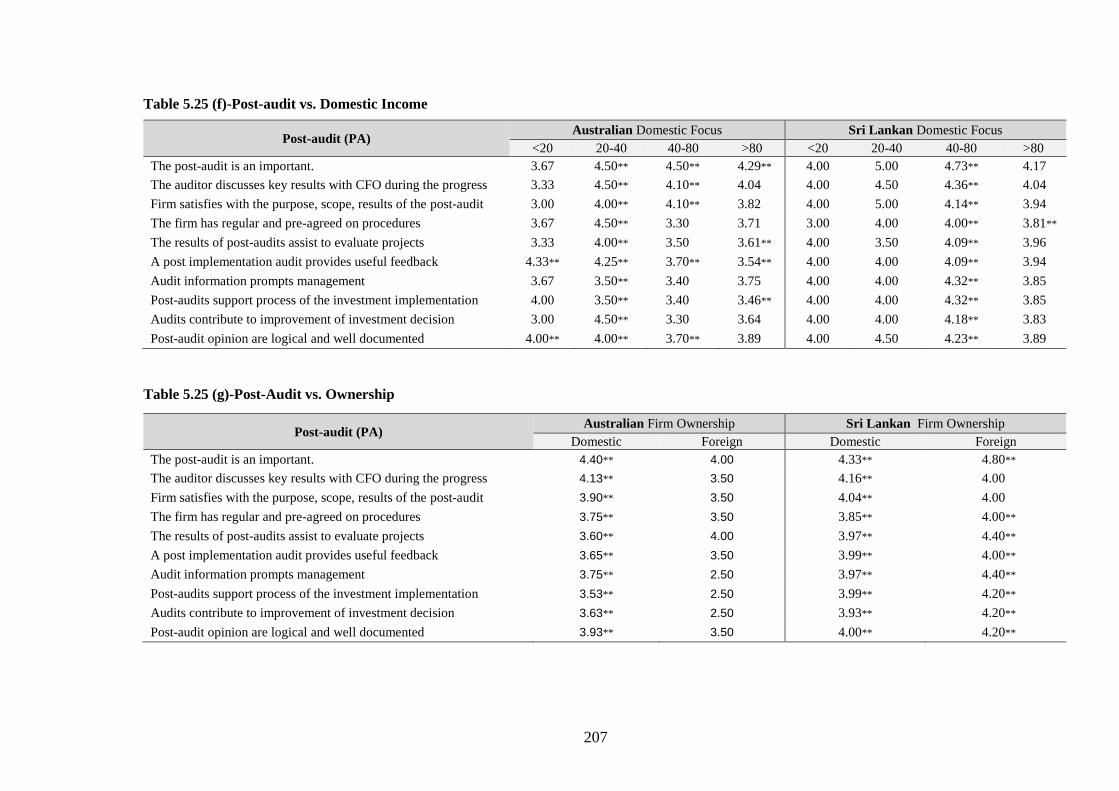
207
Table 5.25 (f)-Post-audit vs. Domestic Income
Post-audit (PA) Australian Domestic Focus Sri Lankan Domestic Focus
<20 20-40 40-80 >80 <20 20-40 40-80 >80
The post-audit is an important. 3.67 4.50** 4.50** 4.29** 4.00 5.00 4.73** 4.17
The auditor discusses key results with CFO during the progress 3.33 4.50** 4.10** 4.04 4.00 4.50 4.36** 4.04
Firm satisfies with the purpose, scope, results of the post-audit 3.00 4.00** 4.10** 3.82 4.00 5.00 4.14** 3.94
The firm has regular and pre-agreed on procedures 3.67 4.50** 3.30 3.71 3.00 4.00 4.00** 3.81**
The results of post-audits assist to evaluate projects 3.33 4.00** 3.50 3.61** 4.00 3.50 4.09** 3.96
A post implementation audit provides useful feedback 4.33** 4.25** 3.70** 3.54** 4.00 4.00 4.09** 3.94
Audit information prompts management 3.67 3.50** 3.40 3.75 4.00 4.00 4.32** 3.85
Post-audits support process of the investment implementation 4.00 3.50** 3.40 3.46** 4.00 4.00 4.32** 3.85
Audits contribute to improvement of investment decision 3.00 4.50** 3.30 3.64 4.00 4.00 4.18** 3.83
Post-audit opinion are logical and well documented 4.00** 4.00** 3.70** 3.89 4.00 4.50 4.23** 3.89
Table 5.25 (g)-Post-Audit vs. Ownership
Post-audit (PA) Australian Firm Ownership Sri Lankan Firm Ownership
Domestic Foreign Domestic Foreign
The post-audit is an important. 4.40** 4.00 4.33** 4.80**
The auditor discusses key results with CFO during the progress 4.13** 3.50 4.16** 4.00
Firm satisfies with the purpose, scope, results of the post-audit 3.90** 3.50 4.04** 4.00
The firm has regular and pre-agreed on procedures 3.75** 3.50 3.85** 4.00**
The results of post-audits assist to evaluate projects 3.60** 4.00 3.97** 4.40**
A post implementation audit provides useful feedback 3.65** 3.50 3.99** 4.00**
Audit information prompts management 3.75** 2.50 3.97** 4.40**
Post-audits support process of the investment implementation 3.53** 2.50 3.99** 4.20**
Audits contribute to improvement of investment decision 3.63** 2.50 3.93** 4.20**
Post-audit opinion are logical and well documented 3.93** 3.50 4.00** 4.20**
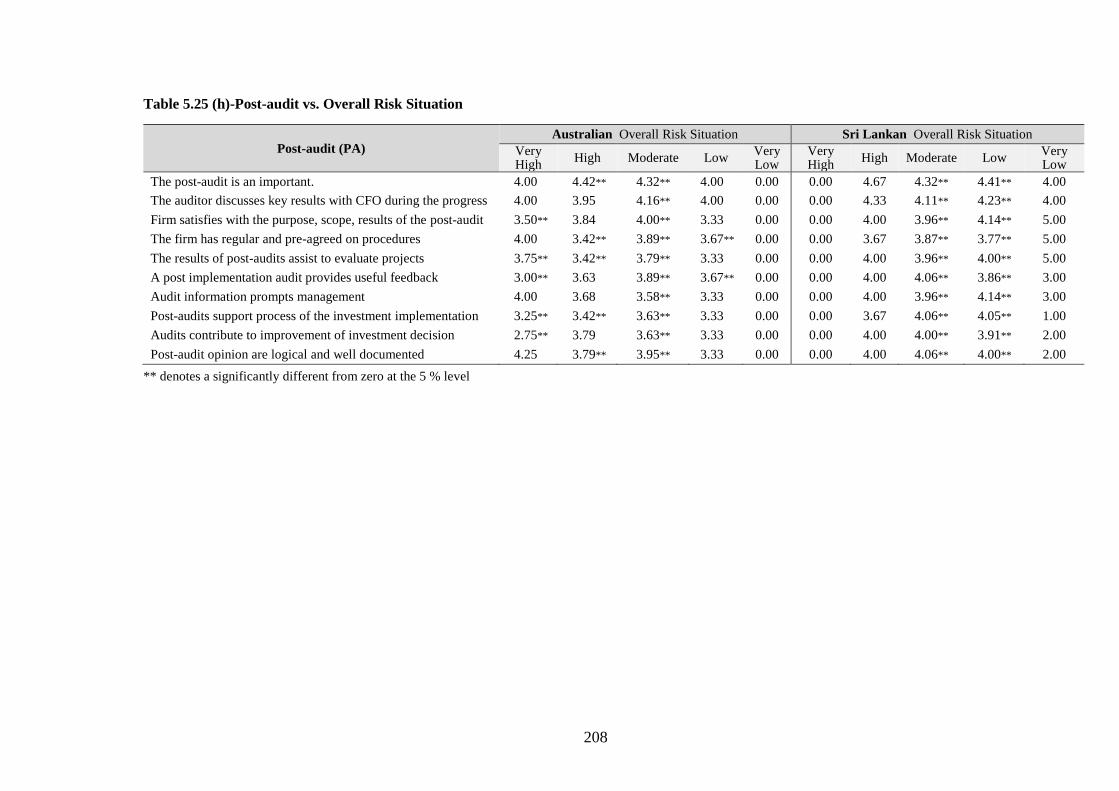
208
Table 5.25 (h)-Post-audit vs. Overall Risk Situation
** denotes a significantly different from zero at the 5 % level
Post-audit (PA) Australian Overall Risk Situation Sri Lankan Overall Risk Situation
Very High
High Moderate Low Very Low
Very High
High Moderate Low Very Low
The post-audit is an important. 4.00 4.42** 4.32** 4.00 0.00 0.00 4.67 4.32** 4.41** 4.00
The auditor discusses key results with CFO during the progress 4.00 3.95 4.16** 4.00 0.00 0.00 4.33 4.11** 4.23** 4.00
Firm satisfies with the purpose, scope, results of the post-audit 3.50** 3.84 4.00** 3.33 0.00 0.00 4.00 3.96** 4.14** 5.00
The firm has regular and pre-agreed on procedures 4.00 3.42** 3.89** 3.67** 0.00 0.00 3.67 3.87** 3.77** 5.00
The results of post-audits assist to evaluate projects 3.75** 3.42** 3.79** 3.33 0.00 0.00 4.00 3.96** 4.00** 5.00
A post implementation audit provides useful feedback 3.00** 3.63 3.89** 3.67** 0.00 0.00 4.00 4.06** 3.86** 3.00
Audit information prompts management 4.00 3.68 3.58** 3.33 0.00 0.00 4.00 3.96** 4.14** 3.00
Post-audits support process of the investment implementation 3.25** 3.42** 3.63** 3.33 0.00 0.00 3.67 4.06** 4.05** 1.00
Audits contribute to improvement of investment decision 2.75** 3.79 3.63** 3.33 0.00 0.00 4.00 4.00** 3.91** 2.00
Post-audit opinion are logical and well documented 4.25 3.79** 3.95** 3.33 0.00 0.00 4.00 4.06** 4.00** 2.00
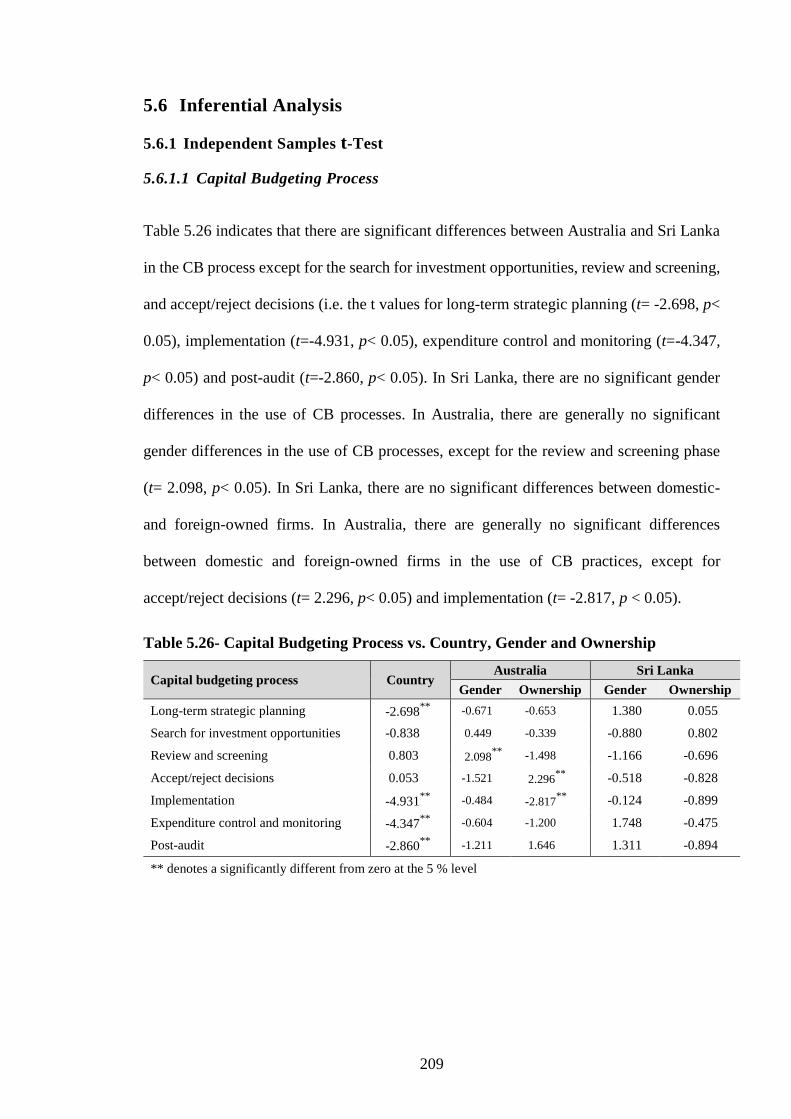
209
5.6 Inferential Analysis
5.6.1 Independent Samples t-Test
5.6.1.1 Capital Budgeting Process
Table 5.26 indicates that there are significant differences between Australia and Sri Lanka
in the CB process except for the search for investment opportunities, review and screening,
and accept/reject decisions (i.e. the t values for long-term strategic planning (t= -2.698, p<
0.05), implementation (t=-4.931, p< 0.05), expenditure control and monitoring (t=-4.347,
p< 0.05) and post-audit (t=-2.860, p< 0.05). In Sri Lanka, there are no significant gender
differences in the use of CB processes. In Australia, there are generally no significant
gender differences in the use of CB processes, except for the review and screening phase
(t= 2.098, p< 0.05). In Sri Lanka, there are no significant differences between domestic-
and foreign-owned firms. In Australia, there are generally no significant differences
between domestic and foreign-owned firms in the use of CB practices, except for
accept/reject decisions (t= 2.296, p< 0.05) and implementation (t= -2.817, p < 0.05).
Table 5.26- Capital Budgeting Process vs. Country, Gender and Ownership
Capital budgeting process Country Australia Sri Lanka
Gender Ownership Gender Ownership
Long-term strategic planning -2.698**
-0.671 -0.653 1.380 0.055
Search for investment opportunities -0.838 0.449 -0.339 -0.880 0.802
Review and screening 0.803 2.098**
-1.498 -1.166 -0.696
Accept/reject decisions 0.053 -1.521 2.296**
-0.518 -0.828
Implementation -4.931**
-0.484 -2.817**
-0.124 -0.899
Expenditure control and monitoring -4.347**
-0.604 -1.200 1.748 -0.475
Post-audit -2.860**
-1.211 1.646 1.311 -0.894
** denotes a significantly different from zero at the 5 % level
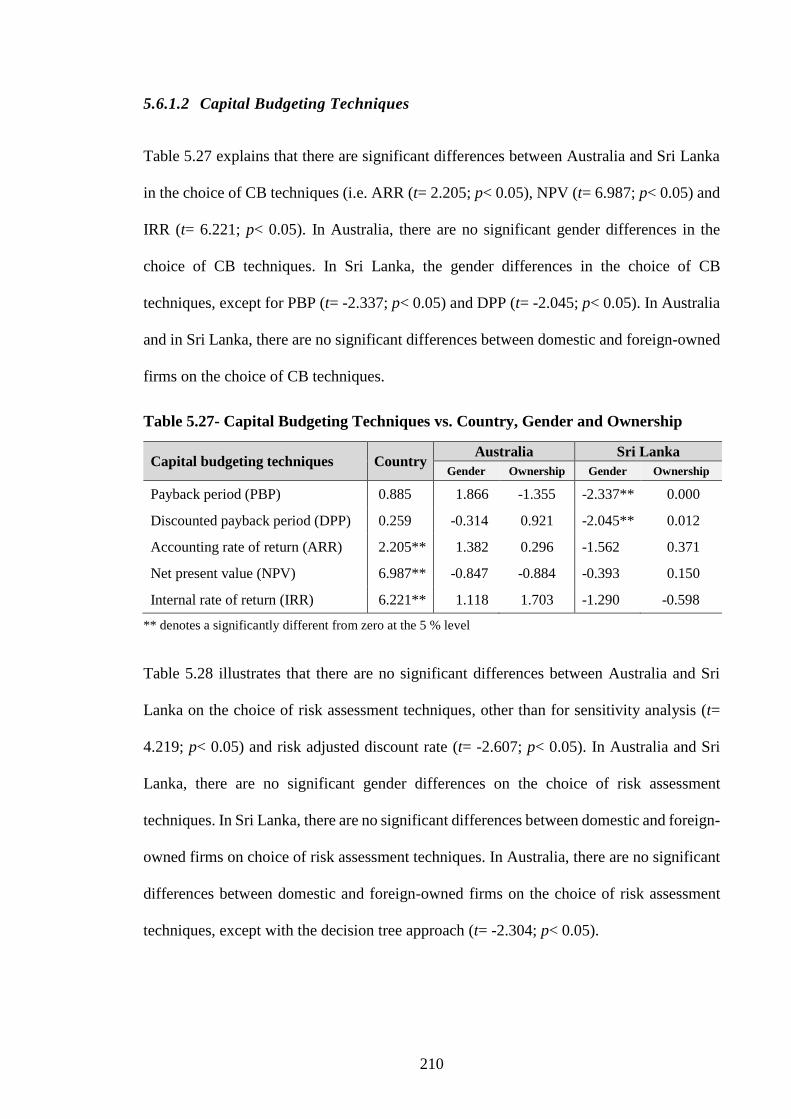
210
5.6.1.2 Capital Budgeting Techniques
Table 5.27 explains that there are significant differences between Australia and Sri Lanka
in the choice of CB techniques (i.e. ARR (t= 2.205; p< 0.05), NPV (t= 6.987; p< 0.05) and
IRR (t= 6.221; p< 0.05). In Australia, there are no significant gender differences in the
choice of CB techniques. In Sri Lanka, the gender differences in the choice of CB
techniques, except for PBP (t= -2.337; p< 0.05) and DPP (t= -2.045; p< 0.05). In Australia
and in Sri Lanka, there are no significant differences between domestic and foreign-owned
firms on the choice of CB techniques.
Table 5.27- Capital Budgeting Techniques vs. Country, Gender and Ownership
** denotes a significantly different from zero at the 5 % level
Table 5.28 illustrates that there are no significant differences between Australia and Sri
Lanka on the choice of risk assessment techniques, other than for sensitivity analysis (t=
4.219; p< 0.05) and risk adjusted discount rate (t= -2.607; p< 0.05). In Australia and Sri
Lanka, there are no significant gender differences on the choice of risk assessment
techniques. In Sri Lanka, there are no significant differences between domestic and foreign-
owned firms on choice of risk assessment techniques. In Australia, there are no significant
differences between domestic and foreign-owned firms on the choice of risk assessment
techniques, except with the decision tree approach (t= -2.304; p< 0.05).
Capital budgeting techniques Country Australia Sri Lanka
Gender Ownership Gender Ownership
Payback period (PBP) 0.885 1.866 -1.355 -2.337** 0.000
Discounted payback period (DPP) 0.259 -0.314 0.921 -2.045** 0.012
Accounting rate of return (ARR) 2.205** 1.382 0.296 -1.562 0.371
Net present value (NPV) 6.987** -0.847 -0.884 -0.393 0.150
Internal rate of return (IRR) 6.221** 1.118 1.703 -1.290 -0.598
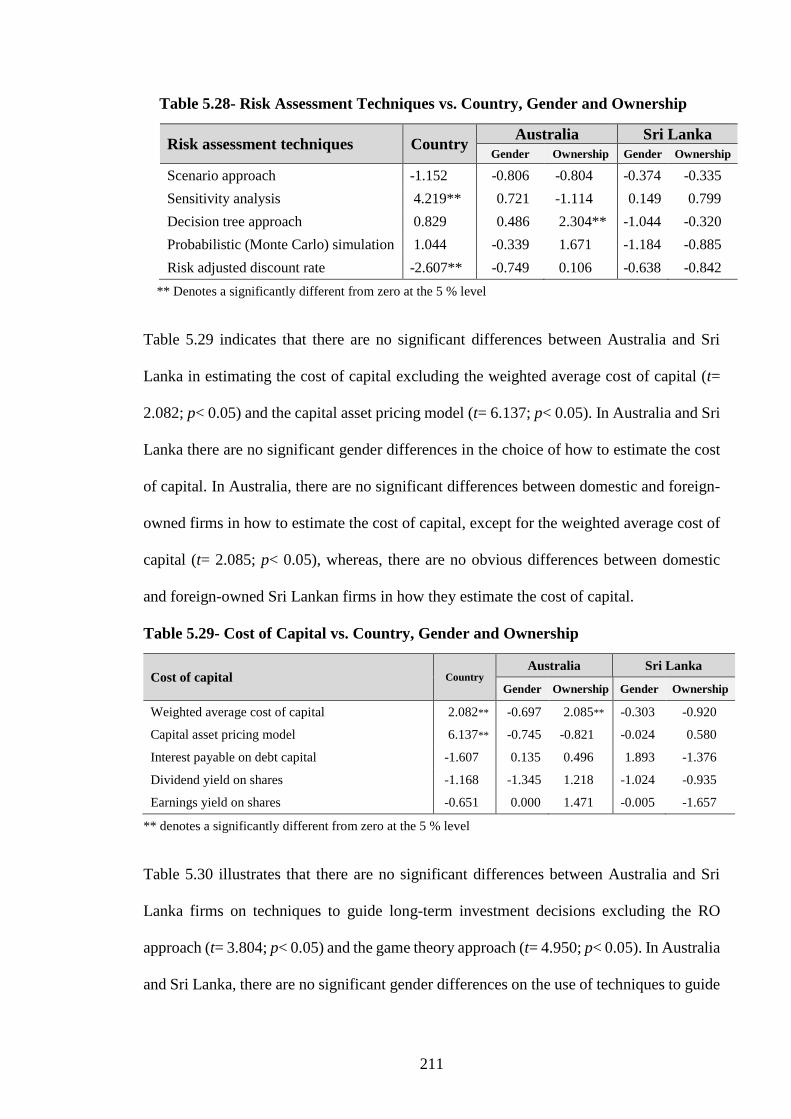
211
Table 5.28- Risk Assessment Techniques vs. Country, Gender and Ownership
** Denotes a significantly different from zero at the 5 % level
Table 5.29 indicates that there are no significant differences between Australia and Sri
Lanka in estimating the cost of capital excluding the weighted average cost of capital (t=
2.082; p< 0.05) and the capital asset pricing model (t= 6.137; p< 0.05). In Australia and Sri
Lanka there are no significant gender differences in the choice of how to estimate the cost
of capital. In Australia, there are no significant differences between domestic and foreign-
owned firms in how to estimate the cost of capital, except for the weighted average cost of
capital (t= 2.085; p< 0.05), whereas, there are no obvious differences between domestic
and foreign-owned Sri Lankan firms in how they estimate the cost of capital.
Table 5.29- Cost of Capital vs. Country, Gender and Ownership
** denotes a significantly different from zero at the 5 % level
Table 5.30 illustrates that there are no significant differences between Australia and Sri
Lanka firms on techniques to guide long-term investment decisions excluding the RO
approach (t= 3.804; p< 0.05) and the game theory approach (t= 4.950; p< 0.05). In Australia
and Sri Lanka, there are no significant gender differences on the use of techniques to guide
Risk assessment techniques Country Australia Sri Lanka
Gender Ownership Gender Ownership
Scenario approach -1.152 -0.806 -0.804 -0.374 -0.335
Sensitivity analysis 4.219** 0.721 -1.114 0.149 0.799
Decision tree approach 0.829 0.486 2.304** -1.044 -0.320
Probabilistic (Monte Carlo) simulation 1.044 -0.339 1.671 -1.184 -0.885
Risk adjusted discount rate -2.607** -0.749 0.106 -0.638 -0.842
Cost of capital Country Australia Sri Lanka
Gender Ownership Gender Ownership
Weighted average cost of capital 2.082** -0.697 2.085** -0.303 -0.920
Capital asset pricing model 6.137** -0.745 -0.821 -0.024 0.580
Interest payable on debt capital -1.607 0.135 0.496 1.893 -1.376
Dividend yield on shares -1.168 -1.345 1.218 -1.024 -0.935
Earnings yield on shares -0.651 0.000 1.471 -0.005 -1.657
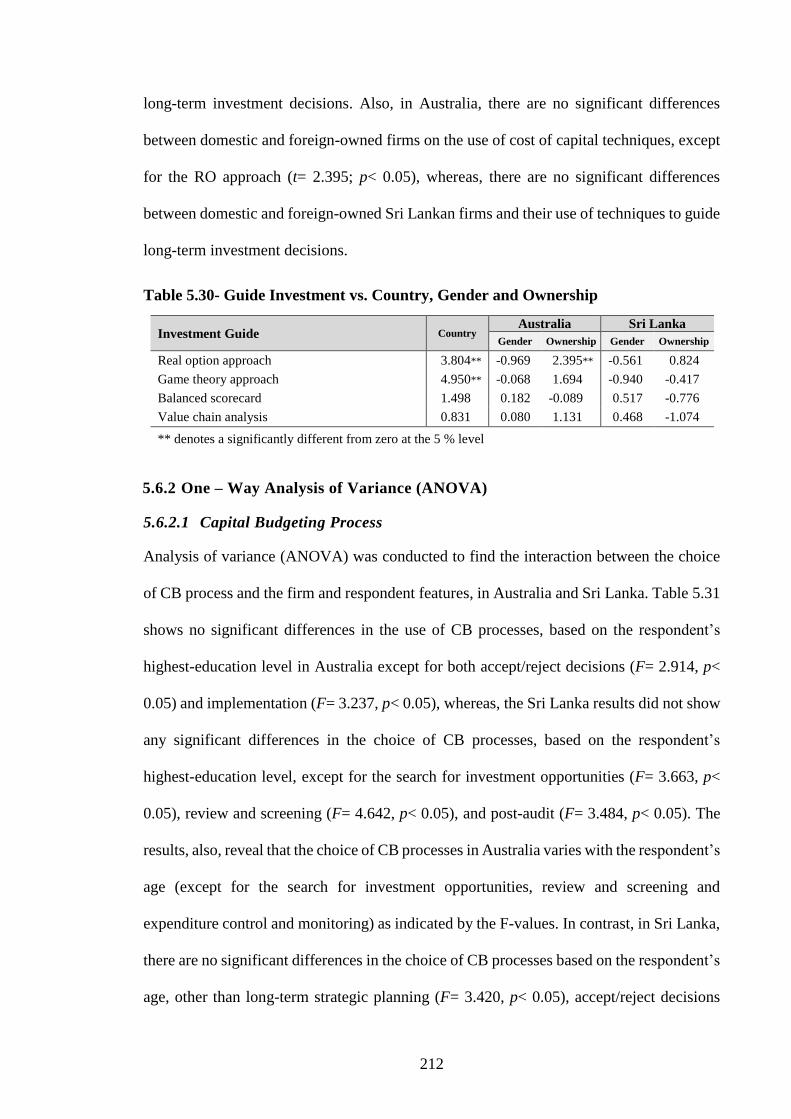
212
long-term investment decisions. Also, in Australia, there are no significant differences
between domestic and foreign-owned firms on the use of cost of capital techniques, except
for the RO approach (t= 2.395; p< 0.05), whereas, there are no significant differences
between domestic and foreign-owned Sri Lankan firms and their use of techniques to guide
long-term investment decisions.
Table 5.30- Guide Investment vs. Country, Gender and Ownership
5.6.2 One – Way Analysis of Variance (ANOVA)
5.6.2.1 Capital Budgeting Process
Analysis of variance (ANOVA) was conducted to find the interaction between the choice
of CB process and the firm and respondent features, in Australia and Sri Lanka. Table 5.31
shows no significant differences in the use of CB processes, based on the respondent’s
highest-education level in Australia except for both accept/reject decisions (F= 2.914, p<
0.05) and implementation (F= 3.237, p< 0.05), whereas, the Sri Lanka results did not show
any significant differences in the choice of CB processes, based on the respondent’s
highest-education level, except for the search for investment opportunities (F= 3.663, p<
0.05), review and screening (F= 4.642, p< 0.05), and post-audit (F= 3.484, p< 0.05). The
results, also, reveal that the choice of CB processes in Australia varies with the respondent’s
age (except for the search for investment opportunities, review and screening and
expenditure control and monitoring) as indicated by the F-values. In contrast, in Sri Lanka,
there are no significant differences in the choice of CB processes based on the respondent’s
age, other than long-term strategic planning (F= 3.420, p< 0.05), accept/reject decisions
Investment Guide Country Australia Sri Lanka
Gender Ownership Gender Ownership
Real option approach 3.804** -0.969 2.395** -0.561 0.824
Game theory approach 4.950** -0.068 1.694 -0.940 -0.417
Balanced scorecard 1.498 0.182 -0.089 0.517 -0.776
Value chain analysis 0.831 0.080 1.131 0.468 -1.074
** denotes a significantly different from zero at the 5 % level
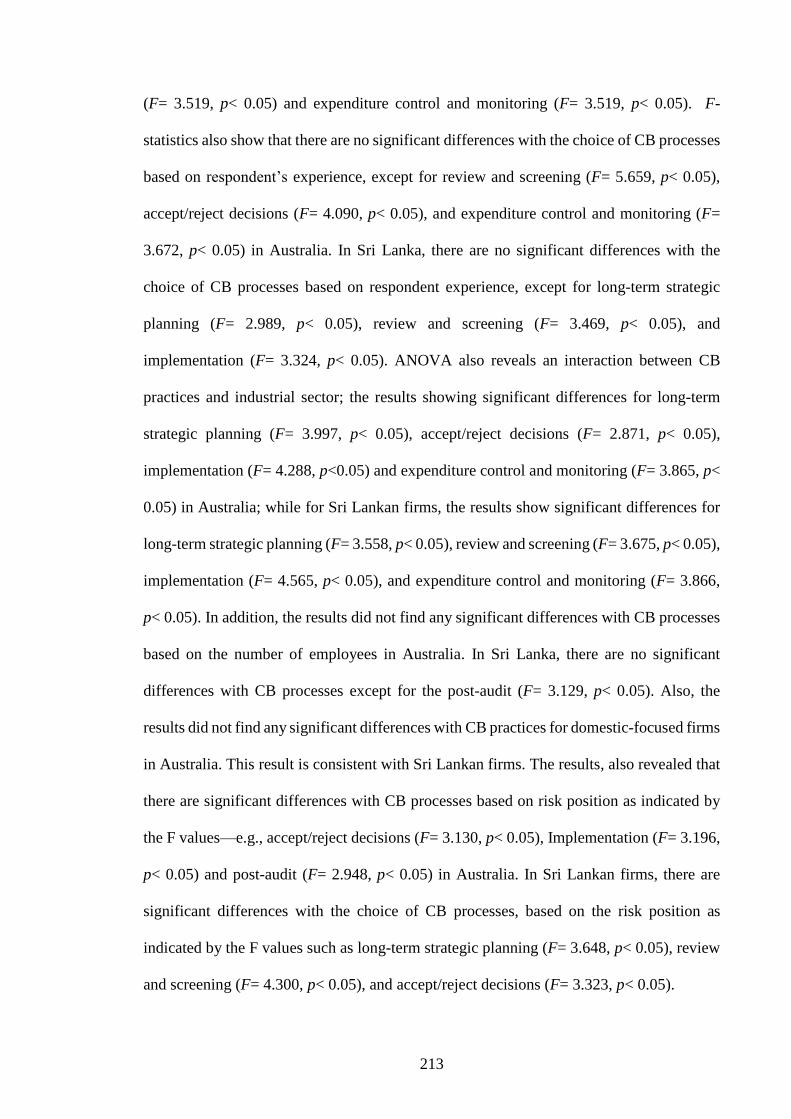
213
(F= 3.519, p< 0.05) and expenditure control and monitoring (F= 3.519, p< 0.05). F-
statistics also show that there are no significant differences with the choice of CB processes
based on respondent’s experience, except for review and screening (F= 5.659, p< 0.05),
accept/reject decisions (F= 4.090, p< 0.05), and expenditure control and monitoring (F=
3.672, p< 0.05) in Australia. In Sri Lanka, there are no significant differences with the
choice of CB processes based on respondent experience, except for long-term strategic
planning (F= 2.989, p< 0.05), review and screening (F= 3.469, p< 0.05), and
implementation (F= 3.324, p< 0.05). ANOVA also reveals an interaction between CB
practices and industrial sector; the results showing significant differences for long-term
strategic planning (F= 3.997, p< 0.05), accept/reject decisions (F= 2.871, p< 0.05),
implementation (F= 4.288, p<0.05) and expenditure control and monitoring (F= 3.865, p<
0.05) in Australia; while for Sri Lankan firms, the results show significant differences for
long-term strategic planning (F= 3.558, p< 0.05), review and screening (F= 3.675, p< 0.05),
implementation (F= 4.565, p< 0.05), and expenditure control and monitoring (F= 3.866,
p< 0.05). In addition, the results did not find any significant differences with CB processes
based on the number of employees in Australia. In Sri Lanka, there are no significant
differences with CB processes except for the post-audit (F= 3.129, p< 0.05). Also, the
results did not find any significant differences with CB practices for domestic-focused firms
in Australia. This result is consistent with Sri Lankan firms. The results, also revealed that
there are significant differences with CB processes based on risk position as indicated by
the F values—e.g., accept/reject decisions (F= 3.130, p< 0.05), Implementation (F= 3.196,
p< 0.05) and post-audit (F= 2.948, p< 0.05) in Australia. In Sri Lankan firms, there are
significant differences with the choice of CB processes, based on the risk position as
indicated by the F values such as long-term strategic planning (F= 3.648, p< 0.05), review
and screening (F= 4.300, p< 0.05), and accept/reject decisions (F= 3.323, p< 0.05).
214
Table 5.31- Capital Budgeting Processes vs. Firm and Its Respondent’s Attributes
5.6.2.2 Capital Budgeting Techniques
The results of the ANOVA (conducted to find the interaction between CB-appraisal
techniques and firm and respondent’s attributes; Table 5.32) shows that there are no
differences at the significance level p= 0.05 in the responses to the use of PBP in selecting
investments due to firm and its respondent’s attributes in Australia. In Sri Lankan firms
there are significant differences in the use of PBP, based on educational background with
F-statistics 2.412 (p< 0.05). F statistics show that use of DPP is significantly related to
industry sectors (F= 2.472; p< 0.05) and the number of employees (F= 3.267; p< 0.05) in
Australia. In Sri Lankan firms, the use of DPP reports on DPP, performed significantly
different with educational background (F= 3.620; p< 0.05), Respondent’s experience
(F=3.304; p<0.05), industry (F=2.136; p<0.05), number of employees (F= 4.202; p< 0.05)
and domestic income level (F= 2.594; p< 0.05). Based on the ARR there are significant
Capital budgeting process Australia
Education Age Respondent experience
Industry No of
employees Domestic income
Risk position
Long-term strategic planning 1.245 3.519** 2.138 3.997** 0.381 0.467 0.234
Search for investment opportunities 0.810 2.116 1.123 1.822 0.851 0.321 1.098
Review and screening 0.875 1.761 5.659** 1.642 0591 0.453 1.295
Accept/reject decisions 2.914** 3.285** 4.090** 2.871** 1.158 0.498 3.130**
Implementation 3.237** 4.163** 1.945 4.288** 1.382 0.709 3.196**
Expenditure control & monitoring 1.021 2.396 3.672** 3.865** 1.715 0.380 1.421
Post-audit 1.335 3.063** 1.053 1.148 2.112 0.986 2.948**
Capital budgeting processes Sri Lanka
Education Age Respondent experience
Industry No of
employees Domestic income
Risk position
Long-term strategic planning 2.083 3.420** 2.989** 3.866** 0.201 0.263 3.648**
Search for investment opportunities 3.663** 2.336 1.397 2.578 0.140 0.833 1.223
Review and screening 4.642** 1.820 3.469** 3.675** 1.396 0.052 4.300**
Accept/reject decisions 1.599 3.397** 2.081 2.905 0.679 0.536 3.323**
Implementation 1.188 1.234 3.324** 4.565** 2.169 1.686 1.255
Expenditure control and monitoring 1.274 4.332** 1.588 3.558** 0.307 0.972 1.337
Post-audit 3.484** 0.752 1.170 1.048 3.129** 2.594 1.593
** Denotes a significantly different from zero at the 5 % level
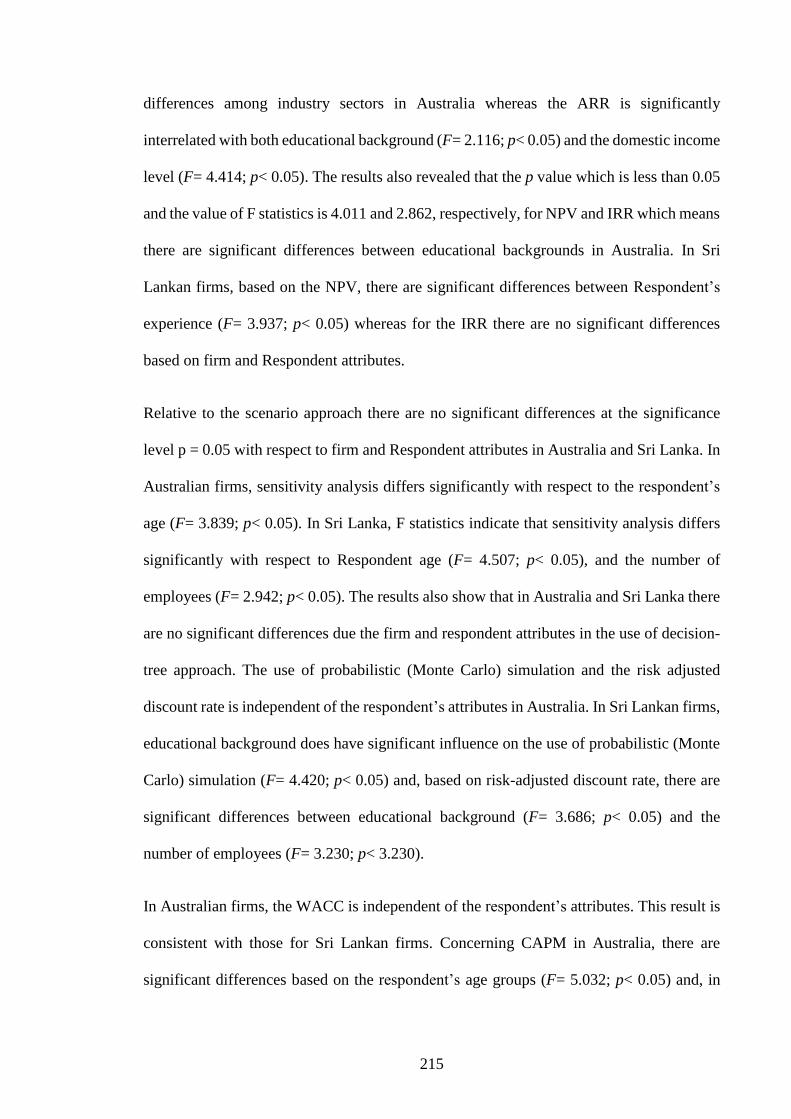
215
differences among industry sectors in Australia whereas the ARR is significantly
interrelated with both educational background (F= 2.116; p< 0.05) and the domestic income
level (F= 4.414; p< 0.05). The results also revealed that the p value which is less than 0.05
and the value of F statistics is 4.011 and 2.862, respectively, for NPV and IRR which means
there are significant differences between educational backgrounds in Australia. In Sri
Lankan firms, based on the NPV, there are significant differences between Respondent’s
experience (F= 3.937; p< 0.05) whereas for the IRR there are no significant differences
based on firm and Respondent attributes.
Relative to the scenario approach there are no significant differences at the significance
level p = 0.05 with respect to firm and Respondent attributes in Australia and Sri Lanka. In
Australian firms, sensitivity analysis differs significantly with respect to the respondent’s
age (F= 3.839; p< 0.05). In Sri Lanka, F statistics indicate that sensitivity analysis differs
significantly with respect to Respondent age (F= 4.507; p< 0.05), and the number of
employees (F= 2.942; p< 0.05). The results also show that in Australia and Sri Lanka there
are no significant differences due the firm and respondent attributes in the use of decision-
tree approach. The use of probabilistic (Monte Carlo) simulation and the risk adjusted
discount rate is independent of the respondent’s attributes in Australia. In Sri Lankan firms,
educational background does have significant influence on the use of probabilistic (Monte
Carlo) simulation (F= 4.420; p< 0.05) and, based on risk-adjusted discount rate, there are
significant differences between educational background (F= 3.686; p< 0.05) and the
number of employees (F= 3.230; p< 3.230).
In Australian firms, the WACC is independent of the respondent’s attributes. This result is
consistent with those for Sri Lankan firms. Concerning CAPM in Australia, there are
significant differences based on the respondent’s age groups (F= 5.032; p< 0.05) and, in
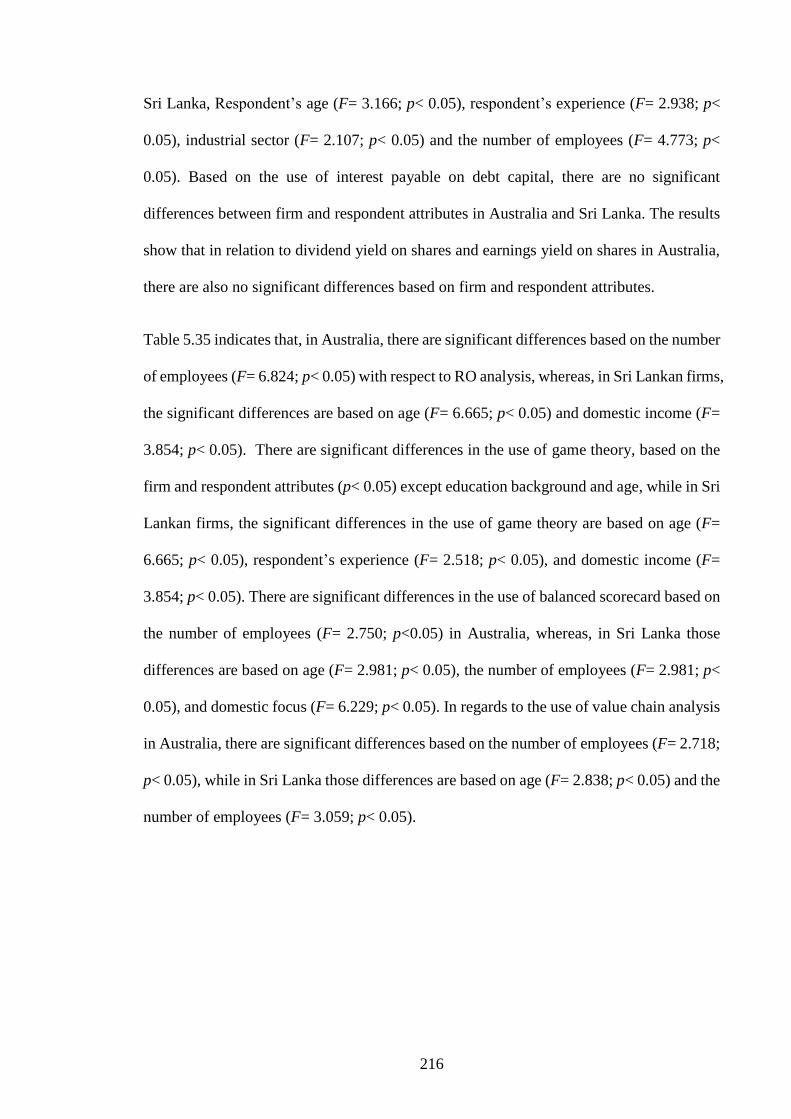
216
Sri Lanka, Respondent’s age (F= 3.166; p< 0.05), respondent’s experience (F= 2.938; p<
0.05), industrial sector (F= 2.107; p< 0.05) and the number of employees (F= 4.773; p<
0.05). Based on the use of interest payable on debt capital, there are no significant
differences between firm and respondent attributes in Australia and Sri Lanka. The results
show that in relation to dividend yield on shares and earnings yield on shares in Australia,
there are also no significant differences based on firm and respondent attributes.
Table 5.35 indicates that, in Australia, there are significant differences based on the number
of employees (F= 6.824; p< 0.05) with respect to RO analysis, whereas, in Sri Lankan firms,
the significant differences are based on age (F= 6.665; p< 0.05) and domestic income (F=
3.854; p< 0.05). There are significant differences in the use of game theory, based on the
firm and respondent attributes (p< 0.05) except education background and age, while in Sri
Lankan firms, the significant differences in the use of game theory are based on age (F=
6.665; p< 0.05), respondent’s experience (F= 2.518; p< 0.05), and domestic income (F=
3.854; p< 0.05). There are significant differences in the use of balanced scorecard based on
the number of employees (F= 2.750; p<0.05) in Australia, whereas, in Sri Lanka those
differences are based on age (F= 2.981; p< 0.05), the number of employees (F= 2.981; p<
0.05), and domestic focus (F= 6.229; p< 0.05). In regards to the use of value chain analysis
in Australia, there are significant differences based on the number of employees (F= 2.718;
p< 0.05), while in Sri Lanka those differences are based on age (F= 2.838; p< 0.05) and the
number of employees (F= 3.059; p< 0.05).
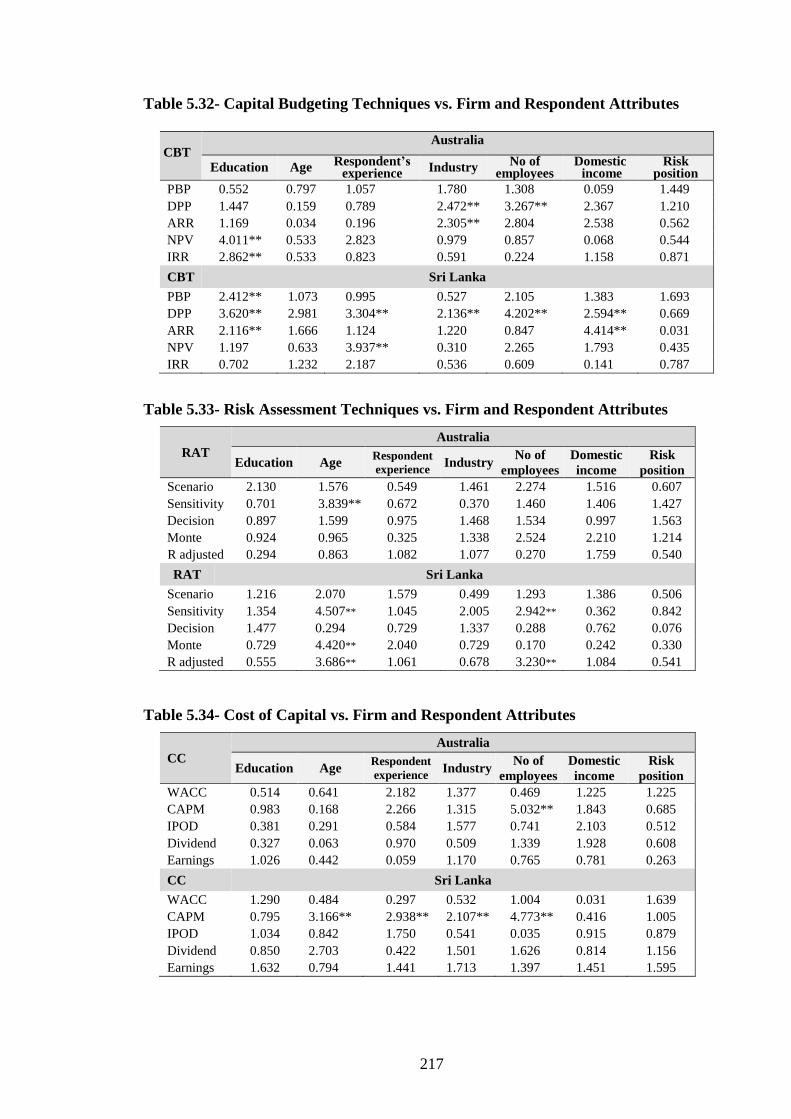
217
Table 5.32- Capital Budgeting Techniques vs. Firm and Respondent Attributes
Table 5.33- Risk Assessment Techniques vs. Firm and Respondent Attributes
Table 5.34- Cost of Capital vs. Firm and Respondent Attributes
CBT Australia
Education Age Respondent’s
experience Industry
No of employees
Domestic income
Risk position
PBP 0.552 0.797 1.057 1.780 1.308 0.059 1.449
DPP 1.447 0.159 0.789 2.472** 3.267** 2.367 1.210
ARR 1.169 0.034 0.196 2.305** 2.804 2.538 0.562
NPV 4.011** 0.533 2.823 0.979 0.857 0.068 0.544
IRR 2.862** 0.533 0.823 0.591 0.224 1.158 0.871
CBT Sri Lanka
PBP 2.412** 1.073 0.995 0.527 2.105 1.383 1.693
DPP 3.620** 2.981 3.304** 2.136** 4.202** 2.594** 0.669
ARR 2.116** 1.666 1.124 1.220 0.847 4.414** 0.031
NPV 1.197 0.633 3.937** 0.310 2.265 1.793 0.435
IRR 0.702 1.232 2.187 0.536 0.609 0.141 0.787
RAT
Australia
Education Age Respondent
experience Industry
No of
employees
Domestic
income
Risk
position
Scenario 2.130 1.576 0.549 1.461 2.274 1.516 0.607
Sensitivity 0.701 3.839** 0.672 0.370 1.460 1.406 1.427
Decision 0.897 1.599 0.975 1.468 1.534 0.997 1.563
Monte 0.924 0.965 0.325 1.338 2.524 2.210 1.214
R adjusted 0.294 0.863 1.082 1.077 0.270 1.759 0.540
RAT Sri Lanka
Scenario 1.216 2.070 1.579 0.499 1.293 1.386 0.506
Sensitivity 1.354 4.507** 1.045 2.005 2.942** 0.362 0.842
Decision 1.477 0.294 0.729 1.337 0.288 0.762 0.076
Monte 0.729 4.420** 2.040 0.729 0.170 0.242 0.330
R adjusted 0.555 3.686** 1.061 0.678 3.230** 1.084 0.541
CC
Australia
Education Age Respondent
experience Industry
No of
employees
Domestic
income
Risk
position
WACC 0.514 0.641 2.182 1.377 0.469 1.225 1.225
CAPM 0.983 0.168 2.266 1.315 5.032** 1.843 0.685
IPOD 0.381 0.291 0.584 1.577 0.741 2.103 0.512
Dividend 0.327 0.063 0.970 0.509 1.339 1.928 0.608
Earnings 1.026 0.442 0.059 1.170 0.765 0.781 0.263
CC Sri Lanka
WACC 1.290 0.484 0.297 0.532 1.004 0.031 1.639
CAPM 0.795 3.166** 2.938** 2.107** 4.773** 0.416 1.005
IPOD 1.034 0.842 1.750 0.541 0.035 0.915 0.879
Dividend 0.850 2.703 0.422 1.501 1.626 0.814 1.156
Earnings 1.632 0.794 1.441 1.713 1.397 1.451 1.595
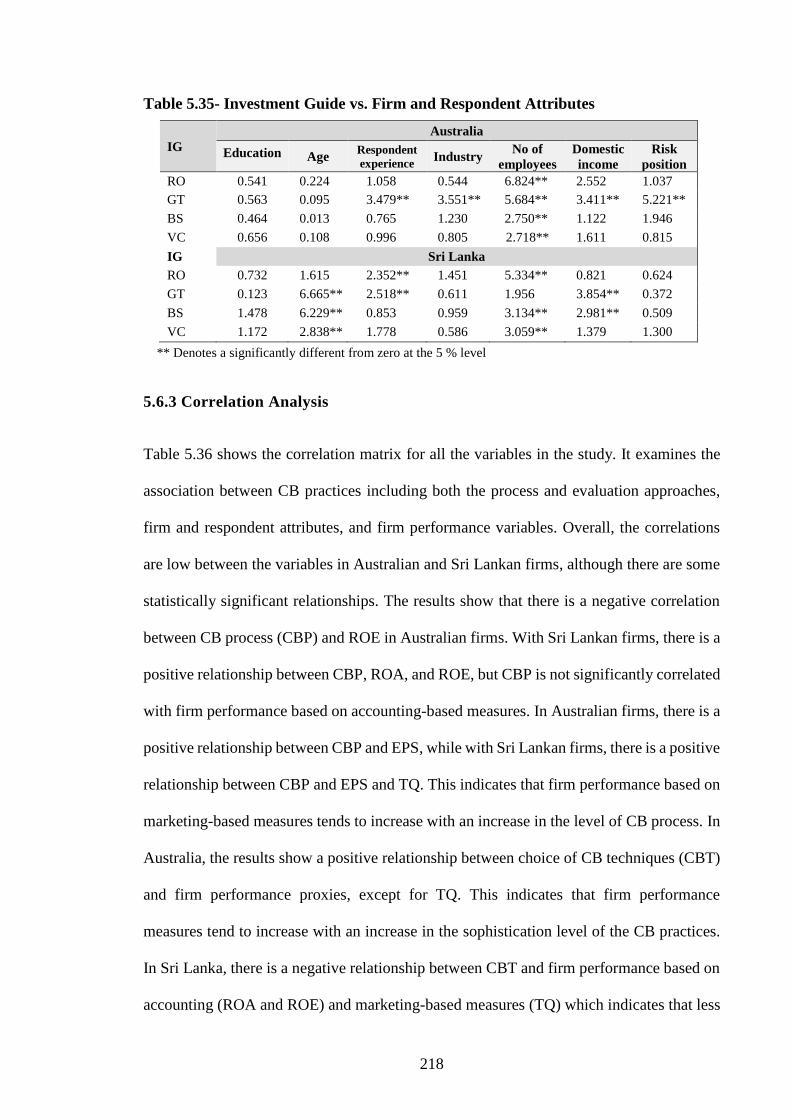
218
Table 5.35- Investment Guide vs. Firm and Respondent Attributes
** Denotes a significantly different from zero at the 5 % level
5.6.3 Correlation Analysis
Table 5.36 shows the correlation matrix for all the variables in the study. It examines the
association between CB practices including both the process and evaluation approaches,
firm and respondent attributes, and firm performance variables. Overall, the correlations
are low between the variables in Australian and Sri Lankan firms, although there are some
statistically significant relationships. The results show that there is a negative correlation
between CB process (CBP) and ROE in Australian firms. With Sri Lankan firms, there is a
positive relationship between CBP, ROA, and ROE, but CBP is not significantly correlated
with firm performance based on accounting-based measures. In Australian firms, there is a
positive relationship between CBP and EPS, while with Sri Lankan firms, there is a positive
relationship between CBP and EPS and TQ. This indicates that firm performance based on
marketing-based measures tends to increase with an increase in the level of CB process. In
Australia, the results show a positive relationship between choice of CB techniques (CBT)
and firm performance proxies, except for TQ. This indicates that firm performance
measures tend to increase with an increase in the sophistication level of the CB practices.
In Sri Lanka, there is a negative relationship between CBT and firm performance based on
accounting (ROA and ROE) and marketing-based measures (TQ) which indicates that less
IG
Australia
Education Age Respondent
experience Industry
No of
employees
Domestic
income
Risk
position
RO 0.541 0.224 1.058 0.544 6.824** 2.552 1.037
GT 0.563 0.095 3.479** 3.551** 5.684** 3.411** 5.221**
BS 0.464 0.013 0.765 1.230 2.750** 1.122 1.946
VC 0.656 0.108 0.996 0.805 2.718** 1.611 0.815
IG Sri Lanka
RO 0.732 1.615 2.352** 1.451 5.334** 0.821 0.624
GT 0.123 6.665** 2.518** 0.611 1.956 3.854** 0.372
BS 1.478 6.229** 0.853 0.959 3.134** 2.981** 0.509
VC 1.172 2.838** 1.778 0.586 3.059** 1.379 1.300
219
sophisticated level of choice of CBTs lead to less firm performance. The results of the
correlation matrix show the extent of correlation between firm and respondent attributes
used in this study. In Australia, respondents’ educational background (ED) is negatively
correlated with ROA, ROE while ED is positively related with firm performance based on
market measures (EPS and TQ) and also observed ED has significant relation on EPS at a
1% level. In contrast, there is a positive association between ED and firm performance
measures except for the ROE in Sri Lanka. Respondent’s maturity (experience) is positively
correlated with ROA and TQ in Australia, while, it is negatively correlated with ROE and
EPS. In addition, Respondent’s maturity is significantly correlated with respondents
management experience at a 5% level in Australia and Sri Lanka. Whereas, respondent’s
maturity is negatively associated with firm performance, except for ROA. In Australia,
respondent’s maturity has a positive relationship with ROA and EPS, but is negatively
related to ROE and TQ. Respondent’s management experience (ME) is positively
correlated with ROA and TQ, but negatively correlated with ROE and EPS in Australia and
has a significant effect on TQ, but only at a 5% level. In Sri Lanka, there is a positive
association between ME and ROA, ROE and EPS while it is a positive relationship with
TQ. A firm’s number of employees (NE) is negatively correlated with its performance,
based on accounting (ROA and ROE) and market-measures (EPS and TQ) in Australia and
in Sri Lanka NE is significantly correlated with ROA at a 5% level. Domestic income (DI)
earned capacity is negatively associated with ROA, EPS and TQ while it is positively
associated with ROE in Australia but is significantly correlated with EPS at a 1% level. In
Sri Lanka, there is a negative relationship between DI earned capacity and firm
performance measures (ROA, ROE, EPS and TQ). Moreover, there is a positive
relationship between firms’ ownership and firm performance measures except for EPS. In
Sri Lankan firms, ownership is positively associated with ROA and ROE, but is negatively
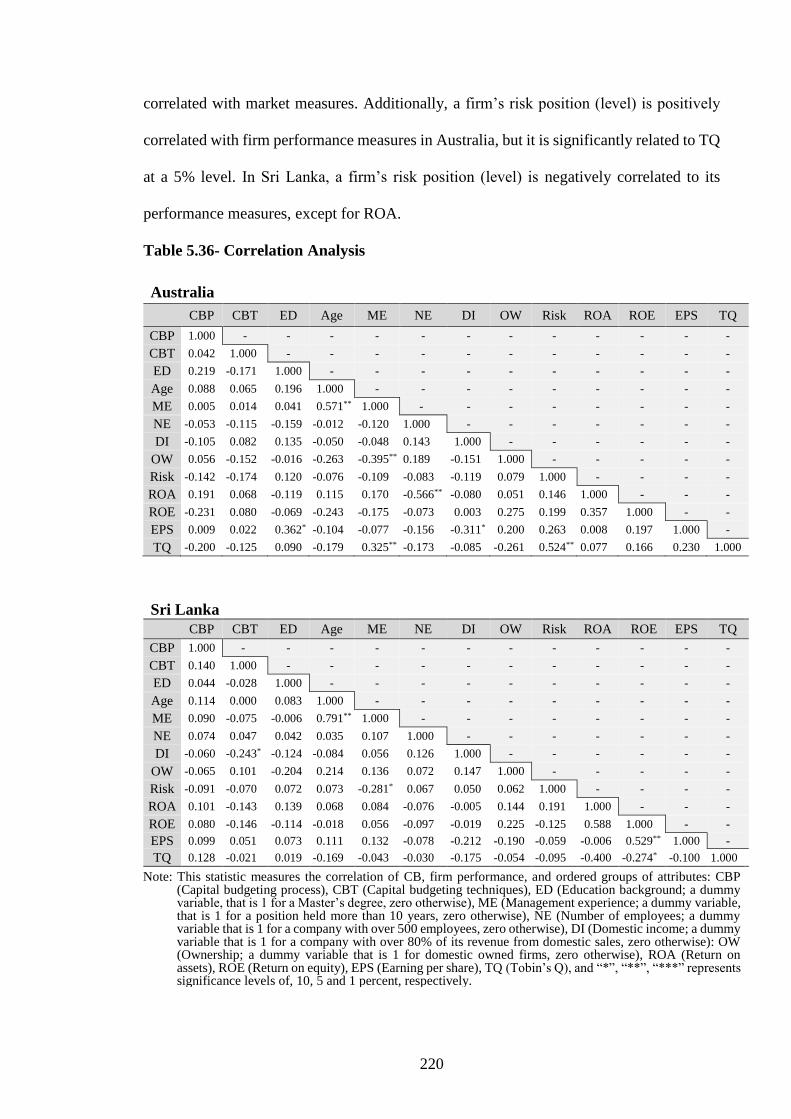
220
correlated with market measures. Additionally, a firm’s risk position (level) is positively
correlated with firm performance measures in Australia, but it is significantly related to TQ
at a 5% level. In Sri Lanka, a firm’s risk position (level) is negatively correlated to its
performance measures, except for ROA.
Table 5.36- Correlation Analysis
Sri Lanka
CBP CBT ED Age ME NE DI OW Risk ROA ROE EPS TQ
CBP 1.000 - - - - - - - - - - - - CBT 0.140 1.000 - - - - - - - - - - - ED 0.044 -0.028 1.000 - - - - - - - - - - Age 0.114 0.000 0.083 1.000 - - - - - - - - - ME 0.090 -0.075 -0.006 0.791** 1.000 - - - - - - - -
NE 0.074 0.047 0.042 0.035 0.107 1.000 - - - - - - -
DI -0.060 -0.243* -0.124 -0.084 0.056 0.126 1.000 - - - - - -
OW -0.065 0.101 -0.204 0.214 0.136 0.072 0.147 1.000 - - - - -
Risk -0.091 -0.070 0.072 0.073 -0.281* 0.067 0.050 0.062 1.000 - - - - ROA 0.101 -0.143 0.139 0.068 0.084 -0.076 -0.005 0.144 0.191 1.000 - - - ROE 0.080 -0.146 -0.114 -0.018 0.056 -0.097 -0.019 0.225 -0.125 0.588 1.000 - - EPS 0.099 0.051 0.073 0.111 0.132 -0.078 -0.212 -0.190 -0.059 -0.006 0.529** 1.000 -
TQ 0.128 -0.021 0.019 -0.169 -0.043 -0.030 -0.175 -0.054 -0.095 -0.400 -0.274* -0.100 1.000
Note: This statistic measures the correlation of CB, firm performance, and ordered groups of attributes: CBP (Capital budgeting process), CBT (Capital budgeting techniques), ED (Education background; a dummy variable, that is 1 for a Master’s degree, zero otherwise), ME (Management experience; a dummy variable, that is 1 for a position held more than 10 years, zero otherwise), NE (Number of employees; a dummy variable that is 1 for a company with over 500 employees, zero otherwise), DI (Domestic income; a dummy variable that is 1 for a company with over 80% of its revenue from domestic sales, zero otherwise): OW (Ownership; a dummy variable that is 1 for domestic owned firms, zero otherwise), ROA (Return on assets), ROE (Return on equity), EPS (Earning per share), TQ (Tobin’s Q), and “*”, “**”, “***” represents significance levels of, 10, 5 and 1 percent, respectively.
Australia
CBP CBT ED Age ME NE DI OW Risk ROA ROE EPS TQ
CBP 1.000 - - - - - - - - - - - - CBT 0.042 1.000 - - - - - - - - - - - ED 0.219 -0.171 1.000 - - - - - - - - - - Age 0.088 0.065 0.196 1.000 - - - - - - - - - ME 0.005 0.014 0.041 0.571** 1.000 - - - - - - - -
NE -0.053 -0.115 -0.159 -0.012 -0.120 1.000 - - - - - - -
DI -0.105 0.082 0.135 -0.050 -0.048 0.143 1.000 - - - - - -
OW 0.056 -0.152 -0.016 -0.263 -0.395** 0.189 -0.151 1.000 - - - - -
Risk -0.142 -0.174 0.120 -0.076 -0.109 -0.083 -0.119 0.079 1.000 - - - - ROA 0.191 0.068 -0.119 0.115 0.170 -0.566** -0.080 0.051 0.146 1.000 - - - ROE -0.231 0.080 -0.069 -0.243 -0.175 -0.073 0.003 0.275 0.199 0.357 1.000 - - EPS 0.009 0.022 0.362* -0.104 -0.077 -0.156 -0.311* 0.200 0.263 0.008 0.197 1.000 -
TQ -0.200 -0.125 0.090 -0.179 0.325** -0.173 -0.085 -0.261 0.524** 0.077 0.166 0.230 1.000
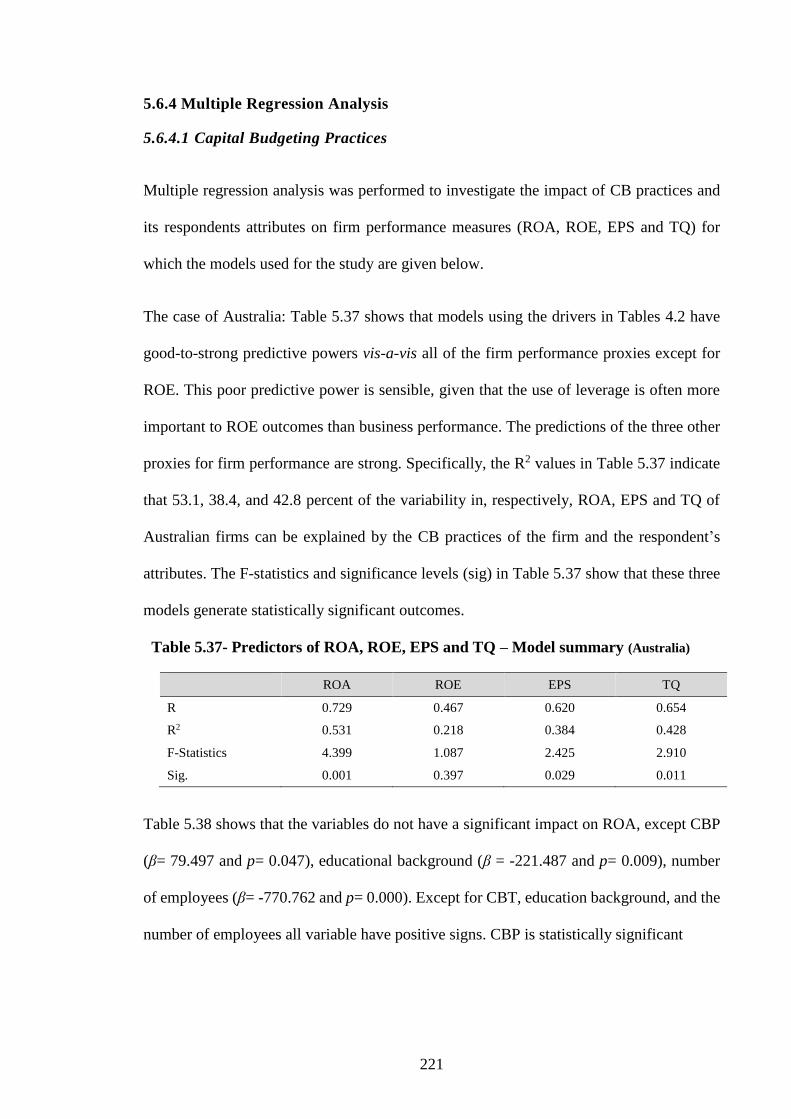
221
5.6.4 Multiple Regression Analysis
5.6.4.1 Capital Budgeting Practices
Multiple regression analysis was performed to investigate the impact of CB practices and
its respondents attributes on firm performance measures (ROA, ROE, EPS and TQ) for
which the models used for the study are given below.
The case of Australia: Table 5.37 shows that models using the drivers in Tables 4.2 have
good-to-strong predictive powers vis-a-vis all of the firm performance proxies except for
ROE. This poor predictive power is sensible, given that the use of leverage is often more
important to ROE outcomes than business performance. The predictions of the three other
proxies for firm performance are strong. Specifically, the R2 values in Table 5.37 indicate
that 53.1, 38.4, and 42.8 percent of the variability in, respectively, ROA, EPS and TQ of
Australian firms can be explained by the CB practices of the firm and the respondent’s
attributes. The F-statistics and significance levels (sig) in Table 5.37 show that these three
models generate statistically significant outcomes.
Table 5.37- Predictors of ROA, ROE, EPS and TQ – Model summary (Australia)
Table 5.38 shows that the variables do not have a significant impact on ROA, except CBP
(β= 79.497 and p= 0.047), educational background (β = -221.487 and p= 0.009), number
of employees (β= -770.762 and p= 0.000). Except for CBT, education background, and the
number of employees all variable have positive signs. CBP is statistically significant
ROA ROE EPS TQ
R 0.729 0.467 0.620 0.654
R2 0.531 0.218 0.384 0.428
F-Statistics 4.399 1.087 2.425 2.910
Sig. 0.001 0.397 0.029 0.011
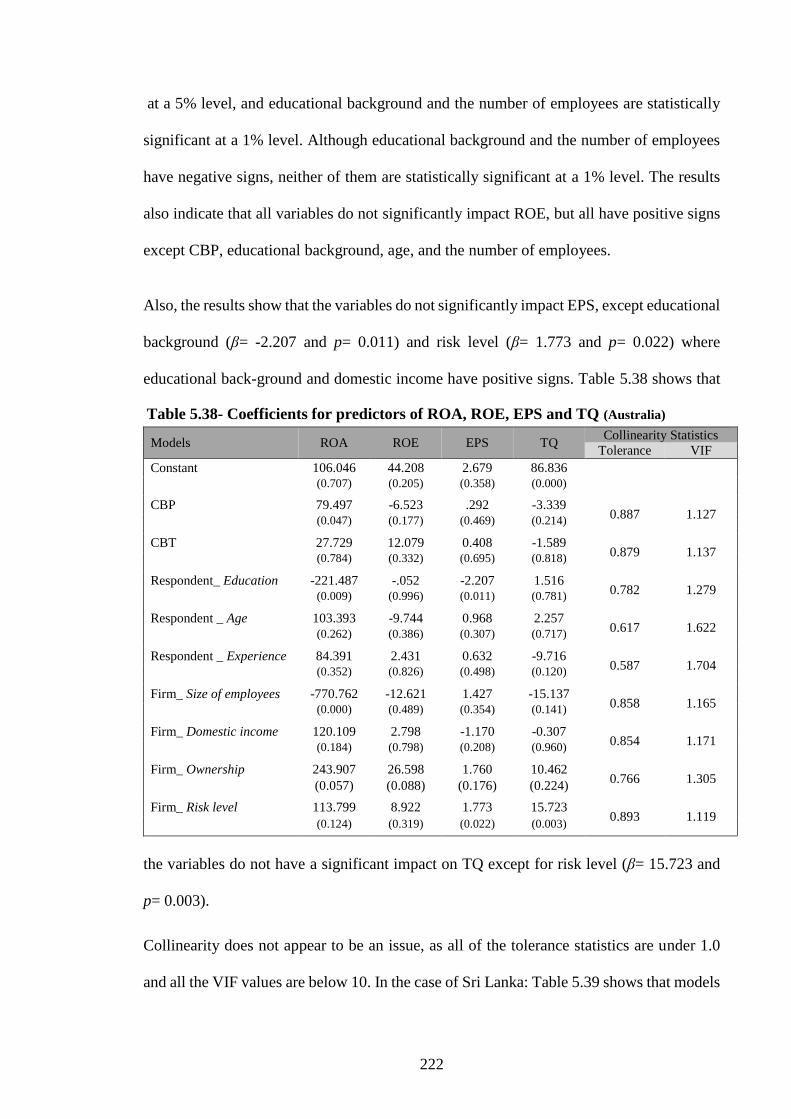
222
at a 5% level, and educational background and the number of employees are statistically
significant at a 1% level. Although educational background and the number of employees
have negative signs, neither of them are statistically significant at a 1% level. The results
also indicate that all variables do not significantly impact ROE, but all have positive signs
except CBP, educational background, age, and the number of employees.
Also, the results show that the variables do not significantly impact EPS, except educational
background (β= -2.207 and p= 0.011) and risk level (β= 1.773 and p= 0.022) where
educational back-ground and domestic income have positive signs. Table 5.38 shows that
the variables do not have a significant impact on TQ except for risk level (β= 15.723 and
p= 0.003).
Collinearity does not appear to be an issue, as all of the tolerance statistics are under 1.0
and all the VIF values are below 10. In the case of Sri Lanka: Table 5.39 shows that models
Table 5.38- Coefficients for predictors of ROA, ROE, EPS and TQ (Australia)
Models ROA ROE EPS TQ Collinearity Statistics
Tolerance VIF
Constant 106.046 44.208 2.679 86.836
(0.707) (0.205) (0.358) (0.000)
CBP 79.497 -6.523 .292 -3.339 0.887 1.127
(0.047) (0.177) (0.469) (0.214)
CBT 27.729 12.079 0.408 -1.589 0.879 1.137
(0.784) (0.332) (0.695) (0.818)
Respondent_ Education -221.487 -.052 -2.207 1.516 0.782 1.279
(0.009) (0.996) (0.011) (0.781)
Respondent _ Age 103.393 -9.744 0.968 2.257 0.617 1.622
(0.262) (0.386) (0.307) (0.717)
Respondent _ Experience 84.391 2.431 0.632 -9.716 0.587 1.704
(0.352) (0.826) (0.498) (0.120)
Firm_ Size of employees -770.762 -12.621 1.427 -15.137 0.858 1.165
(0.000) (0.489) (0.354) (0.141)
Firm_ Domestic income 120.109 2.798 -1.170 -0.307 0.854 1.171
(0.184) (0.798) (0.208) (0.960)
Firm_ Ownership 243.907 26.598 1.760 10.462 0.766 1.305
(0.057) (0.088) (0.176) (0.224)
Firm_ Risk level 113.799 8.922 1.773 15.723 0.893 1.119
(0.124) (0.319) (0.022) (0.003)
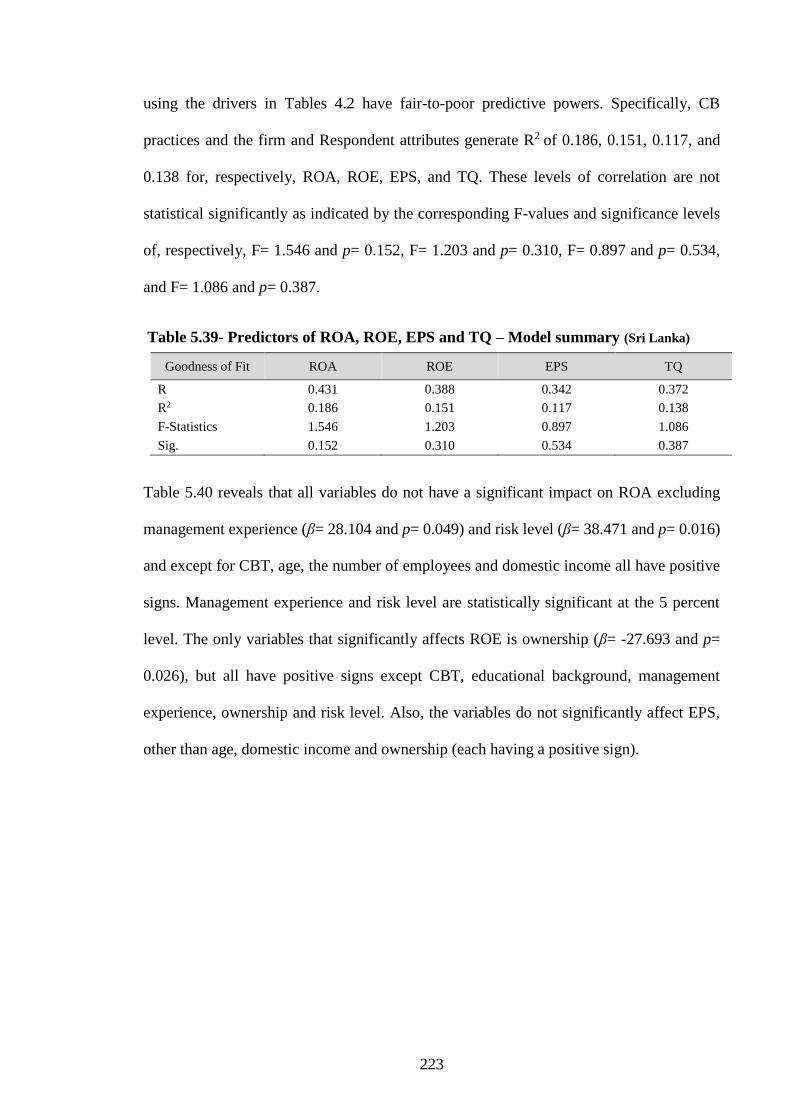
223
using the drivers in Tables 4.2 have fair-to-poor predictive powers. Specifically, CB
practices and the firm and Respondent attributes generate R2 of 0.186, 0.151, 0.117, and
0.138 for, respectively, ROA, ROE, EPS, and TQ. These levels of correlation are not
statistical significantly as indicated by the corresponding F-values and significance levels
of, respectively, F= 1.546 and p= 0.152, F= 1.203 and p= 0.310, F= 0.897 and p= 0.534,
and F= 1.086 and p= 0.387.
Table 5.39- Predictors of ROA, ROE, EPS and TQ – Model summary (Sri Lanka)
Table 5.40 reveals that all variables do not have a significant impact on ROA excluding
management experience (β= 28.104 and p= 0.049) and risk level (β= 38.471 and p= 0.016)
and except for CBT, age, the number of employees and domestic income all have positive
signs. Management experience and risk level are statistically significant at the 5 percent
level. The only variables that significantly affects ROE is ownership (β= -27.693 and p=
0.026), but all have positive signs except CBT, educational background, management
experience, ownership and risk level. Also, the variables do not significantly affect EPS,
other than age, domestic income and ownership (each having a positive sign).
Goodness of Fit ROA ROE EPS TQ
R 0.431 0.388 0.342 0.372
R2 0.186 0.151 0.117 0.138
F-Statistics 1.546 1.203 0.897 1.086
Sig. 0.152 0.310 0.534 0.387
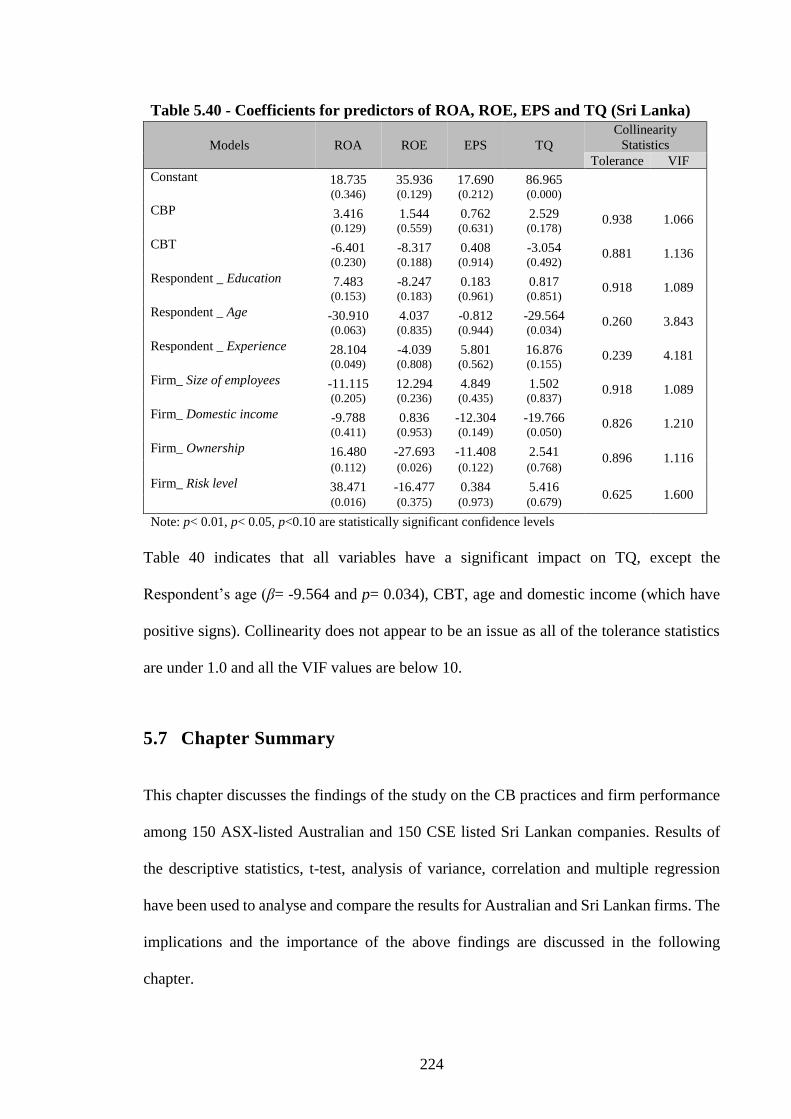
224
Table 40 indicates that all variables have a significant impact on TQ, except the
Respondent’s age (β= -9.564 and p= 0.034), CBT, age and domestic income (which have
positive signs). Collinearity does not appear to be an issue as all of the tolerance statistics
are under 1.0 and all the VIF values are below 10.
5.7 Chapter Summary
This chapter discusses the findings of the study on the CB practices and firm performance
among 150 ASX-listed Australian and 150 CSE listed Sri Lankan companies. Results of
the descriptive statistics, t-test, analysis of variance, correlation and multiple regression
have been used to analyse and compare the results for Australian and Sri Lankan firms. The
implications and the importance of the above findings are discussed in the following
chapter.
Table 5.40 - Coefficients for predictors of ROA, ROE, EPS and TQ (Sri Lanka)
Models ROA ROE EPS TQ
Collinearity
Statistics
Tolerance VIF
Constant 18.735 35.936 17.690 86.965
(0.346) (0.129) (0.212) (0.000)
CBP 3.416 1.544 0.762 2.529 0.938 1.066 (0.129) (0.559) (0.631) (0.178)
CBT -6.401 -8.317 0.408 -3.054 0.881 1.136 (0.230) (0.188) (0.914) (0.492)
Respondent _ Education 7.483 -8.247 0.183 0.817 0.918 1.089 (0.153) (0.183) (0.961) (0.851)
Respondent _ Age -30.910 4.037 -0.812 -29.564 0.260 3.843 (0.063) (0.835) (0.944) (0.034)
Respondent _ Experience 28.104 -4.039 5.801 16.876 0.239 4.181 (0.049) (0.808) (0.562) (0.155)
Firm_ Size of employees -11.115 12.294 4.849 1.502 0.918 1.089 (0.205) (0.236) (0.435) (0.837)
Firm_ Domestic income -9.788 0.836 -12.304 -19.766 0.826 1.210 (0.411) (0.953) (0.149) (0.050)
Firm_ Ownership 16.480 -27.693 -11.408 2.541 0.896 1.116
(0.112) (0.026) (0.122) (0.768)
Firm_ Risk level 38.471 -16.477 0.384 5.416 0.625 1.600
(0.016) (0.375) (0.973) (0.679)
Note: p< 0.01, p< 0.05, p<0.10 are statistically significant confidence levels
225
Chapter Six: Findings and Discussion
6.1 Chapter Introduction
This research aspirations and intent of this study are summarised in the following
hypotheses and sub-hypotheses that are first presented in Chapter 4 (Research Approach
and Methods):
H1: Capital budgeting practices are applied more extensively in developed countries than
in emerging countries.
H1a: There are significant differences in the application of CB practices
between industrial sectors.
H1b: There is a significant difference in CB practices between high risk and low
risk firms.
H1c: Firms and respondents attributes have an effect on the choice of CB
practices employed.
H2: The use of more sophisticated CB practices leads to higher performance than that of
firms using less sophisticated CB practices.
H2a: Capital budgeting processes significantly affect firm performance.
H2b: A firm’s CB techniques are expected to have a positive influence on a firm’s
performance.
The outcomes of the test used to validate/refute the above set of hypotheses are detailed in
Chapter 5 (Analysis and Results). This chapter discusses those outcomes, their consequence
for the above set of hypotheses, and their significance to CB Practices.
226
In the rest of the Chapter: Section 6.1 considers CB Practices in Australia and Sri Lanka;
and Section 6.2 Summarise the Chapter.
6.2 Capital Budgeting Practices in Australia and Sri Lanka
6.2.1 The H1- Hypothesis
H1: Capital budgeting practices are applied more extensively in developed countries than
in emerging countries.
The results of the analysis of the CB practices are given in Chapter 5. The t-test results
listed in Tables 5.26, 5.27, 5.28, 5.29, and 5.30 show that (at a 5% confidence level)
Australian and Sri Lankan firms have:
• Statistically-significant differences in their CB choices in their:
– Long-term strategic planning, implementation, expenditure control and
monitoring, and post-audit steps;
– Use of the ARR, NPV and IRR methods;
– Use of sensitivity analysis and the risk adjusted discount rate (as methods of
risk analysis in CB);
– Use of WACC and CAPM (as methods of estimating the cost of capital);
– Frequency of use of RO and GT,
• No statistically-significant differences in how they:
– Search for investment opportunities, do review and screening, and
accept/reject decisions.
These findings are consistent with studies conducted by Hermes et al. (2007), George
(2011), Shields, Chow, Kato, and Nakagawa (1991), McMahon (1981), Lilleyman (1984),
Freeman and Hobbes (1991), and Truong et al. (2008). However, the findings diverge from
Banda, Koralalage, Ratnayake, and Mudiyanselage (2014) who observed that Sri Lankan
firms rely heavily on NPV, IRR and DPP while the current evidence reveals that Sri Lankan
firms tend to use PBP more than other CB techniques. Taken together, these results suggest
227
that Australian respondents on average use more sophisticated CB practices than those used
by Sri Lankan respondents. These results support the H1 assertion that: Capital budgeting
practices are applied more extensively in developed countries than in emerging countries.
6.2.2 The H1a- Sub-Hypothesis
H1a: There are significant differences in the application of CB practices between
industrial sectors.
This has been evaluated by ANOVA tests which reveal significant differences (at a 5%
confidence level) between Australian firms, by industrial sector, for their CB process use
of: long-term strategic planning; accept/reject decisions; implementation and expenditure
control and monitoring phases. The equivalent tests for Sri Lankan firms, showed
significant differences (at a 5% confidence level), by industrial sector, for their use of: long-
term strategic planning; review and screening; implementation and expenditure control
and monitoring.
In CB appraisal techniques and investment analysis, Australian results show statistically
significant results (at a 5% confidence level) between industries for DPP and ARR. In the
use of risk analysis techniques, firms show no significant differences by industry sector, in
both Australia and Sri Lanka.
In Australia, the use of the cost of capital by firms does not differ significantly by industrial
sector. In Sri Lanka, use of the CAPM (to estimate the cost of capital) differs significantly
by industrial sector. However, using GT (as a CB guide) differs significantly by industrial
sector, in Australia, but there are no significant differences in Sri Lanka, by industry sector,
for the use of CB guide.

228
These findings are consistent with studies by: Batra and Verma (2014); Block (2005); De
Andrés et al. (2015); Hassan et al. (2011); Sandahal and Sjogren (2003); Schall and Sundem
(1980); and Verbeeten (2006), but contrary to a study by Farah et al. (2008). On balance,
this study confirms the sub-hypothesis H1a assertion of: there are significant differences in
the application of CB practices between industrial sectors.
6.2.3 The H1b- Sub-Hypothesis
H1b: There is a significant difference in CB practices between high-risk and low-risk
firms.
This is evaluated with ANOVA tests, which for:
Australia, show for firms of difference risk levels:
– Significant differences in accept/reject decisions and implementation and post-
audit, and
– Insignificant difference for other proxies of the CB process.
– Insignificant difference in the use of appraisal techniques, risk analysis
techniques, and estimation of the cost of capital.
Sri Lanka, show for firms of difference risk levels:
– Significant differences in long-term strategic planning, review and screening
and accept/reject decision,
– Insignificant difference in the use of appraisal techniques, risk analysis
techniques, and estimation of the cost of capital,
– Significant differences in the use of GT as a method of CB guide,
These findings confirm studies by: Chen (1995); Daunfeldt and Hartwig (2014); Graham
and Harvey (2001); Hassan et al. (2011); and Verbeeten (2006). However, Farah et al.
(2008) found no significant differences between the CB practises of high- and low-risk
firms. Overall, these results affirm the H1b assertion that: there is a significant difference in
CB practices between high-risk and low-risk firms. Specifically, this affirmation covers
only some, but not all, CB practices.

229
6.2.4 The H1c- Sub-Hypothesis
H1c: Firms and respondents attributes have an effect on the choice of CB practices
employed.
The evaluated with t-test/ANOVA results which found that the following attributes have
significant influence on the choice of CB practices employed:
Table 6.1- The CB Processes and Techniques Affected by Respondent and Firm Attributes
Attribute Australia Sri Lanka
Respondent
Gender
CB Processes Review and screening None
CB Techniques None PBP, DPP (Capital appraisal method)
Respondent
Education
CB Processes Accept/reject decision
Implementation phase
Search for investment opportunities Review and screening Post-audit
CB Techniques NPV, IRR (capital appraisal method) PBP, DPP, ARR (Capital appraisal method)
Respondent
Age
CB Processes
Long-term strategic planning Accept/reject decision Implementation phase Post-audit
Long-term strategic planning Accept/reject decision Expenditure control and monitoring
CB Techniques Sensitive (Risk analysis method)
Sensitive, Monte Carlo, Risk adjusted (Risk analysis method) CAPM (Cost of capital) GT,BS, VC (CB guide)
Respondent
Experience
CB Processes
Review and screening phase Accept/reject decision Expenditure control and
monitoring
Long-term strategic planning Review and screening phase Implementation phase
CB Techniques GT (CB guide) DPP,NPV (Capital appraisal method) CAPM (Cost of capital) RO,GT (CB guide)
Firm Size of
employees
CB Processes None Post-audit
CB Techniques
DPP (Capital appraisal method) CAPM (Cost of capital) RO, GT, BS, and VC (CB guide)
DPP (Capital appraisal method) Sensitive, risk adjusted (Risk analysis method) CAPM (Cost of capital) RO, BS, VC (CB guide)
Firm
Domestic
focus
CB Processes None None
CB Techniques GT (CB guide) DPP, ARR (capital appraisal method)
GT, BS (CB guide)
Firm Ownership
CB Processes Accept/reject decision Implementation phase
None
CB Techniques
Decision tree (Risk analysis method)
WACC (Cost of capital) RO (CB guide)
None
Firm Risk level
CB Processes
Accept/reject decision Implementation phase Post-audit
Long-term strategic planning Review and screening phase Accept/reject decision
CB Techniques GT (CB guide) None
230
The results in Table 6.1 are similar to those of Brounen et al. (2004), Brijlal (2009),
Brunzell, Liljeblom, and Vaihekoski (2013), Daunfeldt and Hartwig (2014), De Andrés et
al. (2015), Hassan et al. (2011), Hanaeda and Serita (2014), Hermes et al. (2007), Sandahal
and Sjogren (2003) and Verma, Gupta, and Batra (2009). Moreover these results are, also,
consistent with a study by Al-Ajmi et al. (2011) which reported that firm attributes such as
ownership, sources of revenue etc., have some impact on decisions to adopt CB and their
method of estimating the cost of capital and risk. However, these outcomes sharply contrast
with Farah et al. (2008) who found that there is no statistically significant relation between
firm attributes and CB techniques. Also, research by Bennouna et al. (2010) is marginally
inconsistent in that they found that some large Canadian firms did not use DCF (a developed
country). On balance, these results affirm the H1c assertion that: Firms and respondents
attributes have an effect on the choice of CB practices employed.
6.2.5 The H2- Hypothesis
H2: The use of more sophisticated CB practices leads to higher performance than that
of firms using less sophisticated CB practices.
This is evaluated via correlation analysis which found (Table 5.36) that CB processes in:
Australia are positively correlated to ROA and EPS, and
Sri Lanka have a positive relationship with ROA and ROE, EPS and TQ, but that
relationship is not significantly correlated if accounting/market-based values are
applied.
These results show that firm performance, when based on accounting and market- measures,
tend to rise with the sophistication of CB processes. Also, a negative relationship between
CB techniques (CBT) and ROA, ROE and TQ appears in Sri Lanka, but is a positive
relationship in Australia between CBT and ROA ROE, and EPS. With respect to Sri Lankan
firms, there is a negative relationship between CBT and firm performance based on
231
accounting (ROA and ROE) and marketing (TQ) based measures which suggest that less
use of sophisticated CB techniques may reduce firm performance.
Traditional financial theory asserts that use of sophisticated CB practices will improve firm
performance (Copeland, 1992). The mixed results in this study are comparable to studies
by: Christy (1966); Farragher et al. (2001); Klammer (1973) and Pike (1984) who found
that adopting refined CB practices may not, in-itself, improve firm performance. However,
other studies (Kim, 1981; Vadeei et al., 2012) found an association between CB practices
and firm performance. While the results from this study are mixed, on balance they, affirm
the H2 assertion that: the use of more sophisticated CB practices lead to higher performance
than that of firms using less sophisticated CB practices.
6.2.6 The H2a- Sub-Hypothesis
H2a: Capital budgeting processes significantly affect firm performance.
This is evaluated with multiple regression analysis; Tables 5.37 and 5.38 show that, in
Australia, the CB process (independent) variables in Eqs (8-11) are (at a 5% confidence
level) are:
Significantly and positively correlated to ROA,
Positively related (but not at a statistically significant level) to EPS, and
Negatively related (but not at a statistically significant level) to ROE and TQ.
Tables 5.39 and 5.40 show that, in Sri Lanka, the CB process (independent) variables in
Eqs (8-11) are (at a 5% confidence level):
Positively related (but not at a statistically significant level) to both accounting
(ROA and ROE) and market (EPA and TQ) performance measures.
The results are supportive (but not conclusively so) of the H2a assertion that: CB processes
significantly affect firm performance. Specifically, while the Australian findings are further
buttressed by Pike (1984), the causal direction may be suspect (see Kim & Farragher, 1982)
232
—e.g., firms may favour a well-structured CB process only when they expect significant
returns). The Sri Lankan supportive but not conclusive findings are generally consistent
with existing studies, including Kim (1981). While the study findings are not statisically
conclusive, they support the H2a assertion and the assertion is socio-economically logical.
Future research should explore the direction of causality between CB processes and firm
performance.
6.2.7 The H2b- Sub-Hypothesis
H2b: A firm’s CB techniques are expected to have a positive influence on a firm’s
performance.
This is evaluated with multiple-regression analysis; Tables 5.37 and 5.38 show that, in
Australia, the CB techniques (independent) variables in Eqs (8-11) are (at a 5% confidence
level) have:
A positive but statistically not significant effect on ROA, ROE and EPS.
Tables 5.37 and 5.38 show that, in Sri Lanka, the CB techniques (independent) variables in
Eqs (8-11) are (at a 5% confidence level) have:
A positive, but not statistically significant, effect on EPS, and
A negative, but not statistically significant, effect on ROA, ROE and TQ
On the basis of this study’s findings and the mixed findings of other researchers, the
assertion of H2b (that: A firm’s CB techniques are expected to have a positive influence on
a firm’s performance) is not affirmed. This lack of affirmation does not mean there is no
correlation/causation between CB techniques and firm performance, only that future
research needs to expand its scale (e.g., more firms in the sample), reduce its scope (e.g.,
fewer industry classifications in the sample) or change its approach (e.g., add indirect
effects in the equation being regressed). The weak, mixed findings in this study are
233
consistent with those of earlier studies (Al Mutairi et al., 2011; Gilbert, 2005; Klammer,
1973; Mooi & Mustapha, 2001; Olawale, Olumuyiwa, & George, 2011).
6.3 Chapter Summary
This part of the study investigates the effect on Australian and Sri Lankan firm performance
of CB practices and techniques, firm attributes, and respondent attributes. The hypotheses
which were tested for statistical significance were discussed in relation to theory, extant
literature and the study context. The statistical results suggest that Australian respondents,
on average, use more sophisticated CB practices than their Sri Lankan colleagues. However,
the results also suggest that the differences between Australian and Sri Lankan firms are
less than might be expected, given the differences in the socio-economic progress in the
two countries. A summary of the findings and conclusions will be discussed in the next
chapter.
234
Chapter Seven: Conclusions, Implications and Future
Research Directions
7.1 Chapter Introduction
This chapter discusses how the results of this thesis address the research gap identified in
the Chapter 2 literature review. The discussion builds on prior discussions of results,
highlights key contributions, proposes applications for the findings, and suggests areas for
future research. This study seeks to resolve research questions by examining and testing
how CB processes and techniques influence firm performance. The study performs this
analysis on 150 firms in a developed country and 150 firms in an emerging country. Further
study is done to identify and adjust for the often potentially confounding effects of firm
attributes and respondent attributes on firm performance and choices of CB processes and
CB techniques. This study should interest academics, researchers, policy-makers, and
practitioners.
This chapter concludes this thesis with: Section 7.1 giving an overview of the research
questions and findings; Section 7.2 summarising implications of the study’s findings;
Section 7.3 discussing the contribution of the study; Section 7.4 listing limitations of the
study; Section 7.5 suggesting avenues for future research; and Section 7.6 providing final
thoughts and conclusions.
235
7.2 Findings related to Research Questions
The following sub-sections organise the research findings so as to provide insight into each
research question.
7.2.1 Research Question 1
What are the significant differences between Australian and Sri Lankan firms relating to
their CB practices?
This research question seeks to provide insight into differences between the CB practices
of Australian and Sri Lankan firms. This question is addressed in Chapter 5, by a review of
the CB practices and firm performance of a sample of Australian and Sri Lankan firms (150
firms from each country). The CB practices examined are: CB processes; and CB
techniques (e.g., investment analysis techniques, risk analysis techniques, cost of capital
and investment guide). The empirical findings (presented in chapter 5) show that the use of
long-term strategic planning, implementation, expenditure control and monitoring and
post-audit phases differs significantly in Australian firms from Sri Lankan firms. The
search for investment opportunities and implementation appears to be the most vital stages
of CB for Australian firms, but are less important for Sri Lankan firms. The results suggest
that Australian firms tend to use DCF as their most frequently used CB technique and its
usage appears to be more common and important than what is noted in many earlier studies.
Sri Lankan firms tend to consider PBP as the most important CB evaluation technique and
IRR as the next in importance. Scenario approach and sensitivity analysis are the most
widely used techniques for assessing capital-investments risk in Australia, but for Sri
Lankan firms a scenario approach is more often utilised. The results also indicate that most
Australian and Sri Lankan firms rely to some extent on the WACC when estimating the
cost of capital. However, Australian firms appear to use the WACC and CAPM more often
236
than Sri Lankan firms. Australian respondents prefer RO analysis over other capital
investment techniques, whereas, Sri Lankan firms have little interest in RO analysis.
Variations with respect to CB practices in a developed country (Australia) and an emerging
country (Sri Lanka) are confirmed by the above findings. There are multiple variations
between Australia and Sri Lanka. Australia (as a developed nation) has: a) Extensive human
capital that makes it easier and more cost-effective to use of sophisticated evaluation
methods easier and more cost-effective; and b) Relatively intense domestic and
international competition. In contrast, Sri Lanka (as an emerging nation) has: a) Lower
access to human capital, which makes using sophisticated evaluation methods less cost-
effective; and b) much less intensive domestic and international competition. However, the
choice to use relatively sophisticated techniques, instead of simpler alternatives, tends to
vary (in both countries) with firm attributes (size, available human capital, etc.) and the
relative benefits to large Sri Lankan firms may be even greater than those to large Australian
firms. Specifically, if Australian firms (large and small) are more likely to use more
sophisticated techniques than small Sri Lankan firms, then large Sri Lankan firms tend to
operate in less aggressive markets than what large Australian firms face. However,
differences in institutional systems, corporate governance mechanisms and corporate
culture may, also, account for differences between Australian and Sri Lankan small-firm
CB practices—e.g., the results of this study suggest that Australian firms see profit
maximisation as a higher priority than other corporate objectives, but Sri Lanka firms tend
to consider sustainable growth as a top priority within corporate objectives. While
Australian respondents consider shareholders as the top stakeholder priority, Sri Lankan
firms consider their customers and employees to be more important than other stakeholders.

237
7.2.1.1 Research Question 1(i)
What are the CB applications and techniques currently being practiced in Australian and
Sri Lankan listed firms?
A main goal of this research question is to update the current CB decisions and practices
including CB-processes and CB-appraisal techniques (e.g., investment-analysis techniques,
risk-analysis techniques, cost of capital and investment guide) among Australian and Sri
Lankan firms. The results note that the accept/reject decisions is the most important stage
for the majority of Australian and Sri Lankan respondents followed by implementation,
post-audit and expenditure control and monitoring. The results also show that most
Australian respondents consider the search for investment opportunities as a more
important phase than their Sri Lankan counterparts. The long-term strategic planning is
considered to be most important stage by Australian and Sri Lankan respondents. Among
CB appraisal techniques, NPV and IRR are the most popular CB planning and evaluation
techniques with 98 percent of Australian firms reporting they use these techniques.
However PBP is also prevalent. Most Sri Lankan respondents see PBP and IRR as their
most regularly used approaches. The NPV method is less prevalent in Sri Lanka. The
ongoing heavy reliance of Australian and Sri Lankan respondents on PBP for input into
investment decisions is surprising, given that financial textbooks have long listed the
shortcomings of PBP (i.e. it ignores time value of money and cash flows beyond the
completion date). As explained in chapter 2 of this thesis, a large number of developed and
emerging countries still use PBP as a CB method. This implies that simplicity and power
may outweigh the supposed power of more sophisticated techniques. Concurrently, both
the scenario approach and sensitivity analysis are extensively used techniques in Australia
with the scenario approach being now widely utilised among Sri Lankan respondents. The
238
WACC is the most popular method of estimating the cost of equity capital in Australia and
Sri Lanka. The second and third most popular methods for or obtaining and estimating the
cost of capital in Australia is, respectively, the use of the CAPM and interest payable on
debt capital. RO analysis is now commonly in use. Compared to prior research, with this
study revealing a substantial increase in use of the RO method among Australian firms.
When making CB decisions, along with quantitative appraisals, most Australian and Sri
Lankan firms are likely to also consider its consistency with corporate strategy and its
effects on the market image of the firm, and its capacity to improve their competitive
position. Also, most Australian and Sri Lankan firms rely on quantitative analysis judgment
when prioritising their capital investment decisions. However, the CB practices of
Australian firms tend to involve more sophisticated appraisal methods than those used by
Sri Lankan firms.
7.2.1.2 Research Question 1(ii)
What similarities and differences exist in CB practices across industries?
This research question looks at the similarities and differences that in CB practices among
the industrial sectors in Australia and Sri Lanka. In this study of nine industrial sectors
covering ASX and CSE listed firms, two key areas of CB practices (i.e. CB processes and
CB techniques) are covered. For Australian firms long-term strategic planning, accept/
reject decision, implementation and expenditure control stages are significantly different
across Industry sectors, but there are no significant differences in search for investment
opportunities, review and screening and post-audit stages across industry sectors. In Sri
Lanka, there are statistically significant differences between the different industry types as
regards to long-term strategic planning, review and screening, implementation and
expenditure control and monitoring stages of CB while for other stages the differences are
239
insignificant. This study found that: the expenditure control and monitoring stage is
significantly employed by utility, consumables and consumer discretionary firms in
Australia, and post-audit stage is significantly used by consumables, material, health care
and consumer discretionary firms. Among Sri Lankan firms, expenditure control and
monitoring and post-audit stages are significantly used by the industry, consumables,
materials, health care and consumer discretionary sectors. At same time, results also
demonstrate that the use of the DPP and ARR seem to differ significantly between industry
types in Australia while the use of CB techniques does not seem to differ significantly
between industry types in Sri Lanka, except DPP—e.g., this study observed that DPP and
ARR methods are extensively used among the consumables, materials and consumer
discretionary sectors in Australia, but DPP is popular among the industrial, consumables,
materials, health care and consumer discretionary sectors in Sri Lanka. The results indicate
that there is no significant difference in the use of risk analysis techniques between industry
sectors in Australia and Sri Lanka. The use of cost of capital does not seem to differ
significantly between Australian industrial sectors, whereas, the use of the CAPM as a
method of setting the cost of capital seems to differ significantly between industrial sectors
in Sri Lanka. Moreover, GT as a means of CB guide differs significantly between industrial
sectors in Australia at a 5% significance level, while this nature of industry does not affect
the significantly different investment guides in Sri Lanka. Based on the differences on CB
practices between industry sectors, this may be explained, by their industry attributes,
regulations and mode of operations. Accordingly this study partly confirms that there are
some differences based on industrial sectors in Australian and Sri Lankan CB practices.
240
7.2.1.3 Research Question 1(iii)
Do the firm and CFO attributes influence the choice of CB practice?
This research question claims that the firm and the respondent attributes determine CB and,
therefore, are a source of variation in CB practices. As discussed in Chapter 5, this study
on the key influences of CB practices had to disentangle the effects of two key drivers of
CB sophistication: 1) the socio-economic environment in which the firm is embedded (i.e.
developed country vs, emerging country firms); and 2) the attributes of the firm and those
of the respondent. While the Australian CB model was statistically clearer with generally
more significant variables, it was found that firm attributes matter in both countries; with
larger firms in both countries tending to use more sophisticated CB methods than smaller
firms—implying that larger firms tend to have more processes to support their long-term
capital investment decisions, whereas, small firms tend to use more rules-of-thumb. For
e.g., the highest-domestic-focused Australian firms are more likely to use NPV, IRR and
DPP; while, the highest-domestic-focused Sri Lankan firms are more likely to use DPP and
ARR. When the underlying respondents attributes are considered, well-grounded
respondents frequently use more sophisticated methods in Australia and Sri Lanka—e.g.,
DCF and NDCF tend to be favoured by respondents with a Bachelors degree in both
countries; ARR and NPV are significantly favoured by respondents with a PhD in Sri Lanka
and Australian respondents with a Masters degree tend to favour DPP. This indicates that
the sophistication of CB practices appears to be significantly (if not mostly) influenced by
attributes of the firm and the respondent. This finding supports contingency theory—i.e.
the CB practices/investment approach of a firm should fit with that firm’s attributes and
those of its principals.
241
7.2.2 Research Question 2
What is the empirical association between CB practices employed and firm performance
within Australian- and Sri Lankan-listed firms?
This research identifies the direction of individual CB practices (i.e. CB process and CB
appraisal techniques) on firm performance (i.e. maximising shareholder wealth) by
investigating the influence of CB practices on firm performance as measured by
accounting-and market-measures. The CB process of Australian firms has a positive
correlation with ROA and EPS and a negative correlation with ROE and TQ—however,
none of the relationships are statistically significant. In Sri Lanka, the CB process of firms
is positively, but not statistically significantly correlated with any of the performance
measures, other than TQ. This suggests, but does not statistically prove, that the
sophistication level of the CB process is correlated with firm performance. The results
suggest that Australian firms are likely improving their performance by using sophisticated
CB techniques. In Sri Lanka, firms applying sophisticated CB techniques tend to adversely
affect their firm performance measures, except for EPS. The adverse effects of using
sophisticated CB techniques on TQ may merely reflect the dramatic increase in intangible
assets over the last few decades—when intangible assets are a high proportion of total assets,
TQ is more subject to errors and (as a result) is less effective as a measure of firm
performance. In Sri Lanka, the causal relationship, instead of flowing from sophisticated
CB practises to firm performance, may be flowing in the opposite direction. Specifically,
firms having poor performance may be more likely to reach out to more sophisticated CB
practises in an effort to improve their fortunes. It may, also, be that firm performances in
Sri Lanka rely on factors not normally considered in sophisticated CB practises (e.g., family
and/or political connections).
242
7.2.2.1 Research Question 2 (i)
What is the impact of CB practices on these firms’ performance?
This question explores the statistical significance of the models described in chapter 5 and
of magnitude of the individual variables (i.e. the CB practices and firm and respondent
attributes) on the performance of Australian and Sri Lankan-listed firms, using multiple-
linear regression. The regression outcomes show that the independent variables in the
Australian model jointly explain 53.1, 21.8, 38.4, and 42.8 percent of the variation in,
respectively, ROA, ROE, EPS and TQ. The ANOVA (F-value) tests verify that ROA, EPS,
and TQ models generate statistically significant outcomes. In the Sri Lankan regression
model, the independent variables jointly explain 18.6, 15.1, 11.7, and 13.8 percent of the
variation in, respectively, ROA, ROE, EPS and TQ. The ANOVA (F-value) tests were not
statistically significant for any of the four models.
These results may imply that the Australian and Sri Lankan economies are very different.
These differences likely involve the Sri Lankan economy: being dominated by small-to-
medium firms that face severe capital constraints; having limited technical expertise;
having a rules-based rather than principles-based governance mechanism; and saddled with
relatively high corruption (e.g., influence and connections may be more important
determinants of success than competitive competence). The coefficient findings given in
Chapter 5, show that CB process has a significantly positive impact on ROA among
Australian-listed firms which validates the assertion that a high level of sophisticated CB
process leads to higher ROA. The positive correlation of CB process has a positive effect
on EPS is a reasonable outcome. The negative correlation found between the Australian
CB process and ROE and TQ can be explained by other factors (e.g., ROE is dependent on
243
the amount of leverage by debt—a management choice variable and TQ may not handle
the high levels of intangible assets present in rising knowledge economy of Australia).
In Sri Lankan firms, CB process is positively correlated (but not statistically significantly)
with accounting -and market-measures of performance.
The CB techniques of Australian firms are positively (but not statistically significantly)
correlated with ROA, ROE and EPS and negatively (but not statistically significantly)
correlated with TQ. The CB techniques of Sri Lankan firms are negatively (but not
statistically significantly) correlated with ROA, ROE and TQ. It is irrational to presume
that Sri Lankan firms are using CB techniques to negatively impact their firm performance
and even more irrational to presume that they would continue to use CB techniques in such
a way. As noted previously, the causal relationship, instead of flowing from sophisticated
CB techniques to firm performance, may flow in the opposite direction. Specifically, firms
with poor performance may reach out to more sophisticated CB techniques in an effort to
improve their fortunes. It may, also, be that firm performances in Sri Lanka rely on factors
not normally considered in sophisticated CB techniques (e.g., family and/or political
connections).
7.3 Implications of the Study
This study tests whether Australian and Sri Lankan firms have different CB practices and,
also, sought to fill an identified research gap by exploring the impact of CB practices on
firm performance. CB practices are vital, in that if not properly planned, capital investment
can have disastrous financial and performance implications (Du Toit & Pienaar, 2005;
Johnson, 1999).

244
Firms apply CB process and techniques assist to prioritise potential investments. In highly
competitive environments, it is expected that firms will engage in a race to apply ever more
sophisticated CB processes. The cross-national differences that this study observed in the
supplication of CB practices suggest that significant differences in the Australian and Sri
Lankan economies and cultures are driving the differences in CB practices.
The Australian business environment being much more competitive than that of Sri Lanka
is suggested in the greater concern of the Australian respondents for the risks faced by their
firms than what was expressed by their Sri Lankan counterparts (Tables 5.2-5.5). The
Australian respondents appear to be much less procedures and rules bound (at all levels of
the CB process) than their Sri Lankan counterparts (see Tables 5.7 - 5.14). Another bit of
evidence that Australia is more competitive than Sri Lanka is in the relatively high
sophistication of Australian CB techniques (Table 5.10).
The differences in the cultures of the Australian and Sri Lankan business environments is
found in their prioritisation of corporate objectives (Table 5.4; the Australians are more
profit focused) and in their prioritisation of corporate stakeholders (Table 5.5; the Sri
Lankans more closely adhere to the Ethical branch of Stakeholder Theory and Australians
to the Managerial branch of Stakeholder Theory).
It is interesting to note that the PBP preference is consistently stronger in Sri Lanka, but
use of PBP is not significantly lower in Australian firms. This suggests that, despite the
many weaknesses and failings noted about PBP by academics, PBP still provides great
comfort and value in the CB process—possibly as a rough-and-ready measure of relative
risk that ensures that the decision makers do not get led up the garden path by the more
sophisticated CB techniques.
245
Also of great interest is that Australian firms are more likely to use multiple modes of CB
appraisal techniques than Sri Lankan firms—perhaps because their appetite for risky
investments appears to be significantly greater than that of their Sri Lankan counterparts
(Tables 5.2 and 5.9). In complex real-world situations, reconciling the outputs of a
multifaceted approach to CB methods is more likely to give the depth and width of input
needed to achieve an optimal capital investment plan.
Concurrently as Sri Lanka passes through its post-war-recovery phase, reform of its
financial and capital market is essential to sustain economic growth and development.
While a wider diffusion of better investment appraisal methods in Sri Lankan firms could
improve the cost-effectiveness of investment decisions and generally increase efficiency,
this is unlikely to occur until competition is more of a spur.
7.4 Contribution of the Study
This thesis will add insight to the corporate sectors of Australia and Sri Lanka and be of
value to countries in comparable situations. It will also benefit decision makers, investors,
regulators and scholars as well as assist the policy makers to set new and improved
standards for best practices.
This study found that the cultural and business environment of firms is a major determinant
of the effectiveness of CB processes along with: ever shortening life cycles of products, the
need for quick recovery of investments, and the need for quick decision making (Shinoda,
2010).
This study develops insights on how CB practices are applied by Australian and Sri Lankan
firms and documents the impact of CB practices on firm performance. The study revealed
that although there are some notable differences of CB practices between a developed and
246
an emerging country there are also many similarities. This study also contributes to the
accounting/finance literature by adding to a small cohort of comparative studies in CB
practices. Although the empirical results of this research support a number of prior studies,
it also contradicts a number of earlier studies in the developed and emerging countries.
Based on both the theoretical and empirical investigations it is apparent that Australian
firms rely heavily on the sophisticated CB practices when selecting their long-term
investments but continue to use PBP. While RO analysis has established a threshold in the
practice of CB, they have not yet achieved mainstream status.
In evaluating the association between CB practices and the attributes of the firm and its
managers with firm performance in a developed country (Australia) and an emerging
country (Sri Lanka), this research sought to disentangle the firm nature from the nurture
effects of the country in which the firm is embedded (i.e. the development level of the
nation was taken as a proxy for such things as human capital availability, regulatory
systems, market sophistications, etc.). It was found that the nature of a firm tends to trump
the nurture of the development level of the country in which the firm is embedded. While
the Australian CB model was statistically clearer with generally more significant variables,
it was also found that firm size matters in both countries. Larger firms in both countries
tend to use more sophisticated CB methods than those of smaller firms in Sri Lanka.
The results of this study can provide rich information for stakeholders about new findings
in CB practices and their contributions to firm performance in comparative perspective.
Also, the study adds to the general knowledge on CB practices by showing that the nature
of the firm appears to swamp the nurture of the environment in which it is embedded.
Therefore, this study contributes to understanding the role CB play in business decision

247
making by demonstrating the need for more sophistication in firms’ analysis of long-term
investment decision making and underinvestment can be minimised.
7.5 Limitations of the Study
Although the research seeks to be one of the most comprehensive studies that explore CB
practices and performance in a comparative manner, there are still several limitations.
The key limitations inherent in the use of any questionnaire survey were mitigated to a
degree by using official and third-party sources of data where possible for the analysis.
Precisely, inherent in study undertaken using questionnaire is the concern of the sufficiency
of the response level whether the anticipated recipient responds to the questionnaire,
whether the questions/statements are interpreted in the way anticipated and whether there
are sufficient questions to gather the information sought.
The study addressed 150 listed firms on the ASX as per S&P/ASX200 and 150 listed firms
on the CSE as at February 2013. While the findings may have been more statistically
significant if a larger sample was used, that benefit is outweighed by the cost and the lack
of availability of a larger sample. Limitations also included being confined to two different
countries and one-shot survey. The study could be extended to include other countries and
to have a time-serries element.
An added limitation is the difficulties inherent in discovering and adjusting for variations
in the CB mechanisms, business scope, and/or financing portfolio across firms. Specially,
the frequency of CB process/techniques may actually be influenced by variables other than
those considered in this study.
Like most previous studies this study has examined only selected proxies for firm
performance. The difficulties from accounting standards and principles differing between
248
countries have been greatly mitigated over the past decade by the increasing adoption and
use of International Financial Reporting Standards (IFRS).
7.6 Recommendations for Future Research
There are a number of possibilities for future research results from this research. The study
has provided some interesting insights on CB practices including process and appraisal
techniques and its influence on firm performance using accounting-and market- measures
in Australia and Sri Lanka. This study provided a wider scope to conducting CB practices
research in the context of developed and emerging economies. This study will identify the
areas for further research in this context.
Future research should consider including many countries across the emerging to developed
continuum, so as to support more generalised conclusions. Instead of relying mainly on
questionnaire mail survey, an alternative/supplement method of interviewing may provide
more insights about CB practices and their impact on firm performance. In addition to this,
a longitudinal study might be more able to validate findings. Also, future research should
expand consideration of the influence of firm size and sophistication on the CB process.
Future researches on CB in Australia and Sri Lanka should also investigate whether the use
of more than one method in CB has any impact on the financing of CB expenditures and to
what extent it affects their long-term decisions. This point has not yet been deeply
investigated, and it needs further consideration.
A final suggestion for future research relates to gaining a better understanding of factors
that influence differences in the levels of adoption of recently developed CB techniques
between countries. It will be interesting to see how firms across the globe use CB methods
and how in the future firms figure out ways to raise the efficiency of decision making.
249
Future studies of CB sophistication should examine the utilisation of these techniques and
analyse the effect of their usage on firm performance.
7.7 Chapter Summary
This concluding chapter has discussed CB practices and firm performance in Australia and
Sri Lanka which leads to the central argument of the study. This research reviewed findings
related to the research questions and research objectives as explained through this thesis. It
shows that the research has made a significant contribution in filling the research gap on
CB practices and firm performance in a developed and emerging country perspective.
Finally, the recommendations for future research should consider including many countries
across the emerging to developed range in order to engender more generalised conclusions.
250
References
Abdel-Kader, M., & Luther, R. (2008). The impact of firm characteristics on management
accounting practices: A UK-based empirical analysis. The British Accounting
Review, 40(1), 2-27.
ABS. (2015, June 06). Australian Bureau of Statistics, Government of Australia.
Retrieved from
http://www.abs.gov.au/ausstats/[email protected]/Web+Pages/Population+Clock?opendoc
ument.
Adler, R. (2006). Why DCF capital budgeting is bad for business and why schools should
stop teaching it. Accounting Education: An International Journal, 15(1), 3-10.
Aggarwal, R., & Chandra, G. (1990). Stakeholder management: Opportunities and
challenges. Business, 40(1), 48-51.
Agrawal, A., & Mandelker, G. (1987). Managerial incentives and corporate investment and
financing decisions. The Journal of Finance, 42(4), 823-837.
Aharoni, Y. (1966). The foreign investment decision process. Boston, US: Harvard
Business School.
Al Mutairi, M., Hasan, H., & Risik, E. (2011). The impact of corporate financing decision
on corporate performance in the absence of taxes: Panel data from Kuwait stock
market. World Finance Conference, (pp. 1-27). Greece.
Al-Ajmi, J., Al-Saleh, N., & Hussain, H. (2011). Investment appraisal practices: A
comparative study of conventional and Islamic financial institutions. Advances in
Accounting, 27(1), 111-124.
Alexander, L., Hope, P., Collins, D., Lynch, A., & Nicholls, N. (2007). Trends in
Australia’s climate means and extremes: A global context. Australian
Meteorological Magazine, 56(1), 1-18.
Alkaraan, F., & Northcott, D. (2006). Capital investment decision making: A role for
strategic management accounting. British Accounting Review, 38(2), 49-73.
Amram, M., & Howe, K. (2002). Capturing the value of flexibility. Strategic Finance,
84(6), 10-13.
Anand, M. (2002). Corporate finance practices in India: A survey. Vikalpa, 27(4), 29-56.
Anderson, L., & Sollenberger, H. (1992). Managerial accounting (8ed.). Ohio, US: South-
Western Publishing Co.
251
Anderson, R. (1982). Capital budgeting practices of Australian companies. Professional
Administrator, 159-161.
Anderson, R., & Reeb, D. (2003). Founding‐family ownership and firm performance:
Evidence from the S&P 500. The Journal of Finance, 58(3), 1301-1327.
Andor, G., Mohanty, S., & Toth, T. (2015). Capital budgeting practices: A survey of
Central and Eastern European firms. Emerging Markets Review, 23, 148-172.
Andrews, G., & Butler, F. (1986). Criteria for major investment decisions. The Investment
Analysts Journal, 15(27), 31-37.
Anthony, J., & Ramesh, K. (1992). Association between accounting performance measures
and stock prices: A test of the life cycle hypothesis. Journal of Accounting and
Economics, 15(2), 203-227.
Antle, R., & Eppen, G. (1985). Capital rationing and organisational slack in capital
budgeting. Management Science, 31(2), 163-174.
Antle, R., Bogetoft, P., & Stark, A. (2007). Incentive problems and investment timing
options. New York, US: Springer.
Anwar, A., Tieu, K., Gibson, P., Win, K., & Berryman, M. (2014). Analysing the
heterogeneity of traveller mode choice preference using a random parameter logit
model from the perspective of principal–agent theory. International Journal of
Logistics Systems and Management, 17(4), 447-471.
Archer, H., Choate, M., & Racette, G. (1979). Financial management: An introduction (1
ed.). New York, US: John Wiley & Sons Inc.
Arnold, B., & De Lange, P. (2004). Enron: An examination of agency problems. Critical
perspectives on Accounting, 15(6), 751–765.
Arnold, G., and Hatzopoulos, P. (2000). The theory-practice gap in capital budgeting:
Evidence from the United Kingdom. Journal of Business Finance & Accounting,
27(6), 603-625.
Arora, M. (2010). Accounting and financial management (3 ed.). Meerut, India: Krishna
Prakashan Media Limited.
Arrow, K., & Lind, R. (2014). Uncertainty and the evaluation of public investment
decisions. Journal of Natural Resources Policy Research, 6(1), 29-44.
ASX. (2016). Corporate Overview: History. Australian Security Exchange. Retrieved May
2, 2016, from http://www.asx.com.au/about/history.htm
252
ATC. (2015). Why Australia: Bench mark report 2015. Australian Trade Commission,
Australian Government. Retrieved February 1, 2016, from
file:///C:/Users/ppratheepkanth/Downloads/Australia-Benchmark-Report.pdf
Atrill, P. (2012). Financial management for decision making (6 ed.). Essex, England:
Pearson Education Limited.
Australian Stock Exchange. (1996). ASX Submission Financial System Inquiry. Sydney,
Australia: Australian Stock Exchange.
Azhagaiah, R., & Sabari, P. (2008). The impact of dividend policy on shareholders’ wealth.
International Research Journal of Finance and Economics, 20(1), 180-187.
Baker, K., & Powell, G. (2005). Understanding financial management: A practical guide
(1 ed.). Victoria, Australia: Blackwell Publishing.
Baker, K., Dutta, S., and Saadi, S. (2011). Management views on real options in capital
budgeting. Journal of Applied Finance, 21(1), 18-29
Baldenius, T. (2003). Delegated investment decisions and private benefits of control. The
Accounting Review, 78(4), 909-930.
Baldenius, T., Dutta, S., & Reichelstein, S. (2007). Cost allocation for capital budgeting
decisions. The Accounting Review, 82(4), 837-867.
Ballantine, J., Galliers, R., & Stray, S. (1995). The use and importance of financial appraisal
techniques in the IS/IT investment decision making process-recent UK evidence.
Project Appraisal, 10(4), 233-241.
Banda, W., Koralalage, Y., Ratnayake, C., & Mudiyanselage, R. (2014). The use of capital
budgeting techniques in large businesses: Evidence from Sri Lanka. International
Journal of Arts and Commerce, 3(9), 77-84.
Basu, A., & Drew, M. (2010). The appropriateness of default investment options in defined
contribution plans: Australian evidence. Pacific-Basin Finance Journal, 18(3), 290-
305.
Batra, R., & Verma, S. (2014). An empirical insight into different stages of capital
budgeting. Global Business Review, 15(2), 339-362.
Baule, R. (2014). Allocation of risk capital on an internal market. European Journal of
Operational Research, 234(1), 186-196.
Beattie, V., Goodacre, A., & Thomson, S. (2006). Corporate financing decisions: UK
survey evidence. Journal of Business Finance & Accounting, 33(9-10), 1402-1434.
Beck, M. (2015). Australia's infrastructure. Ecodate, 29(2), 2-4.
253
Bennouna, K., Meredith,G., and Marchant,T. (2010). Improved capital budgeting decision
making: Evidence from Canada, Management Decision, 48( 2), 225-247.
Beranek, W. (1975). The cost of capital, capital budgeting, and the maximization of
shareholder wealth. Journal of Financial and Quantitative Analysis, 10(1), 1-20.
Berenson, M., Levine, D., Krehbiel, T., Stephan, D., O'Brien, M., Jayne, N., & Watson, J.
(2013). Business statistics: Concepts and application (2 ed.). NSW, Australia:
Pearson Australia.
Bergstressera, D., and Philippon, T. (2006). CEO incentives and earnings management.
Journal of Financial Economics, 80(3), 511-529.
Bernadette, M., Muralidhar, K., Robert, B., Jay, J., and Karen, P. (2001). An Empirical
Investigation of the relationship between change in coporate social performance and
finacial perforamnce: A stakeholder theory perspective. Journal of Business Ethics,
32(2), 143-156.
Bernardo, A., Cai, H., & Luo, J. (2004). Capital budgeting in multidivision firms:
Information, agency, and incentives. Review of Financial Studies, 17(3), 739-767.
Bhat, S. (2008). Financial management: Principles and practice (2 ed.). New Delhi, India:
Anurag Jain for Excel Books.
Bierman, H. (2010). An introduction to accounting and managerial finance: A merger of
equals (1 ed.). Singapore: World Scientific Publishing.
Bierman, H., & Smidt, S. (1993). The capital budgeting decision: Economic analysis of
investment project (8 ed.). New YorK, US: Macmillan.
Bierman, H., & Smidt, S. (2007). The capital budgeting decision:Economic analysis of
investment projects (9 ed.). New York, US: Routledge.
Black, C., Parry, J., Anderson, H., & Bennett, A. (2002). Are New Zealand chief financial
officers the country cousins of their American counterparts? Business Review, 4(1),
1-10.
Block, S. (1997). Capital budgeting techniques used by small business firms in the 1990s.
The Engineering Economist, 42(4), 289-302.
Block, S. (2005). Are there differences in capital budgeting procedures between industries?
An empirical study. The Engineering Economist, 50(1), 55-67.
Bonn, I., Yoshikawa, T., and Phan, P. (2004). Effects of board structure and firm
performance: A comaprison between Japan and Australia. Asian Business &
Management, 3(1), 105-125.
254
Boquist, J., Todd, M., & Anjan, T. (1998). How do you win the capital allocation game?
Sloan Management Review, 39(1), 59-75.
Bosch-Badia, M., Montllor-Serrats, J., & Tarrazon-Rondon, M. (2014). Capital budgeting
and shareholders' value: investment projects versus courses of action. The
Engineering Economist, 59(3), 207-230
Boudreaux, D., Rao, S., & Das, P. (2014). Sugar cane refining and processing company: A
comprehensive case in measuring a firm’s cost of capital. Journal of Business Case
Studies, 10(3), 335-342.
Bowen, H. (1953). Social responsibility of the businessman. New York, US: Harper and
Row.
Bower, J.L (1986). Managing the resource allocation process: A study of corporate
planning and investment (3 ed.). Boston, US: Harvard Business Press.
Bower, J.L. (1970). Managing the resource allocation process: A study of corporate
planning and investment. Boston, US: Harvard Business School Press.
Bower, J.L., & Gilbert, C. (2005). From resource allocation to strategy. Oxford UK:
Oxford University Press.
Brealey, R., & Myers, S. (2003). Principles of corporate finance (1 ed.). Boston,US:
McGraw-Hill.
Brennan, M., & Suhwartz, E. (1988). The case for convertibles. Journal of Applied
Corporate Finance, 1(2), 55-64.
Brigham, E. (1992). Fundamentals of financial management (6 ed.). Eort Wbrth,Texas:
Dryden Press.
Brigham, E., & Ehrhardt, M. (2011). Financial management: Theory and practice (13 ed.).
Mason,US: South-Western Cengage Learning.
Brigham, E., & Gapenski, L. (1997). Financial management: Theory and practice (8 ed.).
Fort Worth, US: The Dryden Press.
Brijlal, P. (2009). The use of capital budgeting techniques in businesses: A perspective
from the Western Cape. The Journal of Applied Business Rseearch, 25(4), 37-46.
Brounen, D., De Jong, A., and Koedijk, K. (2004). Corporate finance in Europe:
Confronting theory with practice. Journal Financial Management, 33(4), 1-40.
Brunzell, T., Liljeblom, E., & Vaihekoski, M. (2013). Determinants of capital budgeting
methods and hurdle rates in Nordic firms. Accounting & Finance, 53(1), 85-110.
Bryman, A., and Emma, B. (2003). Business research methods. UK: Oxford University
Press.
255
Burns, R., & Walker, J. (1997). Capital budgeting techniques among the Fortune 500: A
rationale approach. Managerial Finance, 23(9), 3-15.
Carleton, W., Kendall, G., & Tandon, S. (1974). Application of the decomposition principle
to the capital budgeting problem in a decentralized firm. The Journal of Finance,
29(3), 815-827.
CBSL. (2013). Annual Report. Colombo, Sri Lanka: Central Bank of Sri Lanka.
CBSL. (2012). Financial System Stability Review. Colombo Sri Lanka: Central Bank of Sri
Lanka.
Chadwell-Hatfield, P., Goitein, B., Horvath, P., & Webster, A. (2011). Financial criteria,
capital budgteing techniques and risk analysis of manufacturing firms. Journal of
Applied Business Research, 13(1), 95-104.
Chan, H., Kamal, H., and William, S. (2004). Capital budgeting practices of Chinese Firms.
The Journal of Global Business Management, 1(1), 20-26.
Chan, Y. (2004). Use of capital budgeting techniques to capital investment decisions in
Canadian Municipal Governments. Journal of Business Financial Accounting,
24(2), 40-48.
Chen, S. (1995). An empirical examination of capital budgeting techniques: Impact of
investment types and firm characteristics. The Engineering Economist, 40(2), 145-
170.
Chen, S. (2008). DCF techniques and nonfinancial measures in capital budgeting: A
contingency approach analysis. Behavioral Research in Accounting, 20(1), 13-29.
Christy, G. (1966). Capital budgeting current practices and their efficiency. US: University
of Oregon.
CIA. (2010). The world factbook. Central Intelligence Agency Washington, US: Potomac
Books Inc.
Cohen, J., Cohen, P., West, S., & Aiken, L. (2013). Applied multiple regression/correlation
analysis for the behavioral sciences (3 ed.). British: Routledge.
Coltman, G. (1995). An analysis of capital budgeting techniques and their impact on
shareholder wealth. University of Cape Town.
Cooper, D., & Petry, G. (1994). Corporate performance and adherence to shareholder
wealth-maximizing principles. Financial Management, 23(1), 71-78.
Copeland., T. E. (1992). Financial theory and corporate policy. London: Wesley
Publishing Company Inc.
256
Correia, C., Mayall, P., O'Grady, B., & Pang, J. (2005). Corporate financial management
(2 ed.). Perth, Australia: Skystone Investments (Pty) Ltd.
Covaleski, M., Dirsminth, M., & Samuel, S. (1996). Managerial accounting research: The
contributions of organisational and sociological theories. Journal of Management
Accounting Research, 8, 1-35.
Crotty, M. (1998). The foundations of social research: Meaning and perspective in the
research process. UK: Sage.
CSE. (2014). Colombo Stock Excahnge. Retrieved September 1, 2014, from
http://www.cse.lk/home.do
Daft, R., & Maclntosh, N. (1978). A new approach to design and use of management
information. California Management Review, 21(1), 82-92.
Daunfeldt, S., & Hartwig, F. (2014). What determines the use of capital budgeting
methods? Evidence from Swedish listed companies. Journal of Finance and
Economics, 2(4), 101-112.
Dayananda, D., Irons, R., Harrison, S., Herbohn, J., & Rowland, P. (2002). Capital
Budgeting, financial appraisal of investment projects. UK: Cambridge University
Press.
De Andrés, P., De Fuente, G., & San Martín, P. (2015). Capital budgeting practices in Spain.
BRQ Business Research Quarterly, 18(1), 37-56.
De Silva, K. (1981). A history of Sri Lanka. US: University of California Press.
Denzin, N., & Lincoln, Y. (2011). The sage handbook of qualitative research (4 ed.). Los
Angeles, US: Sage.
Department of Census and Statistics. (2012). Population Atlas of Sri Lanka. Colombo, Sri
Lanka: Ministry of Finance and Planning.
Dixit, A., & Pindyck, R. (1994). Investment under uncertainty (1 ed.). New Jersey, US:
Princeton University Press.
Donkor, E., & Duffey, M. (2013). Optimal capital structure and financial risk of project
finance investments: A simulation optimization model with chance constraints. The
Engineering Economist, 58(1), 19-34.
Doumpos, M., & Zopounidis, C. (2014). Introduction to financial decision making. In
Multicriteria Analysis in Finance (pp. 1-10). Springer.
Drury, C., & Tayles, M. (1996). UK capital budgeting practices: Some additional survey
evidence. The European Journal of Finance, 2(4), 371-388.
257
Du Toit, M., & Pienaar, A. (2005). A review of capital budgeting behaviour of large South
African firms. Meditari Accountancy Research, 13(1), 19-27.
Duchin, R., & Sosyura, D. (2013). Divisional managers and internal capital markets. The
Journal of Finance, 68(2), 387-429.
Duncan, R. (1972). Characteristics of organisational environments and perceived
environmental uncertainty. Administartive Science Quaterly, 17(3), 313-327.
Easterbrook, F. (1984). Two agency-cost explanations of dividends. The American
Economic Review, 7(4), 650-659.
Easton, P. (2004). PE ratios, PEG ratios and Estimating the implied expected rate of return
on equity capital. The Accounting Review, 79(1), 73-95.
Economic Research Department. (2008). South Asia’s recent growth and future prospects.
SAARCFINANCE Governors’ Symposium - South Asia’s Recent Growth and Future
Prospects (pp. 2-8). Colombo, Sri Lanka: Central Bank of Sri Lanka.
Eljelly, A., & Abuidris, A. (2001). A survey of capital budgeting techniques in the public
and private sectors of a less developed country (LDC) the case of the Sudan. Journal
of African Business, 2(1), 75-93.
Elsas, R., Flannery, M., & Garfinkel, J. (2014). Financing major investments: Information
about capital structure decisions. Review of Finance, 18(4), 1341-1386.
Ermasova, N. (2013). Capital budgeting in the states after the great recession. State and
Local Government Review, 45(2), 119-130.
Eslake, S. (2002). An introduction to the Australian economy. Encyclopaedia Americana
International Edition, 2, 733-741.
Falusi, J. (1983). Capital budgeting techniques in practice. Management Accounting
Journal, 19-25.
Fama, E. (1977). Risk-adjusted discount rates and capital budgeting under uncertainty.
Journal of Financial Economics, 5(1), 3-24.
Fama, E. (1980). Agency problems and the theory of the firm. Journal of Political Economy,
88(2), 288-307.
Fama, E., & Jensen, M. (1985). Organisational forms and investment decisions. Journal of
Financial Economics, 14(1), 101-109.
Farah, M., Mansor, I., and George, W. (2008). Capital budgeting practices of listed
Indonestion companies. Asian Journal of Business and Accounting, 1(2), 175-192.
Farragher, E., Kleiman, R., and Sathu, A. (1999). Current capital investment practices. The
Engineering Economist, 44(2), 137-141.
258
Farragher, E., Kleiman, R., and Sathu, A. (2001). The Association between the use of
Sophisticated capital budgeting practices and corporate performance. The
Engineering Economist, 46(4), 300-311.
Fatoki, O., Okubena, O., and Herbst, G. (2010). An investigation into the impact of
investment appraisal techniques on the profitability of small manufacturing firms in
the Nelson Mandela bay metropolitan area, South Africa. African Journal of
Business Management, 4(7), 1274-1280.
Firth, M. (1996). The diffusion of managerial accounting procedures in the People's
Republic of China and the influence of foreign partnered joint ventures. Accounting,
Organizations and Society, 21(7), 629-654.
Flick, U. (2014). An introduction to qualitative research (5 ed.). UK: Sage.
Franc-Dabrowska, J. (2009). Does dividend policy follow the capital structure theory?
Managing Global Transitions, 7(4), 367-382.
Freeman, M., & Hobbes, G. (1991). Capital budgeting: Theory versus practice. Australian
Accountant, 61(1), 36-41.
Freeman, R. (1994). The politics of stakeholder theory. Business Ethics Quarterly, 4(4),
409-421.
Fremgen, J. (1973). Capital budgeting practices: A survey. Management Accounting,
54(11), 19-25.
Frino, A., Hill, A., & Chen, Z. (2013). Introduction to Corporate Finance (5 ed.). NSW,
Australia: Pearson Australia Group.
Froot, K. (2007). Risk management, capital budgeting and capital structure policy for
insurees and reinsurers. Journal of Risk and Insurance, 74(2), 273-299.
GE. (2016). Sri Lanka. Global Economy. Retreived February 26, 2014 from
http://www.theglobaleconomy.com/Sri-Lanka/Inflation/
Geis, G. (2007). Business outsourcing and the agency cost problem. Notre Dame Law
Review, 82(3), 956-977.
George, E. (2011). Capital budgeting practices and economic development: A comparative
study of companies in Western Europe and West Africa. UK: LAP Lambert
Academic Publishing.
Gervais, S. (2009). Behavioral finance: Capital budgeting and other investment decisions.
Retrieved June 10, 2015, from
https://faculty.fuqua.duke.edu/~sgervais/Research/Papers/BookChapter.OvCapital
Budgeting.pdf
259
Gervais, S., Heaton, J., & Odean, T. (2012). Overconfidence, compensation contracts, and
capital budgeting. The Journal of Finance, 66(5), 1735-1777.
Gilbert, E. (2005). Capital budgeting: A case study analysis of the role of formal evaluation
techniques in the decision making process. South African Journal of Accounting
Research, 19(1), 19-36.
Gitman, L., Juchau, R., & Flanagan, J. (2011). Principles of managerial finance (6 ed.).
NSW: Pearson Education .
Gitman, L., Juchau, R., Flanagan, J., Pearson, K., & Clemens, M. (1998). Principles of
managerial finance (2 ed.). Melbourne, Australia: Addison Wesley Longman
Australia Pty Limited.
Gittman, L., & Forrestter, R. (1977). Forecasting and evaluation: Practices and performance.
Financial Management, 6(3), 66-71.
Gliem, J., & Gliem, R. (2003). Calculating, interpreting, and reporting Cronbach’s alpha
reliability coefficient for Likert-type scales. Midwest Research-to-Practice
Conference in Adult (pp. 82-88). Ohio State University, Columbus, Ohio:
Continuing, and Community Education.
Godfrey, J., Hodgson, A., Holmes, S., and Tarca, A. (2006). Accounting Theory (6 ed.).
Milton: John Wiley & Sons Australia Ltd.
Godfrey, P. (2005). The relationship between corporate philanthropy and shareholder
wealth: A risk management perspective. Academy of Management Review, 30(4),
777-798.
Gombrich, R., Gombrich, R., & Obeyesekere, G. (1988). Buddhism transformed: Religious
change in Sri Lanka (Vol. 8). Bangalore, India: Motilal Banarsidass Publication.
Gordon, L., & Miller, D. (1976). A contingency framework for the design of accounting
information systems. Organisation and Society, 1(1), 59-69.
Gordon, L., & Smith, K. (1992). Postauditing capital expenditures and firm performance:
The role of asymmetric information. Accounting, Organizations and Society, 17(8),
741-757.
Götze, U., Northcott, D., & Schuster, P. (2015). Capital budgeting and investment decisions.
In Investment appraisal: Methods and models (2 ed., pp. 3-26). Berlin, Heidelberg:
Springer.
Graham, J., and Harvey, C. (2001). The theory and practice of corporate finance: Evidence
from the field. Journal of Financial Economics, 2(3), 187-243.
260
Graham, J., Harvey, C., & Puri, M. (2015). Capital allocation and delegation of decision-
making authority within firms. Journal of Financial Economics, 115(3), 449-470.
Grant, M. (1996). Toward a knowlegge-based theory of the firm. Strategic Management
Journal, 17(1), 109-122.
Gray, D. (2009). Doing research in the real world. UK: Sage.
Grinyer, J. (1986). An alternative to maximisation of shareholders' wealth in capital
budgeting decisions. Accounting and Business Research, 16(64), 319-326.
Grinyer, P., Al‐Bazzaz, S., & Yasai‐Ardekani, M. (1986). Towards a contingency theory
of corporate planning: Findings in 48 UK companies. Strategic Management
Journal, 7(1), 3-28.
Guedj, I., Jennifer, C., and Sulaeman, J. (2009). Internal capital allocation and firm
performance. Retrieved April 10, 2014, from
http://dx.doi.org/10.2139/ssrn.1364924
Guerrero-Baena, M., Gómez-Limón, J., & Cardozo, J. (2013). The capital budgeting
process: A methodological approach based on financial and intellectual value
creation. Intangible Capital, 9(4), 1145-1169.
Gugler, K. (2003). Corporate governance, dividend payout policy, and the interrelation
between dividends, R&D, and capital investment. Journal of Banking & Finance,
27(7), 1297-1321.
Gurnani, C. (1984). Capital budgeting: Theory and practice. The Engineering Economist,
30(1), 19-46.
Gustavo, G., Roni, M., Shlomo, B., and Richard, H. (2003). Dividend changes do not signal
changes in future profitability. Retrieved January 3, 2014, from Available at SSRN:
http://ssrn.com/abstract=431762 or http://dx.doi.org/10.2139/ssrn.431762
Haddad, K., Sterk, W., & Wu, A. (2010). Capital budgeting practices of Taiwanese firms.
Journal of International Management Studies, 5(1), 178-182.
Hair, J., Bush, R., & Ortinau, D. (2000). Marketing research: A practical approach for the
new millennium. Sydney, Australia: Irwin McGraw-Hill.
Haka, S. (1987). Capital budgeting techniques and firm specific contingencies: A
correlational analysis. Accounting Organizations and Society, 12(1), 31-48.
Haka, S., Lawrence, A., and George, E. (1985). Sophisticated capital budgeting selection
techniques and firm performance. The Accounting Review, 9(4), 651-669.
Hakim, R., & Shimko, D. (1995). The impact of firm's characteristics on junk-bond default.
Journal of Financial and Strategic Decisions, 8(2), 47-55.
261
Haldma, T., & Lääts, K. (2002). Contingencies influencing the management accounting
practices of Estonian manufacturing companies. Management Accounting Research,
13(4), 379-400.
Hall, J. (2000). Investigating aspects of the capital budgeting process used in the evaluation
of investment projects. South African Journal of Economic & Management Sciences,
3(3), 353-368.
Hall, J., & Millard, S. (2010). Capital budgeting practices used by selected listed South
African firms: financial management. South African Journal of Economic and
Management Sciences, 13(1), 85-97.
Hall, M., & Weiss, L. (1967). Firm size and profitability. Review of Economics and
Statistics, 49(3), 319-331.
Hamzah, A., & Zulkafli, A. (2014). Multiple shareholders structure (MSS) and corporate
financial policy and corporate financial policy. Journal of Finance, 2(1), 107-134.
Han, C. (1986). The sophistication of capital budgeting in Malaysian companies. Omega,
14(2), 175-181.
Hanaeda, H., & Serita, T. (2014). Capital budgeting practices: Evidence from Japan.
Retrieved December 1, 2014, from
http://papers.ssrn.com/sol3/papers.cfm?abstract_id=2312264
Harold, D., and Villalonga, B. (2001). Ownership structure and corporate performance.
Journal of Corporate Finance, 7(1), 209-233.
Harris, M., & Raviv, A. (1996). The capital budgeting process: Incentives and information.
The Journal of Finance, 51(4), 1139-1174.
Harrison, J., Bosse, D., & Phillips, R. (2010). Managing for stakeholders, stakeholder utility
functions, and competitive advantage. Strategic Management Journal, 31(1), 58-74.
Hassan, I., Shao, L., & Shao, A. (1997). Determinants of capital budgeting strategies: An
econometric analysis of U.S multinational subsidiaries. Multinational business
review, 5(1), 68-70.
Hassan, M., Hosny, L., and Vasilya, S. (2011). Capital investment practices: A survey of
large corporation in developing market. Global review of Accounting and Finance,
2(2), 39-60.
Hastie, K. (1998). One busineeman's view of capital budgeting. Financial Management,
3(4), 36-44.
Hendricks, J. (1983). Capital budgeting practices including inflation adustments: A survey.
Managerial Planning, 3(4), 22-28.
262
Heras, I., Dick, P., and Casadesus, M. (2002). ISO 9000 registration's impact on sales and
profitability: A logitudinal analysis of performance before and after accreditation.
International Journal of Quality and Reliability Management, 19(6), 774-791.
Hermes, N., Smid, P., & Yao, L. (2007). Capital budgeting practices: A comparative study
of the Netherlands and China. International Business Review, 16(5), 630-654.
Hettihewa, S. (2016). The importance of risk management in the extractive sector for a
sustainable economy. In S. Devasahayam, & M. Mahapatra, Sustainability in
minerals and energy xectors. WA, Australia: CRS Press Taylor & Francis Group .
Ho, S., & Pike, R. (1991). Risk analysis in capital budgeting contexts simple or
sophisticated? Accounting and Business Research, 21(83), 227-238.
Ho, S., & Pike, R. (1998). Organizational characteristics influencing the use of risk analysis
in strategic capital investments. The Engineering Economist, 43(3), 247-268.
Hodgkinson, L. (1989). Taxation and corporate investment. London: CIMA Research
Studies.
Hofstede, G. (1980). Culture's consequences: International differences in work-related
values. Newbury Park, CA: Sage
Holmen, M., & Pramborg, B. (2009). Capital budgeting and political risk: Empirical
evidence. Journal of International Financial Management & Accounting, 20(2),
105-134.
Hoon, H., and Larry, J. (2001). Tobin’s Q, agency conflicts, and differential wealth effects
of international joint ventures. Global Finance Journal, 12(2), 267-283.
Hopwood, A. (1972). An empirical study of the role of accounting data in performance
evaluation. Empirical Research in Accounting, 156-182.
Hornstein, A. (2013). Corporate capital budgeting and CEO turnover. Journal of Corporate
Finance, 20, 41-58.
Hugo, G. (2014). Change and continuity in Australian international migration policy.
International Migration Review, 48(3), 868-890.
Human Development Report. (2011). Sustainability and equity: A better future for all.
New York, US: United Nations Development Programme. Retrieved August 25,
2015, from
http://hdr.undp.org/sites/default/files/reports/271/hdr_2011_en_complete.pdf
Hussaini, A., & Shafique, I. (2013). Capital budgeting practices in islamic banking:
Evidence from Pakistan. Euro-Asian Journal of Economics and Finance, 1(1), 9-
23.
263
Idowu, S. (2011). Accounting for decision makers in a sustainable environment. In S.
Idowu, & C. Louche, Theory and practice of corporate social responsibility (pp.
209-228). Berlin, Heidelberg: Springer .
Ireland, D., Hoskisson, R., & Hitt, M. (2011). The management of strategy: Concepts and
cases (9 ed.). Canada: South-Western, Cengage Learning.
Ittner, C., Larcker, D., & Randall, T. (2003). Performance implications of strategic
performance measurement in financial services firms. Accounting, Organizations
and Society, 28(7), 715-741.
Jackson, S., Keune, T., & Salzsieder, L. (2013). Debt, equity and capital investment.
Journal of Accounting and Economics, 56(2), 291-310.
Jain, P., Singh, S., & Yadav, S. (2013). Capital Budgeting Decisions. In Financial
Management Practices (pp. 37-76). India: Springer .
Jensen, M. (2001). Value maximization, stakeholder theory, and the corporate objective.
Journal of Applied Corporate Finance, 14(3), 8–21.
Jensen, M., & Meckling, W. (1976). Theory of the firm: Managerial behavior, agency costs
and ownership structure. Journal of Financial Economics, 3(4), 305-360.
Jog, M., & Srivastava, A. (1995). Capital budgeting practices in corporate Canada.
Financial Practice and Education, 5(2), 37-43.
Johnson, N., Pfeiffer, T., and Schneider, G. (2013). Multistage capital budgeting for shared
investments. Management Science, 59(5), 1213-1228.
Johnson, P., and Murray, C. (2006). Business and management research methodologies (6
ed.). London: Sage.
Johnson, R., & Onwuegbuzie, A. (2004). Mixed methods research: A research paradigm
whose time has come. Educational Researcher, 33(7), 14-26.
Johnson. (1999). Making capital budgeting decisions: Maximizing the value of the firm.
London: Pearson Education .
Jung, K., Kim, Y., & Stulz, R. (1996). Timing, investment opportunities, managerial
discretion, and the security issue decision. Journal of Financial Economics, 42(2),
159-186.
Kahraman, C. (2008). Fuzzy sets in engineering economic decision-making. In C.
Kahraman, Fuzzy engineering economics with applications (pp. 1-9). Berlin,
Heidelberg: Springer.
Kalay, A. (2014). International payout policy, information asymmetry, and agency costs.
Journal of Accounting Research, 52(2), 457-472.
264
Kalyebara, B. (1998). In practice, How do Australian companies determine and use the
hurdle rate in capital budgeting? Tenth Annual PACAP/FMA Finance conference.
Kuala Lumpur.
Kalyebara, B., & Islam, S. (2014). Conceptual Framework for Investment appraisal, and
capital markets research in accounting and the methodology. In Corporate
governance, capital markets, and capital budgeting (pp. 45-74). Berlin, Heidelberg:
Springer.
Kantudu, A. (2007). Capital investment appraisal practices of quoted firms in Nigeria.
Retrieved March 3, 2015, from
http://papers.ssrn.com/sol3/papers.cfm?abstract_id=1000075
Kaplan, R. (1984). The evolution of management accounting. Accounting Review, 59(3),
390-418.
Kashyap, A. (2014). Capital allocating decisions: Time value of money. Asian Journal of
Management, 5(1), 106-110.
Kester, G., and Chong, T. (1998). Capital budgeting practices of listed firms in Singapore.
Sigapore Management Review, 20(1), 9-23.
Kester, G., Chang, R., Echanis, E., Haikal, S., Mansor, M., Skully, M., . . . Wang, C. (1999).
Capital budgteing practices in the Asi-Pacific Region: Australia, Hong Kong,
Indoesia, Malaysia, Philippines and Singapore. Financial Practice and Education,
9(1), 25-33.
Khan, M., & Jain, P. (2007). Basic Financial Management (3 ed.). New Delhi, India: The
McGraw - Hill Companies.
Kim, S., & Farragher, E. (1982). An empirical study of the relationship between capital
budgeting practices and earnings performance. The Engineering Economist, 27(3),
185-196
Kim,S.H. (1981). An empirical study on the relationship between capital budgeting
practices and earnings performance. The Engineering Economist, 27(3), 185-196.
King, P. (1975). Is the emphasis of capital budgeting theory misplaced? Journal of Business
Finance & Accounting, 2(1), 69-82.
Klammer, T. (1973). The association of capital budgeting and firm performance. The
Accounting Review, 48(2), 353-364.
Klammer, T., and Walker, M. (1984). The continuing increase in the use of sophisticated
capital budgeting techniques. California Management Review, 27(1), 137-148.
265
Kothari, C. (2004). Research methodology: Methods and techniques. (2 ed.). New Delhi,
India: New Age International (P) Limited.
Krockenberger, M. (2015). Population growth in Australia. Canberra, Australia: The
Australia Institute. Retrieved December 10, 2015, from
http://www.tai.org.au/content/population-growth-australia
Kwong, H. (1986). The sophistication of capital budgeting in Malaysian companies. Omega,
14(2), 175-181.
Lam, K., Wang, D., and Lam, M. (2008). Practices of Hong Kong building contractors in
strategic asset allocation process: Longitudinal approach. Journal of Financial
Management of Property and Construction, 13(3), 176-186.
Lambert, R., & Larcker, D. (1987). An analysis of the use of accounting and market
measures of performance in executive compensation contracts. Journal of
Accounting Research, 25, 85-125.
Larcker, D. (1983). The association between performance paln adoption and corporate
capital invsetment. Journal of Accounting and Economics, 5(1), 3-30.
Laux, J. (2011). Capital Budgeting. American Journal of Business Education, 4(7), 29-38.
Lazaridis, I. (2004). Capital budgeting practices: A survey in the firms in Cyprus. Journal
of small business management, 42(4), 427-433.
Lee, S., & Ip, Y. (1984). Should a $ 1,000,000 investment be made? The Hong Kong
Manager, 13(1), 15-20.
Leon, F., Isa, M., & Kester, G. (2008). Capital budgeting practices of listed Indonesian
companies. Asian Journal of Business and Accounting, 1(2), 175-192.
Lidija, D., & Silvija, O. (2007). Capital budgeting practices: A survey of Croatian firms.
South East European Journal of Economics and Business, 2(1), 59-67.
Lilienfeld-Toal, U., & Ruenzi, S. (2014). CEO ownership, stock market performance, and
managerial discretion. The Journal of Finance, 69(3), 1013-1050.
Liljeblom, E., & Vaihekoski, M. (2004). Investment evaluation methods and required rate
of return in Finnish publicly listed companies. Finnish Journal of Business
Economics, 53(1), 9-24.
Lilleyman, P. (1984). Capital budgeting: current practices of Australian organisations. The
Australian Accountant, 54(2), 130-133.
Lincoln, Y., Lynham, S., & Guba, E. G. (2011). Paradigmatic controversies, contradictions,
and emerging confluences, revisited. In K. Denzin, & S. Lincoln, The Sage
handbook of qualitative research (4 ed., pp. 97-128). California, US: Sage.
266
Louis, H. (2004). Earnings management and the market performance of acquiring firms.
Journal of Financial Economics, 74(1), 121-148.
Maccarrone, P. (1996). Organising the capital budgeting process in large firms.
Management Decision, 34(6), 43-56.
Machuga, S., and Pfeiffer, J. (2002). Economic value added, Future accounting earnings
and Financial analysts' Earnings per share forecasts. Review of Quantitative Finance
and Accounting, 18(1), 59-73.
Mack, N., Woodsong, C., MacQueen, K., Guest, G., and Namey, E. (2005). Qualitative
research methods A data collector's field guide. North Carolina: Family Health
International. Retrieved July 20, 2014, from
http://www.fhi360.org/sites/default/files/media/documents/Qualitative%20Resear
ch%20Methods%20-%20A%20Data%20Collector%27s%20Field%20Guide.pdf
Major, E. (1995). Fundamental of project appraisal. Lagos, Nigeria: Masan Publishers.
Makris, M. (2009). Incentives for motivated agents under an administrative constraint.
Journal of Economic Behavior & Organisation, 71(2), 428-440.
Manoj, A. (2002). Corporate finance practices in India: A survey. Vikalpa, 27(4), 29-56.
Mao, J. (1970). A survey of capital budgeting theory and practice. Journal of Finance,
25(2), 349-360.
Marcus, M. (1969). Profitability and size of firm: Some further evidence. Review of
Economics and Statistics, 51(1), 104-107.
Marino, A., & Matsusaka, J. (2005). Decision processes, agency problems and information;
An economic analysis of capital budgeting procedures. Review of Financial studies,
18(1), 301-325.
Maritan, C. (2001). Capital investment as investing in organisational capabilities: An
empirically grounded process model. Academy of Management Journal, 44(3), 513-
531.
Mark, E., Richard, T., and Andy, L. (1999). Management research: Introduction. London:
Sage.
Maroyi, V., and van der Poll, H,M. (2012). A survey of capital budgeting techniques used
by listed mining companies in South Africa. African Journal of Business
Management, 6(32), 9279-9292.
Maury, B. (2006). Family ownership and firm performance: Empirical evidence from
Western European corporations. Journal of Corporate Finance, 12(1), 321-341.
267
McConnell, J., & Muscarella, C. (1985). Corporate capital expenditure decisions and the
market value of the firm. Journal of Financial Economics, 14(3), 399-422.
Mcdaniel, W., MCcarty, E., & Jessell, K. (1988). Discounted cas flow with explicit
reinvestment rates: Tutorial and extension. Financial Review, 23(3), 369-385.
McLachlan, R., Clark, C., & Monday, I. (2002). Australia's service sector: A study in
diversity. Productivity Commission Staff Research Paper. Retrieved June 8, 2015,
from http://ssrn.com/abstract=304304 or http://dx.doi.org/10.2139/ssrn.304304
McLaney, E., Pointon, J., Thomas, M., & Tucker, J. (2004). Practitioners' perspectives on
the UK cost of capital. European Journal of Finance, 10(1), 23-38.
McLean, I. (2004). Australian economic growth in historical perspective. Economic Record,
80(250), 330-345.
McMahon, R. (1981). The determination and use of investment hurdle rates in capital
budgeting: A survey of Australian practice. Accounting and Finance, 21(1), 15-35.
Meegaskumbura, M.B.A., Bahir, M., Milinkovitch, M., & Schneider, C. (2002). Sri Lanka:
An amphibian hot spot. Science, 298(5592), 379-379.
Menachem, B., & Venetia, I. (1983). The effects of inflation and taxes on growth
investments and replacement policies. The Journal of Finance, 38(5), 1519-1528.
Mendes-Da-Silva, W., & Saito, R. (2014). Stock exchange listing induces sophistication of
capital budgeting. Revista de Administração de Empresas, 54(5), 560-574.
Michael, J., and Guilding, C. (2013). Factors affecting biasing of capital budgeting cash
flow forecasts: Evidence from the hotel industry. Accounting and Business
Research, 42(5), 519-545.
Miller, K., & Waller, H. (2003). Scenerios, real options and integrated risk management.
Long Range Planning, 36(1), 93-107.
Mintzberg, H., Raisinghini, D., and Theoret, A. (1976). The structure of unstructured
decision processes. Administrative Science Ouarterly, 21(1), 246-275.
Mitchell, F. (2002). Research and practice in management accounting: Improving
integration and communication. The European Accounting Review, 11(2), 277-289.
Modigliani, F., & Miller, M. (1958). The cost of capital, corporation finance and the theory
of investment. The American Economic Review, 48(3), 261-295.
Mohana, P. (2011). Financial statement analysis and reporting (1 ed.). New Delhi: PHI
Learning Private Limited.
268
Mooi, S., & Mustapha, M. (2001). Firm performance and degree of sophistication of capital
budgeting practice: Some Malaysian evidence. Proceedings of the Asia Pacific
Management Conference, 19, pp. 279-29. Kuala Lumpur, Malaysia.
Moore, J., & Reichert, A. (1989). A multivariate study of firm performance and the use of
modern analytical tools and financial techniques. Interfaces, 19(3), 79-87.
Morgan, D. (2007). Paradigms lost and pragmatism regained: methodological implications
of combining qualitative and quantitaive methods. Journal of Mixed Methods
Research, 1(1), 48-76.
Morgan, K. (2012). Australia: A Very Short Introduction. UK: Oxford University Press.
Mukherjee, A., & Hanif, M. (2006). Financial accounting (5 ed.). New Delhi, India:
McGraw Hill.
Mukherjee, T.K., & Henderson, G.V. (1987). The capital budgeting process: Theory and
practice. Interfaces, 17(2), 78-90.
Mullin, S. (2007). Business planning & strategy. Fredericton, Canada: Macmullin Inc.
Mutairi, M., Tian, G., & Tan, A. (2009). Corporate finance practice in Kuwait: A survey to
confront theory with practice. Australian Finance and Banking Conference (pp. 1-
26). Sydney, Australia: Social Science Electronic Publishing Inc.
Myers, S. (1984). Finance theory and financial strategy. Interfaces, 14(1), 126-137.
Ndubisi, N. (2012). Mindfulness, reliability, pre-emptive conflict handling, customer
orientation and outcomes in Malaysia's healthcare sector. Journal of Business
Research, 65(4), 537-546.
Neely, A. (2002). Business performance measurement: Theory and practice. Cambridge,
UK: Cambridge University Press.
Nicholls, S., & Rosewall, T. (2015). The economic performance of the states. RBA Bulletin,
13-20.
Nicholson, J., & Ffolliott, J. (1966). Investment evaluation criteria for Canadian companies.
The Business Quarterly, 54-62.
Nolan, S., & Heinzen, T. (2014). Essentials of statistics for the behavioral sciences (2 ed.).
New York, US: Worth Publishers.
Northcott, D. (1995). Capital investment decision making. London: The Dryden press.
Ohlson, J., and Nauroth, B. (2005). Expected EPS and EPS growth as determinants of value.
Review of Accounting Studies, 10(2), 349-365.
Olawale, F., Olumuyiwa, O., & George, H. (2010). An investigation into the impact of
investment appraisal techniques on the profitability of small manufacturing firms in
269
the Nelson Mandela Bay metropolitan area, South Africa. African Journal of
Business Management, 4(7), 1274-1280.
Oliver, D. (1989). Oceania: The native cultures of Australia and the Pacific Islands (Vol.
1). US: University of Hawaii Press.
Onwuegbuzie, A. (2002). Why can’t we all get along? Towards a framework for unifying
research paradigms. Education, 122(3), 518-530.
Otley, D. (1978). Budget use and managerial performance. Journal of Accounting Research,
16(1), 122-149.
Pandy, I. (1999). Financial management (8 ed.). New Delhi, India: Vikas Publicating Pvt
Ltd.
Parrino, R., Kidwell, D., Au-Yong, H., Mokrkel-Kingsbury, N., Dempsey, M., & Murray,
J. (2011). Fundamental of Corporate Finance (1 ed.). NSW, Australia: John Wiley
& Sons Limited.
Pasiouras, F., and Kosmidou, K. (2007). Factors influencing the profitability of domestic
and foreign commercial banks in the European Union. Research in International
Business and Finance, 21(2), 222-237.
Patrick, B., Chen, H., and Wang, N. (2011). A unified theory of Tobin's q, coporate
investment, and risk management. The Journal of Finance, 56(5), 1545-1578.
Patterson, C. (1989). Investment of companies listed on the New Zealand stock exchange.
Accounting and Finance, 29(2), 73-89.
Payne, J., Heath, W., & Gale, L. (1999). Comparative financial practice in the US and
Canada: Capital budgeting and risk assessment. Financial Practice and Education,
9(10), 16-24.
Peebles, P. (2006). The history of Sri Lanka. Portsmouth, UK: Greenwood Publishing
Group.
Peel, M. (1999). Planning, business objectives and capital budgeting in Japanese, German
and domestic SMEs: Some evidence from the UK manufacturing sector. Journal of
Small Business and Enterprise Development, 6(4), 350-365.
Peirson, G., Brown, R., Easton, S., Howard, P., & Pinder, S. (2011). Business finance (11
ed.). NSW Australia: McGraw-Hill Australia Pty Limited.
Pejovich, S. (1995). The firm and contracts. In Economic analysis of institutions and
systems (pp. 171-188). Netherlands: Springer .
Pereiro, L. (2006). The practice of investment valuation in emerging markets: Evidence
from Argentina. Journal of Multinational Financial Management, 16(2), 160-183.
270
Perera, H. (1988). Buddhism in Sri Lanka: Short history. Kandy, Sri Lanka: Buddist
Publication Society.
Periasamy, P. (2013 ). A textbook of financial cost and management accounting (2 ed.).
New Delhi, India: Himalaya Publishing House.
Peter, A. (2012). Financial management for decision makers (6 ed.). Essxs, UK: Pearson
Education Limited.
Peterson, P., & Fabozzi, F. (2002). Capital budgeting: Theory and practice. New York,
US: John Wiley & Sons, Inc. Retrieved August 11, 2014, from
http://160592857366.free.fr/joe/ebooks/tech/Wiley%20Capital%20Budgeting%20
Theory%20and%20Practice.pdf
Petrović, E., Radović, O., & Stanković, J. (2013). Individual investors' investment decision-
making process. Strategic Management, 18(1), 3-14.
Petty, W., Peacock, K., Martin, P., Burrow, M., Known, J., Scott, D., & Martin, D. (1996).
Basic financial management (1 ed.). NSW, Australia: Prentice Hall.
Phelan, P. (1997). Exposing the illusion of confidence in financial analysis. Management
Decision, 35(2), 163-168.
Pietroforte, R., & Gregori, T. (2003). An input-output analysis of the construction sector in
highly developed economies. Construction Management and Economics, 21(3),
319-327.
Pike, R. (1983). The capital budgeting behaviour and corporate characteristics of capital
constrained firms. Journal of Business Finance & Finance, 10(4), 663-671.
Pike, R. (1984). Sophisticated capital budgeting systems and their association with
corporate performance. Managerial and Decision Economics, 5(2), 91-97.
Pike, R. (1986). The Design of capital budgeting processesand the corporate context.
Managerial and Decision Economics, 7(1), 187-195.
Pike, R. (1988). An empirical study of the adoption of sophisticated capital budgeting
practices and decision-making effectiveness. Accounting and Business Research,
18(72), 341-351.
Pike, R. (1996). A longitudinal survey on capital budgeting practices. Journal of Business,
Finance and Accouning, 23(1), 79-92.
Pike, R., & Ho, S. (1991). Risk analysis in capital budgeting: Barriers and benefits. Omega,
19(4), 235-245.
Pinches, G. (1982). Myopia, capital budgeting and decision making. Financial
Management, 11(3), 6-19.
271
Pindado, J., & Chabela, D. (2006). The role of investment, financing and dividend decisions
in explaining corporate ownership structure: Empirical evidence from Spain.
European Financial Management, 12(5), 661-687.
Piper, J. (1978). Determinant of financial control systems for mutiple retailers-some case
study evidence. US: University of Loughborough.
Pirttila, T., & Sandstrom, J. (1995). Manufaturing strategy and capital budgeting process.
International Journal of Production Economics, 41(1), 335-341.
Pitty, J., David, S., & Bird, M. (1975). The capital budgeting decision making process of
large corporations. The Engineering Economist, 20(3), 159-172.
Pocock, A., Correia, C., & Wormald, M. (1991). An analysis of the approaches used by
industrial comapnies listed on the JSE to identify their cost of capital. Journal of
Accounting Research, 5(1), 27-40.
Porter, M. (1992). Capital choices: Changing the way America invests in Industry. Journal
of Applied Corporate Finance, 5(1), 579-589.
Pradeep, B., and Lemay, Q. (2009). The use of capital budgeting techniques in business: A
perspective from the Western Cape. The Journal of Applied Business Research,
25(4), 37-46.
Pratt, S., & Grabowski, R. (2008). Cost of capital: Applications and examples (3 ed.). New
Jersey, US: John Wiley & Sons.
Proctor, M., & Canada, J. (1992). Past and present methods of manufacturing invetsment
evaluation: A review of the empirical and theoretical literature. The Engineering
Economist, 38(1), 45-58.
Rajasekar, S., Philominathan, P., and Chinnathambi, V. (2006). Research methodology.
Retrieved from May 10, 2014, http://arxiv.org/pdf/physics/0601009.pdf
Rajkumar, S., & Hoolahan, B. (2004). Remoteness and issues in mental health care:
Experience from rural Australia. Epidemiologia e Psichiatria Sociale, 13(2), 78-82.
Rawlings-Way, C. (2011). Australia (16 ed.). Australia: Lonely Planet Publications (Firm).
Reid, G., & Smith, J. (2000). The impact of contingencies on management accounting
system development. Management Accounting, 11(4), 427–450.
Rose, D. (2014). Arts of flow: poetics of ‘fit’in Aboriginal Australia. Dialectical
Anthropology, 38(4), 431-445.
272
Ross, S., Bianchi, R., Christensen, M., Drew, M., Westerfield, R., & Jordan, B. (2014).
Fundamentals of corporate finance (6 ed.). NSW, Australia: McGraw Hill
Education.
Ross, S., Westerfield, A., & Jordan, B. (2009). Modern financial management (8 ed.). US:
Mc Graw Hill.
Ross, S., Westerfild, R., Jordan, B., & Roberts, G. (2005). Fundamentals of corporate
finance (5ed.). Toronto, Canada: McGraw Hill Pty Limited.
Rossi, M. (2015). The use of capital budgeting techniques: An outlook from Italy.
International Journal of Management Practice, 8(1), 43-56.
Roubi, R., Barth, R., & Faseruk, A. (2011). Capital budgeting use in Canada: Sophistication
and risk attributes. Journal of Applied Business Research, 7(4), 83-89.
Ruhan, A. (1998). Malaysian capital budgeting methods: Survey and analysis. In Annual
PACAP/FMA Finance Conference on Asia Pacific Financial Market. Kuala
Lumpur.
Ryan, B., Scapens, R., & Theobold, M. (2002). Research method and methodology in
finance and accounting (2 ed.). UK: Academic Press Limited.
Ryan, P., & Ryan, G. (2002). Capital budgeting practices of the fortune 1000: How have
things changed? Journal of Business & Management, 8(4), 1-16.
Salkind, J. (2000). Statistics for people who hate statistics (1 ed.). Calfornia, US: Sage
Publications.
Sandahal, G., and Sjogren, S. (2003). Capital budgeting methods among Sweden's largets
groups of companies. Production Economics, 84(1), 51-69.
Sangster, A. (1993). Capital investment appraisal techniques: A survey of current usage.
Journal of Business Finance and Accounting, 20(3), 307-333.
Satish, V., Sanjeev, G., and Roopali, B. (2009). A survey of capital budgeting practices in
corporate India. The Journal of Business Perspective, 13(3), 1-17.
Saunders, M., Lewis, P., and Thornhill, A. (2012). Research methods for business students
(6 ed.). Essex, UK: Prentice Hall.
Schall, L., & Sundem, G. (1980). Capital budgeting method and risk: A further analysis.
Financial Management, 9(1), 7-11.
Schall, L., Gary, L., & William, R. (1978). A survey and analysis of capital budgeting
methods. The Journal of Finance, 33(1), 281-287.
273
Schiller, A., Herzfeld, M., Brinkman, R., & Stuart, G. (2014). Monitoring, predicting, and
managing one of the seven natural wonders of the world. Bulletin of the American
Meteorological Society, 95(1), 23-30.
Schlegel, D., Frank, F., & Britzelmaier, B. (2016). Investment decisions and capital
budgeting practices in German manufacturing companies. International Journal of
Business and Globalisation, 16(1), 66-78.
Schulz, A., & Cheng, M. (2002). Persistence in capital budgeting reinvestment decisions–
personal responsibility antecedent and information asymmetry moderator: A note.
Accounting & Finance, 42(1), 73-86.
Scott, D., Martin, D., Petty, W., & Known, J. (1988). Basic financial management (4 ed.).
NSW, Australia: Prentice Hall.
Secombe, M., & Smolicz, J. (2015). Second international handbook on globalisation,
education and policy research. In Globalisation, cultural diversity and
multiculturalism: Australia (pp. 503-517). Netherlands: Springer.
Segelod, E. (1998). A note on the survey of project evaluation techniques in major
corporations. International Journal of Production Economics, 54(2), 207-213.
Sekaran, U. (2003). Research methods for business: A skill building approach. Journal of
Education for Business, 68(5), 316-317.
Shao, L., and Alan, S. (1996). Risk analysis and capital budgeting techniques of U.S.
multinational enterprises. Managerial Finance, 22(1), 41-57.
Shan, G., & Xu, L. (2012). Do internal governance mechanisms impact on firm
performance? Empirical evidence from financial sector in China. Journal of Asia-
Pacific Business, 13(2), 114-142.
Sheard, J. (2013). Quantitative data analysis. In K. Williamson, & G. Johanson, Research
Methods: Information, Systems and Contexts (pp. 395-416). Prahran, Australia:
Tilde Publishing and Distribution.
Shields, M., Chow, C., Kato, Y., & Nakagawa, Y. (1991). Management accounting
practices in the US and Japan: Comparative survey findings and research
implications. Journal of International Financial Management & Accounting, 3(1),
61-77.
Shin, H., & Kim, Y. (2002). Agency costs and efficiency of business capital investment:
Evidence from quarterly capital expenditures. Journal of Corporate Finance, 8(2),
139-158.
274
Shinoda, T. (2010). Capital budgeting management practices in Japan. Economic Journal
of Hokkaido University, 39(1), 39-50.
Shleifer, A., & Vishny, R. (1989). Management entrenchment:the case of manage-specific
investments. Journal of Financial Economics, 25(1), 123-139.
Singh, S., Jain, P. K., & Yadav, S. S. (2012). Capital budgeting decisions: Evidence from
India. Journal of Advances in Management Research, 9(1), 96-112.
Singleton, R., Straits, B., & Straits, M. (1993). Approaches to Social Research (2 ed.). New
York, USA: Oxford University Press.
Slagmulde, P., Bruggemana, W., & Wassenhaveb, L. (1995). An empirical study of capital
budgeting practices for strategic investments in CIM technologies. International
Journal of Production Economics, 40(1), 121-152.
Smit, H.T., & Ankum, L.M. (1993). A real options and game theoretic approach to
corporate investment strategy under competition. Financial Management, 241-250.
Smolicz, J. (1997). Australia: From migrant country to multicultural nation. International
Migration Review, 31(1), 171-186.
Soltani, S., Nayebzadeh, S., & Moeinaddin, M. (2014). The Impact Examination of the
techniques of management accounting on the performance of title companies of
yazd. International Journal of Academic Research in Accounting, Finance and
Management Sciences, 4(1), 382-389.
Stulz, R. (1999). What's wrong with modern capital budgeting? Financial Practice and
Education, 99(8), 7-11.
Tappura, S., Sievanen, M., Heikkila, J., Jussila, A., & Nenonen, N. (2014). A management
accounting perspective on safety. Safety Science, 71, 151-159.
Tashakkori, A., & Teddlie, C. (1998). Mixed methodology: Combining qualitative and
quantitative approaches (4 ed.). Thousand Oaks, CA: Sage.
Tayles, M., Pike, R., & Sofian, S. (2007). Intellectual capital, management accounting
practices and corporate performance: Perceptions of managers. Accounting,
Auditing & Accountability Journal, 20(4), 522-548.
Trahan, E., & Gitman, J. (1995). Bridging the theory-practice gap in corporate finance: A
survey of financial officers. The Quarterly Review of Economics and Finance, 35(1),
73-87.
Transparaency International. (2014). Corruption Percetions Index 2014. Transparaency
International: the global coalition against corruption.
doi:http://www.ey.com/Publication/vwLUAssets/EY-transparency-international-
275
corruption-perceptions-index-2014/$FILE/EY-transparency-international-
corruption-perceptions-index-2014.pdf
Trigeorgis, L. (1993). The nature of option interactions and the valuation of investments
with multiple. The Journal of Financial and Quantitative Analysis, 28(1), 1-20.
Truong, G., Partington, G., and Peat, M. (2008). Cost of capital estimation and Capital
budgeting practice in Australia. Asutralian Journal of Management, 33(1), 95-122.
Turner, G. (2003). British cultural studies: An introduction.. UK: Psychology Press.
Vadeei, M., Mahmoudi, P., and Saeid, A. (2012). An analysis and explanation of the
relationship between techniques of capital budgeting and the performance of
companies admitted to Tehran stock exchange. Journal of Basic and Applied
Scientific Research, 2(7), 6420-6423.
Velez, I., & Nieto, G. (1986). Investment decision-making practices in Colombia: A survey.
Interfaces, 16(4), 60-65.
Verbeeten, F.H. (2006). Do organizations adopt sophisticated capital budgeting practices
to deal with uncertainty in the investment decision? A research note. Management
Accounting Research, 17(1), 106-120.
Verma, S., Gupta, S., & Batra, R. (2009). A survey of capital budgeting practices in
corporate India. The Journal of Business Perspective, 13(1), 1-17.
Waterhouse, J., & Tiessen, P. (1978). A contingency framework for management
accounting system research. Accounting, Organisation and Society, 3(1), 65-76.
Weston, J., & Copeland, T. (1992). Managerial Finance (9 ed.). Hinsdale, US: Dryden
Press.
Westwick, C., & Shohet, P. (1976). Investment appraisal and inflation: Report. England:
Institute of Chartered Accountants in England and Wales.
Whitman, D., & Terry, R. (2012). Fundamentals of engineering economics and decision
analysis. Synthesis Lectures on Engineering, 7(1), 1-219.
Whittington, G. (1971). The prediction of profitability. Cambridge, UK: Cambridge
University Press.
Wijewardena, H., & De Zoysa, A. (1999). A comparative analysis of management
accounting practices in Australia and Japan: An empirical investigation. The
International Journal of Accounting, 34(1), 49-70.
Wilkes, F., Samuels, J., & Greenfield, S. (1996). Investment decision making in UK
manufacturing industry. Management Decision, 34(4), 62-71.
276
Williamson, K., & Johanson, G. (2013). Research Methods: Information, system, contexts
(1 ed.). Victoria, Australia: Tilde Publishing and Distribution.
Wilson, C., & Keers, B. (2003). Financial Management: Principles and applications (4
ed.). NSW, Australia: Pearson Education Australia.
Wnuk-Pel, T. (2014). Capital budgeting practices in non manufacturing companies in
Poland. Social Sciences, 82(4), 59-69.
Wong, K., Farragher, E., and Leung, R. (1987). Capital investment practices: A survey of
large corporations in Malaysia, Singapore, and Hong Kong. Asia-Pacific Journal of
Management, 4(2), 112-113.
Woods, J., & Randall, M. (1989). The net present value of future investment opportunities:
Its impact on shareholder wealth and implications for capital budgeting theory.
Financial Management, 18(2), 85-92.
World Bank. (2013). World bank annual report. The World Bank. Retrieved July 1, 2015,
from http://siteresources.worldbank.org/EXTANNREP2013/Resources/9304887-
1377201212378/9305896-1377544753431/1_AnnualReport2013_EN.pdf
Zeeman, R., & Naumann, K. (2005). Principles of managerial finance (4 ed.).
NSW,Australia: Pearson Education.
Zhang, W., Qing, C., and Schniederjans, M. (2004). Neural network earnings per share
forecasting models: A comparative analysis of alternative methods. Decision
Sciences, 35(2), 205-236.
Zinn, C., Lesso, W., & Motazed, B. (1977). A probabilistic approach to risk analysis in
capital investment projects. The Engineering Economist, 22(4), 239-260.
277
Appendices
Appendix A: Plain Language Statement
SCHOOL OF BUSINESS
Project Title: Capital Budgeting Practices and Firm Performance: A
Comparative Study of Australia and Sri Lanka
Principal Researcher: Dr Samanthala Hettihewa
Other/Student Researchers: Dr Gavin Hurst
Mr Pratheepkanth Puwanenthiren
Dear Sir/Madam,
You are invited to participate in a PhD research study being undertaken by Pratheepkanth
Puwanenthiren, under the supervision of Dr Samanthala Hettihewa, and Dr Gavin Hurst of
The Faculty of Business, Federation University Australia, entitled: Capital budgeting
practices and firm performance: a comparative study of Australia and Sri Lanka.
The aim of the research is to investigate whether the capital budgeting practices differ
significantly between Australia and Sri Lanka in terms of performance maximisation and
to contribute to the existing literature, and understanding of capital budgeting practices and
firm performance in Australian and Sri Lankan listed firms across several industries and in
doing so will provide a framework capable of being adopted by both developed and less
developed countries. Particularly, how capital budgeting practices impact on firm
performance in developed and emerging economies. Moreover, this study would benefit
the academics, researchers, policy-makers and practitioners of both countries and other
similar countries through exploring the impact of capital budgeting practices on firm
performance, and pursuing policy to improve the current status of it.
Your contact details have been obtained from your company’s website. Participation in this
research will involve completing the enclosed questionnaire which will take about 25-30
minutes to complete. If you are willing to participate, please complete the attached survey
and return using the enclosed postage-paid envelope by (date).
Responses to the questionnaire will be anonymous and confidential. Please note that your
participation in this research is completely voluntary, and if you do not wish to take part
you are not obliged to do so. Also note that the reply paid envelope provided is coded to
allow the researchers to track non-respondents, however, the questionnaire will be removed

278
and immediately separated from the envelopes on receipt. The questionnaire and the
envelopes will then not be able to be linked in any way. The return of the survey will be
recorded on a database using the coded envelope and the envelopes will then be shredded
immediately so as to assure complete confidentiality. All data from the research will be
stored securely by the principal researcher. Data collected from the questionnaires will be
destroyed after 5 years. You should note however that it is impossible to withdraw once
your survey is returned by mail, due to the anonymous nature of the survey.
Please contact the researchers by an email (provided below) if you would like to receive a
summary of findings on completion of the project.
In the unlikely event that you feel any distress, Australian participants can contact lifeline
on 13 11 14 and Sri Lanka participants can contact lifeline on 1333.
If you have any questions or concerns about completing the questionnaire, you may contact
me at 61 3 5327 9158 or [email protected]
Your cooperation and participation in this study is greatly appreciated.
Sincerely,
Dr Samanthala Hettihewa
If you have any questions, or you would like further information regarding the project titled
Capital Budgeting Practices and Firm Performance: A Comparative Study of Australia and Sri
Lanka, please contact the Principal Researcher Dr Samanthala Hettihewa of the Faculty of
Business. Telephone: 61 3 5327 9158, Email: [email protected] Should you (i.e. the participant) have any concerns about the ethical conduct of this research project, please contact the Federation University Ethics Officer, Research Services, Federation University Australia, PO Box
663, Mt. Helen VIC 3353. Telephone: (03) 5327 9765, Email: [email protected]
CRICOS Provider Number 00103D

279
Appendix B: A Survey Questionnaire
When completing the questionnaire, please focus only on the firm to which you are
attached in providing your responses. Do not focus on other companies in the group.
The questionnaire contains two series of questions. Series A requests general
information of your company. Series B investigates the capital budgeting practice
variables under eight sub-sections.
Please indicate your responses in the relevant box for the given statements/questions.
A1 Indicate your position in the firm.
Chief Financial
Officer
Chief Executive
Officer Director Accountant
Finance
Manager Other
A2 Gender
A3 Indicate your highest educational background.
Diploma Bachelor Honours Master PhD Other
A4 Specify your age group.
Male Female
Below twenty five
years (<25)
Twenty five to thirty
five years (25-35)
Thirty five to fifty five
years (36-55)
Over fifty five years
(55<)
Survey on Capital Budgeting Practices
Part A: General Information
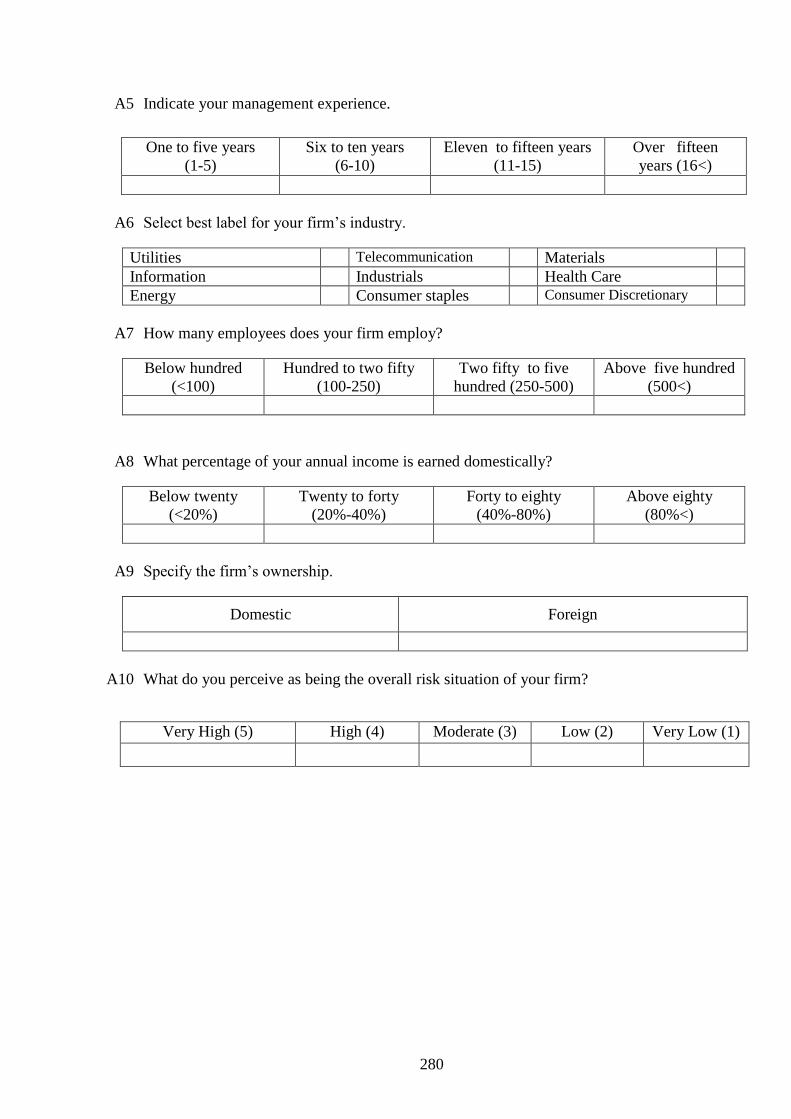
280
A5 Indicate your management experience.
A6 Select best label for your firm’s industry.
Utilities Telecommunication Materials
Information Industrials Health Care
Energy Consumer staples Consumer Discretionary
A7 How many employees does your firm employ?
Below hundred
(<100)
Hundred to two fifty
(100-250)
Two fifty to five
hundred (250-500)
Above five hundred
(500<)
A8 What percentage of your annual income is earned domestically?
Below twenty
(<20%)
Twenty to forty
(20%-40%)
Forty to eighty
(40%-80%)
Above eighty
(80%<)
A9 Specify the firm’s ownership.
Domestic Foreign
A10 What do you perceive as being the overall risk situation of your firm?
One to five years
(1-5)
Six to ten years
(6-10)
Eleven to fifteen years
(11-15)
Over fifteen
years (16<)
Very High (5) High (4) Moderate (3) Low (2) Very Low (1)
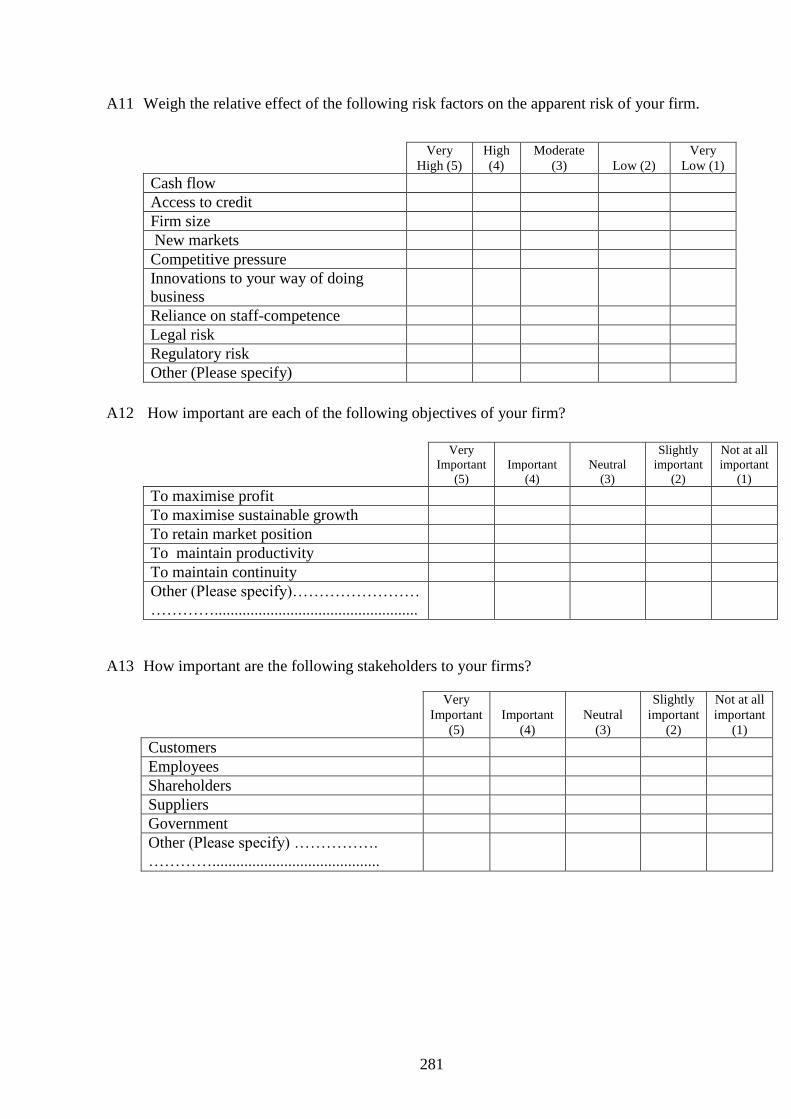
281
A11 Weigh the relative effect of the following risk factors on the apparent risk of your firm.
A12 How important are each of the following objectives of your firm?
A13 How important are the following stakeholders to your firms?
Very
Important
(5)
Important
(4)
Neutral
(3)
Slightly
important
(2)
Not at all
important
(1)
Customers
Employees
Shareholders
Suppliers
Government
Other (Please specify) …………….
…………..........................................
Very
High (5)
High
(4)
Moderate
(3) Low (2)
Very
Low (1)
Cash flow
Access to credit
Firm size
New markets
Competitive pressure
Innovations to your way of doing
business
Reliance on staff-competence
Legal risk
Regulatory risk
Other (Please specify)
Very
Important
(5)
Important
(4)
Neutral
(3)
Slightly
important
(2)
Not at all
important
(1)
To maximise profit
To maximise sustainable growth
To retain market position
To maintain productivity
To maintain continuity
Other (Please specify)……………………
…………...................................................
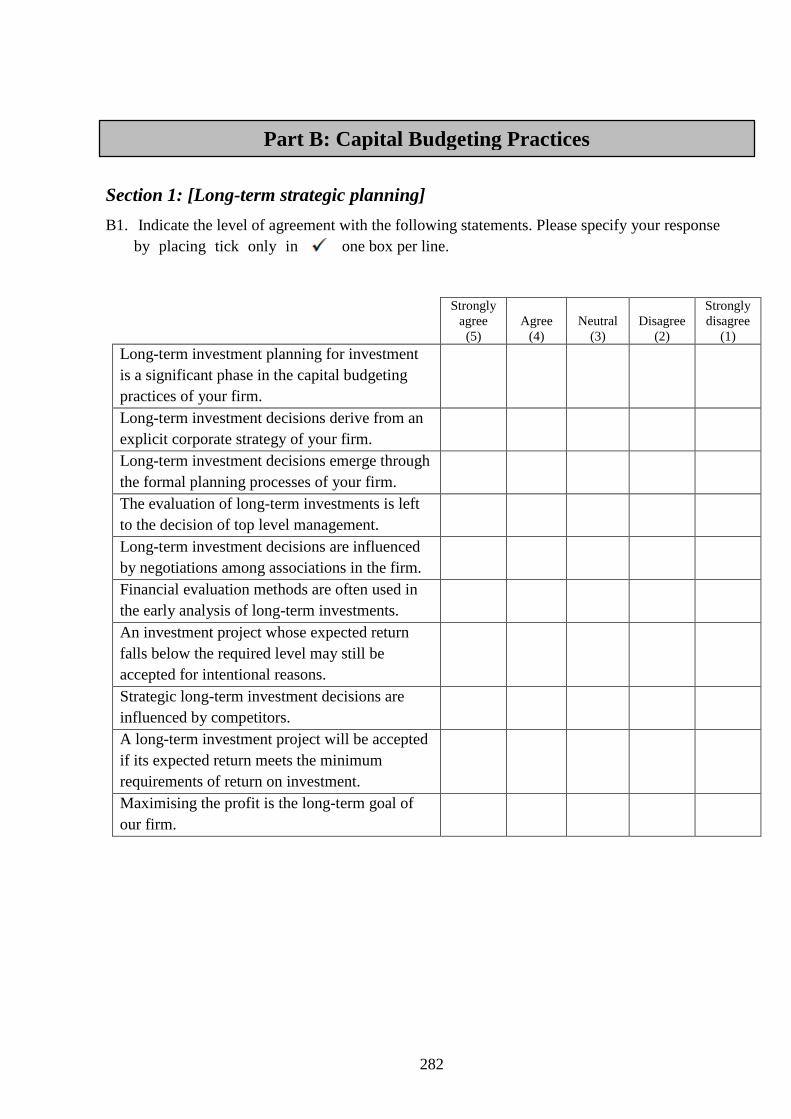
282
Section 01: Long term strategic planning
Section 1: [Long-term strategic planning]
B1. Indicate the level of agreement with the following statements. Please specify your response
by placing tick only in one box per line.
Strongly
agree
(5)
Agree
(4)
Neutral
(3)
Disagree
(2)
Strongly
disagree
(1)
Long-term investment planning for investment
is a significant phase in the capital budgeting
practices of your firm.
Long-term investment decisions derive from an
explicit corporate strategy of your firm.
Long-term investment decisions emerge through
the formal planning processes of your firm.
The evaluation of long-term investments is left
to the decision of top level management.
Long-term investment decisions are influenced
by negotiations among associations in the firm.
Financial evaluation methods are often used in
the early analysis of long-term investments.
An investment project whose expected return
falls below the required level may still be
accepted for intentional reasons.
Strategic long-term investment decisions are
influenced by competitors.
A long-term investment project will be accepted
if its expected return meets the minimum
requirements of return on investment.
Maximising the profit is the long-term goal of
our firm.
Part B: Capital Budgeting Practices
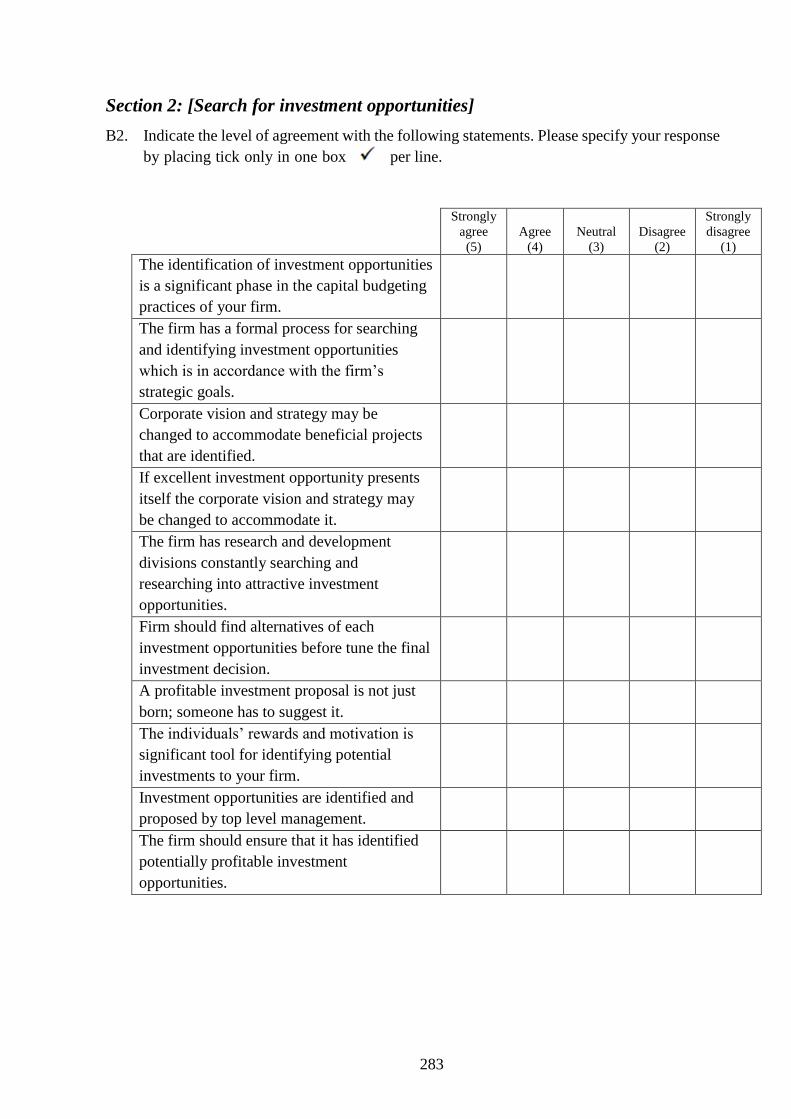
283
Section 2: [Search for investment opportunities]
B2. Indicate the level of agreement with the following statements. Please specify your response
by placing tick only in one box per line.
Strongly
agree
(5)
Agree
(4)
Neutral
(3)
Disagree
(2)
Strongly
disagree
(1)
The identification of investment opportunities
is a significant phase in the capital budgeting
practices of your firm.
The firm has a formal process for searching
and identifying investment opportunities
which is in accordance with the firm’s
strategic goals.
Corporate vision and strategy may be
changed to accommodate beneficial projects
that are identified.
If excellent investment opportunity presents
itself the corporate vision and strategy may
be changed to accommodate it.
The firm has research and development
divisions constantly searching and
researching into attractive investment
opportunities.
Firm should find alternatives of each
investment opportunities before tune the final
investment decision.
A profitable investment proposal is not just
born; someone has to suggest it.
The individuals’ rewards and motivation is
significant tool for identifying potential
investments to your firm.
Investment opportunities are identified and
proposed by top level management.
The firm should ensure that it has identified
potentially profitable investment
opportunities.

284
Section 3: [Review and screening]
B3. Indicate the level of agreement with the following statements. Please specify your response
by placing tick only in one box per line.
Strongly
agree
(5)
Agree
(4)
Neutral
(3)
Disagree
(2)
Strongly
disagree
(1)
The review and screening of projects is a
substantial phase in the capital budgeting practice
in your firm.
The firm has proper process for screening of
investments that is in accordance with the firm’s
investment goals.
The firm has written investment screening
guidelines for investment decisions.
The firm considers the investment’s review
aspects throughout the entire capital budgeting
process in your firm.
All identified investment opportunities are
subjected to a preliminary screening process by
management to isolate marginal and unsound
investments.
There exist proper processes for screening
investment opportunities where pathetic
investments are sorted out.
Review and screening involves some preliminary
quantitative analysis and judgements based on
past experience.
The firm has an established review staff /board
for screening identified investment opportunities.
The review and screening phase decision clearly
affects the success or failure of the firm and its
future direction.
The firm has regular and pre -decided procedures
for review of the majority of the investments.

285
Section 4: [Analysis and evaluation]
B4. How frequently has your firm used the following capital budgeting techniques when
deciding which investment to pursue over the past ten years? Please specify your response
by placing tick only in one box per line.
B5. When valuing an investment how did you assess your firm’s investment risk? Please
specify your response by placing tick only one box per line.
B6. How did you determine your firm’s cost of capital? Please specify your response by
placing tick only in one box per line.
Frequently
(5)
Mostly
(4)
Neutral
(3)
Rarely
(2)
Never
(1)
Payback period (PBP)
Discounted payback period (DPP)
Accounting rate of return (ARR)
Net present value (NPV)
Internal rate of return (IRR)
Other (Please specify)…………………….
…………………………………………….
Frequently
(5)
Mostly
(4)
Neutral
(3)
Rarely
(2)
Never
(1)
Scenario approach
Sensitivity analysis
Decision tree approach
Probabilistic (Monte Carlo) simulation
Risk adjusted discount rate
Other (Please specify)………………….....
…………………………………………….
Frequently
(5)
Mostly
(4)
Neutral
(3)
Rarely
(2)
Never
(1)
Weighted average cost of capital
Capital asset pricing model
Interest payable on debt capital
Dividend yield on shares
Earnings yield on shares
Other (Please specify) ……………………..
……………………………………………...
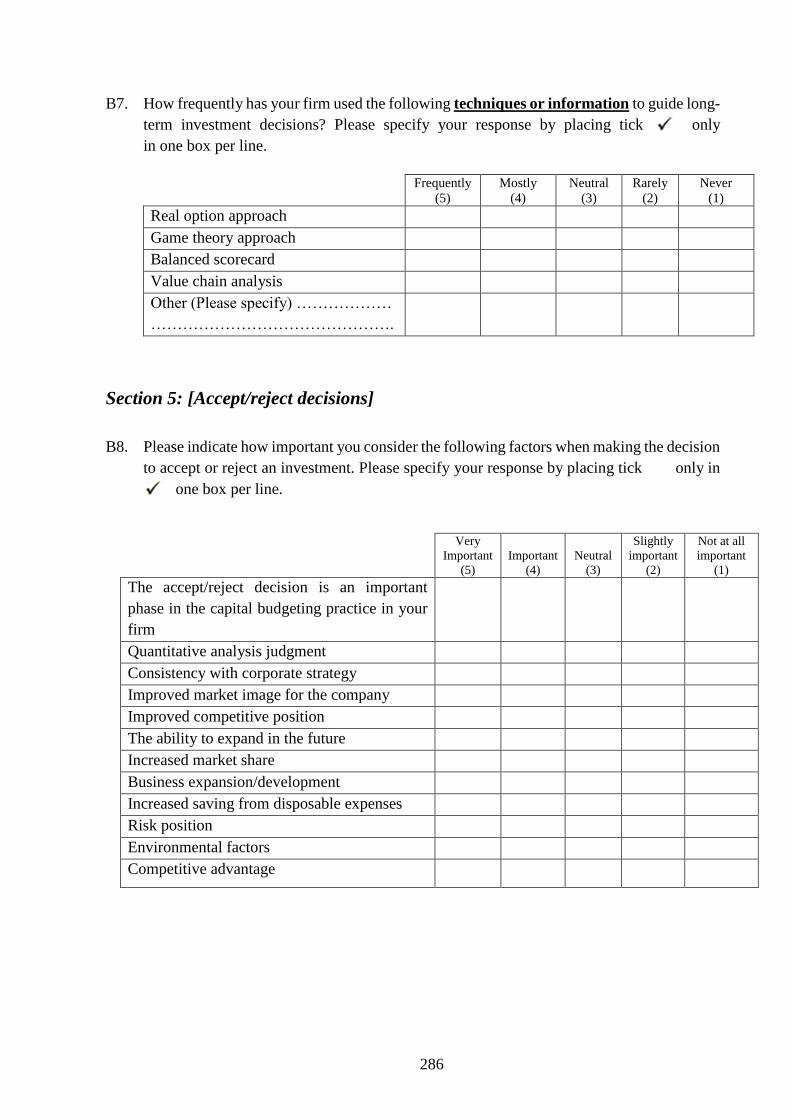
286
B7. How frequently has your firm used the following techniques or information to guide long-
term investment decisions? Please specify your response by placing tick only
in one box per line.
Section 5: [Accept/reject decisions]
B8. Please indicate how important you consider the following factors when making the decision
to accept or reject an investment. Please specify your response by placing tick only in
one box per line.
Frequently
(5)
Mostly
(4)
Neutral
(3)
Rarely
(2)
Never
(1)
Real option approach
Game theory approach
Balanced scorecard
Value chain analysis
Other (Please specify) ………………
……………………………………….
Very
Important
(5)
Important
(4)
Neutral
(3)
Slightly
important
(2)
Not at all
important
(1)
The accept/reject decision is an important
phase in the capital budgeting practice in your
firm
Quantitative analysis judgment
Consistency with corporate strategy
Improved market image for the company
Improved competitive position
The ability to expand in the future
Increased market share
Business expansion/development
Increased saving from disposable expenses
Risk position
Environmental factors
Competitive advantage
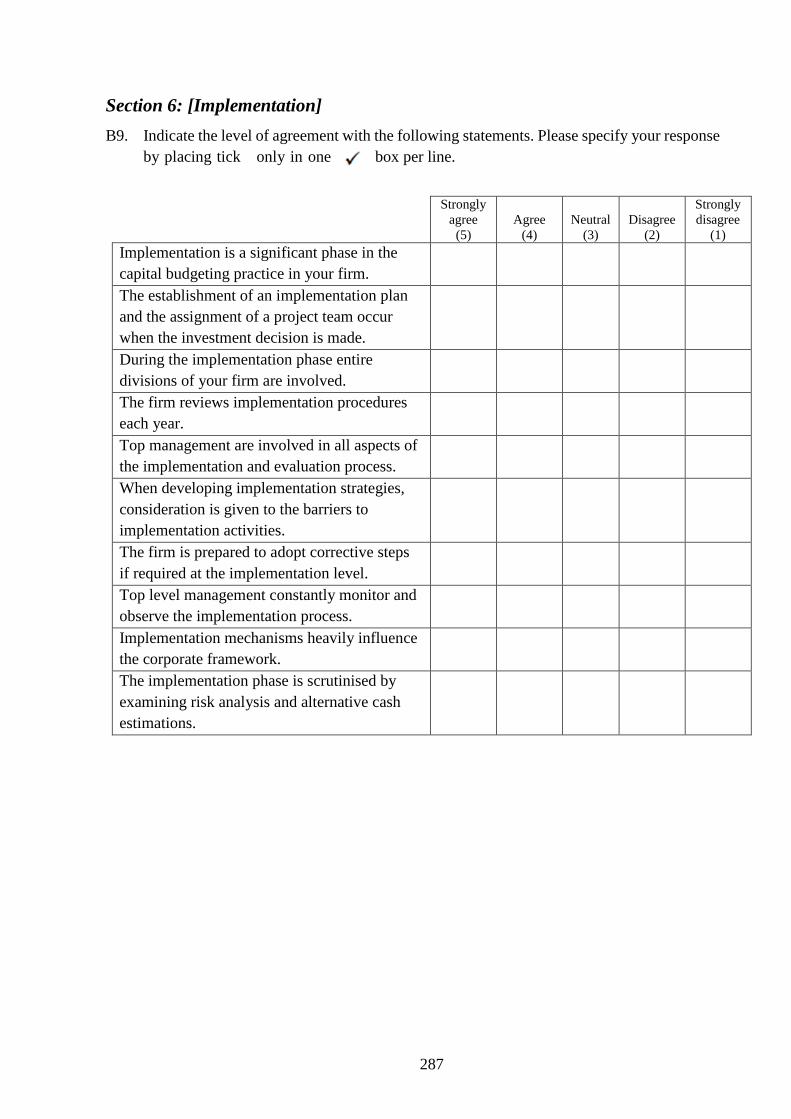
287
Section 6: [Implementation]
B9. Indicate the level of agreement with the following statements. Please specify your response
by placing tick only in one box per line.
Strongly
agree
(5)
Agree
(4)
Neutral
(3)
Disagree
(2)
Strongly
disagree
(1)
Implementation is a significant phase in the
capital budgeting practice in your firm.
The establishment of an implementation plan
and the assignment of a project team occur
when the investment decision is made.
During the implementation phase entire
divisions of your firm are involved.
The firm reviews implementation procedures
each year.
Top management are involved in all aspects of
the implementation and evaluation process.
When developing implementation strategies,
consideration is given to the barriers to
implementation activities.
The firm is prepared to adopt corrective steps
if required at the implementation level.
Top level management constantly monitor and
observe the implementation process.
Implementation mechanisms heavily influence
the corporate framework.
The implementation phase is scrutinised by
examining risk analysis and alternative cash
estimations.
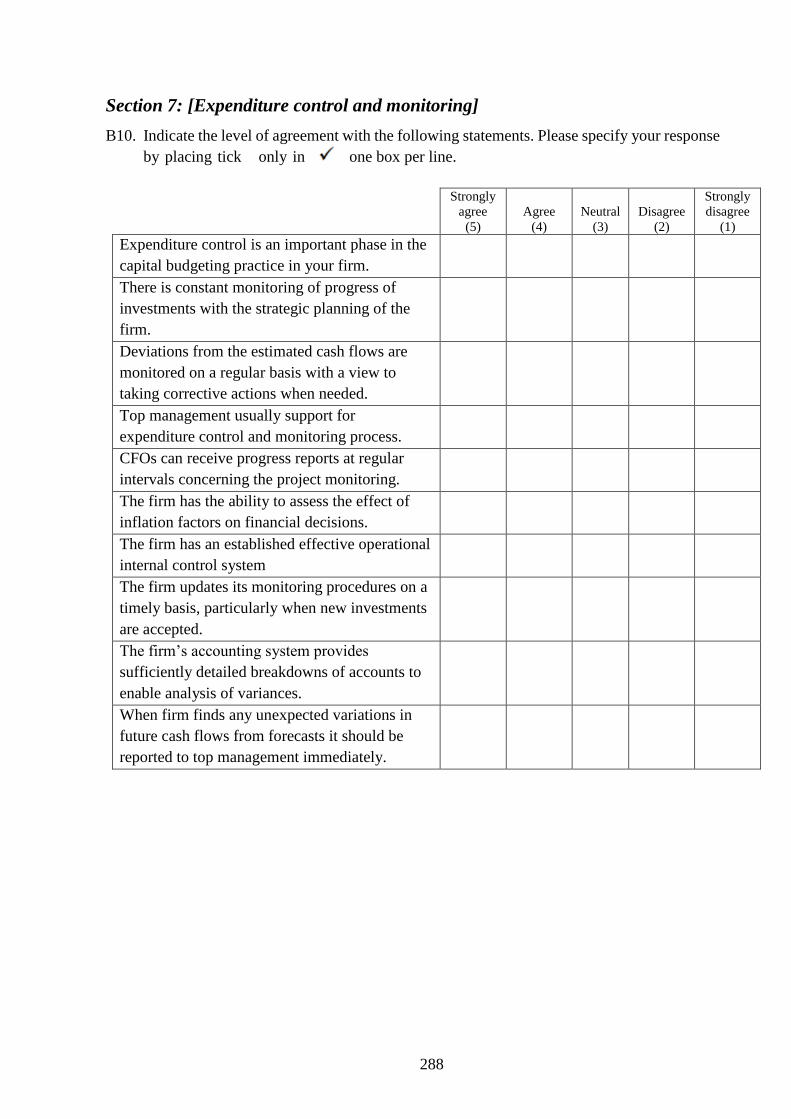
288
Section 7: [Expenditure control and monitoring]
B10. Indicate the level of agreement with the following statements. Please specify your response
by placing tick only in one box per line.
Strongly
agree
(5)
Agree
(4)
Neutral
(3)
Disagree
(2)
Strongly
disagree
(1)
Expenditure control is an important phase in the
capital budgeting practice in your firm.
There is constant monitoring of progress of
investments with the strategic planning of the
firm.
Deviations from the estimated cash flows are
monitored on a regular basis with a view to
taking corrective actions when needed.
Top management usually support for
expenditure control and monitoring process.
CFOs can receive progress reports at regular
intervals concerning the project monitoring.
The firm has the ability to assess the effect of
inflation factors on financial decisions.
The firm has an established effective operational
internal control system
The firm updates its monitoring procedures on a
timely basis, particularly when new investments
are accepted.
The firm’s accounting system provides
sufficiently detailed breakdowns of accounts to
enable analysis of variances.
When firm finds any unexpected variations in
future cash flows from forecasts it should be
reported to top management immediately.

289
Section 8: [Post-audit]
B11. Indicate the level of agreement with the following statements. Please specify your response
by placing tick only in one box per line.
Thank you
Strongly
agree
(5)
Agree
(4)
Neutral
(3)
Disagree
(2)
Strongly
disagree
(1)
The post-audit is an important phase in the
capital budgeting practice in your firm.
The auditor discusses key results with CFO
during the progress of the review of investment
decisions.
Overall, firm satisfies with the purpose, scope,
objectives, conduct, and results of the post
completion audit.
The firm has regular and pre-agreed procedures
for post-audits that is in accordance with the firm’s
investment goals.
The results of post-audits assist to evaluate
projects and to improve future forecasts.
A post implementation audit provides useful
feedback to investment appraisal in your firm.
Audit information prompts management to
consider a thorough review of the firm’s
strategic plan.
Post-audits relate to the current long-term
decisions support process of the investment
implementation.
Audits contribute greatly to improvement of
current investment decision making by
analysing past rights and wrongs.
Post-audit conclusions and opinion are logical
and well documented.

290
Appendix C: HREC Approval
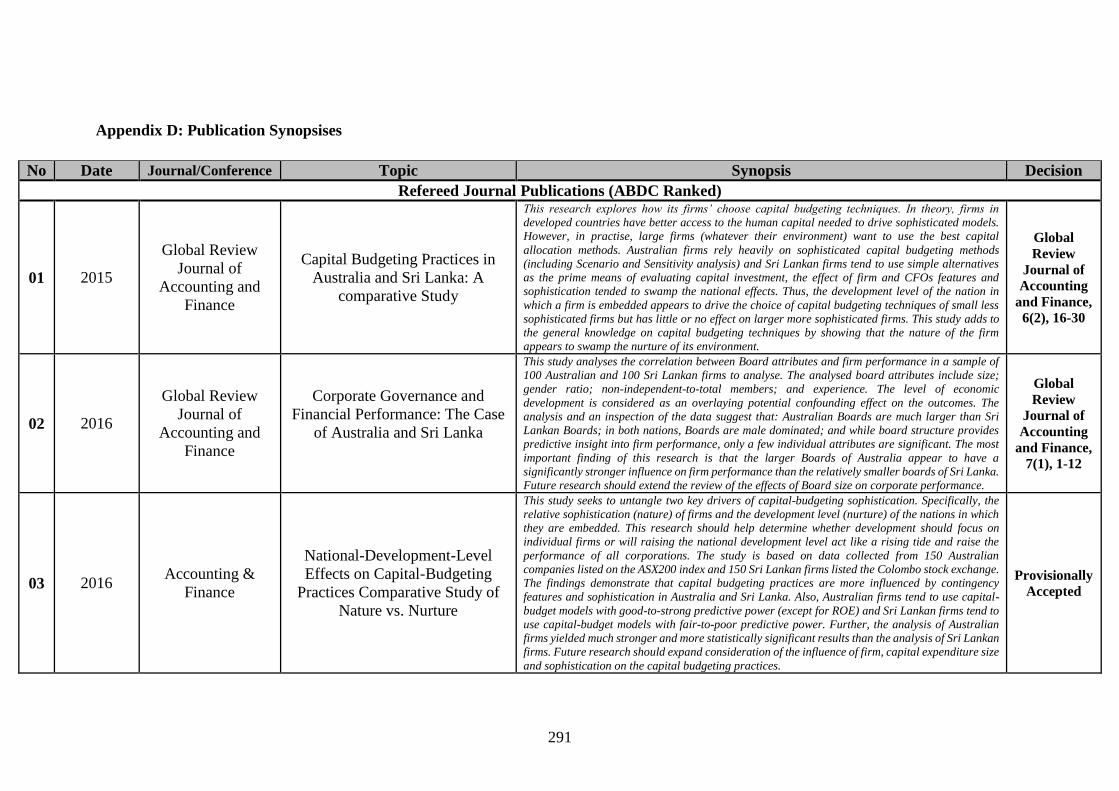
291
Appendix D: Publication Synopsises
No Date Journal/Conference Topic Synopsis Decision
Refereed Journal Publications (ABDC Ranked)
01 2015
Global Review
Journal of
Accounting and
Finance
Capital Budgeting Practices in
Australia and Sri Lanka: A
comparative Study
This research explores how its firms’ choose capital budgeting techniques. In theory, firms in
developed countries have better access to the human capital needed to drive sophisticated models.
However, in practise, large firms (whatever their environment) want to use the best capital
allocation methods. Australian firms rely heavily on sophisticated capital budgeting methods
(including Scenario and Sensitivity analysis) and Sri Lankan firms tend to use simple alternatives
as the prime means of evaluating capital investment, the effect of firm and CFOs features and
sophistication tended to swamp the national effects. Thus, the development level of the nation in
which a firm is embedded appears to drive the choice of capital budgeting techniques of small less
sophisticated firms but has little or no effect on larger more sophisticated firms. This study adds to
the general knowledge on capital budgeting techniques by showing that the nature of the firm
appears to swamp the nurture of its environment.
Global
Review
Journal of
Accounting
and Finance,
6(2), 16-30
02 2016
Global Review
Journal of
Accounting and
Finance
Corporate Governance and
Financial Performance: The Case
of Australia and Sri Lanka
This study analyses the correlation between Board attributes and firm performance in a sample of
100 Australian and 100 Sri Lankan firms to analyse. The analysed board attributes include size;
gender ratio; non-independent-to-total members; and experience. The level of economic
development is considered as an overlaying potential confounding effect on the outcomes. The
analysis and an inspection of the data suggest that: Australian Boards are much larger than Sri
Lankan Boards; in both nations, Boards are male dominated; and while board structure provides
predictive insight into firm performance, only a few individual attributes are significant. The most
important finding of this research is that the larger Boards of Australia appear to have a
significantly stronger influence on firm performance than the relatively smaller boards of Sri Lanka.
Future research should extend the review of the effects of Board size on corporate performance.
Global
Review
Journal of
Accounting
and Finance,
7(1), 1-12
03 2016 Accounting &
Finance
National-Development-Level
Effects on Capital-Budgeting
Practices Comparative Study of
Nature vs. Nurture
This study seeks to untangle two key drivers of capital-budgeting sophistication. Specifically, the
relative sophistication (nature) of firms and the development level (nurture) of the nations in which
they are embedded. This research should help determine whether development should focus on
individual firms or will raising the national development level act like a rising tide and raise the
performance of all corporations. The study is based on data collected from 150 Australian
companies listed on the ASX200 index and 150 Sri Lankan firms listed the Colombo stock exchange.
The findings demonstrate that capital budgeting practices are more influenced by contingency
features and sophistication in Australia and Sri Lanka. Also, Australian firms tend to use capital-
budget models with good-to-strong predictive power (except for ROE) and Sri Lankan firms tend to
use capital-budget models with fair-to-poor predictive power. Further, the analysis of Australian
firms yielded much stronger and more statistically significant results than the analysis of Sri Lankan
firms. Future research should expand consideration of the influence of firm, capital expenditure size
and sophistication on the capital budgeting practices.
Provisionally
Accepted
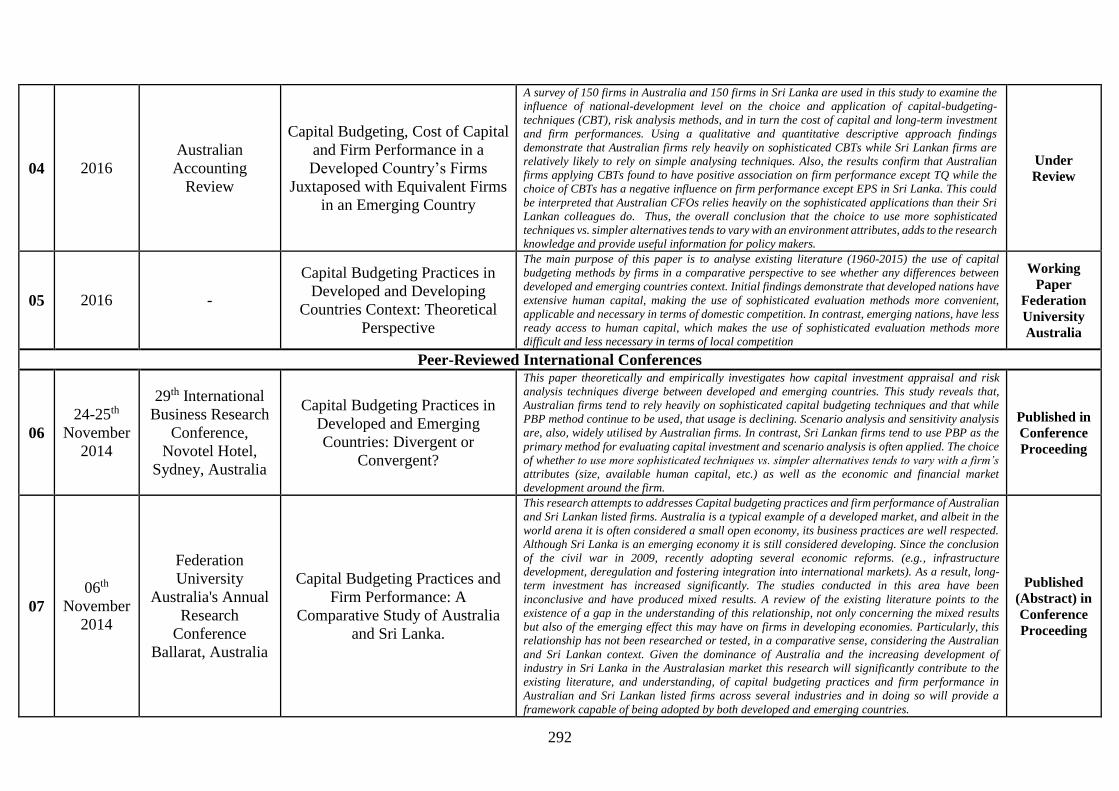
292
04 2016
Australian
Accounting
Review
Capital Budgeting, Cost of Capital
and Firm Performance in a
Developed Country’s Firms
Juxtaposed with Equivalent Firms
in an Emerging Country
A survey of 150 firms in Australia and 150 firms in Sri Lanka are used in this study to examine the
influence of national-development level on the choice and application of capital-budgeting-
techniques (CBT), risk analysis methods, and in turn the cost of capital and long-term investment
and firm performances. Using a qualitative and quantitative descriptive approach findings
demonstrate that Australian firms rely heavily on sophisticated CBTs while Sri Lankan firms are
relatively likely to rely on simple analysing techniques. Also, the results confirm that Australian
firms applying CBTs found to have positive association on firm performance except TQ while the
choice of CBTs has a negative influence on firm performance except EPS in Sri Lanka. This could
be interpreted that Australian CFOs relies heavily on the sophisticated applications than their Sri
Lankan colleagues do. Thus, the overall conclusion that the choice to use more sophisticated
techniques vs. simpler alternatives tends to vary with an environment attributes, adds to the research
knowledge and provide useful information for policy makers.
Under
Review
05 2016 -
Capital Budgeting Practices in
Developed and Developing
Countries Context: Theoretical
Perspective
The main purpose of this paper is to analyse existing literature (1960-2015) the use of capital
budgeting methods by firms in a comparative perspective to see whether any differences between
developed and emerging countries context. Initial findings demonstrate that developed nations have
extensive human capital, making the use of sophisticated evaluation methods more convenient,
applicable and necessary in terms of domestic competition. In contrast, emerging nations, have less
ready access to human capital, which makes the use of sophisticated evaluation methods more
difficult and less necessary in terms of local competition
Working
Paper Federation
University
Australia
Peer-Reviewed International Conferences
06
24-25th
November
2014
29th International
Business Research
Conference,
Novotel Hotel,
Sydney, Australia
Capital Budgeting Practices in
Developed and Emerging
Countries: Divergent or
Convergent?
This paper theoretically and empirically investigates how capital investment appraisal and risk
analysis techniques diverge between developed and emerging countries. This study reveals that,
Australian firms tend to rely heavily on sophisticated capital budgeting techniques and that while
PBP method continue to be used, that usage is declining. Scenario analysis and sensitivity analysis
are, also, widely utilised by Australian firms. In contrast, Sri Lankan firms tend to use PBP as the
primary method for evaluating capital investment and scenario analysis is often applied. The choice
of whether to use more sophisticated techniques vs. simpler alternatives tends to vary with a firm’s
attributes (size, available human capital, etc.) as well as the economic and financial market
development around the firm.
Published in
Conference
Proceeding
07
06th
November
2014
Federation
University
Australia's Annual
Research
Conference
Ballarat, Australia
Capital Budgeting Practices and
Firm Performance: A
Comparative Study of Australia
and Sri Lanka.
This research attempts to addresses Capital budgeting practices and firm performance of Australian
and Sri Lankan listed firms. Australia is a typical example of a developed market, and albeit in the
world arena it is often considered a small open economy, its business practices are well respected.
Although Sri Lanka is an emerging economy it is still considered developing. Since the conclusion
of the civil war in 2009, recently adopting several economic reforms. (e.g., infrastructure
development, deregulation and fostering integration into international markets). As a result, long-
term investment has increased significantly. The studies conducted in this area have been
inconclusive and have produced mixed results. A review of the existing literature points to the
existence of a gap in the understanding of this relationship, not only concerning the mixed results
but also of the emerging effect this may have on firms in developing economies. Particularly, this
relationship has not been researched or tested, in a comparative sense, considering the Australian
and Sri Lankan context. Given the dominance of Australia and the increasing development of
industry in Sri Lanka in the Australasian market this research will significantly contribute to the
existing literature, and understanding, of capital budgeting practices and firm performance in
Australian and Sri Lankan listed firms across several industries and in doing so will provide a
framework capable of being adopted by both developed and emerging countries.
Published
(Abstract) in
Conference
Proceeding
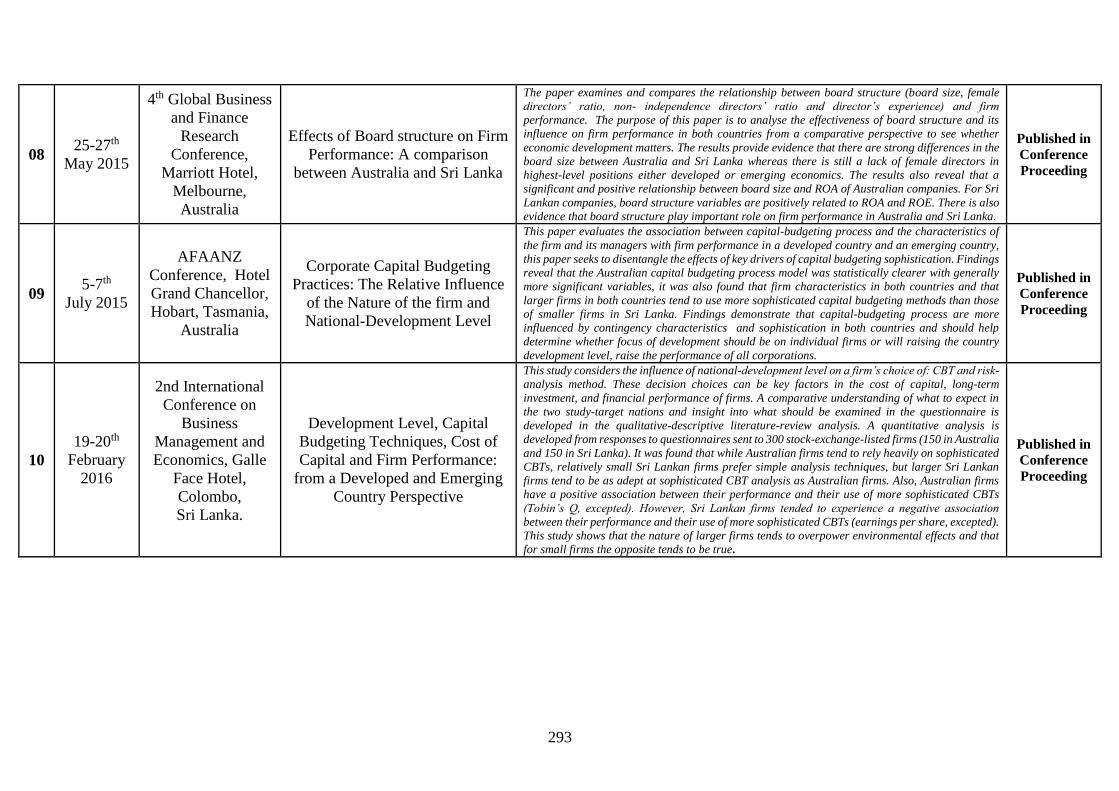
293
08 25-27th
May 2015
4th Global Business
and Finance
Research
Conference,
Marriott Hotel,
Melbourne,
Australia
Effects of Board structure on Firm
Performance: A comparison
between Australia and Sri Lanka
The paper examines and compares the relationship between board structure (board size, female
directors’ ratio, non- independence directors’ ratio and director’s experience) and firm
performance. The purpose of this paper is to analyse the effectiveness of board structure and its
influence on firm performance in both countries from a comparative perspective to see whether
economic development matters. The results provide evidence that there are strong differences in the
board size between Australia and Sri Lanka whereas there is still a lack of female directors in
highest-level positions either developed or emerging economics. The results also reveal that a
significant and positive relationship between board size and ROA of Australian companies. For Sri
Lankan companies, board structure variables are positively related to ROA and ROE. There is also
evidence that board structure play important role on firm performance in Australia and Sri Lanka.
Published in
Conference
Proceeding
09 5-7th
July 2015
AFAANZ
Conference, Hotel
Grand Chancellor,
Hobart, Tasmania,
Australia
Corporate Capital Budgeting
Practices: The Relative Influence
of the Nature of the firm and
National-Development Level
This paper evaluates the association between capital-budgeting process and the characteristics of
the firm and its managers with firm performance in a developed country and an emerging country,
this paper seeks to disentangle the effects of key drivers of capital budgeting sophistication. Findings
reveal that the Australian capital budgeting process model was statistically clearer with generally
more significant variables, it was also found that firm characteristics in both countries and that
larger firms in both countries tend to use more sophisticated capital budgeting methods than those
of smaller firms in Sri Lanka. Findings demonstrate that capital-budgeting process are more
influenced by contingency characteristics and sophistication in both countries and should help
determine whether focus of development should be on individual firms or will raising the country
development level, raise the performance of all corporations.
Published in
Conference
Proceeding
10
19-20th
February
2016
2nd International
Conference on
Business
Management and
Economics, Galle
Face Hotel,
Colombo,
Sri Lanka.
Development Level, Capital
Budgeting Techniques, Cost of
Capital and Firm Performance:
from a Developed and Emerging
Country Perspective
This study considers the influence of national-development level on a firm’s choice of: CBT and risk-
analysis method. These decision choices can be key factors in the cost of capital, long-term
investment, and financial performance of firms. A comparative understanding of what to expect in
the two study-target nations and insight into what should be examined in the questionnaire is
developed in the qualitative-descriptive literature-review analysis. A quantitative analysis is
developed from responses to questionnaires sent to 300 stock-exchange-listed firms (150 in Australia
and 150 in Sri Lanka). It was found that while Australian firms tend to rely heavily on sophisticated
CBTs, relatively small Sri Lankan firms prefer simple analysis techniques, but larger Sri Lankan
firms tend to be as adept at sophisticated CBT analysis as Australian firms. Also, Australian firms
have a positive association between their performance and their use of more sophisticated CBTs
(Tobin’s Q, excepted). However, Sri Lankan firms tended to experience a negative association
between their performance and their use of more sophisticated CBTs (earnings per share, excepted).
This study shows that the nature of larger firms tends to overpower environmental effects and that
for small firms the opposite tends to be true.
Published in
Conference
Proceeding

294
Related Documents


