© 2021 Micron Technology, Inc. All rights reserved. Information, products, and/or specifications are subject to change without notice. Micron, the Micron logo, and all other Micron trademarks are the property of Micron Technology, Inc. All other trademarks are the property of their respective owners. 1 Sanjay Mehrotra and Dave Zinsner August 2, 2021 Capital Allocation Update

Welcome message from author
This document is posted to help you gain knowledge. Please leave a comment to let me know what you think about it! Share it to your friends and learn new things together.
Transcript

© 2021 Micron Technology, Inc. All rights reserved. Information, products, and/or specifications are
subject to change without notice. Micron, the Micron logo, and all other Micron trademarks are the
property of Micron Technology, Inc. All other trademarks are the property of their respective owners.
1
Sanjay Mehrotra and Dave Zinsner
August 2, 2021
Capital Allocation Update

Safe Harbor Statement2
During the course of this meeting, we may make projections or other forward-looking statements
regarding future events or the future financial performance of the Company and the industry. We
wish to caution you that such statements are predictions and that actual events or results may
differ materially. We refer you to the documents the Company files from time to time with the
Securities and Exchange Commission, specifically the Company’s most recent Form 10-K and
Form 10-Q. These documents contain and identify important factors that could cause the actual
results for the Company to differ materially from those contained in our projections or forward-
looking statements. These certain factors can be found at micron.com/certainfactors. Although we
believe that the expectations reflected in the forward-looking statements are reasonable, we
cannot guarantee future results, levels of activity, performance, or achievements. We are under no
duty to update any of the forward-looking statements after the date of the presentation to conform
these statements to actual results.

3
Sanjay MehrotraCEO

4
Initiating a dividend$0.10 quarterly
Today we are announcing an important milestone:

5
Micron's Transformation
Financial Strength
Capital Allocation Strategy
Agenda

6
Micron'sTransformation

7
The New Micron Is Stronger Than Ever Before
Strong market demand growth
Slowing industry supply growth
Leading DRAM and NAND technology
Providing confidence to initiate a dividend
Industry’s broadest portfolio
World-class manufacturing
Team & culture: Innovation for all

Strong Secular Demand Across End Markets8
DRAM and NAND revenue is growing faster than the broader semiconductor industry
Sources: SEMI Rev: WSTS; DRAM and NAND: Yole, Forward Insights, Gartner, and Micron
CY'20 CY'24
$183B
$120B
Memory and Storage
Total Available Market Growth
TAM - total available market | Source: Micron
2005 2010 2015 2020
DRAM + NAND Revenue as %
of Semiconductor TAM4-year moving average
10%
20%
30%

9
Micron supply discipline
Long-term:Capex aligned with stable bit share target
Short term:Adjustments via utilization, capacity shifts
between end markets, and ability to hold
higher levels of inventory
Factors that have improved industry supply dynamics
▪ Slowing of Moore's Law
▪ Industry consolidation
▪ ROIC focus & capital return
Slowing Industry Supply Growth

10
176-Layer: Industry’s Most Advanced NAND
1α nm: Industry’s Most Advanced DRAM
Technology LeadershipDelivering cost competitiveness and customer value
1α nm DRAM & 176-Layer 3D NAND: able to ramp yields 25-30% faster than previous nodes

11
Dramatically strengthened product portfolioRapidly ramping industry-leading technology across market segments
Data center, PC & Graphics▪ Compute DRAM leadership
▪ Highest performance
graphics DRAM
▪ Strong CXL roadmap
SSDs▪ QLC penetration
▪ Broadening NVMe SSD portfolio
▪ SATA leadership
Mobile▪ Low-power DRAM leadership
▪ Leading NAND/MCP solutions
▪ First to market with LP5
Auto & Embedded▪ #1 in Auto and Industrial
▪ First to market with the ISO
26262 standard, ensuring safety
▪ World’s first automotive qualified
UFS 3.1 storage.
Industry's broadest portfolio
High- Bandwidth
Graphics Memory
Compute DRAM
1α-based DDR4
Solid State Drives
176-layer SSDs
Low-Power Memory and Storage
▪ 1α-based LPDDR4X
▪ 176-layer UFS
Automotive-Grade
Memory and Storage

12
Enhanced Manufacturing NetworkInvesting in Cleanroom SpaceEnabling node transitions while
maintaining stable wafer capacity
Lithography
Investing in most advanced EUV and Immersion tools
Smart ManufacturingAdoption of data analytics and AI
techniques to improve our efficiency
Tool Standardization Across DRAM Fabs
2017-2018
20nmMatching
<45%
2019-2021
1x, 1y, 1zMatching
60-70%
2022+
1a and BeyondMatching
>85%
Captive backend capacity and
geographic diversity improves our cost
competitiveness, agility and resiliency
~45%
FY18
>60%
FY20
C
S
S
M
M
M
T
T
DRAM
NAND/
MCP
SSD
C
S
S
M
Cap
tive
Fo
otp
rint
Ca
ptiv
eC
ap
ac
ity
MalaysiaSingaporeChina TaiwanKey

Brilliant, Motivated People Changing The World Through Innovation
13
Transforming how the world uses information to enrich life for all
Cultivating a diverseand inclusive culture that drives innovation
Implementing sustainable practices for the environment and our communities

Dave ZinsnerCFO
14

15
FinancialStrength

16
Our Financial Strength
Enhanced profitability
Strongcross cycle performance
Rock solid balance sheet

17
Enhanced Profitability
>1600 bps EBITDA margin improvementFY16 to FY20
Source: Micron
1. EBITDA is defined as GAAP net income plus interest, taxes,
depreciation and amortization of intangible assets. EBITDA Margin
as % of revenue.
2. LTM = Last twelve months
Micron LTM EBITDA Margin1
Higher Lows Over Time
-10%
10%
30%
50%
70%
FY-02 FY-06 FY-10 FY-14 FY-18 Q3-21
LTM
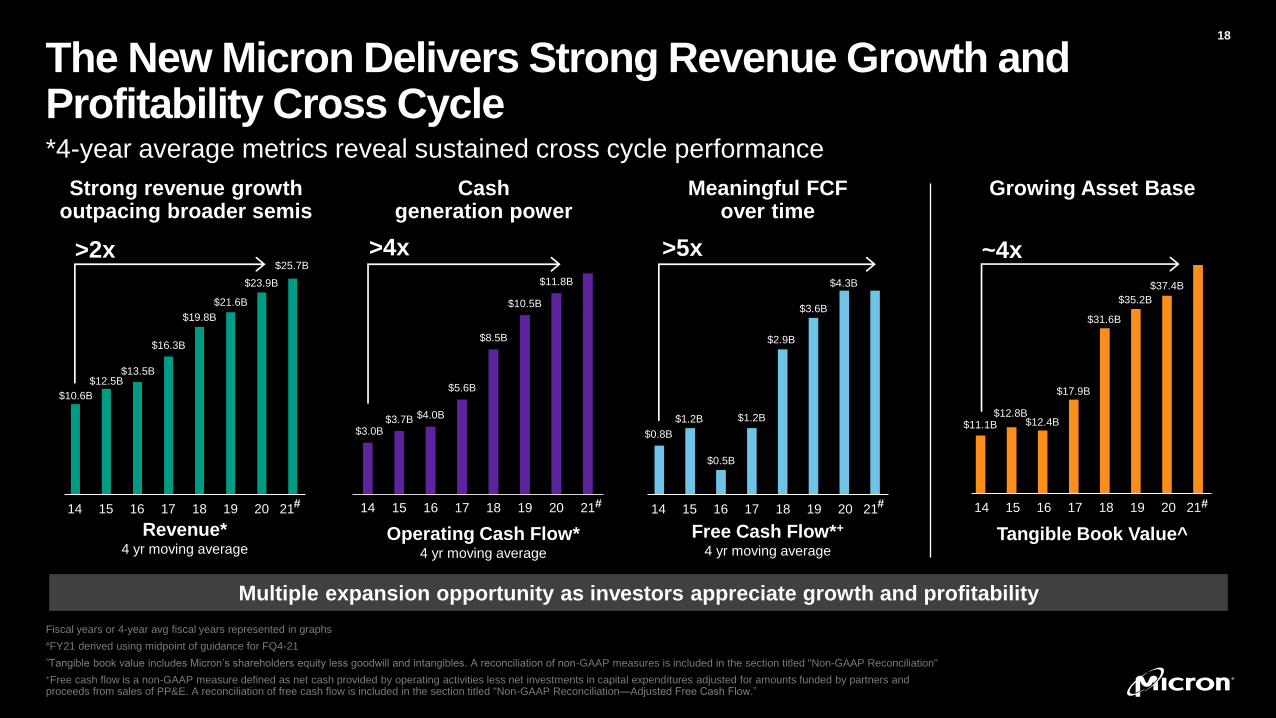
The New Micron Delivers Strong Revenue Growth andProfitability Cross Cycle
18
*4-year average metrics reveal sustained cross cycle performance
Strong revenue growth outpacing broader semis
Meaningful FCFover time
Multiple expansion opportunity as investors appreciate growth and profitability
Growing Asset Base
Fiscal years or 4-year avg fiscal years represented in graphs
#FY21 derived using midpoint of guidance for FQ4-21
^Tangible book value includes Micron’s shareholders equity less goodwill and intangibles. A reconciliation of non-GAAP measures is included in the section titled "Non-GAAP Reconciliation"
+Free cash flow is a non-GAAP measure defined as net cash provided by operating activities less net investments in capital expenditures adjusted for amounts funded by partners and proceeds from sales of PP&E. A reconciliation of free cash flow is included in the section titled "Non-GAAP Reconciliation—Adjusted Free Cash Flow.”
Cash generation power
Revenue*4 yr moving average
>2x
14 15 16 17 18 19 20 21
$10.6B
$12.5B$13.5B
$16.3B
$19.8B
$21.6B
$23.9B
$25.7B
#
$3.0B$3.7B $4.0B
$5.6B
$8.5B
$10.5B
$11.8B
14 15 16 17 18 19 20 21
>4x
Operating Cash Flow*4 yr moving average
#
Free Cash Flow*+
4 yr moving average
>5x
14 15 16 17 18 19 20 21
$4.3B
$3.6B
$2.9B
$1.2B
$0.5B
$1.2B
$0.8B
#
Tangible Book Value^
~4x
14 15 16 17 18 19 20 21
$12.4B
$37.4B
$35.2B
$31.6B
$17.9B
$12.8B$11.1B
#

Successfully Strengthened Balance Sheet19
Commitment to IG capital structure + net cash positive + low leverage ratio
1Leverage is defined as ratio of gross debt to Adjusted EBITDA. Adjusted EBITDA is a non-GAAP measure defined as non-GAAP net income plus interest, taxes, depreciation and amortization of intangible assets. A reconciliation of non-GAAP measures is included in the section titled "Non-GAAP Reconciliation"
2Net Cash is defined as sum of cash, short-term and long-term marketable investments, and restricted cash, minus debt
$9.6B
$12.4B
$11.6B
$11.1B
$9.0B$9.3B
$7.3B
$4.6B
$4.1B
$6.2B
$4.9B
$5.9B$5.6B
$5.4B
$6.7B $6.6B $6.6B $6.6B $6.7B
FQ1 FQ2 FQ3 FQ4 FQ1 FQ2 FQ3 FQ4 FQ1 FQ2 FQ3 FQ4 FQ1 FQ2 FQ3 FQ4 FQ1 FQ2 FQ3
2017 2018 2019 2020 2021
Transitioned to IG and
further improved debt structure
Total Debt Cash Position & Leverage
Net Cash2Total Cash Leverage1
$4.4B $4.6B$4.9B
$6.2B$6.6B
$8.7B
$7.7B$7.4B $7.2B
$9.2B
$7.9B
$9.2B
$8.3B $8.1B
$9.3B $9.3B
$8.4B $8.6B
$9.8B
-$5.2B
-$7.8B-$6.7B
-$5.0B
-$2.4B
-$0.6B
$0.3B
$2.7B$3.1B $3.0B $3.0B
$3.4B
$2.6B $2.7B $2.6B $2.6B
$1.7B $1.9B
$3.1B
2.7x 2.5x
1.6x
1.1x
0.7x 0.6x 0.4x
0.2x 0.2x 0.3x 0.3x 0.4x 0.6x 0.6x 0.8x 0.7x 0.7x 0.6x 0.6x
-10.0x
-8.0x
-6.0x
-4.0x
-2.0x
0.0x
2.0x
($8.0)
($3.0)
$2.0
$7.0
$12 .0
FQ1 FQ2 FQ3 FQ4 FQ1 FQ2 FQ3 FQ4 FQ1 FQ2 FQ3 FQ4 FQ1 FQ2 FQ3 FQ4 FQ1 FQ2 FQ3
2017 2018 2019 2020 2021
Transitioned to IG and
further improved debt structure

20
CapitalAllocationStrategy
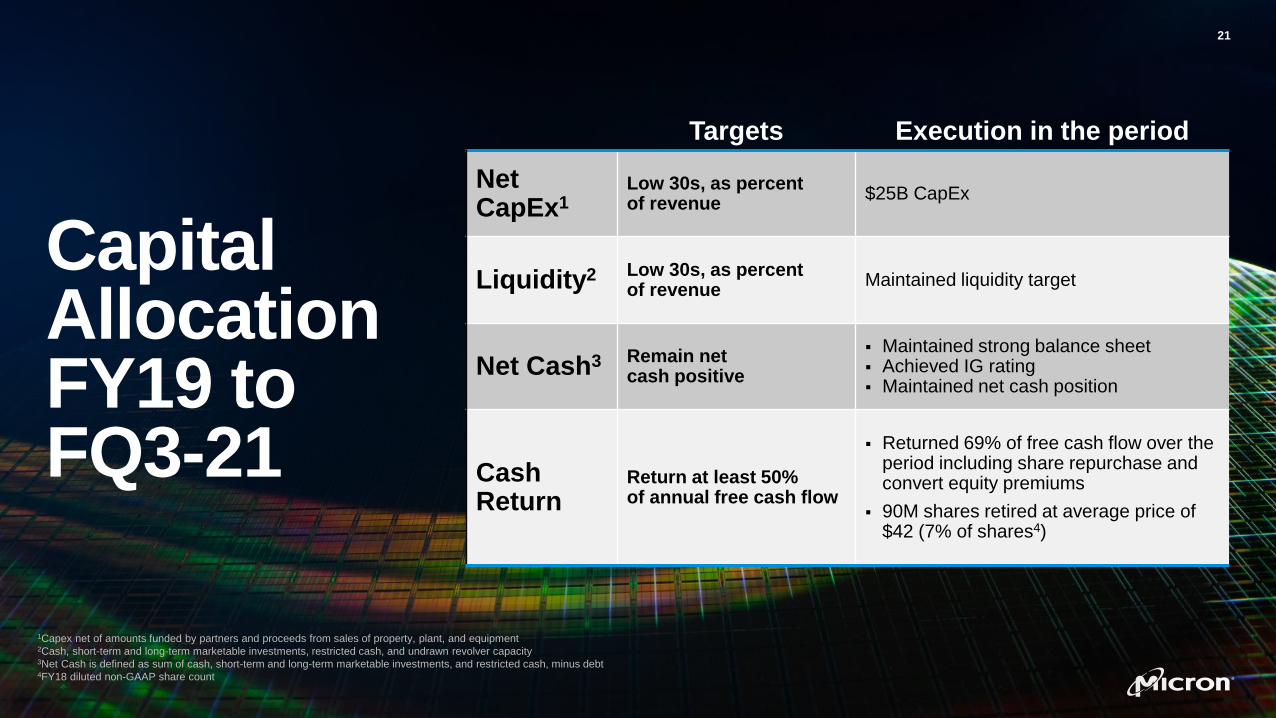
Capital Allocation FY19 to FQ3-21
21
Targets Execution in the period
Net CapEx1
Low 30s, as percent of revenue
$25B CapEx
Liquidity2 Low 30s, as percent of revenue
Maintained liquidity target
Net Cash3 Remain net cash positive
▪ Maintained strong balance sheet▪ Achieved IG rating▪ Maintained net cash position
Cash Return
Return at least 50% of annual free cash flow
▪ Returned 69% of free cash flow over the period including share repurchase and convert equity premiums
▪ 90M shares retired at average price of $42 (7% of shares4)
1Capex net of amounts funded by partners and proceeds from sales of property, plant, and equipment2Cash, short-term and long-term marketable investments, restricted cash, and undrawn revolver capacity3Net Cash is defined as sum of cash, short-term and long-term marketable investments, and restricted cash, minus debt4FY18 diluted non-GAAP share count

22
Targets
Net CapEx1 Mid 30s, as percent of revenue
Liquidity2 Mid 30s, as percent of revenue
Net Cash3 Remain net cash positive
Cash Return4
Return at least 50% of cross cycle free cash flow
$0.10 quarterly dividend
▪ Initiate at $0.10 per quarter. Goal of growing the dividend over time*
▪ Reflects our confidence in EBITDA and FCF generation ability of the business cross cycle
More opportunisticapproach to buybacks
▪ Add significant shareholder value by conserving cash to buy at larger discounts to intrinsic value
▪ We expect to repurchase some shares every year, but the size might vary
1Capex net of amounts funded by partners and proceeds from sales of property, plant, and equipment2Cash, short-term and long-term marketable investments, restricted cash, and undrawn revolver capacity3Net Cash is defined as sum of cash, short-term and long-term marketable investments, and restricted cash, minus debt4Starting in FQ4-21
*Future declarations of quarterly dividends are subject to the determination and discretion of Micron’s Board of Directors
Updated Capital AllocationIntroducing our new
cash return program

23

Non-GAAP Reconciliation – Adjusted Free Cash Flow24
Amounts in millions 2011 2012 2013 2014 2015 2016 2017 2018 2019 2020
Net Cash Provided By Operating Activities
$2,482 $2,115 $1,811 $5,698 $5,209 $3,169 $8,153 $17,400 $13,189 $8,306
Investments In Capital Expenditures, Net
Expenditures For Property, Plant, And Equipment, Net
(2,423) (1,804) (1,414) (3,064) (3,985) (5,780) (4,641) (8,671) (9,634) (8,184)
Payments On Equipment Purchase Contracts
(322) - (16) (30) (95) (46) (519) (206) (75) (63)
Amounts Funded By Partners 14 203 16 108 220 75 13 895 754 272
Other Free Cash Flows - - - - - - 361 - - 30
Adjusted Free Cash Flow $(249) $514 $397 $2,712 $1,349 $(2,582) $3,367 $9,418 $4,234 $361
Adjusted Free Cash Flow –4-year Average
$844 $1,243 $469 $1,212 $2,888 $3,609 $4,345

Non-GAAP Reconciliation – Tangible Book Value25
Amounts in Billions 2011 2012 2013 2014 2015 2016 2017 2018 2019 2020
Equity $9.9 $8.4 $10.0 $11.6 $13.2 $12.9 $19.5 $33.2 $36.8 $39.0
Less:
Intangible Assets 0.40 0.40 0.40 0.50 0.40 0.50 0.40 0.30 0.30 0.30
Goodwill - - - - - 0.10 1.20 1.20 1.20 1.20
Tangible Book Value $9.5 $8.0 $9.6 $11.1 $12.8 $12.4 $17.9 $31.6 $35.2 $37.4
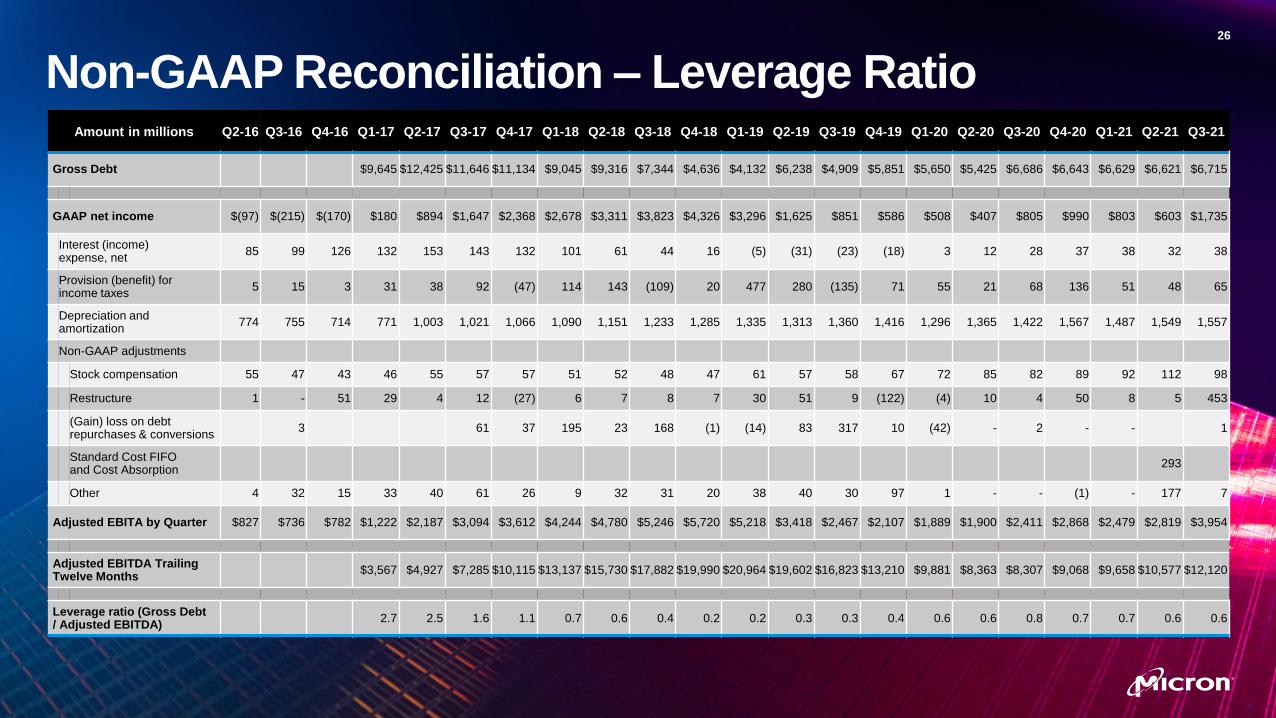
Non-GAAP Reconciliation – Leverage Ratio26
Amount in millions Q2-16 Q3-16 Q4-16 Q1-17 Q2-17 Q3-17 Q4-17 Q1-18 Q2-18 Q3-18 Q4-18 Q1-19 Q2-19 Q3-19 Q4-19 Q1-20 Q2-20 Q3-20 Q4-20 Q1-21 Q2-21 Q3-21
Gross Debt $9,645 $12,425 $11,646 $11,134 $9,045 $9,316 $7,344 $4,636 $4,132 $6,238 $4,909 $5,851 $5,650 $5,425 $6,686 $6,643 $6,629 $6,621 $6,715
GAAP net income $(97) $(215) $(170) $180 $894 $1,647 $2,368 $2,678 $3,311 $3,823 $4,326 $3,296 $1,625 $851 $586 $508 $407 $805 $990 $803 $603 $1,735
Interest (income) expense, net
85 99 126 132 153 143 132 101 61 44 16 (5) (31) (23) (18) 3 12 28 37 38 32 38
Provision (benefit) for income taxes
5 15 3 31 38 92 (47) 114 143 (109) 20 477 280 (135) 71 55 21 68 136 51 48 65
Depreciation and amortization
774 755 714 771 1,003 1,021 1,066 1,090 1,151 1,233 1,285 1,335 1,313 1,360 1,416 1,296 1,365 1,422 1,567 1,487 1,549 1,557
Non-GAAP adjustments
Stock compensation 55 47 43 46 55 57 57 51 52 48 47 61 57 58 67 72 85 82 89 92 112 98
Restructure 1 - 51 29 4 12 (27) 6 7 8 7 30 51 9 (122) (4) 10 4 50 8 5 453
(Gain) loss on debt repurchases & conversions
3 61 37 195 23 168 (1) (14) 83 317 10 (42) - 2 - - 1
Standard Cost FIFO and Cost Absorption
293
Other 4 32 15 33 40 61 26 9 32 31 20 38 40 30 97 1 - - (1) - 177 7
Adjusted EBITA by Quarter $827 $736 $782 $1,222 $2,187 $3,094 $3,612 $4,244 $4,780 $5,246 $5,720 $5,218 $3,418 $2,467 $2,107 $1,889 $1,900 $2,411 $2,868 $2,479 $2,819 $3,954
Adjusted EBITDA Trailing Twelve Months
$3,567 $4,927 $7,285 $10,115 $13,137 $15,730 $17,882 $19,990 $20,964 $19,602 $16,823 $13,210 $9,881 $8,363 $8,307 $9,068 $9,658 $10,577 $12,120
Leverage ratio (Gross Debt / Adjusted EBITDA)
2.7 2.5 1.6 1.1 0.7 0.6 0.4 0.2 0.2 0.3 0.3 0.4 0.6 0.6 0.8 0.7 0.7 0.6 0.6
Related Documents