CAPITAL ADEQUACY FRAMEWORK, FUNDS ALLOCATION STRATEGY AND FINANCIAL PERFORMANCE OF DEPOSIT TAKING SACCOS IN KENYA JOHN CHERUIYOT NG’ENO A THESIS SUBMITTED TO THE SCHOOL OF BUSINESS AND ECONOMICS IN PARTIAL FULFILLMENT OF THE REQUIREMENTS FOR THE AWARD OF THE DEGREE OF DOCTOR OF PHILOSOPHY OF KENYA METHODIST UNIVERSITY SEPTEMBER, 2019

Welcome message from author
This document is posted to help you gain knowledge. Please leave a comment to let me know what you think about it! Share it to your friends and learn new things together.
Transcript

CAPITAL ADEQUACY FRAMEWORK, FUNDS ALLOCATION
STRATEGY AND FINANCIAL PERFORMANCE OF DEPOSIT TAKING
SACCOS IN KENYA
JOHN CHERUIYOT NG’ENO
A THESIS SUBMITTED TO THE SCHOOL OF BUSINESS AND
ECONOMICS IN PARTIAL FULFILLMENT OF THE REQUIREMENTS
FOR THE AWARD OF THE DEGREE OF DOCTOR OF PHILOSOPHY OF
KENYA METHODIST UNIVERSITY
SEPTEMBER, 2019

ii
DECLARATION
I declare that this thesis is my original work and has not been presented in any other
university.
Signed................................... Date..................................
John Cheruiyot Ng‘eno
Bus-4-1761-1/2014
We confirm that the work reported in this thesis was carried out by the candidate
under our supervision.
Signature ...............................Date...............................
Prof. George K. Kingoriah
School of Business and Economics
Kenya Methodist University
Signature………………………Date………………………
Prof. Thomas Senaji
School of Business and Economics
Kenya Methodist University

iii
COPYRIGHT
© Copyright by John Cheruiyot Ngeno 2019
All rights reserved. No part of this thesis may be reproduced, stored in a retrieval
system, or transmitted in any form or by any means, electronic, mechanical,
photocopying, recording and/or otherwise without the prior written permission of the
author.

iv
DEDICATION
This thesis is dedicated to my entire family for their support and understanding
during the period of my PhD studies.
v
ACKNOWLEDGEMENTS
I would like to express my appreciation to Prof. George Kingoriah, who has
supported me throughout my thesis with his patience and knowledge while allowing
me the space to work in my own way. His constant encouragement contributed to
completion of my thesis on time. Dr.Thomas Senaji deserves special thanks as my
thesis coordinator and advisor for his guidance and suggestions. I am forever
grateful.
I wish to thank the respondents from all deposit taking saccos for their responses.
Their contributions created an informative and knowledgeable thesis. In addition, a
thank you Charles Koech, who took me through SPSS package.
Finally I would like say a special thanks to each the cooperative staffs from the
counties where I conducted my research. This research would not have been
successful without your input.
vi
ABSTRACT
This study was aimed at establishing the relationship between capital adequacy
framework and financial performance of deposit taking savings and credit
cooperatives societies in Kenya. There is a declining trend of deposit taking
SACCOs in Kenya. In 2016,164 SACCOs were licensed to operate as deposit taking
SACCOs in Kenya. The study intention was to conduct a census survey but the
responses were less. Only 111 deposit taking societies responded. The government
had introduced various legislations attempting to streamline the operations of
cooperative entity. Sustainability of cooperative movement depends on various
factors one of which being capital adequacy. In this study the influence of six
dimensions of capital adequacy framework namely: internal financing, external
financing, portfolio selection, credit management, risk management and managerial
capability was examined. A descriptive survey was conducted using questionnaires
to collect data from the respondents. Pilot survey was conducted on 12 deposit
taking SACCOs to ensure that questionnaire serve the intended purpose. Data
analysis was carried out using both descriptive and inferential statistics with the aid
of statistical package for social sciences (SPSS 23). Correlation and regression
analysis were used to establish the relationship between research variables. It was
found that internal financing, credit management; portfolio selection, risk
management and managerial capability had positive effect on financial performance
of deposit taking SACCOs in Kenya. This means that as the five variables increase
then financial performance will be increase. External financing had negatively
influenced on the financial performance. With prudent external financing, deposit
taking SACCOs will attain favourable outcome. Funds allocation was found to have
a significant moderating influence on the relationship between capital adequacy
framework and financial performance. Hypotheses were tested at 5 percent
significance level. The null hypotheses were rejected and it was established that
capital adequacy framework and moderating variables influenced significantly
financial performance. It is recommended that focus on capital adequacy framework
will enhance financial performance of deposit taking SACCOs in Kenya.

vii
TABLE OF CONTENTS
DECLARATION ........................................................................................................ ii
COPYRIGHT ............................................................................................................. iii
DEDICATION ........................................................................................................... iv
ACKNOWLEDGEMENTS ........................................................................................ v
ABSTRACT ............................................................................................................... vi
LIST OF TABLES ...................................................................................................... x
LIST OF FIGURES .................................................................................................. xiii
LIST OF ABBREVIATIONS AND ACRONYMS ................................................. xiv
ABSTRACT .............................................................................................................. xv
CHAPTER ONE ......................................................................................................... 1
INTRODUCTION ....................................................................................................... 1
1.1 Background of the Study ....................................................................................... 1
1.2 Statement of the Problem .................................................................................... 12
1.3 Purpose of the Study ........................................................................................... 14
1.4 Research Objectives of the Study ........................................................................ 15
1.5 Research Hypotheses ........................................................................................... 16
1.6 Justification of the Study ..................................................................................... 16
1.7 Limitations of the Study ...................................................................................... 17
1.8 Delimitation of the Study .................................................................................... 18
1.9 Significance of the Study .................................................................................... 18
1.10 Assumptions of the Study ................................................................................. 20
1.11 Scope of the Study ............................................................................................. 20
1.12 Operational Definition of Terms ....................................................................... 22
CHAPTER TWO ....................................................................................................... 24
LITERATURE REVIEW .......................................................................................... 24
2.1 Introduction ......................................................................................................... 24
2.2 Theoretical Framework ....................................................................................... 24
2.3 Empirical Review of Literature ........................................................................... 35
2.4 Conceptual Framework ....................................................................................... 37
2.5 Research Gap ....................................................................................................... 73

viii
2.6 Summary ............................................................................................................. 74
CHAPTER THREE ................................................................................................... 77
RESEARCH METHODOLOGY .............................................................................. 77
3.1 Introduction ......................................................................................................... 77
3.2 Research Philosophy ........................................................................................... 77
3.3 Research Design .................................................................................................. 78
3.4 Target Population ................................................................................................ 80
3.5 Sampling Frame .................................................................................................. 81
3.6 Sample Size and Sampling Technique ................................................................ 81
3.7 Data Collection Instruments ................................................................................ 83
3.8 Pilot Test Study ................................................................................................... 84
3.9 Measurement of Variables................................................................................... 85
3.10 Methods of Data Analysis. ................................................................................ 87
3.11 Validity and Reliability Instruments ................................................................. 94
3.12 Ethical Consideration ........................................................................................ 98
CHAPTER FOUR ..................................................................................................... 99
RESULTS AND DISCUSSIONS ............................................................................. 99
4.1 Introduction ......................................................................................................... 99
4.2 General information ............................................................................................ 99
4.3 Extent of Capital Adequacy Framework Implementation, Funds Allocation and
Finance Performance ............................................................................................... 100
4.4 Capital Adequacy Framework Variables .......................................................... 109
4.5 Relationship between Capital Adequacy Framework and Financial Performance
................................................................................................................................. 119
4.6 Test of Hypotheses on influence of Capital Adequacy Framework on Financial
Performance ............................................................................................................ 126
4.7 Moderated Effect of Capital Adequacy Framework and Financial Performance
................................................................................................................................. 163
4.8 Financial Performance of Deposit Taking-Sacco Societies .............................. 172
4.9 Discussion of Findings ...................................................................................... 184
CHAPTER FIVE ..................................................................................................... 186
SUMMARY, CONCLUSION AND RECOMMENDATIONS ............................. 186
ix
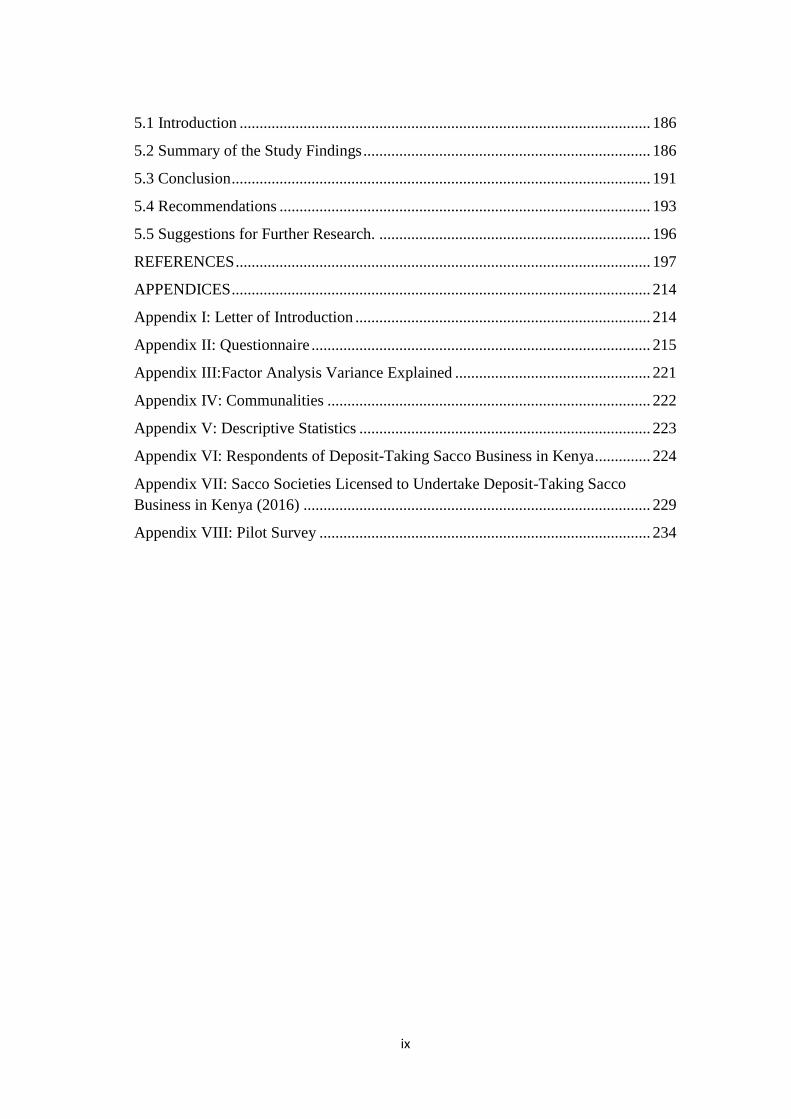
5.1 Introduction ....................................................................................................... 186
5.2 Summary of the Study Findings ........................................................................ 186
5.3 Conclusion ......................................................................................................... 191
5.4 Recommendations ............................................................................................. 193
5.5 Suggestions for Further Research. .................................................................... 196
REFERENCES ........................................................................................................ 197
APPENDICES ......................................................................................................... 214
Appendix I: Letter of Introduction .......................................................................... 214
Appendix II: Questionnaire ..................................................................................... 215
Appendix III:Factor Analysis Variance Explained ................................................. 221
Appendix IV: Communalities ................................................................................. 222
Appendix V: Descriptive Statistics ......................................................................... 223
Appendix VI: Respondents of Deposit-Taking Sacco Business in Kenya .............. 224
Appendix VII: Sacco Societies Licensed to Undertake Deposit-Taking Sacco
Business in Kenya (2016) ....................................................................................... 229
Appendix VIII: Pilot Survey ................................................................................... 234
x
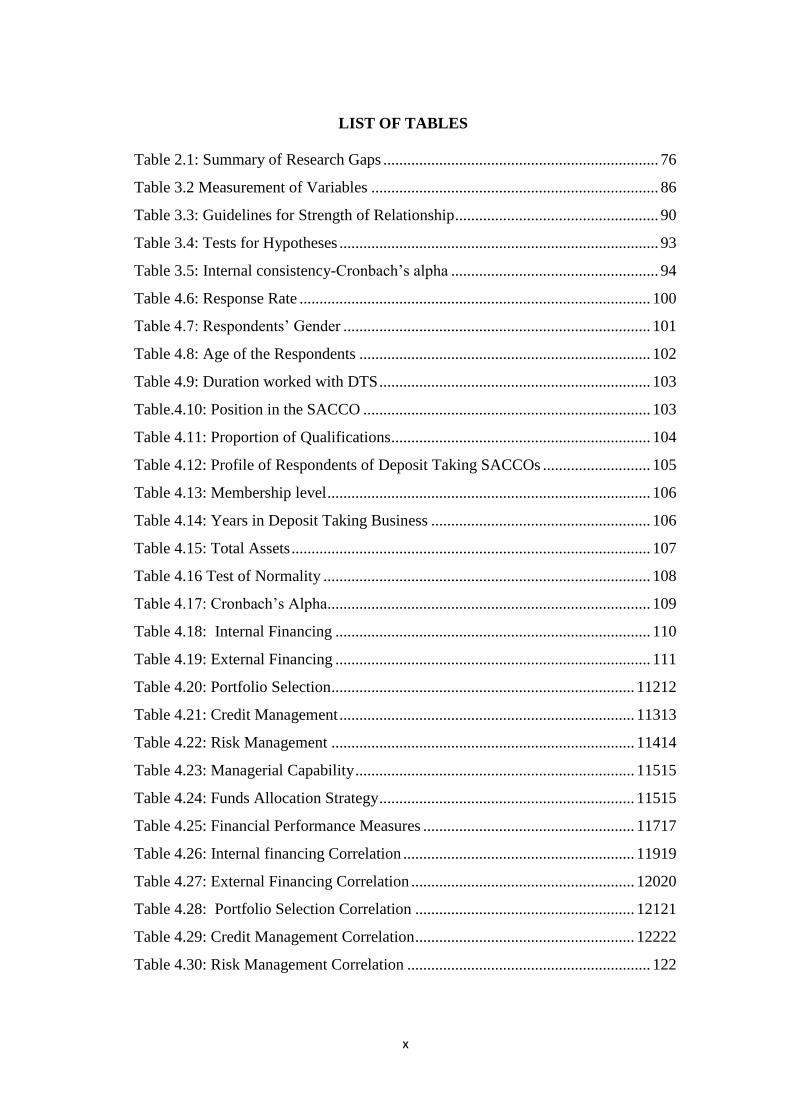
LIST OF TABLES
Table 2.1: Summary of Research Gaps ..................................................................... 76
Table 3.2 Measurement of Variables ........................................................................ 86
Table 3.3: Guidelines for Strength of Relationship ................................................... 90
Table 3.4: Tests for Hypotheses ................................................................................ 93
Table 3.5: Internal consistency-Cronbach‘s alpha .................................................... 94
Table 4.6: Response Rate ........................................................................................ 100
Table 4.7: Respondents‘ Gender ............................................................................. 101
Table 4.8: Age of the Respondents ......................................................................... 102
Table 4.9: Duration worked with DTS .................................................................... 103
Table.4.10: Position in the SACCO ........................................................................ 103
Table 4.11: Proportion of Qualifications ................................................................. 104
Table 4.12: Profile of Respondents of Deposit Taking SACCOs ........................... 105
Table 4.13: Membership level ................................................................................. 106
Table 4.14: Years in Deposit Taking Business ....................................................... 106
Table 4.15: Total Assets .......................................................................................... 107
Table 4.16 Test of Normality .................................................................................. 108
Table 4.17: Cronbach‘s Alpha................................................................................. 109
Table 4.18: Internal Financing ............................................................................... 110
Table 4.19: External Financing ............................................................................... 111
Table 4.20: Portfolio Selection ............................................................................ 11212
Table 4.21: Credit Management .......................................................................... 11313
Table 4.22: Risk Management ............................................................................ 11414
Table 4.23: Managerial Capability ...................................................................... 11515
Table 4.24: Funds Allocation Strategy ................................................................ 11515
Table 4.25: Financial Performance Measures ..................................................... 11717
Table 4.26: Internal financing Correlation .......................................................... 11919
Table 4.27: External Financing Correlation ........................................................ 12020
Table 4.28: Portfolio Selection Correlation ....................................................... 12121
Table 4.29: Credit Management Correlation ....................................................... 12222
Table 4.30: Risk Management Correlation ............................................................. 122
xi
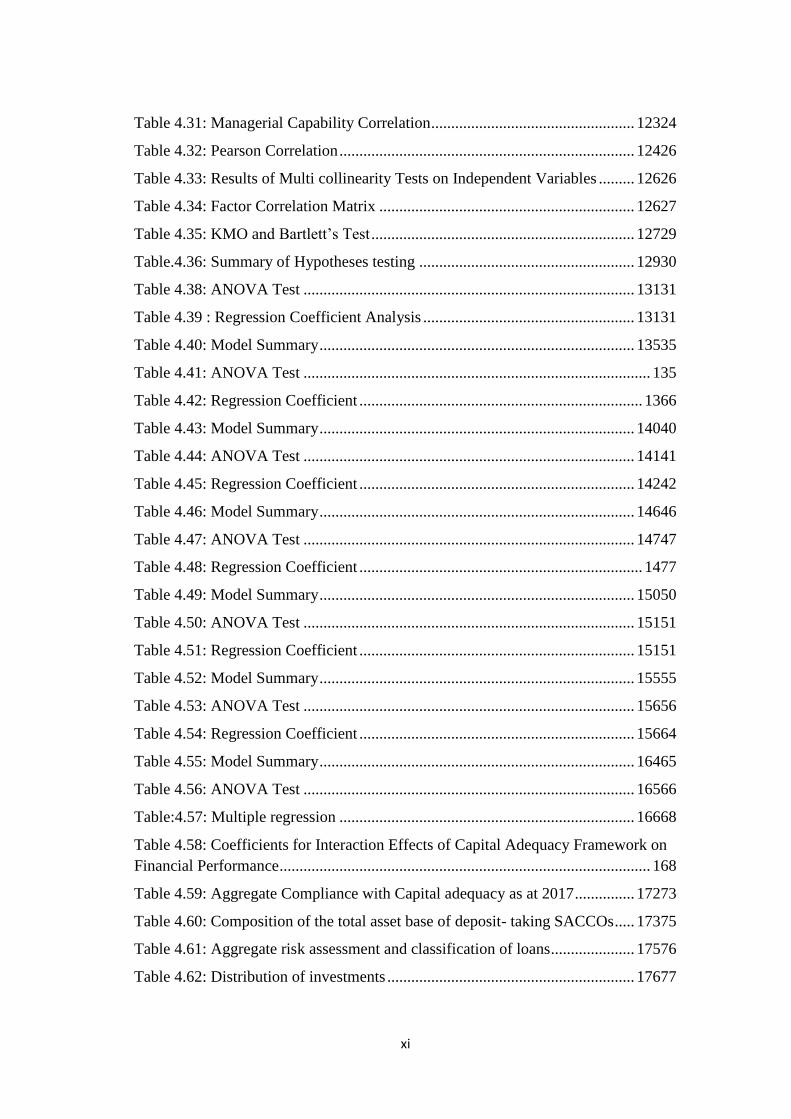
Table 4.31: Managerial Capability Correlation ................................................... 12324
Table 4.32: Pearson Correlation .......................................................................... 12426
Table 4.33: Results of Multi collinearity Tests on Independent Variables ......... 12626
Table 4.34: Factor Correlation Matrix ................................................................ 12627
Table 4.35: KMO and Bartlett‘s Test .................................................................. 12729
Table.4.36: Summary of Hypotheses testing ...................................................... 12930
Table 4.38: ANOVA Test ................................................................................... 13131
Table 4.39 : Regression Coefficient Analysis ..................................................... 13131
Table 4.40: Model Summary ............................................................................... 13535
Table 4.41: ANOVA Test ....................................................................................... 135
Table 4.42: Regression Coefficient ....................................................................... 1366
Table 4.43: Model Summary ............................................................................... 14040
Table 4.44: ANOVA Test ................................................................................... 14141
Table 4.45: Regression Coefficient ..................................................................... 14242
Table 4.46: Model Summary ............................................................................... 14646
Table 4.47: ANOVA Test ................................................................................... 14747
Table 4.48: Regression Coefficient ....................................................................... 1477
Table 4.49: Model Summary ............................................................................... 15050
Table 4.50: ANOVA Test ................................................................................... 15151
Table 4.51: Regression Coefficient ..................................................................... 15151
Table 4.52: Model Summary ............................................................................... 15555
Table 4.53: ANOVA Test ................................................................................... 15656
Table 4.54: Regression Coefficient ..................................................................... 15664
Table 4.55: Model Summary ............................................................................... 16465
Table 4.56: ANOVA Test ................................................................................... 16566
Table:4.57: Multiple regression .......................................................................... 16668
Table 4.58: Coefficients for Interaction Effects of Capital Adequacy Framework on
Financial Performance ............................................................................................. 168
Table 4.59: Aggregate Compliance with Capital adequacy as at 2017 ............... 17273
Table 4.60: Composition of the total asset base of deposit- taking SACCOs ..... 17375
Table 4.61: Aggregate risk assessment and classification of loans ..................... 17576
Table 4.62: Distribution of investments .............................................................. 17677

xii
Table 4.63: Aggregate Statement of Comprehensive Income as at Dec.2017 .... 17778
Table 4.64 : Comparative aggregate liquidity levels of DT-SACCOs ................ 17879
Table 4.65: Distribution of compliance with liquidity ratio ................................ 17980
Table 4.66: Composition of Property, Equipment and Other Assets Portfolio ... 18080
Table 4.67: Trends in external borrowing ratio ................................................... 18081
Table 4.68: Level of compliance with external borrowing ................................... 1812
Table 4.70: Highest academic qualifications attained by CEOs of SACCOs .... 18283
Table.5.1: Summary of findings .............................................................................. 191
xiii
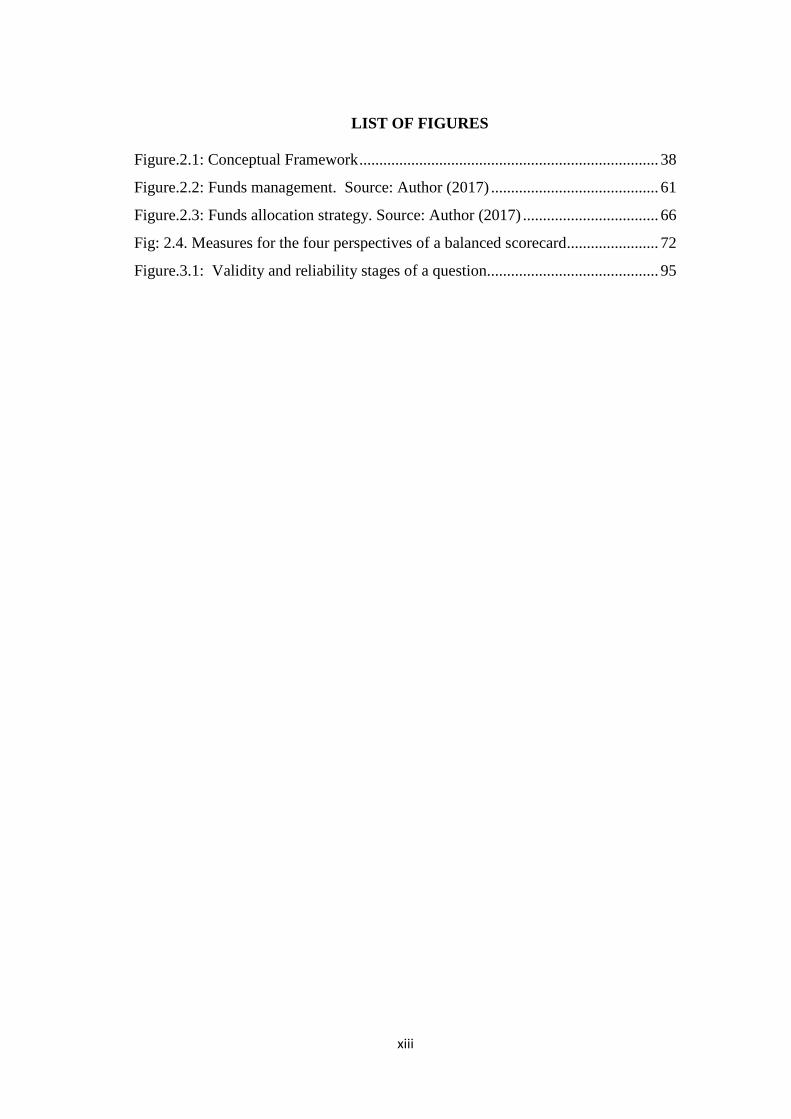
LIST OF FIGURES
Figure.2.1: Conceptual Framework ........................................................................... 38
Figure.2.2: Funds management. Source: Author (2017) .......................................... 61
Figure.2.3: Funds allocation strategy. Source: Author (2017) .................................. 66
Fig: 2.4. Measures for the four perspectives of a balanced scorecard....................... 72
Figure.3.1: Validity and reliability stages of a question........................................... 95
xiv
LIST OF ABBREVIATIONS AND ACRONYMS
ACCOSSCA African Confederation of Cooperative Society Savings and
Credit Association
ATM Automated Teller Machine
BOSA Back Office Service Activity
CEO Chief Executive Officer
DTSs Deposit Taking Saccos
FAS Funds Allocation Strategy
FOSA Front Office Service Activity
HRM Human Resource Manager
ICA International Cooperative Alliance
KUSCCO Kenya Union of Savings and Credit Cooperative
PEARLS Protection Effective financial structure, Quality, Rates of
return and cost, Liquidity and signs of growth
SACCO Savings and Credit Cooperative Societies
SASRA Sacco Societies Regulatory Authority
WOCCU World Council of Credit Unions

xv
ABSTRACT
This study was aimed at establishing the relationship between capital adequacy
framework and financial performance of deposit taking savings and credit
cooperatives societies in Kenya. There is a declining trend of deposit taking
SACCOs in Kenya. In 2016,164 SACCOs were licensed to operate as deposit taking
SACCOs in Kenya. The study intention was to conduct a census survey but the
responses were less. Only 111 deposit taking societies responded. The government
had introduced various legislations attempting to streamline the operations of
cooperative entity. Sustainability of cooperative movement depends on various
factors one of which being capital adequacy. In this study the influence of six
dimensions of capital adequacy framework namely: internal financing, external
financing, portfolio selection, credit management, risk management and managerial
capability was examined. A descriptive survey was conducted using questionnaires
to collect data from the respondents. Pilot survey was conducted on 12 deposit
taking SACCOs to ensure that questionnaire serve the intended purpose. Data
analysis was carried out using both descriptive and inferential statistics with the aid
of statistical package for social sciences (SPSS 23). Correlation and regression
analysis were used to establish the relationship between research variables. It was
found that internal financing, credit management; portfolio selection, risk
management and managerial capability had positive effect on financial performance
of deposit taking SACCOs in Kenya. This means that as the five variables increase
then financial performance will be increase. External financing had negatively
influenced on the financial performance. With prudent external financing, deposit
taking SACCOs will attain favourable outcome. Funds allocation was found to have
a significant moderating influence on the relationship between capital adequacy
framework and financial performance. Hypotheses were tested at 5 percent
significance level. The null hypotheses were rejected and it was established that
capital adequacy framework and moderating variables influenced significantly
financial performance. It is recommended that focus on capital adequacy framework
will enhance financial performance of deposit taking SACCOs in Kenya.

1
CHAPTER ONE
INTRODUCTION
This study focused on the influence of capital adequacy framework and funds
allocation strategy and their influence on financial performance of deposit taking
SACCOs in Kenya. Chapter one provides the historical background of the
cooperative movement, especially savings and credit cooperative society. It also
included the problem statement, research objectives, hypotheses, scope and
significance of the study.
1.1 Background of the Study
Cooperative enterprise started in 15th
century. The Roche dale Society of equitable
pioneers in 1844 introduced the modern cooperative movement. According to global
cooperative movement report 2007, it has employed 100 million people in the world.
The top 300 largest cooperative enterprises had turnover of up to US$ 963 billion
(Mazzarol, 2014).
A co-operative entity is a unique form of business model which has different
features from private investment firm. There are seven principles that guide it. The
International Cooperative Alliance (ICA) formulated these principles that should
guide the formation, organisation and activities of a cooperative entity. These
principles include voluntary and open membership, democratic member control,
member economic participation, autonomy and independence, education, training
and information, cooperation among cooperatives and concern for community.

2
Cooperatives also embrace the values of self-help, honesty, openness, self-
responsibility, social responsibility, transparency and accountability (International
cooperative Alliance [ICA], 2015). These values are the building blocks of strong
cooperative enterprise, without which cooperative enterprises may not achieve their
intended objectives. The major aim of these principles is to benefit cooperative
members through patronage. They get services at a subsidise price. The wider
community cannot benefit from any society as a charity, political, or religious causes
it involves cost. However, other businesses benefit from co-operative enterprise at a
cost. For instance, when an entity invests in a petrol station business it will value all
consumers at the prevailing market prices.
The first financial type of cooperative movement started in Germany between 1850s
and 1860s. The link of this kind of movement with communism made a difference to
spread the agreeable development all through the nineteenth century in Britain and
at that point over Europe, and somewhere else within the twentieth Century. It was
introduced to cater for low- income employees in the urban and the poor farmers in
the rural areas. A mid agricultural depression within the 1860s in Germany, a social
reformer Friedrich Raiffeisen found out that nourishment crisis was caused by other
factors (Mazzarol, 2014). He helped hungry agriculturists and their families during
crisis. He afterward figured it out that the issue was not nourishment but the
agriculturists required credit to assist them in modernising their generation strategies
and to transport their produce to markets. Creation of rural credit unions helped
break the grip of loan sharks who were exploiting poor farmers. Farmers were not
getting any benefit from their farming activities. As a result of credit unions, many
farmers modernised their farm operations, resulting in financial gain.
3
Friedrich Raiffeisen created a modern savings and credit cooperative. It spread all
over Europe. The advancement of supplies was enhanced. The cooperative
movement gathered momentum. It made a difference and created the present day
farmers‘ economy. During same period, another social reformer, Schultze-Delitsch,
introduced similar sort of credit union to cater for town‘s individuals. It provided
credits to empower artisans and a few commerce men to outlive the fast monetary
changes. It also handled challenges that went with the mechanical change.
Consequently, workers‘ cooperatives in Belgium, Italy and France developed
unequivocally similar business model. Ranchers, dealers and little trade proprietors
drove the spread of cooperatives in the urban and rural areas. It flourished well in
Europe as well as in North America and Japan. Despite the fact that the roots of
the agreeable development lie in communism, the spread of farmers‘ credit union
and retail entities during the nineteenth century was caused entirely by the middle
class (Gide, 1992; Birchall 2015).
In 1955, the first credit union was introduced in Ghana to assist rural population in
poverty reduction (Ngombe & Mikwamba, 2014). It was introduced by catholic
missionaries. The community embraced the new idea which was being spread by
parish missionaries. Teachers and trade unionists started their own credit union
which spread to other communities and workplaces in the other regions of Ghana.
Most of the English-speaking nations in Africa embraced credit union among them
were Ghana, Uganda, Nigeria, Tanzania and Kenya. According to Olando, Mbewa
and Jagongo (2012), non-English speaking countries in Africa embraced credit
unions in 1960s. These countries had seen the benefits accruing from them in other
states. The introduction of Savings and Credit Cooperative Society (SACCO) in
4
Africa and its growth resulted in the formation, in 1965, of the African
Confederation of Cooperative Society Savings and Credit Association
(ACCOSSCA) intentioned to spur SACCO principles, avail insurance services and
also educate their clients on various related issues (Ngombe & Mikwamba, 2014,
Borgstrom, 2013).
In Kenya, the European settlers introduced the first co-operative society in 1908 in
Kericho County at Lumbwa in Kipkelion Sub County. It was called Lumbwa
Cooperative Society. The cooperative society promoted agricultural activities
including procuring farm inputs and selling agricultural produce. The first SACCO
commenced in 1964 in Kenya. At inception, their common bonds mostly were based
on connection with location, livelihood and places of worship. However, the
government made a decision requiring all the SACCOs to recruit on their on certain
criteria in 1969. The societies based their recruitment on a secure job or business
relationship. Consequently, societies introduced a check-off system where payments
were channelled directly to the society through employers, processors or marketing
organisations triggering emergence of several commodity-based SACCOs in the
rural areas (Birchall & Ketilson, 2009). The cooperative societies had District unions
which had Union Banking Sections that provided monetary services to the
membership and embraced Raiffeisen-type cooperative design which operated at
the provincial level with branches (Makori, Munene & Muturi, 2013).
When Kenya attained independence, cooperatives movement was recognised as an
apposite tool for economic development. According to Gardeklint (2009), the
government supported the quick development and extension of SACCO society
movement in the country and today constitutes one of the financial pillars of
5
the country within the vision 2030 plan. SACCOs promote financial inclusivity in
the country. The regions without banking facility will have one. It will enhance
saving mobilisation in the remote areas. By 2010, Kenya had more than 5000
SACCOs, registered, with an estimated membership of seven million which
collectively mobilised more than KShs. 200 billion (Republic of Kenya, 2008,
Ndungu, 2010).
In 1997, SACCOs changed their mode of operation by embracing Front Office
Service Activity (FOSA) products which resulted in products diversification from
the usual Back Office Service Activity (BOSA) products to Front Office Service
Activity (FOSA) products. The products of BOSA comprised long-term and the
short-term loans with the former meant for development-related activities and lent
for a period of 24-48 months. The latter which is given for either school fees or
emergency and attracted a 12% interest per annum on a reducing balance. Front
Office Service Activity products include fixed deposit and savings accounts, special
accounts and call deposit and have interest rates ranging from 1.5%-5% to per
month Waweru (2014) and provide other services through link-ability with banks
including cheque clearing and safe custody facilities, standing orders, salary
processing, electronic funds transfer and automated teller machines (ATMs)
(Edwards & Hulme,1995).
When the deposit taking facility was introduced, the SACCOs‘ financial services
offered are almost similar to commercial banks. It has necessitated the provision of a
specific regulatory framework for SACCOs. The introduction of deposit taking
business was commenced when government of Kenya enacted the following laws:
the SACCO Societies Act (NO.14 of 2008) and the SACCO Societies (Deposit-

6
Taking SACCO business) Regulations, 2010 both of which regulate the SACCO
sector in Kenya. This legislation also established SACCOs Society Regulatory
Authority (SASRA) whose mandate is licensing, supervising as well as monitoring
deposit taking SACCOs in Kenya (Dawson, 2013; Decker, 2004). Before the
introduction of this legislation, the Cooperative Societies Act Rule Number12 of
1997 guided the sector. It was amended in 2004. The diversification of financial
services meant that capital adequacy framework plays a crucial role in investing
available funds prudently.
Microfinance House Limited (2016) report six months as the average loan waiting
period in the SACCOs but it was more than six months because of meagre liquidity
position of the SACCOs. As a result, the societies lack adequate capital framework.
Both financial as well as non-financial capitals of SACCOs are inadequate for the
efficient and effective running of these societies. Therefore, there's require for
socially responsive and profitable SACCOs to embrace sensible funds allocation
strategies. These are fundamental to improve the money related execution of the
SACCOs (Waweru, 2014; Darrough & Stougton, 1990). Inadequate capital
frameworks trigger lost cash holding opportunities. When large sums of funds are
underutilised in any firm they do not generate any income. Members need the
financial return at the close of the accounting period and entities may not be in a
good position to meet their money related commitments as and when they fall due.
Financial capital comprises internal as well as external finance. These funds need
prudent financial management so that the immediate benefit from the investments
can be felt by members. In the case of social capital which is non-financial, it
involves strategies of managing funds well so that the profit is achievable (Evans &
7
Branch, 2008). These activities comprise the followings: working capital
management, portfolio selection, risk management, managerial capability,
governance structure, regulatory requirements and information technology. All these
are critical in accomplishing firm objectives.
1.1.1 Capital Adequacy Framework
According to Lipsey and Chrystal (2013), the capital stock consists of financial and
non-financial assets utilised during production of goods and services which assets
include workshops, machinery, equipment, infrastructure, human resource,
strategies, and finances. Since the capital is an input for production, it is a
renewable resource but subject to technical changes which may alter its
characteristics over a period of time. The financial and non-financial assets are
interrelated, as SACCOs often require capital to procure equipment and human
resource. The study focused on the capital adequacy; both financial capital and non-
financial capital for managing SACCOs in Kenya. These resources are utilised to
attain optimum financial return for the members (Croteau, 1963; Cormier, Gordon &
Magna, 2004). The capital requirements for each society should be ascertained to
enable future planning as adequate capital could avert SACCO failure, where the
society cannot meet its financial obligations to pay its membership and other
creditors. Return for a member is also influenced by the capital. The society should
comply with prescribed minimum capital requirement stipulated under statute
(Greuning & Iqbal, 2015). The SACCO Societies Act considers only financial
aspects of SACCOs in Kenya. Non-financial aspects were left out in the Act. These
also affect financial returns a great deal (Mishkin & Eakins, 2012). This study

8
carried out the survey on the relationship between capital adequacy framework on
financial performance of SACCOs in Kenya.
1.1.2 Funds Allocation Strategy
SACCOs allocate funds to various portfolios. Funds can be invested in either tactical
assets or strategic assets. According to Samuelson and Nordhaus (2004), an efficient
economy is characterized by consumers getting the most desired category goods and
services based on the resource and technologies available in the economy.
Efficiency requires the right combination of goods and services to be produced in
the economy and their allocation among consumers meet consumer standards
(Hyndman & McKillop, 2004). The SACCO Societies Act guides the SACCOs on
how to allocate their funds. Investments are not supposed to be more than 40% of
their total assets or more than 5% of total deposits. In case of non-earning assets,
investments should be less than ten percent of the total assets. Land and buildings
should not be more than five percent of the total assets.
1.1.3 Financial Performance
Financial performance is used by regulators to establish financial sustainability of an
economic entity. It facilitates identification of societies that are experiencing severe
problems so that remedial action may be taken (Hoang, 2014). Members will know
whether the investment is viable or not. Investment analysts will use the
performance data to advise prospective investors on which SACCOs to select for
lending their hard earned cash. Societies also evaluate their own performance over
time. The evaluation will determine the outcomes of previous management decisions
so that changes can be made where appropriate. Monitoring of performance
9
consistently will identify existing problems which can be addressed immediately
(Gasbarro, Lewis & Dhar, 2013). However, inconsistent monitoring will lead to
financial failure in the future (Madura, 2012).
According to Madura (2012), bank regulators inspect commercial banks at least
once establish whether the bank is complying with regulations. Its financial
condition is taken into consideration. The regulators also occasionally use
computerised monitoring systems to analyse information provided by the banks on a
quarterly basis. They use CAMELS rating system. In case of SACCOs, they use
PEARLS rating system (Gibbins, Richardson & Waterhouse, 2012).
1.1.4 Deposit Taking SACCOs in Kenya
SASRA licensed 164 SACCOs in Kenya to take deposits from their members in
2016. The number of SACCOs licensed in 2015 were 176. This include new
licensed societies and previously licensed SACCOs and indicates a declining trend
of these SACCOs in the country. SACCO Societies ACT 2008 created Deposit
taking SACCOs (DTS) are legal entities created under the SACCO Societies ACT
2008 which also created SASRA to license, monitor and supervise all licensed
SACCOs in Kenya.
SACCOs have existed in Kenya for a number of years either as deposit- taking or
non-deposit- taking SACCO. A number of deposit-taking societies were licensed in
2014. Since, then the number of Societies is in a declining trend. For example,
during 2014, 2015 and 2016, numbers of deposit- taking Societies licensed were
215,176 and 164 respectively. The declining trend needs immediate address to
forestall the emerging scenario.
10
Deposit-taking SACCOs are allowed to offer Front Office Service Activity products
whereas non-deposit taking SACCOs offer Back Office Service Activity products.
All non-deposit taking SACCOs are under the supervision of Commissioner for
Cooperatives whereas DTS are licensed, supervised, monitored and regulated by
Society Authority. SACCOs registered under the Cooperative Societies Act, Kenya
are also licensed by Society Authority. Therefore, the SACCOs can take deposits
from their membership. By December 2012 the SACCO assets were amounting to
Kenya Shillings two hundred and ninety three billion with a membership of three
million members. At the same period, the total deposits amounted to KShs 213
billion while credit to the membership stood at KShs 221 billion (Ademba, 2013,
Goddard, McKillop & Wilson, 2008).
From the above data analysis, it indicates that SACCOs loans to total asset ratio
(221/293 = 0.75) is 75% of the total assets. To increase loanable fund, the total
assets should be enhanced. Any SACCO should manage its assets and liabilities to
earn the highest benefit to its members. The SACCO management thus has to
oversee four key mandates. Firstly, manager must ensure that the SACCO has
adequate cash to pay its depositors when need arises. This happens when there is
withdrawal by depositor and demand for payment and this requires managing
liquidity, acquiring assets capable of meeting the SACCO‘s financial obligations.
The managers should then pursue a reasonable level of risky investment by for
example acquisition of assets with low default rates. Asset management can also be
employed here. Thirdly, manager concerned should procure resources at low cost
and lastly, the manager has to determine the assets the SACCO should retain and
11
then acquire the required resources. This is capital adequacy management (Mishkin
& Eakins, 2012; Gitonga, 2014).
Effective and efficient management of SACCO needs a professional manager. A bad
SACCO in the hands of good management can turn out to be a successful SACCO
while a good SACCO in the hands of poor management can become a failure.
Therefore, the management of a financial company is a very important factor which
should be considered in SACCO analysis. In fact, this is the first factor to be
considered when investors are giving out loans to SACCOs. If it turns out to be
poor, further analysis can be done to reveal that the SACCO is not worth investing
in (Lipton & Lorsh, 1992). Both in Kenya and across the world there are many
examples of credit and saving cooperative societies which have flourished because
of good management. There are also an equal number of examples of credit unions
which have been doomed because of ineffective management. Good managers must
select their portfolio wisely which as a result give good financial return to their
members (Nagarajan & Jayabal, 2012).
According to Nagarajan and Jayabal (2012), professional managers and competent
employees should be employed so that these organisations may prosper. However,
bad managers will run down good companies. There is little knowledge or research
which has been conducted on the challenges of capital adequacy framework and
funds allocation of deposit- taking SACCOs. The financial performance depends on
its operative management. This study attempted to conduct a research on the capital
adequacy framework and funds allocation practices based on financial performance
and challenges of deposit-taking SACCOs in Kenya.
12
The additional task of receiving cash from members is a challenge to deposit- taking
SACCOs. They do not have capacity to handle this daunting task. The study
established that capital adequacy framework is moderated by allocation of funds
towards financial performance of DTS in Kenya. SACCOs should map their
finances either internal or external finances with financial returns. Managerial
capability should be improved to handle the complicated task of financial
management (Lys, Naugthon & Wang, 2015).
1.2 Statement of the Problem
The Vision 2030 has laid-down programmes necessary for the achievement of the
desired goal in the development blueprint. It recognizes SACCOs as crucial player
in mobilising savings for investments in enterprises and individual development
(Mira & Kennedy, 2013; Langat, 2012). But this dream cannot be achieved if any
SACCO has inadequate capital framework, which is necessary for implementing its
strategic plan. The relevant Ministry is tasked with developing the sector through
frameworks which will facilitate the realisation of the national social-economic
aspirations of Kenya (Ademba, 2012).
The cooperative philosophy guides societies. International Co-operative Alliance
(ICA) framed seven principles which guide societies‘ operations. The introduction
of SASRA is within the purview of government reform process in the financial
sector and is established to protect members‘ interests and ensure public confidence
in the SACCO (Gwegi & Karanja, 2014). It will ultimately promote growth by
improving fund access, amalgamation of local savings and inexpensive facilities to
SACCO members (Ademba, 2013). According to Financial Sector Deepening [FSD]
13
Kenya (2013), some SACCOs are experiencing liquidity problems, and most of
these kinds seldom meet memberships‘ demands for credit and withdrawal of
savings. Institutional capital cannot meet the demands of members. As such, it needs
external financing, which is an expensive exercise. In this scenario, members are
uncertain on the prospects of the SACCOs, despite their loyalty (Gwegi & Karanja
(2014). This situation should be rectified to save the demise of SACCOs. Therefore,
there is need to understand the effect of capital adequacy framework and funds-
allocation strategy on performance.
SACCOs are faced with challenges key among them include insufficient capital
framework, inadequate legislation, low uptake of international performance
standards, absence of disclosure requirement principles, lack of development
strategies, low of adoption of new technologies, improper human resource
management and wanting resources structuring models. Unstable macro-economic
setting and rigid capital adequacy prudential requirements have worsened the
situation of societies (Ongore & Kusa, 2013). According to SACCOs Supervision
Annual Report 2013, SASRA in partnership with Financial Sector Deepening (FSD)
of Kenya conducted a study to establish core skill gaps within licensed SACCOs to
identify the core capacity and skills gaps in the sector which require immediate
attention and. came up with the following capacity areas which need immediate
address, namely; governance, human resource management, management
information system, management of risk and of credit,, marketing strategies and
development of products(Maina, 2013; Magali,2013). These gaps should be
managed efficiently and effectively for the benefit of its members.
14
Since the introduction of deposit-taking business activity, many societies were
deregistered. Most of them were not complying with the laid down regulations.
Declining trend of deposit taking SACCOs has been witnessed since its inception. In
2014, 215 deposit taking SACCOs were licensed. However, in 2016 164 deposit
taking societies were still in operation. It shows that there is a problem which needs
to be addressed immediately. The introduction of deposit-taking business was done
without taking into account capital adequacy framework which is currently facing
the societies in Kenya. The policy framework which needs a thorough review
includes the following: internal and external financing, portfolio selection, credit
management, risk management, managerial capability and funds allocation strategy.
These factors are very crucial for running of SACCOs (Mbogo, 2016).
1.3 Purpose of the Study
This study intention was to discover new insights about capital adequacy framework
moderated by funds allocation towards financial performance of deposit taking
SACCOs in Kenya. The declining trend of deposit taking SACCOs in Kenya need
immediate address (McFie, 2016). In 2014,215 deposit taking SACCOs were
licensed by the Authority. Since then the societies are becoming less in number. In
2016, the authority licensed only 164.The outcome of the survey showed that
internal financing was inadequate, over borrowing was an issue, portfolio selection
was inappropriate, credit management was not appropriately, risk management was
not in place and most of the managers were not professionally qualified. These led to
misallocation of resources (SACCO Societies Regulatory Authority [SASRA],
2016).

15
1.4 Research Objectives of the Study
The study comprised of broad objective and specific objectives.
1.4.1 General Objective
The main objective was to establish influence of capital adequacy framework on
financial performance of deposit taking SACCOs in Kenya.
1.4.2 Specific Objectives
The specific objectives were:
i. To examine the influence of internal financing on financial performance of
deposit-taking SACCOS in Kenya.
ii. To determine the influence of external financing on financial performance of
deposit-taking SACCOS in Kenya.
iii. To establish the influence of portfolio selection on financial performance of
deposit-taking SACCOS in Kenya.
iv. To examine the influence of credit management on financial performance of
deposit-taking SACCOS in Kenya.
v. To assess the influence of risk management on financial performance of deposit
-taking SACCOS in Kenya.
vi. To evaluate the influence of managerial capability on financial performance of
deposit-taking SACCOS in Kenya.
vii. To evaluate the moderating effect of funds allocation strategy and the capital
adequacy framework towards financial performance of the deposit taking
SACCOS in Kenya.

16
1.5 Research Hypotheses
In order to establish the achievement of the objectives the following hypotheses
stated in the null form were tested in the study.
HO1: Internal financing has no significant influence on financial performance of
deposit taking SACCOS in Kenya.
HO2: External financing has no significant influence on financial performance of
deposit taking SACCOS in Kenya.
HO3: Portfolio selection has no significant influence on financial performance of
deposit taking SACCOS in Kenya.
HO4: Credit management has no significant influence on financial performance of
deposit taking SACCOS in Kenya.
HO5: Risk management has no significant influence on financial performance of
deposit taking SACCOS in Kenya.
HO6: Managerial capability has no significant influence on financial performance
of deposit taking SACCOS in Kenya.
HO7: Funds allocation strategy has no moderating effect on capital adequacy
framework towards financial performance of deposit taking SACCOS in
Kenya.
1.6 Justification of the Study
Financial performance as a measure indicates the financial health of a firm. It is
supported by various factors. These factors include financial as well as non-financial
factors. Financial factors include external and internal finances. Non-financial
factors include strategies and management capability.

17
According to Drury (2012), financial performance measures are intentions to
motivate managers to pursue those goals that will best benefit the SACCO as a
whole. Financial measures do not indicate all the factors that are crucial to the
success of a SACCO. Non-financial measures should also be included in measuring
performance of the societies. The crucial areas which need to be included are:
competitiveness, product leadership, quality, customer care, innovation and
flexibility. These measures influence demand for SACCO‘s products and services.
The SACCO should develop performance measures that support the objectives and
competitive strategies of the society (Margrabe, 2014). The study was conducted to
establish the reasons behind declining of trend of deposit taking SACCOs in Kenya.
The outcome will be addressed by the relevant authority. Solutions to the prevailing
problem will facilitate improvement of societies in Kenya.
1.7 Limitations of the Study
Research study was faced by a number of challenges. First, the wide area covered
was costly and time consuming. The researcher ensured that acceptable response
rate was achieved. Second, some of the respondents were not cooperative in filling
and returning the questionnaire. However, county cooperative officers ensured that
all respondents returned questionnaire in time. This study focussed on capital
adequacy framework and funds allocation strategy towards financial performance of
deposit taking SACCOs in Kenya which are aspects of prudent financial
management.
The study finding was limited to deposit taking SACCOs in Kenya. The result may
not be generalised to cover non-deposit taking SACCOs in Kenya. The legal
framework that guides deposit taking SACCOs is significantly different.
18
1.8 Delimitation of the Study
The study was narrowed to address the capital adequacy framework and funds -
allocation strategy on performance of deposit taking SACCOs in Kenya. The
conclusion of the study can be replicated beyond the population sampled.
1.9 Significance of the Study
With the introduction of Society Authority, the mandate to license and subsequently
supervise deposit-taking SACCOs in Kenya was established. Development of
suitable supervisory framework responsive to the nature and size of deposit-taking
SACCOs was necessary. The Authority should ensure that societies are safe and
sound including with regard to financial sustainability and policies for enhancing
access to services while reducing capital adequacy framework challenges.
The study is expected to be of benefit to the management of deposit taking
SACCOs, this way; the challenges on the capital adequacy framework for SACCO
business performance in Kenya will be addressed. As a result, this study will provide
a practical solution to the prevailing problems in the deposit-taking SACCOs in
Kenya as the findings will be availing to each SACCO that participated in the
survey. The results found certain knowledge gaps in the capital adequacy framework
of DTS. These areas need re-evaluation so as to obtain sustainable business growth
and performance.
The study endeavoured to give some insight to the government and the policy
makers; especially in the areas of managerial competence, portfolio selection, risk
management and work capital management. To avoid shifting the focus of the
management on achieving the intended business performance targets, there is need
to streamline the capital adequacy framework requirement. The major objective of
19
steering the SACCOs towards prosperity should not be neglected. The study formed
a formidable base for informing practitioners and policy makers Borzaga and Galera
(2012) in establishing reasons for the current transformation of DTS in Kenya. The
study also extended past research by investigating the interrelationships of business
components on performance of firms where the influence of combination of
variables were examined rather than characteristics of single components as
recommended by (Machiraju, 2016).
The study findings will enhance the achievement of financial inclusion in the
financial system. The banking services will improve in the remote areas. Saving
mobilisation will increase in the country. Hence, the exploitation of SACCOs full
potential in national development as envisaged in the Kenya Vision 2030 will be
achieved (Kinyuira, Gatenya & Muturi, 2014). It is also possible to attain
Millennium Development Goals (2015), because providing financial services in the
rural areas will reduce poverty. It will happen if the members save and take credit to
improve their standard of living (Republic of Kenya (RoK], 1997).
To the academicians, the study has availed further contribution to the existing
knowledge of capital adequacy framework and funds allocation strategy on financial
performance of SACCOs in Kenya. It considered components for capital adequacy
framework both monetary and non- monetary items which influenced financial
return of DTS in Kenya. This will also stimulate prospective researchers to replicate
the study in other sectors of the economy.
20
1.10 Assumptions of the Study
For the purpose of this study the following assumptions were made: first, capital
adequacy framework plays a crucial role on establishing the performance of DTS in
Kenya given that all other aspects remained unchanged. Second, funds are allocated
prudently. Third, Sacco Society Regulatory Authority supervises and monitors
SACCOs effectively. Finally, the respondents were honest in their responses to the
items in questionnaires and that the information given had no reservations. To
maintain capital adequacy framework and to allocate funds prudently, rules and
regulations should be set so that SACCOs can manage their resources well.
Minimum capital requirements should be embraced by all the societies. Funds
allocation guidelines should be in place.
1.11 Scope of the Study
The study covered all counties in Kenya which are characterized by diverse
economic activities including agriculture, livestock keeping and tourism. These
resources are however not well utilised. Infrastructure within the counties is also
poor and while SACCOs in some counties were agriculture-centred, product and
service prices are unpredictable and affect the inflow of cash in such SACCOs. This
has prompted the SACCOs to pursue inroads into other areas of membership such as
recruiting motorbike (Boda-Boda) business operators together with small and
medium enterprise owners with the view of improving liquidity through
diversification.
The study involved a sample of 111 of the 164 licensed DTS in Kenya. The
independent variables were internal financing, external financing, portfolio
selection, credit management, risk management and managerial capability with
21
funds allocation strategy as a moderating variable and financial performance was
dependent variable.
The study focused on establishing influence of capital adequacy framework on
performance and specifically the influence of internal financing, external financing
portfolio selection, credit management, risk management and managerial capability
as capital adequacy framework influences performance of DTS. The funds allocation
strategy was also assessed to evaluate whether it moderates the relationship between
capital adequacy framework expectations and financial performance.
22
1.12 Operational Definition of Terms
Capital adequacy framework Capital adequacy framework comprises
strategies which will enable deposit-taking
SACCOs to utilise their financial resources
optimally (Jordan, Miller & Dolvin, 2018).
Deposit taking SACCO SACCO licensed by SASRA to take deposit
from its members (SACCO Societies Act,
2008)
External financing External financing is a scenario where SACCO
uses borrowed finances in implementing its
projects (Brealey, Myers & Marcus, 2017).
Financial performance Financial performance is financial health of a
SACCO at a given period which is measured
by PEARLS system (International Cooperative
Alliance [ICA], 2004).
Fund allocation Fund allocation is how financial resources are
shared among various uses to which they
might be put with expectation of higher
financial gains (Hiriyappa, 2015).
Internal financing Internal financing is a scenario where a
SACCO uses its own finances to implement its
projects (Hampton, 2013).
23
Managerial capability Managerial capability is the ability of a
SACCO to manage its resources effectively
(Chandan, 2016).
Portfolio selection Portfolio is a combination of investments
which SACCO has to select them appropriately
(Chandra, 2015).
Risk management Risk management is minimising adverse
outcomes by ensuring that strategies are in
place to avoid such eventualities but not to
eliminate risk (Bessis, 2012).
24
CHAPTER TWO
LITERATURE REVIEW
2.1 Introduction
This segment outlines an overview of capital adequacy framework, funds allocation
strategy and financial performance. A review of the study of prudent financial
management practices relating to SACCOs. This chapter deals with the theories
relating to the independent, moderating and dependent variables of the research. The
section reviewed the literature related to the area of study and the knowledge gap. It
included research studies carried out previously.
Current literatures that are important to management of credit cooperative societies‘
finances in Kenya and their synthesis have been analysed and synthesised. The
literature in this chapter enabled the identification of research gaps that necessitated
the study and areas of further research.
2.2 Theoretical Framework
The theoretical framework explains a given phenomenon. It gives a researcher a
bird‘s view of a certain phenomenon. Capital asset is any asset such as equipment or
lands that a company owns and uses in doing its business. Capital adequacy
framework denotes financial as well as non-financial (Social) assets which enable a
firm to achieve its goals. The firm‘s goals are to improve business performance. The
financial capital comprises of shares, savings/deposits, institutional capital and debt
capital, whereas non-financial (social) capital comprises human resource as well as
strategies or policies which firm uses to utilise financial capital to achieve its

25
business performance. Non-financial (social) capital drives financial capital to attain
good financial performance. Non-financial capital is a necessity to utilise scarce
resources effectively and efficiently in a changing environment.
There are a few theories that attempt to elucidate the importance of capital adequacy
framework of business firms. They are capital structure theory which includes:
trade-off theory, pecking order theory, Agency theory and modern portfolio theory
(Naituli, 2011).
2.2.1 Capital Structure Theory
Bhalla (2014) says even a casual review of the literature brings one quickly to the
key question of whether the way in which investment proposals are financed matters
and if it does matter, what is capital structure? Capital structure is the combination
of debt and equity that attains the stated managerial goals, in this case, the
maximisation of the SACCO‘s market values. In other words, the optimal capital
structure is that combination of equity and debt that minimises the SACCO‘s capital
cost. Hence, the existence of an optimal capital structure also implies the
simultaneous optimisation of two important variables namely; cost of capital and
market value (Brealey, Myers & Marcus, 2017).
However, the existence of an optimal capital structure, which leads to maximum
market valuation and minimum capital cost, is not accepted unequivocally. As in
many other controversial issues, there are two extreme views and the inevitable
intermediate version. To wit on the one hand of the spectrum, there is the traditional
view that argues consistently and convincingly that there exists optimal structure of
capital defined by an array of values acceptable to the capital markets. On the other
hand, there is the view of Modigliani and Miller (1958) who also argue consistently
26
and convincingly that under certain acceptable assumptions there can be no leverage
effect on the market value of the firm; hence there is no optimal capital structure as
such. Between these two extremes, there is the intermediate view of the net-
operating –income approach that argues that changes in the capital structure do not
change the overall risk content of the firm; rather, they redistribute the risk among
the claim holders. Hence there is no leverage effect in this sense. However, there
exists optimal structure of capital and its effects, which is derived from the tax
treatment of debt and market imperfections (Jordan et al., 2018). These frictional
elements can lead to higher market values and lower cost of capital for given levels
of risk when the SACCO‘s management employs a judicious combination of
financial claims. All three views are internally consistent, given that all factors are
kept constant.
Bhalla (2014) assumes that entities can choose between a safe technology with a
certain additional cost and uncertain cost of risky technology with an incentive to
finance the latter with debt as the risky technology initially has greater expected
profits and risk than the safe technology.
2.2.2 A Pecking Order Theory: Managerial Preference Effects
Bhalla (2014) and Myers (1984) posit that a particular target capital structure may
not be in existence. Myers (1984) pecking order theory suggests that entities prefer
internal financing. He further opined that managers adjust dividend pay-outs to
arrest the need for external equity shares whilst circumventing major alterations in
the amount of dividend. Where external finances are required, he submitted that the
safest securities be issued first; debt tending to be the primary security issued and
outside value the security of final resort (El-Dereny & Rashwan, 2014). The
27
inclination for inner funding is based on desire to dodge the debt and checking what
happens when modern securities are sold freely. In addition, Myers argued that the
pecking order of financing may reflect the relative issue costs for various security
types. The pecking order theory explains in part why profitable entities tend to have
low ratios of debt, because they have adequate cash flows to re-invest in new
venture. In case of SACCOs, they should embrace more debt because they have a
low stream of cash flow in their operations.
2.2.3 Modern Portfolio Theory
Harry Markowitz is considered the father of Modern Portfolio Theory (MPT) and
introduced the principles that underpin the theory. These principles have been
widely adopted by the financial community with the consequence of its very broad
legacy today (French, 2013).
The MPT primarily influence management by providing a framework for the
systematic selection of portfolios premised on expected return and risk principles.
Before introduction of MPT, investors handled loosely the notions of risk and return.
Investors had the knowledge that it is strategic to diversify, and Markowitz is
credited with formally developing the concept of portfolio diversification where he
quantitatively computed why and how diversification of portfolio works to minimise
the risk of a portfolio to an investor when individual risks are correlated. To achieve
this, he sought to answer the question; is the risk of a given portfolio equal to the
summation of the individual securities surrounding it? It stated that the
interrelationships among security returns must be accounted for in order to compute
portfolio risk and minimise portfolio risk to its minimum for any given level of
return. In conclusion, SACCO should use Markowitz portfolio selection principle in
28
selecting portfolios. Portfolios with less risk and high return should be selected by
the society (Chandra, 2015). From the findings, it showed that portfolio selection
(9.7%) influence financial performance of deposit taking SACCOs in Kenya.
2.2.4 Agency Theory
Brigham and Houston (2011) opine that managers may have personal goals that may
interfere with stockholders‘ maximisation of wealth and yet they are empowered by
the shareholders of the entities; –the membership- to make decisions that may create
a potential conflict of interest known as Agency Theory.
Pandey (2015) asserts that there is a crucial relationship between shareholders and
managers which may create firm value. While managers should in theory act in the
best interest of shareholders and promote value creation, in practice, managers may
pursue their own personal goals. Managers may maximise their own wealth through
high remunerations at the expense of the membership, or opt to play safe by creating
acceptable wealth for membership but not the maximum (Chavez, 2015). They may
opt for costly investment instead electing to finance risks otherwise needed to
maximise shareholders wealth ultimately frustrating the objective of the
shareholders wealth maximisation as a general intent of firm. It is still in the
managers‘ interest that entities survive in the long run. Managers also value
independence and freedom from external interference making their actions likely to
be motivated by survival and self-sufficiency. Further, SACCOs are complex
organisations consisting of multiple stakeholders.
Shareholders continuously monitor their society to prevent managers from
benefitting from the society at the expense of the members. Employees, creditors,
customers and government also keep an eye on managers‘ activities thereby

29
minimizing the likelihood of managers exclusively pursuing their own personal
objectives (Brigham & Houston, 2011). Their survival is thus hinged on
achievement of targets and their success is based on their management of the
societies they lead in comparison with managers leading other societies even though
the performance of each management will depend on the fulfilment of the specific
objectives of the entity.
The conflict between shareholders‘ interests and those of management is known as
agency problem and occasions agency costs which include adverse deviation of
share value for the stockholders and costs they incur to monitor the managers and
control their behaviour. The agency problem vanishes when managers own the
society (Connelly, Certo, Ireland & Reutzel, 2013). Thus availing participative
rights to these managers for example through stock options could mitigate this
problem of agency (Gitman, 2011). Stockholders can compensate managers well by
offering them incentives in order to advance the stockholders‘ interests. The agency
problem can be minimised by close monitoring of managers by other stakeholders.
2.2.5 Risk Theory
Gallati (2013) defined risk as a situation where an exposure to adversity exists or
one in which a possibility of deviation from an expected desired outcome exists. The
society is no exception as it encounters a number of risks in its daily operation. The
society‘s liquidity position is overseen to satisfy the request of contributors and
borrowers‘ needs by converting resources into cash or borrowing reserves on
demand with negligible misfortune. Liquidity administration is the method of
creating stores to meet legally binding or relationship commitments at sensible costs
at all times (Mudibo, 2014). The legally binding commitments that must be met
30
incorporate: modern credit request, existing advance commitments and funds
withdrawals. Proper management of liquidity by societies serves five vital functions:
first, it should demonstrate to the market that the society is safe and capable of
repaying its borrowings. Second, enabling a society meet its loan commitments.
Third, it enables the society to elude selling of unprofitable assets and selling them
at a throw away price. However, the assets are at going concern value which
generates funds. Finally, effective liquidity management lowers the size of the
default risk premium the society must pay for funds (Bessis, 2012). This function
focuses on the reasonable price aspects of the definition of liquidity management. A
society with strong balance sheets will be perceived by the market place as being
liquid and safe. Such societies will be able to buy funds at lower risk premiums
reflecting their perceived credit worthiness (Kumar, Himes & Kritzer, 2014).
Management of risks has a competitive advantage and is often voluntarily assumed
by societies and include; credit, interest rate, liquidity, operational and other risks.
Credit risk occurs when a society cannot recover money from loans or investments,
Interest rate risk ensues when the market value of an asset, loan or security falls
when interest rates rise affecting the solvency of the society which becomes
incapable of fulfilling its obligations owing to the decline in the value of the assets
occasioned by increase in interest rate. Liquidity risk happens when the society is
incapable of meeting depositors‘ demands and borrowers‘ needs (Olkar, 2013). Even
though the current assets have been turned into cash, they are also used to borrow
funds to meet financial dues with nominal loss. Finally, operational risk
encompasses inability to control operating expenditures such as salaries. In a
competitive environment, high operational expenses endanger the prospect to

31
survive. Other risks which societies should take into account when designing risk
management strategy include political risk and technology advances (environmental
risk) (Nagarajan & Jayabal, 2012).
According to Kairu (2015), credit management is the ability to manage clients‘
credit lines and limits and is essential for managing revenue and receivables. The
society must have a better insight into performance capability, credit score history
and changing payment patterns as this assessment will minimise exposure to bad
debt and bankruptcies. The ability to tap into new markets and clientele is dependent
on a society‘s capability timeously make astute credit decisions and set appropriate
lines of credit.
Management of credit has been an accounting function for a long time. This function
is now an independent entity. Its main function is to screen customers with only the
creditworthy allowed to transact with reviews of business performance capability
and understanding the customers‘ business model. It is the first step in certifying that
the society does not end up selling to customers who ends up being delinquent.
Credit management is thus a crucial management function as it impacts on cash flow
and can indicate the difference between survival and insolvency in the private sector
or between cost effective and wasteful administration in the public sector (Kairu,
2015).
Credit procedures should be updated every year because debtors are affected by the
changing economic climate in the marketplace. This also happens to all investments.
Organisations using marketers or accountants to do the errands of credit
management must change. The business environments have changed so much today
and the way they handled their credit matters yesterday is not the same today. A

32
professional in credit management is an essential requirement which firms should
embrace. The areas which need more attention in credit management include:
lending process, credit control, provisions and write-offs. Ralston and Wright (2003)
developed two elements to high quality lending practice. Firstly, the credit union
should obtain systematic identification of risk of each loan applicant. Secondly, they
highlight the necessity for adjusting lending conditions so as to incorporate the high
risk of a borrower.
One of the main functions of a SACCO is to see it that there is proper credit control.
According to Bessis (2012), credit union should stress the inclusion of limit
procedures designed to avert single losses that could endanger the institution.
Dekker (2004) opines that the role of placing instalment periods and principal
amounts that would complement the affordability of the borrower is to be performed
by the lending officer. The credit control will however reduce business volume of
financial institutions because short duration loan terms restrict the interest revenue
generation. According to Dekker (2004), the longer the term of a facility the greater
the risk which may be resultant of the changing environment or circumstances of the
borrower.
Between 2003 and 2006, low interest rates and favourable economic conditions
stimulated the demand for new homes. According to Madura (2012), the advertised
values of homes expanded significantly. Numerous regulations used by financial
specialists contributed to failure of contracts or mortgage-backed securities.
Domestic builders reacted to the ideal lodging conditions by building more homes.
This investment opening encourages more lenders to join other lenders in financing
home building. Home prices continue rising and it resulted in reduction of down
33
payment from home buyers. The lenders assumed that, even if the home buyers
defaulted on the loan, the home‘s value would serve as sufficient collateral.
However, in 2006 the scenario changed for worse, some prospective buyers were
unwilling to purchase homes. The demand for new homes was less than the supply
of new and existing homes for sale. As a result, housing prices declined. Increase in
interest rate made the situation worst because most of the homeowners had
adjustable–rate mortgages. This results in a situation where the mortgage payments
were defaulted. Mortgage defaults continued rising and the market values of homes
declined. As a result, the collateral backing the mortgage was not corresponding to
the entire mortgage value. Though some of the mortgages were insured against
default by private insurers the defaulted amount increased. Hence, some insurance
companies which insured mortgages were not in a good financial position to cover
their obligations.
The government of United States introduced Financial Reform Act to correct the
mess in the financial system and purposes to ensure financial system stability. This
mandate ensures that institutions granting mortgages must examine the income, job
status, and credit history of mortgage applicants before approving mortgage
applications so as to ensure that the looser standards that were common during credit
crisis of 2008 do not recur. The Act also created Financial Stability Oversight
Council whose mandate is to identify risks of the financial system and to make
regulatory recommendations that could reduce those risks (Mwenda & Kalio, 2014).
2.2.6 Scientific Management Theory
This theory is attributed to Frederick Taylor whose experience exposed him to first-
hand challenges and attitudes of workers. He conducted a survey to find out the
34
possibilities for management quality improvement in entities. Other contributors
include Frank, Lilian Gilberth and Henry Gantt who suggested the effective use of
human beings as adjuncts to machines in performance of routine tasks. Taylor was
the only person who contributed concrete shape to the theory of scientific
management which employs scientific methods to the problems of management.
Scientific management is the art of knowing exactly what you want to do. The task
should be done in the best and the cheapest way so that the outcome is maximised
(Morris, Shirokora & Shatalor, 2013). The scientific task should be set basing it on
time and motion study. Other bases on scientific management include
standardisation of working conditions, scientific selection and training of workers
(Spiegel & Yamori, 2014).
Administrative management is also relevant to SACCO management practices. It
emphasizes the use of functional or process approach in managing organisations.
Henry Fayol (1841-1925) introduced this kind of management and believed in
universal management reasoning that those possessing general knowledge of
managerial functions and principles are capable of managing all types of
organisations. He thus proposed breaking of the complex management processes
into distinct inter-dependent responsibility areas. These areas include technical,
commercial, financial, security, accounting and managerial (Chandan, 2016).
The manager‘s chief function in business organisation is decision making and
forward arrangement beneath dubious commerce conditions. A few of the vital
administration choices include decisions on production, inventory, cost, marketing,
finances, personnel and miscellaneous decisions (Mugwe, 2012). One of the
trademarks of a great official is capacity to require speedy choice with clarity of

35
objectives, utilisation of available data, weighing advantages and disadvantages and
making quick choices all taken to attain certain targets with objectives the propelling
components in taking choice. It is imperative to keep in mind that other factors such
as human and behavioural considerations, technological forces and environmental
factors influence the choices and decisions made by managers (Chandan, 2016).
2.3 Empirical Review of Literature
Research was conducted by Wong, Fong, Wong & Choi (2015) on 38 commercial
banks in Hong Kong. The study was on the factors determining bank performance
and how their profit and pricing behaviour is affected by the structure of the market.
The method focused on the Structure-Conduct-Performance (SCP) hypothesis and
Efficient-Structure (EFS) were tested widely and established that the major
determinants of the performance of banks in Hong Kong are the cost efficiency.
However, the market structure is not a significant contributing factor in the bank‘s
profitability. Larger banks are found to be more cost efficient than their
counterparts. The bank-specific factors considered were cost and scale efficiency
and the risk attitude. Macroeconomics factors are important determinants of banks
profitability. They are real GDP growth and unemployment. The independent
variables examined under bank performance were; cost efficiency, scale efficiency
and the risk attitude of banks. Macroeconomics factors were moderating variables.
Research was conducted by Mosongo (2013) to establish whether the financial
innovation has any effect on financial results among SACCOs in Nairobi County.
The target population was 41 SACCOs registered under the commissioner for
cooperatives in Nairobi County. The T-test, F-test and ANOVA were used to
36
determine whether there is a significant relationship between financial innovation
and financial performance among the Societies in Nairobi County. The study found
out that financial innovation leads to financial performance. Financial innovation is
an independent variable which comprises process, product and institutional
innovation. The performance is the dependent variable. From the finding, it
established that institutional innovation had greatest impact on financial outcome
followed by product innovation and lastly was process innovation. The researcher
will not take financial innovation as the independent variable.
Research was conducted by Chumo (2013) on the effects of regulatory compliance
on the financial performance of deposit-taking societies in South Rift region where a
population of 28 DTS were sampled. From the findings, it concludes that the
relationship between financial performance and regulatory provision had a causal
effect. However, exclusively their personal goals are reduced.
Gweyi and Karanja (2014) researched on determinants of financial leverage of
SACCOs in Kenya. Their finding indicated that there is a relationship between the
independent variables, firm size, growth rate, liquidity and profitability and
dependent variable financial leverage. Mpiira et.al (2013) analysed factors
influencing participation of households in SACCO activities in Uganda. They found
out that members‘ participation increased with growth in incomes, earnings, rent and
salaried spouses were less likely to take part. Surge in the distance from the
household to SACCO also reduced participation. Kivuvo and Olweny (2014)
analysed the financial performance of Kenya‘s SACCOs employing Altman Z score
model to determine corporate bankruptcy. They found out that management face
37
challenges in increasing returns. As the external financing increase, the chances of
bankruptcy increase.
Nimalathasan (2015) conducted research on the capital structure and its impact on
profitability and found out that debt-equity ratio is positively related to all
profitability ratios. Based on the literature reviews, nobody has conducted research
on capital adequacy framework and funds allocation on financial performance of
deposit taking SACCOs. As a result, this study sought to establish the effects of
independent and moderating variables on financial performance
2.4 Conceptual Framework
The framework depicted the relationship between the independent variable and
dependent variable and their relationship with moderating variable which was funds
allocation strategy. It guided the study to develop research objectives and also to
conceptualise what could be possible ways of achieving the goals. The framework
provided insight of the task which aided in examination of the effect of capital
adequacy framework and financial performance with the moderating effect of funds
allocation strategy. The figure 2.1 depicts the relationships capital adequacy
framework and financial performance moderated by funds allocation strategy.
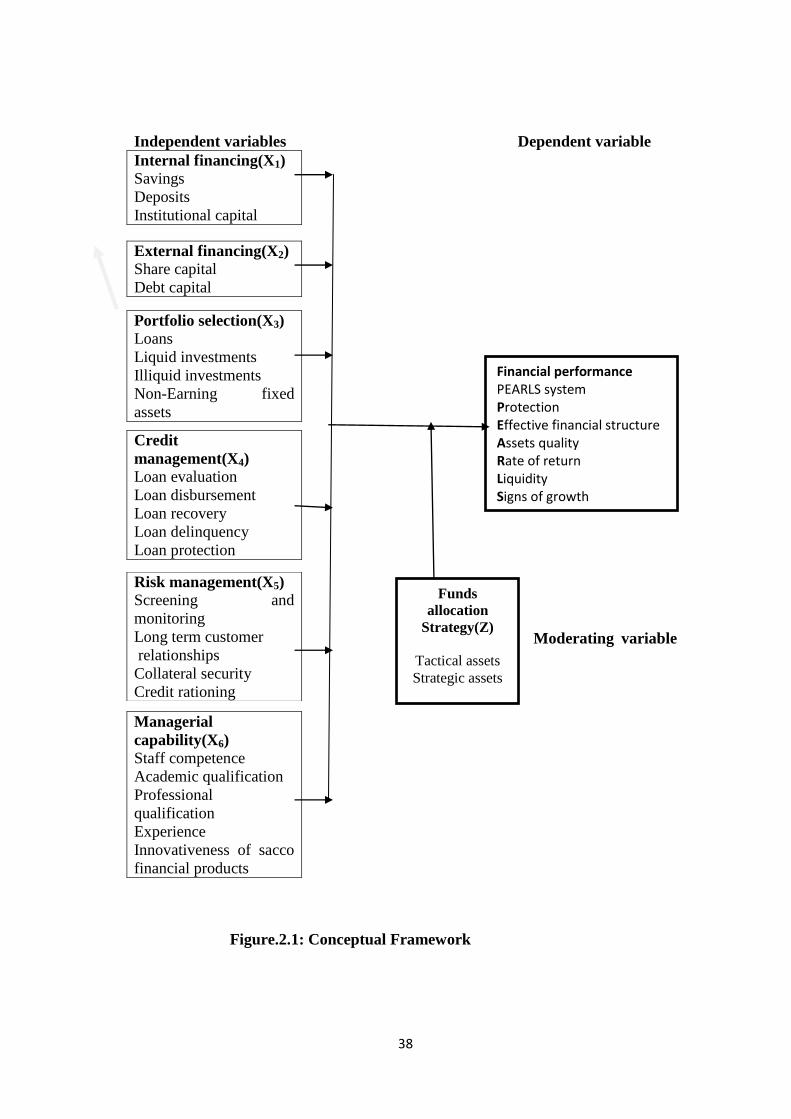
38
Independent variables Dependent variable
Internal financing(X1)
Savings
Deposits
Institutional capital
Moderating variable
Figure.2.1: Conceptual Framework
External financing(X2)
Share capital
Debt capital
Portfolio selection(X3)
Loans
Liquid investments
Illiquid investments
Non-Earning fixed
assets
Credit
management(X4)
Loan evaluation
Loan disbursement
Loan recovery
Loan delinquency
Loan protection
Risk management(X5)
Screening and
monitoring
Long term customer
relationships
Collateral security
Credit rationing
Managerial
capability(X6)
Staff competence
Academic qualification
Professional
qualification
Experience
Innovativeness of sacco
financial products
Financial performance PEARLS system Protection Effective financial structure Assets quality Rate of return Liquidity Signs of growth
Funds
allocation
Strategy(Z)
Tactical assets
Strategic assets

39
Theories underpinning independent variables of this study are capital structure
theory, pecking order theory, modern portfolio theory, agency theory and risk
theory. Capital structure and pecking order theories explain capital structure and
credit management of a firm. The capital structure theory states whether financing of
investment proposals matters and if it does what is an optimal capital structure
(Bhalla, 2014). Besides capital structure theory, pecking order theory also guides
financing decision making (Chandra, 2015). The latter gives an order of financing
investment proposals as follows; internal, debt and external finance. Modern
portfolio theory informs the portfolio selection strategy which states that it should
take into account the risks associated with investments. The managerial capability
anchors agency theory which says that management should act in the best interest of
members and the members‘ wealth maximisation. However, sometimes they may
pursue their own goals (Pandey, 2015). Risk theory informs the risk management
which shows that the business of financial institutions is making loans (Mishkin &
Eakins, 2012). The institutions should lend secure loans. The repayment is effected
in full to earn high profits. The size and age of SACCOs are control variables. These
variables will minimise the effects of other independent variables which are
unrelated with the purpose of this study.
This section reviewed the financial management practices of an economy entity
which started changing in a revolutionary manner in mid 1950s with modern
approaches answering those questions traditional approaches could not offer
solutions. Financial management is a crucial function whose nature and scope is
broader, covering both funds acquisition and its judicious apportionment. Funds
allocation is done in a systematic way but not just haphazard process. When funds
40
are utilised and allocated judiciously among different investment opportunities help
maximise members‘ wealth. Financial management is currently stressing effective
and judicious utilisation of funds rather than funds raising using analysis in solving
the financial challenges of the entity (Pandey, 2015).
At the heart of investment policy is the utility of funds which contributes to the
achievement of the general financial objectives entities set for themselves (Chandra,
2015). Currently, the finance managers have to analyse the consequences of each
decision to be undertaken by the entity. They are consulted before reaching any
financial decision both at review and during scrutiny of the final outcome. Hence,
their participation is vital and it is continuous the decision-making process cycle.
SACCOs embrace the judicious utilisation of funds to exploit the available
opportunities in the market to maximise members benefit. The techniques used
include but not limited to.
2.4.1 Capital Structure and Financial Performance.
The structure of Capital of SACCOs consists of shares/deposits, institutional capital
and debt capital. Institutional capital is non-withdrawable capital. Credit cooperative
societies should see to it that they build institutional capital in the long-run. As a
result, external financing will decline. This will translate into higher benefits to the
members.
Capital structure refers to the relationship between debt and equity that constitute the
mode of financing firm‘s assets. According to Gopal (2012), the choice of an
appropriate capital structure is dependent on various factors including nature of
business, regular earnings the business can maintain, conditions of market and
finally attitude of investors at the time of fund raising. According to Pandey (2015),
41
capital structure decisions can affect a firm‘s value. Firm should have capital
structure which can maximise its market value. This makes capital structure decision
a complex area because of its relationship with other financial decision factors.
Inappropriate capital structure decision is expensive, hence lowering the NPVs of
projects making more of them unviable. However, effective capital structure
decisions could lower capital costs and thereby trigger higher NPVs and more
acceptable projects and hence increase in the firm‘s value (Gitman, 2011). Capital
structure decision makings are guided by various theories namely, capital structure
theory, trade-off theory, signalling theory and pecking order theory.
Most of the SACCOs borrow from financial institutions preferably Cooperative
Bank of Kenya to finance their income generating projects at 15% rate of interest
per annum. Efficient management of debt financing would undoubtedly contribute in
creating wealth for the members which is major an objective for SACCOs. Bellouna
(2012) opined that one way to ensure creation of value creation was to develop
efficient working capital management as this is key for short-term corporate
solvency and survival as it affords firms the avenue to utilise the hidden cash and to
limit the requirement for working capital. Nwankwo and Osha (2014) state that
efficient working capital management influences sale, profitability, growth and
continuity in business.
Capital structure policy should guide them on the optimal capital structure so that
they can strike a balance between risk and return. Consequently, member‘s wealth
creation will be maximised. It is risky to use more debt because it will raise the risk
which members have to pay. Debt is an obligation which has to be honoured in case
the financed project failed yet more debt normally leads to higher projected rate of
42
return on equity in case the debt is managed efficiently and effectively by SACCO
management.
Capital structure decisions are influenced by four main factors namely; risk of
business, tax position, fiscal flexibility and managerial approach. Business risk is
also referred to as operating risk (Murkomen, Njeje & Cherono, 2017). It is
concerned with earnings before interest and tax. It arises due to the chances of
variability in returns caused by different usage of funds. Every business
establishment mobilises funds and uses funds for its business operations. The pattern
of usage differs from one society to another. According to Nagarajan and Jayaball
(2012), a company is exposed to business risk purely based on the pattern of usage
of funds. Operating profit is sensitive to the pattern of usage of funds. Utilisation of
funds also affects the operating cost of a firm. Operating costs include: fixed costs
and variable costs.
A firm should not use a larger proportion of fixed cost because it is not
advantageous. Fixed costs do vary with the volume of output. Financial risk is the
relationship between the proportions of debt capital to the total capital of a SACCO.
Debt capital is interest bearing. Hence, regardless of the prospects of the business,
interest on debt capital must be paid. Payment of interest is an obligation; it does not
depend on the volume of business transacted in a given period (Naituli, 2011). The
major reason why many firms use debt capital in their business activities is because
of its tax deductibles that lower the debt costs. Business flexibility connotes ability
to raise capital on reasonable terms under unfavourable conditions (Mwisho, 2013).
Financial managers acknowledge stable capital supply as necessary for steady
operations which is crucial for long-run success. Some financial managers are

43
aggressive than others; thus some entities are more prone to utilise debt in order to
boost profits and while this does not affect the true optional structure of capital, it
nevertheless influences managers in determining optimal capital structure.
2.4.2 Credit Management and Financial Performance
The term credit comes from Latin word credere which means trust, faith and belief.
If the buyer is given time to pay for goods supplied or services rendered, then it
means that the seller has trust, faith and belief in the buyer that the money will
actually be paid at a future date. This relates to the confidence of the seller in the
buyer using the time given to get together the monies required to pay. If there is no
trust, faith and belief, then the credit is not given (Kairu, 2015).
Basu and Rolfes (1995) postulated top-quality management of credit procedures as
vital components on which successful businesses are built. The main objective for
managing account receivable is collection of these accounts promptly without losing
sales from high-pressure of collection practices.
To achieve this goal, SACCOs should adopt three methods of credit evaluation;
namely, selection of credit and standards, credit terms and credit monitoring. Credit
selection encompasses applying methods to determine which customers qualify for
credit. According to Gitman (2011), this process should involve assessing the
client‘s credit worthiness in comparison with the credit standards of the firm. The
five C‘s of credit dimensions of character, capital, capacity, collateral and conditions
can provide a framework to evaluate the creditworthiness of a potential creditor.
However, this analysis may not give a specific accept or reject decision straight
away. It needs an experienced analyst who has good judgment in review and grant of
44
credit requests. This framework tends to ensure that the credit customers will repay
the facility advanced timeously within the terms of credit.
Credit terms outline the obligations of the parties upon credit and are strongly
influenced by the business activities of an entity (Muasya, 2016). A SACCO needs
its normal terms of credit to comply with its industry benchmarks. Where its terms
are restrictive compared to its competitors, the entity loses trade whereas if the terms
are less prohibitive compared to those of its competitors, the entity will likely pull in
poor-quality clients who may not pay beneath the standard industry terms. Firms
should thus compete on the basis of quality, price and product costs, and services,
but not on the basis of its terms of credit. In addition, regular credit terms should be
in line with industry standards but individual client terms should reflect the riskiness
of the customer (Gitman, 2011).
SACCOs also ought to consider credit observing. Credit checking is a progressing
audit of account receivable to decide whether clients are paying as per agreed to
credit terms. On the off chance that they do not pay in an opportune way, credit
observing will alarm the society to the issue. Moderate instalments are exorbitant to
an entity since they protract the normal period of collection and hence increment in
the entity‘s investment in accounts receivable (Kairu, 2015; Mudiri, 2013). The two
methods commonly used for credit monitoring are aging of accounts receivable and
average collection period and. SACCOs should have a good collection program
which aims at timely collection of receivables. The collection efforts should include
the following techniques, namely; monitoring the status of receivables, dispatching
letters to clients with approaching due dates, e-mail and telephone reach out to
clients around the due date, threat of legal action and actual action to and against
45
overdue accounts. Vigorous programmes of collection tend to decrease sales,
shorten the average periods of collection, reduce percentage of bad debts and
increase the cost of collection. However, a slack programme of collection pushes
sales up, elongate the period of collection, increase percentage of bad debt and
reduces the cost of collection.
The lending of funds by banking institutions and their willingness to lend affect the
financial policies within an economy and even where the Central bank for example
increases capital requirement during a weak economy, banks may still be unwilling
to lend loans to some potential investors; this results in a credit crunch (Madura,
2012) since if the newly created funds are not lent out the economy will be
unstimulated. The institutions would be unwilling to lend because they fear the
weak economy will make it less likely that facilities will be repaid and only extend
credit upon confirmation that the borrower‘s future cash flows will be sufficient to
service the loan. During recession, the future cash flows of many prospective
investors are indeterminate triggering reduced loan applications and also the number
of loan applicants that meet a bank‘s qualification standards.
SACCOs and other institutions of lending owe a duty to their depositors,
shareholders and regulators to avoid bad debts. Because default risk rises during a
weak economy, some potential borrowers will be unable to obtain loans (Ondieki,
2015). Others may qualify only if they pay high risk premiums to cover their default
risk. Consequently, the effects of the Central Bank‘s monetary policy may be limited
if potential borrowers do not qualify or unwilling to incur the high risk premiums.

46
2.4.3 Risk Management and Financial Performance
This study focused on effective financial management of DTS in Kenya covering
various counties in Kenya which SACCOs were introduced to promote saving
among membership. While the intention was judicious, various critical factors other
than minimum capital requirements were not considered. These included protection
of the funds and managerial capabilities (Wetsi, 2015). The management of risk in
DTS must be prioritised particularly during allocation of funds across different
portfolios as fund allocation significantly influence business performance.
As depository institutions, SACCOs encounter credit, liquidity and interest rate
risks. Political interference in running SACCO offices is a major problem in some
counties. It has resulted in the withdrawal of deposit taking licenses by the
Authority. The society may experience the risk of liquidity. In such a case there will
be an unanticipated wave of withdrawals without any new deposits being made by
members. In that case, SACCOs resort to borrowing from Cooperative Bank of
Kenya to resolve temporary liquidity problems. However, if the cash crunch
continues, society must search for a more permanent cure. The market restricts its
transaction to consumers meeting as membership criteria. SACCOs possess little
capacity to get supplementary deposits speedily. However, other financial
institutions are capable of boosting their deposit levels due to their wider market
reach (Gitman, 2011).
SACCOs mainly focus on personal loans to their membership. It is because credit
risk exposure is not greater than mortgage credits. With most of the personal
facilities secured, the loss to the SACCOs in the event of default is reduced. Distinct
economic conditions impact on loan differently with poor conditions significantly
47
impacting loan defaults hence certain societies will, on account of favourable
conditions, perform better than others within the same region (McKillop & Wilson,
2015). Nonetheless, societies with lenient debt policies could experience losses,
even if there is a favourable business cycle. Credit analysis of loan applicants should
be done thoroughly, even though the loans are consumers oriented.
Facilities by societies to their membership are characterized by short or intermediate
maturities making their asset-portfolios interest-rate sensitive. The interest expenses
influence the interest revenues earned by SACCOs. It is due to the nature of sources
of funds which is rate-sensitive. Regardless of the interest rates changes the spread
between interest incomes and interest outlays remain stable over time, regardless of
changes in the rates of interest and thus SACCOs tend to experience lower exposure
to interest rate risk than commercial banks (McGrath, 2017).
The objective of management of risk is to weed out any uneconomical risk taking
while ensuring maximisation of value. The primary focus should thus not be
minimisation or avoidance of all risks but finding the optimal gain between risks
taken and expected returns, and creating competitive advantage for the entity
(Michelle, 2016).
As each business venture comprises risk and return (Nagarajan & Jayabal, 2012),
risk encompassing exposure to uncertainty, the result impacts business performance
of a firm. Investors devote their funds expecting steady income in the future. Often,
expected ROI contrasts the actual return (AR) realised and where AR realised equals
the expected return, then the investment is considered to be risk-free. Where there is
a wide variance in return, the investment is considered risky.
48
The SACCO Societies (Deposit taking SACCO business) Regulation, 2010,
societies must appraise their credit portfolio at least once quarterly. DTS must make
sure that granting loans and lending follow stipulated credit policies. Problematic
accounts should be identified and categorised and prompt redress measures invoked
with provisioning for potential losses continuous and efficient to match prevailing
circumstances. There are five classes of loans: performing, watch, substandard,
doubtful and loss loans. A deposit guarantee fund was introduced by statute to
recompense the membership of failed SACCOs although it is yet to be
operationalized.
A SACCO‘s risk attitude is dependent on its investment decisions and expected
returns. The general presumption is that high risk ventures yield high returns.
Decisions taken by SACCOs thus reflect their risk approach or inclinations which
vary from SACCO to SACCO with DTS undertaking risky ventures expecting
rewards (Jhingan & Stephen, 2011).
Investors have sufficient acquaintance with demand for product demand, production
and factor costs and other related variables with risk a normal feature. Undertakings
characterized by high degrees of uncertainty may thus be rejected even where their
rates of return supersede minimum rates. It is also commonplace to find ventures
requiring high cash outlays being accepted albeit having low rate of returns (Jones,
2014).
SACCOs practicing risks management have a competitive advantage as they are able
to predict adversative changes and shield themselves. Societies have to manage all
the risks in order to maximise members‘ wealth. Common risks which may be
encountered in lending business are credit, interest rate, liquidity and operational

49
risks. With good professional managers, most of the risks will be mitigated. Credit
risk arises when money from loans or investments failed to earn any financial gain.
Interest rate risk occurs when market value of assets fall due to a rise in interest rate
(Chanda, 2016). The solvency of the SACCO would be threatened when it cannot
meet its financial obligations. Liquidity risk arises when the society cannot meet the
demand of depositors and needs of borrowers. The society sells assets in order to get
cash or borrows funds when needed with minimal loss. Finally, operational risk is
resultant of inability to control operating expenses, especially non-interest expenses
such as salaries and wages. Technological advancement which results in
environmental risks should be taken into account when designing risk management
strategies.
Todaro and Smith (2011) define debt servicing as paying back the principal facility
and the interest accumulated constituting a contractual fixed charge on real incomes
and savings SACCO. As the size of the debt grows, so do the debt servicing charges
increase and these should be offset only through the earnings of the SACCO.
Sometimes loans are rescheduled to allow reorganisation of the repayment terms.
However, significant rises in interest rates could increase debt service payments and
occasion servicing challenges.
2.4.4 Portfolio Selection and Financial Performance
Portfolio comprises combinations of securities held by an investor. Generally,
investors invest in more than one security. The main objective of diversifying
investment is to minimise risk in case it occurs. SACCOs invest in various ventures
depending on their profitability of the ventures. They may invest in real estate,
education sector, health sector, hospitality sector, transport sector or any other sector

50
of their choice (Omisore Munirat & Nwufo, 2013). They also invest in various
securities. These securities are contained in typical portfolios consisting of shares of
distinct risk-return relationships and bonds of different characteristics (Chandra,
2015). Marketable securities, for instance, government treasury bills and bonds are
purchased by firms to maximise wealth creation of their members. These are income
generating ventures which will improve their streams of cash inflows to their
societies. They spread risk by investing in different securities so that the adverse
outcome is minimised.
A critical requirement of investment is the need to take into consideration individual
investments as part of an overall investment plan. Individual investment securities
form a portfolio. It is advisable for an institution to diversify its investment as
opposed to investing in single securities. Importantly, each security must be viewed
in a portfolio context. The total risk of a portfolio has to be identified and quantified.
In portfolio management, it has to establish an investment goal and then decide the
best approach to reach that goal with the securities available. Investors should
attempt to obtain the maximum return with minimum risk. According to Bhalla
(2014), he stresses that in order to do a proper task of portfolio management, the
investor must be aware of the investment prices. Portfolio management process
involves the following investment decisions: plan, implement and monitor the
outcomes.
In the planning stage, a thorough review should be carried out to ascertain
investor‘s business situation and current capital market conditions. Both investor
and market condition facilitate preparation of a set of investment policies which will
guide the firm in implementing its investment plan. The set of policies are
51
documented in a written statement of investment policy (Ogilo, 2014). The items
included in the investment policies are: the portfolio objectives, strategies and
various other investment limitations. The result of a well-designed planning
document will serve as a well-defined strategic asset allocation. The strategic asset
allocation reflects the optimal combination of various asset classes in an efficient
market. It is a significant portfolio which would actually be held if a passive, pure
investment strategy is to be embraced (Jordan et al., 2018).
The investors‘ knowledge of various securities has a vital effect on the kind of
security classes which should be held and the speculative strategy is embraced. The
investor should know the rate of returns of a given security so that it can facilitate
prudent decision making. If the investor does not have adequate information about
the nature and extent of a security‘s short and long-term risk, then it should not be
held. The tolerance level which the investor has for investment risk should be taken
into account. According to Bhalla (2014), he states that developing a proper
investment strategy is a daunting task. It is important to assess the potential future
returns on various marketable securities before making any investment decision. The
expected returns from short-term and long- term market forecasts must be made if
one has any intent of engaging in tactical asset allocation. Strategic allocation of
assets shows the allocations optimal for investors where all security prices trade at
their long-term equilibrium values. This may happen if the markets are efficiently
priced. Making decision on the investor‘s current strategic asset allocation requires
prediction of future return distributions for various security class estimates of the
major economic risks faced by the investor.
52
Investment strategies are dynamic. They change with time, as the wealth of the
investor wealth changes and as security prices change and investor‘s knowhow
increases. The optimal strategic asset allocation is not static, it changes as time
passes. As a result, it requires periodic rebalancing from time to time. These changes
are considered as passive changes to the portfolio. They are not active changes in the
hopes of earnings excess risk-adjusted returns from potential security price
disequilibrium. Investors should be continuously revising their strategic asset
allocation. In this case, there is no need to plan for a passive rebalancing strategy.
The investors should evaluate their individual investment needs and market
expectations to develop a current strategic asset allocation (Bhalla, 2014).
The implementation of asset allocation involves three decisions. . Where percentage
holdings of asset classes are different from the desired holdings as stated in the
statement of investment policy, then the portfolio should be readjusted to the desired
strategic asset allocation. One begins by adjusting the asset mix to the desired mix
called for in the strategic asset allocation, then after that any tactical asset allocation
and security selection decisions are made.
The last stage of investment process is portfolio monitoring. At this stage, portfolio
returns are monitored in order to determine which speculative decisions are adding
value to the portfolio and to ascertain that the portfolio‘s objectives are being met
and have not changed. Constraints should be addressed so that the goals of the firm
are achieved. Monitoring has three features. They include the following. First, the
actual portfolio held should be examined to ascertain that it complies with the
statement of investment policy. It is also important to determine whether any passive
rebalancing of the asset mix is required. Second, investment performance should be

53
reviewed. The review consists of checking returns on aggregate portfolio, each asset
class and investment manager. The returns from any speculative investment are also
ascertained to see to it that investments are safe. Investment managers should have a
wide knowledge on portfolio management (Bhalla, 2014; Chandra 2015).
When selecting portfolio, they should consider the portfolio decision basing it on
objectives, constraints and preferences which consist of two steps, that is, asset
allocation and security selection. According to Jones (2014), individual investors
must confront the asset allocation issue if they are to be successful over time.
Having a diversified portfolio of stocks is often not enough, it should be well
managed. Good investment performance is having a portfolio of stocks and properly
diversified because we live in an uncertain world and proper diversification does
eliminate some of the risk of owning stocks. They should embrace Markowitz
diversification model because it pays; that is, portfolio risk can be reduced
depending on the co-variance relationships (Jones, 2014).
Portfolios are selected using fundamental portfolio analysis while technical analysis
or a combination of the two may also be employed. Most investors often believe that
the two techniques assist in valuing portfolios. It is evident from literature reviewed,
that they possess the patience, skill, and ability to identify undervalued stocks.
However, most of the SACCOs do not have security analysts who have analytical
skill to assist them in identifying undervalued or overvalued stocks in the security
markets.
2.4.5 Managerial Capability and Financial Performance
SACCOs are required to have satisfactory financial controls to guarantee that the
judgment of their operation forms. The inside controls ought to be a necessarily
54
portion of the institution in general framework of internal control. They should
promote transference and accountability in the operations of the enterprise. The
reliability of financial and regulatory reporting is a priority. All the entities should
be compliance with relevant laws, regulations and institutional policies (Kumar et
al., 2014). An effective system of internal control for operations and management
include the following: a great control environment, a satisfactory preparation for
distinguishing and assessing hazard, the foundation of control exercises such as
arrangements, methods and strategies, palatable data frameworks and persistent
audit of adherence to set up arrangements and methods. Operational oversight by the
society board and senior management is vital for prudent financial management
process hence crucial for them to understand their mandate about financial
management. They perform their roles in overseeing and managing society finances
adequately.
The management skills of SACCOs should be improved so that the expected cash
flows will be enhanced. For example, competent managers will recognise how to
revise the composition of the firm assets and liabilities to capitalise on existing
economic or regulatory conditions. They can capitalise on economies of scale by
expanding specific types of businesses and avail diversified services that cater for a
range of customers. They may restructure operations and utilise technologies to
reduce outlays (Madura, 2012). The SASRA should prescribe a capital adequacy
framework to provide for managerial efficiency and effectiveness. Professional
managers would be in a good position to manage societies‘ financial and non-
financial resources for prosperity and posterity
55
Today, human resource professionals should perform the role of a partner who helps
the organisations implement their business strategy positioning the function as
integral in business strategy as an effective HR management enables a firm compete
globally, grab market share and become innovative (Dubrin, 2009). In today‘s
competitive and globalised market environment, a skilful committed and competent
workforce is a great source of competitive advantage. Dedicated workforce allows
the organisations to compete on the basis of market responsiveness, product and
service quality and technical innovation. Low cost, high quality products and
services are not just the result of sophisticated machines, but the result of intensely
committed employees who work hard and with self-discipline to produce such
products at the lowest possible cost.
Human Resource Management (HRM) is an equal partner in both the formulation
and implementation of the company‘s strategies so as to gain a competitive
advantage (Gupta, 2008). The goals and strategy should be defined in clear terms so
that people can understand their role in realising the goals and the success in
achieving them can be measured. Once the strategy is clarified, the HR professionals
need to build a clear case for why and how HR can support that strategy. SACCOs
have control regarding composition of its management and organisational structure.
Through the managers in-house decisions that capitalise on the external forces can
be made. The external factors include: rates of interest, economic growth and
regulatory bottlenecks over which a firm has no control. As a result, the managers‘
skills within a society can impact its expected financial performance. Specially,
skilful management is needed for the creation of new products and services that

56
complement the existing services they offer to members. Skilled managers could
also create products that will be used by SACCOs.
Cooperatives are republic and democratic institutions. The owners (members) elect
directors to represent them and oversee the business affairs of the firm. Through the
board of directors (BOD) the overall supervision of an entity is performed. A Chief
Executive Officer (CEO) oversees actual operation. Both CEO and BOD are
collectively and individually answerable to the members. In addition to choosing the
Chief Executive Officer, the BOD also advises on and approves business ventures
and strategy; corporate governance. Corporate governance connotes the process,
custom, policy, law and institutions that determine how a firm is run. According to
Kairu (2015), the business activities of an entity are managed under the direction of
a BOD who delegate to the Chief Executive Officer and other members of staff. The
directors should steer the enterprise with integrity and commitment to the entity, its
business plans and long-term members‘ value. The directors have a wealth of
experience to steer the society to prosperity (Okewo, 2013).
In Kenya, cooperatives are governed by the co-operative societies Act, rules and by-
law set out by the statutory regulations which direct the operations of cooperative
society. According to Kobia (2011), the problem with cooperative corporate
governance arises from weakness in the election or selection of board and
management committees. This compromises their contribution and independent
judgment on issues of vision, strategy, application of resources, and appointment of
executives, standards of conduct and management performance. The most common
strategy which affects cash flows in any given SACCO is the management abilities
to control daily operations of the society. The society cannot dictate economic
57
growth, interest rate movements, or regulation, but it can select its good
management team and organisational structure through whom decisions leveraging
on external factors such as economic growth, interest rate and regulation can be
exploited for the benefit of the firm. As the managers‘ skills improve, so is the
expected cash flows.
Managerial capability of any firm is anchored on education and qualification. The
educational background and formal qualifications of managers and Board of
directors should be a guiding principle. According to Bosworth and Wilson (2002),
qualifications are measure of capability. It should be a requirement when recruiting
managers. Managers should have business administration related degrees and CPA
(K). The academic qualification will give them first hand weapon to promote
organisation effectiveness. Organisational effectiveness depends upon individual
effectiveness, group effectiveness and other factors related to organisation (Rudani,
2011). The development of any organisation needs professionally qualified
managers. Behind the success story of any firm, group efforts have potential
contribution. For deposit taking SACCOs to be successful, they must recruit
professional managers. It is also crucial that Board of Directors should be degree
holders so that they can direct the organisation to prosperity.
Formal and informal training is a continuous process in all organisations. It
facilitates the achievement of the organisational goals. Every firm has to ensure that
their staff complements are professionally sound and technically expert. They should
be well equipped to handle any business activity. A firm has sole responsibility to
arrange training session of all the employees every year so that the quality of human
skills is maintained. To ensure professional excellence, it should be mandatory to

58
update employee skill every year. It is also prudent to embrace management of
global environment (Kondalkar, 2014). Most deposit taking SACCOs have problem
in developing their staff. Staff is the engine of the organisation. They require to be
updated every now and then. The training will modify individual behaviour and
implement change of a permanent nature. Any intervention to solve prevailing
problem, it needs to diagnose the cause. It is critical to select appropriate
intervention and implement it till desired outcomes are realised. It could be
repetitive in nature. Its objective is to understand human behaviour and modify
various organisational processes for desired results. All the SACCOs should
embrace employee development so that their societies can be run professionally.
Hence, members can benefit from their societies financially.
The government of Kenya should lay a legal framework to facilitate recruitment of
professional managers in all the SACCOs. This will go a long way in managing and
investing members‘ funds judiciously. Bad managers ruin good firms. Good
managers manage funds professionally. Even though the government has passed
laws which guide SACCOs, most of them have failed. The societies are being
mismanaged by management. Board of directors influences them to invest in
unviable projects. Some political leaders are involved in mismanagement of
members‘ funds. According to Kanchu and Kumar (2013), they state that in order to
manage SACCOs successfully a manager should possess the following necessary
qualities. First, a manager ought to be well-educated. Besides general education, a
manager should have specialised in business administration. Knowledge of business
environment is vital to deal with the problems which the society may have to face in
future. Second, a manager should undergo training to develop necessary skills for

59
running the society. Managerial skills are acquired through training. It is mandatory
for a good manager to have some sort of training in the area of management where
he is working. Third, a manager should possess some higher level of intelligence
than the average human beings and should be in a good position to think
scientifically and analyse the problems precisely. Fourth, all the managers are
supposed to provide guidance and leadership to a number of subordinates. The
managers ought to channelise the energies of the subordinates for the achievement
of SACCO objectives. Good leadership qualities can motivate subordinates
effectively. Finally, managers should possess the following qualities: foresight,
maturity, technical knowledge, human relations attitude and self-confidence. The
most prominent issue is how directors oversee the work force. The director within
the business environment has got to bargain productively with the individuals who
are to contribute for the accomplishment of authoritative objectives. Drucker has
pushed that the administrative approach to handle labourers and work ought to be
practical and energetic. Each work ought to be outlined as a coordinated set of
operations (Chanda,2016). The labourers ought to be given an adequate degree of
opportunity to organise and control their work environment. It is the obligation of
each supervisor to teach, prepare and create individuals underneath him so that they
may utilise their possibilities and capacities to perform the work distributed to them.
The chief officers ought to offer assistance to staff in the lower level. The staff have
to be motivated to achieve the organisational goals. For getting best commitment
from the individuals working beneath him, he must give them with legitimate
environment. Directors ought to make a climate which brings in and keeps up
fulfilment of SACCOs' objectives. Business and employee management is an art.

60
The business landscape today is characterized by entities that make billions one year
and file bankruptcy in a day. Normally, the business arena is unpredictable. Entities
face a multitude of challenges including technological advancement, diversity and
globalization which give managers daunting task and necessitates knowledge
management training (Olando, Mbewa & Jagongo, 2013). Today, resources and
markets are available on a global scale, and technologies continue to offer solutions
and challenges to present day SACCO business models. There are many challenges
faced by SACCOs including environmental, organisational and individual
challenges. Deposit-taking SACCOs that deal with these challenges effectively are
likely to outperform those that do not face them effectively. Managers face dynamic
environment which force them to be constantly monitoring the opportunities and
threats. Managers need to be proactive in their business dealings.
Total quality management refers to the effective use of the available human
resources. Hence SACCOs should stress on training and continuous personnel
improvement to achieve their intended goals. Total quality management means that
a SACCO‘s culture is explained by and supports the constant quest for customer
satisfaction. According to Kondalkar (2014), it involves continuous improvement of
SACCO‘s processes, resulting in high quality products and services. As Human
resource is a crucial asset in any organisation, no research has been conducted to
establish the relationship between managerial capabilities on financial performance.
2.4.6 Funds Allocation Strategy and Financial Performance
Funds management relates to planning the procurement of finances and using the
resources judiciously. Its objective is to achieve the desired expectations of the
societies and the providers of funds. It has three functions, namely; to anticipate
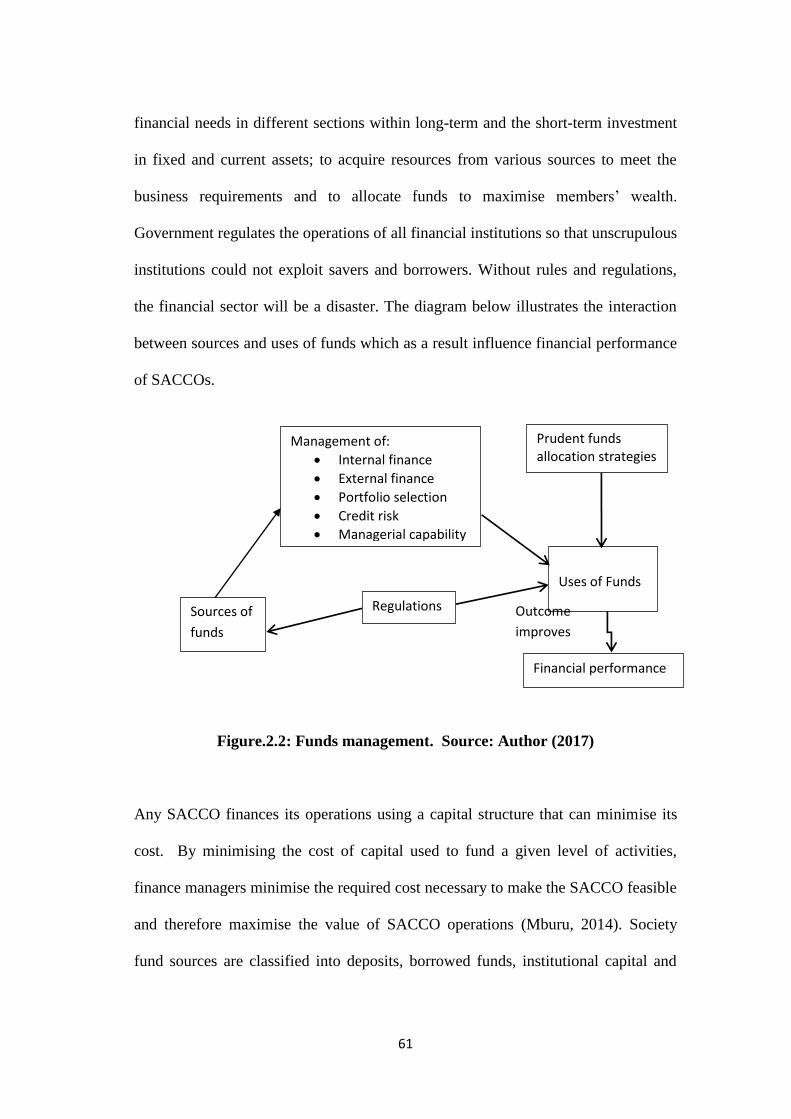
61
financial needs in different sections within long-term and the short-term investment
in fixed and current assets; to acquire resources from various sources to meet the
business requirements and to allocate funds to maximise members‘ wealth.
Government regulates the operations of all financial institutions so that unscrupulous
institutions could not exploit savers and borrowers. Without rules and regulations,
the financial sector will be a disaster. The diagram below illustrates the interaction
between sources and uses of funds which as a result influence financial performance
of SACCOs.
Figure.2.2: Funds management. Source: Author (2017)
Any SACCO finances its operations using a capital structure that can minimise its
cost. By minimising the cost of capital used to fund a given level of activities,
finance managers minimise the required cost necessary to make the SACCO feasible
and therefore maximise the value of SACCO operations (Mburu, 2014). Society
fund sources are classified into deposits, borrowed funds, institutional capital and
Management of:
Internal finance
External finance
Portfolio selection
Credit risk
Managerial capability
Prudent funds allocation strategies
Regulations Sources of
funds
Uses of Funds
Financial performance
Outcome
improves

62
share capital. Most of the societies obtain their funds from members‘ deposits which
is similar to any savings account deposit in commercial banks; it has no specified
maturity. Licensed deposit taking SACCOs are allowed to receive deposits from
their members. Deposit holders are paid interest at the end of the year. In cases
where any society requires funds for either short–term or long-term period, it may
borrow from other SACCOs or from commercial banks (Madura, 2012). Most of the
SACCOs borrow from Cooperative Bank of Kenya which acts as a lender for all
societies to accommodate funding and specific needs or to buoy the liquidity of
distressed enterprises
A SACCO can retain a portion of the profits it has earned without distributing any
part of it to the members. Portions of profits held in the firm form institutional
capital. It includes membership fees. It is non-withdrawable capital. The SACCO
Societies Act 2008 encourages the enterprises to build up this kind of fund.
Members contribute a certain amount of money monthly to the Sacco kitty, and this
also forms share capital. When a member requires a loan, he is entitled to a figure
equal to its shares, multiplied by either two or three to determine the amount of
credit. He will receive such sum (Magness, 2016).
SACCOs invest their funds in either short-term or long-term venture. The uses of
funds for Societies include; cash, mortgages, securities and consumer and
commercial loans. Also, SACCOs must retain cash to meet reserve requirements
stipulated under statute and to cater for withdrawal requests of member depositors.
Other SACCOs also hold cash balances at other financial institutions in exchange
for other services with mortgages constituting the chief asset of SACCOs, especially
those which are financially sound. Mortgages have long-term maturities. The

63
borrowers can usually prepay (Madura, 2012). However, many SACCOs especially
financially weak ones prefer to avoid loans with long maturities.
Savings and credit cooperatives utilise most of their financial resources in advancing
loans to their members. These loans finance acquisition of land by members, home
improvement, purchases of automobiles, paying children‘s school fees; and other
personal expenses. Besides providing loans, SACCOs invest in economic assets as
well, like procuring government bonds and agency securities to sustain optimal
liquidity. Degrees to which SACCOs can offer various products and services are
influenced by the Sacco Societies Act 2008 and by their location. They tend not to
make risky investments. They invest in varied types of securities that assure low risk
(Mishkin & Eakins, 2012).
Vision 2030 is a strategic development plan with the intention of turning Kenya into
a universally competitive and affluent country characterized by a tall quality of life
by 2030. Its objective is to quicken the change of the nation to a rapid industrialised
middle income nation by 2030. The strategy for implementation and realisation of
the vision is broken down into five-year medium term rolling plans (Luethge & Han,
2012). The targets for growth were projected to be above 7 percent yearly in order to
meet the Millennium Development Goals (MDGs) by 2015 and fulfil the Vision
objectives by 2030. Vision 2030 is anchored in economic, social and political pillars
in aspiration to meet the MDGs for Kenya by 2015. The Vision is built on the
following items: macro-economic stability for long-term development, continuous
reforms in governance, equity enhancement and creation of wealth.
64
The cooperative sector is not prominent in the Vision 2030 as was the case in
previous development plans. The opportunities for the sector to thrive are however
vast.. Within the economic pillar-financial services-, (that is, banking, insurance,
capital markets and pension funds), reference to SACCOs and micro-finance
institutions is made with particular mention of cooperatives in the statement;
establishment and strengthening of informal traders‘ associations to form SACCOs
for enhancing savings mobilisation in order to provide affordable finance and
enhancement of management of SACCOs. The First Medium Term Plan (ROK,
2008), reports that of the 4900 SACCOs, serving 2.1 million Kenyans, only 155 are
based in the rural areas.
According to Kobia (2011), 27 percent of Kenyans have access to financial services,
including banks 19 percent, SACCOs and microfinance at 8 percent. Another 35
percent have access to informal financial services provided by Rotating Savings and
Credit Associations (ROSCA), and merry-rounds of relatives and friends revealing
that 38 percent of Kenyans have no access to these products and services (Kobia,
2011). Cooperatives play a critical role in Kenya‘s economy. The greatest part is
contributed by financial cooperatives. The main players are SACCOs, KUSCCO,
Cooperative Bank and CIC, which hold significant savings portfolios. Cooperative
development in Kenya, as in many countries has traversed two main eras: state
control and the period of liberalisation.
Most of the organisation‘s capital allocation decisions were made in the past. This
means that the strategic assets, whether tangible or intangible, are traceable to the
investment decisions which were made yesteryears. Capital allocation decisions are
usually made by top management. This is more so in large divisionalised companies,
65
where a central concern of top management at the corporate head office is to allocate
capital across strategic business units and to manage the investment decision-
making activity in the entire group (Chandra, 2015).
The allocation of resources by the market may not be efficient. It results in market
failure, which will attract government intervention. When the market fails to deliver
efficient resource allocation, loss of economic and social welfare to members is
likely to arise. According to Jhingan and Stephen (2011), resources are the means to
certain ends. Economic system main intention is to facilitate the allocation of scarce
resources. Resource allocation is how the available factors of productions are
allocated among various uses to which they might be put. It determines the amount
of goods and services have to be produced. Uses of resources in one investment
project will affect the other project having relationship through common input. If
one project fund increases with given scarce resources, then the other project fund
decreases. The firm has to ration capital on various projects. The optimum allocation
of resources between two projects will depend upon the rate of return from the
project and the resultant cost savings from the investment to the society. Funds
allocation strategy involves purchase and sale of assets, economic assets and
marketable assets in primary and secondary markets and includes use of resources
or savings to create other assets or acquire existing assets.

66
Financial assets Economic assets
Figure.2.3: Funds allocation strategy. Source: Author (2017)
The effort is to evaluate acceptable projects. The project selection is dedicated by
the nature of net present value. The project that has positive net present value is
selected. Investment decisions relate to the total amount of assets to be held and their
composition in the form of strategic and tactical assets and influence the risk the
business enterprise is exposed to with attitude towards risk by investors key
(Hampton, 2013).
Funds allocation strategy should be guided by asset allocation principles which
stipulate that the investment manager should make forecasts of expected returns,
standard deviations, and co-variances for all available securities. A portfolio has to
be constructed which will indicate the ratio of investment in each of the securities
contained in the portfolio. An efficient set is formed and the optimal portfolio is
Members
Tactical assets
Cash
Bank deposits
Treasury bills
Strategic assets
Share
Debenture
Treasury bonds
SACCO
(Investors)
Tactical assets
Leasing out
commercial buildings
Strategic assets
Buildings
Land
Petrol station
Education
Hospitality ventures
Become

67
identified and selected (Sharpe, Alexander & Bailey, 2011). The portfolio may be
invested in short–term or long-term assets. The short-term investment is referred to
as tactical funds allocation which matures within one year. The long-term
investment is referred to as strategic funds allocation which matures in more than
one-year period. Assets included in tactical investments are marketable securities,
that is, cash equivalents, treasury bills, certificate of deposits and commercial
papers. Strategic investments include treasury bonds, shares, real estate and
debentures (Chandra, 2015). Funds allocation strategy largely determines an
investor‘s success or lack thereof.
Efficient allocation of funds is informed by the market forces. SACCOs should put
in place structures to ensure that efficiency in their organisations is achieved. There
are three ways in which SACCOs will ensure that funds are utilised effectively and
efficiently. Allocation efficiency should be adopted so that direct savings and
retained earnings are invested in the most efficient and productive enterprise.
Operational efficiency should ensure that costs are minimised to enhance members‘
benefit. It is also important that information efficiency should be in place so that the
future prospect of a security is reflected in the current price (Nagarajan & Jayabal,
2012). In conclusion, most SACCOs invest in various investments, namely; loans,
liquid and illiquid investments and non-earning fixed assets.
Most of the activities of financial institutions are affected by macro-economic
factors. The government is the main player in ensuring that business fluctuations in
the economy are controlled. The aim of the government is to stabilise economic
activities so as to avoid the ill-effects of booms and depressions. The government
invokes three instruments to influence the operations of financial institutions. The

68
three instruments comprise: monetary policy, fiscal policy and regulatory
framework. Funds allocation is influenced by government activities and instruments.
This prompts a debate as to whether funds allocation of SACCOs moderated
relationship between capital adequacy framework and the financial performance of
deposit taking SACCOs in Kenya (Klein, 2016). To ascertain this, the following
hypothesis was tested. H7: Funds allocation has no moderating relationship between
capital adequacy framework and financial performance of deposit taking SACCOs
in Kenya.
2.4.7 Financial Performance measures in SACCOs’ Perspective
This section explains various factors which relate to SACCOs financial return which
include: earnings management, strategies for income management, dividend policy
and performance measures (Njuguna, 2009). Capital management and financial gain
are important factors in any business enterprise. Anybody would like to do business
with minimum capital and obtain maximum returns. Other entities such as creditors,
customers, lenders and employees that deal with such a business venture would also
like to deal with a viable business unit (Madura, 2012). Any lender would like to
ensure that the debt-equity ratio is reasonable. Any creditor would like to get paid in
time, and he would, therefore, consider the liquidity position of the company. One
significant parameter of financial strength is capital or net worth. Therefore. it
becomes crucial to have adequate capital and to demonstrate that the owners have
good stakes in the financial business. Any SACCO business is no exception to this.
In measuring the profit performance of SACCOs, PEARLS is employed as a
monitoring and evaluating system. The World Council of Credit Unions (WOCCU)
recommended it as a financial performance measure for credit unions as it contains

69
fundamental indicators in six key areas: protection, financial structure effectiveness,
asset quality, rates of return and costs, liquidity and signs of growth (Pistelli, 2014).
SASRA should embrace this performance measure so that it can correct the
deficiencies before SACCO‘s fail. The more failures it can prevent, the more
confidence the public will have in the SACCO industry (Njuguna, 2014).
The most notorious cause of Sacco‘s failure is poor management. Unfortunately
there exists no reliable measure of poor management. Hence, WOCCU rate
SACCOs or credit unions by six characteristics that constitute the PEARLS ratings.
They include:
Protection evaluates the adequacy of SACCO‘s provision for loan losses and scores
adequate if a SACCO has sufficient resources to cover 100% of all loans delinquent
for more than 12 months and 35% of all loans delinquent for 1-12 months.
Effective financial structure: this evaluates assets, liabilities and capital. It also
recommends an ―ideal‖ structure for savings and loans SACCOs are advised to
increase productive assets as a means to achieve sufficient earnings.
Asset quality: Non-productive assets do not generate income and include buildings
and equipment whose contribution are intangible. The WOCCU target limits
SACCOs to a maximum of 5% of total assets. The higher the ratio, the more
difficult it is to generate sufficient assets.
Each SACCO should make decisions on allocation of deposited funds which
determine its level of credit risk. SASRA thus evaluates the quality of the society‘s
assets which include its loans and securities. The 5cs are applied when assessing the
quality of the loans extended by SACCOs. These comprise capacity, collateral,
condition, capital and character of the potential borrower.
70
Rate of returns and cost: This measures the average income return for each of the
most productive assets of the firm. Also, the average cost yield for each liability and
capital accounts. These are found in the balance sheet. It assists management to
determine the investments which are most profitable depicting how effective the
SACCO has invested its productive resources. The ―ideal‖ target recommended by
the WOCCU is to maintain costs between 3.5-5% of average total assets. Society
may feel that following liberal policy may result in more bad debts and more cost on
the funds blocked by liberal credit. This may prompt a society to switch over to tight
policy to overcome the bad debts and also to reduce the cost involved in advancing
credit. Before the SACCO makes final decision on changing policy, it has to
consider the benefits and costs involved in effecting the change. In case the benefits
exceed the costs in the new policy, that is, liberal to tight or vice versa, it would be
economical to embrace change. However, if the costs exceed the benefits from the
new policy, it is advisable to continue with the existing policy. The bottom line of
final decision is the rate of return of a given policy.
Liquidity: relates to cash needed for withdrawals. PEARLS analyses liquidity from
three perspectives; total, reserves and unutilised funds. The WOCCU ideal target of
total reserves is to maintain a minimum of 20% of the deposit savings in liquid
accounts. SACCOs are required to maintain a reserve of the amount equivalent to
10% savings deposits. The reserves could be channelled toward future payment of
dividends or interests on members‘ deposits should need arise. Idle liquid funds are
non-earning liquidities. The WOCCU ideal target is to reduce the percentage of
these liquidities to as close to zero as possible. Cash flows mapping is very
important in ensuring sufficient liquidity in the society. The cash outflows and
71
inflows should be evaluated to make sure cash inflows exceed cash outflows. In case
cash outflow is more than the inflows, a firm will mostly encounter liquidity
problem. To enhance efficiency of cash management, collections and disbursements
should be well managed and monitored frequently. In case of payables, a society
should conserve its cash resources by making arrangements with its suppliers to set
due dates of their bills to match with society‘s period of peak receipts especially
during second payment of tea proceeds. Synchronisation of cash outflows and
inflows will facilitate greater utilisation of cash resources.
Signs of growth: this measures percentage change between current and past year
performances. The items include: total assets, loans deposits, external credit shares,
institutional capital and members. If a SACCO is not growing, then it is
recapitalising itself, especially when inflation keeps rising. Each of the
characteristics examined relate to the society‘s management. Furthermore, SASRA
rates the management based on administrative skills, market flexibility. It also
assesses the internal control systems, that can make detection of a firm‘s financial
problems easy (World Council of Credit Unions [WOCCU], 2014).
The Balanced Scorecard is another measure of performance. It has a set of targets
and results encompassing four dimensions of performance. The dimensions include:
financial, customers, internal processes and innovation (Lal, 2008). Its main purpose
is to achieve firm‘s objectives. In formulating their objectives, various stakeholders
are taken into account and include workers, contractors, clients, community and the
stakeholders. They have different competing wants. The firm has to balance these
competing wants. Members depend on a SACCO to maintain their investments.
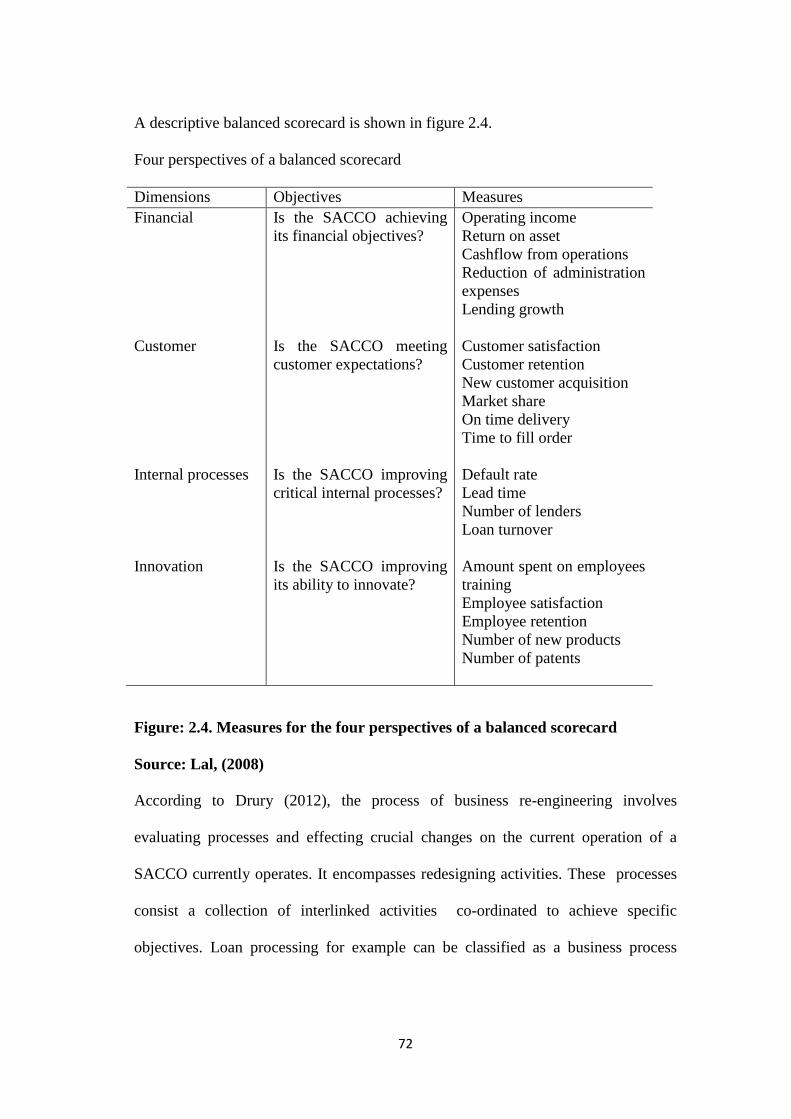
72
A descriptive balanced scorecard is shown in figure 2.4.
Four perspectives of a balanced scorecard
Dimensions Objectives Measures
Financial
Customer
Internal processes
Innovation
Is the SACCO achieving
its financial objectives?
Is the SACCO meeting
customer expectations?
Is the SACCO improving
critical internal processes?
Is the SACCO improving
its ability to innovate?
Operating income
Return on asset
Cashflow from operations
Reduction of administration
expenses
Lending growth
Customer satisfaction
Customer retention
New customer acquisition
Market share
On time delivery
Time to fill order
Default rate
Lead time
Number of lenders
Loan turnover
Amount spent on employees
training
Employee satisfaction
Employee retention
Number of new products
Number of patents
Figure: 2.4. Measures for the four perspectives of a balanced scorecard
Source: Lal, (2008)
According to Drury (2012), the process of business re-engineering involves
evaluating processes and effecting crucial changes on the current operation of a
SACCO currently operates. It encompasses redesigning activities. These processes
consist a collection of interlinked activities co-ordinated to achieve specific
objectives. Loan processing for example can be classified as a business process
73
comprising separate activities relating to receiving loan application, analysing
applicants and disbursing loans. Business process re-engineering is aimed at
improving key processes in a SACCO by focusing on simplification, reduction of
cost, improving quality and enhancing customer satisfaction. The processes of
SACCOs should be automated so that economy, efficiency and effectiveness can be
achieved.
SACCOs make their financial decision by comparing the rate of return of various
investments within the country. If rates of return from a given investment are larger,
they will allocate their funds to that kind of investment. Return arbitrage refers to the
process of moving funds from one investment to the other to take advantage of
higher investment yields (Imungi, 2013). However, SACCOs assume a risk when
they invest in any project because the returns are not guaranteed. SACCOs can
reduce risk by investing in more than one business entity.
2.5 Research Gap
From the literature available, it appears that there is no single factor which influence
business performance of firms. Macro and micro environmental factors have an
impact on business performance. According to Mwatu (2015), external funding
could cause financial difficulties if misallocated whereas internal funding is
positively correlate with profitability. The literature review showed that SACCO
capital adequacy framework and funds allocation strategy research have been low
despite the contribution of SACCOs towards business performance (Onyango,
2013).

74
It is evident from the findings that there exist several gaps in the current
management of deposit-taking SACCOs in Kenya. From all the outcomes in the
seven variables, it indicated that the capacity to sustain deposit taking business has a
bleak future. The declining trend of licensed SACCOs supports these results. The
vision 2030 may be achieved, if the seven variables and others not included in the
study are addressed.
2.6 Summary
This chapter discusses the literature review and theoretical framework on financial
management. The literature reviews capital adequacy framework of deposit-taking
SACCOs. It elaborates factors contributing to the prudent financial management of
DTS.
The empirical evidence gives out prior studies carried out on deposit-taking societies
locally and externally. Studies have been undertaken to establish the factors that
affect SACCO performance. The factors that contributed to slow growth of SACCO
ranged from corporate governance and issues of management to non-remittance of
funds In the past, management of cooperative societies in Africa has been a point of
interest to many researchers. It is a gateway to reduce poverty in the rural areas
(Ngaira, 2014). The SACCOs have been struggling with inadequate financial
resources. Even though the resources are scarce, the management has been
misallocating them to wrong ventures. These have resulted in losses to the members
and the general public due to factors including corruption, nepotism, fraud, agency
problems and political interference.

75
Deposit-taking SACCO is a new business venture in Kenya. The government started
it in 2010. However, there is no research in the literature available relating to capital
adequacy framework of DTS. It is on this basis that this study attempted to find out
if capital adequacy framework has had any impact on the DTS operations and
performance (Wallace & Naser, 1995). If the DTS is having problem in managing
their resources, then they have to adhere to prudent financial management practices.
Table 2.1 shows a summary of literature reviewed and the knowledge gaps
identified.

76
Table 2.1: Summary of Research Gaps
Authors
Focus of Study
Findings
Research gaps
Wong.J.et.al
(2015)
Mosongo,
(2013)
Chumo.J.
(2013)
Gweyi and
Karanja
(2013)
Mpiira.et.al
(2013)
Kivuvo and
Olweny (2014)
Nimalathasan
(2014)
Determinants of the
performance of banks
in Hong Kong.
Financial innovation and
financial performance
among SACCOs in
Nairobi county.
The effects of regulatory
compliance on
the financial performance
of deposit taking
SACCOs in South Rift
region in Kenya.
The effects of
financial leverage on
financial performance of
SACCOs in Kenya.
Factors influencing
participation of
households in SACCO
activities in Uganda.
Altman Z score model as
determinant of corporate
bankruptcy.
The capital structure and
its impact on profitability
of listed manufacturing
companies in Sri Lanka.
The effects of
Structure-Conduct
-performance on
Performance was
Positive.
Financial innovation
improves financial
performance.
Regulatory compliance
improves financial
performance.
It established that firm
size, growth rate and
liquidity affect
performance.
Increase in incomes
and distance from
SACCOs hinder
members participation.
It was established that
as external financing
increases there is a high
chance of bankruptcy.
Debt-equity is
positively related to all
profitability ratios.
The study focused on cost
efficiency and ignored
managerial capability.
This study sought to fill
the research gap by
including managerial
capability.
The study focused on
financial innovation.
Funds allocation
strategy was not taken into
account.
The study only evaluated
on regulatory
compliance. Risk
management was ignored.
The study ignored
portfolio selection.
The study did not take
credit
management into account.
Strict credit management
can hinder households
participation.
The study did not consider
internal financing.Using
internal funds reduce
bankruptcy among
SACCOs.
The study ignored the
contribution of external
funds to financial
performance
Source: Researcher (2018)

77
CHAPTER THREE
RESEARCH METHODOLOGY
3.1 Introduction
This chapter elucidates the methodology used in conducting the study. In this
section, the research design, population, data collection and analysis methods are
included. Primary and secondary data were used to achieve the intended purpose of
the research. Questionnaires were used to collect data from CEOs, Financial
managers and Credit managers from all the SACCOs. The study investigated the
effects of capital adequacy framework and funds allocation strategy on financial
performance.
3.2 Research Philosophy
This research adopted positivism philosophy because the concept of positivism
relates to the philosophical stances of natural scientists. The philosophy gives
preference to utilizing observable social realities research; the conclusion of which
can be law-like generalisation akin to those produced by physical and natural
scientists.
According to Blaxter, Hughes and Tight (2013), positivism posits that the
procedures of social sciences should mirror the natural science ones. Researchers
should be impartial in the research. Positivist researches aim to elucidate findings
that lead to control and predictability. It is a predominant method of understanding
the social world as evident from its usage.
Data collected from DTS in Kenya were credible. An existing theory was used to
develop hypotheses which were tested and confirmed. Where the hypothesis is

78
refuted, further development of the theory may ensue (Saunder, Lewis & Thornhill,
2016). The hypotheses developed may result in collection of facts for subsequent
hypothesis testing. The researcher embraced good judgment by being systematic
and methodical in data collection and analysis.
3.3 Research Design
This study employed descriptive survey design which was quantitative. Descriptive
research design was adopted because the study covered an examination of capital
adequacy framework, funds allocation strategy and business performance of deposit
taking SACCOs in Kenya. Descriptive survey facilitated the establishment of
relationship of events or processes without affecting the purpose of reporting the
situation as they are. This design was appropriate for the study since it would allow
an opportunity for exploratory and descriptive data. This form of data was crucial in
understanding capital adequacy framework and its influence on business
performance of DTS in Kenya. Descriptive research design involves measurement of
study variables as they naturally exist.
According to Beri (2015), it outlines methods for conducting particular studies. The
approach to be used should be specified. These designs are categorised into
exploratory, descriptive and causal research. This study used descriptive research
where factors including age, sex, level of educational, and income were considered
and intended to answer the what, who, where, when and how‖ of the study.
Surveys were conducted in this study to describe record, analyse and interpret
conditions that either exist or existed without any manipulation further considering
79
existing relationships, opinions, on-going processes and developing trends including
past events that influence current conditions.
According to Aldridge and Levine (2012), social surveys involve overall decisions
on collection and analysis of data. Social survey strategy encompasses collection of
the same information about all the cases in a sample. According to Martz (2013),
survey involves systematic observation or interviewing. Respondents were asked the
questions to which they responded based on the answer options available. The
survey was standardised so that consistent answers to the respective questions can be
drawn.
Kothari (2014) defined research design as setting the conditions for collecting and
analysing data such that it is relevant to the economy. Reliability, completeness and
clarity of findings are important to successful research. The most appropriate
techniques should thus be employed to realise the desired goal. This section
elucidates the study design and methodology: data sources, collection and census
survey, organisations and mode of conducting the study including the tools of
analysis used (Peria & Schumuler, 2013). The unit of analysis for this study is
Deposit Taking SACCOs (DTS) in Kenya. DTS are accredited by SASRA to take
deposits from their members annually. The research objective was to evaluate the
capital adequacy framework and funds allocation strategy on financial performance
of Deposit Taking SACCOs in Kenya.
The research design primarily ensured that the findings of the study concisely met
the research objectives. A good research design should reduce the research process
by segmenting the research work into manageable parts, effectively making research

80
objectives projects. The design should minimise partiality and maximise the
reliability. Similarly, it should yield maximum information and provide opportunity
for inclusion of vast aspects of a problem. The research tools specific to the unit of
analysis was customised and used. To attain better findings, two or more research
methods were used. This would cater for the information missed by one method.
Research methodology is a systematic way of solving the research problem. It is a
scientific way of doing research in a given environment (Strandberg, 2012). It
involves collecting, analysing and reporting data; that is the structure used in
collection, analysis and interpretation of information to elicit meaningful answers to
research objectives. The research methodology included two aspects; collection of
data and analysis of data. Primary data was collected through surveys,
questionnaires and structured interviews and thereafter cross-checked against
secondary data available from SASRA records, especially deposits taking SACCOs
profiles and financial statements.
3.4 Target Population
The target population was 164 DTS in Kenya which were licensed in 2016. In the
study, unit of analysis was deposit taking SACCOs in Kenya since they are thriving
to improve financial performance for their members. The intended participants were
the chief executive officers, financial managers and credit officers of the SACCOs in
Kenya. Construct and concept of the study are internal financing, external financing,
portfolio selection, credit management, risk management, managerial capability and
capital adequacy framework respectively. The questionnaires were issued to the
chief executive officers from all licensed SACCOs. County cooperative officers and
81
research assistants assisted in issuing them and also ensuring that all the
questionnaires are filled and returned. Selection of three officers was justified by
the fact that they are responsible for running financial matters of the societies.
Appendix VI shows a list of respondents,
3.5 Sampling Frame
The intended census survey turned out to be a sample survey. A representative of the
population responded to the study. This prompted sampling technique to be used in
this survey. Sampling frame comprises a list of all units of the population (Mutai,
2013). The preparation of a sampling frame is sometimes a major practical problem.
The frame should be updated and be free from errors of omission and duplication of
sampling units. It represents a list of components wherefrom the sample was actually
drawn. For this study, the sampling frame comprised 164 deposit taking SACCOs
licensed in 2016 as shown in Appendix VII.
3.6 Sample Size and Sampling Technique
According to Saunders, Lewis and Thornhill (2016), generalisations about
population from collected data from any probability sample are based on statistical
probability. The larger the size of a sample, the lower the error likelihood in
generalisation. Probability sampling balances the accuracy of outcomes with time
and resources expended to collect, check and analyse data. The sample size choice
hinges on the confidence required in the data, the acceptable margin errors and the
total population size.
According to Mutai (2013), a sample size for a survey is decided at the planning
stage together with the sample design. Resources and time dedicate the sample size

82
to be used. The purpose of sampling is to economise on the use of resources in
gathering information. It is uneconomic to obtain data on the whole of the
population of interest and so information is collected from only a part of the
population (sample). The sample is designed to produce outcomes which are
generalisable from the sample to the whole population under consideration.
Saunders, Lewis and Thornhill (2016) noted that with a population of less than
10,000 a smaller sample size can be employed without affecting the accuracy. This
is known as adjusted minimum sample size. The formula below was used to obtain
adjusted minimum sample. According to Mugenda and Mugenda (2003), where an
estimate of the proportion in the target population assumed to have the elements of
interest say 50% is available it should be used. Its level of significance is 5%. Then,
the sample size can be determined as follows:
n =2
2
s
pqZ= 384
05.0
)5.0)(5.0(96.12
2
Where n= the desired sample size
Z= the standard normal deviate at the required confidence level
P= the proportion in the target population estimated to have characteristics
being measured
q=1-p
s= the level of statistical significance set
If the target population is less than 10,000, the required sample size will be smaller
and is calculated using the formula below (Mugenda & Mugenda, 2003).

83
115
335.3
384
164
3831
384
164
13841
384
)1(1
N
n
nni
ni =115
The respondents were 111 and pilot survey was conducted on 12 SACCOs. The total
SACCOs participated in the survey were 123.These were good representative of the
population.
3.7 Data Collection Instruments
A survey questionnaire was employed to collect primary data on perception,
experience and views on deposits taking SACCOs on the capital adequacy
framework and funds allocation strategy process on financial performance. It
comprised three sections, A B and C which all respondents completed. The
respondents comprised CEOs, finance managers and credit officers of SACCOs.
Each respondent should give his/her opinions independently. The responses were
separated to enable evaluation of differences in opinion on capital adequacy
framework and funds allocation strategy on financial performance, notably
regarding challenges faced in achieving business obligations. The summary of the
items included in the questionnaire are as follows:
SECTION A: This evaluated the deposit taking SACCOs environment. The data
from the survey should reflect the current capacity levels. These included: the
respondent education levels, membership levels, deposit level, common bond and
funds allocation strategy. SECTION B: Purposed to obtain the perceptions of
deposit taking SACCO respondents who had witnessed capital adequacy framework
implementation and funds allocation strategy process.

84
SECTION C: This section was designed to determine the effects of financial
performance measures. Pre-testing of the questionnaires with a pilot group was
carried out to detect weaknesses in design and instrumentation and also to train the
research team.
SASRA (2016) indicates that 164 SACCOs in Kenya were accredited to take
deposits from their membership in 2016. The researcher conducted a census research
on 164 DTS in Kenya. The respondents were 111 out of 152 SACCOs. The twelve
SACCOs participated in pilot survey. There were 164 deposit taking SACCOs as per
SASRA licensing report 2016. The researcher and his team elicited views from the
respondents. The respondents were assisted in filling the survey questionnaire by
research assistants.
3.8 Pilot Test Study
Questionnaires are subjected to pilot testing to ascertain that they are reliable before
issuing to intended respondents (Sekaran & Bougie, 2016). A pilot test was
conducted to ensure that the intended objectives of the study are attained through the
questionnaire. Twelve deposit-taking SACCOs were used to measure the reliability
and validity of the instrument. Purposive sampling was used to select twelve
SACCOs from deposit-taking SACCOs licensed in 2016. Hertzog (2016) posited
that samples as small as 10 to 15 per group are sufficient for pilot testing. In case of
Isaac and Michael (1995), 10 to 30 participants are adequate for pilot testing. The
costs, time and reality of the exercise are taken into account. In this study, twelve
participants were within the recommended range. The category was not part of the
target population and this guaranteed that those participating in the pilot study were
85
not included in the actual sample. The participants were either CEOs, Finance
managers or Credit officers.
This made it possible to get required information from the relevant employees. All
of them had financial knowledge which was the area of interest in the research.
According to Saunder, Lewis and Thornhill (2016), pilot-testing ensures that
questionnaire is refined such that problems in answering them are reduced or
eliminated. Cronbach‘s alpha was employed to establish internal consistency and
reliability of the questionnaire based on the pilot test results. The Cronbach‘s alpha
was more than 0.700 which indicated that the variables were reliable.
3.9 Measurement of Variables
This study involved measurement of eight variables namely: internal financing,
external financing, portfolio selection, credit management, risk management,
managerial capability, funds allocation and financial performance. The capital
adequacy framework for this study include; internal financing, external financing,
portfolio selection, credit management, risk management and managerial capability.
Likert scale (1-5) was used for each of the statements corresponding to the different
parameters of the capital adequacy framework. The moderating variable for this
study was the funds allocation which had two types of allocations. Deposit-taking
SACCOs were required to state how they allocate their funds to various
undertakings. A five point Likert scale was utilised for each of the statements
corresponding to the six parameters of the financial performance. The financial
performance is measured by PEARLS system (WOCCU, 2014).
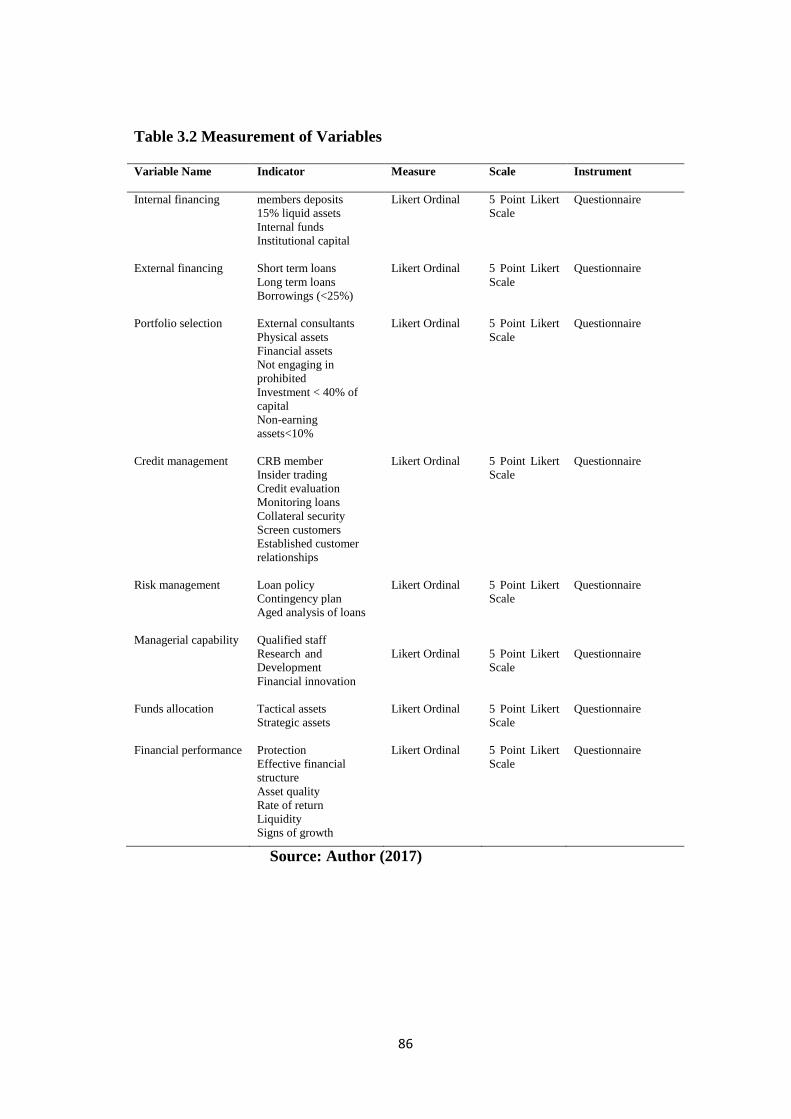
86
Table 3.2 Measurement of Variables
Variable Name
Indicator
Measure
Scale
Instrument
Internal financing
External financing
Portfolio selection
Credit management
Risk management
Managerial capability
Funds allocation
Financial performance
members deposits
15% liquid assets
Internal funds
Institutional capital
Short term loans
Long term loans
Borrowings (<25%)
External consultants
Physical assets
Financial assets
Not engaging in
prohibited
Investment < 40% of
capital
Non-earning
assets<10%
CRB member
Insider trading
Credit evaluation
Monitoring loans
Collateral security
Screen customers
Established customer
relationships
Loan policy
Contingency plan
Aged analysis of loans
Qualified staff
Research and
Development
Financial innovation
Tactical assets
Strategic assets
Protection
Effective financial
structure
Asset quality
Rate of return
Liquidity
Signs of growth
Likert Ordinal
Likert Ordinal
Likert Ordinal
Likert Ordinal
Likert Ordinal
Likert Ordinal
Likert Ordinal
Likert Ordinal
5 Point Likert
Scale
5 Point Likert
Scale
5 Point Likert
Scale
5 Point Likert
Scale
5 Point Likert
Scale
5 Point Likert
Scale
5 Point Likert
Scale
5 Point Likert
Scale
Questionnaire
Questionnaire
Questionnaire
Questionnaire
Questionnaire
Questionnaire
Questionnaire
Questionnaire
Source: Author (2017)
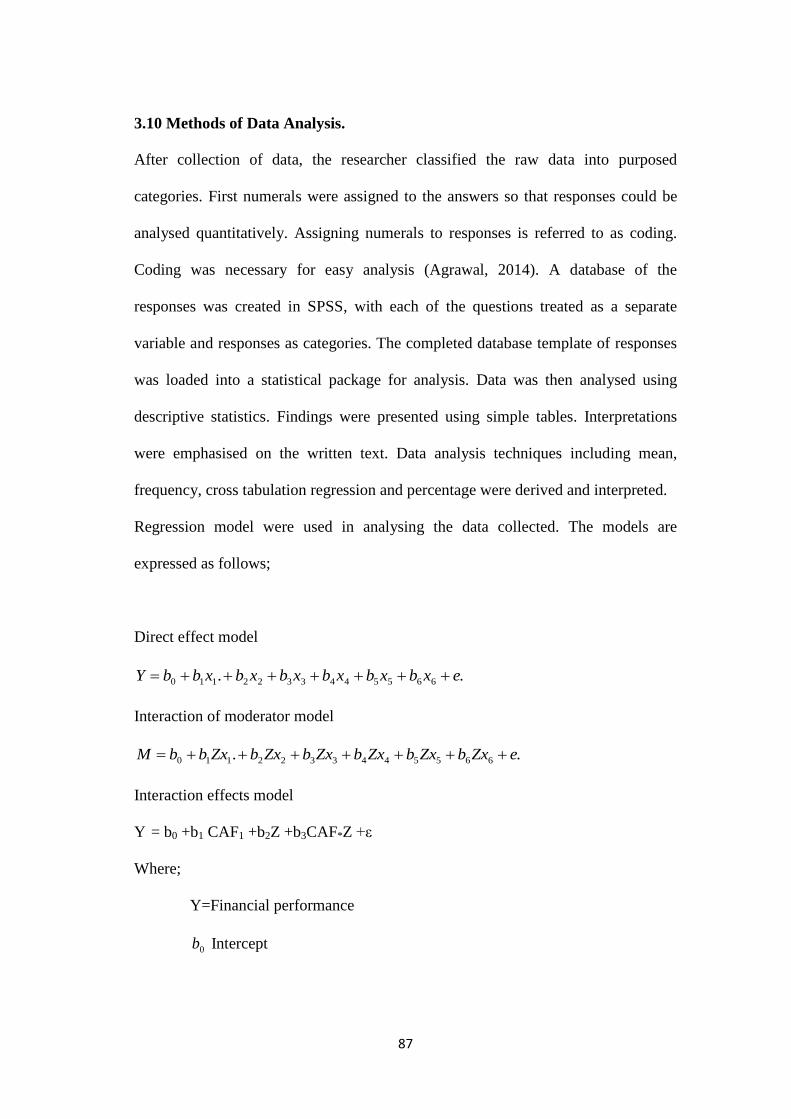
87
3.10 Methods of Data Analysis.
After collection of data, the researcher classified the raw data into purposed
categories. First numerals were assigned to the answers so that responses could be
analysed quantitatively. Assigning numerals to responses is referred to as coding.
Coding was necessary for easy analysis (Agrawal, 2014). A database of the
responses was created in SPSS, with each of the questions treated as a separate
variable and responses as categories. The completed database template of responses
was loaded into a statistical package for analysis. Data was then analysed using
descriptive statistics. Findings were presented using simple tables. Interpretations
were emphasised on the written text. Data analysis techniques including mean,
frequency, cross tabulation regression and percentage were derived and interpreted.
Regression model were used in analysing the data collected. The models are
expressed as follows;
Direct effect model
.. 6655443322110 exbxbxbxbxbxbbY
Interaction of moderator model
.. 6655443322110 eZxbZxbZxbZxbZxbZxbbM
Interaction effects model
Y = b0 +b1 CAF1 +b2Z +b3CAF*Z +ε
Where;
Y=Financial performance
0b Intercept
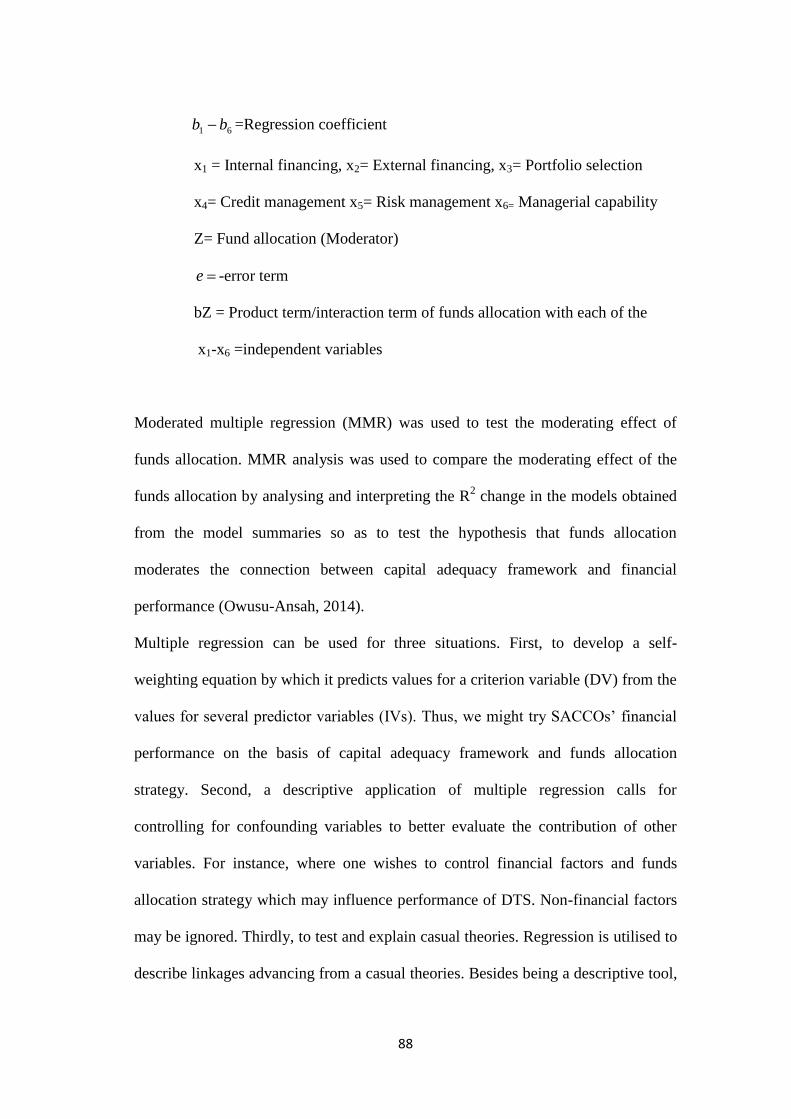
88
61 bb =Regression coefficient
x1 = Internal financing, x2= External financing, x3= Portfolio selection
x4= Credit management x5= Risk management x6= Managerial capability
Z= Fund allocation (Moderator)
e -error term
bZ = Product term/interaction term of funds allocation with each of the
x1-x6 =independent variables
Moderated multiple regression (MMR) was used to test the moderating effect of
funds allocation. MMR analysis was used to compare the moderating effect of the
funds allocation by analysing and interpreting the R2 change in the models obtained
from the model summaries so as to test the hypothesis that funds allocation
moderates the connection between capital adequacy framework and financial
performance (Owusu-Ansah, 2014).
Multiple regression can be used for three situations. First, to develop a self-
weighting equation by which it predicts values for a criterion variable (DV) from the
values for several predictor variables (IVs). Thus, we might try SACCOs‘ financial
performance on the basis of capital adequacy framework and funds allocation
strategy. Second, a descriptive application of multiple regression calls for
controlling for confounding variables to better evaluate the contribution of other
variables. For instance, where one wishes to control financial factors and funds
allocation strategy which may influence performance of DTS. Non-financial factors
may be ignored. Thirdly, to test and explain casual theories. Regression is utilised to
describe linkages advancing from a casual theories. Besides being a descriptive tool,
89
it is also used as an inference tool to test hypotheses and to estimate population
values (Cooper & Schindler, 2015).
3.10.1 Coefficient of Determination
This is used to predict the values of dependent variable absent of any knowledge of
independent variables; the best estimate the estimated dependent variable. Its mean
and standard error of estimate is the different between the actual and the predicted
values of dependent variable (Belsey, Kuh & Welsch, 1980). This testing helps in
discovering if the regression equation is more effective predictive device than the
means of the dependent variables.
3.10.2 Correlation Analysis
Where two variables are interrelated in a way that changes in one create
corresponding changes in the other, the variables are deemed correlated. Measure of
correlation is called coefficient of correlation. The Karl Pearson‘s method is most
widely used in practice. It is known as Pearsonian coefficient of correlation. The
coefficient of correlation is denoted by the symbol r. Correlation presents the
relationship among various variables of the study. Some variables have strong
relationship whereas others have weak relationship. Their relationships are
explained as follows (Cameron, 2004).

90
Table 3.3: Guidelines for Strength of Relationship
Value of r Strength of the Relationship
-1 to- 0.5 or +1 to 0.5 Strong
-0.5 to -0.3 or 0.5 to 0.3 Moderate
-0.1 to -0.3 or 0.1 to 0.3 Weak
Source: Field (2015)
3.10.3 Normality Test
When analysing data in multiple regression model, it is a requirement that data
should be normally distributed. Normality test was ascertained by using skewness
and kurtosis statistics. Skewness shows how distribution of values deviates from
symmetry around the mean. A value of zero means that the distribution was
symmetric, whereas a positive skewness indicated a greater number of smaller
values and a negative value indicates a greater number of larger values. In case of
kurtosis values near zero indicated the shape of data was close to normal. A negative
value indicated a distribution that was more flat than normal. A positive value
indicates that was more peaked than normal. A value of a negative 2 is adequate for
statistical analysis for both skewness and kurtosis (Gujarati & Porter, 2009).
3.10.4 Multicollinearity Test
The study used variable inflation factor (VIF) and Tolerance statistics to test
multicollinearity. Field (2015) states that multicollinearity exists when VIF is greater
than 10 and tolerance is less than 0.1. When the degree of association of independent
variables is high, it means multicollinearity may exist among the independent

91
variables. If it exists, it means that the model could include either variable,
interchangeably.
3.10.5 ANOVA Test
This was used to ascertain if the model could significantly predict outcome. This
technique tests the differences among the means of the populations by examining the
variation within each of the samples, relative to the amount of variation between the
samples (Kothari, 2014). ANOVA consists of evaluations that provide information
about the levels of variability within a regression model and forms a basis for test of
significance.
3.10.6 Factor Analysis
According to Sekaran (2013), it helps reduce the number of variables to meaningful
interpretable and manageable set of factors. In case a questionnaire would like
measure seven variables of internal financing, external financing, portfolio selection,
credit management, risk management, managerial capability and funds allocation
with 3 questions tapping for each. When 21 items are analysed, 7 factors with the
right variables loading on each factor will be the outcome. This confirms that the
variables were measured correctly.
3.10.7 Testing of Hypotheses
In analysing data and also testing hypotheses of the study, descriptive and inferential
methods and SPSS 23 version statistical software were employed. Test established
the relationship between independent variables and financial performance. Rejection
region method was used when determining the significant value of the independent
variables and dependent variable. It has two options either accept the null hypothesis
or otherwise. Where the computed test value statistic is greater than the tabulated
92
value, it indicates that it is significant and the null hypothesis (H0) is rejected at a
level of significance (α) that is with confidence coefficient (1-α). Tabulated value is
critical or significant value at a given level of significance (α). However, in case the
computed value of test statistic is less than the tabulated (critical) value, we say that
it is not significant (Penman, 2016). It means that the difference between the sample
statistic and corresponding parameter-value under H0, is resultant of fluctuations of
sampling. It indicates that the data sampled does not provide satisfactory evidence
against the null hypothesis. It may therefore be accepted at α level of significance.
Pearson correlation test was used in testing hypotheses. The study established that
the null hypotheses were rejected. Since the p-value (0.000) is less than 0.05 level of
significance. It shows that the independent variables and moderating variable
influence financial performance of deposit taking SACCOs in Kenya.

93
Table 3.4: Tests for Hypotheses
Objectives
Hypothesis
Type tests
Interpretation
To examine the
influence of internal
financing on financial
performance of deposit
taking SACCOs in
Kenya
To determine the
influence of external
financing on financial
performance of deposit
taking SACCOs in
Kenya
To establish the
influence of portfolio
selection on financial
performance of deposit
taking SACCOs in
Kenya
To examine the
influence of credit
management on financial
performance of deposit
taking SACCOs in
Kenya
To assess the influence
of risk management on
financial performance of
deposit taking SACCOs
in Kenya
To evaluate the influence
of managerial capability
on financial performance
of deposit taking
SACCOs in Kenya
To evaluate the
moderating effect of
funds allocation towards
financial performance of
deposit taking SACCOs
in Kenya
H01:Internal financing has
no significant influence on
financial performance of
deposit taking SACCOs in
Kenya
H02:External financing has
no significant influence on
financial performance of
deposit taking SACCOs in
Kenya
H03:Portfolio selection has
no significant influence on
financial performance of
deposit taking SACCOs in
Kenya
H04:Credit management
has no significant
influence on financial
performance of deposit
taking SACCOs in Kenya
H05:Risk management has
no significant influence on
financial performance of
deposit taking SACCOs in
Kenya
H06:Managerial capability
has no significant
influence on financial
performance of deposit
taking SACCOs in Kenya
H07:Fund allocation has no
moderating effect on
capital adequacy
framework towards
financial performance of
deposit taking SACCOs in
Kenya
Pearson
correlation
Linear
regression
analysis
Pearson
correlation
Linear
regression
analysis
Pearson
correlation
Linear
regression
analysis
Pearson
correlation
Linear
regression
analysis
Pearson
correlation
Linear
regression
analysis
Pearson
correlation
Linear
regression
analysis
Pearson
correlation
Linear
regression
Analysis
If p-value < 0.05 reject
null hypothesis if p-
value>0.05 fail to reject
the null hypothesis
If p-value < 0.05 reject
null hypothesis if p-
value>0.05 fail to reject
the null hypothesis
If p-value < 0.05 reject
null hypothesis if p-
value>0.05 fail to reject
the null hypothesis
If p-value < 0.05 reject
null hypothesis if p-
value>0.05 fail to reject
the null hypothesis
If p-value < 0.05 reject
null hypothesis if p-
value>0.05 fail to reject
the null hypothesis
If p-value < 0.05 reject
null hypothesis if p-
value>0.05 fail to reject
the null hypothesis
If p-value < 0.05 reject
null hypothesis if p-
value>0.05 fail to reject
the null hypothesis
Source: Author (2017)
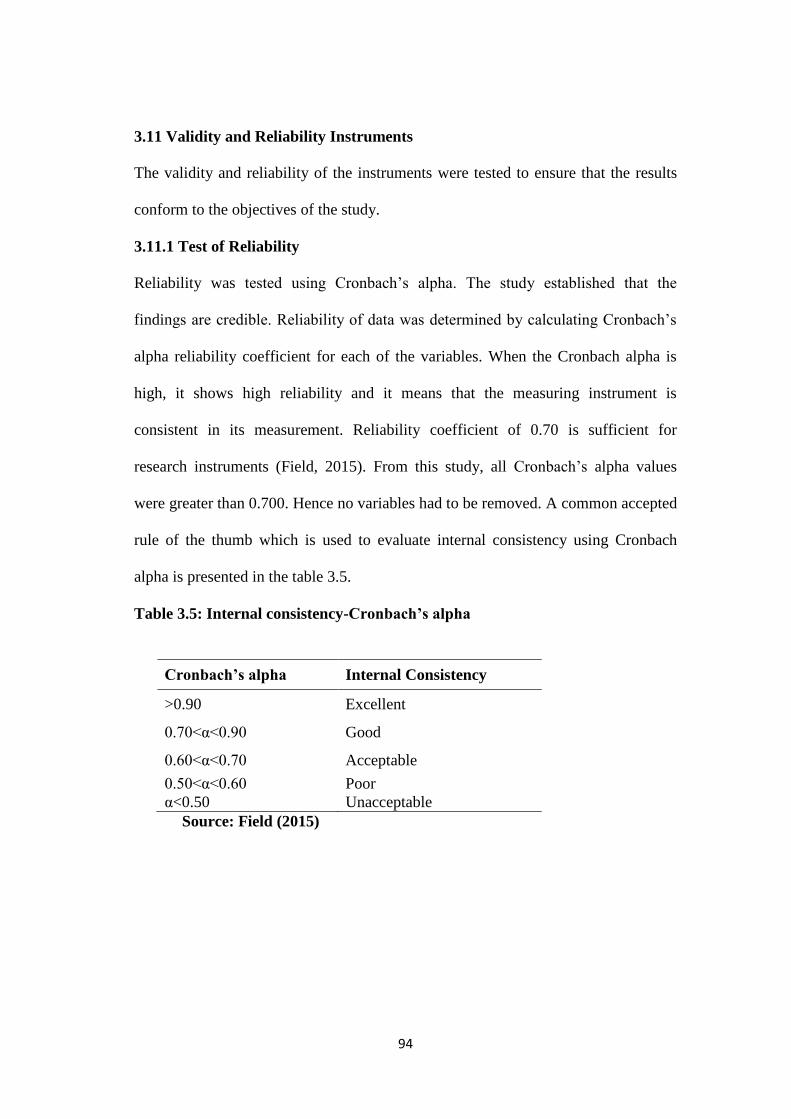
94
3.11 Validity and Reliability Instruments
The validity and reliability of the instruments were tested to ensure that the results
conform to the objectives of the study.
3.11.1 Test of Reliability
Reliability was tested using Cronbach‘s alpha. The study established that the
findings are credible. Reliability of data was determined by calculating Cronbach‘s
alpha reliability coefficient for each of the variables. When the Cronbach alpha is
high, it shows high reliability and it means that the measuring instrument is
consistent in its measurement. Reliability coefficient of 0.70 is sufficient for
research instruments (Field, 2015). From this study, all Cronbach‘s alpha values
were greater than 0.700. Hence no variables had to be removed. A common accepted
rule of the thumb which is used to evaluate internal consistency using Cronbach
alpha is presented in the table 3.5.
Table 3.5: Internal consistency-Cronbach’s alpha
Cronbach’s alpha Internal Consistency
>0.90 Excellent
0.70<α<0.90 Good
0.60<α<0.70 Acceptable
0.50<α<0.60 Poor
α<0.50 Unacceptable
Source: Field (2015)
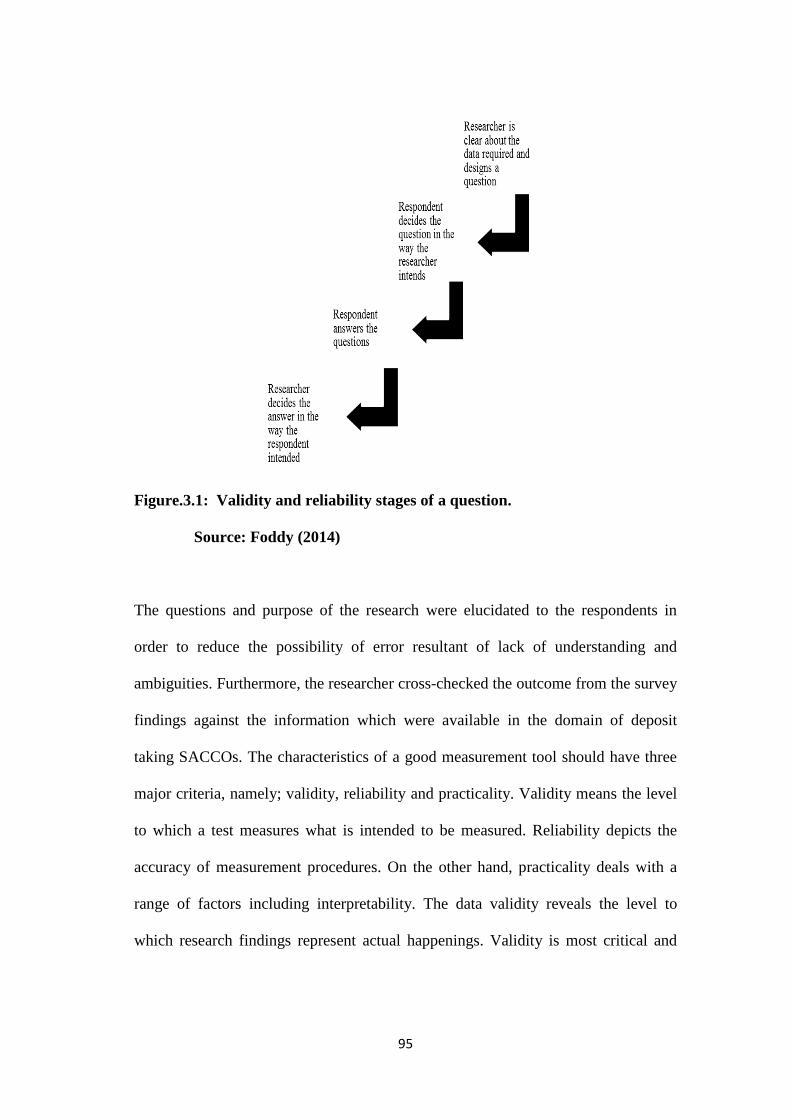
95
Figure.3.1: Validity and reliability stages of a question.
Source: Foddy (2014)
The questions and purpose of the research were elucidated to the respondents in
order to reduce the possibility of error resultant of lack of understanding and
ambiguities. Furthermore, the researcher cross-checked the outcome from the survey
findings against the information which were available in the domain of deposit
taking SACCOs. The characteristics of a good measurement tool should have three
major criteria, namely; validity, reliability and practicality. Validity means the level
to which a test measures what is intended to be measured. Reliability depicts the
accuracy of measurement procedures. On the other hand, practicality deals with a
range of factors including interpretability. The data validity reveals the level to
which research findings represent actual happenings. Validity is most critical and

96
indicates the degree to which instruments measure they are intended to measure
(Kothari, 2014). Data invalidity renders the research works worthless. Validity of
questionnaires depends on the honesty of the respondents when filling the
questionnaires and this study sought to minimise the risk of compromising the
validity of the data by pre-testing the questionnaire so that weaknesses could be
addressed before the actual survey is conducted. The researcher also explained the
questions and purpose of the research to the respondents in order to reduce the
possibility of errors resultant of misunderstanding the questions and ambiguities.
The information collected from the survey was cross checked against information
already existing in the domain of the deposit taking SACCOs.
At the beginning of the survey questionnaire, an introductory paragraph assures the
respondents of the anonymity of their identity responses and this contributed to the
data validity. In addition, triangulation was used to include three measures:
questionnaires, interviews and secondary data from financial statements and SASRA
reports (Sekaran, 2013). Measures are reliable to the level it supplies consistent
results and is focused on the degree to which a measurement is free of random error
and are concerned with the credibility of the findings. It is another important
characteristic that a good measurement tool should have. Reliability refers to the
consistency and the repeatability of the same results over time. It means that if the
same research is to be conducted by someone else, he or she would obtain the same
results, all other things kept constant. The data reliability and validity was enhanced
by predicting potential biases and errors and eliminating them early.
One danger is if the respondents know that the researcher is a competitor and elect to
distort their responses or refuse to take part in the study. This was mitigated by
97
assuring the respondents that the study was for academic purposes and confirmed
this by the cover letter which bore the university‘s logo as opposed to the SASRA
one.
Reliability was achieved by using same questionnaire on the same set of respondents
using same method. Pre-testing questionnaires were done to ensure there was no
problem in answering questions. Pre-testing surveys are very important when
designing questionnaires. Pilot surveys thus assist in stopping and reorganising the
main field work can be extremely difficult once the field work on the actual survey
has started. Any problem encountered was corrected before administering the
questionnaire to other respondents. This ensured greater reliability of the study.
Respondents were encouraged to be free when answering questions as the result
would be kept confidential. Time of filling questionnaire was chosen appropriately
so that the respondents‘ activities were not interfered with.
According to Mitchell (2015), there are three approaches to test reliability: test, re-
tests internal consistency and alternate form. This study embraced the three
approaches. The data collected were correlated with those from the same
questionnaire under similar conditions. Internal consistency was done by correlating
the responses to each question in the questionnaire with those of other questions in
the questionnaire and measured the consistency of responses across all the questions
from the questionnaire. To ascertain internal consistency of the study, Cronbach‘s
alpha was used and was more than 0.900 for all seven variables. This indicates that
the study had higher reliability. Another approach used in testing for reliability was
alternative form where check questions were invoked.
98
3.11.2 Testing for Validity
Internal validity was achieved in this study by ensuring that questionnaire measured
what was intended to measure. The questionnaire was supposed to establish the
relationship between capital adequacy framework and financial performance. The
relationship was moderated by funds allocation strategy (Osoro, 2015). The findings
showed that the independent variables influenced financial performance of deposit
taking SACCOs in Kenya. The concepts of validity involve the three types of
validity: content validity, criterion-related validity and construct validity. The
content validity was expressed through adequate coverage of literature review and
also making sure that the questions in the questionnaire were essential and useful.
This facilitates the achievement of the intended objectives.
3.12 Ethical Consideration
All the participants were informed about the research and its benefit. The
information and data provided by participants were used for research purposes only.
All the information collected was treated as highly confidential. The researcher
observed integrity and objectivity of the study to ensure quality by being open,
truthful and promoting accuracy.
99
CHAPTER FOUR
RESULTS AND DISCUSSIONS
4.1 Introduction
This chapter presents the results from the survey which were analysed and
interpreted based on the purpose of the study. Hypothesis test results are presented
and discussed. Questionnaires were issued to either CEOs, financial managers or
credit officers of deposit taking SACCOs who have knowledge in financial matters.
Reliability and validity of the study are discussed, along with various sensitivity
results. The chapter closes with a summary of the findings.
4.2 General information
Section A of the questionnaire related to broad information on the society. The
information included: the officials, the duration of SACCO operating deposit taking
business, membership, current net worth of the society and educational background
of officials.
4.2.1: Response Rate
The population targeted was the 164 licensed deposit taking SACCOs in Kenya in
2016. However, 12 SACCOs had restricted licenses for only six months (SASRA,
2016). A census survey was carried out of all 152 licensed SACCOs in Kenya
excluding 12 SACCOs which participated in pilot testing. 152 questionnaires were
sent to the deposit taking SACCOs in Kenya from which 111 filled questionnaires
were returned while 41 questionnaires were never returned. The response rate was
73%. Hager, Wilson, Pollack and Rooney (2013) and Babbie (2004) argued that a
response rate of 50% was acceptable to analyse and publish the findings.
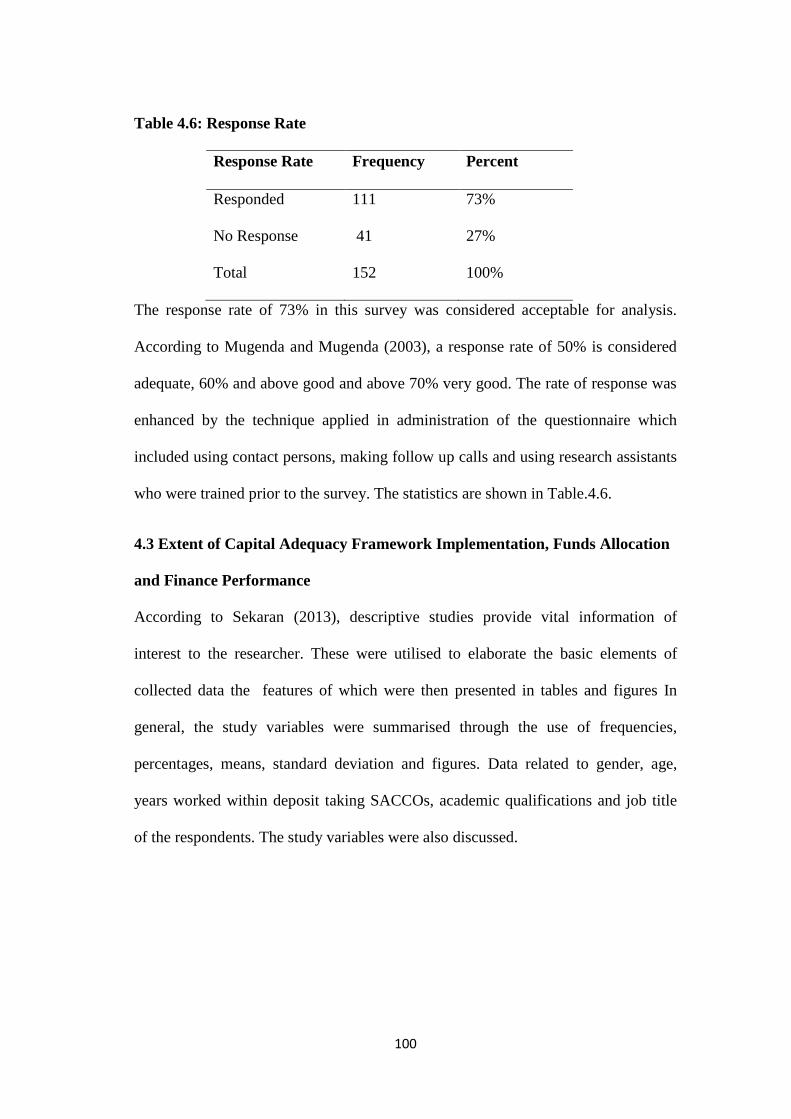
100
Table 4.6: Response Rate
Response Rate Frequency Percent
Responded 111 73%
No Response 41 27%
Total 152 100%
The response rate of 73% in this survey was considered acceptable for analysis.
According to Mugenda and Mugenda (2003), a response rate of 50% is considered
adequate, 60% and above good and above 70% very good. The rate of response was
enhanced by the technique applied in administration of the questionnaire which
included using contact persons, making follow up calls and using research assistants
who were trained prior to the survey. The statistics are shown in Table.4.6.
4.3 Extent of Capital Adequacy Framework Implementation, Funds Allocation
and Finance Performance
According to Sekaran (2013), descriptive studies provide vital information of
interest to the researcher. These were utilised to elaborate the basic elements of
collected data the features of which were then presented in tables and figures In
general, the study variables were summarised through the use of frequencies,
percentages, means, standard deviation and figures. Data related to gender, age,
years worked within deposit taking SACCOs, academic qualifications and job title
of the respondents. The study variables were also discussed.

101
4.3.1 Respondents Gender
Gender is included in the study so that balance view can be obtained from the
survey. Views differ depending on the contributors. If a survey has views from both
gender it will give a fair consideration. Respondents indicated their gender by
ticking against respective option of either male or female.
Table 4.7: Respondents’ Gender
Gender Frequency Percent
Male 83 74.8%
Female 28 25.2%
Total 111 100%
It was evident from the results that most of the respondents were male which
represented 74.8% whereas female represented 25.2%. The gender distribution
indicated that there was a balance in distribution of views collected from both male
and female. Even though the gender rule was not met. The findings confirmed what
Mckillop, Briscoe, McCarthy, Ward and Ferguson (2003) who found out that there
is gender imbalance in the Board of directors and management of credit union.
4.3.2 Age of the Respondents
Age in this study showed maturity and experience of respondents. It determined the
quality of information collected from the survey.
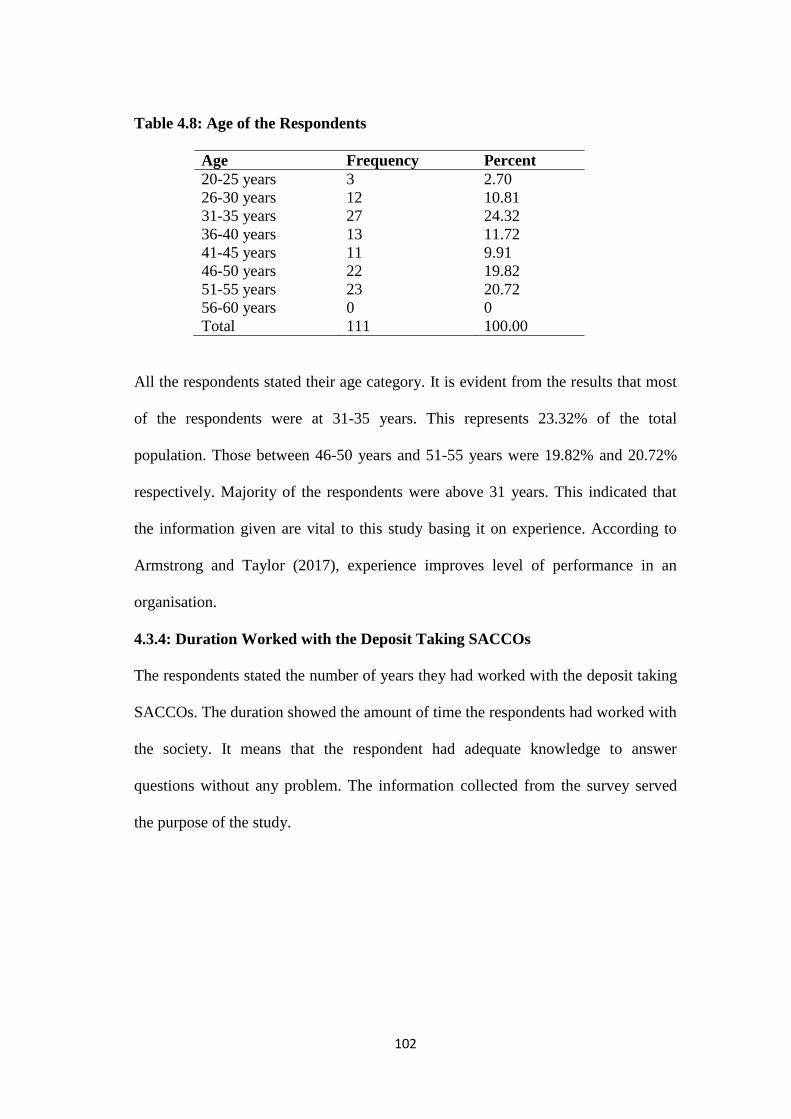
102
Table 4.8: Age of the Respondents
Age Frequency Percent
20-25 years 3 2.70
26-30 years 12 10.81
31-35 years 27 24.32
36-40 years 13 11.72
41-45 years 11 9.91
46-50 years 22 19.82
51-55 years 23 20.72
56-60 years 0 0
Total 111 100.00
All the respondents stated their age category. It is evident from the results that most
of the respondents were at 31-35 years. This represents 23.32% of the total
population. Those between 46-50 years and 51-55 years were 19.82% and 20.72%
respectively. Majority of the respondents were above 31 years. This indicated that
the information given are vital to this study basing it on experience. According to
Armstrong and Taylor (2017), experience improves level of performance in an
organisation.
4.3.4: Duration Worked with the Deposit Taking SACCOs
The respondents stated the number of years they had worked with the deposit taking
SACCOs. The duration showed the amount of time the respondents had worked with
the society. It means that the respondent had adequate knowledge to answer
questions without any problem. The information collected from the survey served
the purpose of the study.
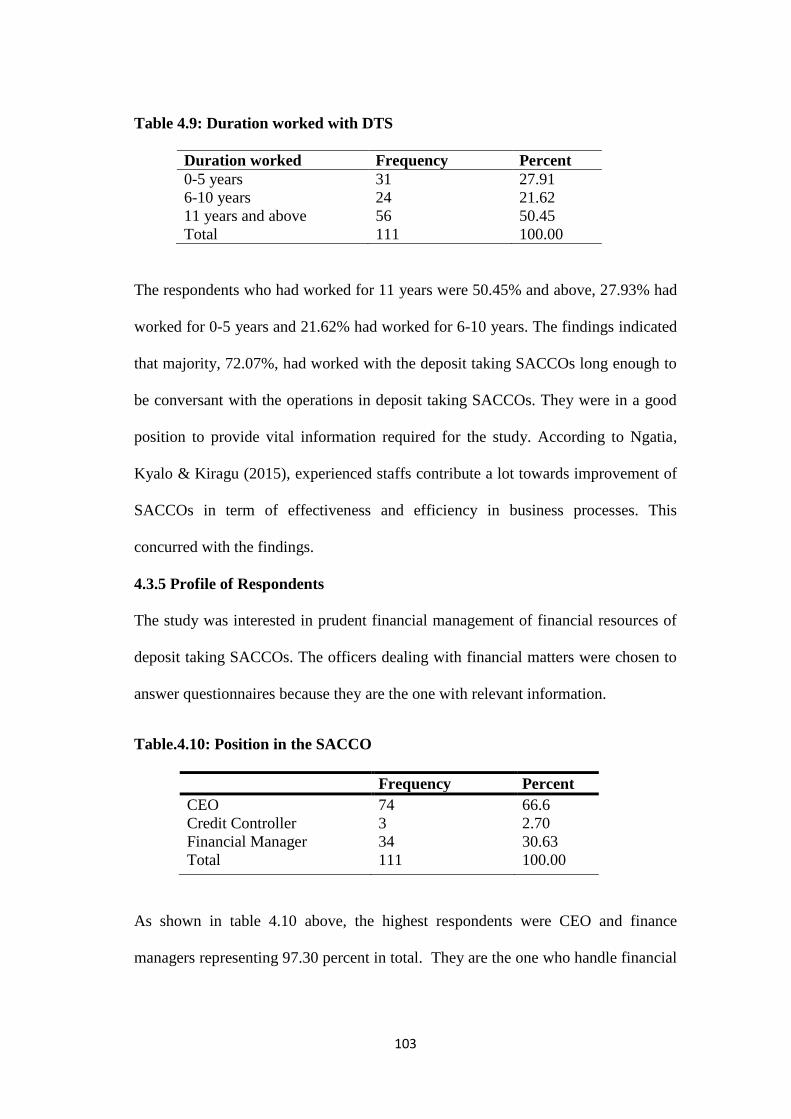
103
Table 4.9: Duration worked with DTS
Duration worked Frequency Percent
0-5 years 31 27.91
6-10 years 24 21.62
11 years and above 56 50.45
Total 111 100.00
The respondents who had worked for 11 years were 50.45% and above, 27.93% had
worked for 0-5 years and 21.62% had worked for 6-10 years. The findings indicated
that majority, 72.07%, had worked with the deposit taking SACCOs long enough to
be conversant with the operations in deposit taking SACCOs. They were in a good
position to provide vital information required for the study. According to Ngatia,
Kyalo & Kiragu (2015), experienced staffs contribute a lot towards improvement of
SACCOs in term of effectiveness and efficiency in business processes. This
concurred with the findings.
4.3.5 Profile of Respondents
The study was interested in prudent financial management of financial resources of
deposit taking SACCOs. The officers dealing with financial matters were chosen to
answer questionnaires because they are the one with relevant information.
Table.4.10: Position in the SACCO
Frequency Percent
CEO 74 66.6
Credit Controller 3 2.70
Financial Manager
Total
34
111
30.63
100.00
As shown in table 4.10 above, the highest respondents were CEO and finance
managers representing 97.30 percent in total. They are the one who handle financial
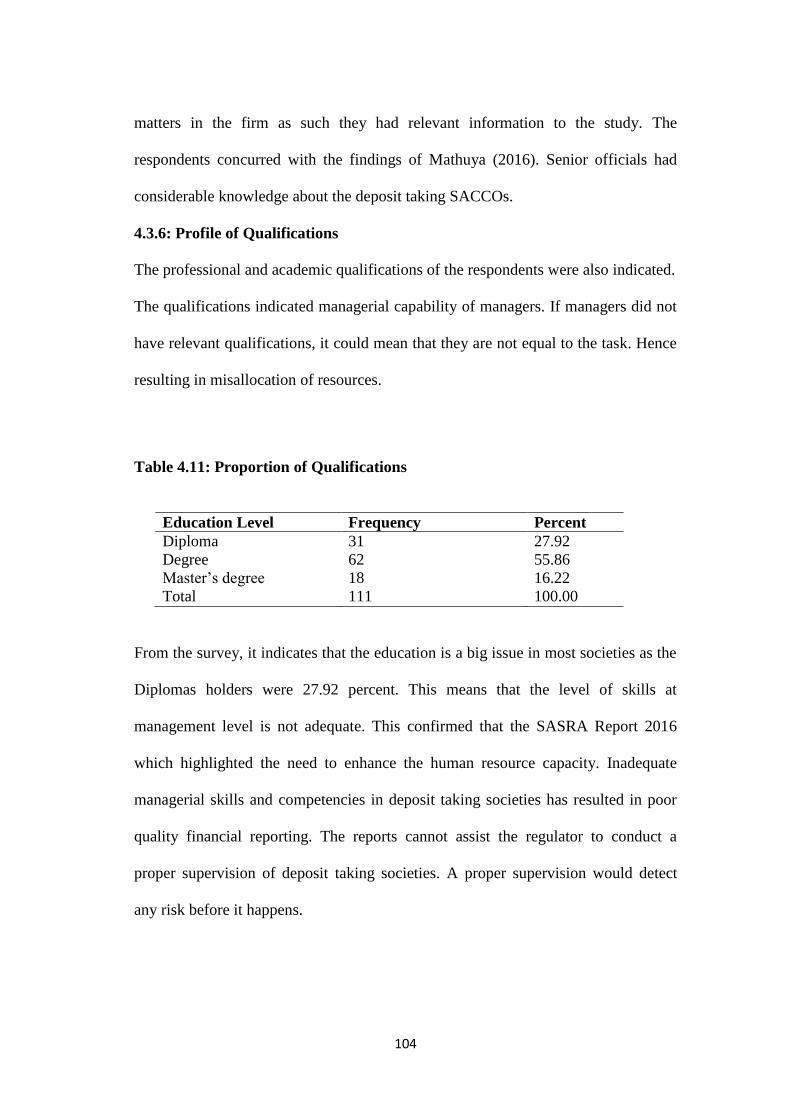
104
matters in the firm as such they had relevant information to the study. The
respondents concurred with the findings of Mathuya (2016). Senior officials had
considerable knowledge about the deposit taking SACCOs.
4.3.6: Profile of Qualifications
The professional and academic qualifications of the respondents were also indicated.
The qualifications indicated managerial capability of managers. If managers did not
have relevant qualifications, it could mean that they are not equal to the task. Hence
resulting in misallocation of resources.
Table 4.11: Proportion of Qualifications
Education Level Frequency Percent
Diploma 31 27.92
Degree 62 55.86
Master‘s degree
Total
18
111
16.22
100.00
From the survey, it indicates that the education is a big issue in most societies as the
Diplomas holders were 27.92 percent. This means that the level of skills at
management level is not adequate. This confirmed that the SASRA Report 2016
which highlighted the need to enhance the human resource capacity. Inadequate
managerial skills and competencies in deposit taking societies has resulted in poor
quality financial reporting. The reports cannot assist the regulator to conduct a
proper supervision of deposit taking societies. A proper supervision would detect
any risk before it happens.
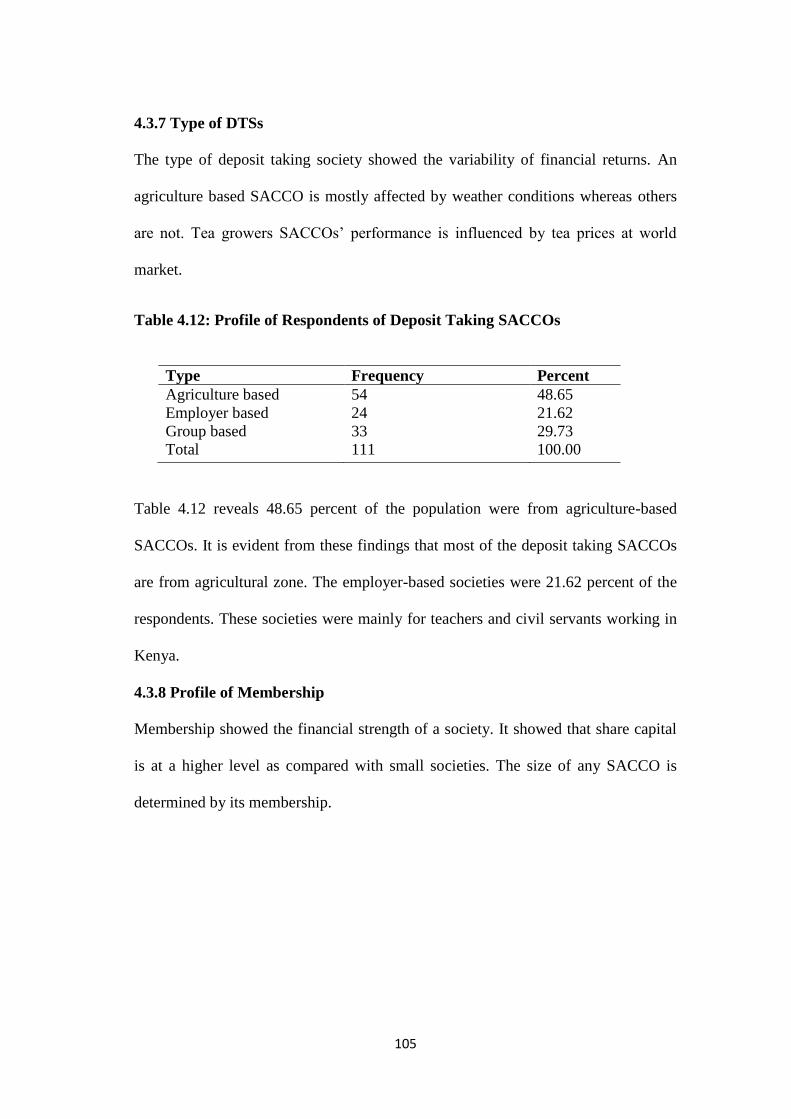
105
4.3.7 Type of DTSs
The type of deposit taking society showed the variability of financial returns. An
agriculture based SACCO is mostly affected by weather conditions whereas others
are not. Tea growers SACCOs‘ performance is influenced by tea prices at world
market.
Table 4.12: Profile of Respondents of Deposit Taking SACCOs
Type Frequency Percent
Agriculture based 54 48.65
Employer based 24 21.62
Group based
Total
33
111
29.73
100.00
Table 4.12 reveals 48.65 percent of the population were from agriculture-based
SACCOs. It is evident from these findings that most of the deposit taking SACCOs
are from agricultural zone. The employer-based societies were 21.62 percent of the
respondents. These societies were mainly for teachers and civil servants working in
Kenya.
4.3.8 Profile of Membership
Membership showed the financial strength of a society. It showed that share capital
is at a higher level as compared with small societies. The size of any SACCO is
determined by its membership.
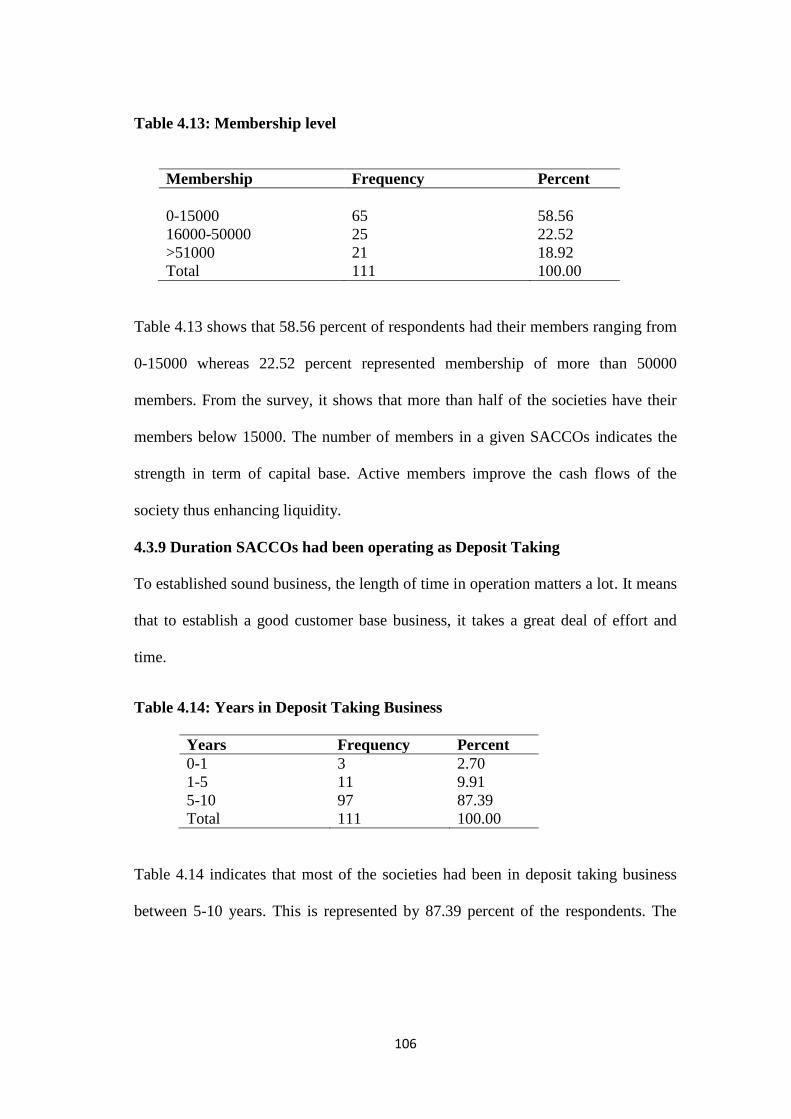
106
Table 4.13: Membership level
Membership Frequency Percent
0-15000
65
58.56
16000-50000 25 22.52
>51000 21 18.92
Total 111 100.00
Table 4.13 shows that 58.56 percent of respondents had their members ranging from
0-15000 whereas 22.52 percent represented membership of more than 50000
members. From the survey, it shows that more than half of the societies have their
members below 15000. The number of members in a given SACCOs indicates the
strength in term of capital base. Active members improve the cash flows of the
society thus enhancing liquidity.
4.3.9 Duration SACCOs had been operating as Deposit Taking
To established sound business, the length of time in operation matters a lot. It means
that to establish a good customer base business, it takes a great deal of effort and
time.
Table 4.14: Years in Deposit Taking Business
Years Frequency Percent
0-1 3 2.70
1-5 11 9.91
5-10
Total
97
111
87.39
100.00
Table 4.14 indicates that most of the societies had been in deposit taking business
between 5-10 years. This is represented by 87.39 percent of the respondents. The
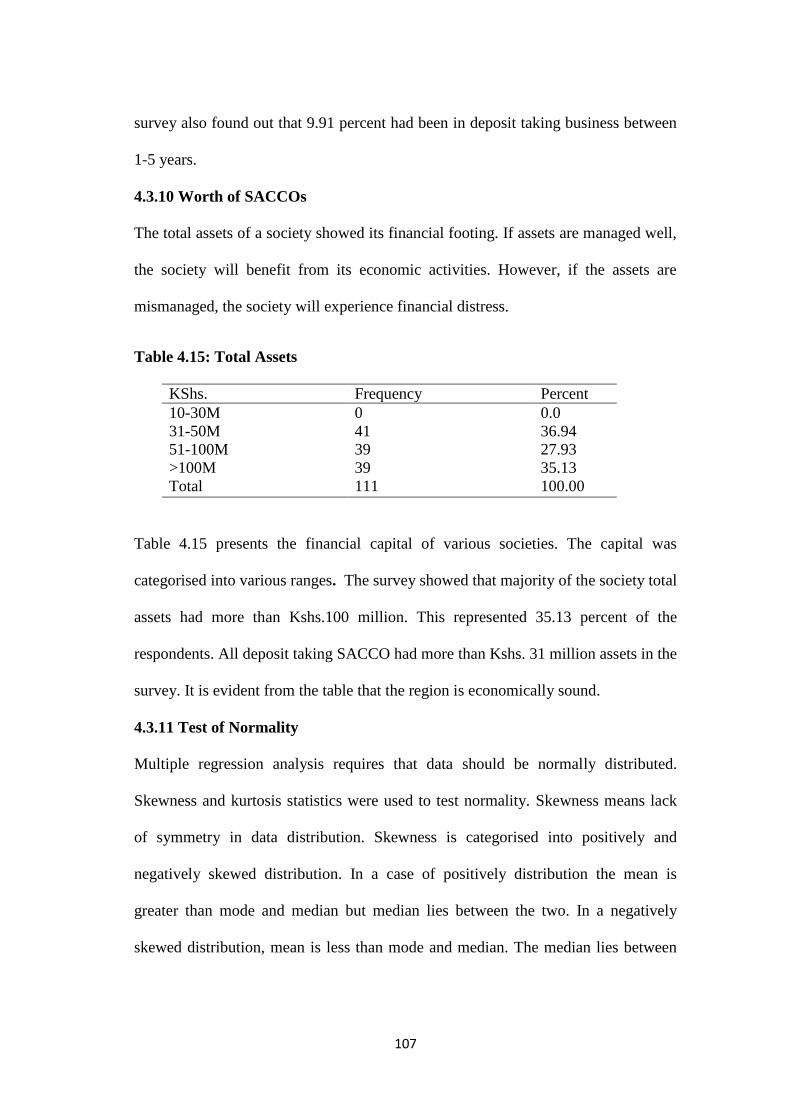
107
survey also found out that 9.91 percent had been in deposit taking business between
1-5 years.
4.3.10 Worth of SACCOs
The total assets of a society showed its financial footing. If assets are managed well,
the society will benefit from its economic activities. However, if the assets are
mismanaged, the society will experience financial distress.
Table 4.15: Total Assets
KShs. Frequency Percent
10-30M 0 0.0
31-50M 41 36.94
51-100M 39 27.93
>100M
Total
39
111
35.13
100.00
Table 4.15 presents the financial capital of various societies. The capital was
categorised into various ranges. The survey showed that majority of the society total
assets had more than Kshs.100 million. This represented 35.13 percent of the
respondents. All deposit taking SACCO had more than Kshs. 31 million assets in the
survey. It is evident from the table that the region is economically sound.
4.3.11 Test of Normality
Multiple regression analysis requires that data should be normally distributed.
Skewness and kurtosis statistics were used to test normality. Skewness means lack
of symmetry in data distribution. Skewness is categorised into positively and
negatively skewed distribution. In a case of positively distribution the mean is
greater than mode and median but median lies between the two. In a negatively
skewed distribution, mean is less than mode and median. The median lies between
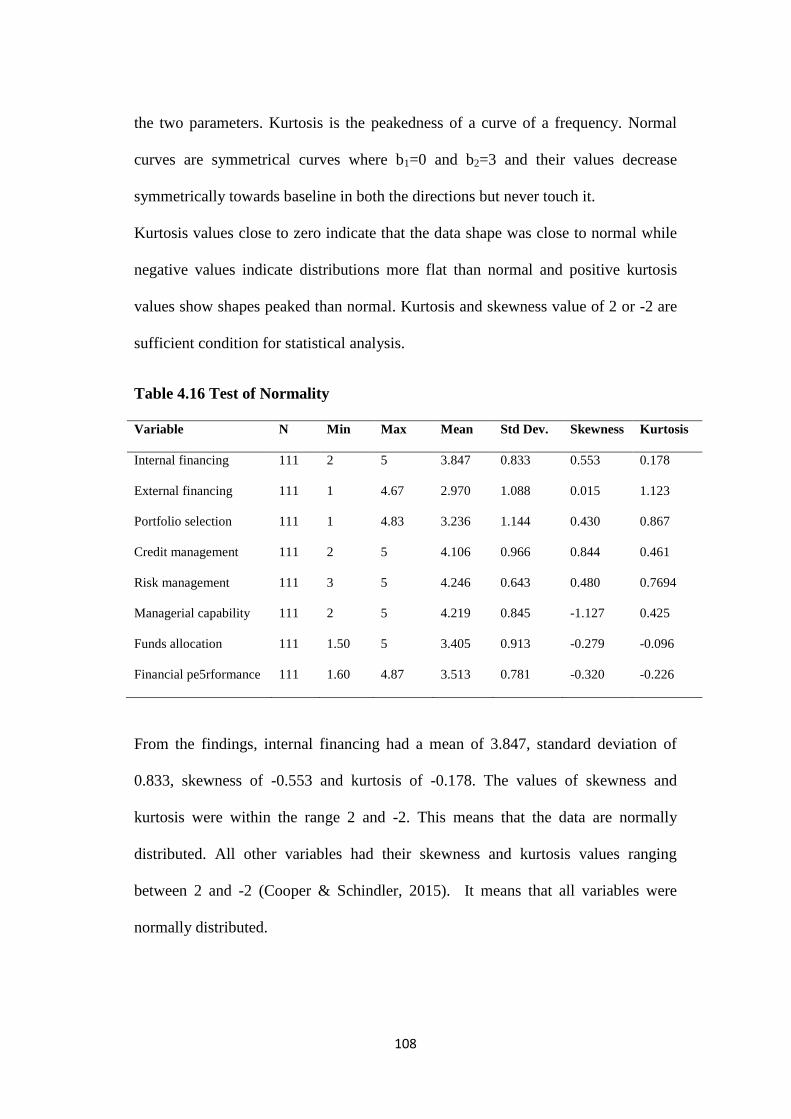
108
the two parameters. Kurtosis is the peakedness of a curve of a frequency. Normal
curves are symmetrical curves where b1=0 and b2=3 and their values decrease
symmetrically towards baseline in both the directions but never touch it.
Kurtosis values close to zero indicate that the data shape was close to normal while
negative values indicate distributions more flat than normal and positive kurtosis
values show shapes peaked than normal. Kurtosis and skewness value of 2 or -2 are
sufficient condition for statistical analysis.
Table 4.16 Test of Normality
Variable N Min Max Mean Std Dev. Skewness Kurtosis
Internal financing 111 2 5 3.847 0.833 0.553 0.178
External financing 111 1 4.67 2.970 1.088 0.015 1.123
Portfolio selection 111 1 4.83 3.236 1.144 0.430 0.867
Credit management 111 2 5 4.106 0.966 0.844 0.461
Risk management 111 3 5 4.246 0.643 0.480 0.7694
Managerial capability 111 2 5 4.219 0.845 -1.127 0.425
Funds allocation 111 1.50 5 3.405 0.913 -0.279 -0.096
Financial pe5rformance 111 1.60 4.87 3.513 0.781 -0.320 -0.226
From the findings, internal financing had a mean of 3.847, standard deviation of
0.833, skewness of -0.553 and kurtosis of -0.178. The values of skewness and
kurtosis were within the range 2 and -2. This means that the data are normally
distributed. All other variables had their skewness and kurtosis values ranging
between 2 and -2 (Cooper & Schindler, 2015). It means that all variables were
normally distributed.
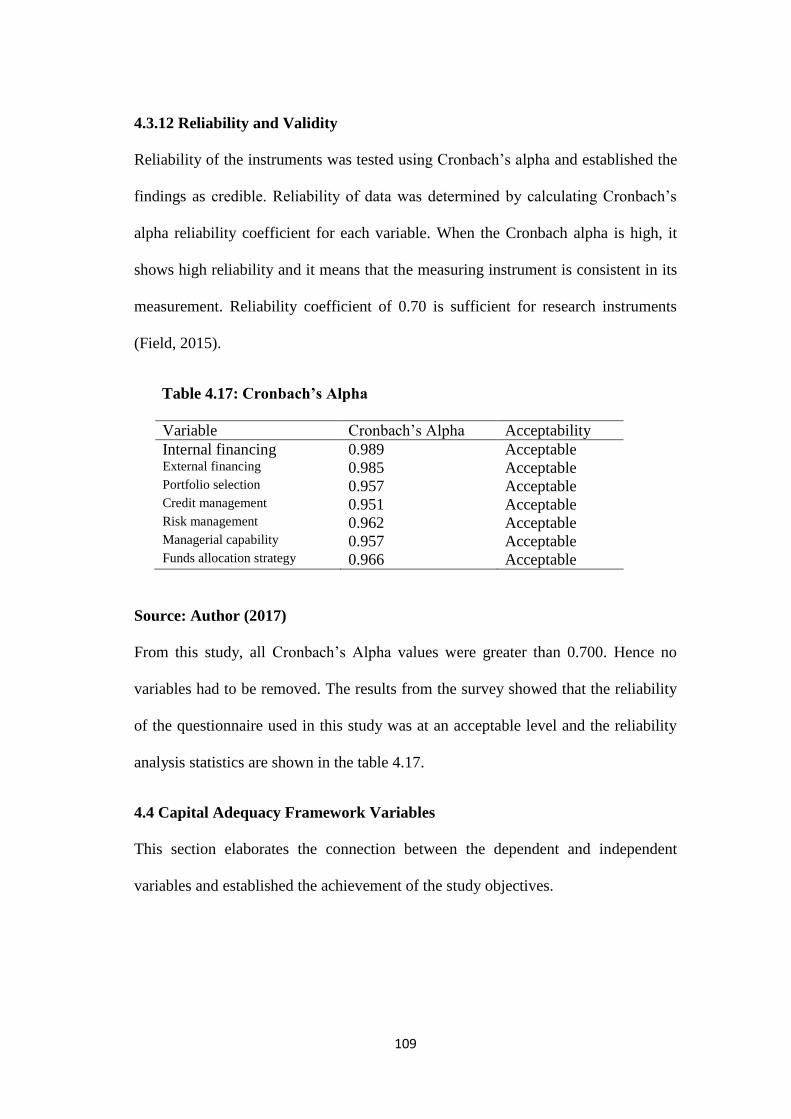
109
4.3.12 Reliability and Validity
Reliability of the instruments was tested using Cronbach‘s alpha and established the
findings as credible. Reliability of data was determined by calculating Cronbach‘s
alpha reliability coefficient for each variable. When the Cronbach alpha is high, it
shows high reliability and it means that the measuring instrument is consistent in its
measurement. Reliability coefficient of 0.70 is sufficient for research instruments
(Field, 2015).
Table 4.17: Cronbach’s Alpha
Variable Cronbach‘s Alpha Acceptability
Internal financing 0.989 Acceptable External financing 0.985 Acceptable Portfolio selection 0.957 Acceptable Credit management 0.951 Acceptable Risk management 0.962 Acceptable Managerial capability 0.957 Acceptable Funds allocation strategy 0.966 Acceptable
Source: Author (2017)
From this study, all Cronbach‘s Alpha values were greater than 0.700. Hence no
variables had to be removed. The results from the survey showed that the reliability
of the questionnaire used in this study was at an acceptable level and the reliability
analysis statistics are shown in the table 4.17.
4.4 Capital Adequacy Framework Variables
This section elaborates the connection between the dependent and independent
variables and established the achievement of the study objectives.

110
4.4.1: Internal Financing
The first objective of the study sought to establish the influence of internal financing
on financial performance of deposit taking SACCOs in Kenya.
Table 4.18: Internal Financing
Internal Financing 1 2 3 4 5 Mean SD
Are member deposits adequate 0 13 25 53 20 3.71 0.803
Maintaining the 15% liquid assets 0 9 42 26 34 3.77 0.963
Embracing internal financing 0 8 27 62 14 3.74 0.595
Insisting on institutional capital 0 10 0 68 33 3.97 0.667
Is share capital adequate 0 14 17 46 34 3.90 0.839
The respondents were required to fill in their views on five questions relating to
internal financing. The questions were categorised into (1) strongly disagree (2)
disagree (3) neutral (4) agree (5) strongly agree. The respondents were required to
rate the agreement or disagreement to various statements in relation to internal
financing. A question relating to member deposits was asked to find out if they are
adequate. A majority of respondents (53) strongly disagreed that member deposits
were not adequate to finance SACCOs‘ activities. This means SACCOs have to
resort to borrowing to ensure that their operations are not disrupted. Using only
member deposits will affect financial performance. In case of maintaining 15% of
their total assets in liquid assets, 47 respondents were not sure if their societies are
doing that. It was also the same to utilising institutional capital in financing their
projects. Majority of the respondents (49) were not sure if their societies were using
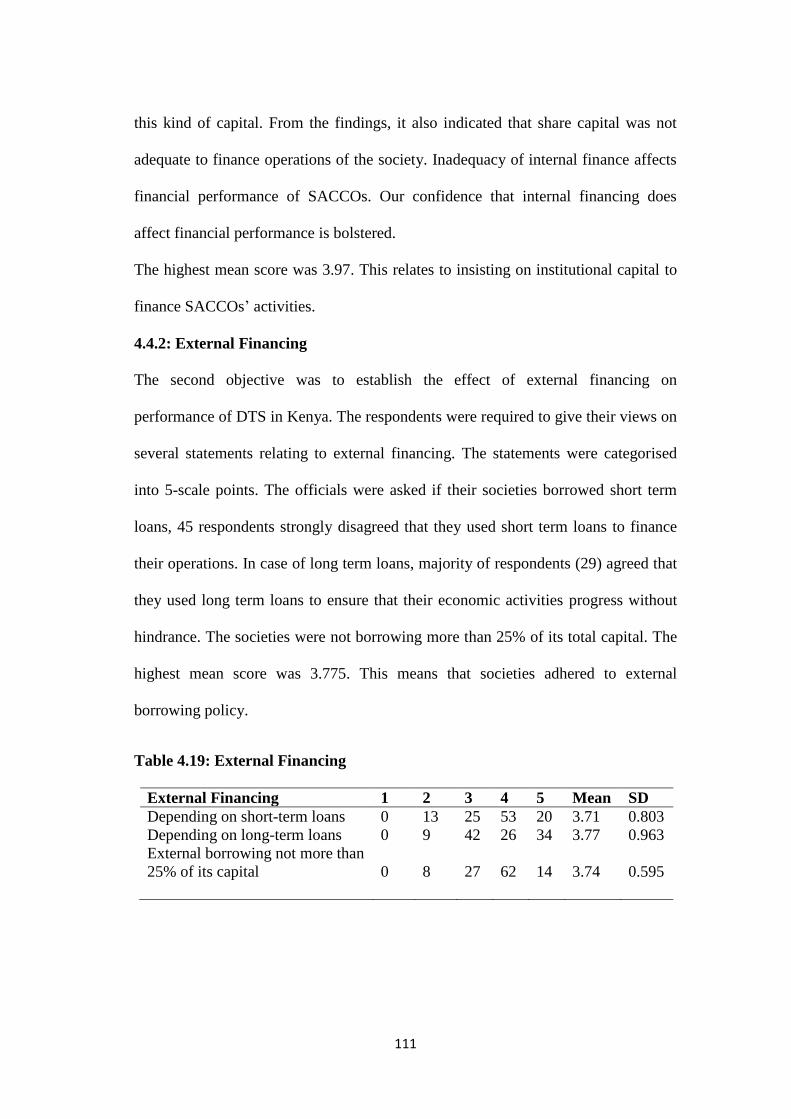
111
this kind of capital. From the findings, it also indicated that share capital was not
adequate to finance operations of the society. Inadequacy of internal finance affects
financial performance of SACCOs. Our confidence that internal financing does
affect financial performance is bolstered.
The highest mean score was 3.97. This relates to insisting on institutional capital to
finance SACCOs‘ activities.
4.4.2: External Financing
The second objective was to establish the effect of external financing on
performance of DTS in Kenya. The respondents were required to give their views on
several statements relating to external financing. The statements were categorised
into 5-scale points. The officials were asked if their societies borrowed short term
loans, 45 respondents strongly disagreed that they used short term loans to finance
their operations. In case of long term loans, majority of respondents (29) agreed that
they used long term loans to ensure that their economic activities progress without
hindrance. The societies were not borrowing more than 25% of its total capital. The
highest mean score was 3.775. This means that societies adhered to external
borrowing policy.
Table 4.19: External Financing
External Financing 1 2 3 4 5 Mean SD
Depending on short-term loans 0 13 25 53 20 3.71 0.803
Depending on long-term loans 0 9 42 26 34 3.77 0.963
External borrowing not more than
25% of its capital
0
8
27
62
14
3.74
0.595

112
4.4.3: Portfolio Selection
The third objective was to establish the influence of portfolio selection on financial
performance of DTS in Kenya. The study therefore sought to ascertain how the
societies select their ventures.
Table 4.20: Portfolio Selection
Portfolio selection 1 2 3 4 5 Mean SD
Depending on external consultant on
portfolio selection
22
34
22
33
0
2.595
1.243
Investing in physical assets 12 37 26 31 5 2.819 1.204
Investing in financial assets 4 22 14 35 36 3.694 1.487
Not engaging in prohibited business 14` 0 0 4 93 4.459 1.778
Does financial investment exceed
40% of capital or 5% of total deposit
28
14
28
32
9
2.820
1.730
Investment in non-earning assets
should be less than 10% of the total
assets in which land and buildings
should be less than 5% of the total
assets
20
30
16
20
25
3.00
2.091
From the table 4.20 results, it is evident that most of the societies did not engage in
prohibited business. Prohibited businesses are illegal. Illegality is costly. Hence, it
will affect financial performance adversely. Its mean score was 4.459. The financial
investment did not exceed 40% of total capital. It is a legal requirement that
SACCOs are not allowed to invest in more 40% of total capital in financial assets. It
is evident from the findings that most of the societies outsource financial
consultancy. A total of 33 respondents agreed that the societies engaged external
consultants in selecting portfolio. This indicates portfolio selection is crucial which
need serious consultation.
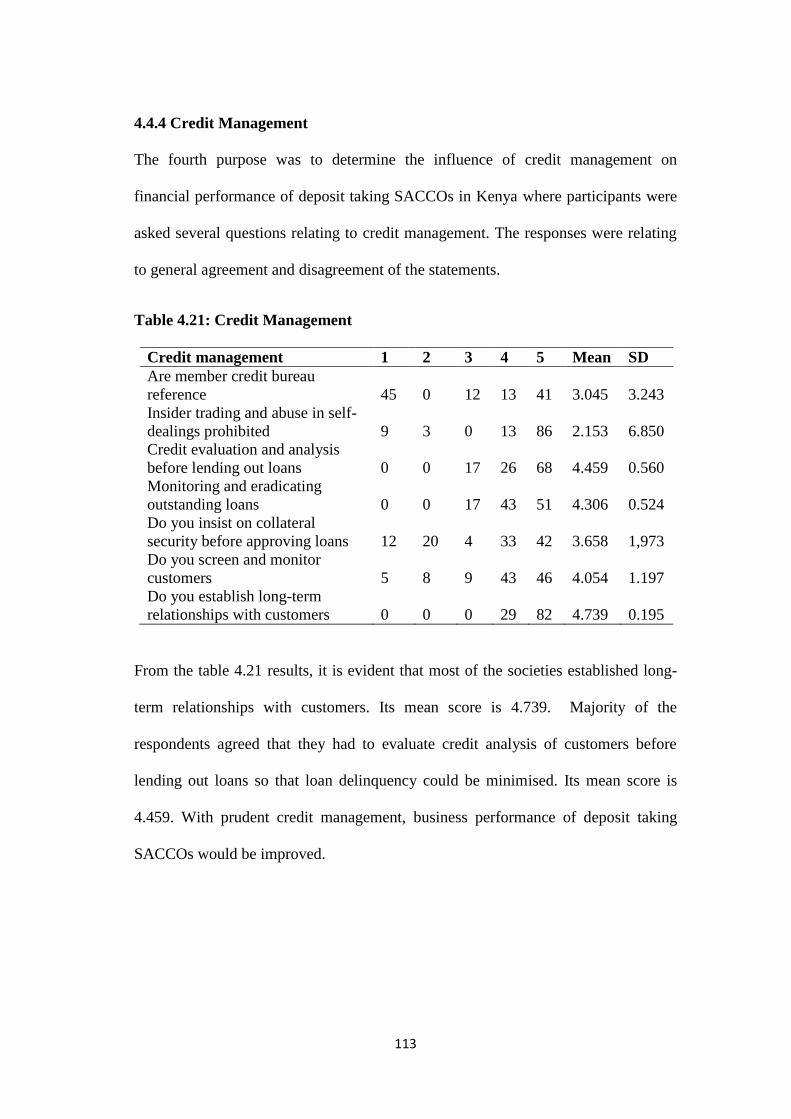
113
4.4.4 Credit Management
The fourth purpose was to determine the influence of credit management on
financial performance of deposit taking SACCOs in Kenya where participants were
asked several questions relating to credit management. The responses were relating
to general agreement and disagreement of the statements.
Table 4.21: Credit Management
Credit management 1 2 3 4 5 Mean SD
Are member credit bureau
reference
45
0
12
13
41
3.045
3.243
Insider trading and abuse in self-
dealings prohibited
9
3
0
13
86
2.153
6.850
Credit evaluation and analysis
before lending out loans
0
0
17
26
68
4.459
0.560
Monitoring and eradicating
outstanding loans
0
0
17
43
51
4.306
0.524
Do you insist on collateral
security before approving loans
12
20
4
33
42
3.658
1,973
Do you screen and monitor
customers
5
8
9
43
46
4.054
1.197
Do you establish long-term
relationships with customers
0
0
0
29
82
4.739
0.195
From the table 4.21 results, it is evident that most of the societies established long-
term relationships with customers. Its mean score is 4.739. Majority of the
respondents agreed that they had to evaluate credit analysis of customers before
lending out loans so that loan delinquency could be minimised. Its mean score is
4.459. With prudent credit management, business performance of deposit taking
SACCOs would be improved.
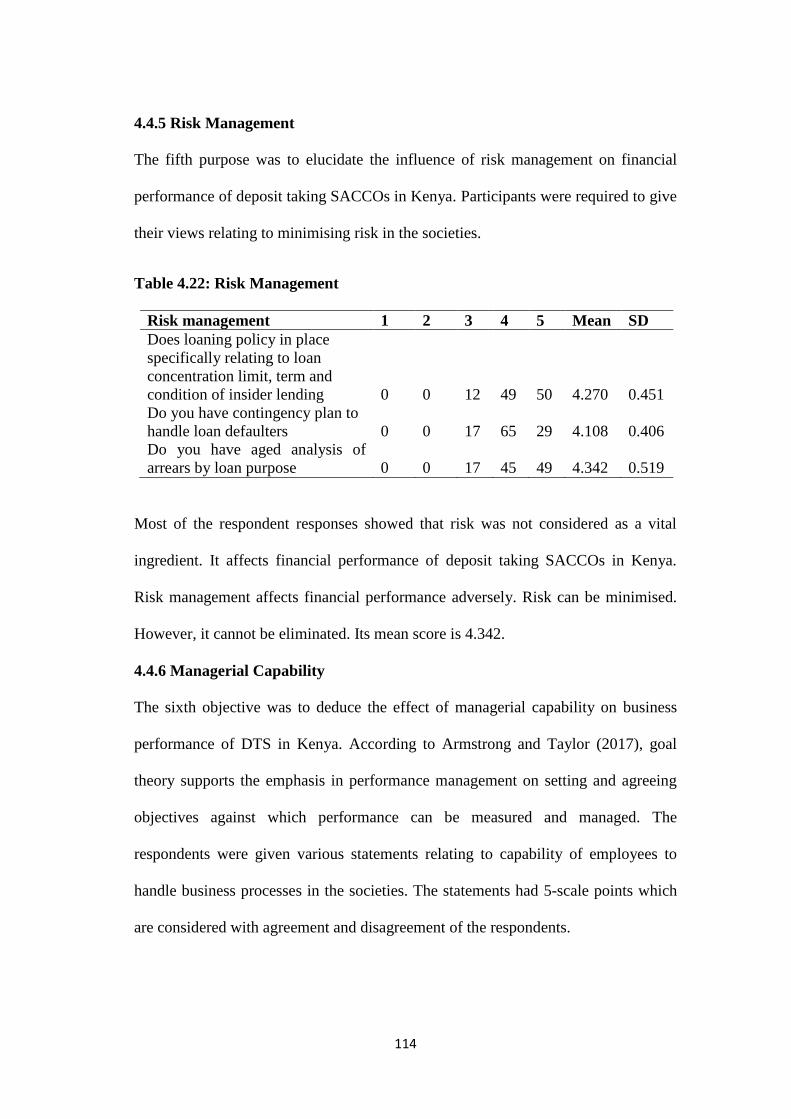
114
4.4.5 Risk Management
The fifth purpose was to elucidate the influence of risk management on financial
performance of deposit taking SACCOs in Kenya. Participants were required to give
their views relating to minimising risk in the societies.
Table 4.22: Risk Management
Risk management 1 2 3 4 5 Mean SD
Does loaning policy in place
specifically relating to loan
concentration limit, term and
condition of insider lending
0
0
12
49
50
4.270
0.451
Do you have contingency plan to
handle loan defaulters
0
0
17
65
29
4.108
0.406
Do you have aged analysis of
arrears by loan purpose
0
0
17
45
49
4.342
0.519
Most of the respondent responses showed that risk was not considered as a vital
ingredient. It affects financial performance of deposit taking SACCOs in Kenya.
Risk management affects financial performance adversely. Risk can be minimised.
However, it cannot be eliminated. Its mean score is 4.342.
4.4.6 Managerial Capability
The sixth objective was to deduce the effect of managerial capability on business
performance of DTS in Kenya. According to Armstrong and Taylor (2017), goal
theory supports the emphasis in performance management on setting and agreeing
objectives against which performance can be measured and managed. The
respondents were given various statements relating to capability of employees to
handle business processes in the societies. The statements had 5-scale points which
are considered with agreement and disagreement of the respondents.
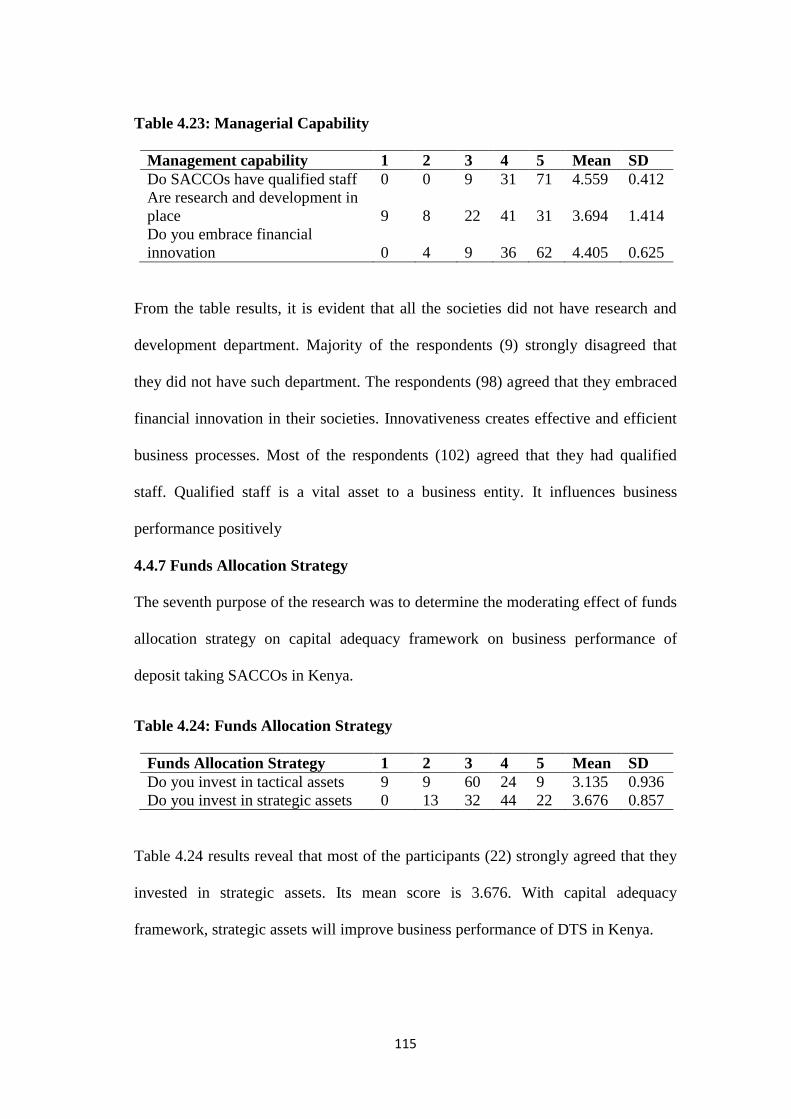
115
Table 4.23: Managerial Capability
Management capability 1 2 3 4 5 Mean SD
Do SACCOs have qualified staff 0 0 9 31 71 4.559 0.412
Are research and development in
place
9
8
22
41
31
3.694
1.414
Do you embrace financial
innovation
0
4
9
36
62
4.405
0.625
From the table results, it is evident that all the societies did not have research and
development department. Majority of the respondents (9) strongly disagreed that
they did not have such department. The respondents (98) agreed that they embraced
financial innovation in their societies. Innovativeness creates effective and efficient
business processes. Most of the respondents (102) agreed that they had qualified
staff. Qualified staff is a vital asset to a business entity. It influences business
performance positively
4.4.7 Funds Allocation Strategy
The seventh purpose of the research was to determine the moderating effect of funds
allocation strategy on capital adequacy framework on business performance of
deposit taking SACCOs in Kenya.
Table 4.24: Funds Allocation Strategy
Funds Allocation Strategy 1 2 3 4 5 Mean SD
Do you invest in tactical assets 9 9 60 24 9 3.135 0.936
Do you invest in strategic assets 0 13 32 44 22 3.676 0.857
Table 4.24 results reveal that most of the participants (22) strongly agreed that they
invested in strategic assets. Its mean score is 3.676. With capital adequacy
framework, strategic assets will improve business performance of DTS in Kenya.

116
4.4.8 Financial Performance
The study also purposed to establish if the deposit taking SACCOs were using the
PEARLS system in measuring their performance. All the respondents were using the
system. However, they rated the parameters differently. Balance scorecard is
superior as compared with PEARLS. It measures four perspectives including
financial return.
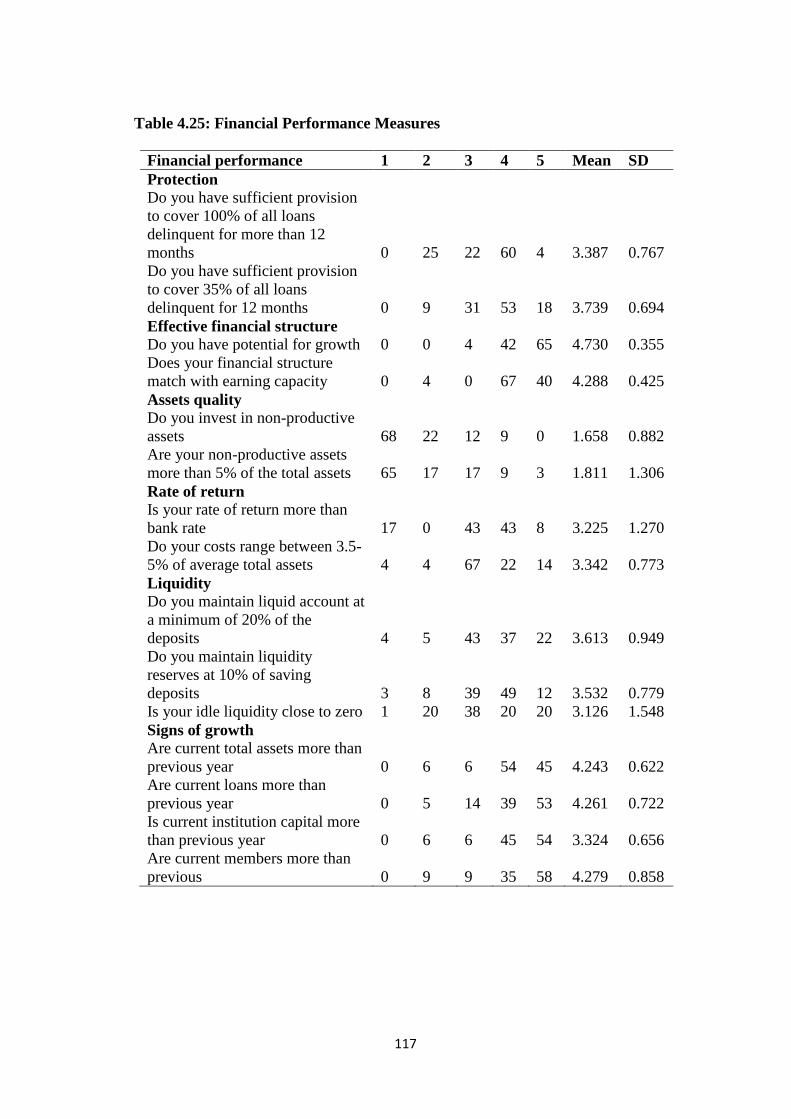
117
Table 4.25: Financial Performance Measures
Financial performance 1 2 3 4 5 Mean SD
Protection
Do you have sufficient provision
to cover 100% of all loans
delinquent for more than 12
months
0
25
22
60
4
3.387
0.767
Do you have sufficient provision
to cover 35% of all loans
delinquent for 12 months
0
9
31
53
18
3.739
0.694
Effective financial structure
Do you have potential for growth 0 0 4 42 65 4.730 0.355
Does your financial structure
match with earning capacity
0
4
0
67
40
4.288
0.425
Assets quality
Do you invest in non-productive
assets
68
22
12
9
0
1.658
0.882
Are your non-productive assets
more than 5% of the total assets
65
17
17
9
3
1.811
1.306
Rate of return
Is your rate of return more than
bank rate
17
0
43
43
8
3.225
1.270
Do your costs range between 3.5-
5% of average total assets
4
4
67
22
14
3.342
0.773
Liquidity
Do you maintain liquid account at
a minimum of 20% of the
deposits
4
5
43
37
22
3.613
0.949
Do you maintain liquidity
reserves at 10% of saving
deposits
3
8
39
49
12
3.532
0.779
Is your idle liquidity close to zero 1 20 38 20 20 3.126 1.548
Signs of growth
Are current total assets more than
previous year
0
6
6
54
45
4.243
0.622
Are current loans more than
previous year
0
5
14
39
53
4.261
0.722
Is current institution capital more
than previous year
0
6
6
45
54
3.324
0.656
Are current members more than
previous
0
9
9
35
58
4.279
0.858
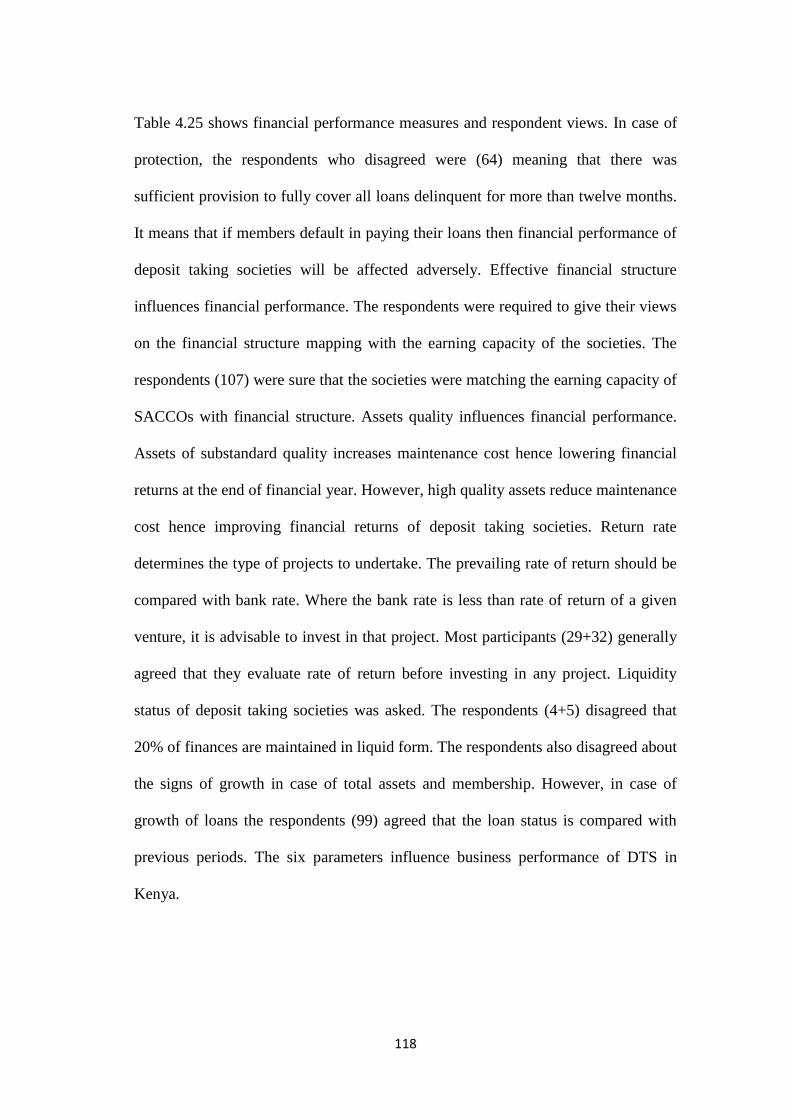
118
Table 4.25 shows financial performance measures and respondent views. In case of
protection, the respondents who disagreed were (64) meaning that there was
sufficient provision to fully cover all loans delinquent for more than twelve months.
It means that if members default in paying their loans then financial performance of
deposit taking societies will be affected adversely. Effective financial structure
influences financial performance. The respondents were required to give their views
on the financial structure mapping with the earning capacity of the societies. The
respondents (107) were sure that the societies were matching the earning capacity of
SACCOs with financial structure. Assets quality influences financial performance.
Assets of substandard quality increases maintenance cost hence lowering financial
returns at the end of financial year. However, high quality assets reduce maintenance
cost hence improving financial returns of deposit taking societies. Return rate
determines the type of projects to undertake. The prevailing rate of return should be
compared with bank rate. Where the bank rate is less than rate of return of a given
venture, it is advisable to invest in that project. Most participants (29+32) generally
agreed that they evaluate rate of return before investing in any project. Liquidity
status of deposit taking societies was asked. The respondents (4+5) disagreed that
20% of finances are maintained in liquid form. The respondents also disagreed about
the signs of growth in case of total assets and membership. However, in case of
growth of loans the respondents (99) agreed that the loan status is compared with
previous periods. The six parameters influence business performance of DTS in
Kenya.
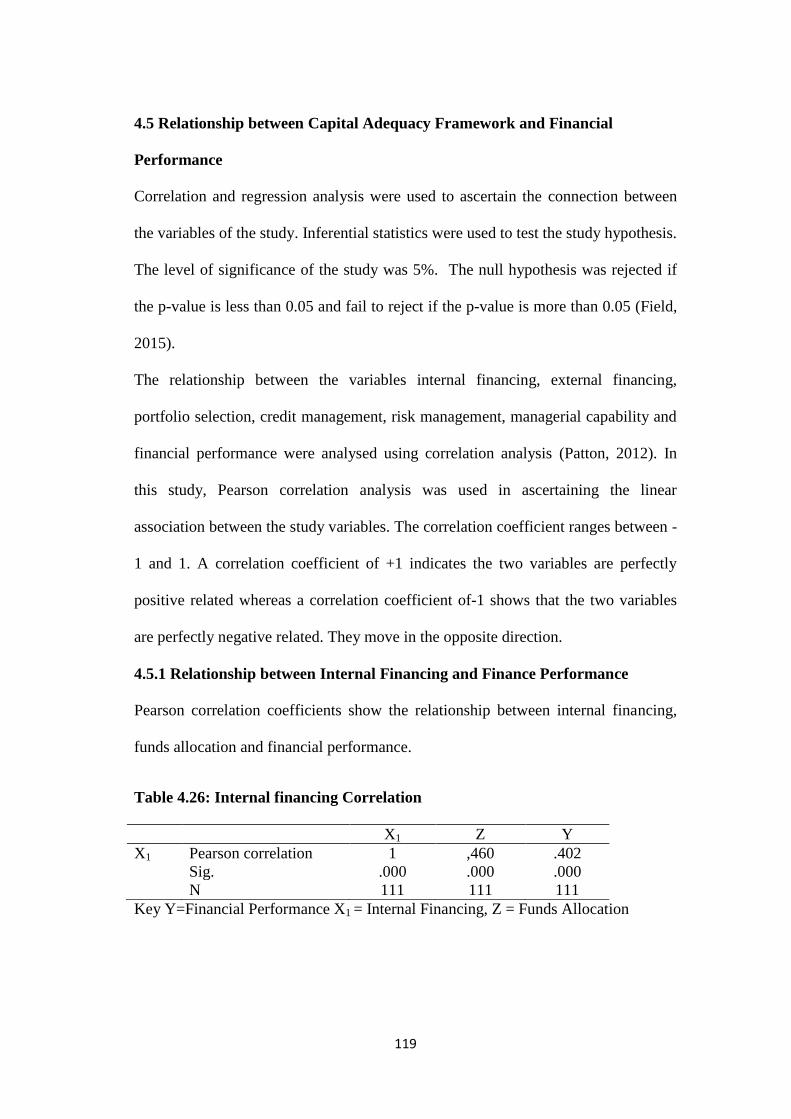
119
4.5 Relationship between Capital Adequacy Framework and Financial
Performance
Correlation and regression analysis were used to ascertain the connection between
the variables of the study. Inferential statistics were used to test the study hypothesis.
The level of significance of the study was 5%. The null hypothesis was rejected if
the p-value is less than 0.05 and fail to reject if the p-value is more than 0.05 (Field,
2015).
The relationship between the variables internal financing, external financing,
portfolio selection, credit management, risk management, managerial capability and
financial performance were analysed using correlation analysis (Patton, 2012). In
this study, Pearson correlation analysis was used in ascertaining the linear
association between the study variables. The correlation coefficient ranges between -
1 and 1. A correlation coefficient of +1 indicates the two variables are perfectly
positive related whereas a correlation coefficient of-1 shows that the two variables
are perfectly negative related. They move in the opposite direction.
4.5.1 Relationship between Internal Financing and Finance Performance
Pearson correlation coefficients show the relationship between internal financing,
funds allocation and financial performance.
Table 4.26: Internal financing Correlation
X1 Z Y
X1 Pearson correlation 1 ,460 .402
Sig. .000 .000 .000
N 111 111 111
Key Y=Financial Performance X1 = Internal Financing, Z = Funds Allocation
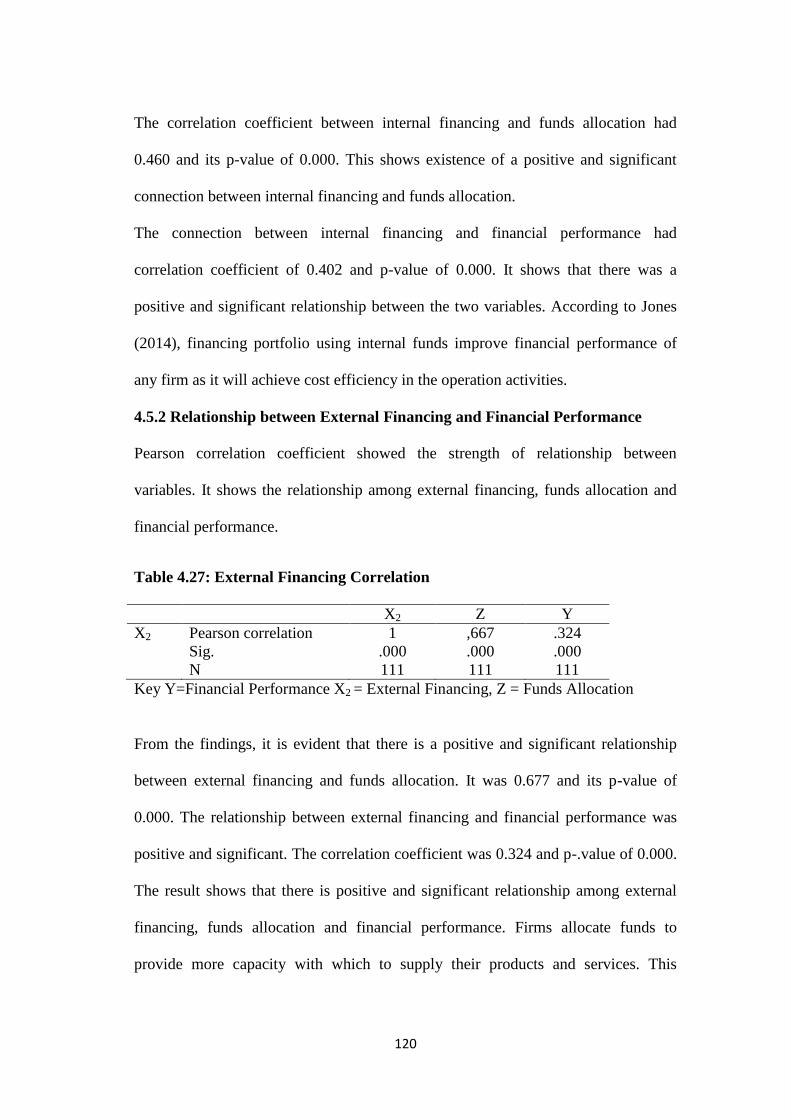
120
The correlation coefficient between internal financing and funds allocation had
0.460 and its p-value of 0.000. This shows existence of a positive and significant
connection between internal financing and funds allocation.
The connection between internal financing and financial performance had
correlation coefficient of 0.402 and p-value of 0.000. It shows that there was a
positive and significant relationship between the two variables. According to Jones
(2014), financing portfolio using internal funds improve financial performance of
any firm as it will achieve cost efficiency in the operation activities.
4.5.2 Relationship between External Financing and Financial Performance
Pearson correlation coefficient showed the strength of relationship between
variables. It shows the relationship among external financing, funds allocation and
financial performance.
Table 4.27: External Financing Correlation
X2 Z Y
X2 Pearson correlation 1 ,667 .324
Sig. .000 .000 .000
N 111 111 111
Key Y=Financial Performance X2 = External Financing, Z = Funds Allocation
From the findings, it is evident that there is a positive and significant relationship
between external financing and funds allocation. It was 0.677 and its p-value of
0.000. The relationship between external financing and financial performance was
positive and significant. The correlation coefficient was 0.324 and p-.value of 0.000.
The result shows that there is positive and significant relationship among external
financing, funds allocation and financial performance. Firms allocate funds to
provide more capacity with which to supply their products and services. This
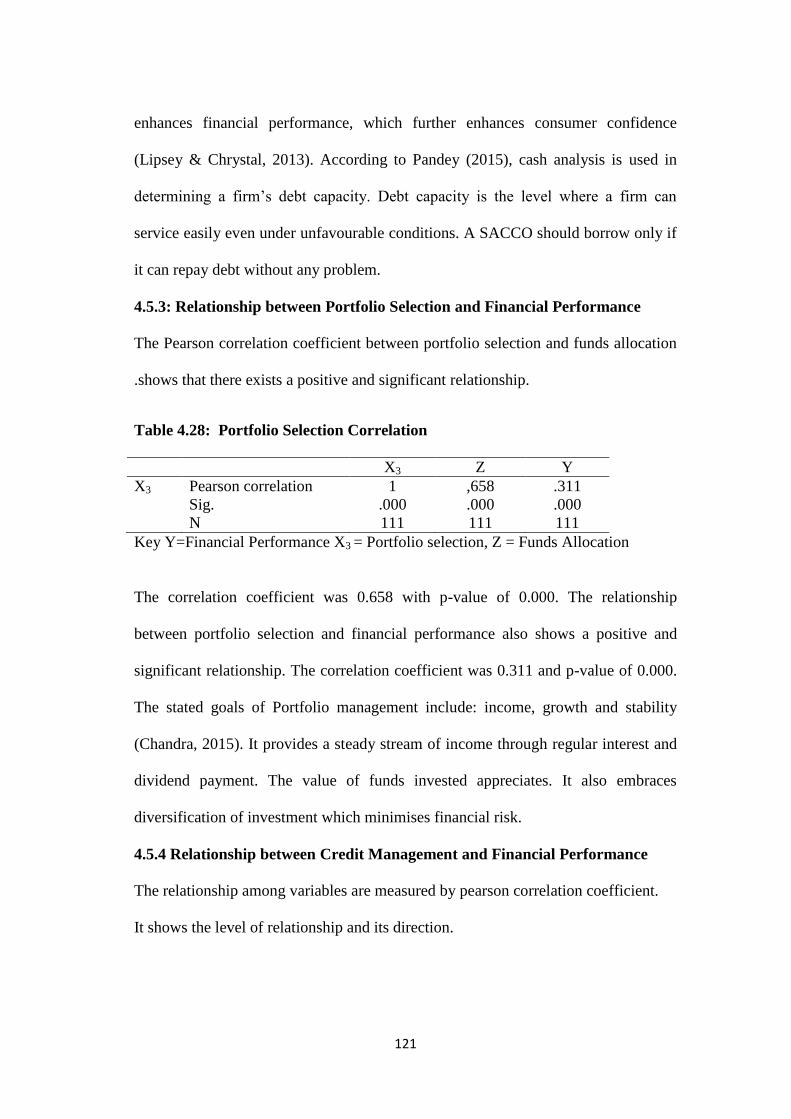
121
enhances financial performance, which further enhances consumer confidence
(Lipsey & Chrystal, 2013). According to Pandey (2015), cash analysis is used in
determining a firm‘s debt capacity. Debt capacity is the level where a firm can
service easily even under unfavourable conditions. A SACCO should borrow only if
it can repay debt without any problem.
4.5.3: Relationship between Portfolio Selection and Financial Performance
The Pearson correlation coefficient between portfolio selection and funds allocation
.shows that there exists a positive and significant relationship.
Table 4.28: Portfolio Selection Correlation
X3 Z Y
X3 Pearson correlation 1 ,658 .311
Sig. .000 .000 .000
N 111 111 111
Key Y=Financial Performance X3 = Portfolio selection, Z = Funds Allocation
The correlation coefficient was 0.658 with p-value of 0.000. The relationship
between portfolio selection and financial performance also shows a positive and
significant relationship. The correlation coefficient was 0.311 and p-value of 0.000.
The stated goals of Portfolio management include: income, growth and stability
(Chandra, 2015). It provides a steady stream of income through regular interest and
dividend payment. The value of funds invested appreciates. It also embraces
diversification of investment which minimises financial risk.
4.5.4 Relationship between Credit Management and Financial Performance
The relationship among variables are measured by pearson correlation coefficient.
It shows the level of relationship and its direction.
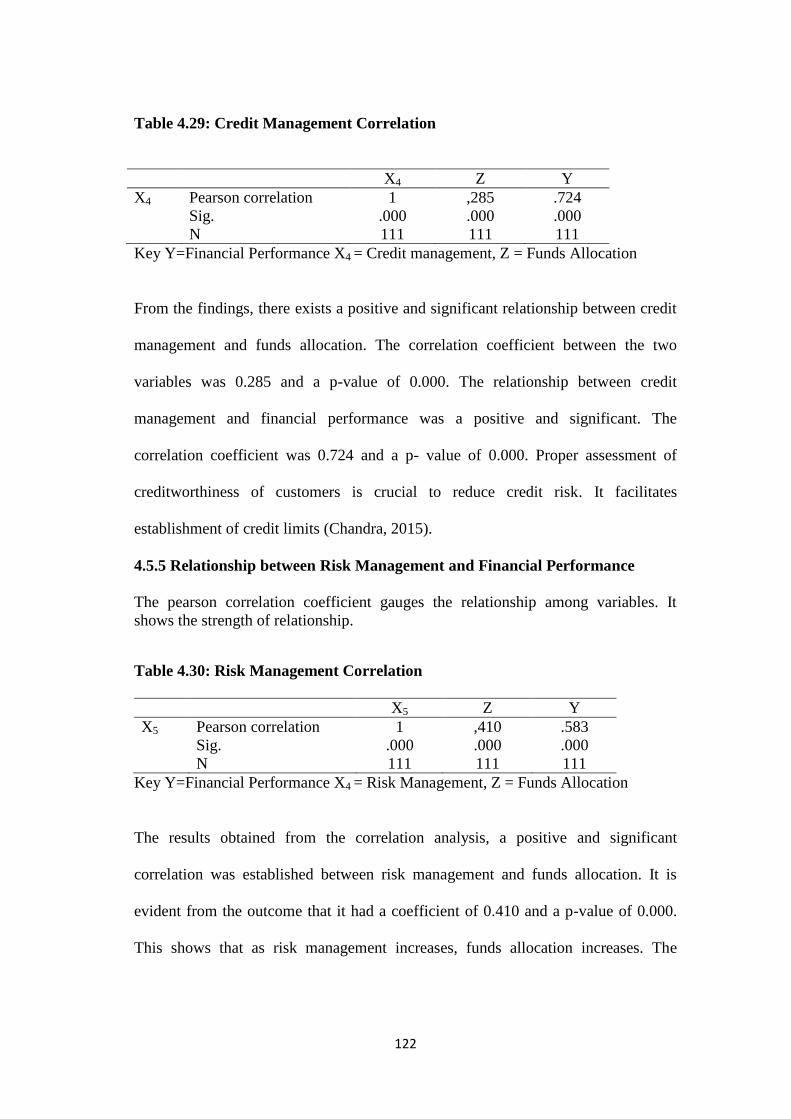
122
Table 4.29: Credit Management Correlation
X4 Z Y
X4 Pearson correlation 1 ,285 .724
Sig. .000 .000 .000
N 111 111 111
Key Y=Financial Performance X4 = Credit management, Z = Funds Allocation
From the findings, there exists a positive and significant relationship between credit
management and funds allocation. The correlation coefficient between the two
variables was 0.285 and a p-value of 0.000. The relationship between credit
management and financial performance was a positive and significant. The
correlation coefficient was 0.724 and a p- value of 0.000. Proper assessment of
creditworthiness of customers is crucial to reduce credit risk. It facilitates
establishment of credit limits (Chandra, 2015).
4.5.5 Relationship between Risk Management and Financial Performance
The pearson correlation coefficient gauges the relationship among variables. It
shows the strength of relationship.
Table 4.30: Risk Management Correlation
X5 Z Y
X5 Pearson correlation 1 ,410 .583
Sig. .000 .000 .000
N 111 111 111
Key Y=Financial Performance X4 = Risk Management, Z = Funds Allocation
The results obtained from the correlation analysis, a positive and significant
correlation was established between risk management and funds allocation. It is
evident from the outcome that it had a coefficient of 0.410 and a p-value of 0.000.
This shows that as risk management increases, funds allocation increases. The

123
relationship between risk management and financial performance is positive and
significant. Its correlation coefficient was 0.583 and p-value of 0.000. This indicates
that there is a positive correlation between risk management and financial
performance of DTS in Kenya. As risk management increases, financial
performance increases. All SACCOs use both equity capital and debt capital. The
proportion of debt capital to the total capital determines financial risk. The higher
proportion of debt component in the capital structure of a SACCO indicates higher
financial risk (Nagarajan & Jayabal, 2012).
4.5.6 Relationship between Managerial Capability and Financial Performance
The relationship between managerial capability and financial performance is shown
in table 4.31.
Table 4.31: Managerial Capability Correlation
X6 Z Y
X6 Pearson correlation 1 ,441 .409
Sig. .000 .000 .000
N 111 111 111
The correlation coefficient showed that there is a strong, positive and significant
relationship between managerial capability and financial performance. This is
shown by the Pearson correlation coefficient of 0.409 and a p-value of 0.000. The
relationship between managerial capability and funds allocation was also positive
and significant. Their coefficient was 0.441 and p-value was 0.000. All the firms
know that the key to competitive advantage in this twenty-one century will be the
capacity of top leadership to create, integrate and implement the new-economy
virtues of speed and e-commerce with the old-economy virtues of generating profit,
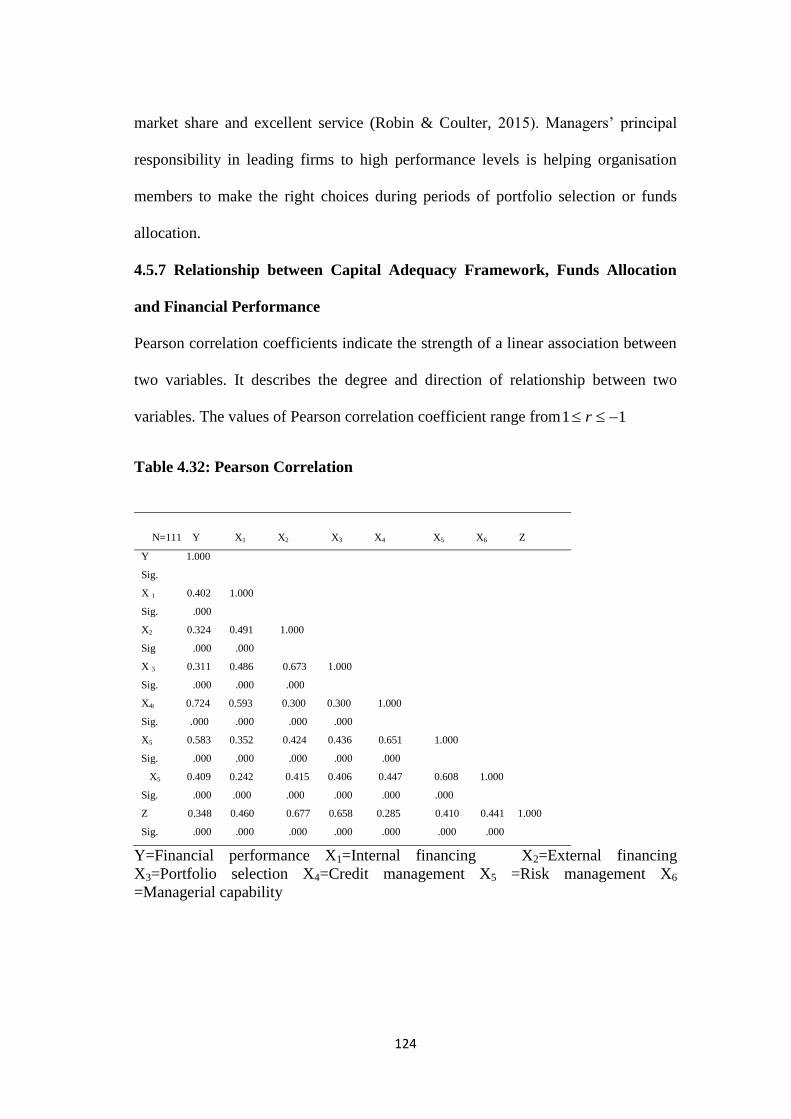
124
market share and excellent service (Robin & Coulter, 2015). Managers‘ principal
responsibility in leading firms to high performance levels is helping organisation
members to make the right choices during periods of portfolio selection or funds
allocation.
4.5.7 Relationship between Capital Adequacy Framework, Funds Allocation
and Financial Performance
Pearson correlation coefficients indicate the strength of a linear association between
two variables. It describes the degree and direction of relationship between two
variables. The values of Pearson correlation coefficient range from 11 r
Table 4.32: Pearson Correlation
N=111 Y X1 X2 X3 X4 X5 X6 Z
Y 1.000
Sig.
X 1 0.402 1.000
Sig. .000
X2 0.324 0.491 1.000
Sig .000 .000
X 3 0.311 0.486 0.673 1.000
Sig. .000 .000 .000
X4t 0.724 0.593 0.300 0.300 1.000
Sig. .000 .000 .000 .000
X5 0.583 0.352 0.424 0.436 0.651 1.000
Sig. .000 .000 .000 .000 .000
X5 0.409 0.242 0.415 0.406 0.447 0.608 1.000
Sig. .000 .000 .000 .000 .000 .000
Z 0.348 0.460 0.677 0.658 0.285 0.410 0.441 1.000
Sig. .000 .000 .000 .000 .000 .000 .000
Y=Financial performance X1=Internal financing X2=External financing
X3=Portfolio selection X4=Credit management X5 =Risk management X6
=Managerial capability
125
When the value of 1r , it means that the correlation is perfectly positive. The
correlation coefficient of negative one shows that the two variables move in the
opposite direction. The correlation coefficient of zero means that there is no
correlation between the variables. The value of r closer to zero indicates that the
relationship between the two variables is not strong. However, if it is closer to one or
unity, it indicates a very strong relationship.
According Maligalig & Martinez (2013), correlation coefficient values which
ranging 0.100 to 0.290 are considered weak, from 0.300 to 0.490 are considered
medium and from 0.500 to 1.000 are considered strong. From the findings, all the
two variables were ranging from .500 to 1.000 meaning that they were strongly
correlated. They are significant at 5% level significance as all of them had p-values=
0.000.
According to Koutsoyiannis (2014), multicollinearity arises when there exists linear
relationships among explanatory variables. If it does not seriously affect the
estimates of the coefficients, one may tolerate its presence in the function. However,
the integrity of the least squares estimate is to a certain extent impaired. As indicated
from the table, all the variables had positive correlations. The correlation between
managerial capability and internal financing is weak (r=0.242).
Multicollinearity is tested to establish if some variables are correlated. If two
variables are correlated, one is dropped from the study.
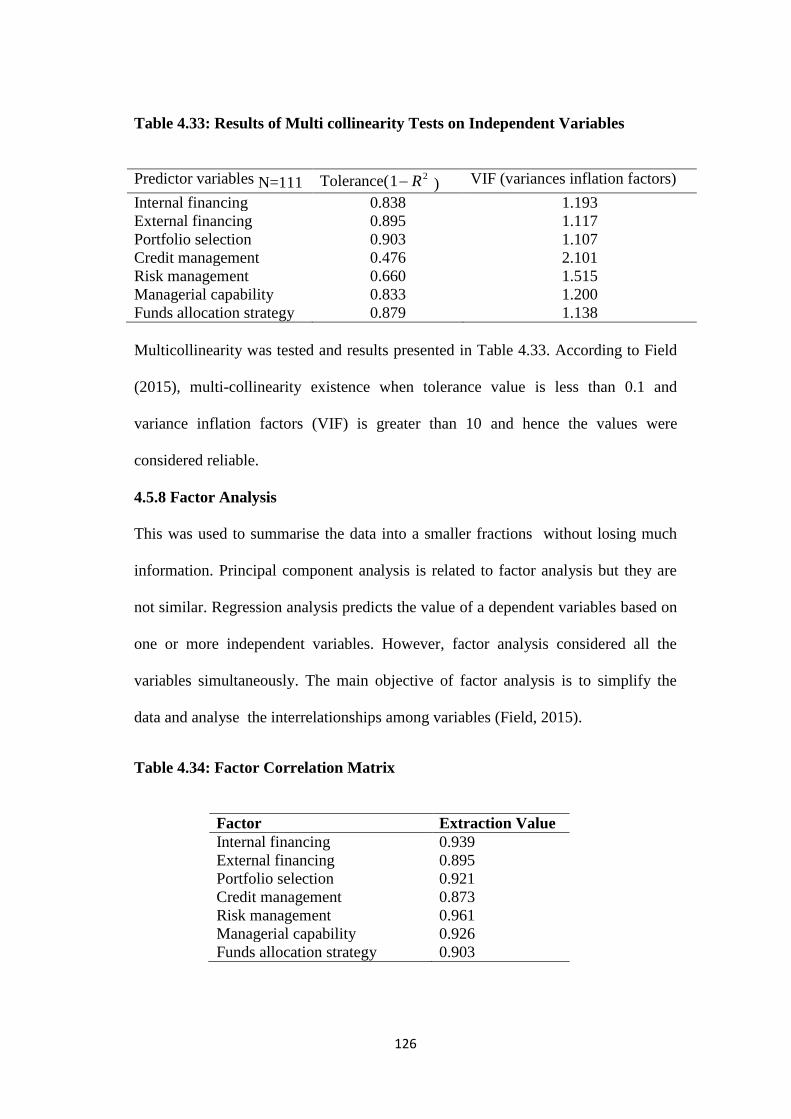
126
Table 4.33: Results of Multi collinearity Tests on Independent Variables
Predictor variables N=111 Tolerance( 21 R ) VIF (variances inflation factors)
Internal financing 0.838 1.193
External financing 0.895 1.117
Portfolio selection 0.903 1.107
Credit management 0.476 2.101
Risk management 0.660 1.515
Managerial capability 0.833 1.200
Funds allocation strategy 0.879 1.138
Multicollinearity was tested and results presented in Table 4.33. According to Field
(2015), multi-collinearity existence when tolerance value is less than 0.1 and
variance inflation factors (VIF) is greater than 10 and hence the values were
considered reliable.
4.5.8 Factor Analysis
This was used to summarise the data into a smaller fractions without losing much
information. Principal component analysis is related to factor analysis but they are
not similar. Regression analysis predicts the value of a dependent variables based on
one or more independent variables. However, factor analysis considered all the
variables simultaneously. The main objective of factor analysis is to simplify the
data and analyse the interrelationships among variables (Field, 2015).
Table 4.34: Factor Correlation Matrix
Factor Extraction Value
Internal financing 0.939
External financing 0.895
Portfolio selection 0.921
Credit management 0.873
Risk management 0.961
Managerial capability 0.926
Funds allocation strategy 0.903
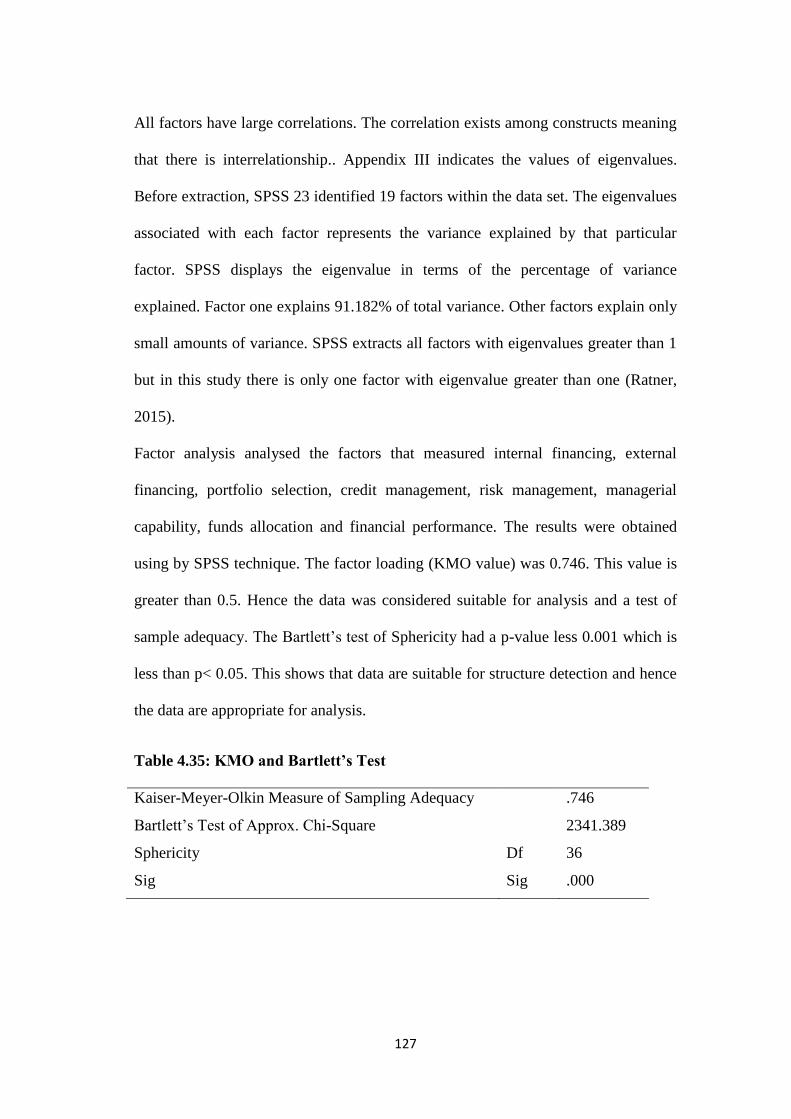
127
All factors have large correlations. The correlation exists among constructs meaning
that there is interrelationship.. Appendix III indicates the values of eigenvalues.
Before extraction, SPSS 23 identified 19 factors within the data set. The eigenvalues
associated with each factor represents the variance explained by that particular
factor. SPSS displays the eigenvalue in terms of the percentage of variance
explained. Factor one explains 91.182% of total variance. Other factors explain only
small amounts of variance. SPSS extracts all factors with eigenvalues greater than 1
but in this study there is only one factor with eigenvalue greater than one (Ratner,
2015).
Factor analysis analysed the factors that measured internal financing, external
financing, portfolio selection, credit management, risk management, managerial
capability, funds allocation and financial performance. The results were obtained
using by SPSS technique. The factor loading (KMO value) was 0.746. This value is
greater than 0.5. Hence the data was considered suitable for analysis and a test of
sample adequacy. The Bartlett‘s test of Sphericity had a p-value less 0.001 which is
less than p< 0.05. This shows that data are suitable for structure detection and hence
the data are appropriate for analysis.
Table 4.35: KMO and Bartlett’s Test
Kaiser-Meyer-Olkin Measure of Sampling Adequacy .746
Bartlett‘s Test of Approx. Chi-Square 2341.389
Sphericity Df 36
Sig Sig .000

128
The test was conducted to ascertain the suitability of data collected from the survey.
Table 4.35 shows that KMO measure of sampling was 0.746 which indicated that
data was suitability for the study.
4.6 Test of Hypotheses on influence of Capital Adequacy Framework on
Financial Performance
The study included 164 deposit-taking societies in Kenya licensed in 2016. Only
111 DTS responded to the survey. The study intended to find the effect of capital
adequacy framework on financial performance. The relationship is moderated by
funds allocation strategy. The hypotheses were tested at 5% significance level. The
results are discussed as follows: Section B questionnaire related to the relationship
among independent and dependent variables. The intention was to establish if the
independent variables influence financial performance of DTSs. The study
established that internal financing, external financing, portfolio selection, credit
management, risk management and managerial capability influenced financial
performance of DTS in Kenya significantly.
Amongst the factors that are critical on the business performance of DTS in Kenya.
They include the following: internal and external financing, portfolio selection,
credit management, risk management, managerial capability and funds allocation
strategy. A DTS is also in a dangerous position if the non-interest expense is greater
than net interest income plus other income. Similarly, the difference in the interest
percent of a weighted average of loans and deposits must be correlating. The quality
of other income is a concern (Jordan et al., 2018). For example, a DTS may try to
generate cash from one-off loan set-ups, just to get the fee, and not bother
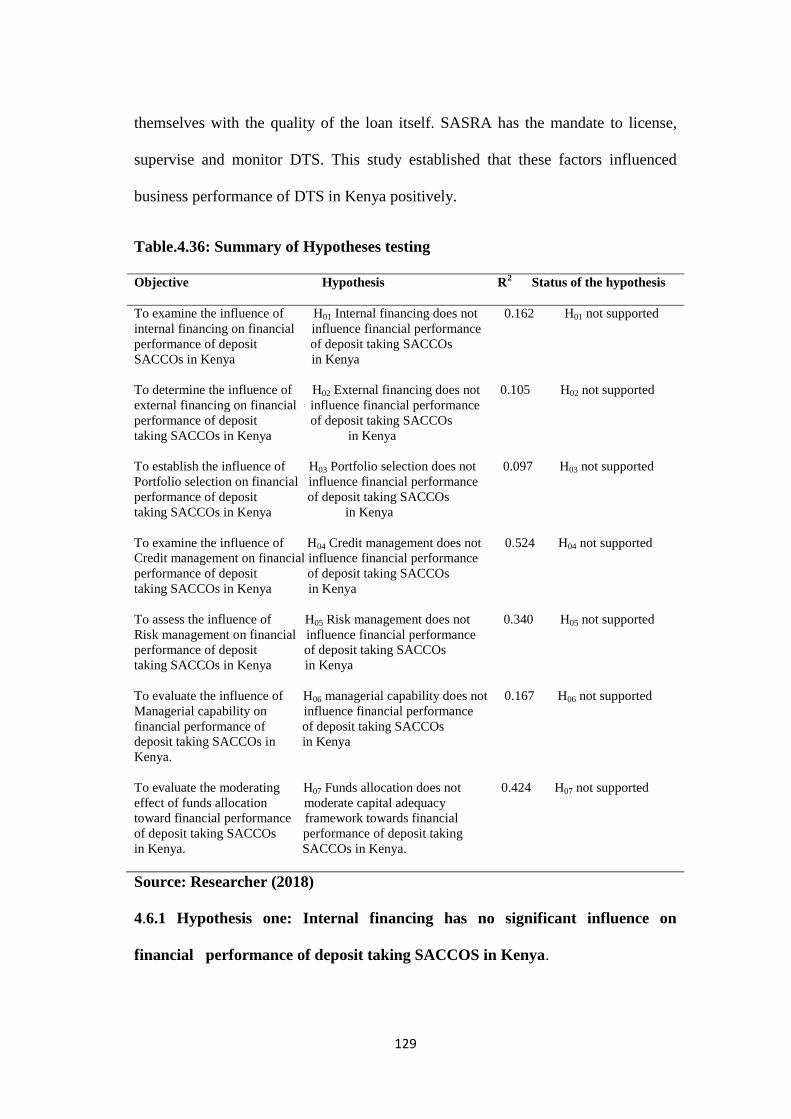
129
themselves with the quality of the loan itself. SASRA has the mandate to license,
supervise and monitor DTS. This study established that these factors influenced
business performance of DTS in Kenya positively.
Table.4.36: Summary of Hypotheses testing
Objective Hypothesis R2 Status of the hypothesis
To examine the influence of H01 Internal financing does not 0.162 H01 not supported
internal financing on financial influence financial performance
performance of deposit of deposit taking SACCOs
SACCOs in Kenya in Kenya
To determine the influence of H02 External financing does not 0.105 H02 not supported
external financing on financial influence financial performance
performance of deposit of deposit taking SACCOs
taking SACCOs in Kenya in Kenya
To establish the influence of H03 Portfolio selection does not 0.097 H03 not supported
Portfolio selection on financial influence financial performance
performance of deposit of deposit taking SACCOs
taking SACCOs in Kenya in Kenya
To examine the influence of H04 Credit management does not 0.524 H04 not supported
Credit management on financial influence financial performance
performance of deposit of deposit taking SACCOs
taking SACCOs in Kenya in Kenya
To assess the influence of H05 Risk management does not 0.340 H05 not supported
Risk management on financial influence financial performance
performance of deposit of deposit taking SACCOs
taking SACCOs in Kenya in Kenya
To evaluate the influence of H06 managerial capability does not 0.167 H06 not supported
Managerial capability on influence financial performance
financial performance of of deposit taking SACCOs
deposit taking SACCOs in in Kenya
Kenya.
To evaluate the moderating H07 Funds allocation does not 0.424 H07 not supported
effect of funds allocation moderate capital adequacy
toward financial performance framework towards financial
of deposit taking SACCOs performance of deposit taking
in Kenya. SACCOs in Kenya.
Source: Researcher (2018)
4.6.1 Hypothesis one: Internal financing has no significant influence on
financial performance of deposit taking SACCOS in Kenya.
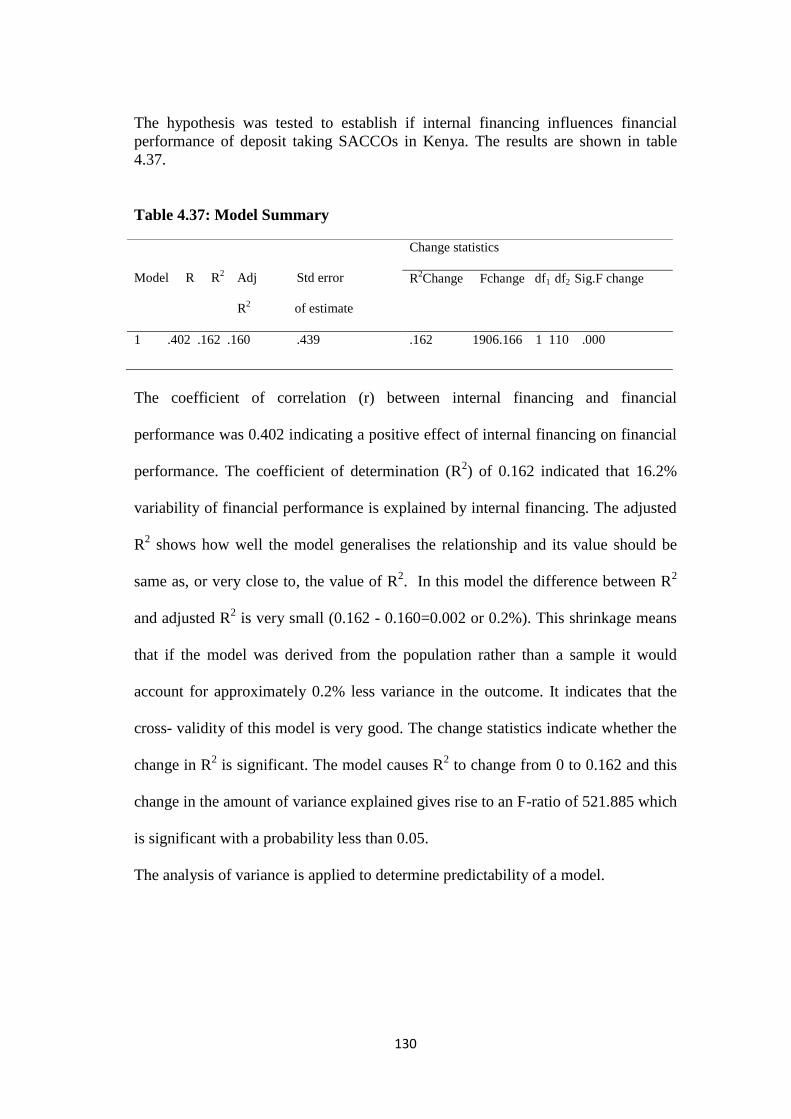
130
The hypothesis was tested to establish if internal financing influences financial
performance of deposit taking SACCOs in Kenya. The results are shown in table
4.37.
Table 4.37: Model Summary
The coefficient of correlation (r) between internal financing and financial
performance was 0.402 indicating a positive effect of internal financing on financial
performance. The coefficient of determination (R2) of 0.162 indicated that 16.2%
variability of financial performance is explained by internal financing. The adjusted
R2 shows how well the model generalises the relationship and its value should be
same as, or very close to, the value of R2. In this model the difference between R
2
and adjusted R2 is very small (0.162 - 0.160=0.002 or 0.2%). This shrinkage means
that if the model was derived from the population rather than a sample it would
account for approximately 0.2% less variance in the outcome. It indicates that the
cross- validity of this model is very good. The change statistics indicate whether the
change in R2 is significant. The model causes R
2 to change from 0 to 0.162 and this
change in the amount of variance explained gives rise to an F-ratio of 521.885 which
is significant with a probability less than 0.05.
The analysis of variance is applied to determine predictability of a model.
Model R R2
Adj Std error
R2
of estimate
Change statistics
R2Change Fchange df1 df2 Sig.F change
1 .402 .162 .160 .439 .162 1906.166 1 110 .000
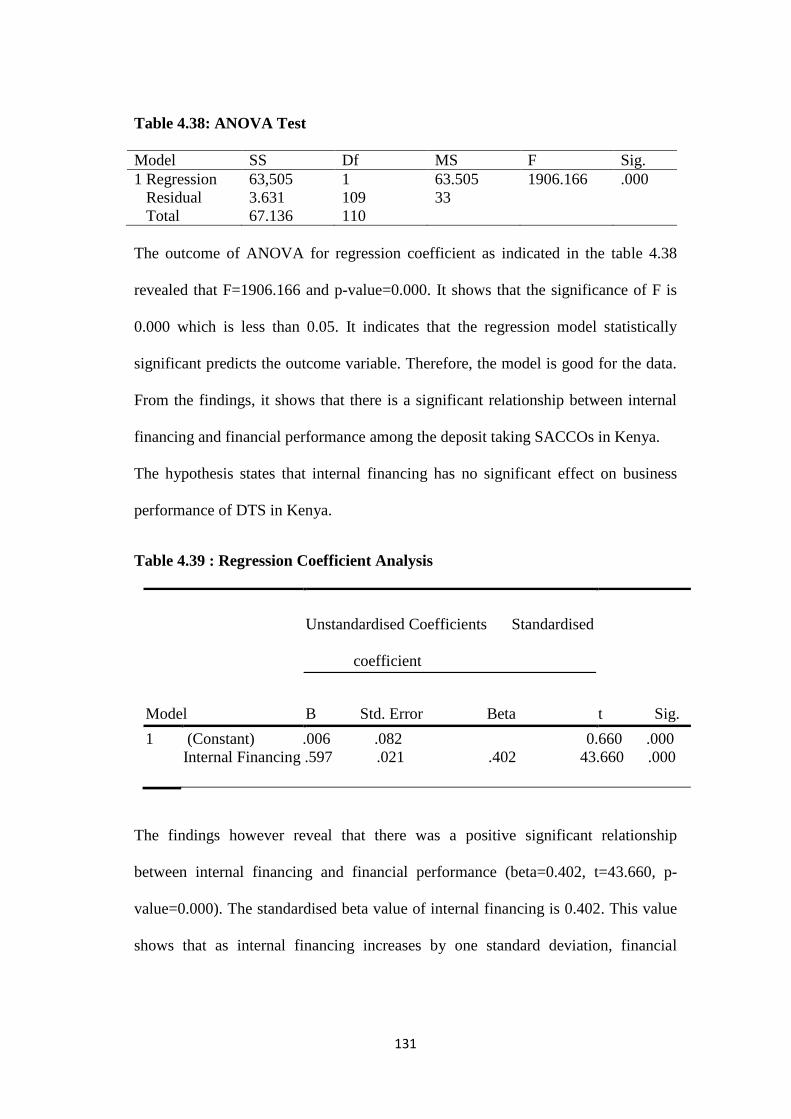
131
Table 4.38: ANOVA Test
Model SS Df MS F Sig.
1 Regression 63,505 1 63.505 1906.166 .000
Residual 3.631 109 33
Total 67.136 110
The outcome of ANOVA for regression coefficient as indicated in the table 4.38
revealed that F=1906.166 and p-value=0.000. It shows that the significance of F is
0.000 which is less than 0.05. It indicates that the regression model statistically
significant predicts the outcome variable. Therefore, the model is good for the data.
From the findings, it shows that there is a significant relationship between internal
financing and financial performance among the deposit taking SACCOs in Kenya.
The hypothesis states that internal financing has no significant effect on business
performance of DTS in Kenya.
Table 4.39 : Regression Coefficient Analysis
Model
Unstandardised Coefficients Standardised
coefficient
t Sig. B Std. Error Beta
1 (Constant) .006 .082 0.660 .000
Internal Financing .597 .021 .402 43.660 .000
The findings however reveal that there was a positive significant relationship
between internal financing and financial performance (beta=0.402, t=43.660, p-
value=0.000). The standardised beta value of internal financing is 0.402. This value
shows that as internal financing increases by one standard deviation, financial

132
performance increases by 0.402 standard deviation. The t-value is 43.660 which is
greater than zero, then the null hypothesis that internal financing has no significant
influence on financial performance of deposit taking SACCOs in Kenya was
rejected and the alternate hypothesis was fail to reject.
In conclusion, internal financing had a positive significant influence on financial
performance among deposit taking SACCOs in Kenya. It is evident from the finding
that internal financing improves financial performance. The SACCOs should ensure
that they increase their institution capital.
The testing of internal financing included five aspects which include the following:
members‘ deposits, equity shares, maintaining 15 percent liquidity of total assets and
institutional capital. Members‘ deposits are money received from members. These
are members‘ savings which can be withdrawn at any time they like. Any deposit-
taking societies has to maintain 15 per cent of total assets in liquid form which may
be invested in either cash or marketable securities. The analysis was done to find out
if internal financing of deposit-taking societies were embracing it or opting for
external funding. The aim of either financing is to magnify the financial
performance of SACCOs. Institutional capital is non-withdrawable capital of
entities (Rouf, 2013). This capital comprises the following: retained earnings and
non-interest incomes. The share capital is the money contributed by members as
equity shares. It forms a larger amount of assets, as compared with other sources. To
test the hypothesis, respondents answered questions relating to the above aspects.
Before a SACCO in need of funds searches for outside funding, it should check its
cash flow positions to determine whether any internal funds are available. Inter-
borrowing among SACCOs is beneficial because the term of borrowing is

133
negotiable. This process is especially useful during periods when the cost of
obtaining funds in the financial markets is relatively high (Riahi-Belkaoui, 2015).
An existing SACCO can raise finances from internal sources additionally for future
growth and expansion. Internal sources of financing are retained earnings in the
form of balance in profit and loss account, general reserves, capital reserves and
depreciation reserves.
A SACCO can keep a portion of the profits it has earned without distributing to the
members. A portion of profits reserved in the society is known as retained profits. It
is strictly not a method of raising finance but refers to an accumulation of returns
which forms institutional capital. If a SACCO continues building institutional
capital, it will have a sound financial footing in future. Members will benefit from it
because the interest charges will be less. Both members and the society will benefit
from internal financing as it will improve the financial performance of the business.
This process of retaining the profits year after year and their judicious utilisation in
the business is known as ploughing back profits (Brigham & Houston, 2014). The
objective of ploughing back the profits is to meet the following society purpose:
replacement of old assets which have become outdated, lending loans as well as
meeting working capital requirements of society, expansion and growth of an
enterprise, making the society self-dependent and avoiding outside financing and
redemption of loans and debentures (Richardson, 2012).
The management of the following crucial factors will help an enterprise achieve
self-financing. The earning status of an entity plays a critical role in determining the
quantum of retained earnings. If the earning capacity of the society is high, retained
earnings also can be high. If a society does not have adequate earning capacity, there
134
is no possibility for retained earnings. The desire and type of members the society
has, influence the retained earnings policy. If the majority of the members are retired
people, widows and those who look for the dividend as a regular source of benefit.
However, preference is made to have a higher figure of income (Gopal, 2012). A
society having that category of members cannot afford to retain more amounts in the
form of retained earnings. A SACCO that has wealthy members may not mind if the
society follows the policy of retained earnings. The future financial requirements of
the society affect the strategy of retained profits. If the society has more expansion
plans, the need for funds is more. The enterprise would prefer to hold earnings rather
than distribute higher dividends. Dividend policy influences retained earnings (Shim
& Siegel, Dauber & Qureshi, 2015). If a SACCO wants to declare more dividends, it
cannot afford to keep more profits. The dividend policy has a reciprocal relationship
with the retention policy (Sharpe et al., 2011). If it holds more profits, the lesser
amount of profit would be available for distribution and vice versa. The monetary
and fiscal policy of the government influences retained earnings. A high taxation
policy of the government leaves the lower amount in the hands of SACCO towards
retention of profits. On the contrary, a liberal policy of the government allows more
profits for holding in the society. It happens normally when the tax liability is less
(Bhalla, 2014).
In conclusion, the internal fund is economical method of financing. Society needs
not depend upon outsiders for meeting the requirements of expansion, loan
advancing and growth. Profits accumulated would be adequate to meet the
requirements for any business opportunities.

135
4.6.2 Hypothesis two: External financing and financial performance of deposit
taking SACCOs in Kenya
The hypothesis was to establish if external financing has influence on financial
performance. The results are shown in table 4.40.
Table 4.40: Model Summary
Model R R2 Adjusted S.E of
R2 the
estimate
Change Statistics
R Square Change FChange df1 df2 Sig. F
Change
1 .324 .105 .103 .198 .105 1603.824 1 109 .000
The coefficient of correlation (R) between external financing and financial
performance was 0.324. This shows that there is a positive correlation between the
two variables. The R2 which is the coefficient of determination explains the amount
of variation of financial performance that is related to external financing. The value
is 0.105. External financing explains 10.5% variability of financial performance of
deposit taking SACCOs in Kenya. The remaining 89.5% is explained by other
factors outside the study scope.
The Analysis of Variance for regression coefficient was applied to show the
relationship between the two variables at 5% level of significance.
Table 4.41: ANOVA Test
Model SS df MS F Sig.
1 Regression 62.864 1 62.864 1603.824 .000
Residual 4.272 109 .029
Total 67.136 110
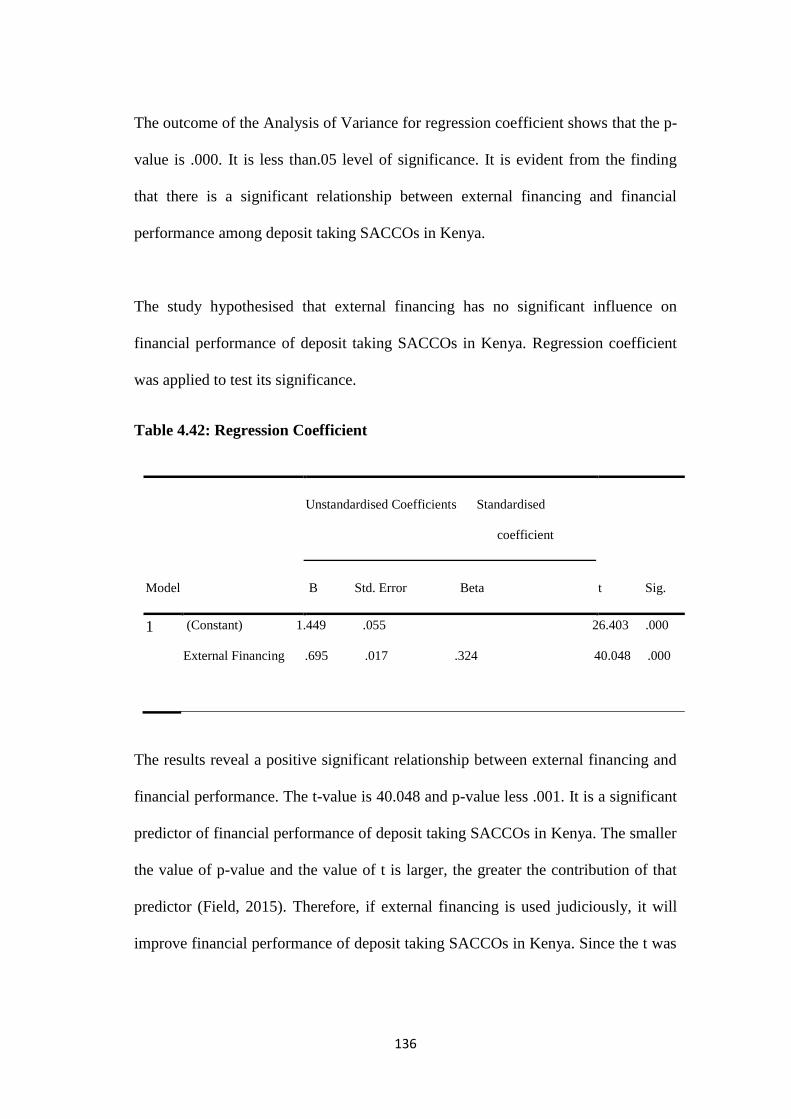
136
The outcome of the Analysis of Variance for regression coefficient shows that the p-
value is .000. It is less than.05 level of significance. It is evident from the finding
that there is a significant relationship between external financing and financial
performance among deposit taking SACCOs in Kenya.
The study hypothesised that external financing has no significant influence on
financial performance of deposit taking SACCOs in Kenya. Regression coefficient
was applied to test its significance.
Table 4.42: Regression Coefficient
Model
Unstandardised Coefficients Standardised
coefficient
t Sig. B Std. Error Beta
1 (Constant) 1.449 .055 26.403 .000
External Financing .695 .017 .324 40.048 .000
The results reveal a positive significant relationship between external financing and
financial performance. The t-value is 40.048 and p-value less .001. It is a significant
predictor of financial performance of deposit taking SACCOs in Kenya. The smaller
the value of p-value and the value of t is larger, the greater the contribution of that
predictor (Field, 2015). Therefore, if external financing is used judiciously, it will
improve financial performance of deposit taking SACCOs in Kenya. Since the t was
137
40.048, the null hypothesis that external financing has no significant influence on
financial performance among deposit taking SACCOs in Kenya was rejected and the
alternative hypothesis was not rejected. External financing has positive significance
influence on financial performance of DTS in Kenya.
The testing of external funding used three aspects which comprise: short-term debts,
long-term debts and borrowing not exceeding 25 percent of total assets. Short-term
loans are paid within a one year. The payments of long-term debts take durations
which are more than one year. Deposit-taking societies are not allowed to borrow
more than 25 percent of total assets. SACCOs procure externally to improve their
financial performance. The respondents were asked relevant questions to the above
three aspects.
External fund influences the financial performance of a given business enterprise. If
the society needs financing, it depends on the operating activities. The larger the
payment of cash dividend is done, the greater the amount of financing. It
necessitates external borrowing or the sale of equity shares to make operation
possible (Gitman, 2011)
To support its investments, a SACCO must devise methods of financing them.
Equity and debt represent the two chief sources of funds for business enterprises
(Chandra, 2015). Lenders are entitled to a contractual set of cash flows. Borrowers
have financial obligations to see to it that loans are paid when loans are due. The
cash flows comprise of receipts and payments to the owners with equity investors
entitled to residue cash flows remitted to them after all claims and liabilities have
138
been satisfied (Fabozzi, Modigliani & Jones, 2009). On the contrary, debt investors
play a passive role to save their investments, and protect their interests.
SACCOs can also raise long-term finance in addition to equity share and debentures.
The funds for financing large expansion, diversification or modernisation projects
can be obtained from term-loans. These loans are acquired when the society is
intending to finance a real estate venture. This project will take a long time to realise
tangible benefit from it. The major advantage of a term loan is that it is for a fixed
period. The profit generated from the economics activities facilitates repayment of
the instalments. More so, the interest liability is fixed. It means that it does not vary.
The profitability of the project does not affect it for a long-term (Chandra, 2015).
SACCOs obtain short-term loans which are usually unsecured from banks and
members‘ deposits. Bank advances and deposits result from actions taken by the
society‘s management and Board of Directors. Bank loans are more common even
though the loans are costly. All sizes of enterprises can access loans. Deposits tend
to be available only to well-managed SACCOs because depositors would not like to
risk their hard-earned cash.
Banks are the chief source of short-term loans which are unsecured to societies.
Specifically, the Cooperative Bank of Kenya gives loans to SACCOs so that they
may advance to their members. The bank is lender of last resort and offer short-term
self-liquidating loans intended merely to carry the business through the seasonal
peak in financing needs that meet the members‘ financial requirements. As the
members‘ financial obligations mature, the funds are generated to retire these loans
fully. The utilisation of the borrowed money provides the mechanism of repaying
the loan without defaulting. The loan is self-financing. It means that the society
139
takes loans from banks, and then they are advanced to the members who pay interest
and principal. The payments facilitate defraying of the borrowed loans from banks.
Banks lend unsecured, short-term funds in three normal ways: through a single-
payment note, lines of credit and revolving fund agreements. A financial institution
issues a single-payment instrument to a trustworthy business borrower (Nyambere,
2013). It is usually a one-time loan made to a potential borrower who needs funds
for financing its activities for short term period. The borrower signs the financial
instrument outlining the loan terms including duration of the facility and the interest
rates. The note normally has a maturity period of 30 days to nine months or even
more than this. The interest charged is usually correlated in some way to the prime
rate of interest. Central bank of Kenya set the base rate of interest within the
country. It is normally statutory monetary committee policy responsibility.
A line of credit is an agreement between a commercial bank and a society that
specifies the amount of unsecured short-term loans it requires. The bank will
determine the amount of loan to be lent to the customer. It will be paid over a given
period agreed by both parties. It is typically a set of duration for one year and places
a certain constraint on the borrowers. The unsecured loan is not easy to obtain but
available based on the sufficiency of funds at the bank which often has a maximum
amount of line of credit which it allows the society to owe it (Mwatu, 2018).
The borrower applying for a line of credit may be required to submit such
documents as its cash budget, its proforma income statement, its proforma balance
sheet, and its recent financial statements. If the bank establishes that the financial
status of the customer is sound, the line of credit is extended. From the bank‘s point
of view, a line of credit is paramount when making financing decisions. It eliminates
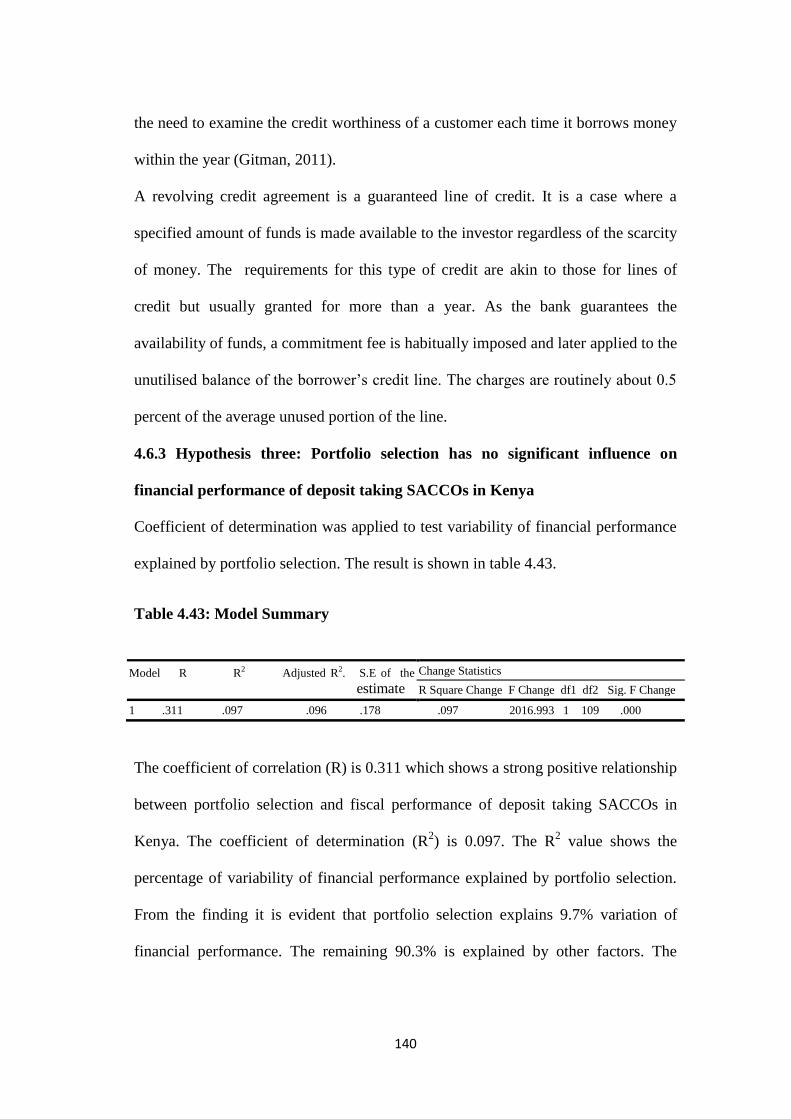
140
the need to examine the credit worthiness of a customer each time it borrows money
within the year (Gitman, 2011).
A revolving credit agreement is a guaranteed line of credit. It is a case where a
specified amount of funds is made available to the investor regardless of the scarcity
of money. The requirements for this type of credit are akin to those for lines of
credit but usually granted for more than a year. As the bank guarantees the
availability of funds, a commitment fee is habitually imposed and later applied to the
unutilised balance of the borrower‘s credit line. The charges are routinely about 0.5
percent of the average unused portion of the line.
4.6.3 Hypothesis three: Portfolio selection has no significant influence on
financial performance of deposit taking SACCOs in Kenya
Coefficient of determination was applied to test variability of financial performance
explained by portfolio selection. The result is shown in table 4.43.
Table 4.43: Model Summary
Model R R2 Adjusted R2. S.E of the
estimate
Change Statistics
R Square Change F Change df1 df2 Sig. F Change
1 .311 .097 .096 .178 .097 2016.993 1 109 .000
The coefficient of correlation (R) is 0.311 which shows a strong positive relationship
between portfolio selection and fiscal performance of deposit taking SACCOs in
Kenya. The coefficient of determination (R2) is 0.097. The R
2 value shows the
percentage of variability of financial performance explained by portfolio selection.
From the finding it is evident that portfolio selection explains 9.7% variation of
financial performance. The remaining 90.3% is explained by other factors. The
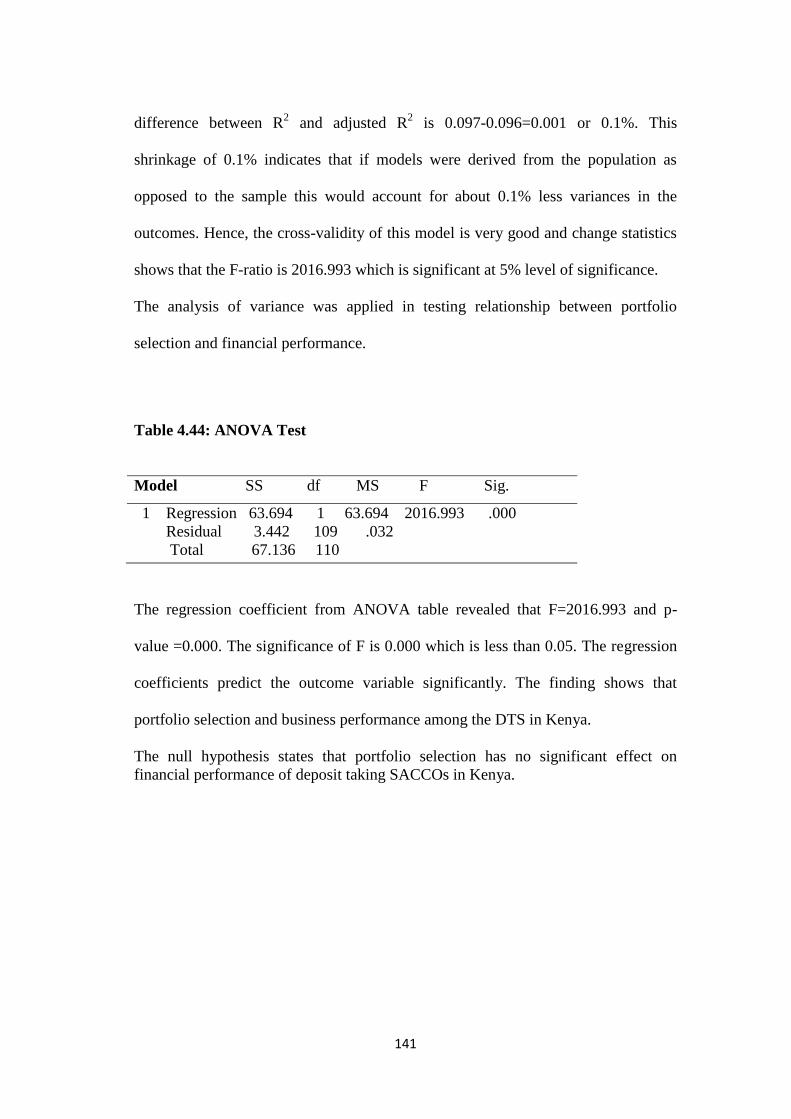
141
difference between R2 and adjusted R
2 is 0.097-0.096=0.001 or 0.1%. This
shrinkage of 0.1% indicates that if models were derived from the population as
opposed to the sample this would account for about 0.1% less variances in the
outcomes. Hence, the cross-validity of this model is very good and change statistics
shows that the F-ratio is 2016.993 which is significant at 5% level of significance.
The analysis of variance was applied in testing relationship between portfolio
selection and financial performance.
Table 4.44: ANOVA Test
Model SS df MS F Sig.
1 Regression 63.694 1 63.694 2016.993 .000
Residual 3.442 109 .032
Total 67.136 110
The regression coefficient from ANOVA table revealed that F=2016.993 and p-
value =0.000. The significance of F is 0.000 which is less than 0.05. The regression
coefficients predict the outcome variable significantly. The finding shows that
portfolio selection and business performance among the DTS in Kenya.
The null hypothesis states that portfolio selection has no significant effect on
financial performance of deposit taking SACCOs in Kenya.
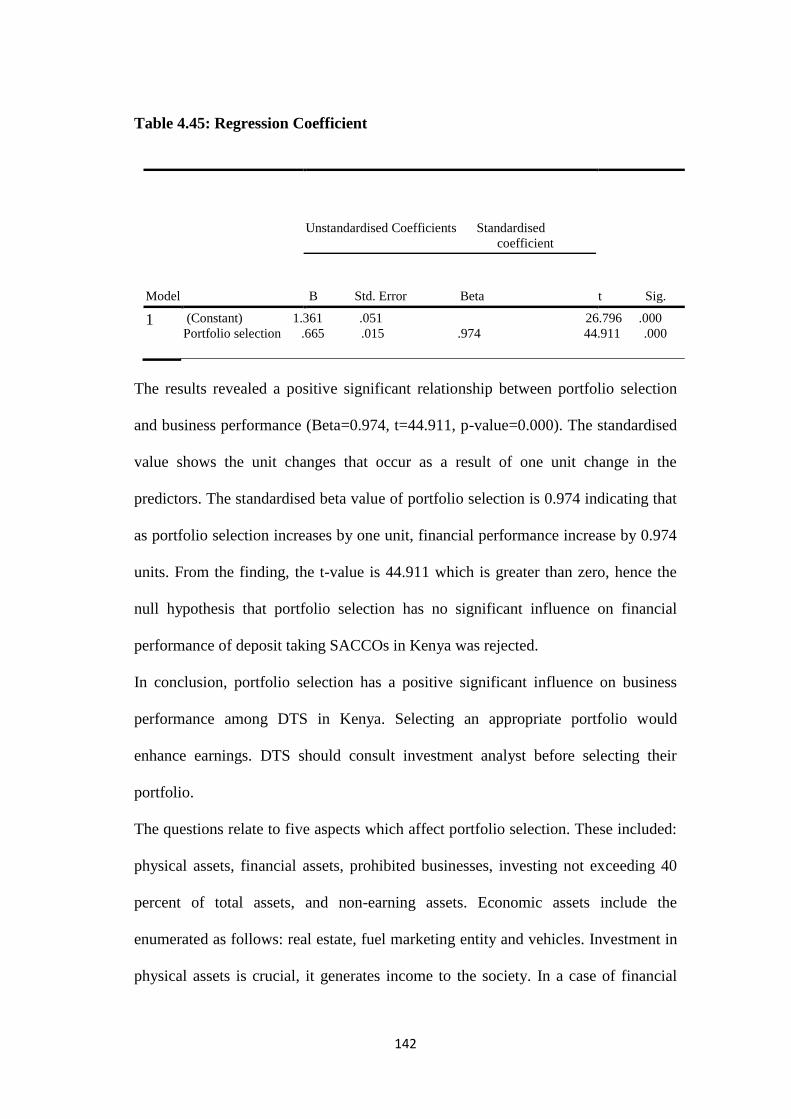
142
Table 4.45: Regression Coefficient
Model
Unstandardised Coefficients Standardised
coefficient
t Sig. B Std. Error Beta
1 (Constant) 1.361 .051 26.796 .000
Portfolio selection .665 .015 .974 44.911 .000
The results revealed a positive significant relationship between portfolio selection
and business performance (Beta=0.974, t=44.911, p-value=0.000). The standardised
value shows the unit changes that occur as a result of one unit change in the
predictors. The standardised beta value of portfolio selection is 0.974 indicating that
as portfolio selection increases by one unit, financial performance increase by 0.974
units. From the finding, the t-value is 44.911 which is greater than zero, hence the
null hypothesis that portfolio selection has no significant influence on financial
performance of deposit taking SACCOs in Kenya was rejected.
In conclusion, portfolio selection has a positive significant influence on business
performance among DTS in Kenya. Selecting an appropriate portfolio would
enhance earnings. DTS should consult investment analyst before selecting their
portfolio.
The questions relate to five aspects which affect portfolio selection. These included:
physical assets, financial assets, prohibited businesses, investing not exceeding 40
percent of total assets, and non-earning assets. Economic assets include the
enumerated as follows: real estate, fuel marketing entity and vehicles. Investment in
physical assets is crucial, it generates income to the society. In a case of financial

143
assets, financial instruments comprise: treasury bills and bonds, equity shares and
certificate of deposits (Quayes & Hasan, 2014). The society is not allowed to invest
in prohibited businesses, such as speculating, trade in Foreign exchange transactions
(FOREX) and gambling, which are highly risky. All investments should not exceed
40 percent of total assets. There is also threshold in investing in non-earning assets.
These assets facilitate the operations of SACCOs. The assets include the following:
computers, photocopiers, tables and others.
According to Hiriyappa (2015), investors are investing their money in companies
with sound financial footings. Investment in various financial instruments like
equity, preference shares, deposits, debentures, government or gilt edged securities,
bonds, public provident schemes, bank deposits, real estate, money market
instruments, precious objects and mutual funds. These investment avenues are
known as investment opportunities which are available to investors.
Investment management involves correct decision making of the buying or selling of
the securities in the market. Ordinary people cannot invest without consultants‘
assistance as it is risky. It needs competent and experienced professionals who have
been dealing with such cases. Investment management involves decision making at
perilous and tough movement in the market. Environmental analysis should be done
to avoid wrong investment. The decisions should be thorough so that the society
could not lose hard earned money. Any investment which has failed, cannot recover
the already incurred costs. So it is prudent to do analysis on the following economic
factors: industry and firm analysis. It is crucial to be aware of the market
expectations and fluctuations in the secondary market.
144
The traditional investments take into account security analysis which estimates the
advantages and disadvantages of individual investments and portfolio management
which focuses on construction and maintenance of a group of investments in order to
reduce risk as opposed to increasing returns (Chandra, 2015). Returns are significant
factors in determining growth, even though the primary goal of portfolio managers is
to achieve desired earning levels by assuming the least possible risk.
Portfolio management purposes to attain maximum returns from a ventures
delegated to investment managers to manage requiring such manager to balance
variables that underpin good investments. The factors which determine the viability
of investment include: liquidity, return and security, intended to achieve the highest
returns for the investors (Rouf, 2014). A viable portfolio will enhance financial
gains. The systematic development and implementation of an investment strategy
are vital activity and involve the process of managing assets and investments. It
needs selection, management and evaluation of portfolio.
The objective of portfolio selection includes: stability of principal, income, higher
level of income and capital appreciation (Hiriyappa, 2015). Stability of principal
connotes a situation where the investor stands no chance of suffering losses on their
original principal because of factors such as legislation and the investor‘s risk
attitude
. It is the most conservative portfolio and likely to generate the most modest returns
in the long run. When the objective of the society is stability of principal, then the
society should invest in appropriate investments such as bank certificates.
In income objective, there are no given prescriptions against period declines in
principal value. The earnings from marketable securities are sensitive to interest rate
145
with a rise in interest rates leading to the fall of the market value of these securities.
If the firm sells securities before maturity, it will realise an actual loss. Where
income is the intended objective this objective is favourable compared to stability of
principal. An appropriate investment includes treasury bonds, treasury bills,
corporate bonds and other government agency securities.
The time value of money is a key concept in finance. A shilling today is worth more
than an equal number of it at any point in future. Income growth objectives sacrifice
some current returns for some purchasing power protection which often involve
reduced initial income payout (Srairi & Douissa, 2014). Income improves over time
and overtakes those from an income objective. Funds with growth of income as its
primary objective often seek to have the annual income increased by at least the
prevailing rate of inflation. Growth of cash flow requires some investment in equity
securities.
Investors may not be interested in portfolio generating income. The capital
appreciation is what they are expecting to attain at a given point of time in future as
could be the case of retirees who may receive their pension cheques sufficient to
finance their retirement life cycle. Owners of investment portfolio could favour
having it continue to grow its value rather than getting additional income from it.
When considering interest or dividends, payment of tax has to be taken into account
as these are taxable capital gains in Kenya (Hiriyappa, 2015).
Markowitz developed the modern portfolio theory through his analysis framework
on the inter linkages between risk and return He used the statistical analysis for
measurement of risk and mathematical programming for selection of assets in a
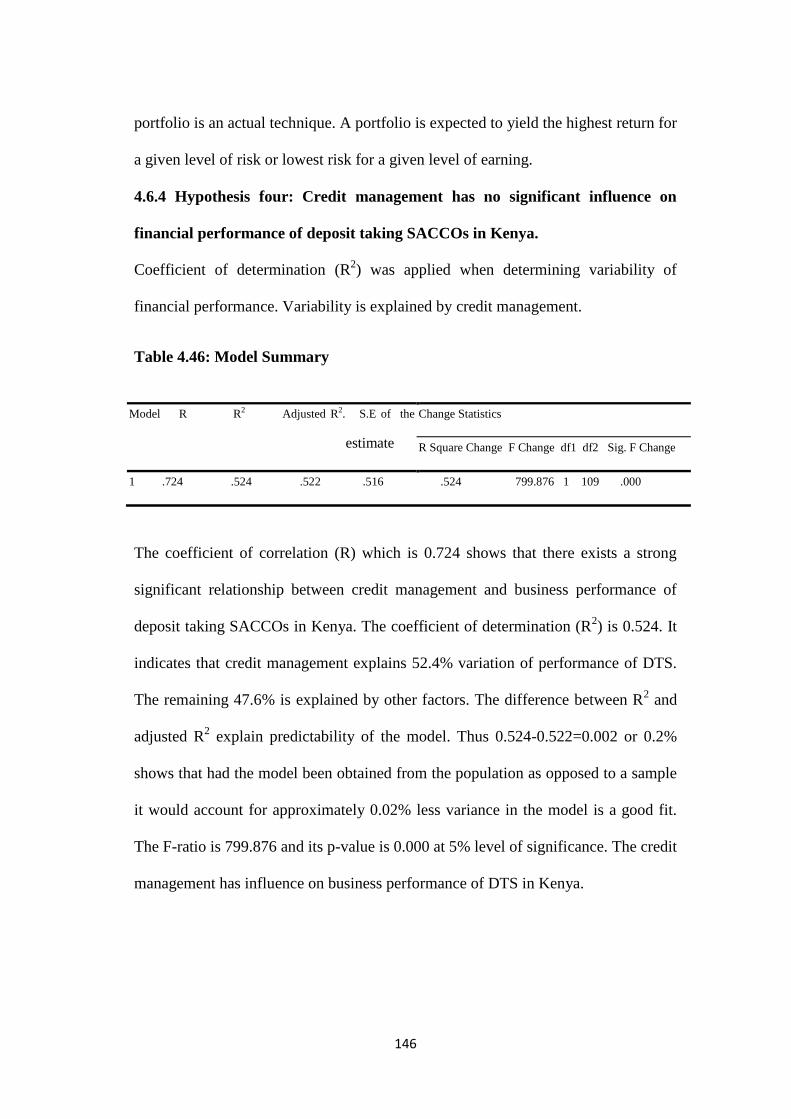
146
portfolio is an actual technique. A portfolio is expected to yield the highest return for
a given level of risk or lowest risk for a given level of earning.
4.6.4 Hypothesis four: Credit management has no significant influence on
financial performance of deposit taking SACCOs in Kenya.
Coefficient of determination (R2) was applied when determining variability of
financial performance. Variability is explained by credit management.
Table 4.46: Model Summary
Model R R2 Adjusted R2. S.E of the
estimate
Change Statistics
R Square Change F Change df1 df2 Sig. F Change
1 .724 .524 .522 .516 .524 799.876 1 109 .000
The coefficient of correlation (R) which is 0.724 shows that there exists a strong
significant relationship between credit management and business performance of
deposit taking SACCOs in Kenya. The coefficient of determination (R2) is 0.524. It
indicates that credit management explains 52.4% variation of performance of DTS.
The remaining 47.6% is explained by other factors. The difference between R2 and
adjusted R2 explain predictability of the model. Thus 0.524-0.522=0.002 or 0.2%
shows that had the model been obtained from the population as opposed to a sample
it would account for approximately 0.02% less variance in the model is a good fit.
The F-ratio is 799.876 and its p-value is 0.000 at 5% level of significance. The credit
management has influence on business performance of DTS in Kenya.
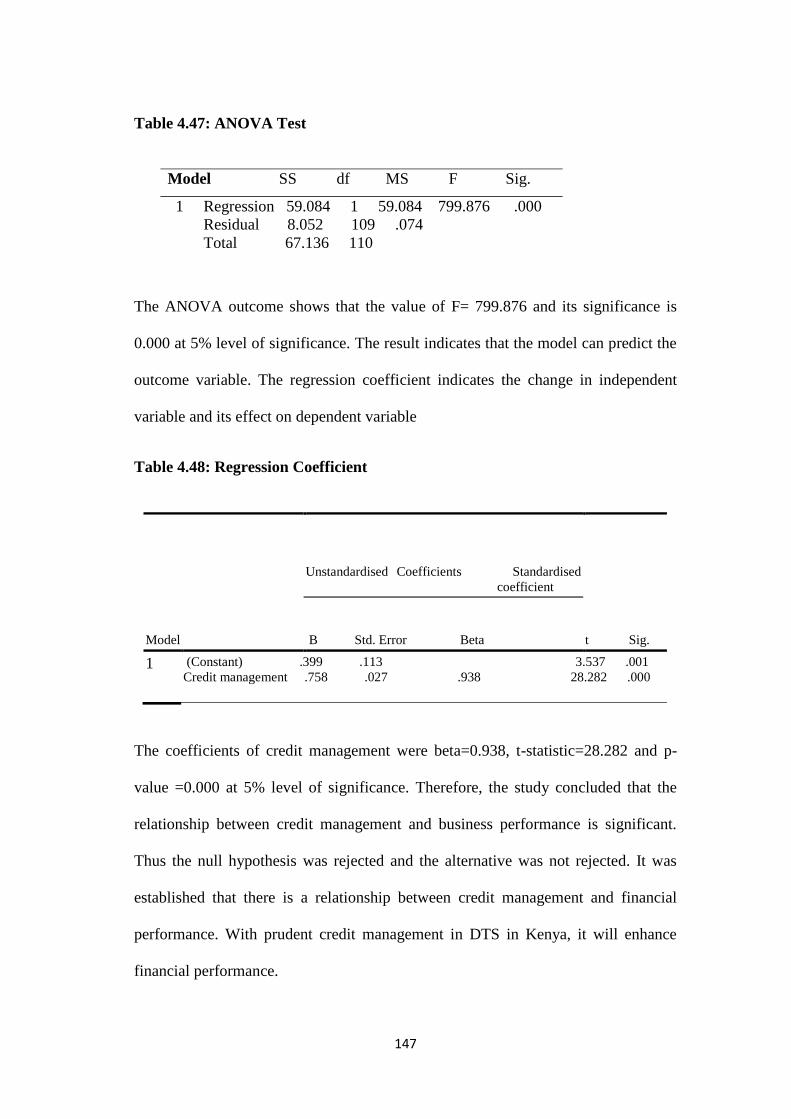
147
Table 4.47: ANOVA Test
The ANOVA outcome shows that the value of F= 799.876 and its significance is
0.000 at 5% level of significance. The result indicates that the model can predict the
outcome variable. The regression coefficient indicates the change in independent
variable and its effect on dependent variable
Table 4.48: Regression Coefficient
Model
Unstandardised Coefficients Standardised
coefficient
t Sig. B Std. Error Beta
1 (Constant) .399 .113 3.537 .001
Credit management .758 .027 .938 28.282 .000
The coefficients of credit management were beta=0.938, t-statistic=28.282 and p-
value =0.000 at 5% level of significance. Therefore, the study concluded that the
relationship between credit management and business performance is significant.
Thus the null hypothesis was rejected and the alternative was not rejected. It was
established that there is a relationship between credit management and financial
performance. With prudent credit management in DTS in Kenya, it will enhance
financial performance.
Model SS df MS F Sig.
1 Regression 59.084 1 59.084 799.876 .000
Residual 8.052 109 .074
Total 67.136 110

148
Credit management ensures that all credits are paid on time to avoid a credit crunch.
It involves seven aspects which the firm has to embrace. These include: being a
member of Credit Bureau of Reference (CRB), avoiding insider trading, credit
evaluation, monitoring and evaluating, collateral security, screening and checking
and long-term customer relations. Before lending out loans, society should liaise
with credit bureau reference to establish the creditworthiness of a borrower. The
firm should assess a potential customer by evaluating, controlling and screening
customers. A long-term relationship with customers should be introduced to
minimise default risk. Collateral security should be a requirement before lending out
the loan. Deposit-taking societies should avoid insider lending.
Most of SACCO funds are utilised to make loans or in purchasing debt securities
either of which use the society acts as a creditor and subject to default risk. SACCO
credit provision will determine the possibility of overall risk of credit of the
portfolio‘s assets (Skinner, 2014). A SACCO can be exposed to credit risk also if it
serves as a guarantor on loans borrowed by other societies. SACCOs must lend
loans consistently in order to earn high profit. The payment should be made in full
making the principles of adverse selection and moral hazard essential for mitigating
credit risks and making fruitful loans.
Adverse selection in loan occurs because loans are lent to those who are most likely
to default on their loans. These borrowers who are selected are probable to produce
an adverse outcome. Borrowers with very risky investment ventures have much to
gain if their ventures are successful. Risky ventures have higher financial returns.
Most of the investors prefer them. However, borrowers who are not credit worthy

149
cannot be advanced any loan. There is greater possibility that the loan may not be
repaid in time.
Moral hazard exists in all financial institutions. SACCO is included. Borrowers may
have incentives to engage in activities that are undesirable from the lender‘s point of
view. In this scenario, the creditor encounters the hazard of default. Borrowers with
great earning expectation would invest in high risk investment projects. These
projects will earn a reasonable profit if successful. These high-risk ventures are
likely to fail. As a result, the borrowers will not be able to pay back the loans. To
make profit, firms must overcome problems such as adverse selection and moral
hazard that make loan defaults likely thus necessitating risk management.
Credit risk management is a vital exercise in any financial institution. Prospective
borrowers should be evaluated before extending credit to them. It is important to
establish creditworthiness of all the customers. It should use credit analysts who
would evaluate the credit information of potential borrowers to ascertain their
financial status (Saunders, 2017). Evaluation should indicate the probability of the
borrower meeting their repayment so that the SACCO can make a decision on
granting the loan. Request for credit should be assessed so that it assists in making
decision relating to the value of collateral security. In case the borrower default its
security will be sold to recover outstanding loan.
Societies should diversify their credits to ensure that their customers are not
dependent on a common source of income. For example, a SACCO in a tea growing
region that provides consumer loans to farmers is highly susceptible to credit risk. If
the tea farmers experience a bad growing season because of poor weather
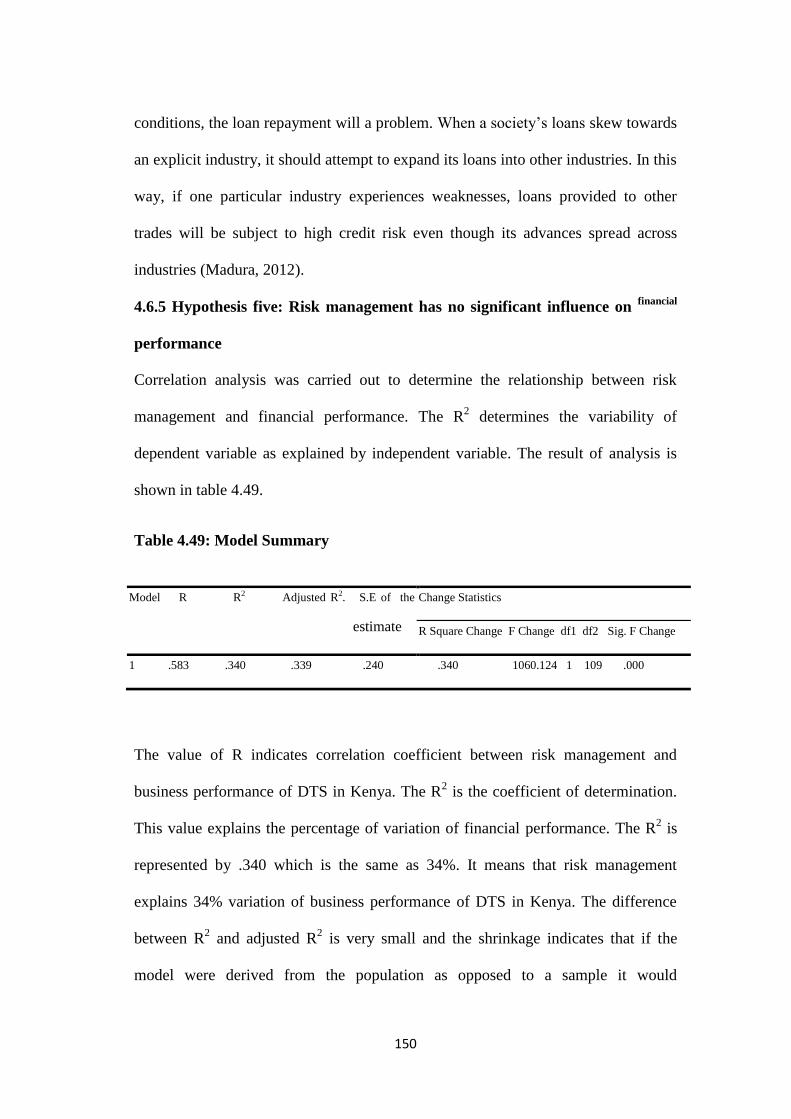
150
conditions, the loan repayment will a problem. When a society‘s loans skew towards
an explicit industry, it should attempt to expand its loans into other industries. In this
way, if one particular industry experiences weaknesses, loans provided to other
trades will be subject to high credit risk even though its advances spread across
industries (Madura, 2012).
4.6.5 Hypothesis five: Risk management has no significant influence on financial
performance
Correlation analysis was carried out to determine the relationship between risk
management and financial performance. The R2 determines the variability of
dependent variable as explained by independent variable. The result of analysis is
shown in table 4.49.
Table 4.49: Model Summary
Model R R2 Adjusted R2. S.E of the
estimate
Change Statistics
R Square Change F Change df1 df2 Sig. F Change
1 .583 .340 .339 .240 .340 1060.124 1 109 .000
The value of R indicates correlation coefficient between risk management and
business performance of DTS in Kenya. The R2 is the coefficient of determination.
This value explains the percentage of variation of financial performance. The R2 is
represented by .340 which is the same as 34%. It means that risk management
explains 34% variation of business performance of DTS in Kenya. The difference
between R2 and adjusted R
2 is very small and the shrinkage indicates that if the
model were derived from the population as opposed to a sample it would
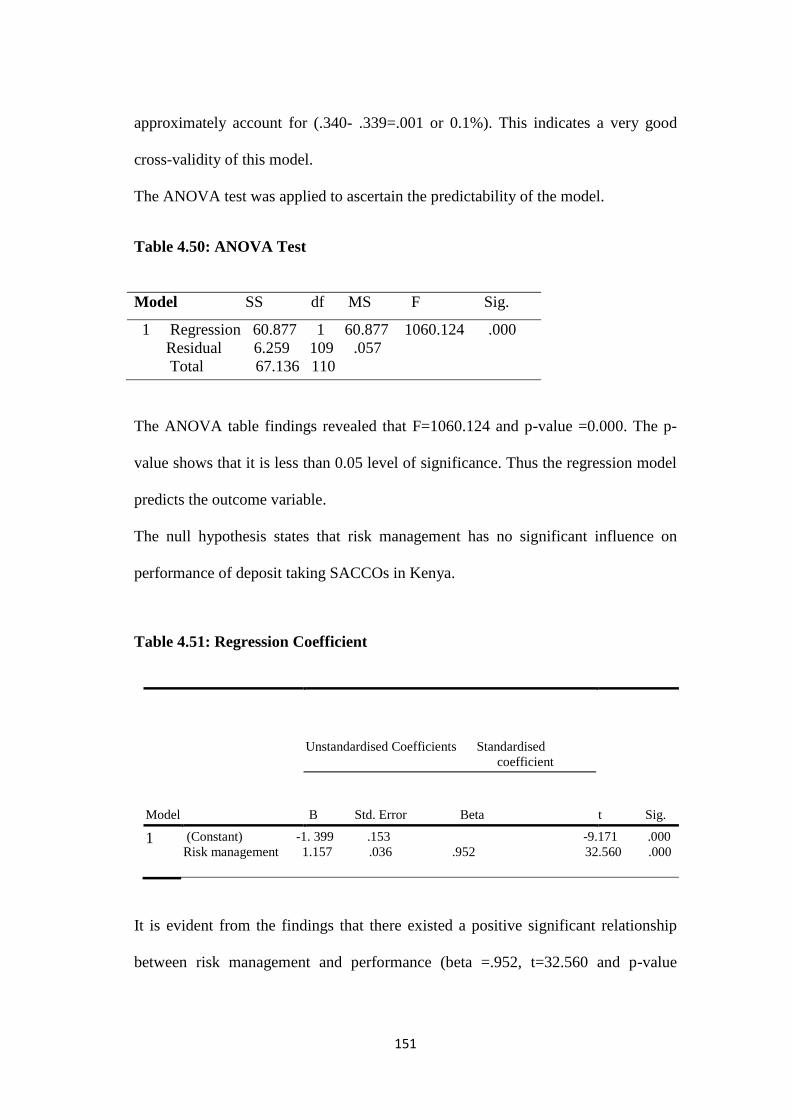
151
approximately account for (.340- .339=.001 or 0.1%). This indicates a very good
cross-validity of this model.
The ANOVA test was applied to ascertain the predictability of the model.
Table 4.50: ANOVA Test
Model SS df MS F Sig.
1 Regression 60.877 1 60.877 1060.124 .000
Residual 6.259 109 .057
Total 67.136 110
The ANOVA table findings revealed that F=1060.124 and p-value =0.000. The p-
value shows that it is less than 0.05 level of significance. Thus the regression model
predicts the outcome variable.
The null hypothesis states that risk management has no significant influence on
performance of deposit taking SACCOs in Kenya.
Table 4.51: Regression Coefficient
Model
Unstandardised Coefficients Standardised
coefficient
t Sig. B Std. Error Beta
1 (Constant) -1. 399 .153 -9.171 .000
Risk management 1.157 .036 .952 32.560 .000
It is evident from the findings that there existed a positive significant relationship
between risk management and performance (beta =.952, t=32.560 and p-value
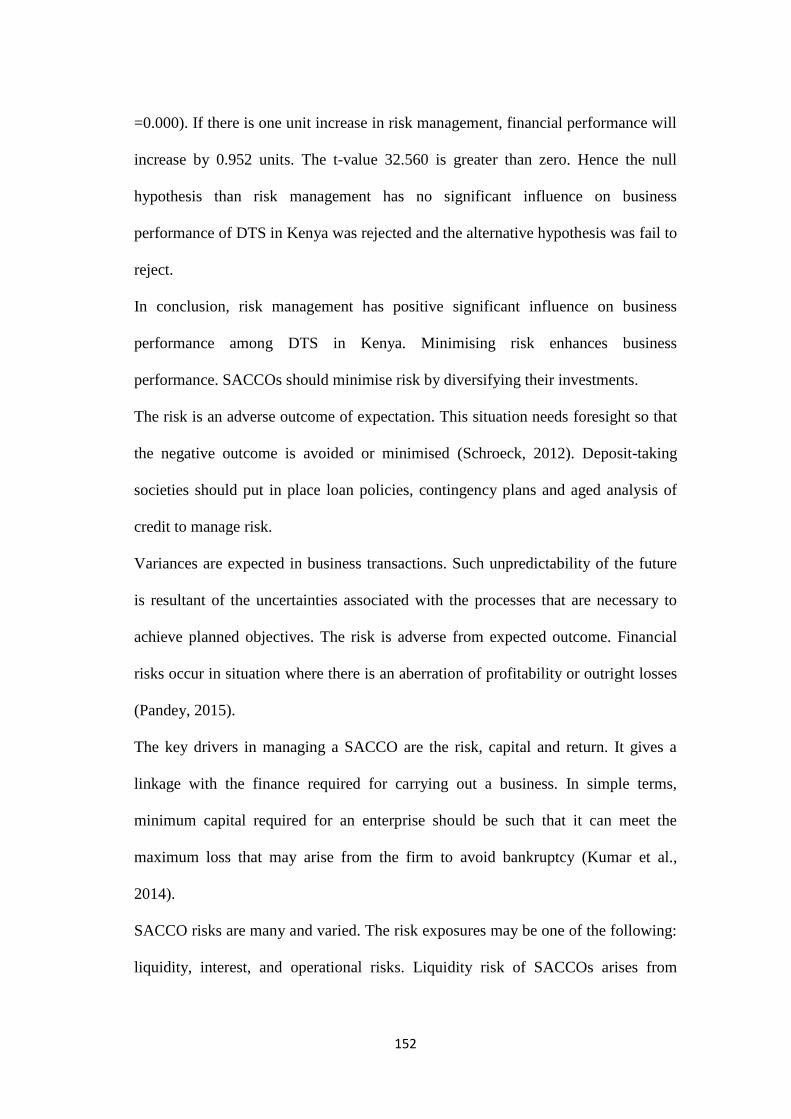
152
=0.000). If there is one unit increase in risk management, financial performance will
increase by 0.952 units. The t-value 32.560 is greater than zero. Hence the null
hypothesis than risk management has no significant influence on business
performance of DTS in Kenya was rejected and the alternative hypothesis was fail to
reject.
In conclusion, risk management has positive significant influence on business
performance among DTS in Kenya. Minimising risk enhances business
performance. SACCOs should minimise risk by diversifying their investments.
The risk is an adverse outcome of expectation. This situation needs foresight so that
the negative outcome is avoided or minimised (Schroeck, 2012). Deposit-taking
societies should put in place loan policies, contingency plans and aged analysis of
credit to manage risk.
Variances are expected in business transactions. Such unpredictability of the future
is resultant of the uncertainties associated with the processes that are necessary to
achieve planned objectives. The risk is adverse from expected outcome. Financial
risks occur in situation where there is an aberration of profitability or outright losses
(Pandey, 2015).
The key drivers in managing a SACCO are the risk, capital and return. It gives a
linkage with the finance required for carrying out a business. In simple terms,
minimum capital required for an enterprise should be such that it can meet the
maximum loss that may arise from the firm to avoid bankruptcy (Kumar et al.,
2014).
SACCO risks are many and varied. The risk exposures may be one of the following:
liquidity, interest, and operational risks. Liquidity risk of SACCOs arises from

153
funding of long-term assets by short-term liabilities. It results in financing liabilities
in a rollover manner. It means that short term liabilities are used to defray long term
liabilities. It is referred to as refinancing risk. Financing liquidity risk refers to a
situation where the investor is unable to obtain funds to meet cash flows obligations
(Olkar, 2013). For SACCOs, funding liquidity risk is crucial. The liquidity risk in
SACCOs manifest in different dimensions: to replace net outflows to unanticipated
withdrawal or non-renewal of deposits; funding risk and time risk which occurs
from the need to compensate for non-receipt of expected inflows of funds when
performing assets turn into non-performing assets (Mishkin & Eakins, 2012).
Interest rate risk is an exposure of a financial condition to adverse movements in
interest rates and can take different forms including its effect on earnings and
economic value of the society (Sharpe et al., 2011). The value of assets and
liabilities is taken into account with gaps of mismatch risks arising from holding
assets and liabilities comprised of distinct principal amounts, maturity dates and
repricing dates. This creates exposure to unexpected changes in the level of market
interest rates (Singhvi & Desai, 2013). This scenario can occur when assets maturing
in two years at a fixed rate of interest has been funded by a liability maturing in six
months. The interest margin would undergo a change after six months, as liability
would be repriced up a maturing causing variation in net interest income. Market
risk refers to unfavourable deviations of the mark-to-market values of the trading
portfolios occasioning, at times, movements in the market during the period of
liquidating the transactions (Jones, 2014). Price risk occurs when financial assets are
sold at a lower price than expected. It happens when they are disposed before their
maturity period. Bond prices and yields are negatively correlated in the security
154
market. The trading books have positive correlation with price risk. Its creation
facilitates profit making out of short-term activities in the rates of interest. Default
risk attributable to the possibility of a debtor failing to meet its financial
commitments as stipulated in the agreed terms (Gopal, 2012). Counterparty risk is a
form of credit risk related to non-performance of the trading partners due to
counterparty‘s refusal or inability to perform and is a transient financial risk
associated with trading.
Operational risk refers to loss resultant of insufficient workforce, internal processes
and systems or external factors. Its scope is broad including fraud, communication,
documentation, competence, model, cultural, external events, legal, regulatory,
compliance and system risks (Gallati, 2013). Two of these risks are common in
SACCO‘s operations namely: transaction and compliance risk. Transaction risk
arises from, both internal and external fraud, failed business, processes and the
inability to maintain business continuity and manage information. Compliance or
integrity risk connotes the statutory sanctions, fiscal or repute loss that a society may
suffer resultant of its failure to comply with good business practices (Gweyi &
Karanja, 2014).
Strategic risk arises from unfavourable business decisions, improper decision
implementation, or rigidity to industry changes. This risk is a function of
comparability of society‘s strategic objectives, the resources deployed against these
goals and the quality of implementation (Hiriyappa, 2015).

155
4.6.6 Hypothesis six: Managerial capability has no significant influence on
financial performance of deposit taking SACCOs in Kenya
The hypothesis was tested to established if managerial capability had any influence
on financial performance. The result is shown in table 4.52.
Table 4.52: Model Summary
Model R R2 Adjusted R2. S.E of the
estimate
Change Statistics
R Square Change F Change df1 df2 Sig. F Change
1 .409 .167 .166 .288 .167 698.370 1 109 .000
The coefficient of correlation (R) was 0.409. This indicates that there was a sturdy
positive correlation between managerial capability and performance of deposit
taking SACCOs in Kenya. The coefficient of determination (R2) was 0.167. This
explains the percentage which managerial capability contributed towards financial
performance. The variability of performance was attributable to managerial
capability to the tune of 16.7%. The remaining percentage (83.3%) was resultant of
factors outside the model. The relationship between managerial capability and
business performance is significant at 5% level of significance. Since the p-value is
0.000 which is less than 0.05.
The study assessed whether the model significantly predicts the performance of the
deposit taking SACCOs in Kenya or not.
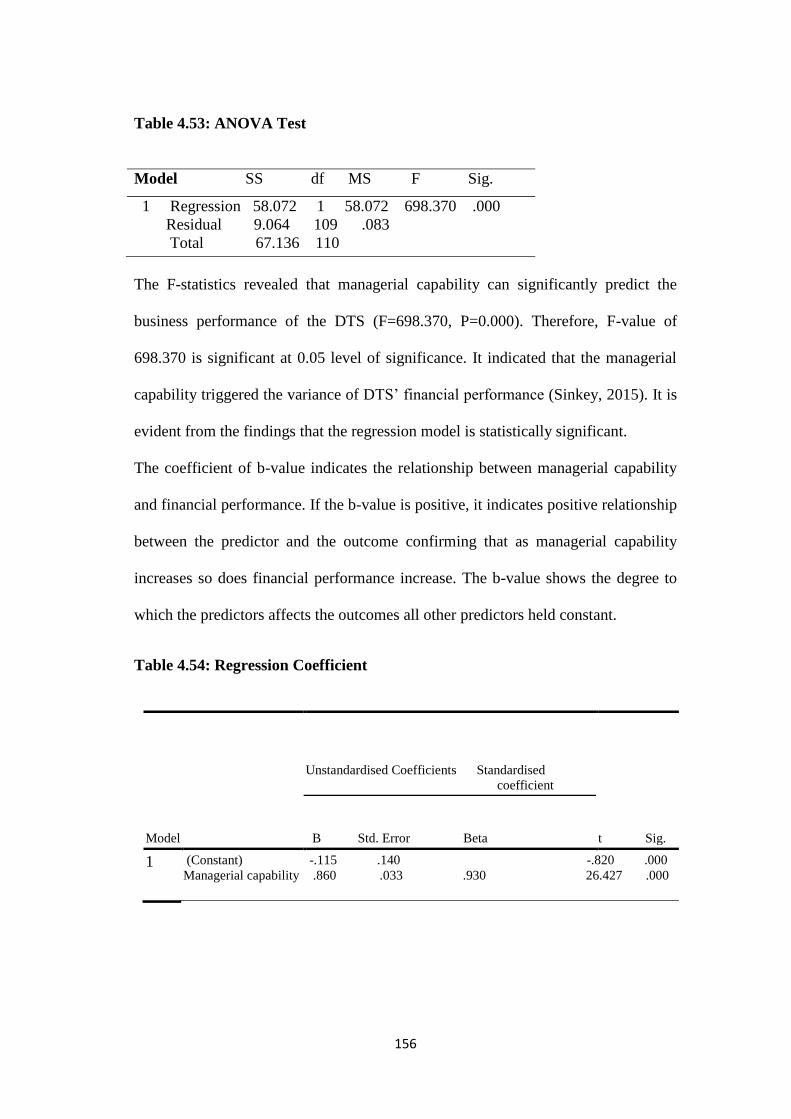
156
Table 4.53: ANOVA Test
Model SS df MS F Sig.
1 Regression 58.072 1 58.072 698.370 .000
Residual 9.064 109 .083
Total 67.136 110
The F-statistics revealed that managerial capability can significantly predict the
business performance of the DTS (F=698.370, P=0.000). Therefore, F-value of
698.370 is significant at 0.05 level of significance. It indicated that the managerial
capability triggered the variance of DTS‘ financial performance (Sinkey, 2015). It is
evident from the findings that the regression model is statistically significant.
The coefficient of b-value indicates the relationship between managerial capability
and financial performance. If the b-value is positive, it indicates positive relationship
between the predictor and the outcome confirming that as managerial capability
increases so does financial performance increase. The b-value shows the degree to
which the predictors affects the outcomes all other predictors held constant.
Table 4.54: Regression Coefficient
Model
Unstandardised Coefficients Standardised
coefficient
t Sig. B Std. Error Beta
1 (Constant) -.115 .140 -.820 .000
Managerial capability .860 .033 .930 26.427 .000

157
Managerial capability has b-value of 0.860. This value indicates that if managerial
capability is increased by a unit, performance will be increased by 0.860 units if the
effects of other predictors are held constant. Since the t-value (26.427) and b-value
0.860 are significant as the p-value (0.000) is less than 0.05 significance level. Then,
it is true only to say that managerial capability is making a significant contribution
to the model. The null hypothesis was rejected as managerial capability has a
significant influence on performance of DTS in Kenya.
The predictor variables which affect managerial capability include the following:
research and development, qualified staff and financial innovation. All business
enterprises embrace research and development. It will enhance effectiveness and
efficiency in running business operations (Samaha & Dahawy, 2015). Hence, it
improves the financial performance of SACCOs. Qualified staff is assets to any
economic entities. They minimise wastage of resources. They are also creative and
innovative. Financial innovation creates new products and processes in a firm.
Deposit-taking societies should embrace it in order to prosper (Kabiru, 2013).
Every manager has to perform management function within a broad framework of
business environment that is composed of ever changing variables, factors or forces,
both internal and external to the SACCO. These variables are interdependent and
interconnected. The ability of a manager to interact effectively with the environment
determines the SACCO‘s survival and growth. The environment comprises various
factors (forces, circumstances, conditions or influences) that affect the functioning
of the society, and each of the managerial decisions. It offers both opportunities and
threats. Business environment refers to the relevant forces that affect managerial
158
decisions. It mainly includes external and uncontrollable forces like political, legal,
macroeconomic, socio-cultural, technological, and competitive forces for which a
manager has no control.
Environment diagnosis and analysis are crucial issues in this study of business
environment. It involves identifying the type of problem (declining trend of licensed
deposit-taking SACCOs) by signs and symptoms. Symptoms are the set of
conditions that indicate the existence of a problem. For example, declining trend of
licensed deposit-taking societies is a symptom that indicates something is wrong
with one or more departments of the SACCOs. Remember that an indication itself is
not a problem, but it indicates an existence of a problem. Analysis shows the
detailed and systematic study of each aspect related to the SACCO. The analysis
depends on diagnosis. It involves dividing an issue into small pieces and examining
each piece in detail (Teoh & Hwang, 2014). A manager can suggest action by
diagnosing and analysing the business environment. Diagnosis and analysis help to
identify the overall health of the society and form the basis for corrective action.
Environment diagnosis and analysis are critical information for a plan. Besides the
current environment, the future trends are important for planning. Environment
diagnosis should concentrate on finding the factors (problems, opportunities and
most critical threats) for the plan about the SACCOs‘ objectives. It only involves
identification of the relevant aspects. Environment analysis is an attempt to study the
relevant forces about the SACCOs‘ internal situation. The analysis aims at the
detailed study of the factors comprising the micro economics and macroeconomics
environments to show a meaningful picture of the same. It guides the SACCO about

159
the amount and manner of efforts required to solve the problem. Hence, both
diagnosis and analysis are indispensable for formulating a business strategy.
Environment plays a vital role in determining the degrees of success of the SACCO.
The SACCO can realise its objectives to the extent the environment favours. It
survives and grows by constant interaction with its external environment and dies if
it stops interacting. A SACCO has to constantly adjust and readjust with dynamic
business cycle by changing and modifying its internal environment. A manager
needs to have a thorough understanding of the environmental forces and should be
responsive to them. The present of opportunities and threats depends upon the
capacity of its internal environment (SACCO‘s strength) and favourableness of its
external environment. It involves response in term of import from and exports to the
environment. Diagnosis and analysis help in assessing the SACCO‘s strengths and
weaknesses about the outside forces (Thomas, Nelson & Silver, 2011).
A SACCO enterprise can adopt to its external changes only when it is internally
capable and fit. Therefore, it is essential that internal forces constituting SACCO‘s
climate should also be diagnosed and analysed. Internal environment consists of the
following factors: resource ability, elementary policies and procedures, SACCO
structure, lending forecasting, capital investment, a degree of cooperation among
departments and employees‘ morale and loyalty (Rudani, 2011; Suchman, 2015).
Professionalism relates to formal education and training, and other professional
norms. Professional managers indicate suitably qualified, adequately trained, and
efficiency oriented competent and sophisticated persons who can strive for excellent
performance. Professional etiquette regarding to appearance, professional

160
knowledge and skills, professional thinking and professional behaviour are crucial
assets. Professionally managed SACCO implies that professional norms are put in
place. It also strives for excellence in performance. Besides business activities,
professional management can also apply to other fields of human activities, like
education, politics, government offices and even philanthropic activities.
According to Prasad (Rudani, 2011), seven conditions to professional management
has to be considered. First, commitment should insist in defining knowledge and
techniques professionally. SACCO should recruit managers with business related
training so that it can assist him in making prudent decision making. Second, it
should embrace the application of relevant modern management tools and
techniques. These tools facilitate judicious utilisation of financial as well as non-
financial resources of the society (Thomas, 2009). Third, it should include team
approach in managing the firm rather than emphasising personal style, whims, and
prejudice. It should embrace teamwork so that it can achieve the intended goals of
the society. It can encourage employees to purchase shares so that it can own the
firm. Fourth, it should be prepared to accept change management. Fifth, competence
rather than birth should be the basis for promotion in the SACCO ladder. Sixth, it
should embrace optimisation-oriented decision making to optimise the benefits to
the SACCO and its constituents. Seventh, the SACCO should be responsive to the
welfare of society and be guided by national policies.
Quality refers to a level of excellence in a given organisation. Its features include:
character, beliefs, ethics, mission, aspirations, behaviour and performance of a
person. Quality leadership thus relate to how effectively the leader behaves and
performs their role. Such performance is determined by the coordinator, staff and
161
members. The quality of leadership, therefore, depends upon the ability of a leader
to ensure propriety and excellence in the conduct and performance of his SACCO,
members and self.
The ability of a leader to ensure propriety and excellence in all aspects of
responsibility is referred to as total quality leadership which is characterized by
successful discharge of leadership role, ethical propriety in selection and pursuit of
mission and goals of leadership, ethical and real approach in performance of
leadership roles, excellence in optimisation of wellbeing and output of the SACCO,
members and leader, propriety in adherence to the socio-economic-moral-legal
norms of the society and state, and directives of the controlling authority by the
leader, SACCO and members and all round propriety and excellence in the
discharge of leadership roles ( Bhatti, 2014; UNCTAD, 2014).
The quality of leadership helps a leader to gain and maintain support of the authority
in controlling members. Leadership quality enables employees to outmatch
competitors and sustain supremacy in leadership. It keeps the confidence and respect
of the members. It helps in keeping head high and performing roles with vigour. A
leader should, therefore, ensure that performance of activities helps in achieving
total quality performance (Willis, 2013). SACCOs should embrace total quality
leadership criteria when picking their Board of Directors. Poor leadership has ruined
many SACCOs in Kenya. Board of Directors may be elected to a leadership position
because of political interference.
In law, there is a separation between the ownership and management of a corporate
body. It creates an agency relationship between the managers and the SACCO‘s
members. The directors are the agents of the ordinary membership who are the

162
principals. The directors are elected by the membership at the Annual General
Meeting (AGM). If the performance of the directors is questionable or not
satisfactory, the members withdraw their services. The executives‘ position in the
society is that of agents or stewards (Tsamenyi, Enninful & Onmah, 2016). The top
management must make decisions consistent with the members‘ aspiration of wealth
maximisation. The directors who are agents must organise the resources of the entity
such that the members get maximum returns from the decision made.
Conflict arises because making decisions that maximise the wealth of the members
require subordination of management‘s interests and goals for the overall SACCO
goals. In reality, it is not easy to achieve. The directors who on the other hand are
employees of the society would want to maximise the benefits from the society
(Wambua, 2015). The employees want an attractive salary, to live in luxurious
houses paid for by the SACCO, drive expensive cars courtesy of the SACCO‘s
resources. Generally, the societies have most of their commitments cater for all these
benefits. Then, the wealth of the members will not be maximised and this is the
point of conflict.
Some unscrupulous directors will take advantage of the ignorance of most of the
members and abuse office by taking SACCO reserves for their own use. When the
society is not performing well financially, particularly as opposed to other SACCOs
in the industry, there is a tendency of the members to remove the directors.
Unscrupulous executives who know that if re-elected may take away with some of
the SACCO‘s resources and manipulate the books of accounts. The agency problem
touches the lenders. Although lenders such as bankers do not have the power to
appoint the directors, the Cooperative Act Cap 490 of Kenya laws empowers them

163
to petition the court to appoint receivers to manage the affairs of the society in case
the SACCO is in financial distress. The receivers then act as agents of the lenders.
However, to create this relationship the creditor in question must be secured
(Naituli, 2011, Unerman, 2014).
According to Naituli (2011), SACCOs must incur agency costs to safeguard their
interests in the society. The expenditures are meant to check on the performance of
the directors. It actually reports incidences of directors taking advantage of the firm
resources for their gains. These costs include; external auditing, forming audit
committees, fair remuneration of the directors, and SASRA‘s supervision, all of
which would subject the affairs of the SACCO to light scrutiny.
4.7 Moderated Effect of Capital Adequacy Framework and Financial
Performance
Funds allocation strategy was introduced to regression model to establish the
moderating effect on capital adequacy framework towards business performance of
DTS in Kenya. Any change in the adjusted R squared determines moderating effect.
The regression analysis was conducted for each independent variable and the
dependent variable to determine the individual moderating influence of each
determinant of business performance. The model predicts the outcome from the
independent variable, the moderator and the interaction of the two (Field, 2015).
According to Mathuya (2016), the change in the coefficient of determination for the
interaction variable is positive and significant, then it means the moderating effect
exists. The moderation hypothesis is supported.

164
The hypothesis was tested by regressing each interaction variable with financial
performance. The result showed that funds allocation strategy moderate capital
adequacy framework towards financial performance. The null hypothesis is rejected.
Model 1 is before moderating whereas model 2 is after moderating.
Table 4.55: Model Summary
Change statistic
Model R R2
Adj R2 SE R
2change F change Sig.
1 X1 0.402 0.162 0.160 0.439 0.162 1906.166 0.000
X2 0.324 0.105 0.103 0.198 0.105 1603.824 0.000
X3 0.311 0.097 0.96 0.178 0.097 2016.993 0.000
X4 0.409 0.167 0.166 0.288 0.167 698.370 0.000
X5 0.583 0.340 0.339 0.240 0.340 1060.122 0.000
X6 0.724 0.524 0.522 0.516 0.524 799.876 0.000
2 X1*Z 0.405 0.164 0.162 0.437 0.164 1757.281 0.000
X2*Z 0.329 0.108 0.106 0.196 0.108 1468.250 0.000
X3*Z. 0.316 0.100 0.109 0.176 0.100 1987.342 0.000
X4*Z 0.411 0.169 0.168 0.286 0.169 487.678 0.000
X5*Z 0.585 0.342 0.341 0.239 0.342 949.819 0.000
X6*Z 0.731 0.534 0.532 0.514 0.534 658.578 0.000
Source : Author(2018)
Regression analysis was carried out to determine the effect of funds allocation
strategy on the relationship between capital adequacy framework and the financial
performance. The interaction between capital adequacy framework and funds
allocation strategy was computed and used in the regression model Y=β0 +
β1CAF*Z+ єi . Table 4.55 presents the model summary with the results of the
moderation analysis on the relationship between capital adequacy framework and
financial performance (Waleed, 2014). According to the results, the value of
adjusted R2 improved when the moderating variable was introduced. This indicates
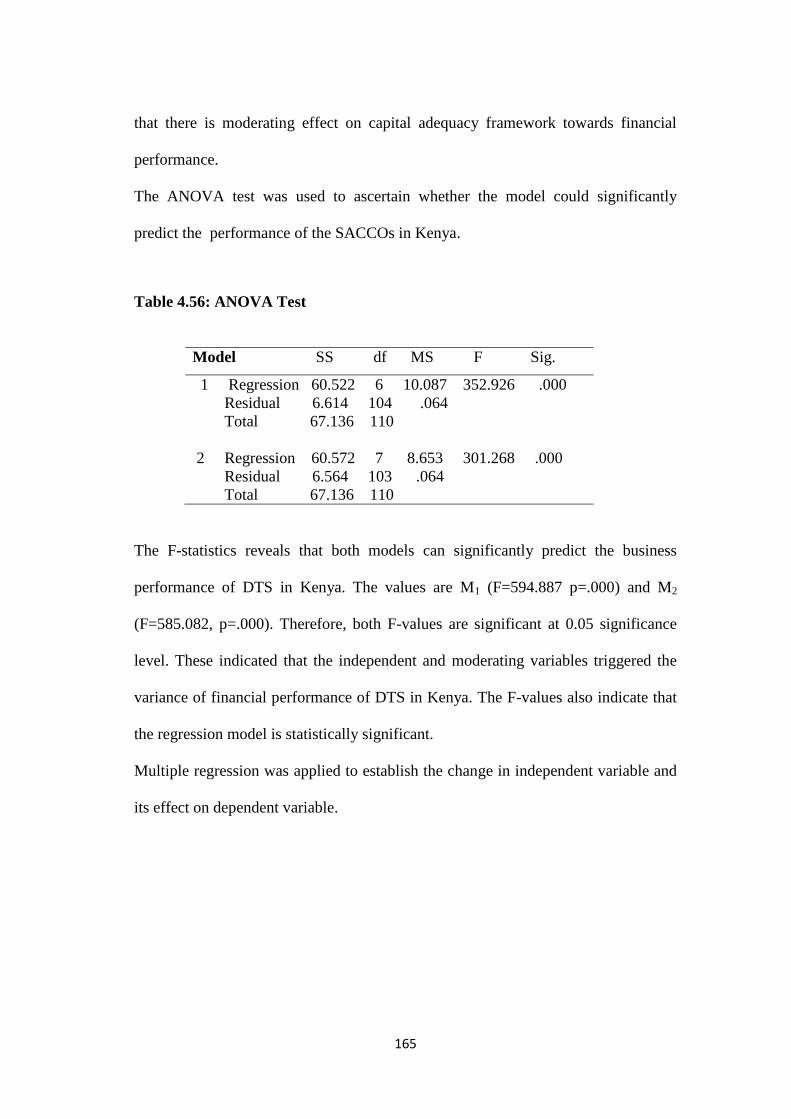
165
that there is moderating effect on capital adequacy framework towards financial
performance.
The ANOVA test was used to ascertain whether the model could significantly
predict the performance of the SACCOs in Kenya.
Table 4.56: ANOVA Test
Model SS df MS F Sig.
1 Regression 60.522 6 10.087 352.926 .000
Residual 6.614 104 .064
Total 67.136 110
2 Regression 60.572 7 8.653 301.268 .000
Residual 6.564 103 .064
Total 67.136 110
The F-statistics reveals that both models can significantly predict the business
performance of DTS in Kenya. The values are M1 (F=594.887 p=.000) and M2
(F=585.082, p=.000). Therefore, both F-values are significant at 0.05 significance
level. These indicated that the independent and moderating variables triggered the
variance of financial performance of DTS in Kenya. The F-values also indicate that
the regression model is statistically significant.
Multiple regression was applied to establish the change in independent variable and
its effect on dependent variable.
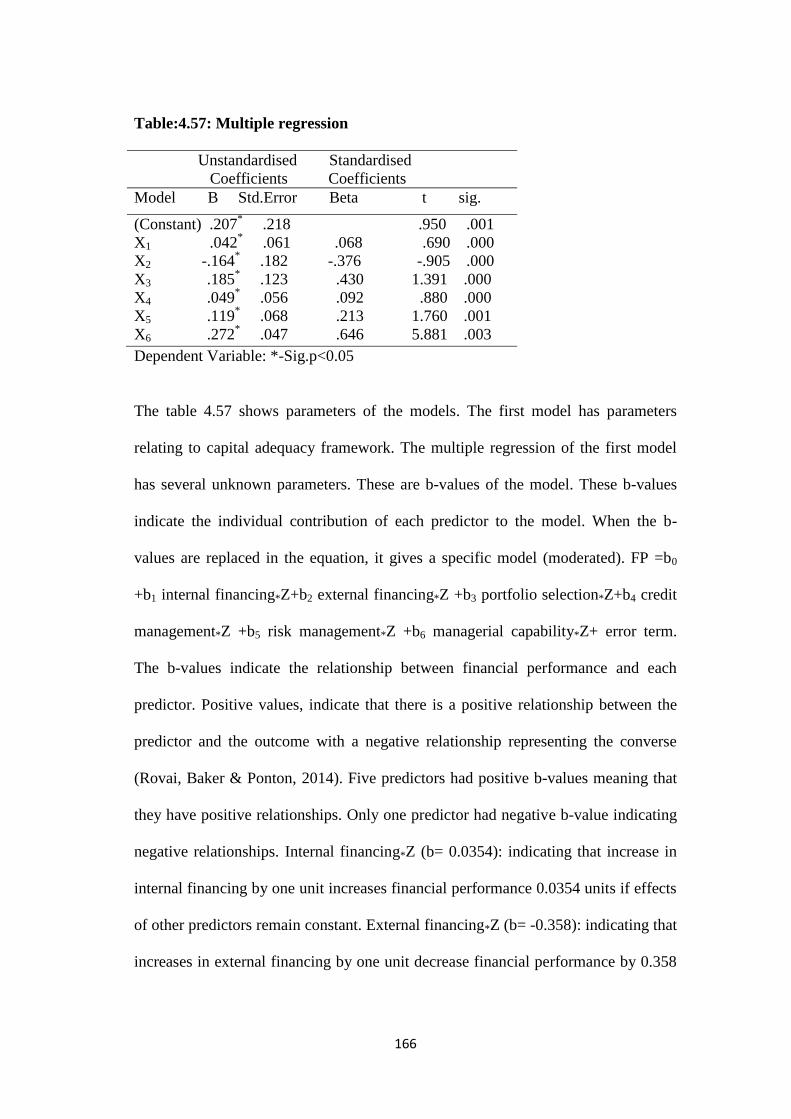
166
Table:4.57: Multiple regression
Unstandardised Standardised
Coefficients Coefficients
Model B Std.Error Beta t sig.
(Constant) .207* .218 .950 .001
X1 .042* .061 .068 .690 .000
X2 -.164* .182 -.376 -.905 .000
X3 .185* .123 .430 1.391 .000
X4 .049* .056 .092 .880 .000
X5 .119* .068 .213 1.760 .001
X6 .272* .047 .646 5.881 .003
Dependent Variable: *-Sig.p<0.05
The table 4.57 shows parameters of the models. The first model has parameters
relating to capital adequacy framework. The multiple regression of the first model
has several unknown parameters. These are b-values of the model. These b-values
indicate the individual contribution of each predictor to the model. When the b-
values are replaced in the equation, it gives a specific model (moderated). FP =b0
+b1 internal financing*Z+b2 external financing*Z +b3 portfolio selection*Z+b4 credit
management*Z +b5 risk management*Z +b6 managerial capability*Z+ error term.
The b-values indicate the relationship between financial performance and each
predictor. Positive values, indicate that there is a positive relationship between the
predictor and the outcome with a negative relationship representing the converse
(Rovai, Baker & Ponton, 2014). Five predictors had positive b-values meaning that
they have positive relationships. Only one predictor had negative b-value indicating
negative relationships. Internal financing*Z (b= 0.0354): indicating that increase in
internal financing by one unit increases financial performance 0.0354 units if effects
of other predictors remain constant. External financing*Z (b= -0.358): indicating that
increases in external financing by one unit decrease financial performance by 0.358

167
units where effects of other predictors remain constant. Portfolio selection*Z
(b=0.0225): indicating that a unit increase in portfolio selection increases financial
performance by 0.0225 units. It is only true if the effects of other predictors are held
constant. Credit management*Z (b=0.0759): indicating a unit increase in credit
management increases financial performance by 0.0759 units the effects of other
predictors remain constant. Risk management*Z (b=0.0488): indicating that a unit
increase in risk management increases financial performance by 0.0488 units if the
effects of other predictors are constant. Managerial capability*Z (b=0.0820):
indicating that an increase in managerial capability by one unit, increases financial
performance by 0.0820 units if the effects of other predictors are constant.
The regression coefficient b-values measure the interaction effect between capital
adequacy framework and moderating variable (Z). The regression coefficient b
measures simple effects of capital adequacy framework when the value of Z=0 that
is there is no interaction effects involved. The test of moderation is operationalised
by the product term CAF*Z. In order to test the moderation in a model, one needs to
test b-value of interaction term (CAF*Z). If b-value is significant, then one could
conclude that moderator variable Z moderates the relationship between capital
adequacy framework and business performance.
The table 4.57 presents un-standardised coefficients, the standardised beta
coefficients and t-test values which were used to test significance of the variables.
The model indicates that the intercept is .207. This means that if all independent
variables are zero then the fiscal performance of the DTS will be 0.207. The B-
values indicate the level of change of financial performance when the independent
variables change. When one unit increases of internal financing (X1), financial
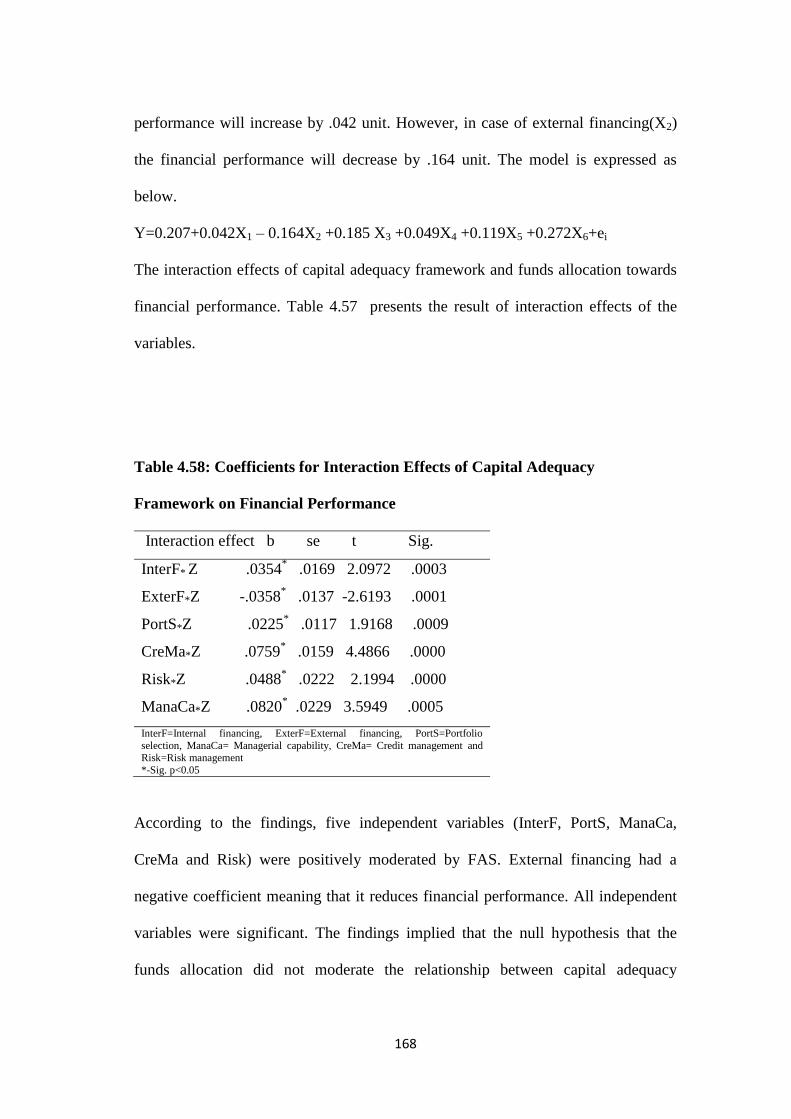
168
performance will increase by .042 unit. However, in case of external financing(X2)
the financial performance will decrease by .164 unit. The model is expressed as
below.
Y=0.207+0.042X1 – 0.164X2 +0.185 X3 +0.049X4 +0.119X5 +0.272X6+ei
The interaction effects of capital adequacy framework and funds allocation towards
financial performance. Table 4.57 presents the result of interaction effects of the
variables.
Table 4.58: Coefficients for Interaction Effects of Capital Adequacy
Framework on Financial Performance
Interaction effect b se t Sig.
InterF* Z .0354* .0169 2.0972 .0003
ExterF*Z -.0358* .0137 -2.6193 .0001
PortS*Z .0225* .0117 1.9168 .0009
CreMa*Z .0759* .0159 4.4866 .0000
Risk*Z .0488* .0222 2.1994 .0000
ManaCa*Z .0820* .0229 3.5949 .0005
InterF=Internal financing, ExterF=External financing, PortS=Portfolio
selection, ManaCa= Managerial capability, CreMa= Credit management and
Risk=Risk management
*-Sig. p<0.05
According to the findings, five independent variables (InterF, PortS, ManaCa,
CreMa and Risk) were positively moderated by FAS. External financing had a
negative coefficient meaning that it reduces financial performance. All independent
variables were significant. The findings implied that the null hypothesis that the
funds allocation did not moderate the relationship between capital adequacy
169
framework and business performance of DTS in Kenya was therefore rejected. The
findings support the proposition held by Kinyuira, Gatenya and Muturi (2014) that
funds allocation enhance financial performance.
In the second model, it shows that movement of b-values did not change but the
magnitudes change. Funds allocation strategy (Z) moderated the effect of
independent variables on DTS financial performance. Internal financing embraced
building up institutional capital within the DTS. It is believed that this type of
capital will save the societies from external financing which is extremely expensive.
External financing attracted high interest rate which drained the societies‘ earnings.
Some societies have been delicensed because of over borrowing. These societies had
problems in managing financial resources of the societies. Most of the managers did
not have business related qualifications which could have assisted them in making
prudent portfolio selection. Investments were done haphazardly. Some societies
invested in unviable projects, these projects were later sold at a lower price resulting
in capital loss. Fraud was also common in various societies. The internal control
system in these deposit-taking SACCOs is poor. It needs improvement so that the
financial resources of members are safeguarded. Audit department should recruit
qualified auditors so that they could instil reliable internal control system.
Funds allocation strategy was a moderating variable (Thuo, Muturi & Njeru, 2013).
The predictor variables were tactical and strategic assets. With adequate capital, both
financial and non-financial, the business performance of deposit-taking societies is
improved. Resources are invested in tactical as well as strategic assets prudently.
Funds allocation encompasses many investment activities in assets and securities.
They are dynamic and flexible operations. The objective of this service is to help
170
investors when selecting securities. The process of funds allocation involves a
logical set of steps common to any decision regarding planning stage, implementing
stage and monitoring and controlling stage (Hampton, 2013). The planning stage is
the most important element of proper funds allocation. This involves a careful
review in conducting the investor‘s financial situation and current primary and
secondary conditions. In the planning stage the following activities need to be taken
into consideration namely; investor conditions, market conditions, investment
policies and strategic allocation. Investor conditions measure regarding the financial
situation as marketable as non-marketable assets and liabilities, knowledge of the
fund‘s allocation and risk tolerance of the portfolio. This stage involves identifying
investor aspirations, conditions and problems of the business situation in marketable
and non-marketable assets (Gitman, 2011). The investor must know financial status
fully. The society‘s knowledge of various securities also has an impact on the
primary and secondary market. The investor must be aware that yearly equity returns
are quite variable, short-term returns on bonds. Finally, the investor considers risk of
losing financial return.
Market conditions in terms of short-term expectations and long term expectations. In
long-term expectations involved in the portfolio‘s strategic asset allocation differs
from the short-term asset allocation. According to Sharpe et al., (2011), strategic
asset allocation refers to how a portfolio‘s funds would be shared among various
sectors. Portfolio manager‘s long term forecasts of expected returns, variances and
co-variances guide allocation. Tactical asset allocation refers to how these funds are
shared at any particular moment, given the investor‘s short term forecasts. Hence,
the former reflects what the portfolio manager would do for long–term, and the latter
171
mirrors what he or she would do under current market conditions. Market conditions
tie to inflation and consumption of investment.
Investor policies are specified in terms of allocating assets strategically, speculative
strategy and internal or external management. Investor makes decisions regarding
assets. Asset allocation refers to the percentage invested in various securities such as
money market investment, fixed income obligations, financial instruments,
economic investment and financial investments (Viru, 2014). Investors estimate risk
from the securities and portfolio of the current scenario. After the investor has
determined a current strategic asset allocation and decided how to rebalance the
allocation passively with the value of assets changing with time as do occur
variations in prices of shares (Kumar et al., 2014). A decision is made as to the types
and amount of security speculation which will be allowed.
Implementation stage is the most important element of prudent investments and
speculation in portfolio. This involves a careful selection of securities investment in
different sectors such as industry, service and agriculture. The implementation stage
comprises rebalancing strategic and tactical allocation of assets and security
selection. Rebalance strategic asset allocation involves asset mix to the desired level
called for in strategic asset allocation. If investors believe that the price levels of
certain assets like industries or economic sectors are temporarily too high or too low,
actual portfolio holdings should depart from the asset mix (Madura, 2012). It should
invest in the strategic asset allocation. Tactical asset allocation should be embraced
instead of strategic asset allocation. Security selection involves speculation
involving selection of securities within given asset classes, industries or economic
sectors. Thus strategic asset allocation policies would require securities in the asset
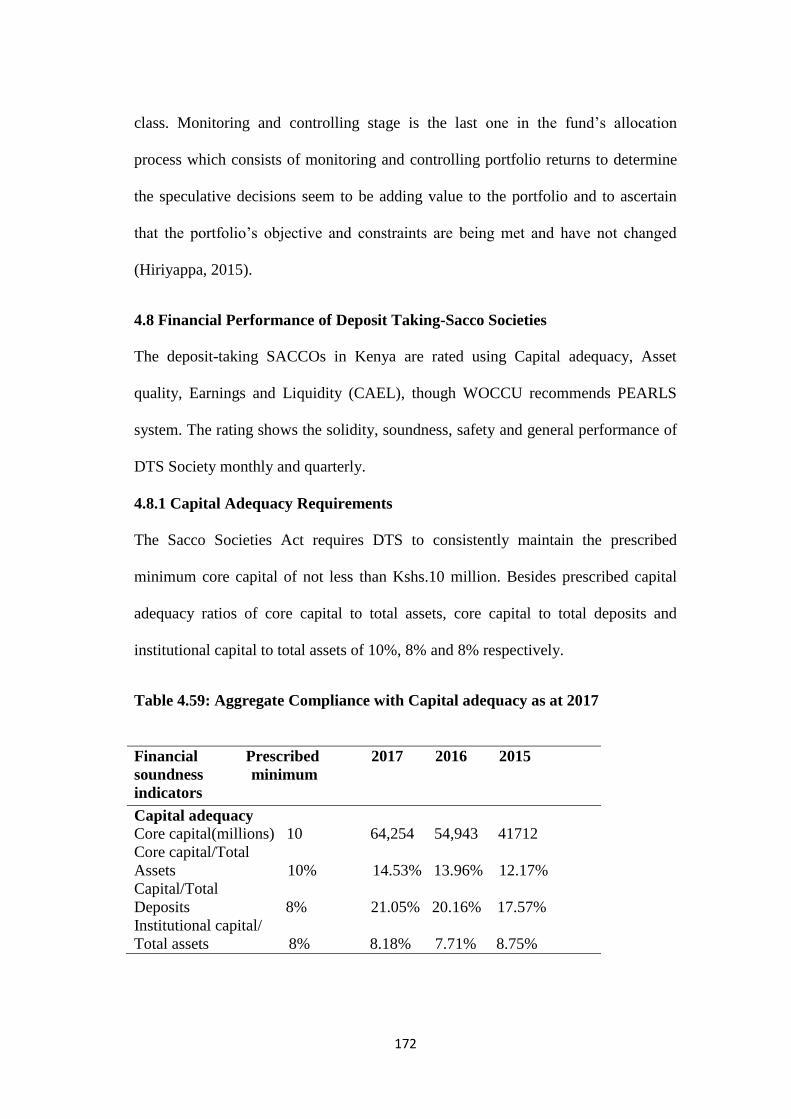
172
class. Monitoring and controlling stage is the last one in the fund‘s allocation
process which consists of monitoring and controlling portfolio returns to determine
the speculative decisions seem to be adding value to the portfolio and to ascertain
that the portfolio‘s objective and constraints are being met and have not changed
(Hiriyappa, 2015).
4.8 Financial Performance of Deposit Taking-Sacco Societies
The deposit-taking SACCOs in Kenya are rated using Capital adequacy, Asset
quality, Earnings and Liquidity (CAEL), though WOCCU recommends PEARLS
system. The rating shows the solidity, soundness, safety and general performance of
DTS Society monthly and quarterly.
4.8.1 Capital Adequacy Requirements
The Sacco Societies Act requires DTS to consistently maintain the prescribed
minimum core capital of not less than Kshs.10 million. Besides prescribed capital
adequacy ratios of core capital to total assets, core capital to total deposits and
institutional capital to total assets of 10%, 8% and 8% respectively.
Table 4.59: Aggregate Compliance with Capital adequacy as at 2017
Financial Prescribed 2017 2016 2015
soundness minimum
indicators
Capital adequacy
Core capital(millions) 10 64,254 54,943 41712
Core capital/Total
Assets 10% 14.53% 13.96% 12.17%
Capital/Total
Deposits 8% 21.05% 20.16% 17.57%
Institutional capital/
Total assets 8% 8.18% 7.71% 8.75%
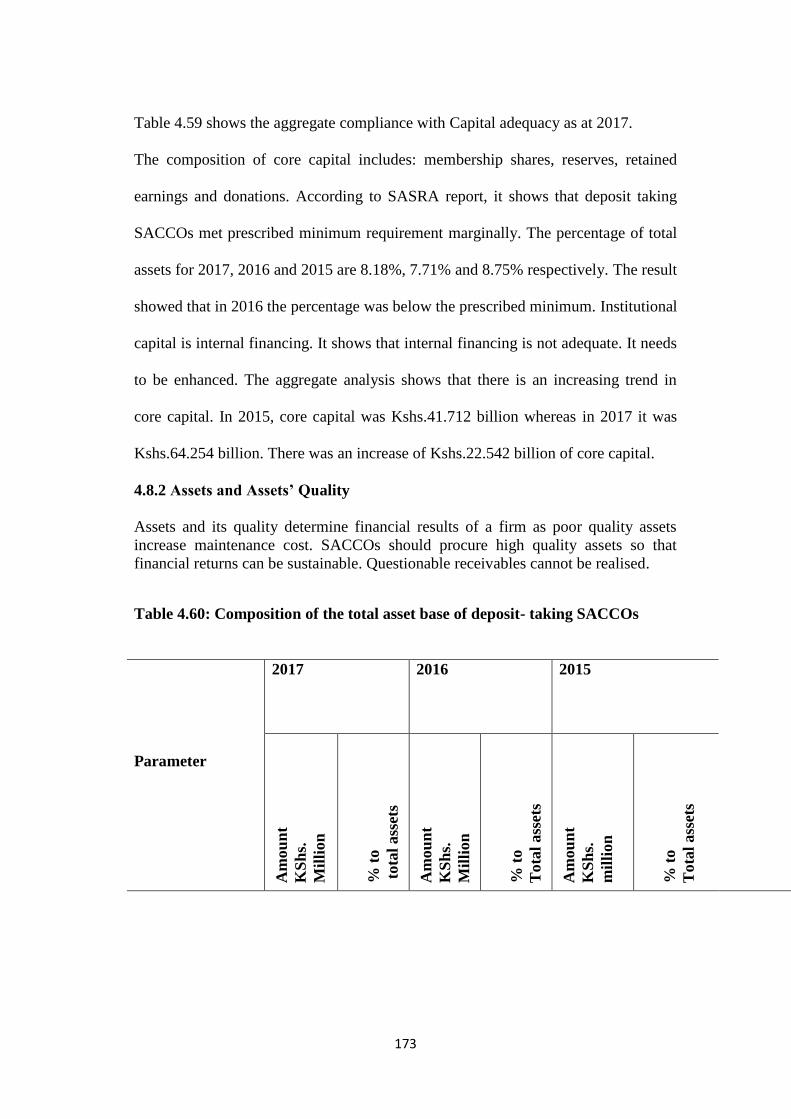
173
Table 4.59 shows the aggregate compliance with Capital adequacy as at 2017.
The composition of core capital includes: membership shares, reserves, retained
earnings and donations. According to SASRA report, it shows that deposit taking
SACCOs met prescribed minimum requirement marginally. The percentage of total
assets for 2017, 2016 and 2015 are 8.18%, 7.71% and 8.75% respectively. The result
showed that in 2016 the percentage was below the prescribed minimum. Institutional
capital is internal financing. It shows that internal financing is not adequate. It needs
to be enhanced. The aggregate analysis shows that there is an increasing trend in
core capital. In 2015, core capital was Kshs.41.712 billion whereas in 2017 it was
Kshs.64.254 billion. There was an increase of Kshs.22.542 billion of core capital.
4.8.2 Assets and Assets’ Quality
Assets and its quality determine financial results of a firm as poor quality assets
increase maintenance cost. SACCOs should procure high quality assets so that
financial returns can be sustainable. Questionable receivables cannot be realised.
Table 4.60: Composition of the total asset base of deposit- taking SACCOs
Parameter
2017
2016
2015
Am
ou
nt
KS
hs.
Mil
lion
% t
o
tota
l ass
ets
Am
ou
nt
KS
hs.
Mil
lion
% t
o
Tota
l ass
ets
Am
ou
nt
KS
hs.
mil
lion
% t
o
Tota
l ass
ets
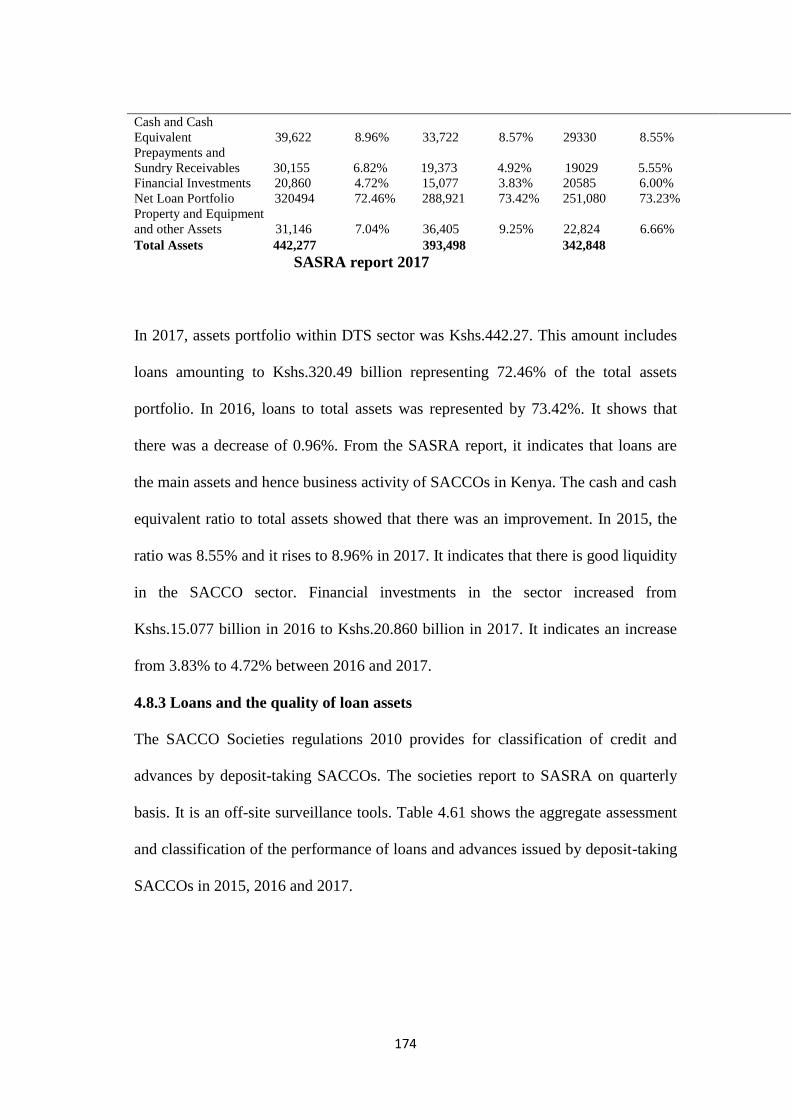
174
Cash and Cash
Equivalent 39,622 8.96% 33,722 8.57% 29330 8.55%
Prepayments and
Sundry Receivables 30,155 6.82% 19,373 4.92% 19029 5.55%
Financial Investments 20,860 4.72% 15,077 3.83% 20585 6.00%
Net Loan Portfolio 320494 72.46% 288,921 73.42% 251,080 73.23%
Property and Equipment
and other Assets 31,146 7.04% 36,405 9.25% 22,824 6.66%
Total Assets 442,277 393,498 342,848
SASRA report 2017
In 2017, assets portfolio within DTS sector was Kshs.442.27. This amount includes
loans amounting to Kshs.320.49 billion representing 72.46% of the total assets
portfolio. In 2016, loans to total assets was represented by 73.42%. It shows that
there was a decrease of 0.96%. From the SASRA report, it indicates that loans are
the main assets and hence business activity of SACCOs in Kenya. The cash and cash
equivalent ratio to total assets showed that there was an improvement. In 2015, the
ratio was 8.55% and it rises to 8.96% in 2017. It indicates that there is good liquidity
in the SACCO sector. Financial investments in the sector increased from
Kshs.15.077 billion in 2016 to Kshs.20.860 billion in 2017. It indicates an increase
from 3.83% to 4.72% between 2016 and 2017.
4.8.3 Loans and the quality of loan assets
The SACCO Societies regulations 2010 provides for classification of credit and
advances by deposit-taking SACCOs. The societies report to SASRA on quarterly
basis. It is an off-site surveillance tools. Table 4.61 shows the aggregate assessment
and classification of the performance of loans and advances issued by deposit-taking
SACCOs in 2015, 2016 and 2017.
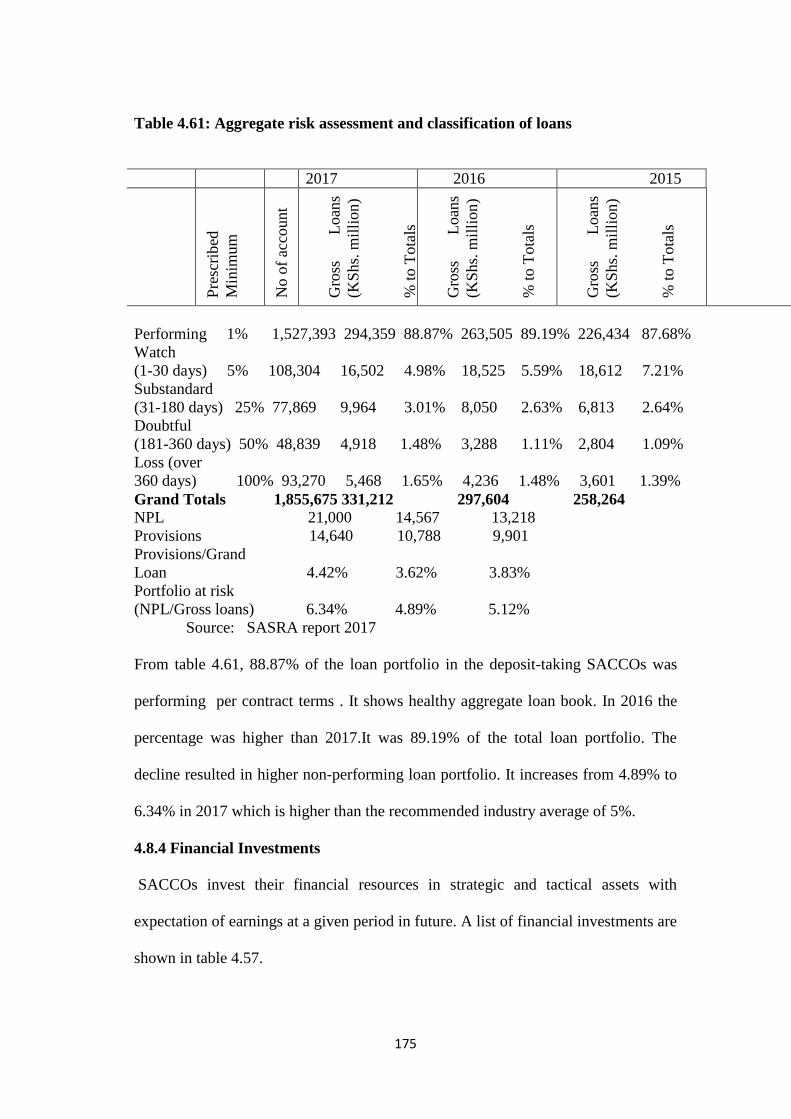
175
Table 4.61: Aggregate risk assessment and classification of loans
2017 2016 2015
Pre
scri
bed
Min
imum
No o
f ac
count
Gro
ss
Loan
s
(KS
hs.
mil
lion
)
% t
o T
ota
ls
Gro
ss
Loan
s
(KS
hs.
mil
lion
)
% t
o T
ota
ls
Gro
ss
Loan
s
(KS
hs.
mil
lion
)
% t
o T
ota
ls
Performing 1% 1,527,393 294,359 88.87% 263,505 89.19% 226,434 87.68%
Watch
(1-30 days) 5% 108,304 16,502 4.98% 18,525 5.59% 18,612 7.21%
Substandard
(31-180 days) 25% 77,869 9,964 3.01% 8,050 2.63% 6,813 2.64%
Doubtful
(181-360 days) 50% 48,839 4,918 1.48% 3,288 1.11% 2,804 1.09%
Loss (over
360 days) 100% 93,270 5,468 1.65% 4,236 1.48% 3,601 1.39%
Grand Totals 1,855,675 331,212 297,604 258,264
NPL 21,000 14,567 13,218
Provisions 14,640 10,788 9,901
Provisions/Grand
Loan 4.42% 3.62% 3.83%
Portfolio at risk
(NPL/Gross loans) 6.34% 4.89% 5.12%
Source: SASRA report 2017
From table 4.61, 88.87% of the loan portfolio in the deposit-taking SACCOs was
performing per contract terms . It shows healthy aggregate loan book. In 2016 the
percentage was higher than 2017.It was 89.19% of the total loan portfolio. The
decline resulted in higher non-performing loan portfolio. It increases from 4.89% to
6.34% in 2017 which is higher than the recommended industry average of 5%.
4.8.4 Financial Investments
SACCOs invest their financial resources in strategic and tactical assets with
expectation of earnings at a given period in future. A list of financial investments are
shown in table 4.57.
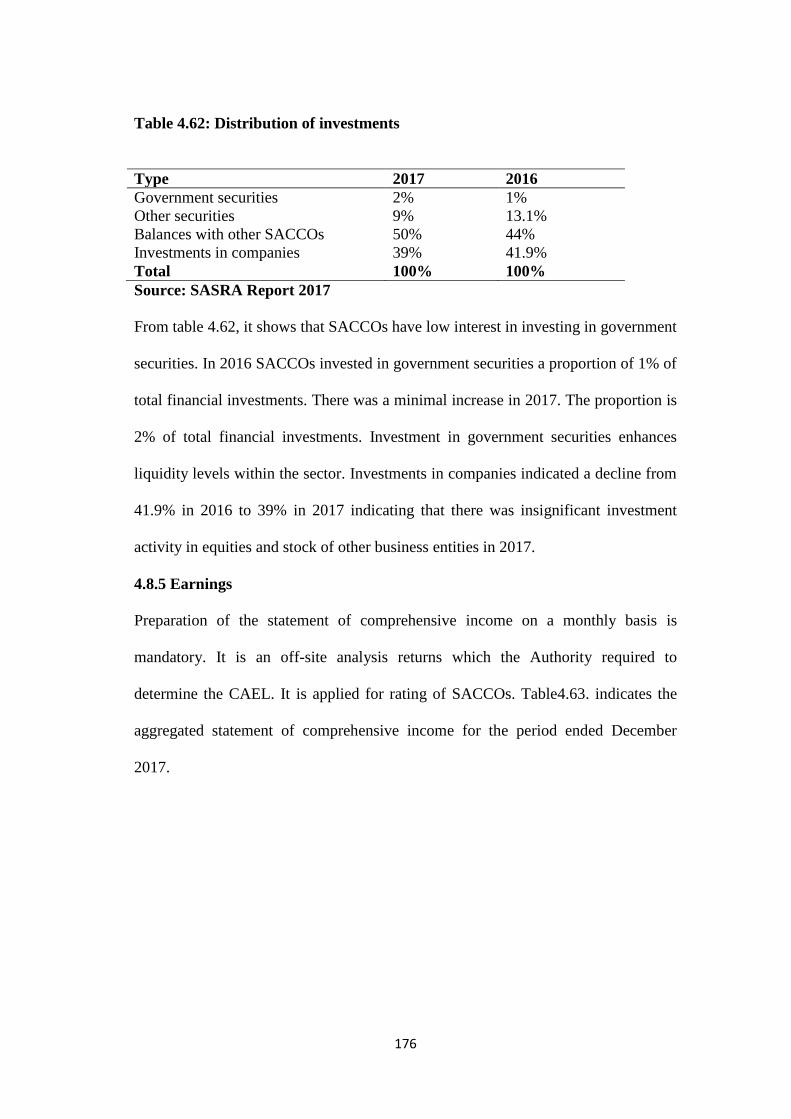
176
Table 4.62: Distribution of investments
Type 2017 2016
Government securities 2% 1%
Other securities 9% 13.1%
Balances with other SACCOs 50% 44%
Investments in companies 39% 41.9%
Total 100% 100%
Source: SASRA Report 2017
From table 4.62, it shows that SACCOs have low interest in investing in government
securities. In 2016 SACCOs invested in government securities a proportion of 1% of
total financial investments. There was a minimal increase in 2017. The proportion is
2% of total financial investments. Investment in government securities enhances
liquidity levels within the sector. Investments in companies indicated a decline from
41.9% in 2016 to 39% in 2017 indicating that there was insignificant investment
activity in equities and stock of other business entities in 2017.
4.8.5 Earnings
Preparation of the statement of comprehensive income on a monthly basis is
mandatory. It is an off-site analysis returns which the Authority required to
determine the CAEL. It is applied for rating of SACCOs. Table4.63. indicates the
aggregated statement of comprehensive income for the period ended December
2017.
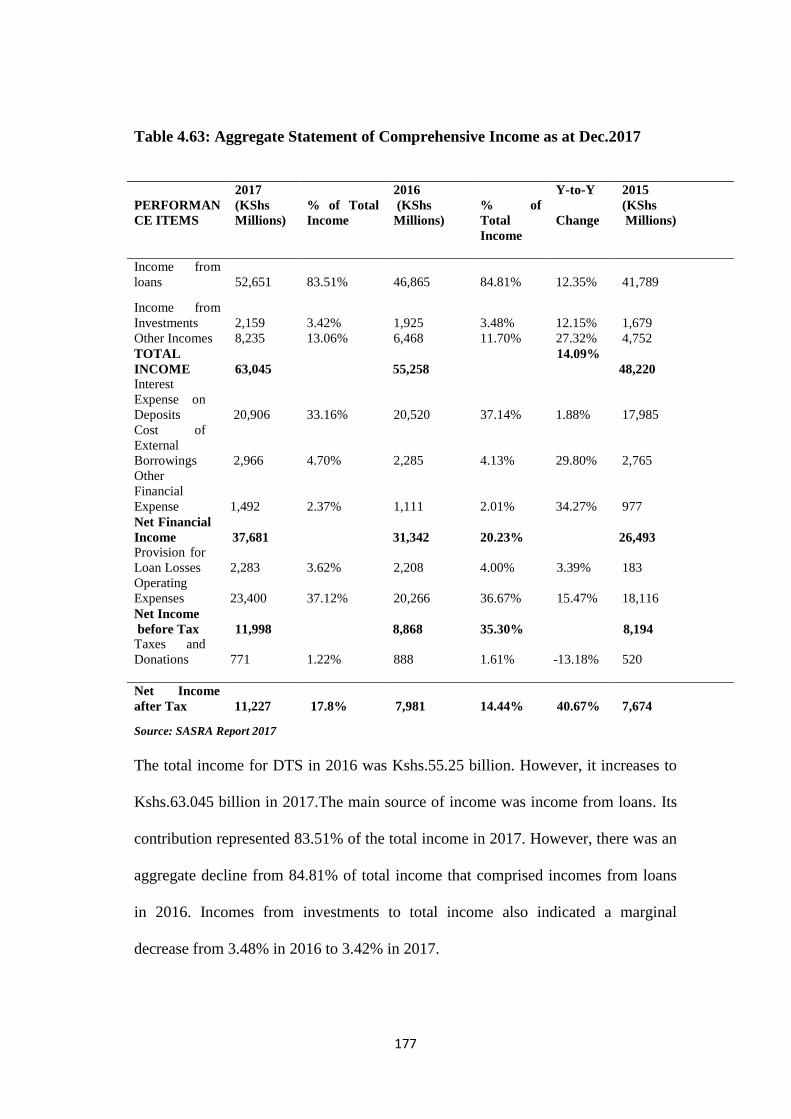
177
Table 4.63: Aggregate Statement of Comprehensive Income as at Dec.2017
PERFORMAN
CE ITEMS
2017
(KShs
Millions)
% of Total
Income
2016
(KShs
Millions)
% of
Total
Income
Y-to-Y
Change
2015
(KShs
Millions)
Income from
loans
52,651
83.51%
46,865
84.81%
12.35%
41,789
Income from
Investments
2,159
3.42%
1,925
3.48%
12.15%
1,679
Other Incomes 8,235 13.06% 6,468 11.70% 27.32% 4,752
TOTAL
INCOME
63,045
55,258
14.09%
48,220 Interest
Expense on
Deposits
20,906
33.16%
20,520
37.14%
1.88%
17,985
Cost of
External
Borrowings
2,966
4.70%
2,285
4.13%
29.80%
2,765
Other
Financial
Expense
1,492
2.37%
1,111
2.01%
34.27%
977
Net Financial
Income
37,681
31,342
20.23%
26,493 Provision for
Loan Losses
2,283
3.62%
2,208
4.00%
3.39%
183
Operating
Expenses
23,400
37.12%
20,266
36.67%
15.47%
18,116
Net Income
before Tax
11,998
8,868
35.30%
8,194 Taxes and
Donations
771
1.22%
888
1.61%
-13.18%
520
Net Income
after Tax
11,227
17.8%
7,981
14.44% 40.67%
7,674
Source: SASRA Report 2017
The total income for DTS in 2016 was Kshs.55.25 billion. However, it increases to
Kshs.63.045 billion in 2017.The main source of income was income from loans. Its
contribution represented 83.51% of the total income in 2017. However, there was an
aggregate decline from 84.81% of total income that comprised incomes from loans
in 2016. Incomes from investments to total income also indicated a marginal
decrease from 3.48% in 2016 to 3.42% in 2017.

178
4.8.6 Liquidity
Section 30 of the Act and Regulation 13(2) of the Regulations 2010 require
SACCOs to maintain a minimum of fifteen (15%) percent of its savings deposits
and short-term liabilities in liquid assets. Table4.58 shows the aggregate level of
compliance with the statutory liquidity ratios.
Table 4.64 : Comparative aggregate liquidity levels of DT-SACCOs
Liquidity Ratio
2017
2016
2015
Liquid
Assets/Savings
Deposits and STLs
(Liquidity Ratio)
>=15%
54.10%
49.95%
55.90%
Liquid Assets/Total
Deposits
17.17%
18.05%
17.21%
External
Borrowings/Total
Assets
<=25%
4.83%
5.04%
5.21%
Liquid Assets/Total
Assets
11.85%
12.49%
11.93%
Total Loans/Total
Deposits
108.49%
108.39%
108.80%
*STLs – Short—Term Liabilities :SASRA report 2017
It is evident from the table 4.64 that liquidity of deposit-taking SACCOs in 2017
was very high. It was 54.1% as compared with 49.95% in 2016. Even though the
liquidity was high, the total number of deposit-taking SACCOs that comply with the
statutory provisions reduced from 165 in 2016 to 147 in 2017.
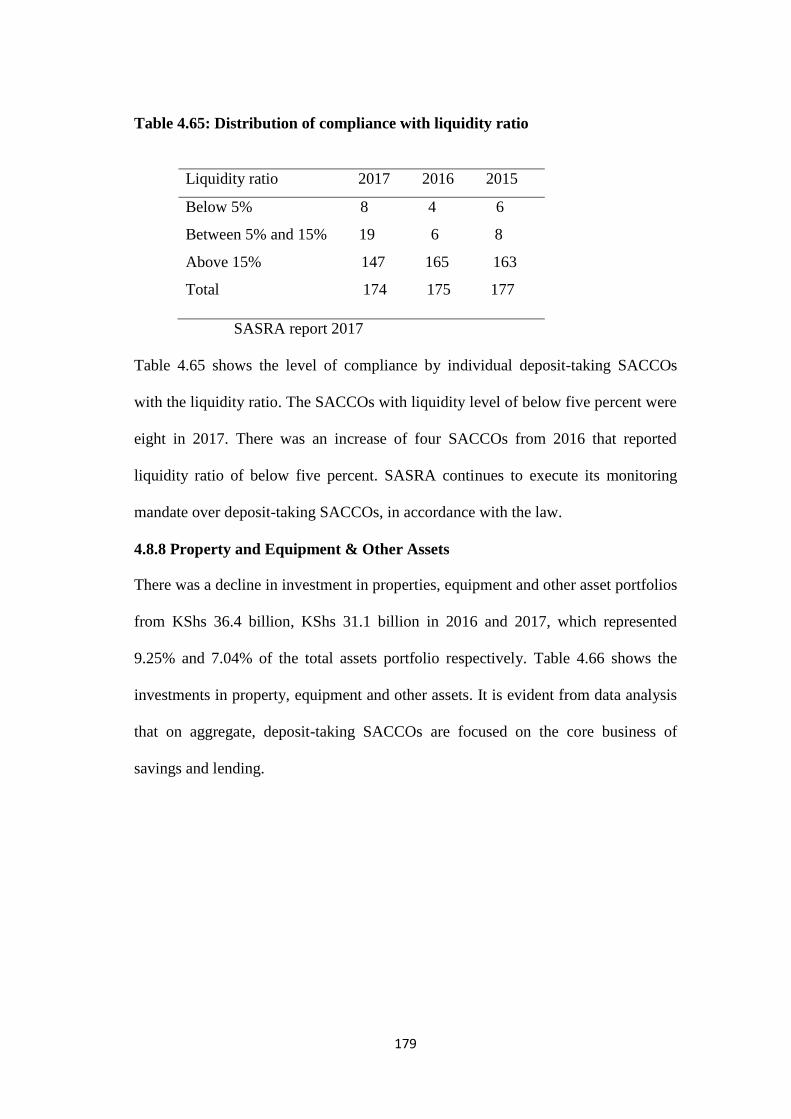
179
Table 4.65: Distribution of compliance with liquidity ratio
Liquidity ratio 2017 2016 2015
Below 5% 8 4 6
Between 5% and 15% 19 6 8
Above 15% 147 165 163
Total 174 175 177
SASRA report 2017
Table 4.65 shows the level of compliance by individual deposit-taking SACCOs
with the liquidity ratio. The SACCOs with liquidity level of below five percent were
eight in 2017. There was an increase of four SACCOs from 2016 that reported
liquidity ratio of below five percent. SASRA continues to execute its monitoring
mandate over deposit-taking SACCOs, in accordance with the law.
4.8.8 Property and Equipment & Other Assets
There was a decline in investment in properties, equipment and other asset portfolios
from KShs 36.4 billion, KShs 31.1 billion in 2016 and 2017, which represented
9.25% and 7.04% of the total assets portfolio respectively. Table 4.66 shows the
investments in property, equipment and other assets. It is evident from data analysis
that on aggregate, deposit-taking SACCOs are focused on the core business of
savings and lending.

180
Table 4.66: Composition of Property, Equipment and Other Assets Portfolio
2017 2016 2015
Amount
KShs.
Parameter Million
% of total
PPE
Amount
KShs.
Million
% of
total PPE
Y-to-Y
Change
Amount
KShs.
Million
Investment
Properties
5,813
18.67%
7,335
20.15%
-20.75%
4,452
Property and
Equipment
17,404
55.88%
14,412
39.59%
20.76%
12,590
Prepaid lease
rentals
756
2.43%
314
0.86%
140.65%
466
Intangible
Assets
1,679
5.39%
1,563
4.29%
7.43%
806
Other Assets 5,494 17.64% 12,781 35.11% -57.02% 4,510
22,824 TOTALS 31,146 100% 36,405
SASRA report 2017
The remarkable change reported is the decline in other assets portfolio. In 2016,
other assets portfolio was KShs. 12.781 billion but in 2017 the portfolio fell to
Kshs.5.494 billion. This is in line with the SASRA‘s vision from 2016 encouraging
deposit-taking SACCOs to reduce investments in other assets. Classification of other
assets in their financial statements will encourage fraudulent activities. Financial
crisis in 2007-08 was caused by real estate investment in United State of America.
4.8.9 External Borrowing
According to Sacco Societies Act 2008, deposit-taking SACCOs are required to
maintain an external borrowing to total assets ratio of not more than 25% at any
time.
Table 4.67: Trends in external borrowing ratio
Ratio 2017 2016 2015 2014
External borrowing 4.83% 5.04% 5.21% 6.43%
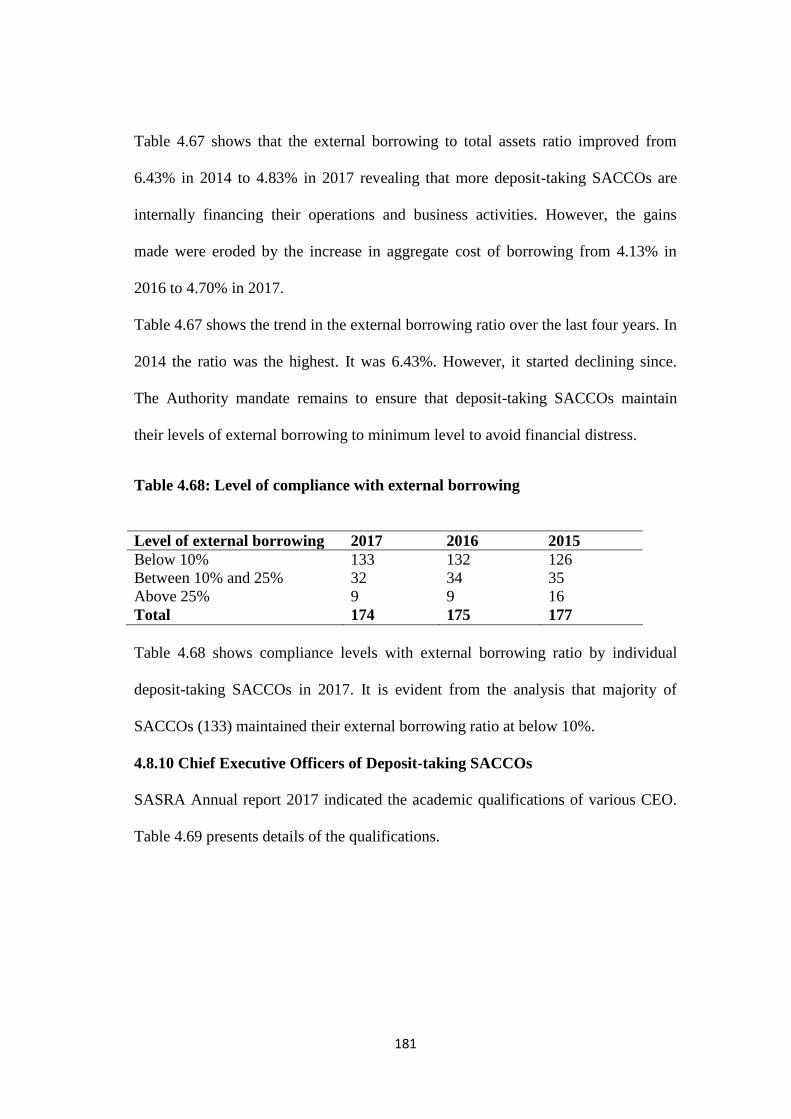
181
Table 4.67 shows that the external borrowing to total assets ratio improved from
6.43% in 2014 to 4.83% in 2017 revealing that more deposit-taking SACCOs are
internally financing their operations and business activities. However, the gains
made were eroded by the increase in aggregate cost of borrowing from 4.13% in
2016 to 4.70% in 2017.
Table 4.67 shows the trend in the external borrowing ratio over the last four years. In
2014 the ratio was the highest. It was 6.43%. However, it started declining since.
The Authority mandate remains to ensure that deposit-taking SACCOs maintain
their levels of external borrowing to minimum level to avoid financial distress.
Table 4.68: Level of compliance with external borrowing
Level of external borrowing 2017 2016 2015
Below 10% 133 132 126
Between 10% and 25% 32 34 35
Above 25%
Total
9
174
9
175
16
177
Table 4.68 shows compliance levels with external borrowing ratio by individual
deposit-taking SACCOs in 2017. It is evident from the analysis that majority of
SACCOs (133) maintained their external borrowing ratio at below 10%.
4.8.10 Chief Executive Officers of Deposit-taking SACCOs
SASRA Annual report 2017 indicated the academic qualifications of various CEO.
Table 4.69 presents details of the qualifications.
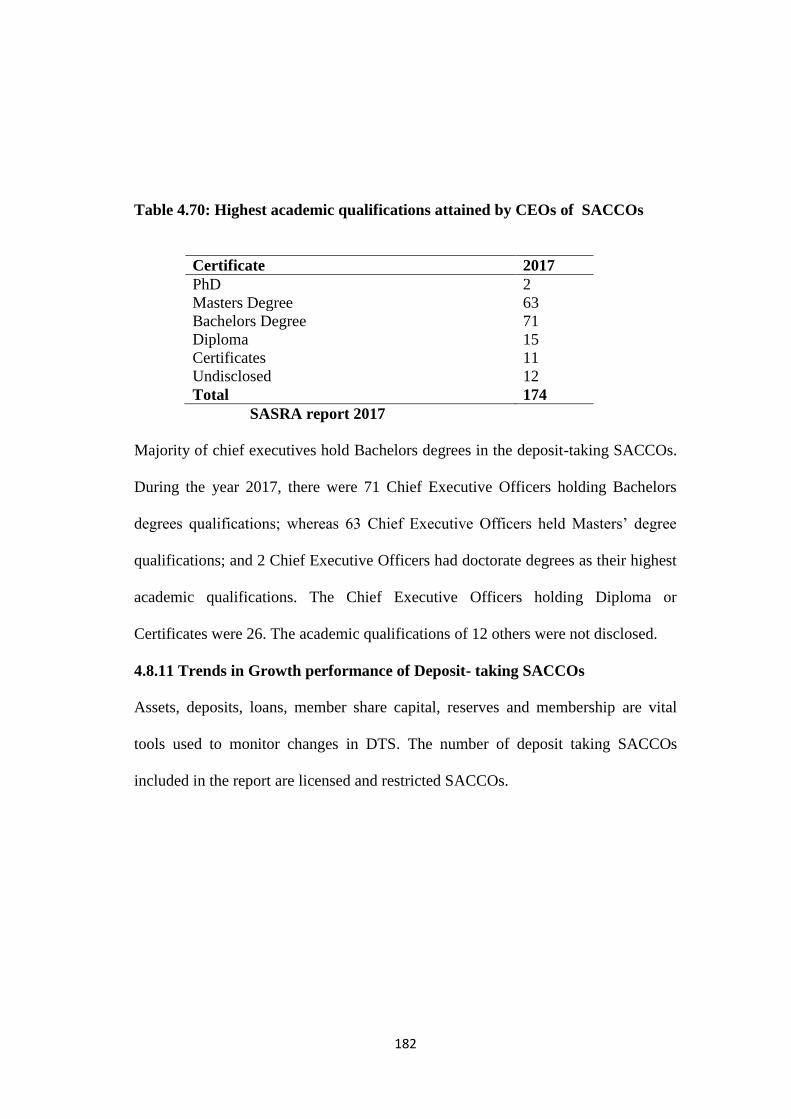
182
Table 4.70: Highest academic qualifications attained by CEOs of SACCOs
Certificate 2017
PhD 2
Masters Degree 63
Bachelors Degree 71
Diploma 15
Certificates 11
Undisclosed
Total
12
174
SASRA report 2017
Majority of chief executives hold Bachelors degrees in the deposit-taking SACCOs.
During the year 2017, there were 71 Chief Executive Officers holding Bachelors
degrees qualifications; whereas 63 Chief Executive Officers held Masters‘ degree
qualifications; and 2 Chief Executive Officers had doctorate degrees as their highest
academic qualifications. The Chief Executive Officers holding Diploma or
Certificates were 26. The academic qualifications of 12 others were not disclosed.
4.8.11 Trends in Growth performance of Deposit- taking SACCOs
Assets, deposits, loans, member share capital, reserves and membership are vital
tools used to monitor changes in DTS. The number of deposit taking SACCOs
included in the report are licensed and restricted SACCOs.

183
Table 4.71: Key trends in growth parameters of deposit-taking SACCOs as at
2016
Parameter 2016 2015 Y-TO-Y GROWTH
%
Number of DT-
SACCOS
176
177
-0.6%
Active membership 3,143,485 2,675,050 17.5%
Dormant
membership
489,112
466,911
4.8% Total Membership 3,632,597 3,145,565 15.6%
FINANCIALS* KSHS MILLIONS KSHS MILLIONS
Assets 393,499 342,848 14.8%
Deposits 272,579 237,440 14.8%
Gross Loans 297,604 258,183 15.3%
Allowance for
loans Loss
8,683
7,103
22.2%
Net Loans &
Advance
288,921
251,080
15.1%
Capital and
Reserves
61,261
50,835
20.5%
Core Capital 54,943 41,712 31.7%
*The Financials relates to 175 DT-SACCOs only and excludes financials for Taqwa Sacco Society
Ltd.
Though the total membership and active membership grew by 15.6% and 17.5%
respectively, there was a decline in the number of operating deposit-taking SACCOs
partly attributed to the revoking of the licenses of two DTS in June of 2016. Table
4.65 shows an analysis of the trends in the main growth parameters of deposit-taking
SACCOs in 2016, derived from approved financial statements of the deposit-taking
SACCOs.
The results show that the DTS system recorded collective growth in all key growth
measurement parameters. The total assets grew by 14.8% to KShs 393. 49 billion in
2016, up from KShs 342.84 billion recorded in the previous year.
The total deposits also grew to reach KShs 272.57 billion in 2016 up from KShs
237.44 billion in 2015; while the gross and net loans‘ portfolio grew by 15.3% and
184
15.1% respectively over the same period to stand at KShs 297.6 billion and KShs
288.92 billion respectively.
4.9 Discussion of Findings
The purpose of the study was to identify whether capital adequacy framework has
had any effect on the DTS in Kenya. Out of 164 DTS in Kenya, 111+12 returned
questionnaires. This represented 75% of response rate. Most of the societies had
been in operation between five and ten years. It represented 77.48% of all
respondents.
Respondents were asked about their academic certificates. The answers showed that
most of the respondents were degree holders which represented 44.14%. The
explanation given for this was that most employees were not motivated to develop
themselves academically. This had slow down the growth of SACCOs and also the
financial performance (Frosdick, 2015). On inquiry if capital adequacy framework
has had any effect on the financial performance, there was general positive response
with most respondents acknowledging that external financing and funds allocation
strategy had affected financial performance adversely. The reasons for the adversity
included: high interest rate, misappropriation of funds and misallocation of funds.
Two SACCOs had invested in unviable projects. Eventually, the projects were sold
to repay outstanding loans.
Coefficient of determinations of the independent variables indicated that the findings
cannot be generalised because the remaining percentages were attributable to other
factors which were not part of the study. Basing on the findings of the predictor
model from the analysis, the study found out that there existed a significant

185
relationship between capital adequacy framework and financial performance
indicators. The study therefore concludes that capital adequacy framework do have
effect on the SACCO financial performance as shown by the predictor model. The
coefficient of determinations of moderated model increased for all independent
variables. This shows that funds allocation moderated capital adequacy framework
towards financial performance of deposit taking SACCOs in Kenya.
186
CHAPTER FIVE
SUMMARY, CONCLUSION AND RECOMMENDATIONS
5.1 Introduction
This chapter summarises the research, findings, conclusion drawn, the
recommendations and the implication of the findings. The overall objective of the
study was to evaluate the influence of capital adequacy framework on business
performance among DTS in Kenya. Specifically, the study sought to establish the
influence of internal financing on financial performance of deposit taking SACCOS
in Kenya, to determine the influence of external financing on financial performance
of deposit taking SACCOS in Kenya, to establish the influence of portfolio selection
on financial performance of deposit taking SACCOS in Kenya, to evaluate the
influence of credit management on financial performance of deposit taking
SACCOS in Kenya, to evaluate the influence of risk management on financial
performance of deposit taking SACCOS in Kenya and to determine the influence of
managerial capability on financial performance of deposit taking SACCOS in
Kenya. The study also sought to establish the moderating effect of funds allocation
on capital adequacy framework towards financial performance of deposit taking
SACCOs in Kenya.
5.2 Summary of the Study Findings
The questionnaire was used to collect views from the officials of 111 DTSs in
Kenya. Various methods were used when analysing data. The main objective was to
establish the effect of capital adequacy framework, funds allocation strategy and
187
financial performance of DTSs. The findings from the study and implications are
expounded as follows;
5.2.1 The Influence of Internal Financing on the Financial Performance
The study sought to establish the moderating effect on internal financing towards
financial performance of deposit taking SACCOs. From the findings, it indicates
that b-value of 0.0354 of moderated internal financing influence financial
performance. When one unit of internal financing increases, it means that financial
performance will increase by 0.0354 unit at 5% level of significance. The p-value
was 0.0003 which is less than 0.05. The influence of moderated internal financing
on financial performance is significant. Hence, the null hypothesis was rejected.
Internal financing of most of DTSs were very weak. There is a growing need to
enhance institutional capital. SACCOs‘ own capital is very low. The priority of
DTSs should be to build institutional capital and postpone investing in real estates.
The study found out that internal financing influence financial performance of
SACCOs. The objective of the study had been achieved.
5.2.2 The influence of External Financing on Financial Performance
The study found that external financing influenced financial performance negatively.
The b-value was -0.0358 at 5% level of significance. It means that as external
financing increases by one unit the financial performance decreases by 0.0358 unit.
External financing was being embraced by majority of societies (Epstien &
Freedman, 2014). This source of finance is extremely expensive. Servicing of debt
had eroded earnings of the societies. This has resulted in low financial performance
of the societies. Financial institutions charged between 15-18 percent on the
188
borrowed loan majority of the DTSs were undercapitalised. They did not meet the
loan demand of their members.
5.2.3 The Influence of portfolio selection on Financial Performance
The study sought to examine the contribution of portfolio selection on financial
performance. Using multiple regression, the b-value of moderated portfolio selection
had a value of 0.0225 at 5% level of significance. It indicated that portfolio selection
influenced financial performance positively. Portfolio selection needs competent
managers to select appropriate portfolio. Most of the employees were not degree
holders. Hence, it will result in poor judgement of business opportunities in the
market. Majority of DTSs invested their funds in strategic assets.
5.2.4 The Influence of Credit Management on Financial Performance
The study found out that moderated credit management influenced financial
performance positively. Based on multiple regression, it showed that the b-value was
0.0759 at 5% level of significance. This means that as credit management increases
by one unit then the financial performance increases by 0.0759 unit. Credit
management is very important to all financial institutions. It ensures that all the
loans are paid back to the society (Bitner & Goddard, 2014). Credit evaluation
should be done before advancing any loan to the members. In addition, screening
should be done and the five Cs of credit analysis of the potential borrowers should
also be carried out.
5.2.5 The Contribution of Risk Management on Financial Performance
The study sought to examine the contribution of risk management on the financial
performance of deposit taking societies. The moderated risk management had beta
value of 0.0488 at 5% level of significance. The p-value was 0.000 which indicated

189
that the variable was significant. It was less than p=0.05. Risk management is
attempting to reduce risk exposure to the society (Bini, Dainelli & Giunta, 2015).
This is done by systemically identifying, assessing and managing the various risks
encountered by Saccos. Default risk is the main risk faced by the societies. This is
reduced by creating transparency in disseminating information to the guarantors.
5.2.6 The Contribution of Managerial Capability on Financial Performance
The study sought to examine the contribution of managerial capability towards
financial performance of deposit taking SACCOs. Using multiple regression, the
moderated managerial capability influenced financial performance. Its b-value was
0.0820 at 5% level of significance. It showed that the variable was an important
determinant of financial performance in SACCOs. This implied that one unit
increase in managerial capability increased the financial performance in SACCOs by
0.0820 unit.
Managerial capability is the ability to manage and control resources of the society
judiciously. Resources are scarce. There is need to manage them effectively and
efficiently for the benefit of the members at large. Societies should employ
competent staff in order to manage the scarce resources. From the study, it indicated
that some of the employees do not have degree certificates. Deposit taking subsector
is poorly supervised and regulated, with uncoordinated supervisory frameworks.
Most of the supervision was done by county staff which mean that the operations
are politically influenced by politicians. This has resulted in mismanagement of
Sacco‘s funds (Al-Tamimi & Al-Mazrooei, 2016). The study found out that funds
allocation strategy was favouring strategic assets. Some of these investments were
190
not viable. Most of the investment in strategic assets are eventually sold. This
indicates that SACCOs are not taking into account the profitability of their
investments. Societies invest in strategic assets with hidden agenda. The study
established that there was a positive and significant relationship between financial
performance and capital adequacy framework. It shows that implementation of
moderated capital adequacy framework and funds allocation influenced variation in
the financial performance. Table 5.1 shows a summary of findings.

191
Table.5.1: Summary of findings
Objective
Conclusion
Recommendation
To examine the influence
of internal financing on
financial performance of
deposit taking SACCOs in
Kenya.
To determine the influence
of external financing on
financial performance of
deposit taking SACCOs in
Kenya.
To establish the influence
of portfolio selection on
financial performance of
deposit taking SACCOs in
Kenya.
To examine the influence
of credit management on
financial performance of
loan
deposit taking SACCOs in
Kenya.
To assess the influence
of risk management on
financial performance of
deposit taking SACCOs in
Kenya.
To evaluate the influence
of managerial capability on
financial performance of
deposit taking SACCOs in
Kenya.
To evaluate the moderating
effect of funds allocation
towards financial
performance
of deposit taking SACCOs in
Kenya.
Internal financing was very
weak
External financing is
expensive
Majority of SACCOs invested
in strategic assets
It is a vital factor to be
considered when lending
credit.
Risk should be minimised
It is the driver of SACCOs
It moderated independent
variables
Enhancing institutional
capital and postponing real estate
investment
Borrowing should be matched
with cashflows
Competent managers should be
engaged
Credit evaluation should be done
before advancing any loan
Diversification of investment to
spread risk
Employ qualified and competent
staff
Funds should be allocated
prudently
Source: Researcher (2018)
5.3 Conclusion
From the findings, the study concluded that capital adequacy framework and fund
allocation strategy had an impact on the financial performance of DTSs in the study
area. Moreover, the researcher can conclude that most of DTSs had problems in
financing their operations. The societies borrowed mostly from commercial banks.
192
This venture is expensive. Consequently, it reduces the society earnings. The
researcher can also conclude that the introduction of deposit taking business had
improved the provision of financial services in the rural areas. The researcher also
concludes that the withdrawal of license of various SACCOs in the counties is due
to mismanagement and misappropriation of funds. A case in point is Bomet County
where two DTSs were delicensed by SASRA. The study, further conclude that
managerial capability is inadequate. From the findings, it was evident that the
diploma holders were 27.92% whereas the degree holders were 55.86%. This
indicates that managerial skills are very low in the DTSs. Low managerial skills
resulted in misallocation of resources which was witnessed in some of the DTS.
Finally, it was evident that there existed a positive significant relationship between
the level of financial performance and managerial capability which was b=0.0820.
There existed a positive relationship between portfolio selection and level of
financial performance which was b=0.0225, even though it was the least.
The study concluded that funds allocation strategy has moderating effect on the
relationship between capital adequacy framework and financial performance.
Therefore, deposit taking SACCOs should embrace prudent funds allocation strategy
to ensure that high level of financial returns is realised.
The study finally concluded that capital adequacy framework has significant effect
on financial performance among deposit taking societies. Hence, as capital adequacy
framework is enhanced, then financial performance of deposit taking societies will
improve. High financial returns are the ultimate goal but if SACCOs ignore capital
193
adequacy framework then their effort may be futile. A well-managed society will
attain high financial gains.
5.4 Recommendations
The research report focused on the capital adequacy framework, funds allocation
strategy and financial performance of DTSs. Developing capital adequacy
framework require a comprehensive and coordinated approach. Proposed capital
adequacy framework should address all pertinent issues so as to attain the desired
results.
This study recommends that deposit taking SACCOs in Kenya should enhance
institutional capital as they significantly affect financial performance. Deposit-taking
societies experienced low capitalisation. It is a major constraint within the sector.
Internal finances are not sufficient whereas external finances are available but
expensive. The SACCOs should be encouraged to mobilise savings and deposits
from members. To be successful, the DTSs should be trustworthy and transparent.
Members cannot save or deposit their money in a doubtful society. The government
should find a way of raising external capital (Al-Tamimi, 2012). It can do this by
creating a fund which will cater for SACCOs. This fund can be accessed by the
society to meet their financial obligations. This initiative will be useful to the
groups. If internal finance is adequate and the SACCO expects financial
performance to increase then it should consider increasing internal funds. However,
if it is inadequate and the SACCO expects financial performance to increase then it
should consider increasing funds

194
The study recommends that deposit taking SACCOs in Kenya should use external
finance with care. In case external finance is adequate and the SACCO expects
financial performance to increase (decrease) it should match external funds with
cash flow. However, if it is inadequate and it expects financial performance to
increase (decrease) the SACCOs should consider increasing external funds
(remaining unchanged). Short term loans should not be used to finance long term
projects. Long term projects take a long duration to commence generating cash
inflows.
The study recommends that deposit taking SACCOs in Kenya embrace prudent
portfolio selection to avoid investing in unviable ventures. When portfolio selection
is adequate and the SACCO expects financial performance to increase (decrease),
then it should remain unchanged (match external funds with cash flows). In contrast,
that is, when the portfolio selection is inadequate and the SACCO expects financial
performance to increase (decrease), then it should consider increasing external funds
(remaining unchanged).
The study recommends that SACCOs should continue with capacity building by
training existing staff and also recruiting competent staffs. The government should
liaise with universities so that they can create programmes which assist in the
development of the enterprise.
Advanced technology should be adopted by societies so that cost efficiency and
effectiveness in their operations can be achieved. This will enhance their earnings
accruing to members. When the managerial capability is adequate and the SACCO
expects financial performance to increase (decrease) then it should consider
remaining unchanged (recruiting professional managers). In case it is inadequate and
195
the Society expects financial performance to increase (decrease), then it should
consider recruiting professional managers (remaining unchanged).
The study further recommends that DTS incorporate good credit management
practices. A well-managed credit system enhances financial performance. Credit risk
will be minimal. If the SACCO‘s credit management is adequate and it expects
financial performance to increase (decrease), then it should consider remaining
unchanged (tightening credit policies). In contrary, that is when the portfolio
selection is inadequate and the SACCO expects financial performance to increase
(decrease). It should consider tightening credit policies (remaining unchanged)
(Ademba, 2013).
The study recommends that the SACCOs should have good risk management
policies. Loan policy should be in place specifically those policies relating to loan
concentration limits, term and condition of insider lending. Contingency plan should
be in place to handle loan defaulters and emergency cases.
If the SACCO‘s risk management is adequate and it expects financial performance
to increase (decrease) then it should consider remaining unchanged (enhancing risk
management efforts). However, in case of inadequate risk management and the
SACCO expect financial performance to increase (decrease). It should consider
enhancing risk management efforts (remaining unchanged).
The study recommends that funds allocation should be carried out in a manner that
financial returns are taken into account. When the funds allocation strategy is
adequate and the SACCO expects financial performance to increase (decrease) then
it should consider remaining unchanged (embracing prudent funds allocation
strategy). Inadequate funds allocation strategy will force SACCO to consider

196
embracing prudent funds allocation strategy (remaining unchanged), if it expects
financial performance to increase (decrease) (Altman, 2016).
The study finally recommends that PEARLS system should be embraced by all
deposit taking SACCOs in Kenya. The system takes into account financial aspects in
managing SACCOs. However, other aspects have to be considered. Balance
Scorecard is a good measure of performance. It should be embraced by all the
SACCOs in Kenya.
5.5 Suggestions for Further Research.
The study focused on financial and non-financial factors influencing financial
performance of deposit taking SACCOs. Recommendation for further research was
suggested on the effect of the following; technology, improved business processes,
culture of the organisation and operation management. From available literature,
there is not any study on these areas. The effects of the macro-economic factors on
the financial performance of the SACCOs need to be looked into. The macro-
economic factors include: real GDP growth, inflation, taxation and the exchange rate
fluctuations.
197
REFERENCES
Ademba, (2012). Challenges facing SACCO's in Africa today. Retrieved from
http://www.accosca.org
Ademba, M. (2013). Speech for the chief executive officer, SASRA during the
SACCO leader‘s forum, at KICC on 26th
August, 2013. Retrieved from
https://www.industrialization.go.ke/index.php/media-center/speeches-by-
cabinet-secretary/469-speech-by-hon-adan-mohammed-during-the-2nd-
kuscco-sacco-leaders-convention-on-22nd-march-2017-at-the-kicc-nairobi
Agrawal, B. (2014). Basic statistics. New Delhi: New Age international
publishers,
Aldridge, A., & Levine, K. (2012). Surveying the social world: principles and
practice in survey research. Buckingham: Open University Press.
Al-Tamimi, H., (2012). Risk Management Practices: An Empirical Analysis of the
UAE Commercial Banks. Finance India, 17(1), 1045-1057. Retrieved from
https://www.econbiz.de/Record/risk-management-practices-an-empirical-
analysis-of-the-uae-commercial-banks-tamimi-hussain-hassan/10009086470
Al-Tamimi, H., & Al-Mazrooei, M., (2016). Banks‘ risk management: a comparison
study of UAE national and foreign banks, The Journal of Risk
Finance, 8(4), 394-409. Retrieved from
https://www.researchgate.net/publication/257933657_Banks'_Risk_Manage
ment_A_Comparison_Study_of_UAE_National_and_Foreign_Banks_Journa
l_of_Risk_Finance_Vol8_No_4394-409_2007/citation/download
Altman, A. (2016). The theory of financial intermediation, Journal of Banking &
Finance, l21, 1461-1485. Retrieved from
https://ideas.repec.org/b/erf/erfstu/23.html
Armstrong, M, & Taylor, S, (2017). Armstrong handbook of human resource
management practice. (14th
ed.). Dorset Press: New York.
Babbie, E. (2013). The Basics of social research. Wadsworth: Cengage Learning.
Basu, S., & Rolfes, H. (1995). Strategic credit management, New Jersey: John
Wiley and sons Inc.
Bellouna, M. (2012). Effect of capital investment on working capital management;
evidence on Tunisian export SME. International Journal of Finance, 22(3).
DOI: 10.5897/ajbm11.1586. DOI:10.5897/ajbm11.1586
Belsey, D., Kuh, E. & Welsch, R. (1980). Regression Diagnostics: Identifying.
New York: John Wiley and Sons.

198
Beri, G. C. (2005). Marketing Research. (3rd
ed). New Delhi: Tata McGraw-Hill
Publishing Company.
Bessis, J. (2012). Risk Management in banking, New Jersey: John Wily & Sons Ltd.
Bhalla. V. K. (2014). Financial Management. New Delhi: S. Chand & Company
Pvt Ltd .
Bhatti. J. R. (2014). Total quality leadership: concepts, values, ethical philosophy
and role model. (3rd
ed.). New Delhi: New Age International Publishers.
Bini, L., Dainelli. F., & Giunta, F. (2015). Signalling theory and voluntary
disclosure to the financial market: evidence from the profitability indicators
published in the annual report. 34th
EAA Annual Congress (pp.1-29). Rome:
University of Bamberg. Retrieved from
https://portal.findresearcher.sdu.dk/en/publications/the-effect-of-non-audit-
services-and-related-threats-on-investors
Birchall, J. (2015). Rediscovering the cooperative advantage poverty reduction
through self-help. ILO: General. Retrieved from
http://www.socioeco.org/bdf_fiche-document-4305_en.html
Birchall, J. & Ketilson, L. H. (2009). Resilience of the cooperative business model in
times of crisis. Geneva, Switzerland: International Labor Organization,
Sustainable Enterprise Programme. Retrieved from
https://www.ilo.org/wcmsp5/groups/public/---ed_emp/---
emp_ent/documents/publication/wcms_108416.pdf
Bitner, J. W. & Goddard, R. A. (2014). Successful bank asset/liability management:
a guide to the future beyond gap. New Jersey: University of Bamberg.
Blaxter. L., Hughes. C & Tight. M. (2013). How to research. (4th
ed.). England:
Open University Press.
Borgstrom, M. (2013). Effective co-operative governance: A practitioner‘s
perspective. Journal of Co-operative Organization and Management.
1(1), 49-50. DOI: 10.1016/j.jcom.2013.05.001
Borzaga, C. & Galera, G. (2012). Promoting the understanding of cooperatives for a
better world, paper presented at the Eurice Conference,Venice.
Brealey, R. A., Myers, S. C. & Marcus, A, J. (2017). Fundamentals of corporate
finance. (8th
ed.). New York: McGraw Hill International.
Brigham. E. F. & Houston. J. F. (2011). Fundamentals of financial management.
(10th
ed.). India: Cengage Learning.
Cameron. A. C. (2004). Kurtosis. in S. Michael, Lewis-Beck., A. Bryman,,& T. L,
Futing. The Sage Encyclopedia of Social Science Research Methods
(pp.121). doi: http://dx.doi.org/10.4135/9781412950589

199
Chandan. J. S. (2016). Management: Concepts and Strategies. (5th
ed.). Vikas New
Delhi: Publishing House Pvt Ltd.
Chandra, P. (2015). Investment analysis and portfolio management. (5th
ed.). New
Delhi: PHI Learning Private Ltd
Chavez, J. R. (2015). Impact Analysis of the SACCO Regulatory Framework-Kenya
SACCO Sector: SACCO Assessment-Proposed 2006 SACCO Act. Madison,
W1: World Council of Credit Unions Inc. retrieved from
http://erepository.uonbi.ac.ke/bitstream/handle/11295/13144/Ngaira_The%2
0impact%20of%20SACCO%20regulatory%20authority%20guidelines%20o
n%20SACCO%20operations%20in%20Kenya.pdf?sequence=3
Chumo, J. C. (2013). The effects of regulatory compliance on financial performance
of deposit taking Sacco‘s in South Rift Region. (Master‘s Thesis). University
of Nairobi, Kenya.
Connelly, B. L., Certo, S. T., Ireland, R. D., & Reutzel, C. R. (2013). Signaling
theory: a review and assessment. Journal of Management. 37(1), 39-67.
Retrieved from https://doi.org/10.1177/0149206310388419
Cooper, D. R., & Schindler, P. S. (2015). Business research methods. (8th
ed.).
New Delhi: Tata McGraw Hill.
Cormier, D., Gordon, I. M. & Magnan, M. (2004). Corporate environmental
disclosure: contrasting management‘s perceptions with reality. Journal of
Business Ethics. 49(2), 143-165. Retrieved from
https://link.springer.com/article/10.1023/B:BUSI.0000015844.86206.b9
Croteau, T. J. (1963). The economics of the credit union. Detroit: Waynes State
University Press.
Darrough, M. H., & Stoughton, N. M. (1990). Financial disclosure policy in an entry
game. Journal of Accounting and Economics. 12(2), 219-243.
https://doi.org/10.1016/0165-4101(90)90048-9
Dawson, J. F. (2013). Moderation in management research: What, why, when, and
how. Journal of Business and Psychology. 29(1), 1-19. Retrieved from
https://link.springer.com/article/10.1007/s10869-013-9308-7
Decker, O. S. (2004). Corporate social responsibility and structural change in
financial services. Managerial Auditing Journal. 19(6), 712-728. Retrieved
form
https://www.emerald.com/insight/content/doi/10.1108/02686900410543840/
full/html
Dekker, B. (2004). Consumer credit quality: underwriting, scoring, fraud prevention
and collection. Wards worth: White Box Publishing.
200
Drury, C. (2012). Cost and management accounting. (7th
ed.). New Delhi: Cengage
Learning
Dubrin, A. (2009). Management: concepts and cases (2nd
ed.). India: Cengage
Learning (Pvt) ltd.
Edwards, M. & Hulme, D. (1995). Non-governmental organisations: performance
and accountability: beyond the magic bullet. London: Earthscan
Publications limited.
El-Dereny, M., & Rashwan, N. (2014). Solving multicollinearity problem using
ridge regression models. International Journal of Contemporary
Mathematical Sciences. 6(12), 585-600. Retrieved from http://www.m-
hikari.com/ijcms-2011/9-12-2011/rashwanIJCMS9-12-2011.pdf
Epstien, M. J. & Freedman, M. (2014). Social disclosure and the individual investor.
Accounting, Auditing & Accountability Journal, 7(4), 94-109. Retrieved
from https://doi.org/10.1108/09513579410069867
Evans, A, C., & Branch, B. (2008). A technical guide to PEARLS-A performance
monitoring system. Madison, W1: World Council of Credit Unions.
Retrieved from
https://www.microfinancegateway.org/sites/default/files/mfg-en-toolkit-a-
technical-guide-to-pearls-a-performance-monitoring-system-nov-2002.pdf
Fabozzi, F., Modigliani, F. & Jones, F. (2009). Foundations of financial markets
and institutions. (4th
ed.). India: Prentice Hall.
Field, A. (2015). Discovering statistics using SPSS. (2nd
ed.). London: Sage.
Financial Sector Regulators (2013). Kenya’s financial sector stability report, 2011.
Nairobi: Financial Sector Regulators. Retrieved from
https://www.centralbank.go.ke/images/docs/kfs/Kenya%20Financial%20Sect
or%20Stability%20Report%202010.pdf
Foddy, W. (2014). Constructing questions for interviews and questionnaire.
London: Cambridge university press.
French, C. W. (2013). The treynor capital asset pricing model. Journal of Investment
Management, 1(2), 60-72. Retrieved from https://ssrn.com/abstract=447580
Frosdick, G. H. (2015). Inherent risk: credit and market risks. Washington. DC:
John Wiley & Son Ltd.
Financial Sector Deepening Kenya. (2013). 2013 annual report. Nairobi; FSD.
Retrieved from https://fsdkenya.org/publication/the-2013-fsd-annual-report/
Gallati, R. (2013). Risk management and capital adequacy. New York: McGraw-
Hill.

201
Gardeklint, A. (2009). Facts about the co-operative movement. Nairobi, Kenya:
National Federation of cooperatives.
Gasbarro, J. M., Lewis, B. L., & Dhar, V. (2013). Assessing inherent risk during
audit planning: the development of a knowledge based model. Accounting
Organization and Society. 9(45), 67-95. Retrieved from
https://ideas.repec.org/a/eee/aosoci/v14y1989i4p359-378.html
Gibbins, M., Richardson, A. J., & Waterhouse, V. (1992). The management of
financial disclosure: theory and perspectives. Vancouver: Canadian
Certified General.
Gide, C. (1992). Consumers’ cooperative societies. New York: Alfred A Knopf.
Gitman, L. J. (2011). Principles of managerial finance. (11th
ed.). New Delhi, India:
Doring Kindersley Pvt Ltd.
Gitonga, B. A. (2014). Cooperative management. Nairobi: PSI Consultants.
Goddard, J., McKillop, D., & Wilson, J. O. (2008). The diversification and financial
performance of US Credit Unions. Journal of Banking & Finance. 32(9),
1836-1849. Retrieved from
http://citeseerx.ist.psu.edu/viewdoc/download?doi=10.1.1.562.290&rep=rep
1&type=pdf
Gopal, C. R. (2012). Financial management and management accounting. New
Delhi. New Age International (P) Ltd Publishers.
Greuning, H. & Iqbal, O. (2015). Analyzing and Managing Banking Risk: A
Framework for Assessing Corporate Governance and Financial Risk.
(2nd
ed.). Prentice Hall.
Gujarati, D. N., & Porter, D. C. (2009). Basic econometrics. (5th
ed.). New York,
US: McGraw-Hill Irwin.
Gupta, C. B. (2008). Human resource management. (9th
ed.). New Delhi: Sultan
Chand & Sons.
Gweyi, M. O. & Karanja, J. (2014). Effect of financial leverage on financial
performance of deposit taking savings and credit cooperative in Kenya.
International journal of academic research in accounting, finance and
management science. 2(76), 321-425.
Hampton, J, J. (2013). Financial decision-making, concepts, problems and cases.
(4th
ed.). New Delhi: PHI Learning Private Ltd,
Hager, M., Wilson, S. & Pollak, T. & Rooney, P. (2003). Response rates for mail
surveys of nonprofit organizations: a review and empirical test. Nonprofit
and Voluntary Sector Quarterly - NONPROFIT VOLUNT SECT Q. 32. 252-
267. Doi: 10.1177/0899764003032002005.
202
Hertzog, M., (2016). Considerations in determining sample size for pilot studies.
Research in Nursing & Health, 31(1-3), 405-440. doi: 10.1002/nur.20247.
Hiriyappa, B. (2015). Investment management securities and portfolio management.
(2nd
ed.). New Delhi: New Age International Publishers.
Hoang, F. H. (2014). Efficiency ratios and community bank performance. Journal of
Finance and Accountancy. 1(1), 1-15. Retrieved from
http://www.aabri.com/manuscripts/09227.pdf
Hyndman, N., & McKillop, D. (2004). Accountability, accounting and credit unions:
A Study from the UK. Review of International Cooperation, 97(1), 30-
37. Retrieved from
https://pure.qub.ac.uk/portal/en/publications/accountability-accounting-and-
credit-unions(c7799ba7-04ce-49ac-85d4-f88e147f9b6b).html
Imungi, J. (2016). Synergy between the cooperative sector and the academia in
promoting research and innovation to enhance industrial and socio- economic
development in East Africa. First East African Cooperative Conference.
Nairobi. Retrieved from
http://www.industrialization.go.ke/images/downloads/feacc-
materials/synergy-between-the-cooperative-sector-and-the-academia.pdf
International cooperative Alliance (2004). International cooperative Alliance annual
Report 2004. Retrieved from
https://www.ica.coop/sites/default/files/publication-files/ica-annual-report-
2004-1412980771.pdf
International Co-operative Alliance (2015). What is a co-operative? Geneva: ICA.
Retrieved from http://ica.coop/en/what -co-operative
Irungu, G. (2013, July 5). Poor financial records a test for stability of SACCOs.
Business Daily. Retrieved from www.businesdailyafrica.com/poorfinancial-
records-a-test-for-stability-insaccos/
Isaac, S., & Michael, W. B. (1995). Handbook in research and evaluation. San
Diego: Educational and Industrial Testing Services.
Jhingan. M. L. & Stephen. J. K. (2011). Managerial Economics. (2nd
ed.). New
Delhi: Vrinda Publications (P) Ltd.
Jones, C. P. (2014). Investment principles and concepts. (11th
ed.). New Delhi:
Aggarwal Printing Press.
Jordan, B. D., Miller, T. W. & Dolvin, S. D. (2018). Fundamentals of Investments.
(8th
ed.). New York: McGraw Hill, Education International edition.
Kairu, P. U. (2015). Credit management. (2nd
ed.). Nairobi: Focus Publishers ltd.
Kanchu, T., & Kumar, M. (2013). Risk management in banking sector–an empirical
study. International Journal of Marketing, Financial Services &
203
Management Research, 2(2), 145-160. Retrieved from
http://indianresearchjournals.com/pdf/IJMFSMR/2013/February/11.pdf
Kinyuira, D., Gatenya, J., & Muturi, W. (2014). Influence of strategic
organizational. components on the performance of deposit taking savings and
credit cooperatives in Kenya. Journal of Business and Management. 6(3),
79-93. DOI: 10.9790/487X-16617682
Kivuvo, R. M., & Olweny. T. (2014). Financial performance analysis of Kenya‘s
SACCO sector using the Altima Z score model of corporate bankruptcy.
International Journal of Business and Social Science, 62(1), 104-138.
Retrieved from
https://www.google.com/url?sa=t&rct=j&q=&esrc=s&source=web&cd=1&c
ad=rja&uact=8&ved=2ahUKEwi3ocDjx8vkAhUp3OAKHZkPBQMQFjAA
egQIAhAC&url=http%3A%2F%2Fijbssnet.com%2Fjournals%2FVol_5_No
_9_1_August_2014%2F4.pdf&usg=AOvVaw1SoIVAlVPWL1GYLm_nXsi
T
Klein, A. (2016). Firm performance and board committee structure. Journal of Law
and Econmics, 41(1), 275-304. DOI: 10.1086/467391 retrieved from
https://www.jstor.org/stable/10.1086/467391
Kobia. S. K. (2011). Cooperative movement in Kenya: challenges and opportunities.
Nairobi, Kenya: Lukiko Consulting Trust Management
Kondalkar, V. (2014). Organisational Behaviour. India: New Age International
Limited Publishers
Kothari, C. R. (2014). Research methodology: methods and techniques. (2nd
ed.).
New Delhi: New Age International (P) Ltd.
Koutsoyiannis, A. (2014). Theory of econometrics. (2nd
ed.). New York: Palgrave.
Kumar, S., Himes, K. & Kritzer, C., 2014, ‗Risk assessment and operational
approaches to managing risk in global supply chains‘. Journal of
Manufacturing Technology Management 25(6), 873–890. Retrieved from
https://doi.org/10.1108/JMTM-04-2012-0044
Lal, J. (2008). Advanced management accounting. (3rd
ed.). New Delhi: S. Chand &
Company ltd.
Langat, J. K. (2012). Factors influencing performance of savings and credit co-
operative societies in Bomet County. (Unpublished master‘s project,
University of Nairobi, Kenya). Retrieved from
http://erepository.uonbi.ac.ke/handle/11295/8099
Lipsey. C. & Chrystal, K. (2013). Economics. (13th
ed.). United Kingdom:
Oxford University Press.
204
Lipton. M. & Lorsh. J. W. (1992). A modest proposal for improved corporate
governance. New Jersey: Business Lawyer.
Luethge, D., & Han, H. G. (2012). Assessing corporate social and financial
performance in China. Social Responsibility Journal, 8(3), 389-403.
Retrieved form
https://www.emerald.com/insight/content/doi/10.1108/17471111211247965/
full/html
Lys, T., Naugthon, J. P., & Wang, C. (2015). Signaling through corporate
accountability reporting. Journal of Accounting and Econmics, 60(1), 56-72.
https://doi.org/10.1016/j.jacceco.2015.03.001
Machiraju, H. R. (2016). Modern commercial banking. (2nd
ed.). New Delhi: New
age International (pvt) ltd publisher.
Madura, J. (2012). Financial institutions and markets. (10th
ed.). China: Cengage
Learning,
Magali, J. J. (2013). The influence of rural savings and credits cooperatives societies
(SACCOs) variables on loans default risks: The case study of Tanzania.
Research Journal of Finance and Accounting, 4(9), 77-91. Retrieved from
https://pdfs.semanticscholar.org/963d/8641dff2e45c807a68778f2abebac4355
5e5.pdf
Magness, V. (2016). Strategic posture, financial performance and environmental
disclosure: an empirical test of legitimacy theory. Accounting, Auditing and
Accountability Journal, 19(4), 540-563. Retrieved from
https://doi.org/10.1108/09513570610679128
Maina, J. M. (2013). Relationship between credit risk management practices and
financial performance of microfinance institutions in Kenya. (Unpublished
Master‘s Project, University of Nairobi, Kenya). Retrieved from
http://erepository.uonbi.ac.ke/handle/11295/7630
Makori, J., Munene, C.& Muturi, W. (2013). The challenges facing Deposit-Taking
SACCOS regulatory compliance in Kenya: A case of the Gusii region.
Journal of contemporary research in business. 5(2), 98. Retrieved from
http://ir-library.mmarau.ac.ke:8080/xmlui/handle/123456789/4481
Maligalig, D., & Martinez, A. (2013). Developing a master sample design for
household surveys in developing countries: A case study in Bangladesh.
Survey Methods: Insights from the Field. Retrieved from
https://surveyinsights.org/?p=2151
Margrabe, K. (2014). The incidence of secured debt: evidence from the small
business community. Journal of Financial and Quantitative Analysis, 24(2),
379-394. DOI: 10.2307/2330818 retrieved from
https://www.jstor.org/stable/2330818
205
Martz, W. (2013). Evaluating organizational performance rational, natural, and open
system models. American Journal of Evaluation. 34(11), 385-401. doi:
10.1177/1098214013479151.
Mathuya, D. (2016). Determinants of disclosure level by deposit taking SACCOs in
Kenya. (Doctorate thesis, Jomo Kenyatta University of Agriculture and
Technology, Nairobi) Retrieved from
https://pdfs.semanticscholar.org/bace/ce0683556916f9e2b62d7386b2317385
46d5.pdf
Mazzarol, T. (2014). Cooperative enterprise. A discussion paper & Literature
review. Perth, WA: Co-operatives WA. Retrieved from https://research
repository.uwa.edu.au/en/publications/cooperative-enterprise-a-discussion-
paper-amp-literature-review
Mbogo, J. M. (2010). Determinant of performance of saving and credit
cooperatives. (Unpublished Master‘s Project, University of Nairobi, Kenya).
http://erepository.uonbi.ac.ke/handle/11295/7913
Mburu, M. N. (2014). Corporate governance practices: a case study of the Kenya
union of savings and credit co-operatives limited. Nairobi: University of
Nairobi. Retrieved from http://erepository.uonbi.ac.ke/handle/11295/22751
McFie. J. B. (2016). High Quality Financial Reporting: The Case of the Nairobi
Stock Exchange. (Unpublished PhD Thesis, University of Strathclyde,
Glasgow). Retrieved from http://hdl.handle.net/11071/3403
McGrath, D. (2017). Social accounting in the credit union sector: GRI Readiness.
Australia: Charles Sturt University. retrieved from
https://researchoutput.csu.edu.au/ws/portalfiles/portal/9679011/PID11701pre
-pub.pdf
McKillop, D. G., Briscoe, R., McCarthy, O., Ward, M., & Ferguson, C. (2003). Irish
credit unions: exploring the gender mix. Voluntas: International Journal of
Voluntary and Nonprofit Organizations, 14(3), 339-358. Retrieved from
s://link.springer.com/article/10.1023/A:1025670704720
McKillop, D., & Wilson, J. (2015). Credit Unions: A Theoretical and Empirical
Overview. New York: Salomon Center and Wiley Periodical Inc.
Mira, G. & Kennedy, O. (2013). Challenges facing accessibility of credit facilities
among women owned enterprises in Nairobi central business district in
Kenya. International Journal of Social Sciences and Entrepreneurship, 1(7),
377-396. Retrieved from
https://profiles.uonbi.ac.ke/kogollah/publications/challenges-facing-
accessibility-credit-facilities-among-women-owned-enterprise
Michelle, A. (2016). The effect of digital finance on financial inclusion in the
banking industry in Kenya. (Doctoral dissertation, School of Business,
206
University of Nairobi, Kenya). Retrieved from
http://erepository.uonbi.ac.ke/handle/11295/7924
Mitchell, V. (2015). Assessing the reliability and validity of questionnaire: an
empirical example, Journal of Applied Management Studies. 3(5), 62-68.
Retrieved from https://www.ncbi.nlm.nih.gov/pmc/articles/PMC3905644/
Microfinance House ltd (2016). Background information on SACCOs presented in
AFRACA workshop on the role of women in the development of microfinance
in Africa. Nairobi, Kenya. Retrieved from
https://www.researchgate.net/publication/318419514_An_investigation_into
_the_cash_balance_management_challenges_in_saving_and_credit_cooperat
ive_societies_SACCOs_in_Nakuru_County_Kenya
Mishkin, F. S. & Eakins, S. G. (2012). Financial markets and institutions. (6th
ed.).
New Delhi: Dorling Kindersley India Pvt ltd.
Morris, M., Shirokora G., & Shatalor A. (2013). The business model and firm
performance. The case of Russian food service venture. Journal of small
business management. 349(23), 986-1005. Retrieved from
https://doi.org/10.1111/j.1540-627X.2012.00377.x
Modigliani, F. & Miller. F. (1958). The cost of capital, corporation finance and the
theory of investment. The American Economic Review, 48(3), 261-297.
Retrieved from http://www.jstor.org/stable/1809766
Mosongo, E. (2013). The relationship between financial innovation and financial
performance among SACCOs in Nairobi County. (Unpublished Master‘s
project, University of Nairobi, Kenya). Retrieved from
http://erepository.uonbi.ac.ke/handle/11295/3497
Mpiira, S., Kiiza, B., Katungi, E.M., Staver, C.P., Tabuti, J.R., Kyotalimye, M.,
…Tushemereirwe, W. (2013). Factors influencing households‘ participation
in the Savings and Credit Cooperative (SACCO) programmes in Uganda.
African Journal of Agricultural Research. 8(43), 5276-5284. DOI:
10.5897/AJAR11.1673
Muasya, B. W. (2016). The Impact of Non-Performing Loans on the Performance of
Banking Sector in Kenya. (Unpublished Master‘s thesis, University of
Nairobi, Kenya). Retrieved from
http://erepository.uonbi.ac.ke/handle/11295/7913
Mudibo, E, K. (2014). Challenges and opportunities facing Kenyan savings and
credit co-operative movement, presentation of the African saving and credit
cooperative conference, 2006. Retrieved form
https://www.ijsse.org/articles/ijsse_v1_i9_288_314.pdf
Mudiri, M. J. (2013). The use of 6Cs credit risk appraisal model and its relationship
with non-performing loans of commercial banks in Kenya. (Unpublished
207
Master‘s Project, University of Nairobi, Kenya). Retrieved from
http://erepository.uonbi.ac.ke/handle/11295/5613
Mugenda, O. M. & Mugenda, A. G. (2003). Research methods: quantitative and
qualitative approaches. Nairobi: Acts press.
Mugwe,, D. (2012, December 9). Inside Harambee Sacco’s mega fraud. Business
Daily. Retrieved from www.businessdailyAfrica.com/inside/-harambee
sacco-mega-fraud/
Murkomen, C., Njeje, D., & Cherono, V, (2017). An assessment of the relationship
between capital structure and financial performance of Saccos in Baringo
County. International Journal of Business Management. 19(3), 1-13. DOI:
10.9790/487X-
Mutai, B. K. (2013). How to write research proposal. India: Good touch publishers.
Mwatu. M. D. (2018). Capital structure and financial performance of deposit taking
SACCOs in Kenya. (Master‘s thesis, Kenyatta University, Nairobi).
Retrieved from https://ir-
library.ku.ac.ke/bitstream/handle/123456789/18700/Capital%20structure%2
0and%20the%20financial%20performance%20of%20deposit....pdf?
sequence=1&isAllowed=y
Mwenda, M., & Kalio, A. (2014). Determinants of capital structure in savings and
credit societies in Kenya: A case of cooperatives in Nakuru County.
International Journal of Science and Research, 3(10), 2413-2417. Retrieved
from https://www.ijsr.net/archive/v3i10/T0NUMTQ3MjU=.pdf
Mwisho, A. M. (2013). Basic lending conditions and procedures in commercial
banks. The Accountant. 13(3), 16-19. Retrieved from
https://iedunote.com/steps-in-lending-process
Myers, S. C. (1984). The capital structure puzzle. Journal of Finance, 39(1), 575-
592. Retrieved from
http://dx.doi.org/10.2307/2327916
Naituli, G. J. (2011). Principles and practices of financial management. Nairobi,
CUEA Press.
Nagarajan, K., & Jayabal, G. (2012). Security analysis and portfolio management.
New Delhi: New Age International publishers.
Ndungu, G. (2010, January, 10). Underlying movement. Business daily post, p.7.
Ngaira, L. (2014). The impact of Sacco regulatory authority guidelines on Sacco
operations in Kenya: The case of Nairobi Deposit-Taking Sacco’s. (Master‘s
thesis, University of Nairobi, Kenya). Retrieved from
http://erepository.uonbi.ac.ke/handle/11295/2974
208
Ngatia, M. L., Kyalo, T. N., & Kiragu, D. N. (2015). Influence of management
training on compliance with international financial reporting standards by
SACCOs in Nyeri County, Kenya. Scholars Bulletin, 1(4), 90-95. Retrieved
from http://41.89.227.156:8080/xmlui/handle/123456789/532
Njuguna, P. (2009). Sealing accounting loopholes strengthens SACCOs. Nairobi;
WOCCU SACCO CAP News.
Njuguna, P. (2014). The effects of governance on SACCO business conduct. Nairobi:
SASRA.
Ngombe, B., & Mikwamba, E. (2014). Know more about SACCO. A handbook for
SACCO study circle programme, Malawi union of savings and credit
cooperative (MUSCCO). Lilongwe, Malawi. Retrieved from
https://www.muscco.org/
Nimalathasan, H. (2015). Capital structure and its impact on profitability of listed
manufacturing companies in Sri Lanka. International Journal of Business
and Management. 9(4), 87-162. Retrieved from
https://ideas.repec.org/a/aio/rteyej/v1y2010i10p7-16.html
Nyambere, K. F. (2013). Effect of credit risk management on financial performance
of deposit taking SACCOs in Kenya. (Master‘s Thesis, University of Nairobi,
Kenya). Retrieved from http://erepository.uonbi.ac.ke/handle/11295/7110
Nwankwo, O. & Osho, G. (2014). An empirical analysis of corporate survival and
growth; evidence from efficient working capital management. International
Journal of Scholarly Academic intellectual diversity, 12(1), 90. Retrieved
from
https://www.researchgate.net/publication/242701474_An_Empirical_Analysi
s_of_Corporate_Survival_and_Growth_Evidence_from_Efficient_Working_
Capital_Management
Ogilo, F. (2014). The impact of credit risk management on financial performance of
commercial banks in Kenya. DBA Africa Management Review 2014. 1(3),
22-37. Retrieved from http://journals.uonbi.ac.ke/damr/article/view/1089
Okewo, E. (2013, May 26). Teachers clash with Sacco officials over low dividends.
Business Daily. P.10.
Kabiru, A. (2013). How SARSA is mainstreaming Africa’s largest Sacco Movement.
Top 30 SACCOs in Kenya. Retrieved from
https://www.businessdailyafrica.com/news/Five-top-saccos-boast-Sh149bn-
savings-assets/539546-5101030-119ehklz/index.html
Olando C. O., Mbewa M. O., & Jagongo A. (2012). Financial practice as a
determinant of growth of savings and credit cooperative society‘s wealth.
International journal of business and social science, Kenya. 4(13), 72-89.
Retrieved from http://ir-library.ku.ac.ke/handle/123456789/7758

209
Olando C. O., Mbewa M. O., & Jagongo, A. (2013). The contribution of SACCO
financial stewardship to growth of SACCOs in Kenya. International journal
of business and social science, 3(17).112-137. Retrieved from http://ir-
library.ku.ac.ke/handle/123456789/5825
Olkar, B. (2013). Risk management. New Delhi: Macmillan Publishers Indian Ltd.
Omisore, I., Munirat. Y., & Nwufo, C. (2013). The modern portfolio theory as an
investment decision tool. Journal of Accounting and Taxation. 4(2), 19-28.
Retrieved from http://www.academicjournals.org/JAT
Ondieki, F. W. (2015). The relationship between credit risk analysis and the level of
non-performing loans: A case study of commercial banks. (Unpublished
master‘s Project, University of Nairobi, Kenya). Retrieved from
http://erepository.uonbi.ac.ke/handle/11295/7913
Ongore, V.O. & Kusa, G. B. (2013). Determinants of financial performance of
commercial banks in Kenya. International Journal of economic & financial
issues (IJEFI), 3(1), 85. Retrieved from
https://www.researchgate.net/publication/277076321_Determinants_of_Fina
ncial_Performance_of_Commercial_Banks_in_Kenya
Onyango, J. (2013). The effects of external financing on the Savings and Credit
Cooperative Wealth in Nairobi County, Kenya (unpublished master‘s project,
United State International University, Kenya). Retrieved from
http://erepo.usiu.ac.ke/handle/11732/2557;jsessionid=8F91831C20329647D
7FA0A4EC34BBC70
Osoro, J. (2015). Financial Reporting Workshop for Co-operative Societies.
Nairobi: ICPAK.
Owusu-Ansah, S. (2014). Factors influencing corporate compliance with financial
reporting requirements in New Zealand. International Journal of Commerce
and Management, 15(2), 141-157. Retrieved from
https://doi.org/10.1108/10569210580000193
Pandey, I. M. (2015). Financial management. (9th
ed). New Delhi: Vikas publishing
House pvt ltd,
Patton, M. Q. (2012). Qualitative research and evaluation methods. Thousand Oaks,
CA: Sage Limited.
Penman, S. H. (2016). An empirical investigation of the voluntary disclosure of
corporate earnings forecasts. Journal of Accounting Research, 6(4), 605-626.
DOI: 10.2307/2490396 retrieved from https://www.jstor.org/stable/2490396
Peria, M. S., & Schumuler, S. L. (2013). Do Depositors Punish Banks for Bad
Behaviour? Market discipline, deposit insurance, and banking crises. The
210
Journal of Finance, 56(3), 1029-1051. https://doi.org/10.1111/0022-
1082.00354
Pistelli, M. (2014). Measuring governance in microfinance: initial findings from a
Pilot Project. Geneva: Microfinance Information Exchange.
Quayes, S., & Hasan, T. (2014). Financing disclosure and performance of
microfinance institutions. Journal of Accounting & Organisational Change,
10(3), 314-337. Retrieved from https://doi.org/10.1108/JAOC-12-2011-0067
Ratner, B. (2015). Variable selection methods in regression: Ignorable problem,
outing notable solution. Journal of Targeting, Measurement and Analysis for
Marketing, 18(1), 65-75.
Ralston, D. & Wright, A. (2003). Lending procedures and the viability –social
objectives conflict in credit unions. International journal of bank marketing.
9(4), 69-84. Retrieved from https://doi.org/10.1108/02652320310498456
Republic of Kenya (1997). Sessional paper NO.6 of 1997 on cooperative in a
liberalized economic environment. Nairobi: Government printer.
Republic of Kenya (2008). Medium term plan (2008-2012) for the financial services
sector Nairobi. Government printer Republic of Kenya (2008). Vision 2030
first medium term plan. A globally competitive and prosperous Kenya 2008,
Nairobi: Government printer
Riahi-Belkaoui, A. (2015). The nature and determinants of disclosure adequacy: an
international perspective. London: Quorum Books.
Richardson, E. (2012). Credit risk management system of a commercial bank,
International Journal of Emerging Markets, 3(3), 323-332. DOI:
10.1108/17468800810883729
Robin, S. & Coulter, M. (2015). Management. (11th
ed.). Boston: Prentice Hall.
Rouf, A. (2013). Corporate characteristics, governance attributes and the extent of
voluntary disclosure in Bangladesh. Africa Journal of Business Management,
5(19), 7836-7845. Retrieved from
https://www.researchgate.net/publication/275833544_Corporate_Characteris
tics_Governance_Attributes_and_the_Extent_of_Voluntary_Disclosure_in_
Bangladesh
Rouf. M. A. (2014). The relationship between corporate governance and value of the
firm in developing countries. evidence from Bangladesh. The international
Journal of Applied Economics and Finance. 67(32), 482-659. Retrieved from
https://ssrn.com/abstract=2576591
Rovai, A., Baker, J. D., & Ponton, M. K. (2014). Social science research design and
statistics. Chesapeake VA: Watertree Press LLC.
211
Rudani, R. B. (2011). Management and organisational behaviour. New Delhi: Tata
McGraw-Hill.
SACCO Societies Regulatory Authority (2016). Speech by the Honorable Cabinet
Secretary Ministry of Industrialization and Enterprise Development during
the SACCO Leaders Forum at KICC. Retrieved from
www.sasra.go.ke/newsupdates/speeches &sa.
SACCO Societies Regulatory Authority (2016). SACCO Supervision Annual
Report 2016. Nairobi: SASRA.
Samaha,K., & Dahawy, K. (2015). An empirical analysis of corporate governance
structures and voluntary corporate disclosure in volatile capital markets: The
Egyptian experience. International Journal of Accounting, Auditing and
Performance Evaluation, 7(1/2), 61-93. DOI: 10.1504/IJAAPE.2011.037726
·
Samuelson, P. & Nordhaus, W. (2004). Economics. New Jersey: Irwin/McGraw-
Hill.
Saunders, A. (2017). Financial institutions management; a modern perspective.
London: McGraw-Hill companies Inc.
Saunders, M., Lewis. P. & Thornhill. A. (2016), Research methods for business
students. (5th
ed.). New York: Prentice Hall.
Schroeck, G. (2012). Risk management and value creation in financial institutions.
New Jersey: John Wiley & Sons Inc.
Sharpe, W. F., Alexander, G. J. & Bailey, J. V. (2011). Investments. New Delhi: HI
Learning Private Ltd ,
Shim, J., Siegel, J., Dauber, N. & Qureshi, A. ( 2015). Accounting handbook.
Hauppauge, New York: Barrons Educational Series
Sekaran, U. (2013). Research Methods for Business. United States: John Wiley &
Sons, Inc.
Sekaran, U., & Bougie, R. (2016). Research Methods for Business: A Skill Building
Approach (6th
ed.). New York: John Wiley & Sons, Inc.
Singhvi, S., & Desai, H. B. (2013). An empirical analysis of the quality of corporate
financial disclosure. The Accounting Review, 46(1), 129-138. Retrieved from
https://www.jstor.org/stable/243894
Sinkey, J. F. (2015). A multivariate statistical analysis of the characteristics of
problem banks. Journal of Finance. 30(1), 21-36. DOI: 10.2307/2978429
Retrieved from https://www.jstor.org/stable/2978429
212
Skinner, D. J. (2014). Why firms voluntarily disclose bad news. Journal of
Accounting Research, 32(1), 38-60. DOI: 10.2307/2491386 Retrieved from
https://www.jstor.org/stable/2491386
Spiegel, M. M., & Yamori. M. (2014). Determinants of voluntary bank disclosure:
evidence from Japanese shink in Banks. CESifo Working Paper,
No.1135(pp.1- 33). Venice, Italy: CESifo. Retrieved from
https://ideas.repec.org/p/fip/fedfpb/03-03.html
Srairi, S., & Douissa, I. B. (2014). Factors influencing bank transparency: case of
emerging markets. British Journal of Economics, Management & Trade,
4(4), 523-540. DOI: 10.9734/BJEMT/2014/6167
Strandberg, C. (2012). Credit union social responsibility reporting. Canada: Credit
Union Central.
Suchman, M. (2015). Managing legitimacy: Strategic and institutional approaches.
Academy of Management Review, 20(3), 571-610. DOI: 10.2307/258788
Retrieved from https://www.jstor.org/stable/258788
Teoh, S. H., & Hwang, C. Y. (2014). Nondisclosure and adverse selection as signals
of firm value. Review of Financial Studies, 4(1), 283-313. Retrieved from
https://www.jstor.org/stable/2962106
Thomas, J. R., Nelson, J. K., & Silver, S. J. (2011). Research methods in physical
activity. Champaign. Illinois: Human Kinetics.
Thomas, L. (2009). Consumer credit models: pricing, profit and portfolios. London:
Oxford University Press.
Thuo, A. K., Muturi, J. M., & Njeru, M. J. (2013). Determinants of dividends levels
by co-operative societies. A study of savings and credit co-operative societies
in Embu District. (Doctorate thesis, Kenyatta University, Nairobi). Retrieved
from https://ir-library.ku.ac.ke/handle/123456789/5079?show=full
Todaro, M. P. & Smith, S. C. (2011). Economic development. (11th
ed.). Edinburgh
Gate: Pearson Education Ltd.
Tsamenyi, M., Enninful-Adu, E., & Onumah, J. (2016). Disclosure and corporate
governance in developing countries: evidence from Ghana. Managerial
Auditing Journal, 22(3), 319-334. Retrieved from
https://doi.org/10.1108/02686900710733170
Unerman, J. (2014). Methodological issues- reflections on quantification in
corporate social reporting content analysis. Accounting, Auditing &
Accountability Journal, 13(5), 667-681. Retrieved from
https://doi.org/10.1108/09513570010353756
United Nations Conference on Trade and Development (2014). Conference
proceeds in Geneva. Geneva: UNCTAD.
213
Viru, S. W. (2014). The relationship between credit risk management practices and
financial performance of microfinance institutions in Kenya. (Unpublished
master‘s project, University of Nairobi, Kenya). Retrieved from
http://erepository.uonbi.ac.ke/handle/11295/7919
Waleed, A. (2014). Corporate governance, voluntary disclosure and financial
performance: ban empirical analysis of Saudi listed firms using a mixed-
methods research design. (Unpublished PhD thesis, University of Glasgow,
Glasgow). Retrieved from https://eleanor.lib.gla.ac.uk/record=b3060457
Wallace, R. S., & Naser, K. (1995). Firm-specific determinants of the
comprehensiveness of mandatory disclosure in the corporate annual reports
of firms listed on the stock exchange of Hong Kong. Journal of Accounting
and Public Policy. 14(4), 311-368. Retrieved from
https://doi.org/10.1016/0278-4254(95)00042-9
Wambua, K. P. (2015). The effects of corporate governance on savings and credit
co-operatives (SACCOs) financial performance in Kenya. (Unpublished
Master‘s Project, KCA University, Nairobi). Retrieved from
http://41.89.49.13:8080/xmlui/handle/123456789/653
Waweru, K. M. (2014). An investigation in to the cash balance management
challenges in savings and credit cooperative societies (SACCOs) in Nakuru
county Kenya. Journal of research in international business and
management. 4(9), 16-22. Retrieved from
https://www.researchgate.net/publication/318419514_An_investigation_into
_the_cash_balance_management_challenges_in_saving_and_credit_cooperat
ive_societies_SACCOs_in_Nakuru_County_Kenya
Willis, A. (2013). Financial Institutions Management: A risk management approach
(6th
ed.). New York: McGraw Hill.
Wong, J., Fong, T., Wong, T. & Choi, K. (2007). Determinants of the performance
of banks in Hong Kong. Hong Kong monetary authority, working papers.
10.2139/ssrn.1032032. Retrieved from
https://link.springer.com/chapter/10.1057/9780230227378_4
World Council of Credit Unions (2014). Credit union governance. Madison,
W1.USA: World Council of Credit Unions, Madison Office. Retrieved from
https://www.woccu.org

214
APPENDICES
Appendix I: Letter of Introduction
John C. Ngeno
Box122
Silibwet.
Dear Sir/Madam,
I am completing my PhD in Kenya Methodist University in Banking and Finance,
part of which involves completing a dissertation. My research consists of an
evaluation of the capital adequacy framework, funds allocation strategy and
financial performance of deposit-taking Saccos in south rift region. My supervisor is
Professor George K. Kingoriah.
For the purpose of my research I am conducting a survey on twenty three deposit
taking Sacco‘s in South rift region regarding their strategies on prudent financial
management practices to attain reasonable financial returns. Enclosed is a copy of
my survey. Due to time constraints on the dissertation, I would be very grateful if
you could answer the survey and return same in the prepaid envelope by the 30th
of
September 2016. The responses will be kept strictly confidential and anonymous.
They will be used for academic research; no person or Sacco‘s will be identified.
As soon as the dissertation is completed there will be an opportunity to disseminate
the findings to those that participated in the research. This research will have a more
practical value to all the Sacco‘s in Kenya and the findings can be implemented in
order to improve the financial performance in each Sacco‘s.
Thanking you in advance for your cooperation and time.
Yours sincerely,
John C. Ngeno
PhD Banking and Finance student
Email: [email protected]
Mobile: 0714896556

215
Appendix II: Questionnaire
Section A: General information
1. Name of the Sacco…………………………………………………………
2 What is your gender?
Male
Female
3 What is your age bracket?
20-25 years
26-30 years
31-35 years
36-40 years
41-45 years
46- 50 years
51-55 years
56-60 years
4 How long have been working with SACCO?
0-5 years
6-10 years
11 years and above
5 Can you please state your position in the SACCO?
C.E.O
Finance manager
Credit officer
6 How many years has the SACCO been operating as a deposit lending SACCO?
0-1 1-5 5-10
7 What is the current total number of members currently?
0-15,000 16,000 – 50,000 > 51,000
8 Who are your members?
Agriculture based Employer based Group Based
9 What is the current worth of the firm (KShs? Million)?
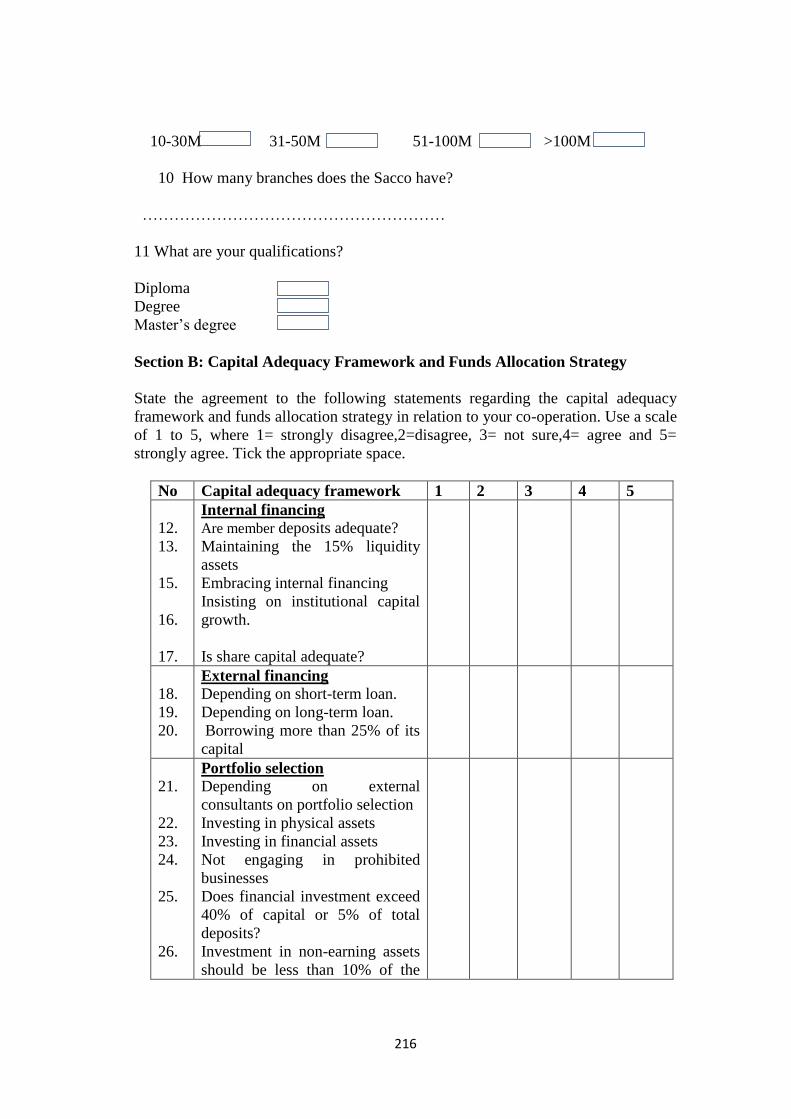
216
10-30M 31-50M 51-100M >100M
10 How many branches does the Sacco have?
…………………………………………………
11 What are your qualifications?
Diploma
Degree
Master‘s degree
Section B: Capital Adequacy Framework and Funds Allocation Strategy
State the agreement to the following statements regarding the capital adequacy
framework and funds allocation strategy in relation to your co-operation. Use a scale
of 1 to 5, where 1= strongly disagree,2=disagree, 3= not sure,4= agree and 5=
strongly agree. Tick the appropriate space.
No Capital adequacy framework 1 2 3 4 5
12.
13.
15.
16.
17.
Internal financing
Are member deposits adequate?
Maintaining the 15% liquidity
assets
Embracing internal financing
Insisting on institutional capital
growth.
Is share capital adequate?
18.
19.
20.
External financing
Depending on short-term loan.
Depending on long-term loan.
Borrowing more than 25% of its
capital
21.
22.
23.
24.
25.
26.
Portfolio selection
Depending on external
consultants on portfolio selection
Investing in physical assets
Investing in financial assets
Not engaging in prohibited
businesses
Does financial investment exceed
40% of capital or 5% of total
deposits?
Investment in non-earning assets
should be less than 10% of the

217
No Capital adequacy framework 1 2 3 4 5
total assets in which land and
building should be less than 5%
of the total assets.
27.
28.
29.
Managerial capability
Do SACCOs have qualified staff?
Does research and development
in place?
Do you embrace financial
innovation?
30.
31.
32.
33.
34.
35.
36.
Credit management
Are you a member of credit
Bureau reference
Insider trading and abusive self-
dealings are prohibited
Credit evaluation and analysis
before lending out funds.
Monitoring and eradicating
outstanding loans.
Do you insist on collateral
security before approving loans?
Do you screen and monitor
customers?
Do establish long-term
relationships with customers?
37.
38
39
Risk management
Does loaning policy in place
specifically relating to loan
concentration limit, terms and
condition of insider lending
Do you have contingency plan to
handle loan defaulters
Do you have aged analysis of
Arrears by loan purpose?
40
41
Funds allocation strategy
Do you invest in tactical assets?
Do you invest in strategic assets?
42. Which investment enhances financial performance?
Tactical assets
Strategic assets
43. Do you face any challenges in meeting the above functions?

218
Yes No
If yes, enumerate the challenges.
…………………………………………………………………………………………
…………………………………………………………………………………………
…………………………………………………………………………………………
…………………………………………………………………………………………
…………………………………………………………………………………………
…………………………………………………………………………………………
…………
44. Does the Sacco have strategies to put in place to address the above challenges?
Yes No
If yes, list the strategies
…………………………………………………………………………………………
…………………………………………………………………………………………
…………………………………………………………………………………………
…………………………………………………………………………………………
…………………………………………………………………………………………
…………………………………………………………………………………………
…………
45. What business opportunities have you missed due to the above challenges?
…………………………………………………………………………………………
…………………………………………………………………………………………
……

219
Section C: Financial Performance Measures
This section is concerned with assessing financial performance measures of the
deposit taking SACCOs in Kenya. Tick in the box which best describe your
agreement and disagreement.
Effects of financial performance measures
1. Protections:
1.1. Do you have sufficient provisions to
cover 100% of all loans delinquent for more
than 12 months?
1.2. Do you have sufficient provisions to
cover 35% of all loans delinquent for 1-12
months?
2. Effective financial structure:
2.1 Do you have potential for growth?
2.2 Does your financial structure matches
with earning capacity?
3. Asset quality:
3.1 Do you invest in non-productive assets?
3.2 Are your non-productive assets more than
5% of total assets?
4.Rates of return:
4.1 Does your rate of return more than bank
rate?
4.2 Do your costs range between 3.5-5% of
average total assets?
5.Liquidity:
5.1 Do you maintain liquid account at a
minimum of 20% of the deposit saving?
5.2 Do you maintain liquidity reserves at 10%
of saving deposits?
5.3 Does your idle liquidity close to zero?
6.Signs of growth:
6.1 Do current total assets more than previous
year?
6.2 Do current loans deposits more than
previous year?
6.3 Does current institutional capital more
than previous year?
6.4 Do current members more than previous
year?
1 2 3 4 5
With the introduction of deposit taking business of Sacco‘s, has there been a change
in terms of how the society is run?
Yes No
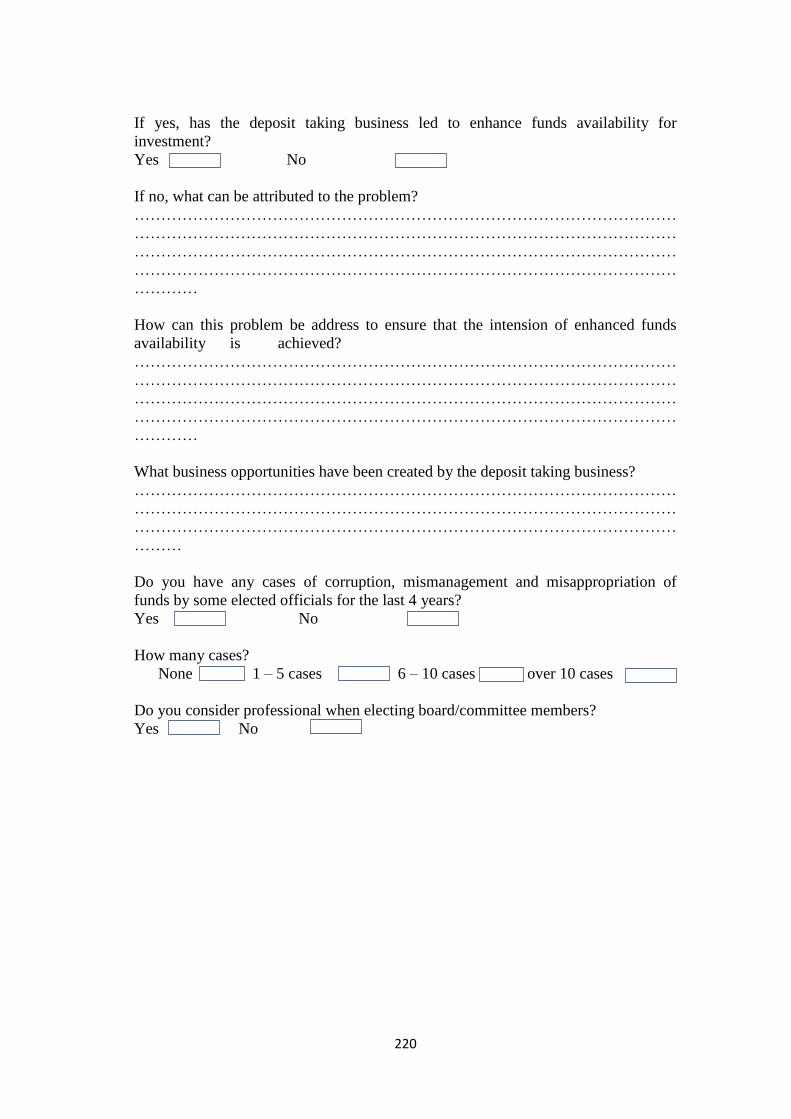
220
If yes, has the deposit taking business led to enhance funds availability for
investment?
Yes No
If no, what can be attributed to the problem?
…………………………………………………………………………………………
…………………………………………………………………………………………
…………………………………………………………………………………………
…………………………………………………………………………………………
…………
How can this problem be address to ensure that the intension of enhanced funds
availability is achieved?
…………………………………………………………………………………………
…………………………………………………………………………………………
…………………………………………………………………………………………
…………………………………………………………………………………………
…………
What business opportunities have been created by the deposit taking business?
…………………………………………………………………………………………
…………………………………………………………………………………………
…………………………………………………………………………………………
………
Do you have any cases of corruption, mismanagement and misappropriation of
funds by some elected officials for the last 4 years?
Yes No
How many cases?
None 1 – 5 cases 6 – 10 cases over 10 cases
Do you consider professional when electing board/committee members?
Yes No
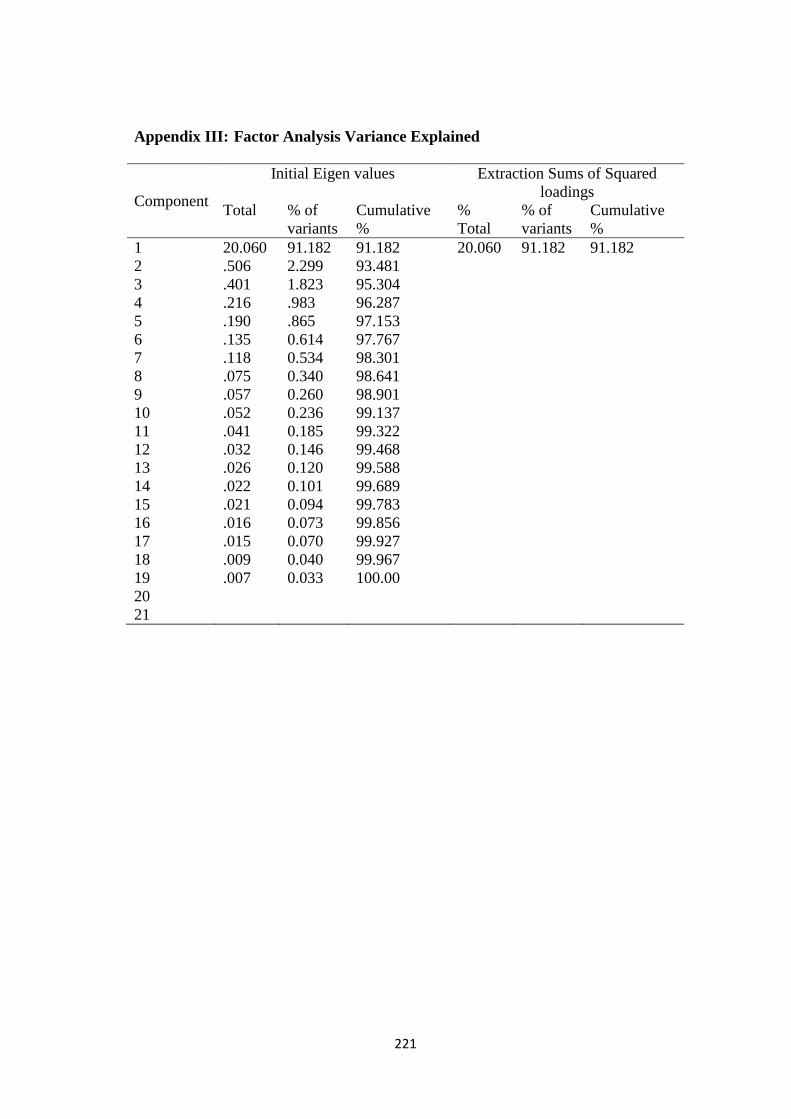
221
Appendix III: Factor Analysis Variance Explained
Component
Initial Eigen values Extraction Sums of Squared
loadings
Total % of
variants
Cumulative
%
%
Total
% of
variants
Cumulative
%
1 20.060 91.182 91.182 20.060 91.182 91.182
2 .506 2.299 93.481
3 .401 1.823 95.304
4 .216 .983 96.287
5 .190 .865 97.153
6 .135 0.614 97.767
7 .118 0.534 98.301
8 .075 0.340 98.641
9 .057 0.260 98.901
10 .052 0.236 99.137
11 .041 0.185 99.322
12 .032 0.146 99.468
13 .026 0.120 99.588
14 .022 0.101 99.689
15 .021 0.094 99.783
16 .016 0.073 99.856
17 .015 0.070 99.927
18 .009 0.040 99.967
19 .007 0.033 100.00
20
21
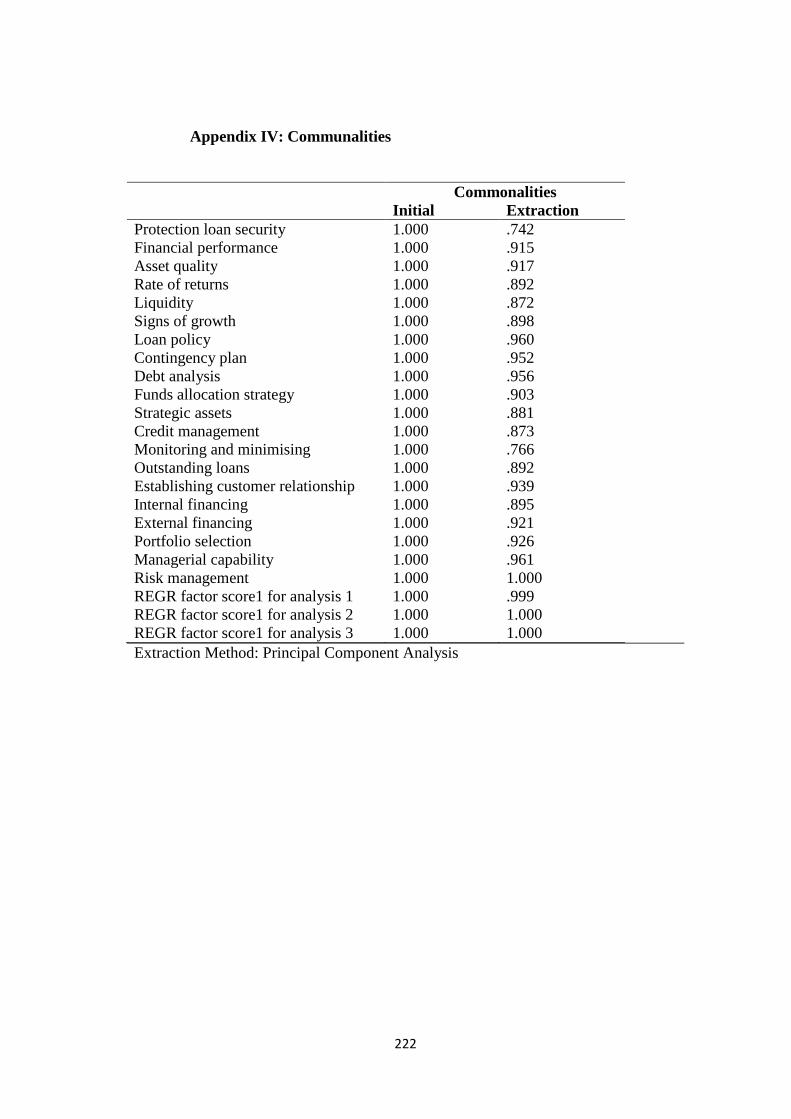
222
Appendix IV: Communalities
Commonalities
Initial Extraction
Protection loan security 1.000 .742
Financial performance 1.000 .915
Asset quality 1.000 .917
Rate of returns 1.000 .892
Liquidity 1.000 .872
Signs of growth 1.000 .898
Loan policy 1.000 .960
Contingency plan 1.000 .952
Debt analysis 1.000 .956
Funds allocation strategy 1.000 .903
Strategic assets 1.000 .881
Credit management 1.000 .873
Monitoring and minimising 1.000 .766
Outstanding loans 1.000 .892
Establishing customer relationship 1.000 .939
Internal financing 1.000 .895
External financing 1.000 .921
Portfolio selection 1.000 .926
Managerial capability 1.000 .961
Risk management 1.000 1.000
REGR factor score1 for analysis 1 1.000 .999
REGR factor score1 for analysis 2 1.000 1.000
REGR factor score1 for analysis 3 1.000 1.000
Extraction Method: Principal Component Analysis
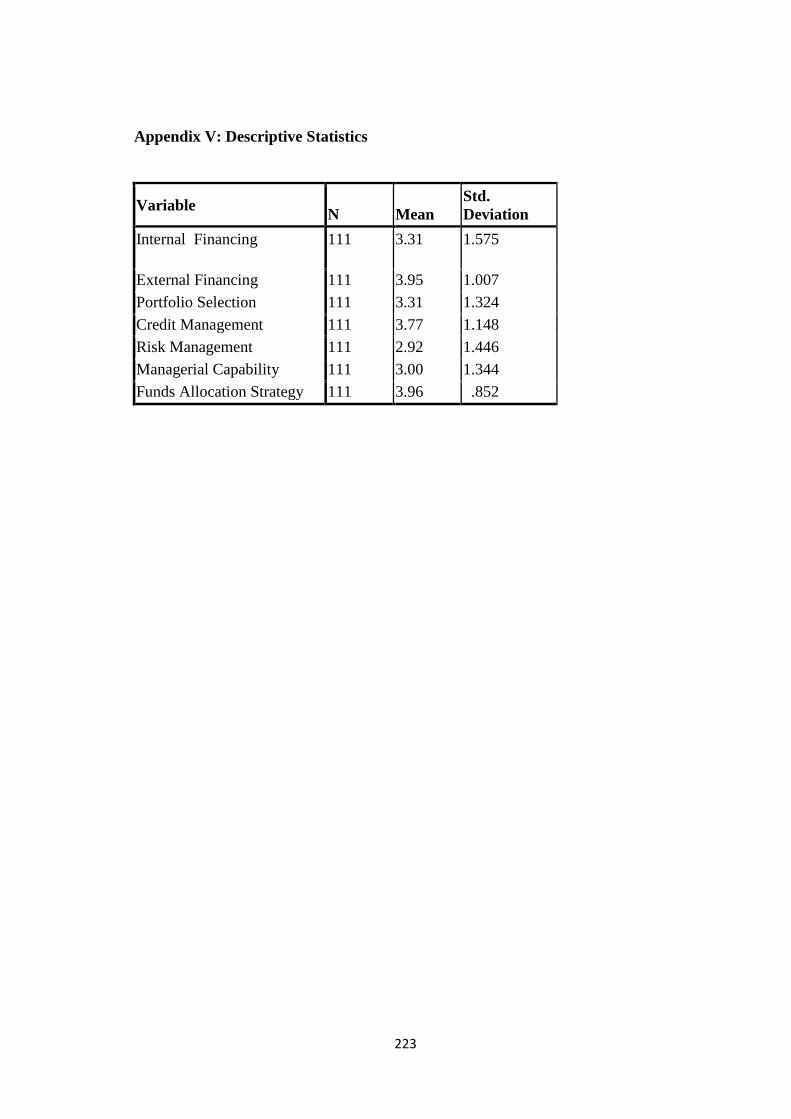
223
Appendix V: Descriptive Statistics
Variable N Mean
Std.
Deviation
Internal Financing 111
3.31 1.575
External Financing 111 3.95 1.007
Portfolio Selection 111 3.31 1.324
Credit Management 111 3.77 1.148
Risk Management 111 2.92 1.446
Managerial Capability 111 3.00 1.344
Funds Allocation Strategy 111 3.96 .852
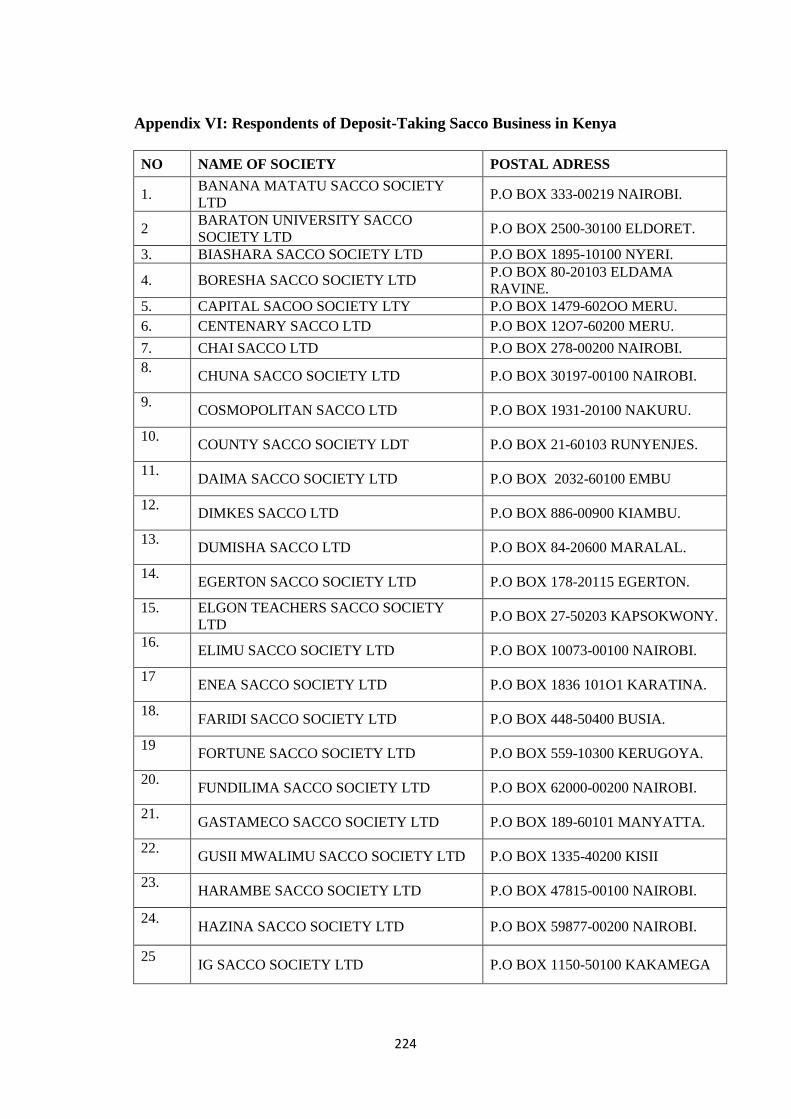
224
Appendix VI: Respondents of Deposit-Taking Sacco Business in Kenya
NO NAME OF SOCIETY POSTAL ADRESS
1. BANANA MATATU SACCO SOCIETY
LTD P.O BOX 333-00219 NAIROBI.
2 BARATON UNIVERSITY SACCO
SOCIETY LTD P.O BOX 2500-30100 ELDORET.
3. BIASHARA SACCO SOCIETY LTD P.O BOX 1895-10100 NYERI.
4. BORESHA SACCO SOCIETY LTD P.O BOX 80-20103 ELDAMA
RAVINE.
5. CAPITAL SACOO SOCIETY LTY P.O BOX 1479-602OO MERU.
6. CENTENARY SACCO LTD P.O BOX 12O7-60200 MERU.
7. CHAI SACCO LTD P.O BOX 278-00200 NAIROBI.
8. CHUNA SACCO SOCIETY LTD P.O BOX 30197-00100 NAIROBI.
9. COSMOPOLITAN SACCO LTD P.O BOX 1931-20100 NAKURU.
10. COUNTY SACCO SOCIETY LDT P.O BOX 21-60103 RUNYENJES.
11. DAIMA SACCO SOCIETY LTD P.O BOX 2032-60100 EMBU
12. DIMKES SACCO LTD P.O BOX 886-00900 KIAMBU.
13. DUMISHA SACCO LTD P.O BOX 84-20600 MARALAL.
14. EGERTON SACCO SOCIETY LTD P.O BOX 178-20115 EGERTON.
15. ELGON TEACHERS SACCO SOCIETY
LTD P.O BOX 27-50203 KAPSOKWONY.
16. ELIMU SACCO SOCIETY LTD P.O BOX 10073-00100 NAIROBI.
17 ENEA SACCO SOCIETY LTD P.O BOX 1836 101O1 KARATINA.
18. FARIDI SACCO SOCIETY LTD P.O BOX 448-50400 BUSIA.
19 FORTUNE SACCO SOCIETY LTD P.O BOX 559-10300 KERUGOYA.
20. FUNDILIMA SACCO SOCIETY LTD P.O BOX 62000-00200 NAIROBI.
21. GASTAMECO SACCO SOCIETY LTD P.O BOX 189-60101 MANYATTA.
22. GUSII MWALIMU SACCO SOCIETY LTD P.O BOX 1335-40200 KISII
23. HARAMBE SACCO SOCIETY LTD P.O BOX 47815-00100 NAIROBI.
24. HAZINA SACCO SOCIETY LTD P.O BOX 59877-00200 NAIROBI.
25 IG SACCO SOCIETY LTD P.O BOX 1150-50100 KAKAMEGA
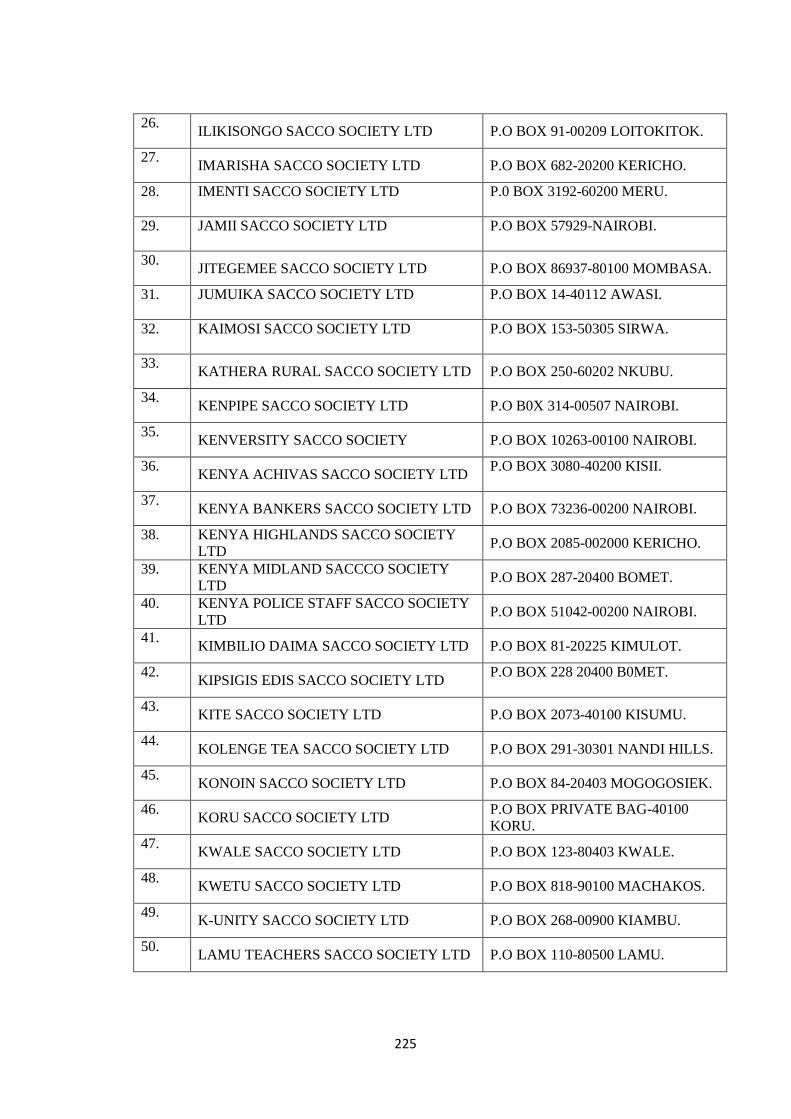
225
26. ILIKISONGO SACCO SOCIETY LTD P.O BOX 91-00209 LOITOKITOK.
27. IMARISHA SACCO SOCIETY LTD P.O BOX 682-20200 KERICHO.
28. IMENTI SACCO SOCIETY LTD P.0 BOX 3192-60200 MERU.
29. JAMII SACCO SOCIETY LTD P.O BOX 57929-NAIROBI.
30. JITEGEMEE SACCO SOCIETY LTD P.O BOX 86937-80100 MOMBASA.
31. JUMUIKA SACCO SOCIETY LTD P.O BOX 14-40112 AWASI.
32. KAIMOSI SACCO SOCIETY LTD P.O BOX 153-50305 SIRWA.
33. KATHERA RURAL SACCO SOCIETY LTD P.O BOX 250-60202 NKUBU.
34. KENPIPE SACCO SOCIETY LTD P.O B0X 314-00507 NAIROBI.
35. KENVERSITY SACCO SOCIETY P.O BOX 10263-00100 NAIROBI.
36. KENYA ACHIVAS SACCO SOCIETY LTD
P.O BOX 3080-40200 KISII.
37. KENYA BANKERS SACCO SOCIETY LTD P.O BOX 73236-00200 NAIROBI.
38. KENYA HIGHLANDS SACCO SOCIETY
LTD P.O BOX 2085-002000 KERICHO.
39. KENYA MIDLAND SACCCO SOCIETY
LTD P.O BOX 287-20400 BOMET.
40. KENYA POLICE STAFF SACCO SOCIETY
LTD P.O BOX 51042-00200 NAIROBI.
41. KIMBILIO DAIMA SACCO SOCIETY LTD P.O BOX 81-20225 KIMULOT.
42. KIPSIGIS EDIS SACCO SOCIETY LTD
P.O BOX 228 20400 B0MET.
43. KITE SACCO SOCIETY LTD P.O BOX 2073-40100 KISUMU.
44. KOLENGE TEA SACCO SOCIETY LTD P.O BOX 291-30301 NANDI HILLS.
45. KONOIN SACCO SOCIETY LTD P.O BOX 84-20403 MOGOGOSIEK.
46. KORU SACCO SOCIETY LTD
P.O BOX PRIVATE BAG-40100
KORU.
47. KWALE SACCO SOCIETY LTD P.O BOX 123-80403 KWALE.
48. KWETU SACCO SOCIETY LTD P.O BOX 818-90100 MACHAKOS.
49. K-UNITY SACCO SOCIETY LTD P.O BOX 268-00900 KIAMBU.
50. LAMU TEACHERS SACCO SOCIETY LTD P.O BOX 110-80500 LAMU.
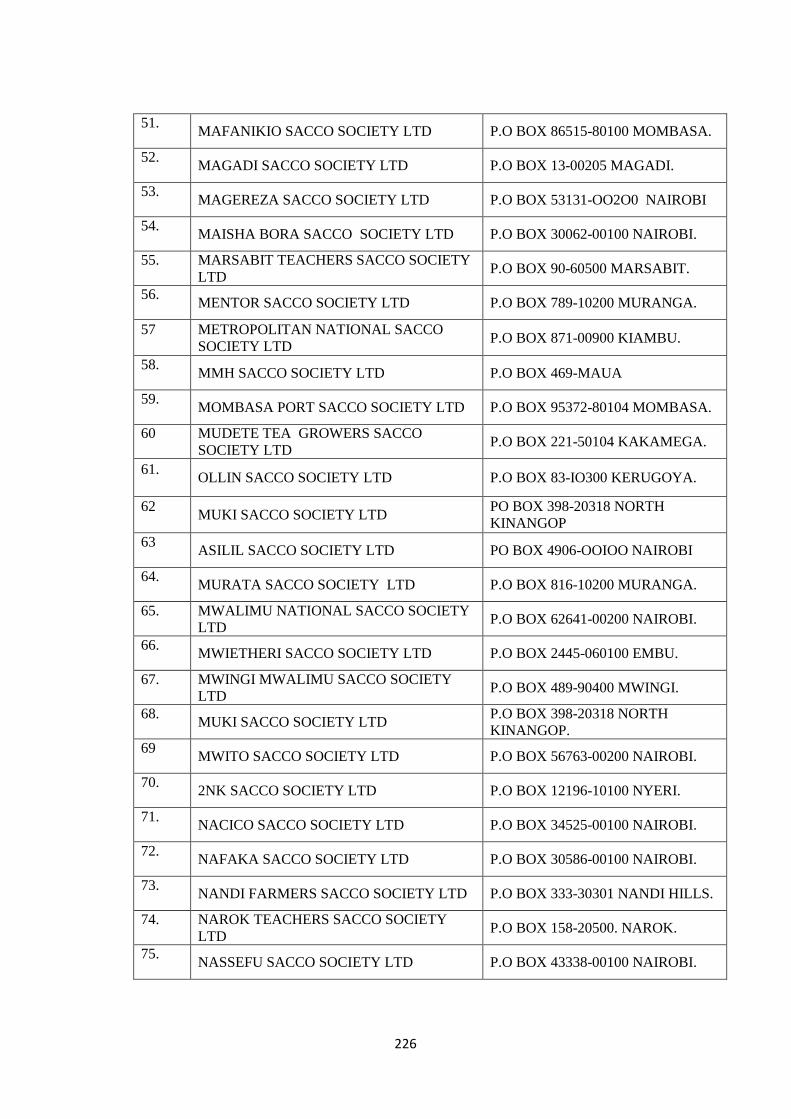
226
51. MAFANIKIO SACCO SOCIETY LTD P.O BOX 86515-80100 MOMBASA.
52. MAGADI SACCO SOCIETY LTD P.O BOX 13-00205 MAGADI.
53. MAGEREZA SACCO SOCIETY LTD P.O BOX 53131-OO2O0 NAIROBI
54. MAISHA BORA SACCO SOCIETY LTD P.O BOX 30062-00100 NAIROBI.
55. MARSABIT TEACHERS SACCO SOCIETY
LTD P.O BOX 90-60500 MARSABIT.
56. MENTOR SACCO SOCIETY LTD P.O BOX 789-10200 MURANGA.
57 METROPOLITAN NATIONAL SACCO
SOCIETY LTD P.O BOX 871-00900 KIAMBU.
58. MMH SACCO SOCIETY LTD P.O BOX 469-MAUA
59. MOMBASA PORT SACCO SOCIETY LTD P.O BOX 95372-80104 MOMBASA.
60 MUDETE TEA GROWERS SACCO
SOCIETY LTD P.O BOX 221-50104 KAKAMEGA.
61. OLLIN SACCO SOCIETY LTD P.O BOX 83-IO300 KERUGOYA.
62 MUKI SACCO SOCIETY LTD
PO BOX 398-20318 NORTH
KINANGOP
63 ASILIL SACCO SOCIETY LTD PO BOX 4906-OOIOO NAIROBI
64. MURATA SACCO SOCIETY LTD P.O BOX 816-10200 MURANGA.
65. MWALIMU NATIONAL SACCO SOCIETY
LTD P.O BOX 62641-00200 NAIROBI.
66. MWIETHERI SACCO SOCIETY LTD P.O BOX 2445-060100 EMBU.
67. MWINGI MWALIMU SACCO SOCIETY
LTD P.O BOX 489-90400 MWINGI.
68. MUKI SACCO SOCIETY LTD
P.O BOX 398-20318 NORTH
KINANGOP.
69 MWITO SACCO SOCIETY LTD P.O BOX 56763-00200 NAIROBI.
70. 2NK SACCO SOCIETY LTD P.O BOX 12196-10100 NYERI.
71. NACICO SACCO SOCIETY LTD P.O BOX 34525-00100 NAIROBI.
72. NAFAKA SACCO SOCIETY LTD P.O BOX 30586-00100 NAIROBI.
73. NANDI FARMERS SACCO SOCIETY LTD P.O BOX 333-30301 NANDI HILLS.
74. NAROK TEACHERS SACCO SOCIETY
LTD P.O BOX 158-20500. NAROK.
75. NASSEFU SACCO SOCIETY LTD P.O BOX 43338-00100 NAIROBI.
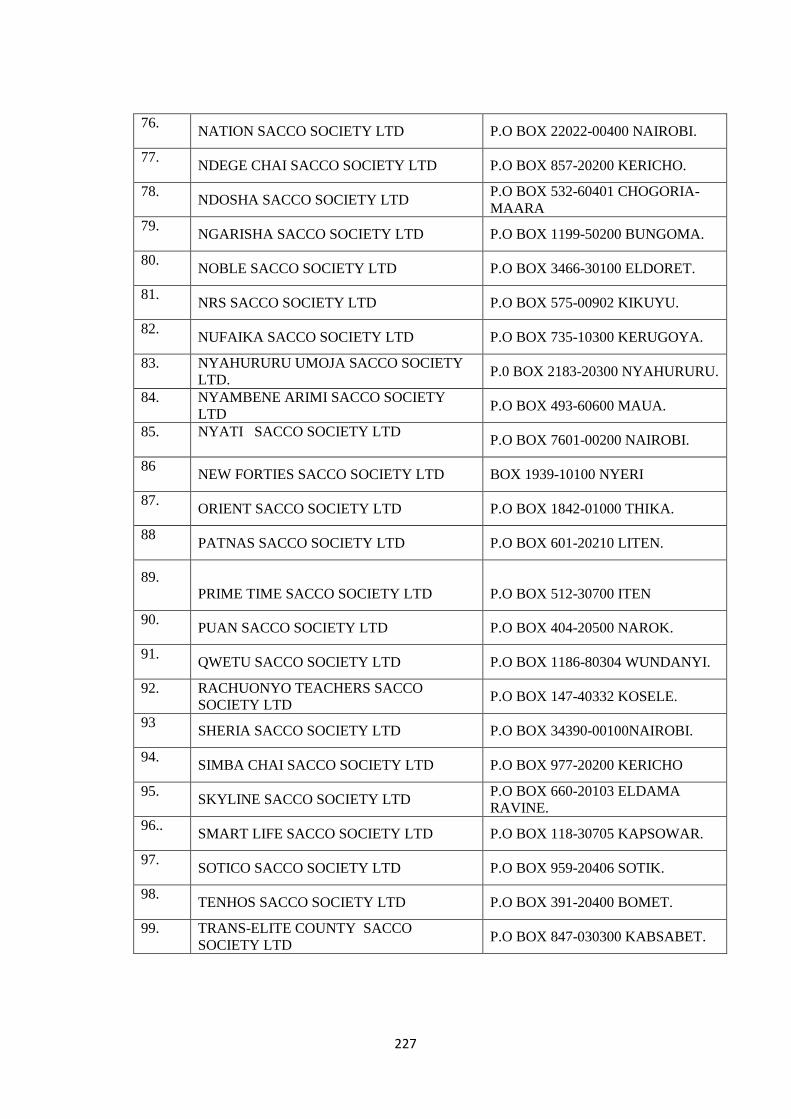
227
76. NATION SACCO SOCIETY LTD P.O BOX 22022-00400 NAIROBI.
77. NDEGE CHAI SACCO SOCIETY LTD P.O BOX 857-20200 KERICHO.
78. NDOSHA SACCO SOCIETY LTD
P.O BOX 532-60401 CHOGORIA-
MAARA
79. NGARISHA SACCO SOCIETY LTD P.O BOX 1199-50200 BUNGOMA.
80. NOBLE SACCO SOCIETY LTD P.O BOX 3466-30100 ELDORET.
81. NRS SACCO SOCIETY LTD P.O BOX 575-00902 KIKUYU.
82. NUFAIKA SACCO SOCIETY LTD P.O BOX 735-10300 KERUGOYA.
83. NYAHURURU UMOJA SACCO SOCIETY
LTD. P.0 BOX 2183-20300 NYAHURURU.
84. NYAMBENE ARIMI SACCO SOCIETY
LTD P.O BOX 493-60600 MAUA.
85. NYATI SACCO SOCIETY LTD
P.O BOX 7601-00200 NAIROBI.
86 NEW FORTIES SACCO SOCIETY LTD BOX 1939-10100 NYERI
87. ORIENT SACCO SOCIETY LTD P.O BOX 1842-01000 THIKA.
88 PATNAS SACCO SOCIETY LTD P.O BOX 601-20210 LITEN.
89.
PRIME TIME SACCO SOCIETY LTD
P.O BOX 512-30700 ITEN
90. PUAN SACCO SOCIETY LTD P.O BOX 404-20500 NAROK.
91. QWETU SACCO SOCIETY LTD P.O BOX 1186-80304 WUNDANYI.
92. RACHUONYO TEACHERS SACCO
SOCIETY LTD P.O BOX 147-40332 KOSELE.
93 SHERIA SACCO SOCIETY LTD P.O BOX 34390-00100NAIROBI.
94. SIMBA CHAI SACCO SOCIETY LTD P.O BOX 977-20200 KERICHO
95. SKYLINE SACCO SOCIETY LTD
P.O BOX 660-20103 ELDAMA
RAVINE.
96.. SMART LIFE SACCO SOCIETY LTD P.O BOX 118-30705 KAPSOWAR.
97. SOTICO SACCO SOCIETY LTD P.O BOX 959-20406 SOTIK.
98. TENHOS SACCO SOCIETY LTD P.O BOX 391-20400 BOMET.
99. TRANS-ELITE COUNTY SACCO
SOCIETY LTD P.O BOX 847-030300 KABSABET.
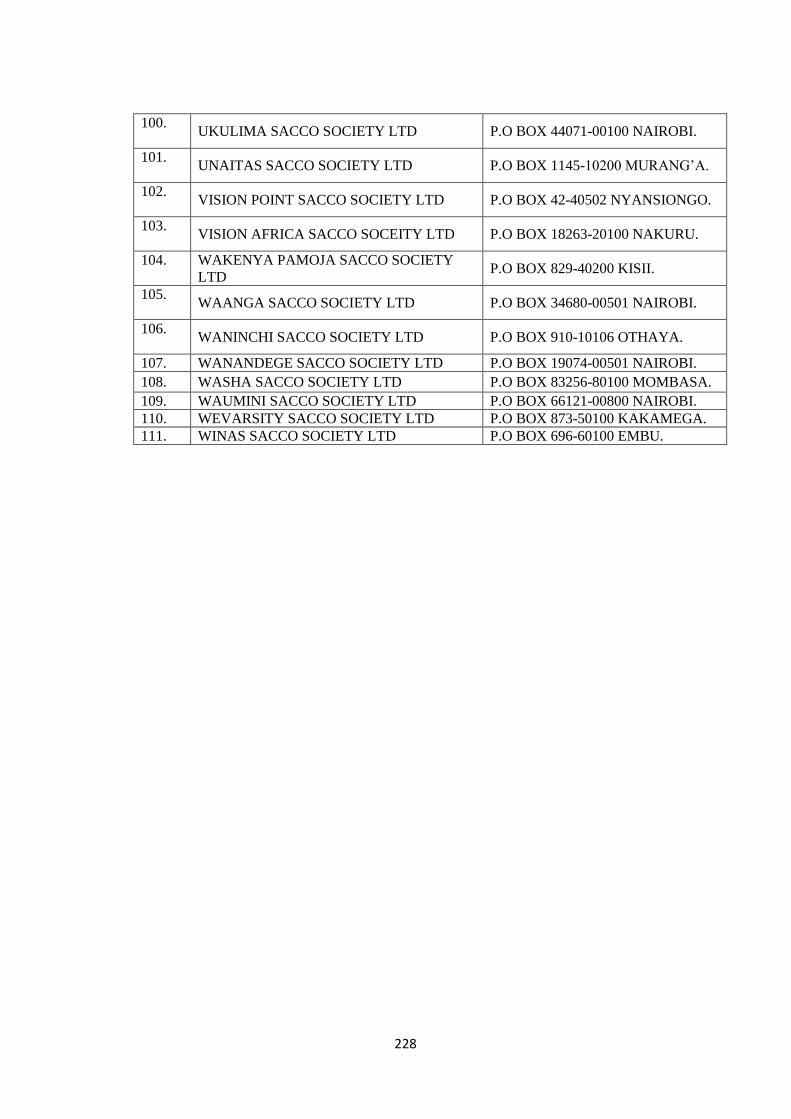
228
100. UKULIMA SACCO SOCIETY LTD P.O BOX 44071-00100 NAIROBI.
101. UNAITAS SACCO SOCIETY LTD P.O BOX 1145-10200 MURANG‘A.
102. VISION POINT SACCO SOCIETY LTD P.O BOX 42-40502 NYANSIONGO.
103. VISION AFRICA SACCO SOCEITY LTD P.O BOX 18263-20100 NAKURU.
104. WAKENYA PAMOJA SACCO SOCIETY
LTD P.O BOX 829-40200 KISII.
105. WAANGA SACCO SOCIETY LTD P.O BOX 34680-00501 NAIROBI.
106. WANINCHI SACCO SOCIETY LTD P.O BOX 910-10106 OTHAYA.
107. WANANDEGE SACCO SOCIETY LTD P.O BOX 19074-00501 NAIROBI.
108. WASHA SACCO SOCIETY LTD P.O BOX 83256-80100 MOMBASA.
109. WAUMINI SACCO SOCIETY LTD P.O BOX 66121-00800 NAIROBI.
110. WEVARSITY SACCO SOCIETY LTD P.O BOX 873-50100 KAKAMEGA.
111. WINAS SACCO SOCIETY LTD P.O BOX 696-60100 EMBU.
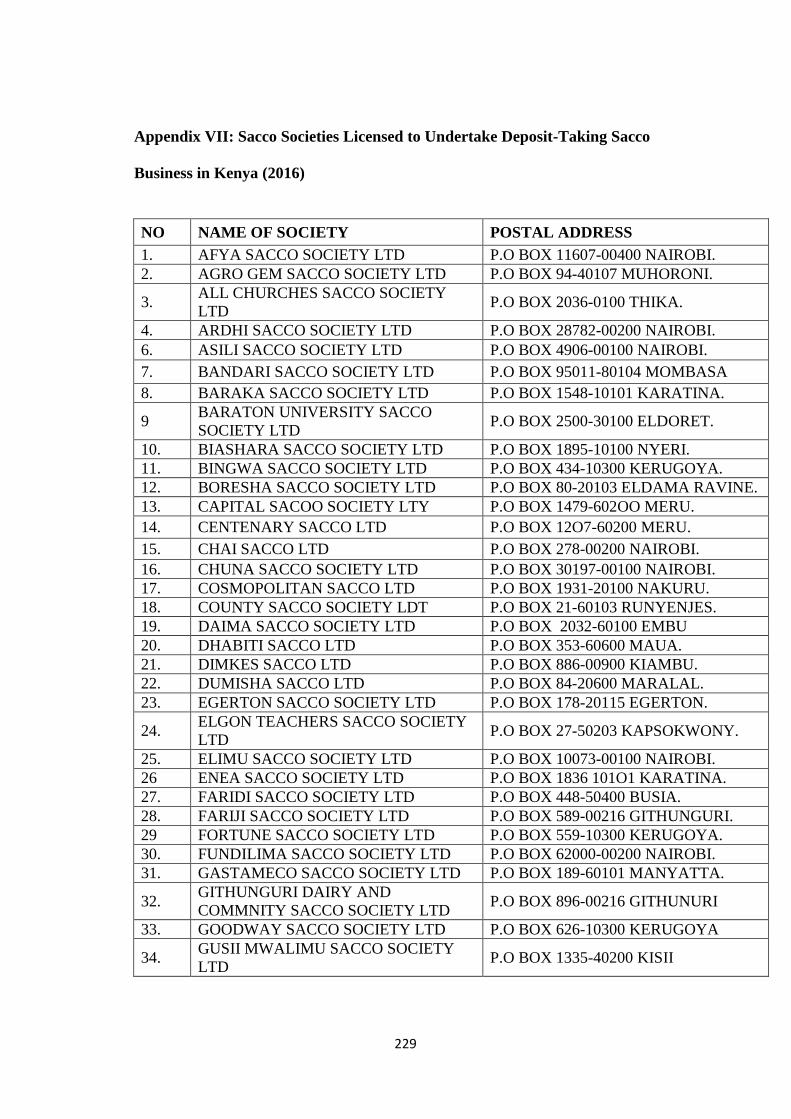
229
Appendix VII: Sacco Societies Licensed to Undertake Deposit-Taking Sacco
Business in Kenya (2016)
NO NAME OF SOCIETY POSTAL ADDRESS
1. AFYA SACCO SOCIETY LTD P.O BOX 11607-00400 NAIROBI.
2. AGRO GEM SACCO SOCIETY LTD P.O BOX 94-40107 MUHORONI.
3. ALL CHURCHES SACCO SOCIETY
LTD P.O BOX 2036-0100 THIKA.
4. ARDHI SACCO SOCIETY LTD P.O BOX 28782-00200 NAIROBI.
6. ASILI SACCO SOCIETY LTD P.O BOX 4906-00100 NAIROBI.
7. BANDARI SACCO SOCIETY LTD P.O BOX 95011-80104 MOMBASA
8. BARAKA SACCO SOCIETY LTD P.O BOX 1548-10101 KARATINA.
9 BARATON UNIVERSITY SACCO
SOCIETY LTD P.O BOX 2500-30100 ELDORET.
10. BIASHARA SACCO SOCIETY LTD P.O BOX 1895-10100 NYERI.
11. BINGWA SACCO SOCIETY LTD P.O BOX 434-10300 KERUGOYA.
12. BORESHA SACCO SOCIETY LTD P.O BOX 80-20103 ELDAMA RAVINE.
13. CAPITAL SACOO SOCIETY LTY P.O BOX 1479-602OO MERU.
14. CENTENARY SACCO LTD P.O BOX 12O7-60200 MERU.
15. CHAI SACCO LTD P.O BOX 278-00200 NAIROBI.
16. CHUNA SACCO SOCIETY LTD P.O BOX 30197-00100 NAIROBI.
17. COSMOPOLITAN SACCO LTD P.O BOX 1931-20100 NAKURU.
18. COUNTY SACCO SOCIETY LDT P.O BOX 21-60103 RUNYENJES.
19. DAIMA SACCO SOCIETY LTD P.O BOX 2032-60100 EMBU
20. DHABITI SACCO LTD P.O BOX 353-60600 MAUA.
21. DIMKES SACCO LTD P.O BOX 886-00900 KIAMBU.
22. DUMISHA SACCO LTD P.O BOX 84-20600 MARALAL.
23. EGERTON SACCO SOCIETY LTD P.O BOX 178-20115 EGERTON.
24. ELGON TEACHERS SACCO SOCIETY
LTD P.O BOX 27-50203 KAPSOKWONY.
25. ELIMU SACCO SOCIETY LTD P.O BOX 10073-00100 NAIROBI.
26 ENEA SACCO SOCIETY LTD P.O BOX 1836 101O1 KARATINA.
27. FARIDI SACCO SOCIETY LTD P.O BOX 448-50400 BUSIA.
28. FARIJI SACCO SOCIETY LTD P.O BOX 589-00216 GITHUNGURI.
29 FORTUNE SACCO SOCIETY LTD P.O BOX 559-10300 KERUGOYA.
30. FUNDILIMA SACCO SOCIETY LTD P.O BOX 62000-00200 NAIROBI.
31. GASTAMECO SACCO SOCIETY LTD P.O BOX 189-60101 MANYATTA.
32. GITHUNGURI DAIRY AND
COMMNITY SACCO SOCIETY LTD P.O BOX 896-00216 GITHUNURI
33. GOODWAY SACCO SOCIETY LTD P.O BOX 626-10300 KERUGOYA
34. GUSII MWALIMU SACCO SOCIETY
LTD P.O BOX 1335-40200 KISII
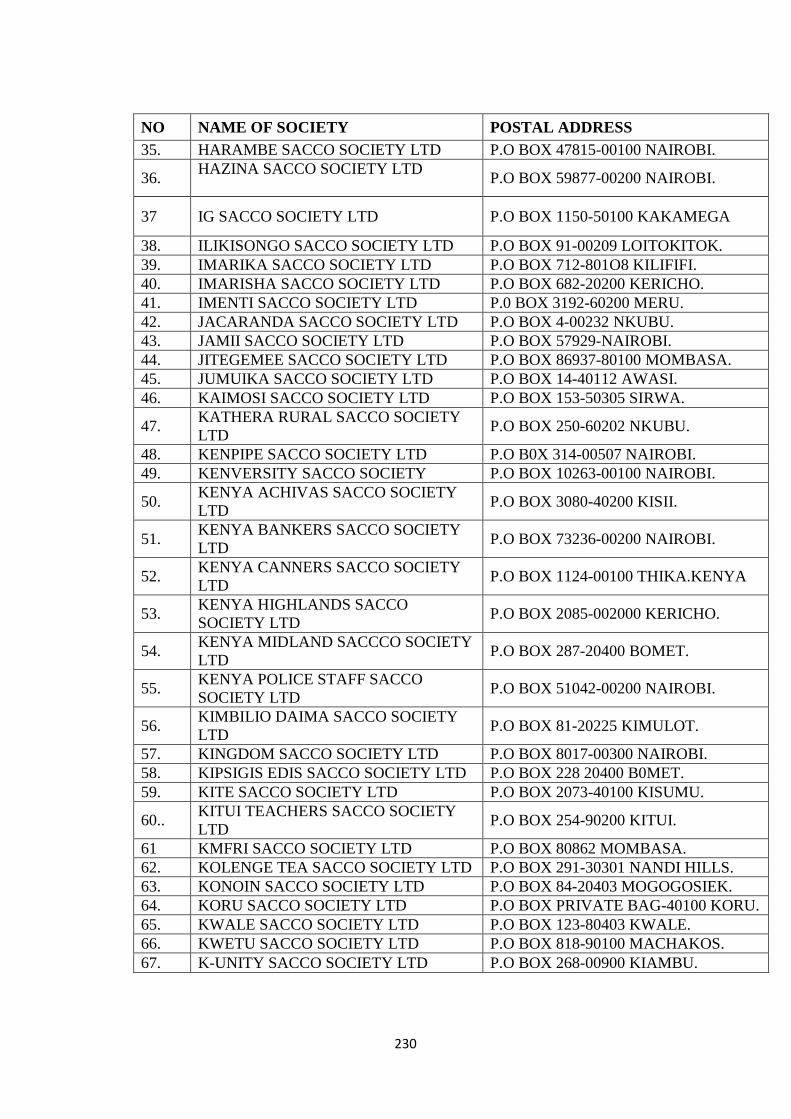
230
NO NAME OF SOCIETY POSTAL ADDRESS
35. HARAMBE SACCO SOCIETY LTD P.O BOX 47815-00100 NAIROBI.
36. HAZINA SACCO SOCIETY LTD
P.O BOX 59877-00200 NAIROBI.
37 IG SACCO SOCIETY LTD P.O BOX 1150-50100 KAKAMEGA
38. ILIKISONGO SACCO SOCIETY LTD P.O BOX 91-00209 LOITOKITOK.
39. IMARIKA SACCO SOCIETY LTD P.O BOX 712-801O8 KILIFIFI.
40. IMARISHA SACCO SOCIETY LTD P.O BOX 682-20200 KERICHO.
41. IMENTI SACCO SOCIETY LTD P.0 BOX 3192-60200 MERU.
42. JACARANDA SACCO SOCIETY LTD P.O BOX 4-00232 NKUBU.
43. JAMII SACCO SOCIETY LTD P.O BOX 57929-NAIROBI.
44. JITEGEMEE SACCO SOCIETY LTD P.O BOX 86937-80100 MOMBASA.
45. JUMUIKA SACCO SOCIETY LTD P.O BOX 14-40112 AWASI.
46. KAIMOSI SACCO SOCIETY LTD P.O BOX 153-50305 SIRWA.
47. KATHERA RURAL SACCO SOCIETY
LTD P.O BOX 250-60202 NKUBU.
48. KENPIPE SACCO SOCIETY LTD P.O B0X 314-00507 NAIROBI.
49. KENVERSITY SACCO SOCIETY P.O BOX 10263-00100 NAIROBI.
50. KENYA ACHIVAS SACCO SOCIETY
LTD P.O BOX 3080-40200 KISII.
51. KENYA BANKERS SACCO SOCIETY
LTD P.O BOX 73236-00200 NAIROBI.
52. KENYA CANNERS SACCO SOCIETY
LTD P.O BOX 1124-00100 THIKA.KENYA
53. KENYA HIGHLANDS SACCO
SOCIETY LTD P.O BOX 2085-002000 KERICHO.
54. KENYA MIDLAND SACCCO SOCIETY
LTD P.O BOX 287-20400 BOMET.
55. KENYA POLICE STAFF SACCO
SOCIETY LTD P.O BOX 51042-00200 NAIROBI.
56. KIMBILIO DAIMA SACCO SOCIETY
LTD P.O BOX 81-20225 KIMULOT.
57. KINGDOM SACCO SOCIETY LTD P.O BOX 8017-00300 NAIROBI.
58. KIPSIGIS EDIS SACCO SOCIETY LTD P.O BOX 228 20400 B0MET.
59. KITE SACCO SOCIETY LTD P.O BOX 2073-40100 KISUMU.
60.. KITUI TEACHERS SACCO SOCIETY
LTD P.O BOX 254-90200 KITUI.
61 KMFRI SACCO SOCIETY LTD P.O BOX 80862 MOMBASA.
62. KOLENGE TEA SACCO SOCIETY LTD P.O BOX 291-30301 NANDI HILLS.
63. KONOIN SACCO SOCIETY LTD P.O BOX 84-20403 MOGOGOSIEK.
64. KORU SACCO SOCIETY LTD P.O BOX PRIVATE BAG-40100 KORU.
65. KWALE SACCO SOCIETY LTD P.O BOX 123-80403 KWALE.
66. KWETU SACCO SOCIETY LTD P.O BOX 818-90100 MACHAKOS.
67. K-UNITY SACCO SOCIETY LTD P.O BOX 268-00900 KIAMBU.
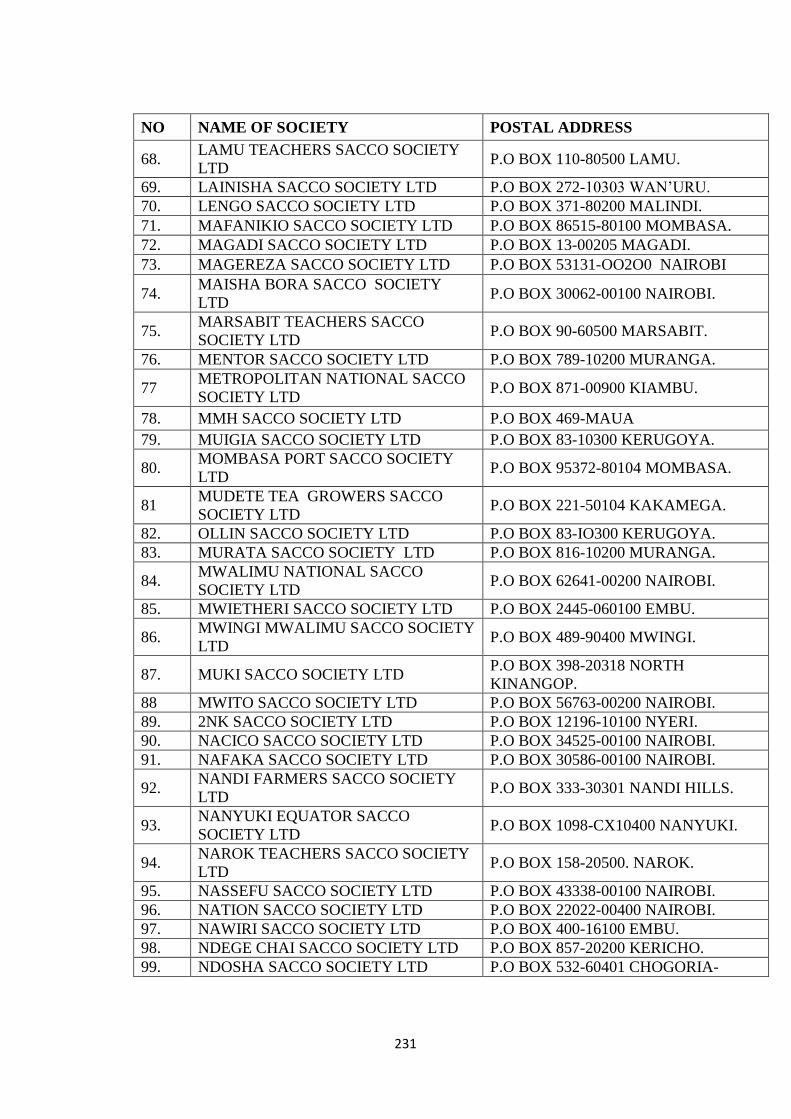
231
NO NAME OF SOCIETY POSTAL ADDRESS
68. LAMU TEACHERS SACCO SOCIETY
LTD P.O BOX 110-80500 LAMU.
69. LAINISHA SACCO SOCIETY LTD P.O BOX 272-10303 WAN‘URU.
70. LENGO SACCO SOCIETY LTD P.O BOX 371-80200 MALINDI.
71. MAFANIKIO SACCO SOCIETY LTD P.O BOX 86515-80100 MOMBASA.
72. MAGADI SACCO SOCIETY LTD P.O BOX 13-00205 MAGADI.
73. MAGEREZA SACCO SOCIETY LTD P.O BOX 53131-OO2O0 NAIROBI
74. MAISHA BORA SACCO SOCIETY
LTD P.O BOX 30062-00100 NAIROBI.
75. MARSABIT TEACHERS SACCO
SOCIETY LTD P.O BOX 90-60500 MARSABIT.
76. MENTOR SACCO SOCIETY LTD P.O BOX 789-10200 MURANGA.
77 METROPOLITAN NATIONAL SACCO
SOCIETY LTD P.O BOX 871-00900 KIAMBU.
78. MMH SACCO SOCIETY LTD P.O BOX 469-MAUA
79. MUIGIA SACCO SOCIETY LTD P.O BOX 83-10300 KERUGOYA.
80. MOMBASA PORT SACCO SOCIETY
LTD P.O BOX 95372-80104 MOMBASA.
81 MUDETE TEA GROWERS SACCO
SOCIETY LTD P.O BOX 221-50104 KAKAMEGA.
82. OLLIN SACCO SOCIETY LTD P.O BOX 83-IO300 KERUGOYA.
83. MURATA SACCO SOCIETY LTD P.O BOX 816-10200 MURANGA.
84. MWALIMU NATIONAL SACCO
SOCIETY LTD P.O BOX 62641-00200 NAIROBI.
85. MWIETHERI SACCO SOCIETY LTD P.O BOX 2445-060100 EMBU.
86. MWINGI MWALIMU SACCO SOCIETY
LTD P.O BOX 489-90400 MWINGI.
87. MUKI SACCO SOCIETY LTD P.O BOX 398-20318 NORTH
KINANGOP.
88 MWITO SACCO SOCIETY LTD P.O BOX 56763-00200 NAIROBI.
89. 2NK SACCO SOCIETY LTD P.O BOX 12196-10100 NYERI.
90. NACICO SACCO SOCIETY LTD P.O BOX 34525-00100 NAIROBI.
91. NAFAKA SACCO SOCIETY LTD P.O BOX 30586-00100 NAIROBI.
92. NANDI FARMERS SACCO SOCIETY
LTD P.O BOX 333-30301 NANDI HILLS.
93. NANYUKI EQUATOR SACCO
SOCIETY LTD P.O BOX 1098-CX10400 NANYUKI.
94. NAROK TEACHERS SACCO SOCIETY
LTD P.O BOX 158-20500. NAROK.
95. NASSEFU SACCO SOCIETY LTD P.O BOX 43338-00100 NAIROBI.
96. NATION SACCO SOCIETY LTD P.O BOX 22022-00400 NAIROBI.
97. NAWIRI SACCO SOCIETY LTD P.O BOX 400-16100 EMBU.
98. NDEGE CHAI SACCO SOCIETY LTD P.O BOX 857-20200 KERICHO.
99. NDOSHA SACCO SOCIETY LTD P.O BOX 532-60401 CHOGORIA-
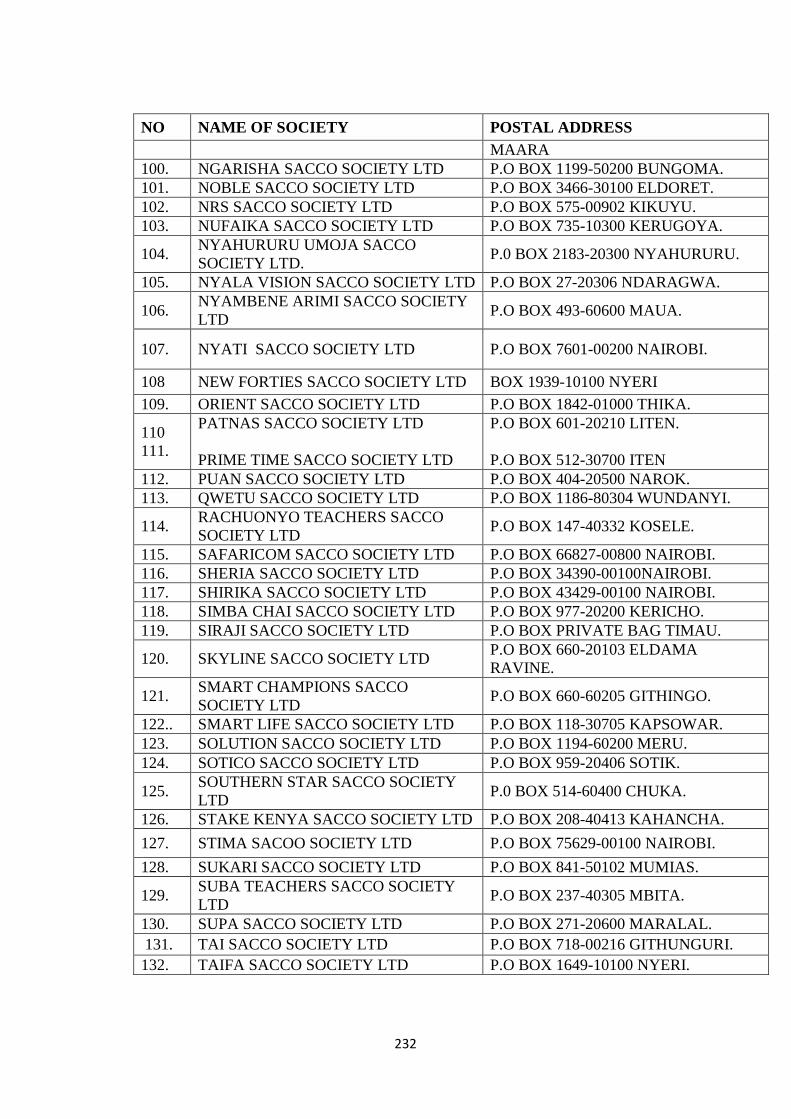
232
NO NAME OF SOCIETY POSTAL ADDRESS
MAARA
100. NGARISHA SACCO SOCIETY LTD P.O BOX 1199-50200 BUNGOMA.
101. NOBLE SACCO SOCIETY LTD P.O BOX 3466-30100 ELDORET.
102. NRS SACCO SOCIETY LTD P.O BOX 575-00902 KIKUYU.
103. NUFAIKA SACCO SOCIETY LTD P.O BOX 735-10300 KERUGOYA.
104. NYAHURURU UMOJA SACCO
SOCIETY LTD. P.0 BOX 2183-20300 NYAHURURU.
105. NYALA VISION SACCO SOCIETY LTD P.O BOX 27-20306 NDARAGWA.
106. NYAMBENE ARIMI SACCO SOCIETY
LTD P.O BOX 493-60600 MAUA.
107. NYATI SACCO SOCIETY LTD P.O BOX 7601-00200 NAIROBI.
108 NEW FORTIES SACCO SOCIETY LTD BOX 1939-10100 NYERI
109. ORIENT SACCO SOCIETY LTD P.O BOX 1842-01000 THIKA.
110
111.
PATNAS SACCO SOCIETY LTD
PRIME TIME SACCO SOCIETY LTD
P.O BOX 601-20210 LITEN.
P.O BOX 512-30700 ITEN
112. PUAN SACCO SOCIETY LTD P.O BOX 404-20500 NAROK.
113. QWETU SACCO SOCIETY LTD P.O BOX 1186-80304 WUNDANYI.
114. RACHUONYO TEACHERS SACCO
SOCIETY LTD P.O BOX 147-40332 KOSELE.
115. SAFARICOM SACCO SOCIETY LTD P.O BOX 66827-00800 NAIROBI.
116. SHERIA SACCO SOCIETY LTD P.O BOX 34390-00100NAIROBI.
117. SHIRIKA SACCO SOCIETY LTD P.O BOX 43429-00100 NAIROBI.
118. SIMBA CHAI SACCO SOCIETY LTD P.O BOX 977-20200 KERICHO.
119. SIRAJI SACCO SOCIETY LTD P.O BOX PRIVATE BAG TIMAU.
120. SKYLINE SACCO SOCIETY LTD P.O BOX 660-20103 ELDAMA
RAVINE.
121. SMART CHAMPIONS SACCO
SOCIETY LTD P.O BOX 660-60205 GITHINGO.
122.. SMART LIFE SACCO SOCIETY LTD P.O BOX 118-30705 KAPSOWAR.
123. SOLUTION SACCO SOCIETY LTD P.O BOX 1194-60200 MERU.
124. SOTICO SACCO SOCIETY LTD P.O BOX 959-20406 SOTIK.
125. SOUTHERN STAR SACCO SOCIETY
LTD P.0 BOX 514-60400 CHUKA.
126. STAKE KENYA SACCO SOCIETY LTD P.O BOX 208-40413 KAHANCHA.
127. STIMA SACOO SOCIETY LTD P.O BOX 75629-00100 NAIROBI.
128. SUKARI SACCO SOCIETY LTD P.O BOX 841-50102 MUMIAS.
129. SUBA TEACHERS SACCO SOCIETY
LTD P.O BOX 237-40305 MBITA.
130. SUPA SACCO SOCIETY LTD P.O BOX 271-20600 MARALAL.
131. TAI SACCO SOCIETY LTD P.O BOX 718-00216 GITHUNGURI.
132. TAIFA SACCO SOCIETY LTD P.O BOX 1649-10100 NYERI.
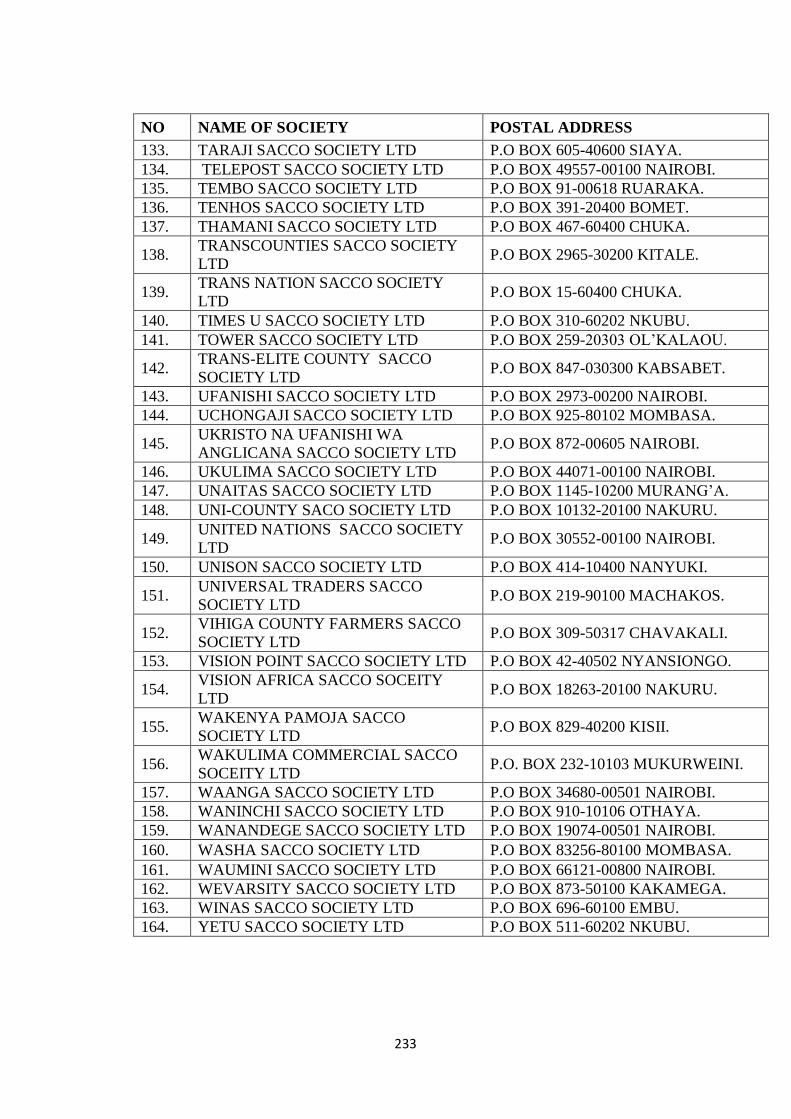
233
NO NAME OF SOCIETY POSTAL ADDRESS
133. TARAJI SACCO SOCIETY LTD P.O BOX 605-40600 SIAYA.
134. TELEPOST SACCO SOCIETY LTD P.O BOX 49557-00100 NAIROBI.
135. TEMBO SACCO SOCIETY LTD P.O BOX 91-00618 RUARAKA.
136. TENHOS SACCO SOCIETY LTD P.O BOX 391-20400 BOMET.
137. THAMANI SACCO SOCIETY LTD P.O BOX 467-60400 CHUKA.
138. TRANSCOUNTIES SACCO SOCIETY
LTD P.O BOX 2965-30200 KITALE.
139. TRANS NATION SACCO SOCIETY
LTD P.O BOX 15-60400 CHUKA.
140. TIMES U SACCO SOCIETY LTD P.O BOX 310-60202 NKUBU.
141. TOWER SACCO SOCIETY LTD P.O BOX 259-20303 OL‘KALAOU.
142. TRANS-ELITE COUNTY SACCO
SOCIETY LTD P.O BOX 847-030300 KABSABET.
143. UFANISHI SACCO SOCIETY LTD P.O BOX 2973-00200 NAIROBI.
144. UCHONGAJI SACCO SOCIETY LTD P.O BOX 925-80102 MOMBASA.
145. UKRISTO NA UFANISHI WA
ANGLICANA SACCO SOCIETY LTD P.O BOX 872-00605 NAIROBI.
146. UKULIMA SACCO SOCIETY LTD P.O BOX 44071-00100 NAIROBI.
147. UNAITAS SACCO SOCIETY LTD P.O BOX 1145-10200 MURANG‘A.
148. UNI-COUNTY SACO SOCIETY LTD P.O BOX 10132-20100 NAKURU.
149. UNITED NATIONS SACCO SOCIETY
LTD P.O BOX 30552-00100 NAIROBI.
150. UNISON SACCO SOCIETY LTD P.O BOX 414-10400 NANYUKI.
151. UNIVERSAL TRADERS SACCO
SOCIETY LTD P.O BOX 219-90100 MACHAKOS.
152. VIHIGA COUNTY FARMERS SACCO
SOCIETY LTD P.O BOX 309-50317 CHAVAKALI.
153. VISION POINT SACCO SOCIETY LTD P.O BOX 42-40502 NYANSIONGO.
154. VISION AFRICA SACCO SOCEITY
LTD P.O BOX 18263-20100 NAKURU.
155. WAKENYA PAMOJA SACCO
SOCIETY LTD P.O BOX 829-40200 KISII.
156. WAKULIMA COMMERCIAL SACCO
SOCEITY LTD P.O. BOX 232-10103 MUKURWEINI.
157. WAANGA SACCO SOCIETY LTD P.O BOX 34680-00501 NAIROBI.
158. WANINCHI SACCO SOCIETY LTD P.O BOX 910-10106 OTHAYA.
159. WANANDEGE SACCO SOCIETY LTD P.O BOX 19074-00501 NAIROBI.
160. WASHA SACCO SOCIETY LTD P.O BOX 83256-80100 MOMBASA.
161. WAUMINI SACCO SOCIETY LTD P.O BOX 66121-00800 NAIROBI.
162. WEVARSITY SACCO SOCIETY LTD P.O BOX 873-50100 KAKAMEGA.
163. WINAS SACCO SOCIETY LTD P.O BOX 696-60100 EMBU.
164. YETU SACCO SOCIETY LTD P.O BOX 511-60202 NKUBU.

234
Appendix VIII: Pilot Survey
1. AGRO GEM SACCO SOCIETY LTD P.O BOX 94-40107
MUHORONI.
2. ASILI SACO SOCIETY LTD P.O BOX 4906-00100
NAIROBI.
3. KENYA CANNERS SACCO SOCIETY
LTD
P.O BOX 1124-00100
THIKA.
4. KMFRI SACCO SOCIETY LTD P.O BOX 80862-10400
MOMBASA.
5. LENGO SACCO SOCIETY LTD P.O BOX 371-80200
MALINDI.
6. NYANYUKI EQUATOR SACCO
SOCIETY LTD
P.O BOX 1098-10400
NYANYUKI.
7. SAFARICOM SACCO SOCIETY LTD P.O BOX 66827-00800
NAIROBI.
8. SHIRIKA SACCO SOCEITY LTD P.O BOX 43429-00100
NAIROBI.
9. SOUTHERN STAR SACCO SOCIETY
LTD
P.O BOX 514-60400
CHUKA.
10. STIMA SACCO SOCEITY LTD P.O. BOX 75629-00100
NAIROBI.
11. SUPA SACCO SOCIETY LTD P.O BOX 271-20600
MARALAL.
12. SUBA SACCO SOCIETY LTD P.O BOX 237-40305
MBITA.

235
.

236

237
Related Documents