Capacity Value of PV and Wind Generation in the NV Energy System S. Lu R. Diao N. Samaan P. Etingov September 2012 Prepared for the U. S. Department of Energy under Contract DE-AC05-76RL01830 PNNL-22117

Welcome message from author
This document is posted to help you gain knowledge. Please leave a comment to let me know what you think about it! Share it to your friends and learn new things together.
Transcript

Capacity Value of PV and Wind Generation in the NV Energy System S. Lu R. Diao N. Samaan P. Etingov September 2012
Prepared for the U. S. Department of Energy under Contract DE-AC05-76RL01830
PNNL-XXXXX
Prepared for the U. S. Department of Energy under Contract DE-AC05-76RL01830
PNNL-22117

DISCLAIMER
This report was prepared as an account of work sponsored by an agency of the United States Government. Neither the United States Government nor any agency thereof, nor Battelle Memorial Institute, nor any of their employees, makes any warranty, express or implied, or assumes any legal liability or responsibility for the accuracy, completeness, or usefulness of any information, apparatus, product, or process disclosed, or represents that its use would not infringe privately owned rights. Reference herein to any specific commercial product, process, or service by trade name, trademark, manufacturer, or otherwise does not necessarily constitute or imply its endorsement, recommendation, or favoring by the United States Government or any agency thereof, or Battelle Memorial Institute. The views and opinions of authors expressed herein do not necessarily state or reflect those of the United States Government or any agency thereof.
PACIFIC NORTHWEST NATIONAL LABORATORY operated by BATTELLE
for the UNITED STATES DEPARTMENT OF ENERGY
under Contract DE-AC05-76RL01830
Printed in the United States of America
Available to DOE and DOE contractors from the Office of Scientific and Technical Information,
P.O. Box 62, Oak Ridge, TN 37831-0062; ph: (865) 576-8401 fax: (865) 576-5728 email: [email protected]
Available to the public from the National Technical Information Service, U.S. Department of Commerce, 5285 Port Royal Rd., Springfield, VA 22161
ph: (800) 553-6847 fax: (703) 605-6900 email: [email protected] online ordering: http://www.ntis.gov/ordering.htm
This document was printed on recycled paper. (9/2003)

PNNL-22117
Capacity Value of PV and Wind Generation in the NV Energy System S. Lu (Principal Investigator) R. Diao (Task Lead) N. Samaan P. Etingov September 2012 Prepared for the U. S. Department of Energy under Contract DE-AC05-76RL01830 Pacific Northwest National Laboratory Richland, Washington 99352

iii
Abstract Calculation of photovoltaic (PV) and wind power capacity values is important for estimating additional load that can be served by new PV or wind installations in the electrical power system. It also is the basis for assigning capacity credit payments in systems with markets. Because of variability in solar and wind resources, PV and wind generation contribute to power system resource adequacy differently from conventional generation. Many different approaches to calculating PV and wind generation capacity values have been used by utilities and transmission operators. Using the NV Energy system as a study case, this report applies peak-period capacity factor (PPCF) and effective load carrying capability (ELCC) methods to calculate capacity values for renewable energy sources. We show the connection between the PPCF and ELCC methods in the process of deriving a simplified approach that approximates the ELCC method. This simplified approach does not require generation fleet data and provides the theoretical basis for a quick check on capacity value results of PV and wind generation. The diminishing return of capacity benefit as renewable generation increases is conveniently explained using the simplified capacity value approach.

iv
Acknowledgement The authors would like to thank NV Energy colleagues Vladimir Chadliev, Rich Salgo, Bobby Hollis, and James Doubek for their support and productive discussions.
The U.S. Department of Energy Office of Electricity Delivery and Energy Reliability sponsored this project.

v
Contents
Abstract ........................................................................................................................................................ iii Acknowledgement ....................................................................................................................................... iv 1.0 Introduction ....................................................................................................................................... 1 2.0 Peak-Period Capacity Factor Method ............................................................................................... 2
2.1 Methodology Description ............................................................................................................. 2 2.2 Simulation Results ........................................................................................................................ 3
3.0 Effective Load Carrying Capability Method..................................................................................... 7 3.1 Methodology Description ............................................................................................................. 7 3.2 Simulation Results ........................................................................................................................ 9
4.0 Wind Generation Capacity Value ................................................................................................... 12 5.0 A Simplified Capacity Value Approach ......................................................................................... 14
5.1 Development of a Simplified Approach ..................................................................................... 14 5.2 Capacity Value Diminishing Return Explained .......................................................................... 18
6.0 Conclusions ..................................................................................................................................... 20 7.0 References ....................................................................................................................................... 21

vi
Figures
Figure 2-1. Capacity Factor with Respect to the Percentage of Peak Load Hours ..................................... 3 Figure 3-1. NV Energy Southern System Load Duration Curve ................................................................ 7 Figure 3-2. LOLP of NV Energy Southern System Generation Fleet......................................................... 8 Figure 3-4. Hourly Load Profile in the NV Energy Southern System in 2007 ......................................... 10 Figure 3-5. Concept for Determining PV Capacity using the ELCC Method .......................................... 10 Figure 3-6. Impact of Increased PV Penetration on Capacity Value ........................................................ 11 Figure 4-1. Hourly Load Profile in the Entire NV Energy System, 2010 ................................................. 12 Figure 4-3. Wind Generation Capacity Value in the Entire NV Energy System, 2010 ............................ 13 Figure 5-1. Load Duration Curve for PV Case 5 and its PV Capacity Value ........................................... 14 Figure 5-2. LOLP of NV Energy Southern System Generation Fleet (probability of in-service
capacity being less than specific demand values) ................................................................. 15 Figure 5-3. Load Duration Curves for the NV Energy southern system with an Indication of the
Threshold Demand dth for Calculating the LOLE.................................................................. 16 Figure 5-4. Distribution of Peak Load Hours at Different PV Penetration Levels ................................... 19 Figure 5-5. Distribution of PV Capacity Factor during Peak Load Hours ................................................ 19

vii
Tables
Table 2-1. PV Capacity Factor during Peak Load Hours during a Year ..................................................... 4 Table 2-2. PV Capacity Value based on the Capacity Factor during the Daily Peak Period ...................... 6 Table 3-1. PV Capacity Value with Respect to Installed Capacity ........................................................... 10 Table 5-1. PV Capacity Value Calculation Results Comparison .............................................................. 17 Table 5-2. Wind Capacity Value Calculation Results Comparison .......................................................... 18


1
1.0 Introduction
The adequacy of power generation resources is very important in the areas of system planning and secure operations. It is influenced by the availability of generation resources and the effects of bulk transmission and distribution systems. Factors affecting generation resource availability include forced outages, scheduled maintenance, derating, and other reasons. Load forecast uncertainty also can affect resource adequacy and needs to be considered in generation planning studies. The calculation of photovoltaic (PV) and wind power capacity values is important for estimating additional load that can be served by new PV or wind installations in the electrical power system. It also is the basis for assigning capacity credit payments in systems with markets. Because of their variability PV and wind generation contribute to system resource adequacy in ways that are different from conventional generators. Calculation of capacity values for these variable resources is, therefore, treated differently from conventional generators. Many methods have been used by different utilities and transmission operators in the United States [1] [2]. These various methods often result in different values even when based on the same data set. Among these methods, the effective load carrying capability (ELCC) method, which is based on loss of load expectation (LOLE), is considered the most accurate; however, it also requires complicated calculations and large amount of generator and load data [1] [3]. The peak-period capacity factor (PPCF) method uses average capacity factors (or capacity factors with an exceedance level) calculated over certain peak load periods to estimate the capacity value. The PPCF method is clear and simple in concept; however, it seemingly lacks the rigor and the link to the reliability metric of LOLE. This report uses the NV Energy system as a study case, and applies the PPCF and ELCC methods to calculate capacity values for PV and wind generation. The connection between these two methods is shown by deriving a simplified approach that approximates the ELCC method. This approximation does not require the generation fleet data and provides the theoretical basis for a quick check of PV and wind generation capacity values. The diminishing return of capacity benefit as renewable generation increases is conveniently explained using the simplified capacity value approach. The report is organized as follows. In Chapter 2, the PPCF method is described, and results from its use are shown for various PV penetration cases. In Chapter 3, the ELCC method for computing capacity values of variable renewable resources is described, and results for PV cases are presented. In Chapter 4, the capacity value of wind resources in the NV Energy system is calculated using the ELCC method. A simplified approach that approximates the ELCC method is discussed in Chapter 5. This simplified method is tested using the same study cases, and a comparison is made between the simplified method and the ELCC method. The diminishing return of the renewable resources capacity value also is explained in this chapter. Finally, conclusions are discussed in Chapter 6.

2
2.0 Peak-Period Capacity Factor Method
2.1 Methodology Description
Integration of variable renewable generation sources into a power system raises issues about how to quantify the capacity value of these sources. Different approaches have been developed to assess the capacity value of PV and wind sources. References [1-3] provide overviews for these different approaches. In this chapter, the PPCF method, based on the capacity factor of PV generation during a certain percentile of peak load period, is applied to the NV Energy system. The system load duration curve is divided into nine bins, including 0.05%, 0.1%, 1%, 5%, 10%, 25%, 50%, 75%, and 100%. These bins correspond to the 4, 8, 88, etc., hours with highest load out of 8760 hours of a year, respectively. The average capacity factor of PV generation during each peak load period is calculated using Equation (2.1) and assigned the capacity value of PV. The correlation between PV generation and load is maintained in the calculation.
𝐴𝑣𝑒𝑟𝑎𝑔𝑒 𝐶𝑎𝑝𝑎𝑐𝑖𝑡𝑦 𝐹𝑎𝑐𝑡𝑜𝑟 = ∑𝑆𝑜𝑙𝑎𝑟 𝑃𝑜𝑤𝑒𝑟 𝑜𝑓 𝑆𝑒𝑙𝑒𝑐𝑡𝑒𝑑 𝑃𝑒𝑎𝑘 𝐿𝑜𝑎𝑑 𝐻𝑜𝑢𝑟𝑠𝐼𝑛𝑠𝑡𝑎𝑙𝑙𝑒𝑑 𝑆𝑜𝑙𝑎𝑟 𝐶𝑎𝑝𝑎𝑐𝑖𝑡𝑦×𝑇𝑜𝑡𝑎𝑙 𝑁𝑢𝑚𝑏𝑒𝑟 𝑜𝑓 𝑆𝑒𝑙𝑒𝑐𝑡𝑒𝑑 𝑃𝑒𝑎𝑘 𝐿𝑜𝑎𝑑 𝐻𝑜𝑢𝑟𝑠
(2.1) Based on the distribution of capacity factors during peak load hours, PV capacity values with a certain confidence level also can be calculated. For example, a capacity value with 90% confidence means the number is smaller than the actual PV capacity factor 90% of the time. 𝐶𝑜𝑛𝑓𝑖𝑑𝑒𝑛𝑐𝑒 𝐿𝑒𝑣𝑒𝑙 = 𝑃𝑟𝑜𝑏𝑎𝑏𝑖𝑙𝑖𝑡𝑦(𝐶𝑎𝑝𝑎𝑐𝑖𝑡𝑦 𝐹𝑎𝑐𝑡𝑜𝑟 𝑖𝑛 𝑆𝑒𝑙𝑒𝑐𝑡𝑒𝑑 𝑃𝑒𝑎𝑘 𝐻𝑜𝑢𝑟𝑠 ≥ 𝐶𝑎𝑝𝑎𝑐𝑖𝑡𝑦 𝑉𝑎𝑙𝑢𝑒) (2.2) Results of the NV Energy PV capacity value based on the approach described above are shown in Section 2.2.1. The analysis uses simulated PV generation data in 2007 produced by Sandia National Laboratories (PV Case 1). A variation of the above approach is used by the California Independent Services Operator (CAISO) to calculate the capacity value (termed “qualifying capacity” or “QC”) of combined PV and wind generation [4]. In the CAISO approach, a daily peak load period of 5 hours is defined for each calendar month. A capacity value corresponding to a chosen confidence level (termed the “exceedence factor” in the CAISO approach) then are determined for each month based on the defined daily peak period rather than the peak load periods of the entire year. A capacity value assessment similar to that used in CAISO was implemented for comparison, and the results of that assessment are shown in Section 2.2.2. The capacity value was calculated for the entire year instead of on a monthly basis in the NV Energy study. The CAISO-type approach contains mainly two steps, which are described below:
1. First, calculate the daily average capacity factor during the defined daily peak load period: 𝐴𝑣𝑒𝑟𝑎𝑔𝑒 𝐶𝑎𝑝𝑎𝑐𝑖𝑡𝑦 𝐹𝑎𝑐𝑡𝑜𝑟 𝑖𝑛 𝐷𝑎𝑖𝑙𝑦 𝑃𝑒𝑎𝑘 𝐿𝑜𝑎𝑑 𝑃𝑒𝑟𝑖𝑜𝑑 = ∑𝑆𝑜𝑙𝑎𝑟 𝑃𝑜𝑤𝑒𝑟 𝑜𝑓 𝐷𝑎𝑖𝑙𝑦 𝑃𝑒𝑎𝑘 𝐿𝑜𝑎𝑑 𝑃𝑒𝑟𝑖𝑜𝑑𝐼𝑛𝑠𝑡𝑎𝑙𝑙𝑒𝑑 𝑆𝑜𝑙𝑎𝑟 𝐶𝑎𝑝𝑎𝑐𝑖𝑡𝑦×𝑁𝑢𝑚𝑏𝑒𝑟 𝑜𝑓𝐻𝑜𝑢𝑟𝑠 𝑖𝑛 𝐷𝑎𝑖𝑙𝑦 𝑃𝑒𝑎𝑘 𝐿𝑜𝑎𝑑 𝑃𝑒𝑟𝑖𝑜𝑑
(2.3)

3
2. Second, find the capacity value at a certain confidence level, P, which is equal to the Pth percentile of the daily average capacity factor during peak load period of the whole year:
𝐶𝑜𝑛𝑓𝑖𝑑𝑒𝑛𝑐𝑒 𝐿𝑒𝑣𝑒𝑙 = 𝑃𝑟𝑜𝑏𝑎𝑏𝑖𝑙𝑖𝑡𝑦(𝐷𝑎𝑖𝑙𝑦 𝐴𝑣𝑒𝑟𝑎𝑔𝑒 𝐶𝑎𝑝𝑎𝑐𝑖𝑡𝑦 𝐹𝑎𝑐𝑡𝑜𝑟 𝑖𝑛 𝑃𝑒𝑎𝑘 𝐿𝑜𝑎𝑑 𝑃𝑒𝑟𝑖𝑜𝑑 ≥ 𝐶𝑎𝑝𝑎𝑐𝑖𝑡𝑦 𝑉𝑎𝑙𝑢𝑒) (2.4)
2.2 Simulation Results
2.2.1 Yearly PPCF Approach The NV Energy PV capacity value based on yearly peak period capacity factors is presented in this section. The PV capacity factor in the NV Energy system is calculated using the total name plate value of 149.5 MW, as defined in large PV Case1 data set. The capacity factors calculated with respect to different percentages of peak load hours are shown in Figure 2-1. The detailed capacity factors displayed in Figure 2-1 are further tabulated in Table 2-1. Note that, for the 0.05% and 0.1% peak load hours, because the total number of hours is small, rounding up or down could make a significant difference when calculating the capacity value at a certain confidence. The results shown here were rounded toward the more conservative direction (i.e., a lower capacity value). In Figure 2-2, the distribution of system load during a certain percentage of peak load hours is provided to help interpret the results. Similarly, the distribution of the PV capacity factors during peak load periods is shown in Figure 2-3.
(a) (b)
(c)
Figure 2-1. Capacity Factor with Respect to the Percentage of Peak Load Hours
0.05 0.1 1 5 10 25 50 75 1000
0.1
0.2
0.3
0.4
0.5
0.6
0.7
0.8
0.9
1
Percent of Peak Load Hours
Cap
acity
Fac
tor
50% ConfidenceAverage
0.05 0.1 1 5 10 25 50 75 1000
0.1
0.2
0.3
0.4
0.5
0.6
0.7
0.8
0.9
1
Percent of Peak Load Hours
Cap
acity
Fac
tor
70% ConfidenceAverage
0.05 0.1 1 5 10 25 50 75 1000
0.1
0.2
0.3
0.4
0.5
0.6
0.7
0.8
0.9
1
Percent of Peak Load Hours
Cap
acity
Fac
tor
90% ConfidenceAverage

4
Table 2-1. PV Capacity Factor during Peak Load Hours during a Year
% of Peak Load Hours 0.05 0.1 1 5 10 25 50 75 100 50% Confidence 0.6724 0.6856 0.6676 0.6324 0.5835 0.5230 0.0999 0.1800 0.0083 70% Confidence 0.5383 0.5665 0.5562 0.4214 0.2757 0 0 0 0 90% Confidence 0.3762 0.3762 0.3762 0.0717 0 0 0 0 0
Average 0.5814 0.6358 0.6105 0.5404 0.4849 0.4246 0.3247 0.3356 0.2926
(a) (b)
(c) (d)
(e) (f)
Figure 2-2. Distribution of Certain Percentage Levels of Peak Load Hours
1 2 3 4 5 6 7 8 9 10 11 12 13 14 15 16 17 18 19 20 21 22 23 240
0.1
0.2
0.3
0.4
0.5
0.6
0.7
0.8
0.9
1Distribution of 0.05% Peak Load Hours
Hour of the Day
No.
of H
ours
1 2 3 4 5 6 7 8 9 10 11 12 13 14 15 16 17 18 19 20 21 22 23 240
0.2
0.4
0.6
0.8
1
1.2
1.4
1.6
1.8
2Distribution of 0.1% Peak Load Hours
Hour of the Day
No.
of H
ours
1 2 3 4 5 6 7 8 9 10 11 12 13 14 15 16 17 18 19 20 21 22 23 240
10
20
30
40
50
60
70
80Distribution of 5% Peak Load Hours
Hour of the Day
No.
of H
ours
1 2 3 4 5 6 7 8 9 10 11 12 13 14 15 16 17 18 19 20 21 22 23 240
50
100
150Distribution of 25% Peak Load Hours
Hour of the Day
No.
of H
ours
1 2 3 4 5 6 7 8 9 10 11 12 13 14 15 16 17 18 19 20 21 22 23 240
50
100
150
200
250
300
350Distribution of 50% Peak Load Hours
Hour of the Day
No.
of H
ours
1 2 3 4 5 6 7 8 9 10 11 12 13 14 15 16 17 18 19 20 21 22 23 240
50
100
150
200
250
300
350
400Distribution of 75% Peak Load Hours
Hour of the Day
No.
of H
ours

5
(a) (b)
(c) (d)
(e) (f)
Figure 2-3. Distribution of PV Capacity during Certain Percentage of Peak Load Hours
0 0.2 0.4 0.6 0.8 10
0.1
0.2
0.3
0.4
0.5
0.6
0.7
0.8
0.9
1Distribution of Solar Capacity Factor During 0.05% Peak Load Hours
Capacity Factor
No.
of H
ours
0 0.2 0.4 0.6 0.8 10
0.5
1
1.5
2
2.5
3Distribution of Solar Capacity Factor During 0.1% Peak Load Hours
Capacity Factor
No.
of H
ours
0 0.2 0.4 0.6 0.8 10
10
20
30
40
50
60
70Distribution of Solar Capacity Factor During 5% Peak Load Hours
Capacity Factor
No.
of H
ours
0 0.2 0.4 0.6 0.8 10
100
200
300
400
500
600
700
800Distribution of Solar Capacity Factor During 25% Peak Load Hours
Capacity Factor
No.
of H
ours
0 0.2 0.4 0.6 0.8 10
500
1000
1500
2000
2500Distribution of Solar Capacity Factor During 50% Peak Load Hours
Capacity Factor
No.
of H
ours
0 0.2 0.4 0.6 0.8 10
500
1000
1500
2000
2500
3000Distribution of Solar Capacity Factor During 75% Peak Load Hours
Capacity Factor
No.
of H
ours
6
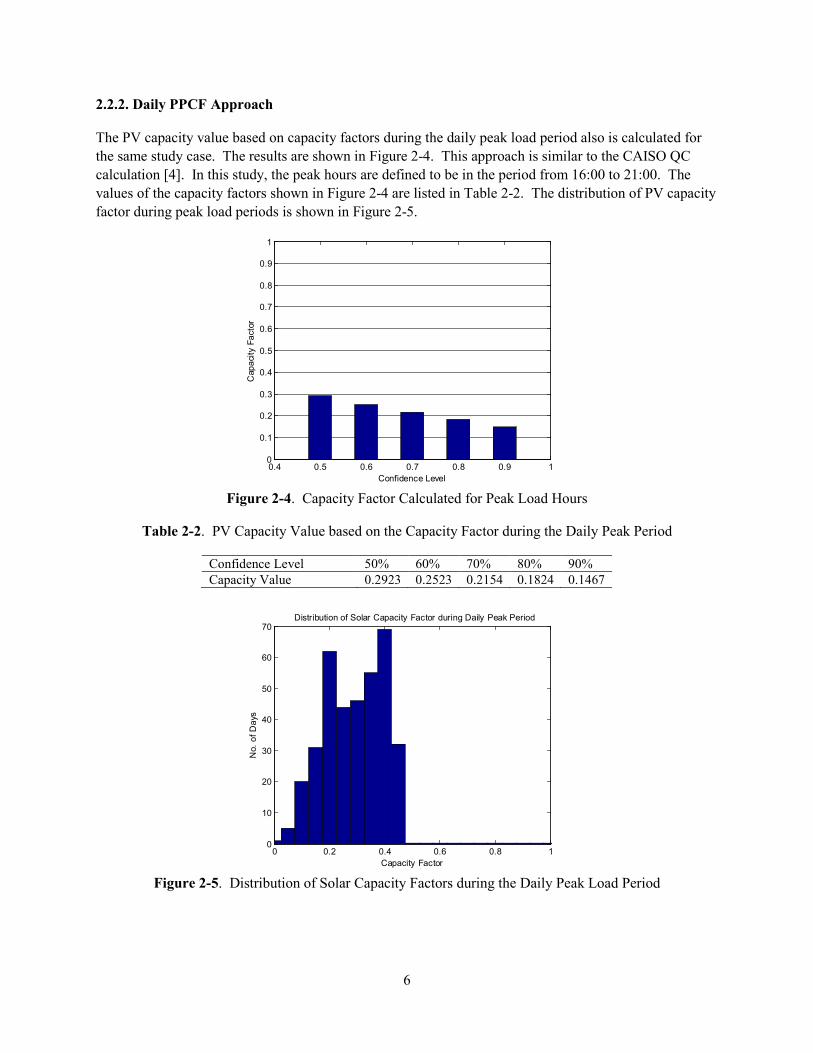
2.2.2. Daily PPCF Approach The PV capacity value based on capacity factors during the daily peak load period also is calculated for the same study case. The results are shown in Figure 2-4. This approach is similar to the CAISO QC calculation [4]. In this study, the peak hours are defined to be in the period from 16:00 to 21:00. The values of the capacity factors shown in Figure 2-4 are listed in Table 2-2. The distribution of PV capacity factor during peak load periods is shown in Figure 2-5.
Figure 2-4. Capacity Factor Calculated for Peak Load Hours
Table 2-2. PV Capacity Value based on the Capacity Factor during the Daily Peak Period
Confidence Level 50% 60% 70% 80% 90% Capacity Value 0.2923 0.2523 0.2154 0.1824 0.1467
Figure 2-5. Distribution of Solar Capacity Factors during the Daily Peak Load Period
0.4 0.5 0.6 0.7 0.8 0.9 10
0.1
0.2
0.3
0.4
0.5
0.6
0.7
0.8
0.9
1
Confidence Level
Cap
acity
Fac
tor
0 0.2 0.4 0.6 0.8 10
10
20
30
40
50
60
70Distribution of Solar Capacity Factor during Daily Peak Period
Capacity Factor
No.
of D
ays

7
3.0 Effective Load Carrying Capability Method
3.1 Methodology Description
In this section, we describe the ELCC method used to quantify the capacity value of variable renewable resources. ELCC is identified as the most preferred method in determining PV capacity value by a Solar Electric Power Association workshop [1], and also recommended by the IEEE Power and Energy Society Task Force on the Capacity Value of Wind Power [3]. System reliability can be measured by loss of load probability (LOLP), which is the probability that load is higher than available generation at a given time or LOLE, which is the expected time during which load is higher than available generation. The concept of LOLP, shown in Figure 3-1, can be expressed in Equation (3.1). Figure 3-2 provides an example of the LOLP of the NV Energy southern system generation fleet. For time interval t, the LOLP is:
𝐿𝑂𝐿𝑃(𝑡) = 𝑃𝑡(𝐶𝑖𝑛 𝑠𝑒𝑟𝑣𝑖𝑐𝑒 < 𝑑𝑡) (3.1)
Figure 3-1. NV Energy Southern System Load Duration Curve
The system LOLE can be calculated using Equation (3.2) if the length of time interval T is 1 hour.
𝐿𝑂𝐿𝐸𝑦𝑒𝑎𝑟 = ∑ 𝑇 ∗ 𝑃𝑡�𝐶𝑖𝑛 𝑠𝑒𝑟𝑣𝑖𝑐𝑒 < 𝑑𝑡�8760𝑡=1 = ∑ 𝑃𝑡�𝐶𝑖𝑛 𝑠𝑒𝑟𝑣𝑖𝑐𝑒 < 𝑑𝑡�8760
𝑡=1 (3.2)
Note that the common industry practice for the calculation of LOLP and LOLE is performed hourly and therefore, only considers meeting the total energy demand in each hour, and does not include the capacity and ramp requirements for catching up with load ramps and intra-hour variability of load. The later, usually taken care of by balancing reserves, may deserve special attention in generation adequacy assessment in a high renewable penetration environment. However, this is outside the scope of this report and will be inverstigated separately. For conventional generators, LOLE is an effective metric for quantifying generation adequacy to meet system load. It is affected by various factors including generation availability such as forced outage, derating, maintenance, and transmission and distribution system availability. In the ELCC method, the
0 1000 2000 3000 4000 5000 6000 7000 8000 90000
1000
2000
3000
4000
5000
6000
Hour
Load
(MW
)
Total Load
Capacity in serviceUnserved load

8
capacity value of renewable generation is calculated as the additional load that can be served as a result of the generation addition while maintaining the same level of reliability. A description of the procedure follows. A flow chart describing these steps is depicted in Figure 3-3.
1. Prepare a full list of generators with their forced outage rates, which excludes any renewable generator to be evaluated.
2. Calculate the capacity outage probability table by convolution, which contains a certain level of generation and its probability.
3. For a given load series with hourly resolution during a specific period, calculate the hourly LOLP values. Note that the actual load curve is to be used here without considering any renewable generation.
4. Calculate the LOLE level based on the LOLP values from the previous step. 5. Adjust load level throughout the entire study period by adding ∆L until the LOLE reaches the
NERC standard, 2.4 hours/year target. Record the peak load level when LOLE = 2.4 hours/year, PL1.
6. Find the net load curve by subtracting the renewable power output from the actual load. 7. Use this net load curve as input, and calculate the LOLE value. This should be lower than the
one calculated using the actual load. 8. Iteratively increase ∆L so that the new LOLE value reaches 2.4 hours/year. Record the new peak
load value, PL2. 9. Thus, the capacity value (or ELCC) of renewable resource is PL2 - PL1.
Figure 3-2. LOLP of the NV Energy Southern System Generation Fleet
0 1000 2000 3000 4000 5000 6000-60
-50
-40
-30
-20
-10
0
demand, MW
Log
10P
(Cin
se
rvic
e <
de
ma
nd
)

9
Figure 3-3. Flow Chart for Calculating the Capacity Value of a Renewable Resource
3.2 Simulation Results
In this section, the ELCC method is applied on the NV Energy southern system for the 2007 study year to calculate the capacity value of PV generation. Data sets including load profile, PV profile, and generator table with FOR are used in the analysis. The load profile in 2007 is shown in Figure 3-4. The generator list with associated FOR values used for LOLE calculations is provided in Appendix A. The ELCC method is tested on five study cases, representing different levels of PV penetration in the NV Energy southern system. The concept of this method of determining the PV capacity value is further illustrated in Figure 3-5. The calculated PV capacity values for different study cases are shown in Table 3-1. The trend plot shown in Figure 3-6 illustrates the impact of increasing PV penetration on the capacity value. It can be observed in Figure 3-6 that the capacity value of PV generation in percentage decreases as the installation capacity increases. The cause of this diminishing benefit is explained in Chapter 5 with the derivation of a simplified capacity value approach approximating the ELCC method.

10
Figure 3-4. Hourly Load Profile in the NV Energy Southern System, 2007
Figure 3-5. Concept for Determining PV Capacity using the ELCC Method
Table 3-1. PV Capacity Value with Respect to Installed Capacity
Cases Installed Capacity, MW PV Capacity Value, MW PV Capacity Value, Percentage
1 149 85.55 57.41% 2 222 113.87 51.29% 3 292 143.36 49.10% 4 492 235.55 47.88% 5 892 343.16 38.47%
0 1000 2000 3000 4000 5000 6000 7000 80001500
2000
2500
3000
3500
4000
4500
5000
5500
6000
Hour
Load
in S
outh
ern
NV
E, M
W
5600 5700 5800 5900 6000 6100 62000
0.5
1
1.5
2
2.5
3
← w/o solar
5901.0
← w/ solar
5986.6
Max Load, MW
LOLE
, hou
rs/y
ear
max original load: 5877.0 MW --solar installed capacity: 149.0 MW
ELCC

11
Figure 3-6. Impact of Increased PV Penetration on Capacity Value
149 222 292 492 8920
10
20
30
40
50
60
70
80
90
100
PV Installed Capacity, MW
PV
Cap
acity
Val
ue, %

12
4.0 Wind Generation Capacity Value
In this chapter, the same ELCC method described in Chapter 3 is implemented to evaluate the capacity value of wind resource in the NV Energy system. Based on the data available, this study is performed for the year 2010, for both the northern and southern parts of the NV Energy system. As shown in Figure 4-1, the peak hourly load of7859.66 MW occurred on July 2010. The hourly wind production curve containing the outputs from four wind farms is shown in Figure 4-2. The generators with their FOR values used for LOLE calculation are listed in Appendix B. The total installed wind capacity in the analysis is 650 MW. The calculated wind capacity value is 163.5 MW as shown in Figure 4-3, which is 25.2% of the installed capacity.
Figure 4-1. Hourly Load Profile in the Entire NV Energy System, 2010
Figure 4-2. Hourly Wind Profile of Four Wind Farms in the Entire NV Energy System, 2010
0 1000 2000 3000 4000 5000 6000 7000 80002000
3000
4000
5000
6000
7000
8000
Hour
NV
E Lo
ad, M
W
0 1000 2000 3000 4000 5000 6000 7000 80000
100
200
300
400
500
600
700
Hour
NV
E W
ind
Prod
uctio
n, M
W

13
Figure 4-3. Wind Generation Capacity Value in the Entire NV Energy System, 2010
163.5 MW

14
5.0 A Simplified Capacity Value Approach
5.1 Development of a Simplified Approach
Usually, the ELCC approach described in Chapter 3 is considered to provide accurate calculations of PV or wind capacity values. This approach requires large amount of data and complicated calculations, and it is difficult to apply in many situations. This section describes the derivation of a simplified approach that approximates the ELCC method, eliminates the need for conventional generation data, and can be performed very quickly. Based on this simplified approach, the diminishing return of renewable generation capacity value can be conveniently explained, as will be discussed in Section 5.2. The ELCC method defines capacity value as the equivalent perfectly reliable generation capacity that, when used to replace PV or wind generation, the system can achieve the same LOLE as with the renewable resources being replaced. Figure 5-1 shows the load duration curve (the horizontal and vertical axes are transposed for the convenience of discussions later on) for the base case without PV, net load in PV Case 5, and the equivalent load to PV Case 5 (shifted left from the base case curve, which has the same LOLE as PV Case 5). The y axis in Figure 5-1 represents the cumulative hours through the entire year when load is less or equal to x. The calculated capacity value for PV in Case 5 is 343 MW. Again, as noted in Section 3.1, the LOLE calculation does not consider balancing requirements caused by the uncertainty and variablity of load and PV generation.
Figure 5-1. Load Duration Curve for PV Case 5 and its PV Capacity Value
The LOLP for load in any particular hour t of the year is the probability of generation capacity in service (Cin service) being less than the demand in hour t (dt):
𝐿𝑂𝐿𝑃(𝑡) = 𝑃𝑡(𝐶𝑖𝑛 𝑠𝑒𝑟𝑣𝑖𝑐𝑒 < 𝑑𝑡) (5.1)
The LOLE for hour t is therefore:
0 1000 2000 3000 4000 5000 60000
1000
2000
3000
4000
5000
6000
7000
8000
9000
x (MW)
Cum
ulat
ive
Hou
rs W
hen
Load
>=
x
Total Load without PVNet Load for PV Case5Equivalent Load to Case5
343 MW
343 MW

15
𝐿𝑂𝐿𝐸(𝑡) = 𝑇 ∗ 𝑃𝑡(𝐶𝑖𝑛 𝑠𝑒𝑟𝑣𝑖𝑐𝑒 < 𝑑𝑡) (5.2)
T is one hour. For convenience, T will be omitted in the equations that follow.The LOLE for the entire year is calculated as:
𝐿𝑂𝐿𝐸𝑦𝑒𝑎𝑟 = ∑ 𝑇 ∗ 𝑃𝑡(𝐶𝑖𝑛 𝑠𝑒𝑟𝑣𝑖𝑐𝑒 < 𝑑𝑡)8760𝑡=1 = ∑ 𝑃𝑡(𝐶𝑖𝑛 𝑠𝑒𝑟𝑣𝑖𝑐𝑒 < 𝑑𝑡)8760
𝑡=1 (5.3)
To be absolutely accurate, we would need to calculate the LOLP for each hour of the year to get the LOLE of the year. However, when the demand is very low compared to installation capacity of the generation fleet, the LOLP in low demand hours is negligible. This can be observed in Figure 5-2, which shows the LOLP of the NV Energy southern system at different demand levels.
Figure 5-2. LOLP of NV Energy Southern System Generation Fleet (probability of in-service capacity
being less than specific demand values)
In Figure 5-2, we can see that, even if we ignore the LOLP in those hours in which demand is less than 3000 MW, the LOLE result will probably not be affected much. Next, we will discuss more quantitatively under which demand levels we can ignore the LOLPs. First, we set the error tolerance of LOLE as 1% of the largest LOLP among all hours of the year, which occurs during the hour with the highest demand:
𝑇𝑜𝑙 = 1100
max�𝐿𝑂𝐿𝑃(𝑡)� = 1100
𝑃(𝐶𝑖𝑛 𝑠𝑒𝑟𝑣𝑖𝑐𝑒 < 𝑑𝑚𝑎𝑥) (5.4)
Comparing Equations (5.3) and (5.4), we can see that:
𝑇𝑜𝑙 ≤ 1100
𝐿𝑂𝐿𝐸𝑦𝑒𝑎𝑟 (5.5)
Second, we define a set of hours (i.e., “Low Demand Hours”) when demand is less than a threshold dth, and dth should satisfy:
0 1000 2000 3000 4000 5000 6000-60
-50
-40
-30
-20
-10
0
demand, MW
Log 10
P(C
in s
ervi
ce <
dem
and)

16
∑ 𝐿𝑂𝐿𝑃(𝑡) =𝑡∈𝐿𝑜𝑤 𝐷𝑒𝑚𝑎𝑛𝑑 𝐻𝑜𝑢𝑟𝑠 ∑ 𝑃(𝐶𝑖𝑛 𝑠𝑒𝑟𝑣𝑖𝑐𝑒 < 𝑑𝑡)𝑡∈𝐿𝑜𝑤 𝐷𝑒𝑚𝑎𝑛𝑑 𝐻𝑜𝑢𝑟𝑠 ≤ 𝑇𝑜𝑙 (5.6)
From Equation (5.6), we can get: ∑ 𝐿𝑂𝐿𝑃(𝑡)𝑡∈𝐿𝑜𝑤 𝐷𝑒𝑚𝑎𝑛𝑑 𝐻𝑜𝑢𝑟𝑠 ≤ ∑ 𝑃(𝐶𝑖𝑛 𝑠𝑒𝑟𝑣𝑖𝑐𝑒 < 𝑑𝑡ℎ)𝑡∈𝐿𝑜𝑤 𝐷𝑒𝑚𝑎𝑛𝑑 𝐻𝑜𝑢𝑟𝑠 = 𝑁 ∗ 𝑃(𝐶𝑖𝑛 𝑠𝑒𝑟𝑣𝑖𝑐𝑒 < 𝑑𝑡ℎ) (5.7)
where N is the number of hours in the “Low Demand Hours” set. By combining Equations (5.5) and (5.6), we can find dth by:
𝑃(𝐶𝑖𝑛 𝑠𝑒𝑟𝑣𝑖𝑐𝑒 < 𝑑𝑡ℎ) ≤ 𝑇𝑜𝑙/𝑁 (5.8)
When calculating the LOLE, we can use Equation (5.9) and ignore the contribution of the LOLP in those hours when demand is lower than dth with an error of less than 1%.
𝐿𝑂𝐿𝐸𝑦𝑒𝑎𝑟 ≈ ∑ 𝑃𝑘(𝐶𝑖𝑛 𝑠𝑒𝑟𝑣𝑖𝑐𝑒 < 𝑑𝑘)𝑑𝑘∈{𝑑𝑡|𝑑𝑡>𝑑𝑡ℎ} (5.9)
On the load duration curve shown in Figure 5-1, define hour tth as the hour with demand dth. The terms tth and dth are indicated on the redraw of the load duration curve in Figure 5-3.
Figure 5-3. Load Duration Curves for the NV Energy Southern System with an Indication of the
Threshold Demand dth for Calculating the LOLE
Define 𝑑𝑡′ as the demand on the load duration curve, and Equation (5.9) can be rewritten as:
𝐿𝑂𝐿𝐸𝑦𝑒𝑎𝑟 ≈ ∑ 𝑃𝑡�𝐶𝑖𝑛 𝑠𝑒𝑟𝑣𝑖𝑐𝑒 < 𝑑𝑡′�𝑡∈[0,𝑡𝑡ℎ] (5.10)
In the NV Energy southern system, the peak load is 5877 MW in year 2007. The LOLP at the peak load hour is:
𝐿𝑂𝐿𝑃(𝑑𝑚𝑎𝑥 = 5877𝑀𝑊) = 𝑃(𝐶𝑖𝑛 𝑠𝑒𝑟𝑣𝑖𝑐𝑒 < 𝑑𝑚𝑎𝑥) = 0.1398 (5.11)
Using Equations (5.4) and (5.8) and the LOLP curve in Figure 5-2, we can determine dth, which is ~4900 MW. According to the load duration curve for no PV case in Figure 5-1, dth corresponds to the
0 1000 2000 3000 4000 5000 60000
1000
2000
3000
4000
5000
6000
7000
8000
9000
x (MW)
Cum
ulat
ive
Hou
rs W
hen
Load
>=
x
Total Load without PVNet Load for PV Case5Equivalent Load to Case5
tth dth
17
lower bound of 2.5% peak load period. In other words, when calculating LOLEyear, we only need to consider the LOLP of those hours in the 2.5% peak load period. With PV in the system, the LOLE calculation uses the net load duration curve (load – PV generation), which is shown as the red dashed line in Figure 5-3:
𝐿𝑂𝐿𝐸𝑦𝑒𝑎𝑟_𝑃𝑉 ≈ ∑ 𝑃𝑡(𝐶𝑖𝑛 𝑠𝑒𝑟𝑣𝑖𝑐𝑒 < 𝑛𝑑𝑡′)𝑡∈[0,𝑡𝑡ℎ] (5.12)
where 𝑛𝑑𝑡′ is the net load on the net load duration curve. When calculating the capacity value of PV (CVPV), we still adopt Equation (5.10), and CVPV should satisfy:
𝐿𝑂𝐿𝐸𝑦𝑒𝑎𝑟_𝑃𝑉 ≈ ∑ 𝑃𝑡(𝐶𝑖𝑛 𝑠𝑒𝑟𝑣𝑖𝑐𝑒 < 𝑑𝑡′ − 𝐶𝑉𝑃𝑉)𝑡∈[0,𝑡𝑡ℎ] (5.13)
which means that with PV in the system, the LOLE is the same as adding a perfectly reliable resource of capacity CVPV. Assume that the LOLP function is linear between dth and dmax, which is approximately true at the upper end of the curve in Figure 5-2. From Equations (5.12) and (5.13), we get:
∑ 𝑃𝑡(𝐶𝑖𝑛 𝑠𝑒𝑟𝑣𝑖𝑐𝑒 < 𝑑𝑡′ − 𝐶𝑉𝑃𝑉)𝑡∈[0,𝑡𝑡ℎ] = ∑ 𝑃𝑡(𝐶𝑖𝑛 𝑠𝑒𝑟𝑣𝑖𝑐𝑒 < 𝑛𝑑𝑡′)𝑡∈[0,𝑡𝑡ℎ]
∑ (𝑑𝑡′ − 𝐶𝑉𝑃𝑉)𝑡∈[0,𝑡𝑡ℎ] = ∑ 𝑛𝑑𝑡′𝑡∈[0,𝑡𝑡ℎ]
𝐶𝑉𝑃𝑉 = 𝑚𝑒𝑎𝑛�∑ (𝑑𝑡′ − 𝑛𝑑𝑡′)𝑡∈[0,𝑡𝑡ℎ] �
= 𝑚𝑒𝑎𝑛�∑ 𝑃𝑉𝑡′𝑡∈[0,𝑡𝑡ℎ] � (5.14)
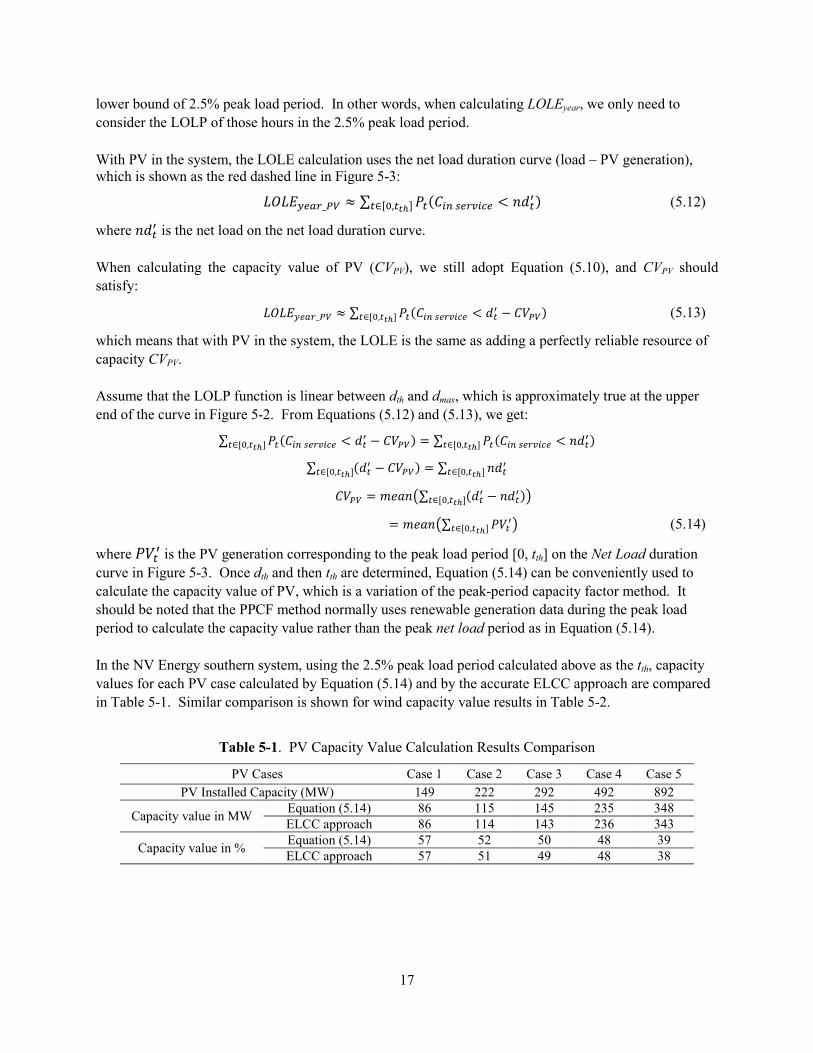
where 𝑃𝑉𝑡′ is the PV generation corresponding to the peak load period [0, tth] on the Net Load duration curve in Figure 5-3. Once dth and then tth are determined, Equation (5.14) can be conveniently used to calculate the capacity value of PV, which is a variation of the peak-period capacity factor method. It should be noted that the PPCF method normally uses renewable generation data during the peak load period to calculate the capacity value rather than the peak net load period as in Equation (5.14). In the NV Energy southern system, using the 2.5% peak load period calculated above as the tth, capacity values for each PV case calculated by Equation (5.14) and by the accurate ELCC approach are compared in Table 5-1. Similar comparison is shown for wind capacity value results in Table 5-2.
Table 5-1. PV Capacity Value Calculation Results Comparison
PV Cases Case 1 Case 2 Case 3 Case 4 Case 5 PV Installed Capacity (MW) 149 222 292 492 892
Capacity value in MW Equation (5.14) 86 115 145 235 348 ELCC approach 86 114 143 236 343
Capacity value in % Equation (5.14) 57 52 50 48 39 ELCC approach 57 51 49 48 38

18
Table 5-2. Wind Capacity Value Calculation Results Comparison
Wind Installed Capacity (MW) 650
Capacity value in MW Equation (5.14) 165 ELCC approach 164
Capacity value in % Equation (5.14) 25 ELCC approach 25
Table 5-1 and Table 5-2 show close matches between the results from the simplified approach and the accurate ELCC approach. When generator data such as forced outage rate, derating, and maintenance schedules are not available, or a software program following the accurate calculation of LOLE is too time consuming, Equation (5.14) can be used to calculate the capacity value of renewable resources. The discussion in this section establishes the connection between the peak-period capacity factor method and the effective load carrying capability method. When the peak load period [0, tth] is carefully selected, it shows that the PPCF method provides a good approximation of ELCC. However, we need to recognize the assumption is that the LOLP function is linear between dth and dmax (load corresponding to tth and 0 on the load duration curve). If tth is too large, this assumption will not be valid; on the other hand, if tth is too small, LOLPs neglected in Equation (5.9) will be large. For a particular system, Equations (5.4) to (5.8) can be used to find the appropriate value of tth.
5.2 Capacity Value Diminishing Return Explained
We observed from the results in Chapter 3 and also in Table 5-1 that the capacity values of PV generation in the NV Energy southern system decrease from 57% at 149 MW to 38% at 892 MW. This diminishing capacity benefit can be conveniently explained using the simplified capacity value approach developed in Section 5.1.
Figure 5-4 shows the distribution of 2.5% peak load hours in Case 1 and Case 5, in comparison with the No-PV case. Because of the significant amount of PV generation in Case 5, the center of the peak load period shifts nearly two hours from 17:00 to 19:00, while there is almost no change in the peak load period in Case 1. Consequently, the capacity factor of PV generation during the peak period decreases substantially in Case 5 when compared to Case 1. This significant change is shown in Figure 5-5. In Figure 5-5, the “No PV” data set uses load duration curves to find the 2.5% peak load hours and displays the distribution of PV capacity factor in each PV case in these hours. The “With PV” data set uses net load duration curve to find the same percentage of peak hours.
In summary, the peak period of net load shifts toward those hours when PV generation has lower capacity factors, as PV penetration increases. In Section 5.1, we showed that the PV output in these peak (net) load hours matters the most and approximately determine the capacity value, according to Equation (5.14). Therefore, the PV capacity value tends to decrease in percentage as its installation capacity increases. In principle, this phenomenon and explanation applies to all variable generation sources including wind.

19
(a) Case 1 (b) Case 5
Figure 5-4. Distribution of Peak Load Hours at Different PV Penetration Levels
(a) Case 1 (b) Case 5
Figure 5-5. Distribution of PV Capacity Factor during Peak Load Hours
1 2 3 4 5 6 7 8 9 10 11 12 13 14 15 16 17 18 19 20 21 22 23 240
5
10
15
20
25
30
35
40
45
50Distribution of 2.5% Peak Load Hours
Hour of the Day
No.
of H
ours
No PVWith PV
1 2 3 4 5 6 7 8 9 10 11 12 13 14 15 16 17 18 19 20 21 22 23 240
5
10
15
20
25
30
35
40
45
50Distribution of 2.5% Peak Load Hours
Hour of the Day
No.
of H
ours
No PVWith PV
0 0.2 0.4 0.6 0.8 10
5
10
15
20
25
30
35
40
45
50Distribution of Solar Capacity Factor During 2.5% Peak Period
Capacity Factor
No.
of H
ours
No PVWith PV
0 0.2 0.4 0.6 0.8 10
5
10
15
20
25
30
35
40
45
50Distribution of Solar Capacity Factor During 2.5% Peak Period
Capacity Factor
No.
of H
ours
No PVWith PV

20
6.0 Conclusions
In this report, several approaches are applied for computing the capacity values of PV and wind generation in the NV Energy system, including the PPCF and ELCC methods and a new simplified method. Several study cases for the NV Energy southern system were analyzed to investigate the capacity values of PV generation under different penetration levels. The ELCC method was tested on the wind generation data for the entire NV Energy system. Our simplified capacity value approach does not require generation fleet data and provides the theoretical basis for a quick check on PV and wind generation capacity value results. The diminishing return of capacity benefit as renewable generation increases is conveniently explained using our simplified approach.

21
7.0 References
[1] T Hoff, R Perez, JP Ross, and M Taylor. 2008. “Photovoltaic Capacity Value Methods.” Available at http://www.solarelectricpower.org/media/84207/sepa%20pv%20capacity.pdf
[2] J Rogers and K Porter. 2012. “Summary of Time Period-Based and Other Approximation Methods for Determining the Capacity Value of Wind and Solar in the United States.” Available at http://www.nrel.gov/docs/fy12osti/54338.pdf
[3] Milligan KM, CJ Dent, B Hasche, C D’Annunzio, K Dragoon, H Holttinen, N Samaan, L Soder, and M O’Malley. 2011. “Capacity Value of Wind Power.” IEEE Transactions on Power Systems 26(2):564-572.
[4] California Independent Service Operator (CAISO). 2009. “Decision Adopting Local Procurement Obligations for 2010 and Further Refining the Resource Adequacy Program.” Available at http://docs.cpuc.ca.gov/WORD_PDF/FINAL_DECISION/102755.PDF

22
Appendix A Table A.1. Generator List in the NV Energy Southern System, 2007
No. Generator Name Capacity, MW FOR 1 REID GDR-1 100 0.12 2 REID GDR-2 100 0.12 3 REID GDR-3 100 0.12 4 REID GDR-4 24 0.09 5 NAVAJO-1 85 0.03 6 NAVAJO-2 85 0.03 7 NAVAJO-3 85 0.03 8 Silverhawk 2x1 599 0.01 9 Lenzie 1_2x1 601 0.02
10 Lenzie 2_2x1 601 0.02 11 Higgins 2x1 600 0.01 12 Harry Allen 2x1 524 0.03 13 CLARK-9 250 0.04 14 CLARK-10 57 0.03 15 ALLEN CT-3 84 0.11 16 ALLEN CT-4 84 0.11 17 SUNRISE-2 81 0.0449 18 SUNPEAK-3 78 0.05 19 SUNPEAK-4 78 0.043 20 SUNPEAK-5 78 0.07 21 CLARK-4 63 0.25 22 CLARK-11 57 0.05 23 CLARK-12 57 0.05 24 CLARK-13 57 0.05 25 CLARK-14 57 0.05 26 CLARK-15 57 0.05 27 CLARK-16 57 0.05 28 CLARK-17 57 0.05 29 CLARK-18 57 0.05 30 CLARK-19 57 0.05 31 CLARK-20 57 0.05 32 CLARK-21 57 0.05 33 CLARK-22 57 0.05 34 SAGUARO-1 90 0.055 35 NCA 1-1 85 0.11 36 NCA 2-1 85 0.11 37 LvCogen-1 50 0.04 38 LVC-1 118 0.05 39 LVC-2 118 0.05 40 GRIF7x24-1 570 0.03 41 RG4CDWR-4 233 0.09

23
Appendix B
Table B.1. Generator List with FOR Values for the Entire NV Energy System, 2010
No. Generator Name Capacity, MW FOR 1 CLARK MT-3 72 0.06 2 CLARK MT-4 72 0.04 3 PINON CC-1 (80 MW CT +30 M steamer) 108 0.03 4 TRACY CC 541 0.05 5 TRACY-1 53 0.01 6 TRACY-2 83 0.01 7 TRACY-3 108 0.03 8 CLARK-10 57 0.03 9 CLARK-11 57 0.05 10 CLARK-12 57 0.05 11 CLARK-13 57 0.05 12 CLARK-14 57 0.05 13 CLARK-15 57 0.05 14 CLARK-16 57 0.05 15 CLARK-17 57 0.05 16 CLARK-18 57 0.05 17 CLARK-19 57 0.05 18 CLARK-20 57 0.05 19 CLARK-21 57 0.05 20 CLARK-22 57 0.05 21 CLARK-4 63 0.25 22 CLARK-9 250 0.04 23 FT CH-1 113 0.02 24 FT CH-2 113 0.05 25 ALLEN CT-3 84 0.11 26 ALLEN CT-4 84 0.11 27 HA_2x1-1 524 0.03 28 HIG_2x1-1 600 0.01 29 Len1_2x1-1 601 0.02 30 Len2_2x1-2 601 0.02 31 Navajo-1 85 0.03 32 Navajo-2 85 0.03 33 Navajo-3 85 0.03 34 REID GDR-1 100 0.12 35 REID GDR-2 100 0.12 36 REID GDR-3 100 0.12 37 REID GDR-4&5 257 0.09 38 SHW1_2x1-1 599 0.01 39 SUNPEAK-3 78 0.05 40 SUNPEAK-4 78 0.043 41 SUNPEAK-5 78 0.07 42 VALMY-1 127 0.06

24
No. Generator Name Capacity, MW FOR 43 VALMY-2 134 0.06 44 Beowawe 17.7 0.01 45 Brady 24 0.0076 46 Desert Peak 2 25 0.01 47 Faulkner 1 49.5 0.01 48 Galena 2 13 0.01 49 Galena 3 26.5 0.01 50 Homestretch 2.1 0.0076 51 Jersey Valley 22.5 0.01 52 Richard Burdette 26 0.01 53 Salt Wells 23.6 0.01 54 San Emidio (Amor 2) 3.8 0.01 55 Soda Lake I & II 23.1 0.01 56 Steamboat Hills 14.6 0.01 57 Steamboat IA 2 0.01 58 Steamboat II 13.4 0.01 59 Steamboat III 13.4 0.01 60 Stillwater 47.2 0.01 61 LVC-1 118 0.05 62 LVC-2 118 0.05 63 LvCogen-1(older unit) 50 0.04 64 RG4CDWR-4 233 0.09 65 TOLL15_1-1 525 0.01 66 NCA 1-1 85 0.11 67 NCA 2-1 85 0.11 68 GRIF7x24 570 0.03 69 SAGUARO-1 90 0.09 70 NMTblk12-1 168 0.06 71 NMTblk3-1 41 0.06 72 WINN GT-1 17 0.03

Related Documents


