Capacity planning

Welcome message from author
This document is posted to help you gain knowledge. Please leave a comment to let me know what you think about it! Share it to your friends and learn new things together.
Transcript
Capacity planning
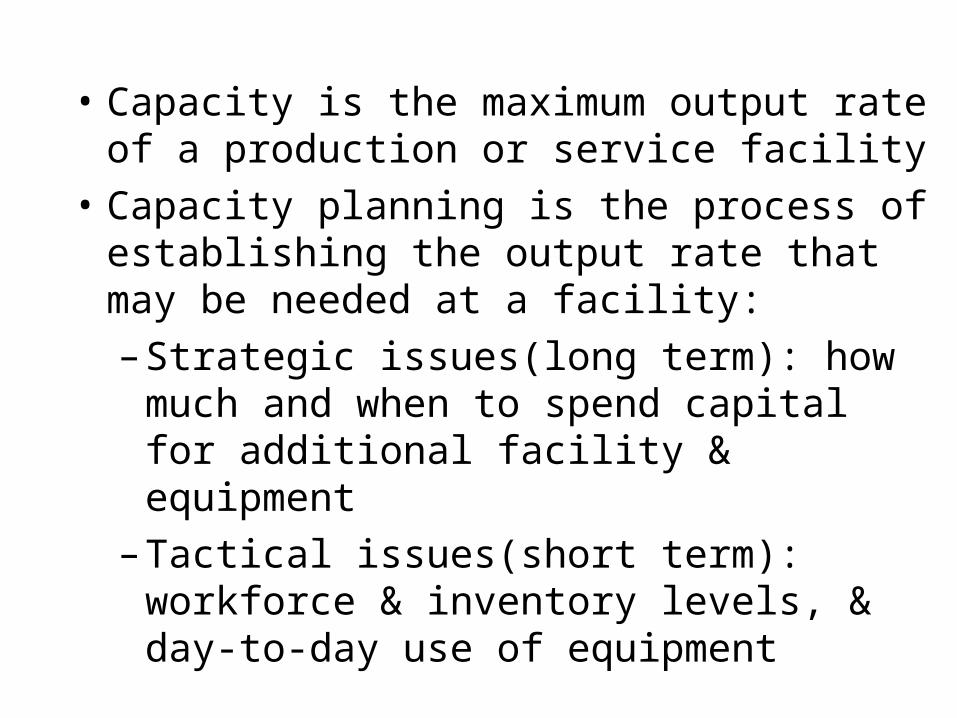
• Capacity is the maximum output rate of a production or service facility
• Capacity planning is the process of establishing the output rate that may be needed at a facility:– Strategic issues(long term): how much and
when to spend capital for additional facility & equipment
– Tactical issues(short term): workforce & inventory levels, & day-to-day use of equipment
Measuring Capacity Examples
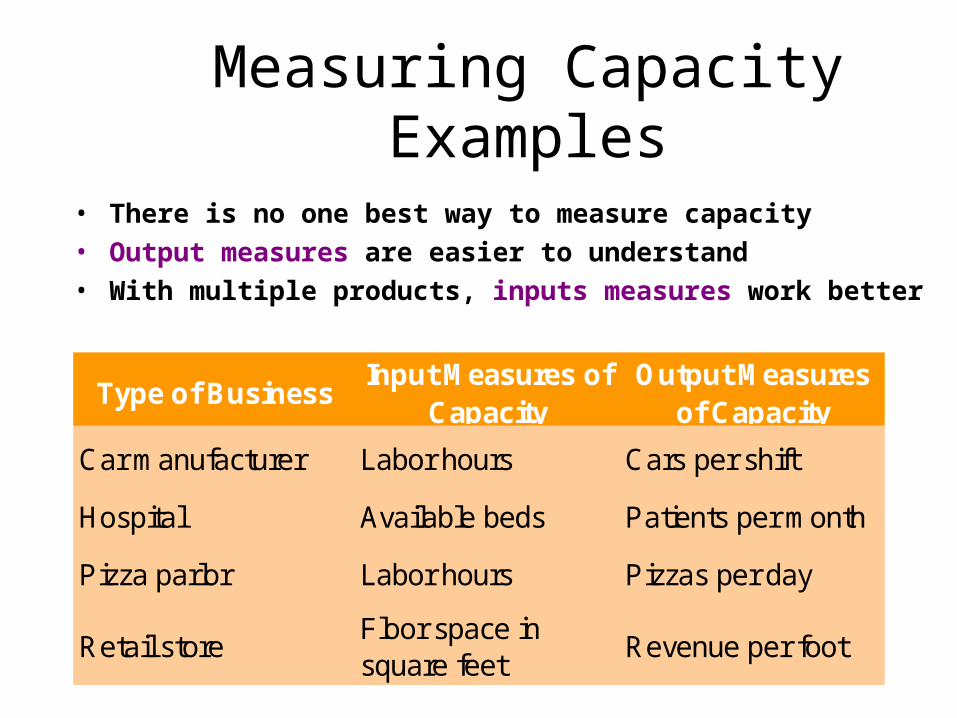
• There is no one best way to measure capacity• Output measures are easier to understand • With multiple products, inputs measures work better
Type of BusinessInput Measures of
CapacityOutput Measures
of Capacity
Car manufacturer Labor hours Cars per shift
Hospital Available beds Patients per month
Pizza parlor Labor hours Pizzas per day
Retail storeFloor space in square feet
Revenue per foot
Capacity Information Needed
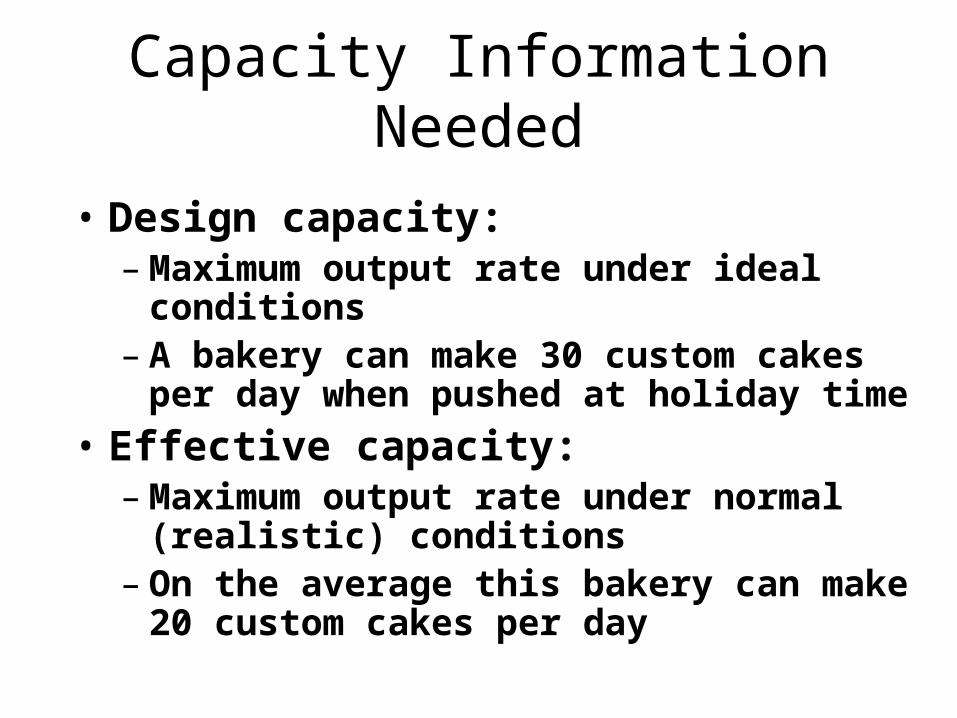
• Design capacity:– Maximum output rate under ideal conditions– A bakery can make 30 custom cakes per day when
pushed at holiday time• Effective capacity:
– Maximum output rate under normal (realistic) conditions
– On the average this bakery can make 20 custom cakes per day

Calculating Capacity Utilization
• Measures how much of the available capacity is actually being used:
– Measures effectiveness– Use either effective or design capacity in denominator
100%capacity
rateoutput actualnUtilizatio
Example of Capacity Utilization
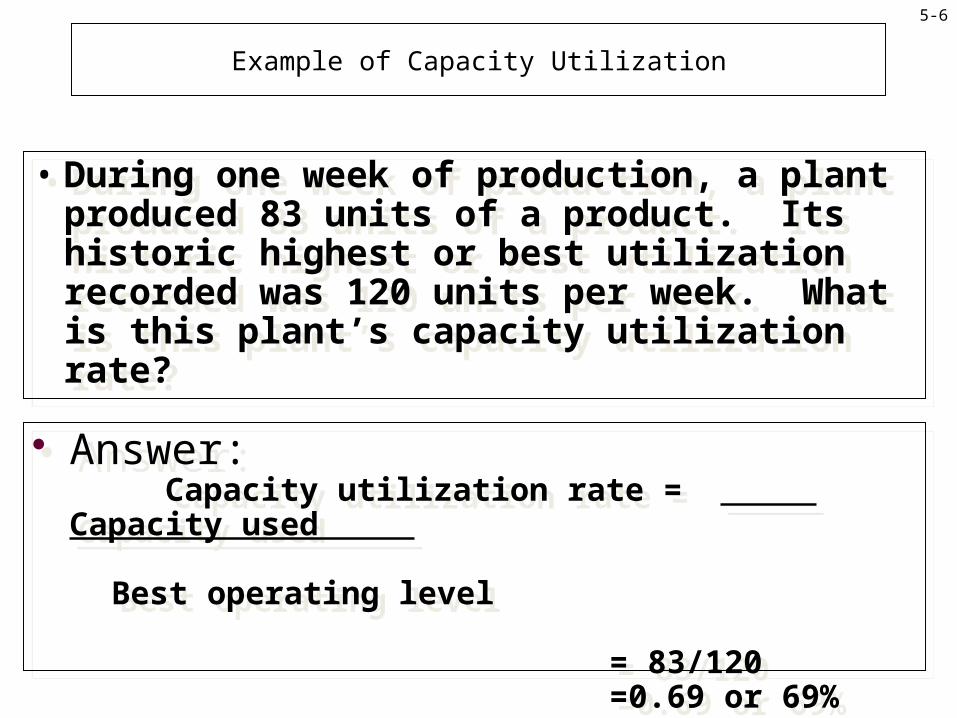
• During one week of production, a plant produced 83 units of a product. Its historic highest or best utilization recorded was 120 units per week. What is this plant’s capacity utilization rate?
• During one week of production, a plant produced 83 units of a product. Its historic highest or best utilization recorded was 120 units per week. What is this plant’s capacity utilization rate?
Answer: Capacity utilization rate = Capacity
used Best
operating level = 83/120 =0.69 or 69%
Answer: Capacity utilization rate = Capacity
used Best
operating level = 83/120 =0.69 or 69%
5-6
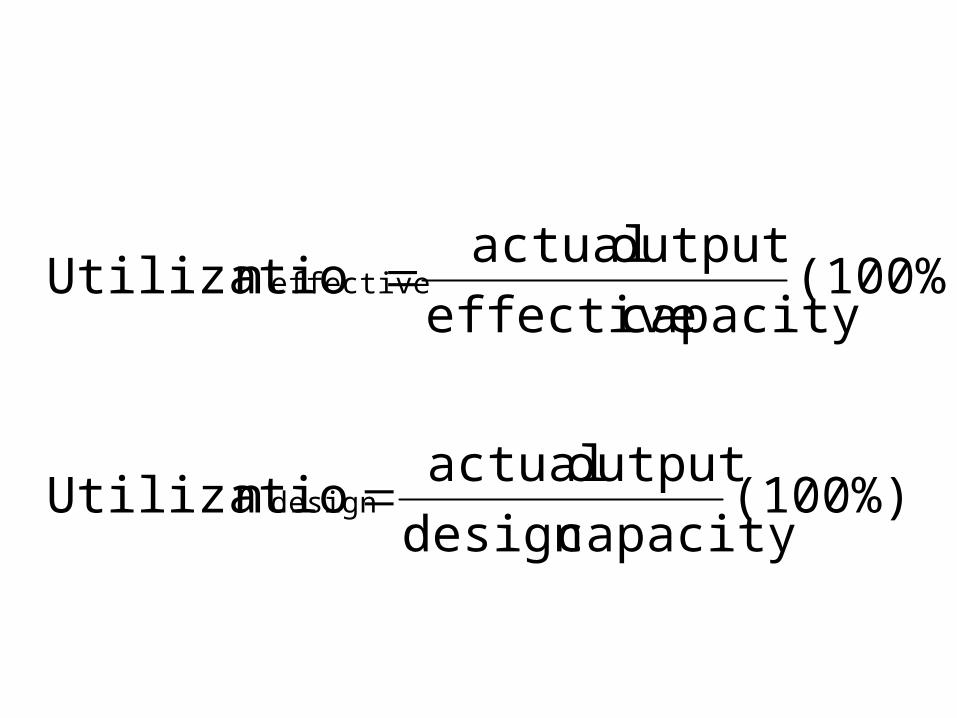
(100%)capacitydesign
output actualn Utilizatio
(100%)capacity effective
output actualn Utilizatio
design
effective
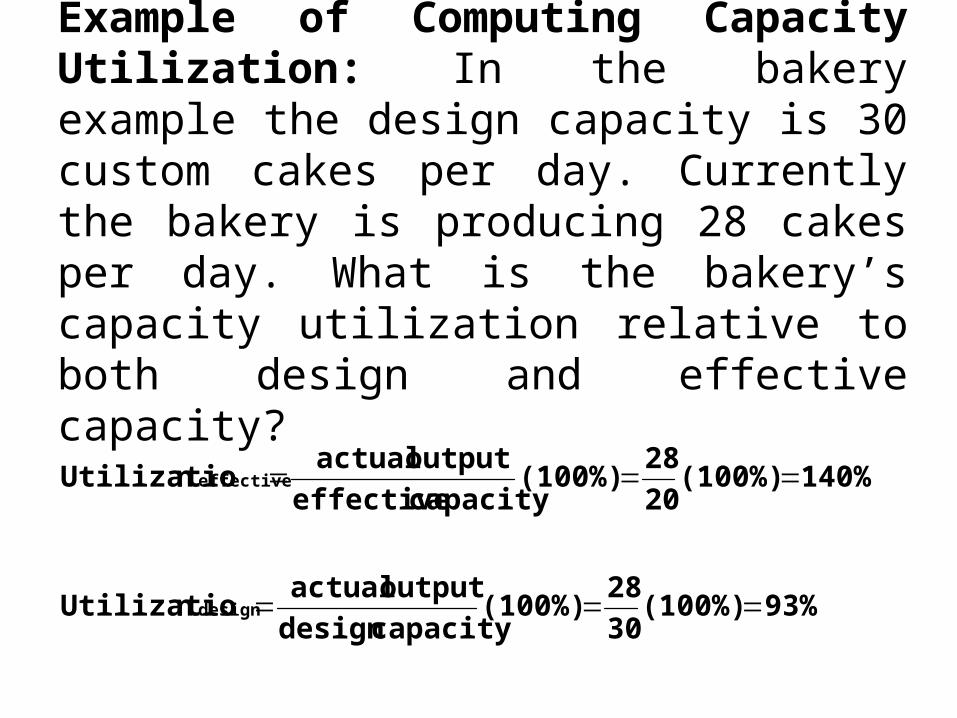
Example of Computing Capacity Utilization: In the bakery example the design capacity is 30 custom cakes per day. Currently the bakery is producing 28 cakes per day. What is the bakery’s capacity utilization relative to both design and effective capacity?
93%(100%)30
28(100%)
capacity design
output actual nUtilizatio
140%(100%)20
28(100%)
capacity effective
output actual nUtilizatio
design
effective

Example• If operated around the clock under ideal
conditions, the fabrication department of an engine manufacturer can make 100 engines per day. Management believes that a maximum output rate of only 45 engines per day can be sustained economical over a long period of time. Currently, the department is producing an average of 50 engines per day. What is the utilization of the department relative to peak capacity? Effective capacity?

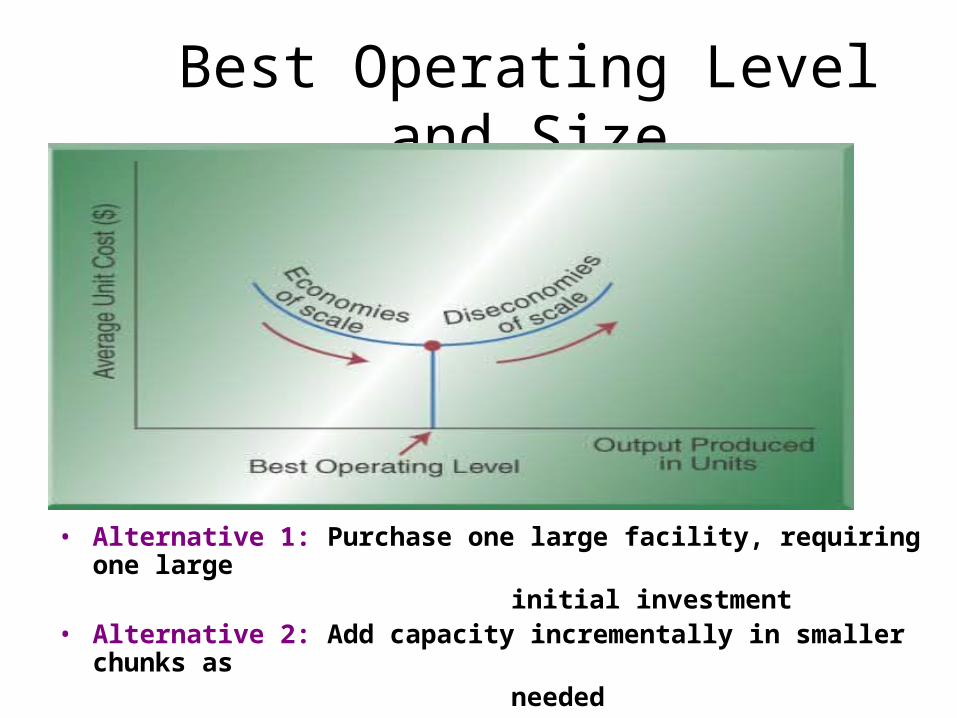
How Much Capacity Is Best?• The Best Operating Level is the output that results in
the lowest average unit cost• Economies of Scale:
– Where the cost per unit of output drops as volume of output increases
– Spread the fixed costs of buildings & equipment over multiple units, allow bulk purchasing & handling of material
• Diseconomies of Scale:– Where the cost per unit rises as volume increases– Often caused by congestion (overwhelming the process
with too much work-in-process) and scheduling complexity
Best Operating Level and Size
• Alternative 1: Purchase one large facility, requiring one large initial investment• Alternative 2: Add capacity incrementally in smaller chunks as needed

Economies & Diseconomies of Scale
100-unitplant
200-unitplant 300-unit
plant
400-unitplant
Volume
Averageunit costof output
Economies of Scale and the Learning Curve working
Economies of Scale and the Learning Curve working
Diseconomies of Scale start working
Diseconomies of Scale start working
5-12

Capacity strategies
• Sizing capacity cushions • Timing and sizing expansion• Operating decisions
Capacity cushion
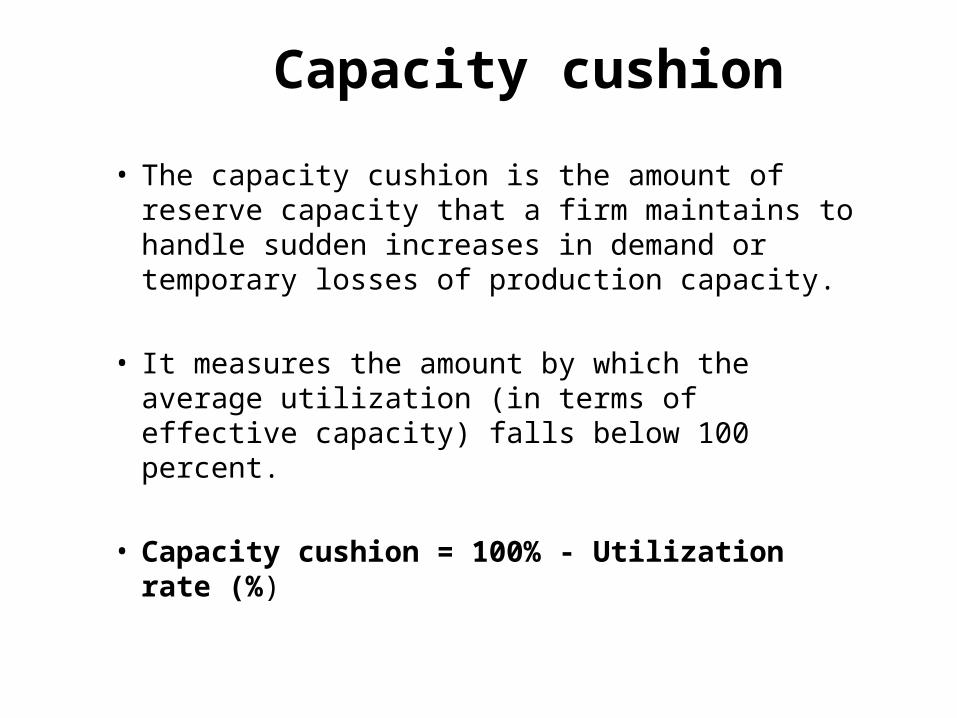
• The capacity cushion is the amount of reserve
capacity that a firm maintains to handle sudden increases in demand or temporary losses of production capacity.
• It measures the amount by which the average utilization (in terms of effective capacity) falls below 100 percent.
• Capacity cushion = 100% - Utilization rate (%)
When to expand and by how much?
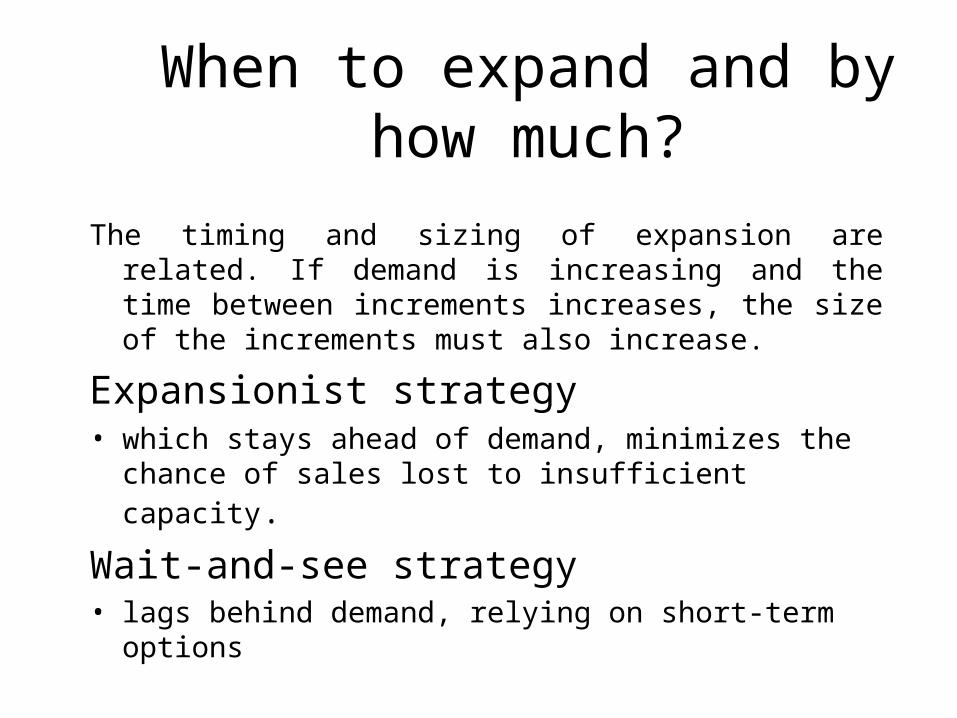
The timing and sizing of expansion are related. If demand is increasing and the time between increments increases, the size of the increments must also increase.
Expansionist strategy• which stays ahead of demand, minimizes the chance of
sales lost to insufficient capacity.
Wait-and-see strategy• lags behind demand, relying on short-term options
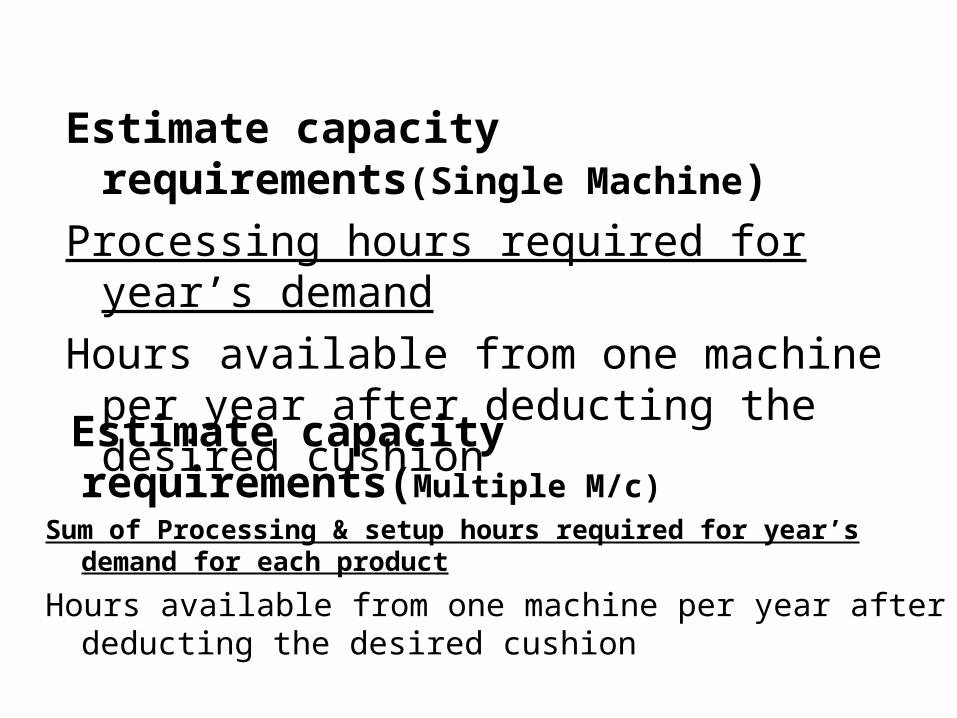
Estimate capacity requirements(Single Machine) Processing hours required for year’s demandHours available from one machine per year after
deducting the desired cushion
Estimate capacity requirements(Multiple M/c) Sum of Processing & setup hours required for year’s demand for each product
Hours available from one machine per year after deducting the desired cushion
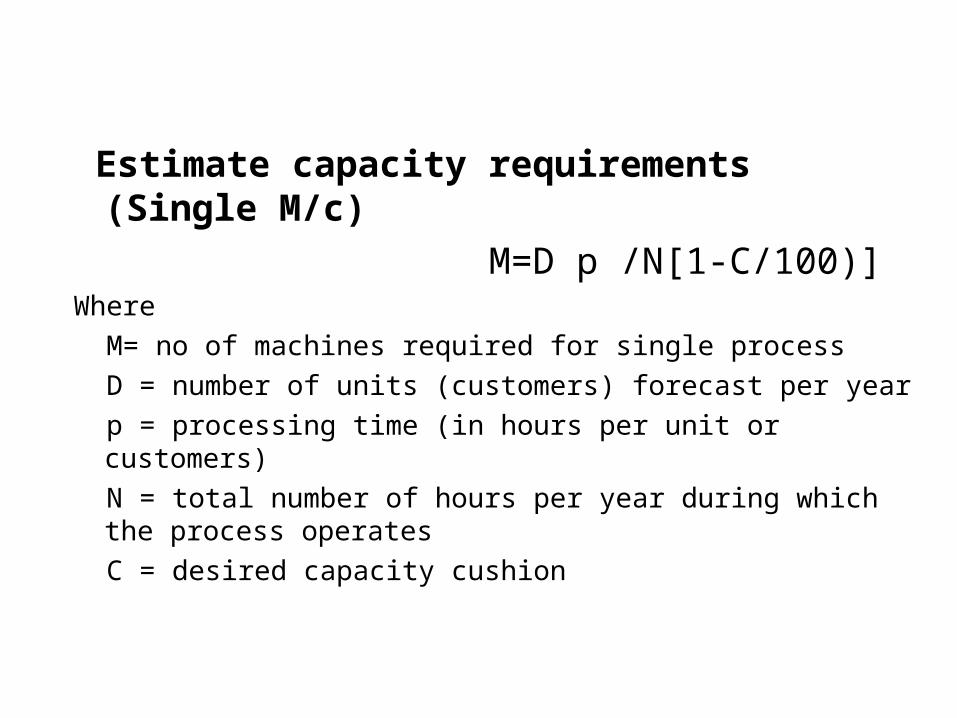
Estimate capacity requirements (Single M/c) M=D p /N[1-C/100)]Where M= no of machines required for single process D = number of units (customers) forecast per year p = processing time (in hours per unit or customers) N = total number of hours per year during which the process
operates C = desired capacity cushion
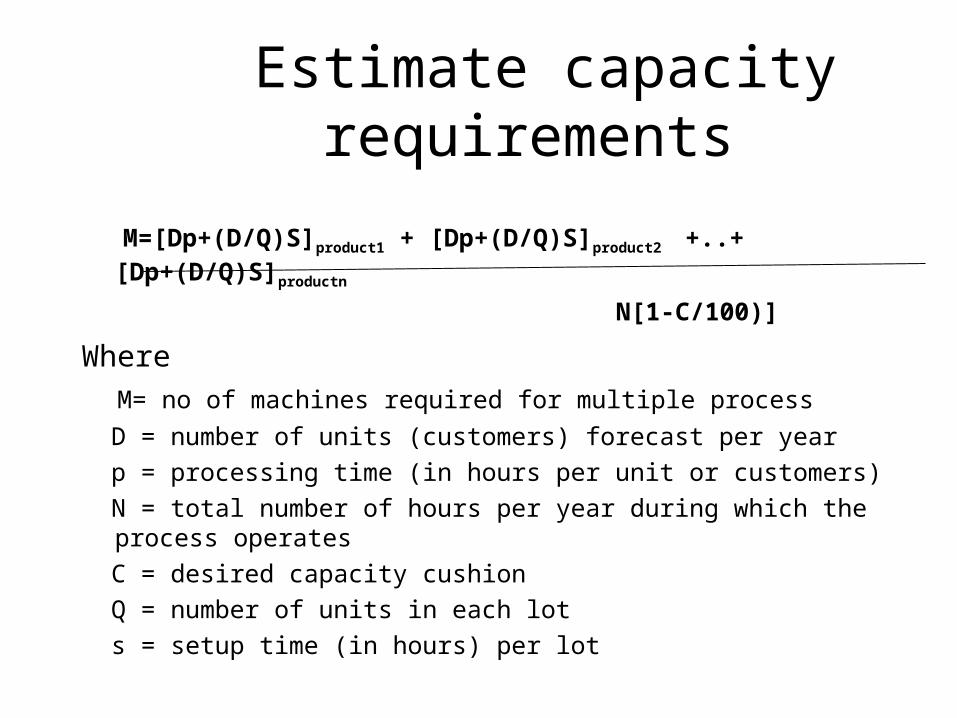
Estimate capacity requirements
M=[Dp+(D/Q)S]product1 + [Dp+(D/Q)S]product2 +..+ [Dp+(D/Q)S]productn
N[1-C/100)]
Where M= no of machines required for multiple process D = number of units (customers) forecast per year p = processing time (in hours per unit or customers) N = total number of hours per year during which the process operates C = desired capacity cushion Q = number of units in each lot s = setup time (in hours) per lot
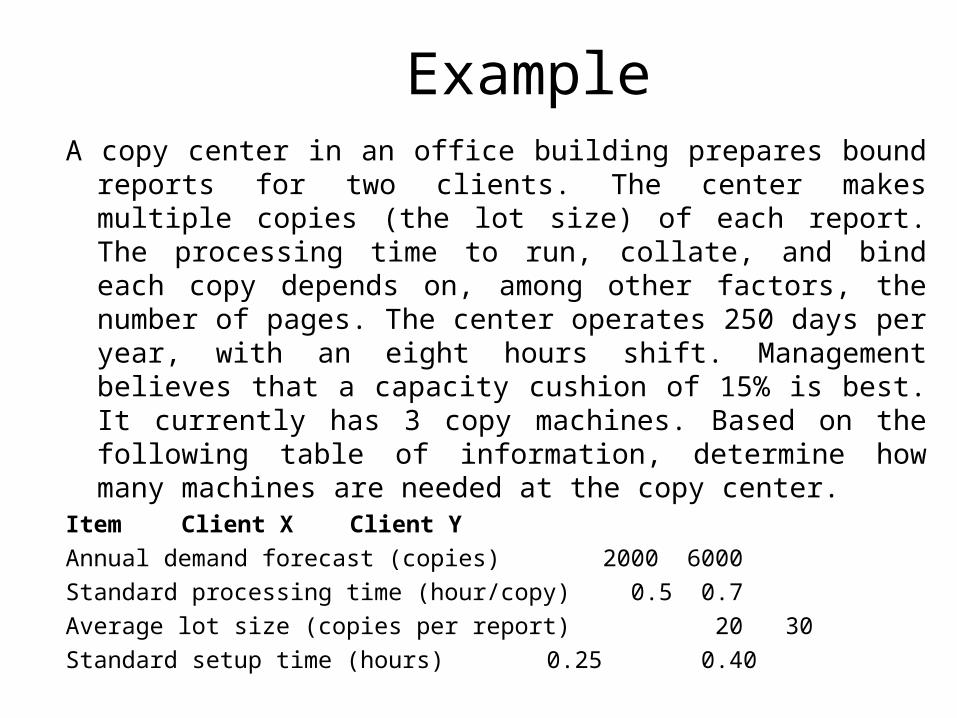
ExampleA copy center in an office building prepares bound reports for two
clients. The center makes multiple copies (the lot size) of each report. The processing time to run, collate, and bind each copy depends on, among other factors, the number of pages. The center operates 250 days per year, with an eight hours shift. Management believes that a capacity cushion of 15% is best. It currently has 3 copy machines. Based on the following table of information, determine how many machines are needed at the copy center.
Item Client X Client Y Annual demand forecast (copies) 2000 6000 Standard processing time (hour/copy) 0.5 0.7 Average lot size (copies per report) 20 30 Standard setup time (hours) 0.25 0.40
Identify Gaps • A capacity gap is any difference (positive or negative)
between projected demand and current capacity. Identifying gaps requires use of the correct capacity measure. Complications arise when multiple operations and several resource inputs are involved.
• In 1970 when airline executive states fly more seats to get more passengers many airlines responded by buying more jumbo jets, but competitors flying smaller planes were more successful. The correct measure of capacity was the number of departments rather than the number of seats.

Step 2: Identify Gaps A restaurant is experiencing a boom in business. The owner expects to serve a total of 80,000 meals this year. Although the kitchen is operating at 100 percent capacity, the dining room can handle a total of 1,05,000 dinners per year. Forecasted demand for the next five years is as follows: • Year 1: 90,000 meals • Year 2: 1,00,000 meals • Year 3: 1,10,000 meals • Year 4: 1,20,000 meals • Year 5: 1,30,000 meals What are the capacity gaps in the restaurant’s kitchen and dining room through year 5?

Develop alternatives
The next step is to develop alternative plans to cope with projected gaps.• One alternative is base case, which is do nothing and
simply lose orders from any demand that exceeds current capacity.
• Other alternatives are various timing and sizing options for adding new capacity, including the expansionist and wait-and-see strategies.
Tools for Capacity Planning• Waiting Line Model• Simulation• Decision Tree
Example
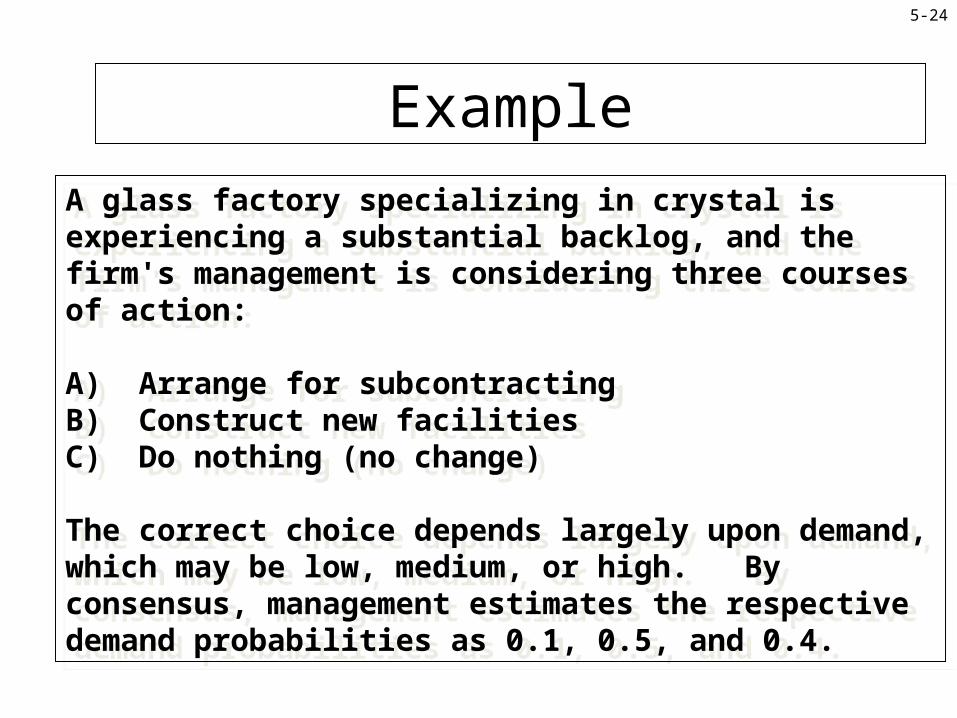
A glass factory specializing in crystal is experiencing a substantial backlog, and the firm's management is considering three courses of action:
A) Arrange for subcontractingB) Construct new facilitiesC) Do nothing (no change)
The correct choice depends largely upon demand, which may be low, medium, or high. By consensus, management estimates the respective demand probabilities as 0.1, 0.5, and 0.4.
5-24
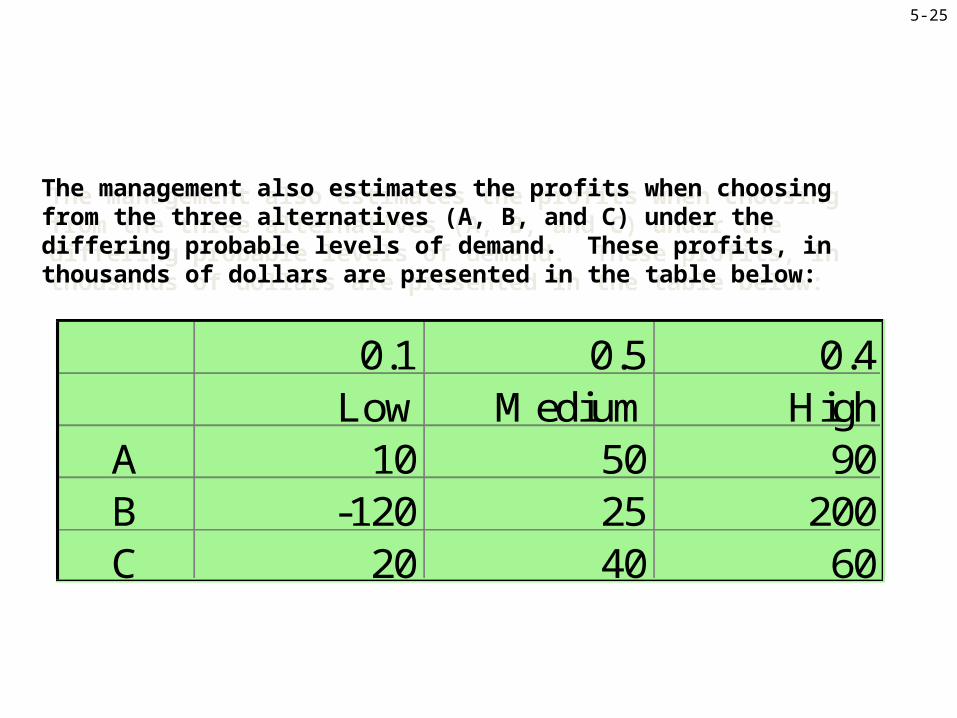
0.1 0.5 0.4Low Medium High
A 10 50 90B -120 25 200C 20 40 60
The management also estimates the profits when choosing from the three alternatives (A, B, and C) under the differing probable levels of demand. These profits, in thousands of dollars are presented in the table below:
The management also estimates the profits when choosing from the three alternatives (A, B, and C) under the differing probable levels of demand. These profits, in thousands of dollars are presented in the table below:
5-25

Example: Good Eats CaféGood Eats Café is about to build a new restaurant. An architect has developed three building designs, each with a different seating capacity. Good Eats estimates that the average number of customers per hour will be 80, 100, or 120 with respective probabilities of 0.4, 0.2, and 0.4. The payoff table showing the profits for the three designs is on the next slide.
• Payoff Table
Average Number of Customers Per Hour c1 = 80 c2 = 100 c3 = 120
Design A $10,000 $15,000 $14,000 Design B $ 8,000 $18,000 $12,000 Design C $ 6,000 $16,000 $21,000
• Payoff Table
Average Number of Customers Per Hour c1 = 80 c2 = 100 c3 = 120
Design A $10,000 $15,000 $14,000 Design B $ 8,000 $18,000 $12,000 Design C $ 6,000 $16,000 $21,000
Related Documents