CAPACITY PLANNING BCM524 – CONSTRUCTION SYSTEM ANALYSIS

Welcome message from author
This document is posted to help you gain knowledge. Please leave a comment to let me know what you think about it! Share it to your friends and learn new things together.
Transcript
CAPACITY PLANNING
BCM524 – CONSTRUCTION SYSTEM ANALYSIS

Capacity Planning
Capacity is the ability to hold, receive, store or accommodate raw materials, finished products, customers, etc.
Capacity is the upper limit or ceiling on the load that an operating unit can handle.
Capacity refers to a system’s potential for producing goods or delivering services over a specified time interval
The basic questions in capacity handling are: What kind of capacity is needed?
How much is needed?
When is it needed?
12/11/20142

Strategic Capacity Planning
12/11/20143
Strategic Capacity Planning is an approach for
determining the overall capacity level of capital
intensive resources, including facilities, equipment
and overall labour force size.
Capacity used is the rate of output actually
achieved
The best operating level is nominally the capacity of
which the process was designed

Process Selection and System Design
Forecasting
Product and
Service Design
Technological
Change
Capacity
Planning
Process
Selection
Facilities and
Equipment
Layout
Work
Design
12/11/20144

1. Impacts ability to meet future demands
2. Affects operating costs
3. Major determinant of initial costs
4. Involves long-term commitment
5. Affects competitiveness
6. Affects ease of management
7. Globalization adds complexity
8. Impacts long range planning
Importance of Capacity Decisions
12/11/20145 Ani Maslina Saleh / BCM542 / AP246

Capacity Decisions
Design capacity
Maximum capability to produce:
a. Rated capacity is theoretical
b. Effective capacity includes efficiency and utilization
maximum output rate or service capacity an operation,
process, or facility is designed for
Effective capacity
Design capacity minus allowances such as personal time,
maintenance, and scrap
Actual output
rate of output actually achieved--cannot
exceed effective capacity.
12/11/20146
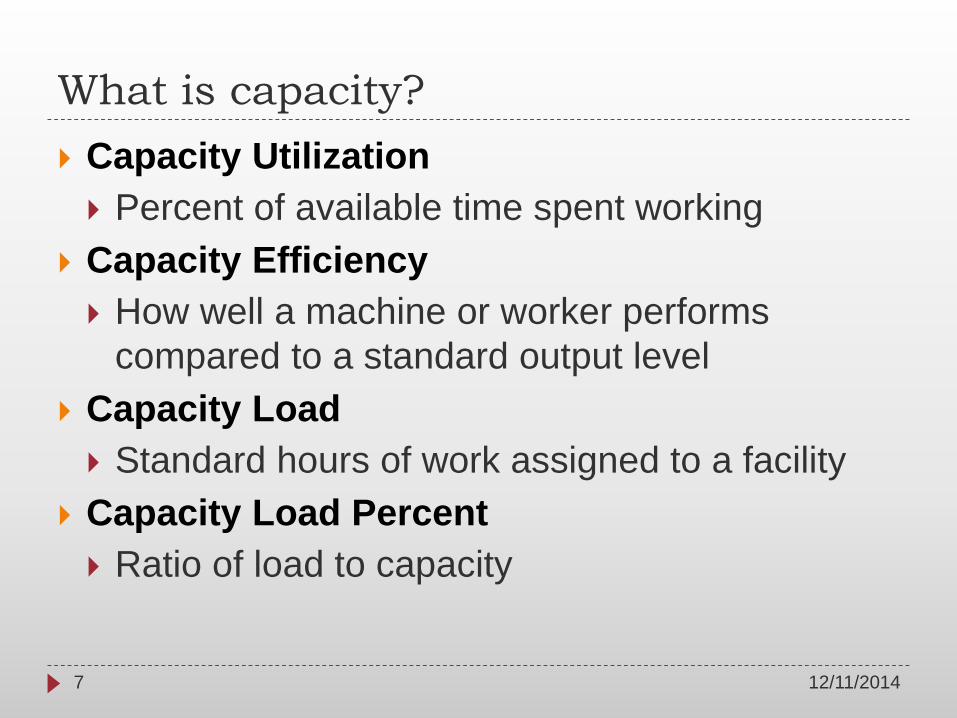
What is capacity?
12/11/20147
Capacity Utilization
Percent of available time spent working
Capacity Efficiency
How well a machine or worker performs
compared to a standard output level
Capacity Load
Standard hours of work assigned to a facility
Capacity Load Percent
Ratio of load to capacity

Capacity Requirement
12/11/20148
Dimension of
Demand
Effect on capacity
requirement
Quantity How much capacity is
needed?
Timing When should capacity be
available?
Quality What kind of capacity is
needed?
Location Where should capacity be
installed?

Capacity Planning
12/11/20149
Capacity is the maximum output rate of a
production or service facility
Capacity planning is the process of establishing
the output rate that may be needed at a facility :
Capacity is usually purchased in ‘chunks’
Strategic issues : how much and when to
spend capital additional facility & equipment
Tactical issues : workforce & inventory levels,
and day-to-day use of equipment
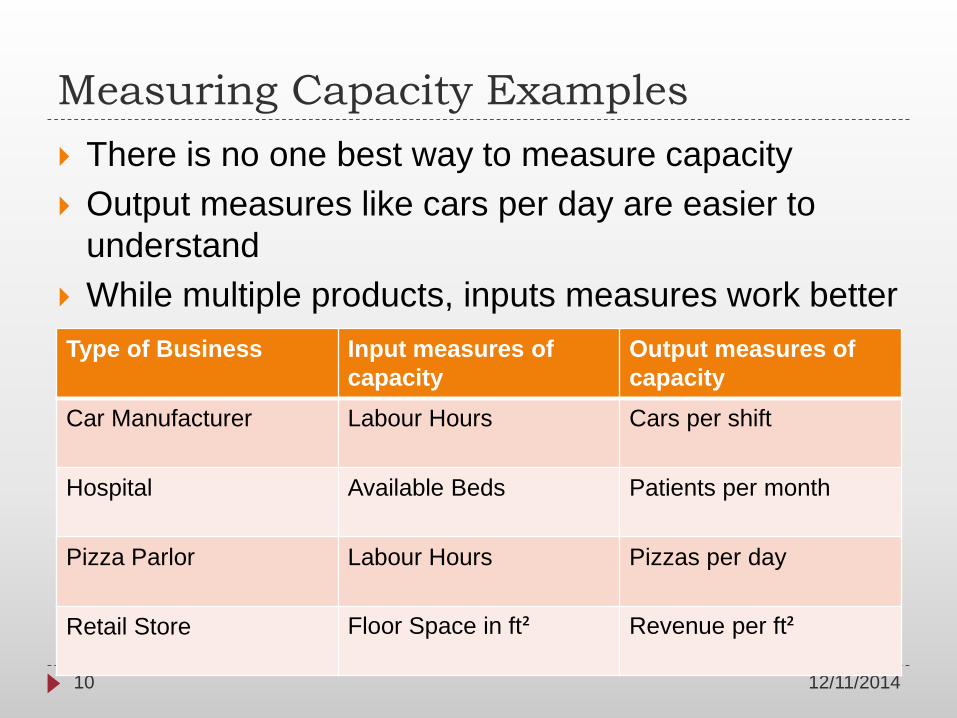
Measuring Capacity Examples
12/11/201410
There is no one best way to measure capacity
Output measures like cars per day are easier to
understand
While multiple products, inputs measures work better
Type of Business Input measures of
capacity
Output measures of
capacity
Car Manufacturer Labour Hours Cars per shift
Hospital Available Beds Patients per month
Pizza Parlor Labour Hours Pizzas per day
Retail Store Floor Space in ft² Revenue per ft²

Efficiency and Utilization
Actual outputCapacity Efficiency =
Effective capacity
Actual outputCapacity Utilization =
Design capacity
Both measures expressed as percentages
12/11/201411 Ani Maslina Saleh / BCM542 / AP246
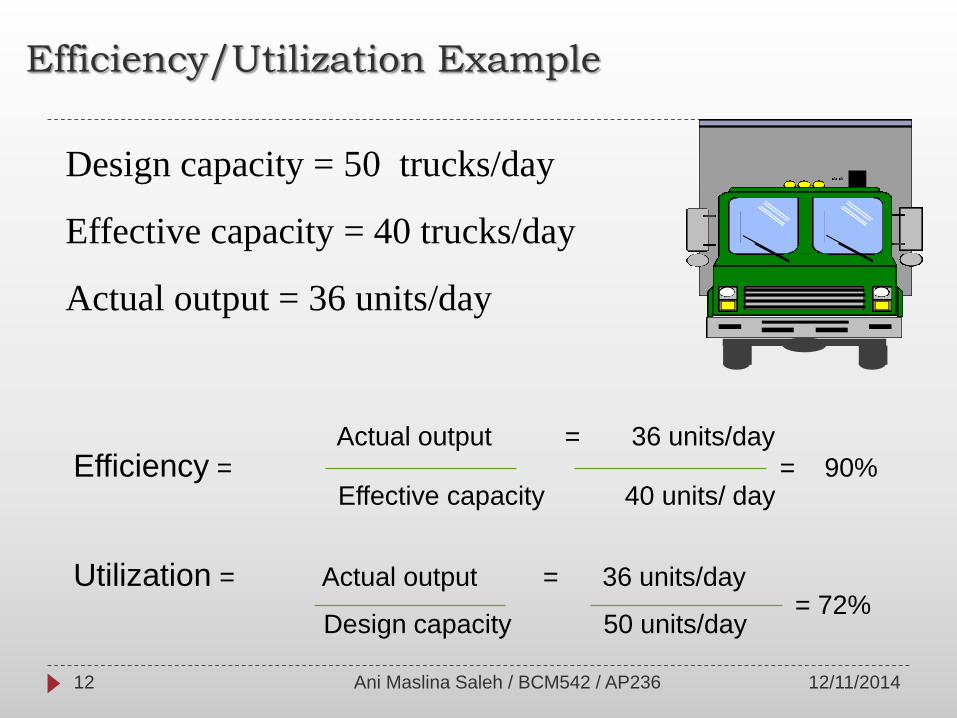
Actual output = 36 units/day
Efficiency = = 90%Effective capacity 40 units/ day
Utilization = Actual output = 36 units/day = 72%
Design capacity 50 units/day
Efficiency/Utilization Example
Design capacity = 50 trucks/day
Effective capacity = 40 trucks/day
Actual output = 36 units/day
12/11/201412 Ani Maslina Saleh / BCM542 / AP236
Determinants of Effective Capacity
Facilities
Product and service factors
Process factors
Human factors
Operational factors
Supply chain factors
External factors
12/11/201413 Ani Maslina Saleh / BCM542 / AP236

Table – Factors that determine effective capacity
Facilities Design
Location
Layout
Environment
Product / Service Design
Product or service mix
Process Quantities capabilities
Quality Capabilities
Human factors Job content
Job design
Training and experience
Motivation
Compensation
Learning rates
Absenteeism and labor turnover
Operational Scheduling
Materials management
Quality assurance
Maintenance policies
Equipment breakdowns
External factors Product standards
Safety regulations
Unions
Pollution control standards
12/11/201414 Ani Maslina Saleh / BCM542 / AP236
Strategy Formulation
Capacity strategy for long-term demand
Demand patterns
Growth rate and variability
Facilities
Cost of building and operating
Technological changes
Rate and direction of technology changes
Behavior of competitors
Availability of capital and other inputs
12/11/201415 Ani Maslina Saleh / BCM542 / AP236
Key Decisions of Capacity Planning
1. Amount of capacity needed
Involves consideration of expected demand and capacity costs.
The greater demand of uncertainty, the greater amount of capacity
cushion
2. Timing of changes
Relates to availability of capital, lead time needed to make
changes and expected demand
3. Need to maintain balance
Requires proportionate changes in capacity in all related areas of
the system
4. Extent of flexibility of facilities
Influence by the uncertainty about demand and the degree of
variety in work requirements.
Capacity cushion – extra demand intended to offset uncertainty
12/11/201416
Steps for Capacity Planning
1. Estimate future capacity requirements
2. Evaluate existing capacity
3. Identify alternatives
4. Conduct financial analysis
5. Assess key qualitative issues
6. Select one alternative
7. Implement alternative chosen
8. Monitor results
12/11/201417 Ani Maslina Saleh / BCM542 / AP236

Calculating Processing Requirements
ProductAnnual
Demand
Standardprocessing time
per unit (hr.)Processing time
needed (hr.)
#1
#2
#3
400
300
700
5.0
8.0
2.0
2,000
2,400
1,400 5,800
A department works one eight-hour shift, 250 days a year. And
has these figures for usage of a machine that is being
considered:
Annual capacity - 8 hours shift and 250 working days a year to
produce 3 products – need how many machine?
5,800 hours = 2.9 machines (equiv. To 3 machines)
2,000 hours/machine
Make or Buy
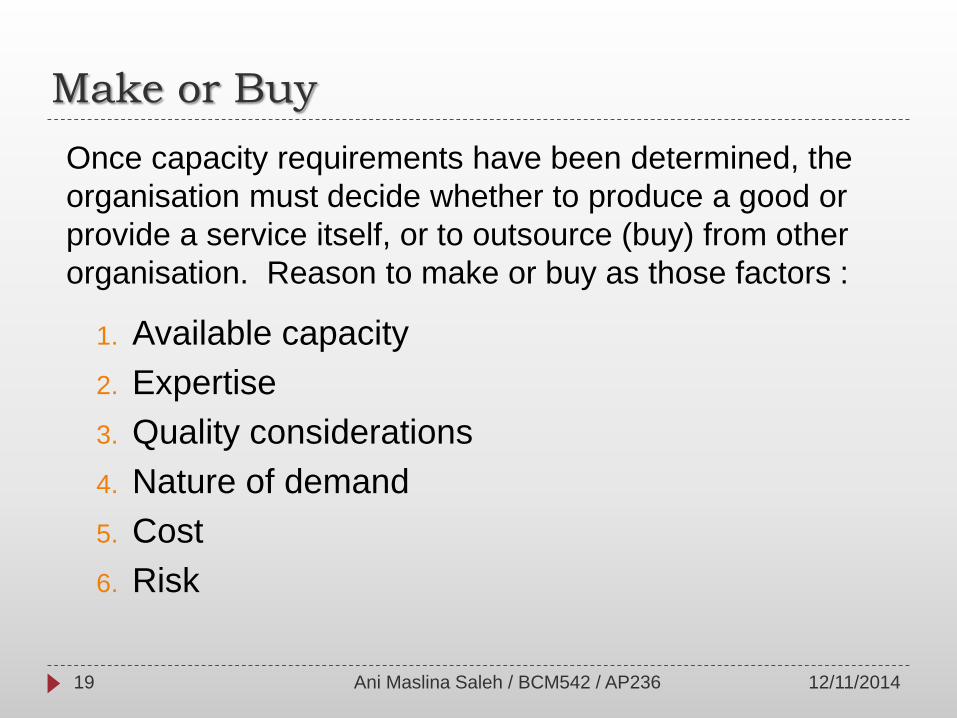
1. Available capacity
2. Expertise
3. Quality considerations
4. Nature of demand
5. Cost
6. Risk
Once capacity requirements have been determined, the
organisation must decide whether to produce a good or
provide a service itself, or to outsource (buy) from other
organisation. Reason to make or buy as those factors :
12/11/201419 Ani Maslina Saleh / BCM542 / AP236
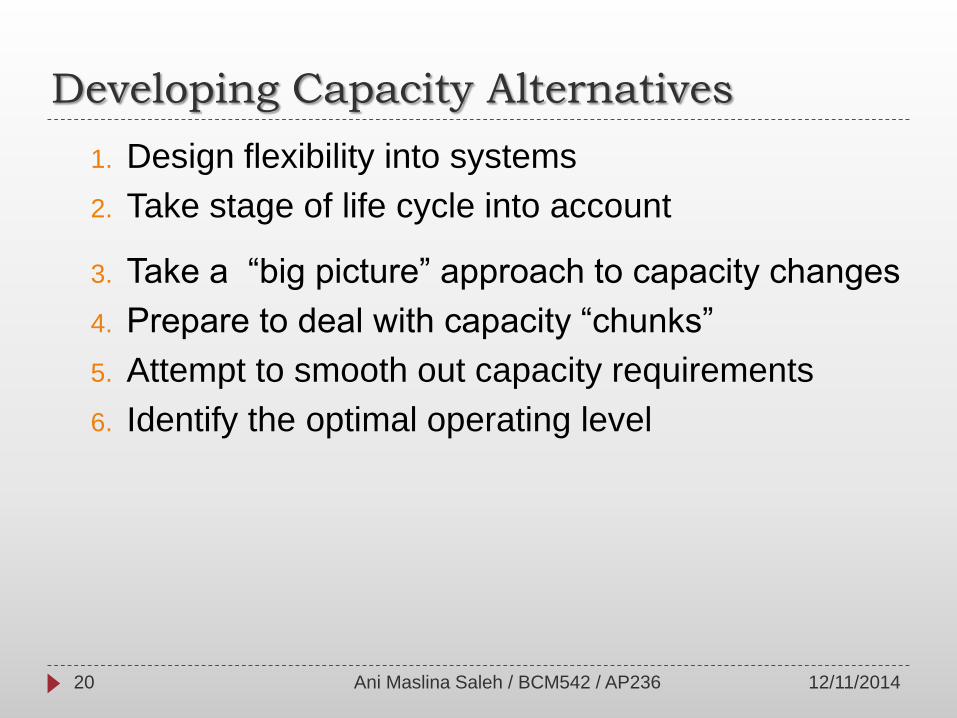
Developing Capacity Alternatives
1. Design flexibility into systems
2. Take stage of life cycle into account
3. Take a “big picture” approach to capacity changes
4. Prepare to deal with capacity “chunks”
5. Attempt to smooth out capacity requirements
6. Identify the optimal operating level
12/11/201420 Ani Maslina Saleh / BCM542 / AP236

Economies of Scale
Economies of scale
If the output rate is less than the optimal level,
increasing output rate results in decreasing
average unit costs
Diseconomies of scale
If the output rate is more than the optimal level,
increasing the output rate results in increasing
average unit costs
12/11/201421 Ani Maslina Saleh / BCM542 / AP236

Evaluating Alternatives
Minimum
cost
Ave
rag
e c
os
t p
er
un
it
0 Rate of output
Production units have an optimal rate of output for minimal cost.
Minimum average cost per unit
12/11/201422
Under-
Utilization
Over-
UtilizationBest
Operating
Level
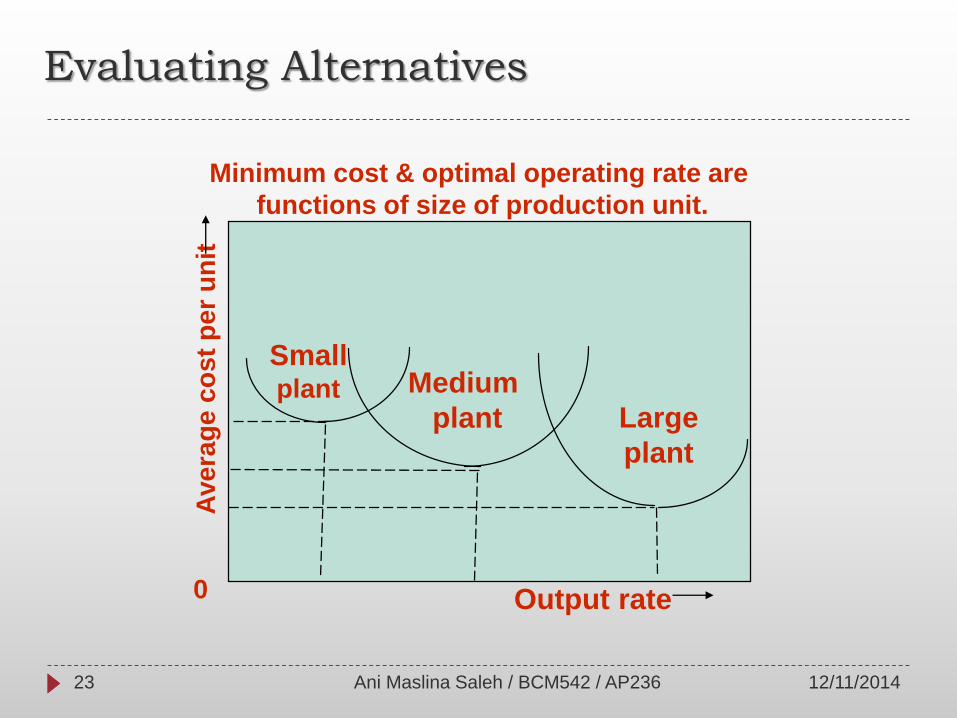
Evaluating Alternatives
Minimum cost & optimal operating rate are
functions of size of production unit.A
ve
rag
e c
os
t p
er
un
it
0
Smallplant Medium
plant Large
plant
Output rate
12/11/201423 Ani Maslina Saleh / BCM542 / AP236

Need to be near customers
Capacity and location are closely tied
Inability to store services
Capacity must be matched with timing of demand
Degree of volatility of demand
Peak demand periods
Planning Service Capacity
12/11/201424 Ani Maslina Saleh / BCM542 / AP236
Evaluating Alternatives
A number of techniques are useful for
evaluating capacity alternatives from an
economic standpoint.
Some of the more common are cost-volume
analysis, financial analysis, decision theory
and waiting-line analysis,
12/11/201425 Ani Maslina Saleh / BCM542 / AP236

Cost-Volume Analysis
Cost-volume analysis focuses on relationship
between cost, revenue and volume of out-put.
The purpose of cost-volume analysis is to estimate
the income of an organisation under different
operating conditions.
As a tool for comparing capacity alternatives
Fixed costs – remain constant regardless of volume
of output (e.g. Rental costs, property taxes,
equipment costs, heating and cooling expenses and
administrative costs)
12/11/201426 Ani Maslina Saleh / BCM542 / AP236
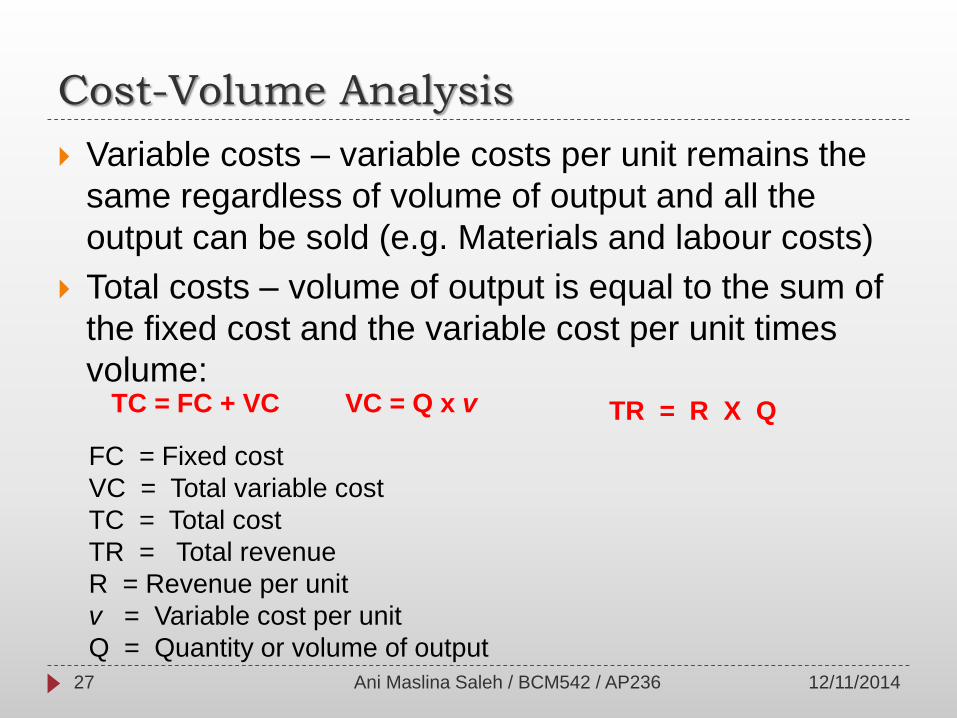
Cost-Volume Analysis
Variable costs – variable costs per unit remains the
same regardless of volume of output and all the
output can be sold (e.g. Materials and labour costs)
Total costs – volume of output is equal to the sum of
the fixed cost and the variable cost per unit times
volume:TC = FC + VC VC = Q x v TR = R X Q
FC = Fixed cost
VC = Total variable cost
TC = Total cost
TR = Total revenue
R = Revenue per unit
v = Variable cost per unit
Q = Quantity or volume of output
12/11/201427 Ani Maslina Saleh / BCM542 / AP236
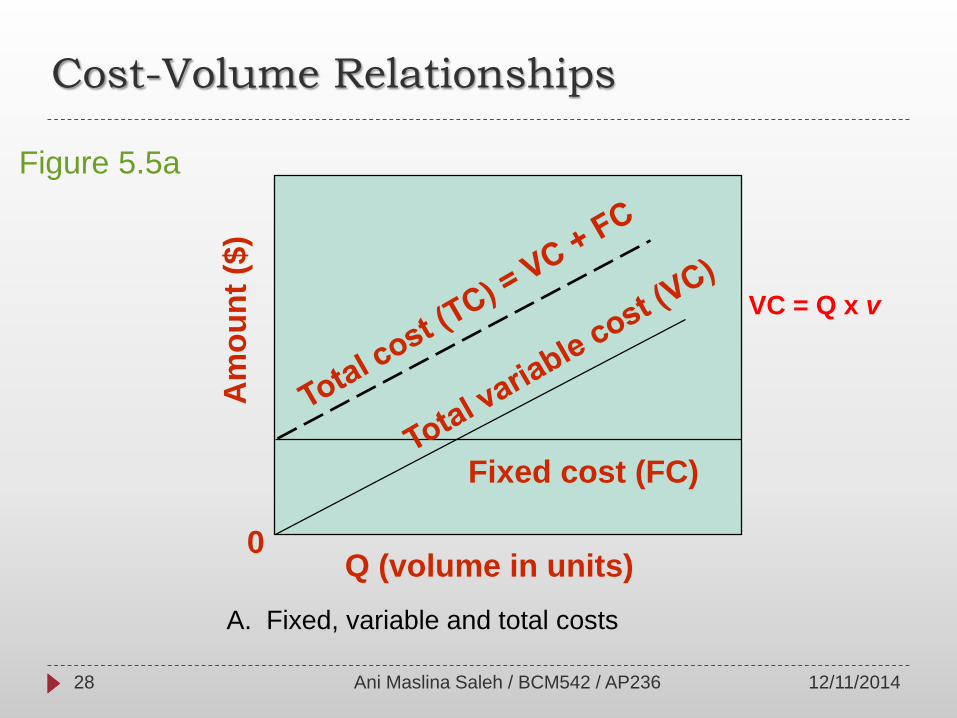
Cost-Volume Relationships
Am
ou
nt
($)
0Q (volume in units)
Fixed cost (FC)
Figure 5.5a
A. Fixed, variable and total costs
VC = Q x v
12/11/201428 Ani Maslina Saleh / BCM542 / AP236
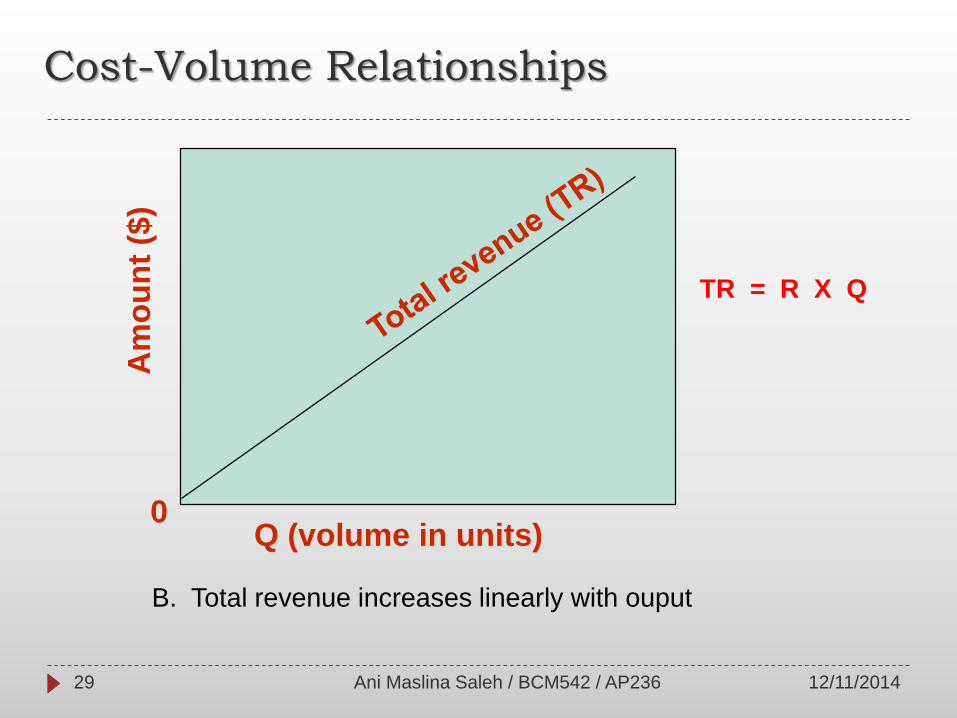
Cost-Volume Relationships
Am
ou
nt
($)
Q (volume in units)0
B. Total revenue increases linearly with ouput
TR = R X Q
12/11/201429 Ani Maslina Saleh / BCM542 / AP236

Cost-Volume RelationshipsA
mo
un
t ($
)
Q (volume in units)0 Break Even Point (BEP) units
Profit (P) = TR – TC
Or
P = Q (R – v) - FC
FC
QBEP =
R - v
12/11/201430 Ani Maslina Saleh / BCM542 / AP236

1. One product is involved
2. Everything produced can be sold
3. Variable cost per unit is the same regardless of volume
4. Fixed costs do not change with volume
5. Revenue per unit constant with volume
6. Revenue per unit exceeds variable cost per unit
Assumptions of Cost-Volume Analysis
12/11/201431 Ani Maslina Saleh / BCM542 / AP236
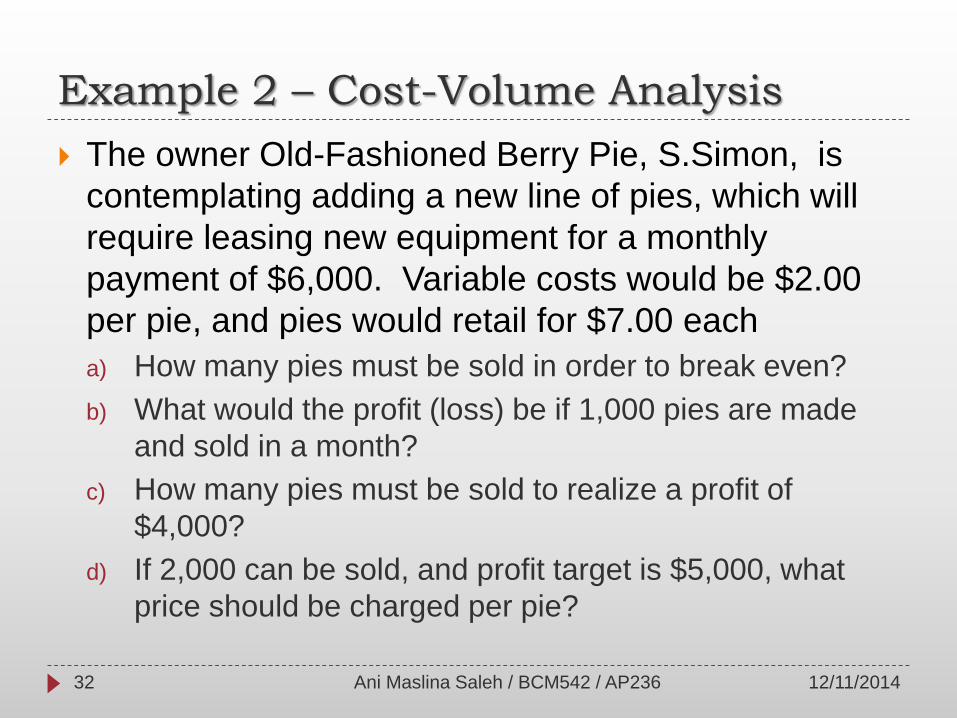
Example 2 – Cost-Volume Analysis
The owner Old-Fashioned Berry Pie, S.Simon, is
contemplating adding a new line of pies, which will
require leasing new equipment for a monthly
payment of $6,000. Variable costs would be $2.00
per pie, and pies would retail for $7.00 each
a) How many pies must be sold in order to break even?
b) What would the profit (loss) be if 1,000 pies are made
and sold in a month?
c) How many pies must be sold to realize a profit of
$4,000?
d) If 2,000 can be sold, and profit target is $5,000, what
price should be charged per pie?
12/11/201432 Ani Maslina Saleh / BCM542 / AP236

Example 2 - Solution
FC = $ 6,000, VC = $2 per pie, Rev = $7 per
pie
FC $6,000a. QBEP = = = 1,200 pies/month
Rev – VC $7 - $2
b. For Q = 1,000, P = Q (R - v) – FC
= 1,000($7 - $2) - $6,000
= -$1,000 (loss)
12/11/201433 Ani Maslina Saleh / BCM542 / AP236
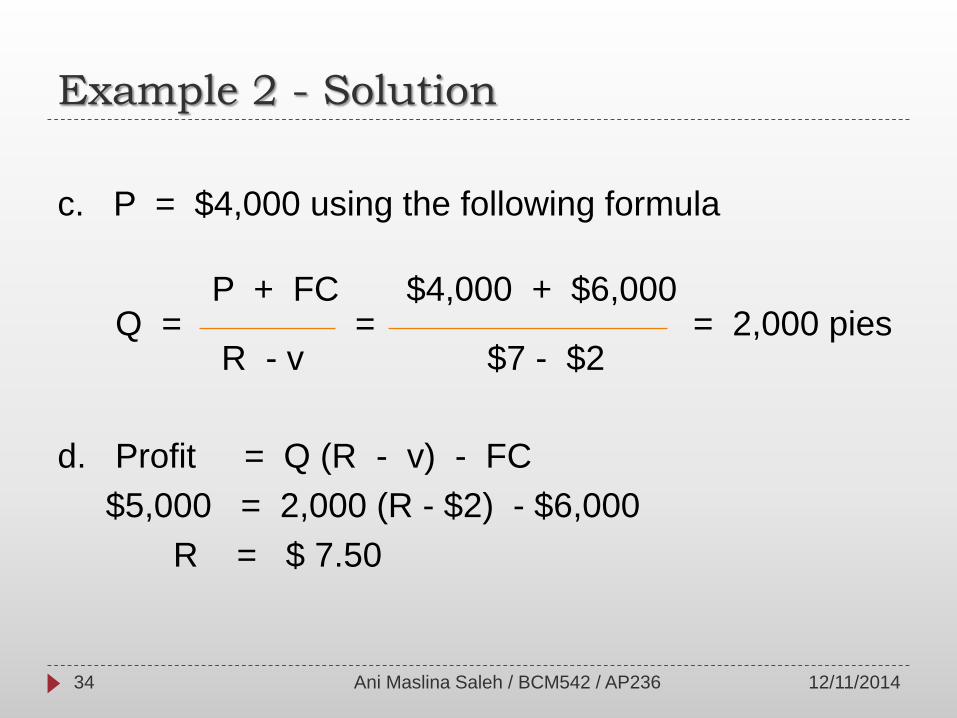
Example 2 - Solution
c. P = $4,000 using the following formula
P + FC $4,000 + $6,000Q = = = 2,000 pies
R - v $7 - $2
d. Profit = Q (R - v) - FC
$5,000 = 2,000 (R - $2) - $6,000
R = $ 7.50
12/11/201434 Ani Maslina Saleh / BCM542 / AP236
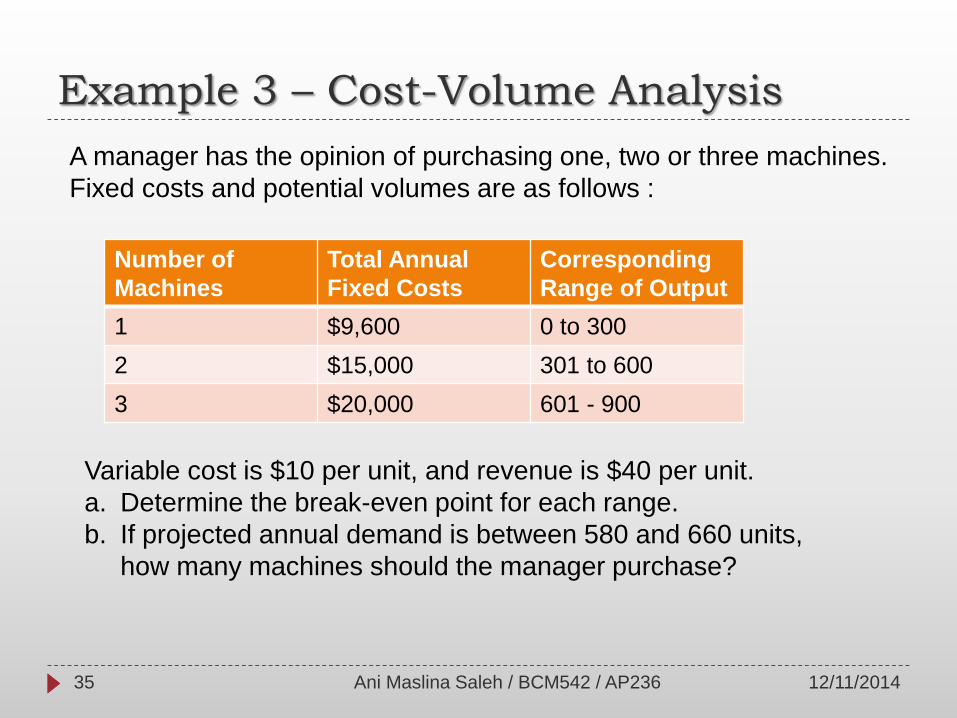
Example 3 – Cost-Volume Analysis
A manager has the opinion of purchasing one, two or three machines.
Fixed costs and potential volumes are as follows :
Number of
Machines
Total Annual
Fixed Costs
Corresponding
Range of Output
1 $9,600 0 to 300
2 $15,000 301 to 600
3 $20,000 601 - 900
Variable cost is $10 per unit, and revenue is $40 per unit.
a. Determine the break-even point for each range.
b. If projected annual demand is between 580 and 660 units,
how many machines should the manager purchase?
12/11/201435 Ani Maslina Saleh / BCM542 / AP236

Example 3 - Solution
a. Compute the break-even point for each range using the
formula
For 1 machine :$9,600
QBEP = = 320 units (not in range, so no BEP)
$40/unit - $10/unit
For 2 machines :
$15,000
QBEP = = 500 units
$40/unit - $10/unit
FC
QBEP =
R - v
12/11/201436 Ani Maslina Saleh / BCM542 / AP236
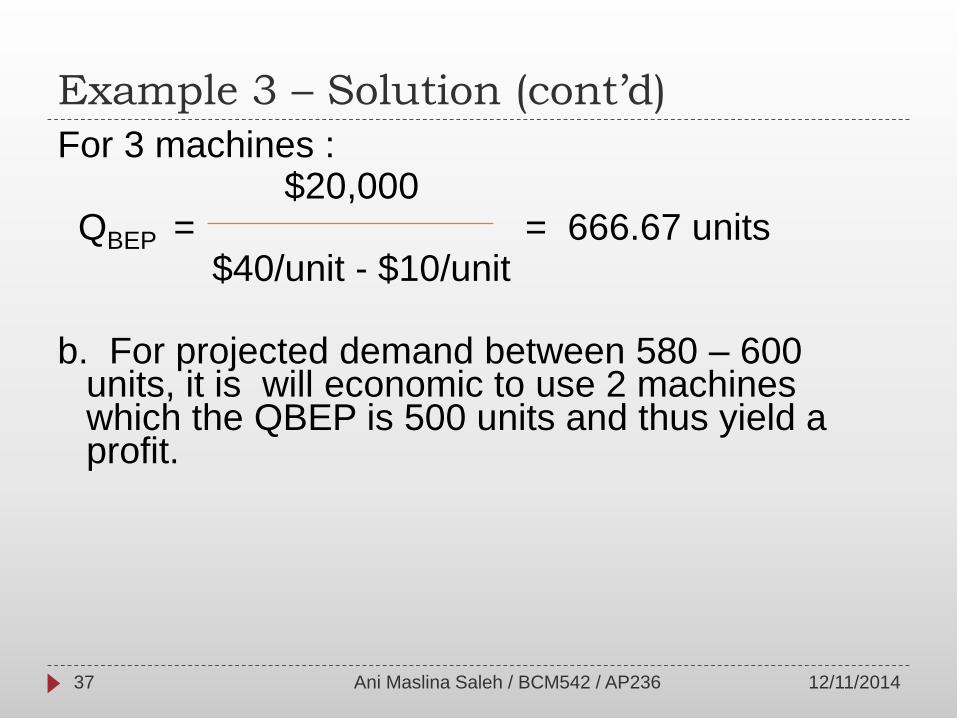
Example 3 – Solution (cont’d)
For 3 machines :$20,000
QBEP = = 666.67 units$40/unit - $10/unit
b. For projected demand between 580 – 600 units, it is will economic to use 2 machines which the QBEP is 500 units and thus yield a profit.
12/11/201437 Ani Maslina Saleh / BCM542 / AP236

Break-Even Problem with Step Fixed Costs
Quantity
Step fixed costs and variable costs.
1 machine
2 machines
3 machines
Figure 5.6a
12/11/201438 Ani Maslina Saleh / BCM542 / AP236

Break-Even Problem with Step Fixed Costs
$
TC
TC
TCBEP
2
BEP3
Quantity
1
2
3
Multiple break-even points
Figure 5.6b
12/11/201439 Ani Maslina Saleh / BCM542 / AP236

Financial Analysis
Cash Flow - the difference between cash received
from sales and other sources, and cash outflow
for labor, material, overhead, and taxes.
Present Value - the sum, in current value, of all
future cash flows of an investment proposal. (e.g
Future Value, Internal Rate of Return (IRR) etc.)
12/11/201440 Ani Maslina Saleh / BCM542 / AP236

CONCLUSION
Capacity planning involves long-term and short-term
considerations
Long –term considerations relate to the overall level
of capacity and relate with forecasting
Short-term considerations relate to variable in
capacity requirements due to seasonal, random and
irregular fluctuations in demand.
Ideally, capacity will match demand
12/11/201441 Ani Maslina Saleh / BCM542 / AP236

Exercise
12/11/2014Ani Maslina Saleh / BCM542 / AP23642
A producer of felt-tip pens received a forecast of
demand of 30,000 pens for the coming month from it
marketing department. Fixed cost of $25,000/month
are allocated to the felt-tip operation, and variable
cost are 37 cents per pen.
a) Find the break-even quantity if pens sell for $1
each
b) At what price must pens be sold to obtain a
monthly profit of $15,000.

12/11/2014Ani Maslina Saleh / BCM542 / AP23643
A manager must decide which type of equipment to buy, Type A or Type B. Type A equipment costs $15,000 each and Type B costs $11,000 each. The equipment can be operated 8 hours per day, 250 days a year.
Either machine can be used to perform two types of chemical analysis, C1 and C2. Annual service requirements and processing times are shown in the following table. Which type of equipment should be purchased, and how many of that type will be needed. The goal is to minimise total purchase cost
Total processing time (annual volume x processing time per analysis needed by type of equipment
Analysis
Type
Annual
Volume
Processing
Time (Hr) - A
Processing
Time (Hr) –
B
C1 1,200 1 2
C2 900 3 2

12/11/2014Ani Maslina Saleh / BCM542 / AP23644
A manager must decide which type of machine to buy A, B or C Machine costs A- $40,000, B costs - $ 30,000 and C - $80,000. Product forecast and processing times on the machine are as follows ;
a) Assume that only purchasing costs are being considered . Which machine have the lowest total cost and how many machine need. Machine operate 10 hours a day, 250 days a year
b) Machine A have hourly operating costs of $10 each, Machine B $11 each, Machine C $12 each. Which machine can be selected and how many machine need to minimize total cost while satisfying capacity processing requirement.
product Annual
demand
Time
processin
g (min)
A
Time
processin
g (min)
B
Time
processin
g (min)
C
1 16000 3 4 2
2 12000 4 4 3
3 6000 5 6 4
4 30000 2 2 1
Related Documents