Sensors and Actuators B 211 (2015) 428–438 Contents lists available at ScienceDirect Sensors and Actuators B: Chemical jo u r nal homep age: www.elsevier.com/locate/snb Capacitive biosensing of bacterial cells: Analytical model and numerical simulations N. Couniot ∗ , A. Afzalian, N. Van Overstraeten-Schlögel, L.A. Francis, D. Flandre ICTEAM Institute, Université catholique de Louvain, Place du levant 3-L5.03.02, 1348 Louvain-La-Neuve, Belgium a r t i c l e i n f o Article history: Received 5 November 2014 Received in revised form 14 January 2015 Accepted 27 January 2015 Available online 7 February 2015 Keywords: Bacterial detection Interdigital capacitor modeling Metal–insulator–electrolyte (MIE) Electrical double layer Planar electrodes CMOS biosensors a b s t r a c t Impedimetric biosensors with a passivation layer, also called capacitive biosensors, have recently shown great promise towards sensitive, selective and rapid detection of pathogen bacterial cells. However, few studies focus on their modeling, yet critical for the optimization of their sensitivity. To address this issue, we propose a comprehensive framework by developing analytical models and 2D numerical simulations of passivated interdigitated microelectrodes (IDEs) with adherent bacterial cells in electrolyte. While models provide a qualitative and semi-quantitative analysis of the AC impedance spectroscopy based on the system cutoff frequencies, finite element method (FEM) simulations based on Poisson–Nernst–Planck equations enable accurate quantification of the sensitivity to bacteria versus the applied frequency thanks to modeling of complex phenomena such as ion transport, surface and space charges, multi-shell bacterial dielectric properties and sensor topology. These numerical simulations are assessed by experimental results and compared to analytical models. © 2015 Elsevier B.V. All rights reserved. 1. Introduction Capacitive biosensors could enable compact, portable and elec- trical sensing of biological species [1]. They consist of non-faradaic electrodes that prevent charge transfer at the electrode interface. The application of sinusoidal voltages on electrodes enables extrac- tion of the AC complex impedance, often dominated by the sensor capacitance. Its variation is related to the amount of biological species that specifically bind on bioreceptors grafted to the sensor surface. Using micrometer-sized interdigitated electrodes (IDEs) also called interdigitated array microelectrodes (IDAM), capacitive biosensors have demonstrated large sensitivity to bacterial cells [2,3] and capability to be easily co-integrated with a CMOS read- out interface [4–8], providing miniaturization, system integration, affordability and portability, which are key features for point-of- care (PoC) diagnosis tools [9]. The microelectrodes are typically coated by a thin insulating passivation layer. When self-assembled from biological materials [10], this insulation mainly acts as a selectivity means to bind target bacteria [2]. When grown by microfabrication (SiO 2 [7], Al 2 O 3 [8], Ta 2 O 5 [11], etc.), the insulating layer mainly acts as protective coat- ing against electrochemical corrosion of the electrode material such ∗ Corresponding author. Tel.: +32 10472174. URL: http://[email protected] (N. Couniot). as aluminum in CMOS process [12]. Despite these advantages, the insulating layer can degrade the bacterial sensitivity [13]. To opti- mize the complex frequency-dependent dielectric system formed by discrete bacteria and metal–insulator–electrolyte (MIE) struc- ture towards the highest sensitivity, most research works model the electrodes and bacterial cells by an equivalent electrical cir- cuit combining lumped elements [2], providing only a qualitative analyzis of the sensor behavior in the presence of bacterial cells. Despite exact expressions of the IDE cell constant [14] and electric field penetration depth [15] in simple electrolytes, the spectral vari- ation of the IDE impedance in presence of bacterial cells remains unformulated. Instead of analytical models, 2D or 3D electrostatic simulations have been reported to accurately quantify the sensitiv- ity to bacterial cells depending on their random positions on the 3D electrode topology [16], their number [16,17] and the thickness of the passivation layer [13]. Such 2D or 3D simulations have also been implemented to analyze the impact of the applied frequency on the sensor impedance [18] and sensitivity [19–21] of nanometer-scale biomolecules. In this work, we propose a comprehensive analysis of the spectral impedance and sensitivity of capacitive biosensors in pres- ence of bacterial cells based on analytical models, 2D numerical simulations and experimental measurements. In Section 2, the ana- lytical models are first established for the MIE interface without and with bacterial cells, showing how cutoff frequencies govern the sensor and bacterial impedances. The maximal sensitivity is http://dx.doi.org/10.1016/j.snb.2015.01.108 0925-4005/© 2015 Elsevier B.V. All rights reserved.

Welcome message from author
This document is posted to help you gain knowledge. Please leave a comment to let me know what you think about it! Share it to your friends and learn new things together.
Transcript
Cn
NI
a
ARRAA
KBIMEPC
1
teTtcssab[oac
p[bTi
h0
Sensors and Actuators B 211 (2015) 428–438
Contents lists available at ScienceDirect
Sensors and Actuators B: Chemical
jo u r nal homep age: www.elsev ier .com/ locate /snb
apacitive biosensing of bacterial cells: Analytical model andumerical simulations
. Couniot ∗, A. Afzalian, N. Van Overstraeten-Schlögel, L.A. Francis, D. FlandreCTEAM Institute, Université catholique de Louvain, Place du levant 3-L5.03.02, 1348 Louvain-La-Neuve, Belgium
r t i c l e i n f o
rticle history:eceived 5 November 2014eceived in revised form 14 January 2015ccepted 27 January 2015vailable online 7 February 2015
eywords:
a b s t r a c t
Impedimetric biosensors with a passivation layer, also called capacitive biosensors, have recently showngreat promise towards sensitive, selective and rapid detection of pathogen bacterial cells. However, fewstudies focus on their modeling, yet critical for the optimization of their sensitivity. To address this issue,we propose a comprehensive framework by developing analytical models and 2D numerical simulationsof passivated interdigitated microelectrodes (IDEs) with adherent bacterial cells in electrolyte. Whilemodels provide a qualitative and semi-quantitative analysis of the AC impedance spectroscopy based on
acterial detectionnterdigital capacitor modeling
etal–insulator–electrolyte (MIE)lectrical double layerlanar electrodesMOS biosensors
the system cutoff frequencies, finite element method (FEM) simulations based on Poisson–Nernst–Planckequations enable accurate quantification of the sensitivity to bacteria versus the applied frequency thanksto modeling of complex phenomena such as ion transport, surface and space charges, multi-shell bacterialdielectric properties and sensor topology. These numerical simulations are assessed by experimentalresults and compared to analytical models.
© 2015 Elsevier B.V. All rights reserved.
. Introduction
Capacitive biosensors could enable compact, portable and elec-rical sensing of biological species [1]. They consist of non-faradaiclectrodes that prevent charge transfer at the electrode interface.he application of sinusoidal voltages on electrodes enables extrac-ion of the AC complex impedance, often dominated by the sensorapacitance. Its variation is related to the amount of biologicalpecies that specifically bind on bioreceptors grafted to the sensorurface. Using micrometer-sized interdigitated electrodes (IDEs)lso called interdigitated array microelectrodes (IDAM), capacitiveiosensors have demonstrated large sensitivity to bacterial cells2,3] and capability to be easily co-integrated with a CMOS read-ut interface [4–8], providing miniaturization, system integration,ffordability and portability, which are key features for point-of-are (PoC) diagnosis tools [9].
The microelectrodes are typically coated by a thin insulatingassivation layer. When self-assembled from biological materials10], this insulation mainly acts as a selectivity means to bind target
acteria [2]. When grown by microfabrication (SiO2 [7], Al2O3 [8],a2O5 [11], etc.), the insulating layer mainly acts as protective coat-ng against electrochemical corrosion of the electrode material such∗ Corresponding author. Tel.: +32 10472174.URL: http://[email protected] (N. Couniot).
ttp://dx.doi.org/10.1016/j.snb.2015.01.108925-4005/© 2015 Elsevier B.V. All rights reserved.
as aluminum in CMOS process [12]. Despite these advantages, theinsulating layer can degrade the bacterial sensitivity [13]. To opti-mize the complex frequency-dependent dielectric system formedby discrete bacteria and metal–insulator–electrolyte (MIE) struc-ture towards the highest sensitivity, most research works modelthe electrodes and bacterial cells by an equivalent electrical cir-cuit combining lumped elements [2], providing only a qualitativeanalyzis of the sensor behavior in the presence of bacterial cells.Despite exact expressions of the IDE cell constant [14] and electricfield penetration depth [15] in simple electrolytes, the spectral vari-ation of the IDE impedance in presence of bacterial cells remainsunformulated. Instead of analytical models, 2D or 3D electrostaticsimulations have been reported to accurately quantify the sensitiv-ity to bacterial cells depending on their random positions on the 3Delectrode topology [16], their number [16,17] and the thickness ofthe passivation layer [13]. Such 2D or 3D simulations have also beenimplemented to analyze the impact of the applied frequency on thesensor impedance [18] and sensitivity [19–21] of nanometer-scalebiomolecules.
In this work, we propose a comprehensive analysis of thespectral impedance and sensitivity of capacitive biosensors in pres-ence of bacterial cells based on analytical models, 2D numerical
simulations and experimental measurements. In Section 2, the ana-lytical models are first established for the MIE interface withoutand with bacterial cells, showing how cutoff frequencies governthe sensor and bacterial impedances. The maximal sensitivity is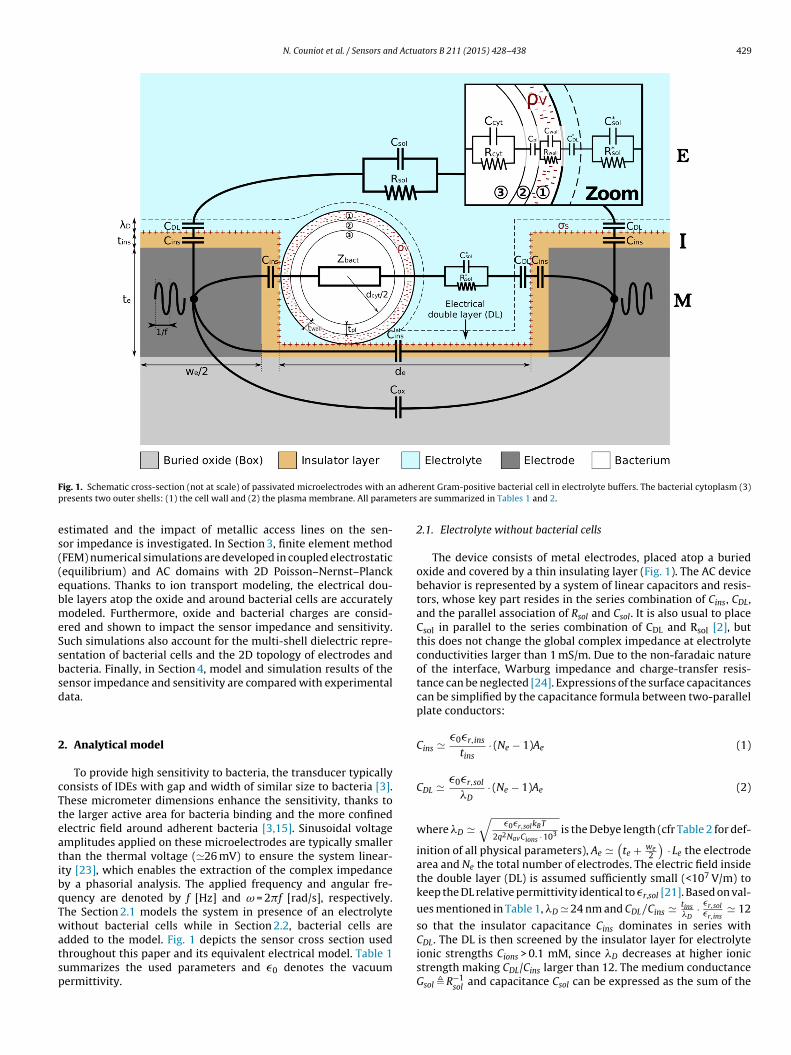
N. Couniot et al. / Sensors and Actuators B 211 (2015) 428–438 429
F adhep eters
es((ebmeSsbsd
2
cTteatibqTwatsp
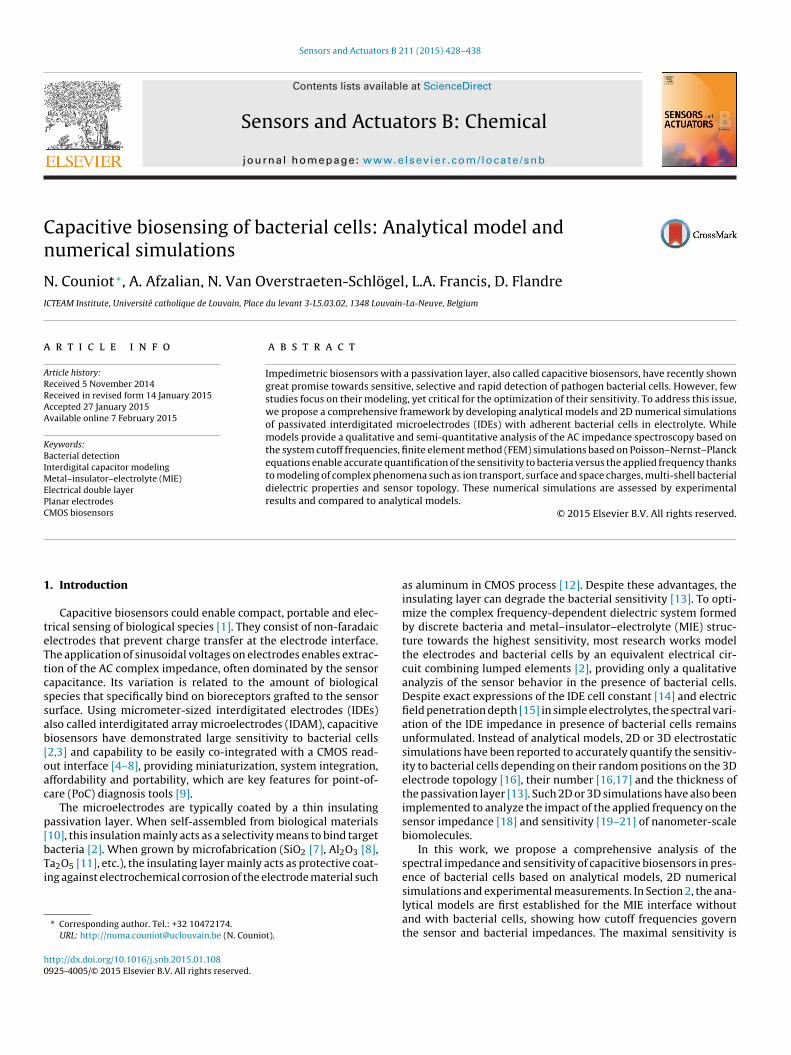
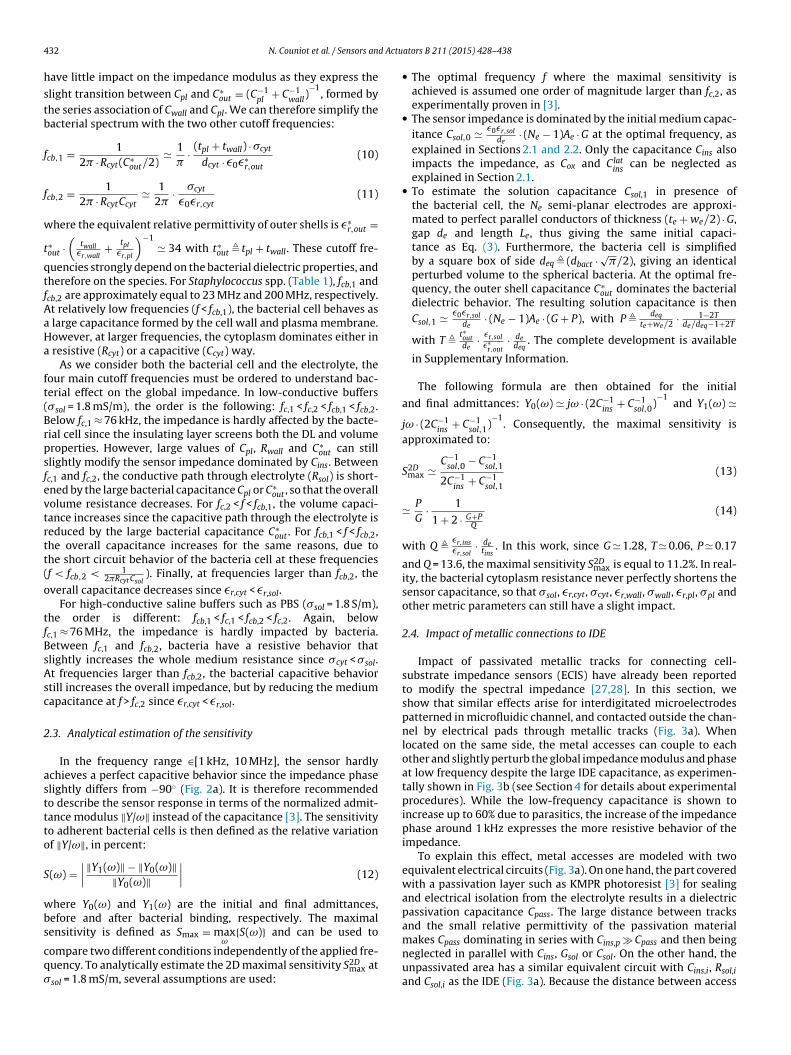
ig. 1. Schematic cross-section (not at scale) of passivated microelectrodes with anresents two outer shells: (1) the cell wall and (2) the plasma membrane. All param
stimated and the impact of metallic access lines on the sen-or impedance is investigated. In Section 3, finite element methodFEM) numerical simulations are developed in coupled electrostaticequilibrium) and AC domains with 2D Poisson–Nernst–Planckquations. Thanks to ion transport modeling, the electrical dou-le layers atop the oxide and around bacterial cells are accuratelyodeled. Furthermore, oxide and bacterial charges are consid-
red and shown to impact the sensor impedance and sensitivity.uch simulations also account for the multi-shell dielectric repre-entation of bacterial cells and the 2D topology of electrodes andacteria. Finally, in Section 4, model and simulation results of theensor impedance and sensitivity are compared with experimentalata.
. Analytical model
To provide high sensitivity to bacteria, the transducer typicallyonsists of IDEs with gap and width of similar size to bacteria [3].hese micrometer dimensions enhance the sensitivity, thanks tohe larger active area for bacteria binding and the more confinedlectric field around adherent bacteria [3,15]. Sinusoidal voltagemplitudes applied on these microelectrodes are typically smallerhan the thermal voltage (�26 mV) to ensure the system linear-ty [23], which enables the extraction of the complex impedancey a phasorial analysis. The applied frequency and angular fre-uency are denoted by f [Hz] and ω = 2�f [rad/s], respectively.
he Section 2.1 models the system in presence of an electrolyteithout bacterial cells while in Section 2.2, bacterial cells aredded to the model. Fig. 1 depicts the sensor cross section usedhroughout this paper and its equivalent electrical model. Table 1ummarizes the used parameters and �0 denotes the vacuumermittivity.
rent Gram-positive bacterial cell in electrolyte buffers. The bacterial cytoplasm (3) are summarized in Tables 1 and 2.
2.1. Electrolyte without bacterial cells
The device consists of metal electrodes, placed atop a buriedoxide and covered by a thin insulating layer (Fig. 1). The AC devicebehavior is represented by a system of linear capacitors and resis-tors, whose key part resides in the series combination of Cins, CDL,and the parallel association of Rsol and Csol. It is also usual to placeCsol in parallel to the series combination of CDL and Rsol [2], butthis does not change the global complex impedance at electrolyteconductivities larger than 1 mS/m. Due to the non-faradaic natureof the interface, Warburg impedance and charge-transfer resis-tance can be neglected [24]. Expressions of the surface capacitancescan be simplified by the capacitance formula between two-parallelplate conductors:
Cins � �0�r,ins
tins· (Ne − 1)Ae (1)
CDL � �0�r,sol
�D· (Ne − 1)Ae (2)
where �D �√
�0�r,solkBT
2q2NavCions · 103 is the Debye length (cfr Table 2 for def-
inition of all physical parameters), Ae �(
te + we2
)· Le the electrode
area and Ne the total number of electrodes. The electric field insidethe double layer (DL) is assumed sufficiently small (<107 V/m) tokeep the DL relative permittivity identical to �r,sol [21]. Based on val-
ues mentioned in Table 1, �D � 24 nm and CDL/Cins � tins�D
· �r,sol�r,ins
� 12
so that the insulator capacitance Cins dominates in series with
CDL. The DL is then screened by the insulator layer for electrolyteionic strengths Cions > 0.1 mM, since �D decreases at higher ionicstrength making CDL/Cins larger than 12. The medium conductanceGsol � R−1soland capacitance Csol can be expressed as the sum of the
430 N. Couniot et al. / Sensors and Actuators B 211 (2015) 428–438
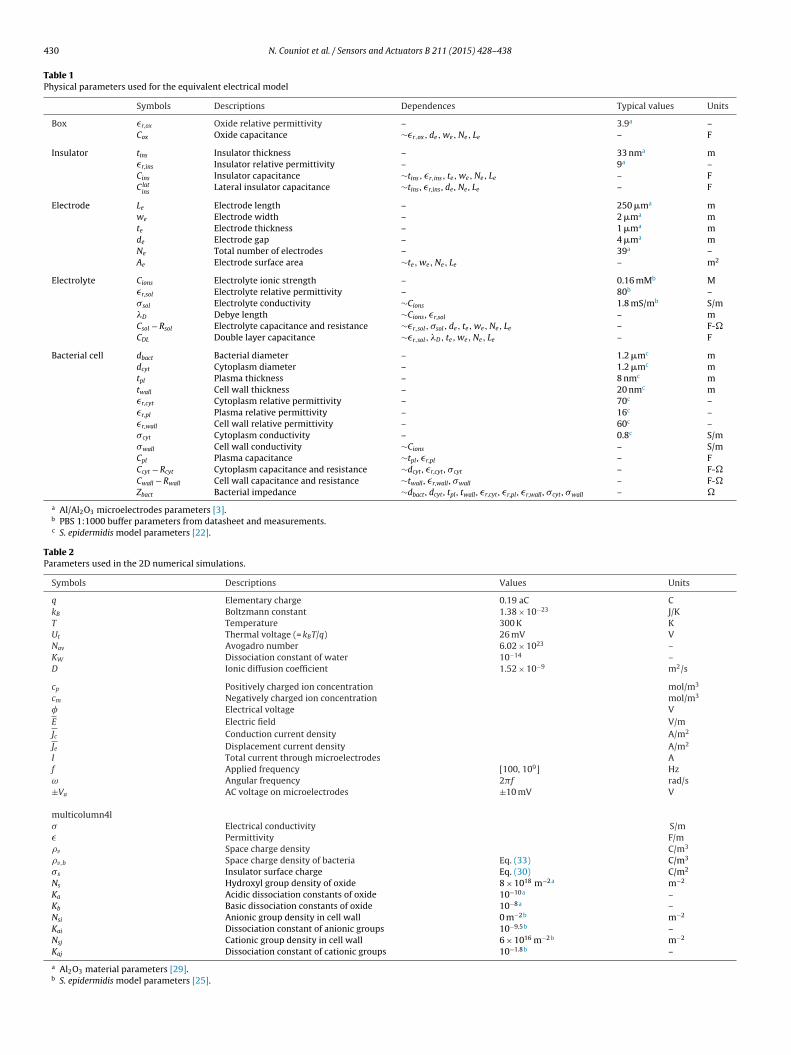
Table 1Physical parameters used for the equivalent electrical model
Symbols Descriptions Dependences Typical values Units
Box �r,ox Oxide relative permittivity – 3.9a –Cox Oxide capacitance ∼�r,ox, de, we, Ne, Le – F
Insulator tins Insulator thickness – 33 nma m�r,ins Insulator relative permittivity – 9a –Cins Insulator capacitance ∼tins, �r,ins, te, we, Ne, Le – FClat
insLateral insulator capacitance ∼tins , �r,ins , de , Ne , Le – F
Electrode Le Electrode length – 250 �ma mwe Electrode width – 2 �ma mte Electrode thickness – 1 �ma mde Electrode gap – 4 �ma mNe Total number of electrodes – 39a –Ae Electrode surface area ∼te, we, Ne, Le – m2
Electrolyte Cions Electrolyte ionic strength – 0.16 mMb M�r,sol Electrolyte relative permittivity – 80b –�sol Electrolyte conductivity ∼Cions 1.8 mS/mb S/m�D Debye length ∼Cions , �r,sol – mCsol − Rsol Electrolyte capacitance and resistance ∼�r,sol, �sol, de, te, we, Ne, Le – F-�CDL Double layer capacitance ∼�r,sol, �D, te, we, Ne, Le – F
Bacterial cell dbact Bacterial diameter – 1.2 �mc mdcyt Cytoplasm diameter – 1.2 �mc mtpl Plasma thickness – 8 nmc mtwall Cell wall thickness – 20 nmc m�r,cyt Cytoplasm relative permittivity – 70c –�r,pl Plasma relative permittivity – 16c –�r,wall Cell wall relative permittivity – 60c –�cyt Cytoplasm conductivity – 0.8c S/m�wall Cell wall conductivity ∼Cions – S/mCpl Plasma capacitance ∼tpl , �r,pl – FCcyt − Rcyt Cytoplasm capacitance and resistance ∼dcyt , �r,cyt , �cyt – F-�Cwall − Rwall Cell wall capacitance and resistance ∼twall , �r,wall , �wall – F-�Zbact Bacterial impedance ∼dbact , dcyt , tpl , twall , �r,cyt , �r,pl , �r,wall , �cyt , �wall – �
a Al/Al2O3 microelectrodes parameters [3].b PBS 1:1000 buffer parameters from datasheet and measurements.c S. epidermidis model parameters [22].
Table 2Parameters used in the 2D numerical simulations.
Symbols Descriptions Values Units
q Elementary charge 0.19 aC CkB Boltzmann constant 1.38 × 10⁻²³ J/KT Temperature 300 K KUt Thermal voltage (= kBT/q) 26 mV VNav Avogadro number 6.02 × 10²³ –KW Dissociation constant of water 10−14 –D Ionic diffusion coefficient 1.52 × 10⁻⁹ m2/s
cp Positively charged ion concentration mol/m3
cm Negatively charged ion concentration mol/m3
� Electrical voltage VE Electric field V/mJc Conduction current density A/m2
Je Displacement current density A/m2
I Total current through microelectrodes Af Applied frequency [100, 109] Hzω Angular frequency 2�f rad/s±Va AC voltage on microelectrodes ±10 mV V
multicolumn4l� Electrical conductivity S/m� Permittivity F/mv Space charge density C/m3
v,b Space charge density of bacteria Eq. (33) C/m3
�s Insulator surface charge Eq. (30) C/m2
Ns Hydroxyl group density of oxide 8 × 10¹⁸ m−2a m−2
Ka Acidic dissociation constants of oxide 10−10a –Kb Basic dissociation constants of oxide 10−8a –Nsi Anionic group density in cell wall 0 m−2b m−2
Kai Dissociation constant of anionic groups 10−9.5b –Nsj Cationic group density in cell wall 6 × 10¹⁶ m−2b m−2
Kaj Dissociation constant of cationic groups 10−1.8b –
a Al2O3 material parameters [29].b S. epidermidis model parameters [25].
d Actuators B 211 (2015) 428–438 431
cp
C
G
w
p
gcfc
f
f
ti
C
C
p
icliBa
qit
all1�f�lutsc
2
tfm
N. Couniot et al. / Sensors an
apacitance between parallel conductors of thickness te and thelanar capacitance between half electrodes of width we/2:
sol � �0�r,sol
de· (Ne − 1)AeG (3)
sol � �sol
de· (Ne − 1)AeG (4)
here G � te+de · K(√
1−k2)/(2K(k))te+we/2 is a geometric constant with
arameters k � cos(
�2 · we
de+we
)and K(k) �
∫ t=1t=0
dt√(1−t2)(1−k2t2)
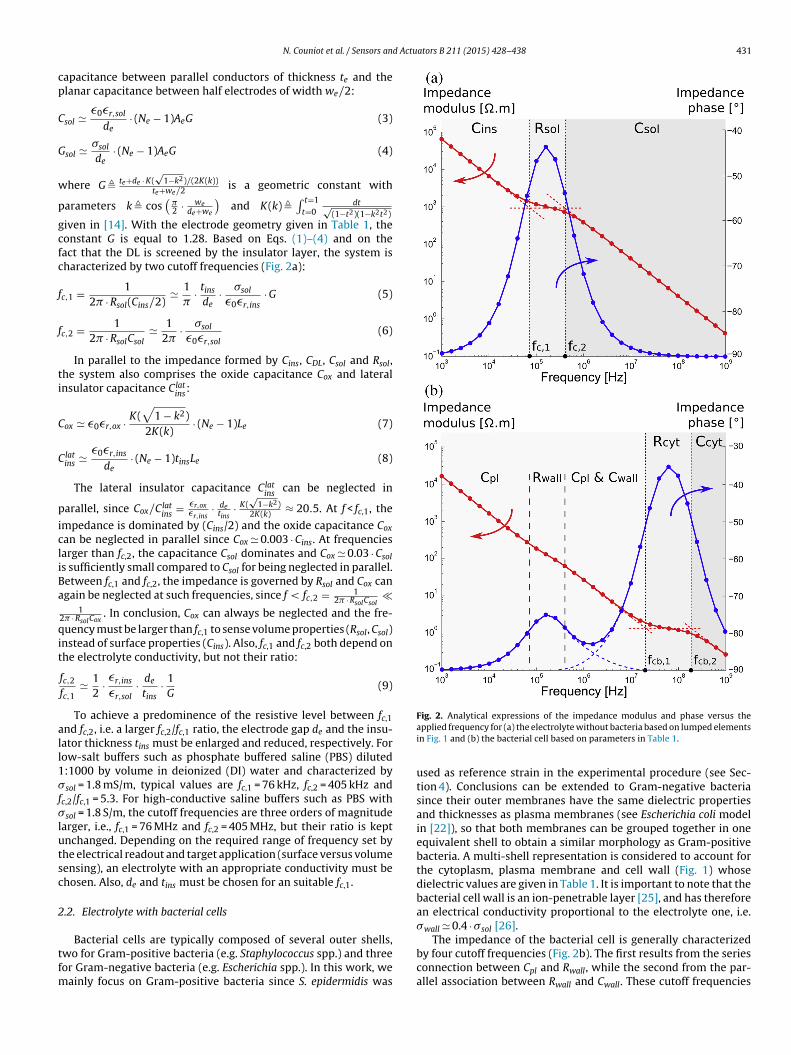
iven in [14]. With the electrode geometry given in Table 1, theonstant G is equal to 1.28. Based on Eqs. (1)–(4) and on theact that the DL is screened by the insulator layer, the system isharacterized by two cutoff frequencies (Fig. 2a):
c,1 = 12� · Rsol(Cins/2)
� 1�
· tins
de· �sol
�0�r,ins· G (5)
c,2 = 12� · RsolCsol
� 12�
· �sol
�0�r,sol(6)
In parallel to the impedance formed by Cins, CDL, Csol and Rsol,he system also comprises the oxide capacitance Cox and lateralnsulator capacitance Clat
ins:
ox � �0�r,ox · K(√
1 − k2)2K(k)
· (Ne − 1)Le (7)
latins � �0�r,ins
de· (Ne − 1)tinsLe (8)
The lateral insulator capacitance Clatins
can be neglected in
arallel, since Cox/Clatins
= �r,ox�r,ins
· detins
· K(√
1−k2)2K(k) ≈ 20.5. At f < fc,1, the
mpedance is dominated by (Cins/2) and the oxide capacitance Cox
an be neglected in parallel since Cox � 0.003 · Cins. At frequenciesarger than fc,2, the capacitance Csol dominates and Cox � 0.03 · Csols sufficiently small compared to Csol for being neglected in parallel.etween fc,1 and fc,2, the impedance is governed by Rsol and Cox cangain be neglected at such frequencies, since f < fc,2 = 1
2� · RsolCsol�
12� · RsolCox
. In conclusion, Cox can always be neglected and the fre-uency must be larger than fc,1 to sense volume properties (Rsol, Csol)
nstead of surface properties (Cins). Also, fc,1 and fc,2 both depend onhe electrolyte conductivity, but not their ratio:
fc,2
fc,1� 1
2· �r,ins
�r,sol· de
tins· 1
G(9)
To achieve a predominence of the resistive level between fc,1nd fc,2, i.e. a larger fc,2/fc,1 ratio, the electrode gap de and the insu-ator thickness tins must be enlarged and reduced, respectively. Forow-salt buffers such as phosphate buffered saline (PBS) diluted:1000 by volume in deionized (DI) water and characterized bysol = 1.8 mS/m, typical values are fc,1 = 76 kHz, fc,2 = 405 kHz and
c,2/fc,1 = 5.3. For high-conductive saline buffers such as PBS withsol = 1.8 S/m, the cutoff frequencies are three orders of magnitude
arger, i.e., fc,1 = 76 MHz and fc,2 = 405 MHz, but their ratio is keptnchanged. Depending on the required range of frequency set byhe electrical readout and target application (surface versus volumeensing), an electrolyte with an appropriate conductivity must behosen. Also, de and tins must be chosen for an suitable fc,1.
.2. Electrolyte with bacterial cells
Bacterial cells are typically composed of several outer shells,wo for Gram-positive bacteria (e.g. Staphylococcus spp.) and threeor Gram-negative bacteria (e.g. Escherichia spp.). In this work, we
ainly focus on Gram-positive bacteria since S. epidermidis was
Fig. 2. Analytical expressions of the impedance modulus and phase versus theapplied frequency for (a) the electrolyte without bacteria based on lumped elementsin Fig. 1 and (b) the bacterial cell based on parameters in Table 1.
used as reference strain in the experimental procedure (see Sec-tion 4). Conclusions can be extended to Gram-negative bacteriasince their outer membranes have the same dielectric propertiesand thicknesses as plasma membranes (see Escherichia coli modelin [22]), so that both membranes can be grouped together in oneequivalent shell to obtain a similar morphology as Gram-positivebacteria. A multi-shell representation is considered to account forthe cytoplasm, plasma membrane and cell wall (Fig. 1) whosedielectric values are given in Table 1. It is important to note that thebacterial cell wall is an ion-penetrable layer [25], and has thereforean electrical conductivity proportional to the electrolyte one, i.e.�wall � 0.4 · �sol [26].
The impedance of the bacterial cell is generally characterizedby four cutoff frequencies (Fig. 2b). The first results from the seriesconnection between Cpl and Rwall, while the second from the par-allel association between Rwall and Cwall. These cutoff frequencies
4 d Actu
h
stb
f
f
w
t
qtfAaHa
ft(Brpsfevtrtt(
o
tfBsAsc
2
asttto
S
wbs
cq�
32 N. Couniot et al. / Sensors an
ave little impact on the impedance modulus as they express the
light transition between Cpl and C∗out = (C−1
pl+ C−1
wall)−1
, formed byhe series association of Cwall and Cpl. We can therefore simplify theacterial spectrum with the two other cutoff frequencies:
cb,1 = 12� · Rcyt(C∗
out/2)� 1
�· (tpl + twall) · �cyt
dcyt · �0�∗r,out
(10)
cb,2 = 12� · RcytCcyt
� 12�
· �cyt
�0�r,cyt(11)
here the equivalent relative permittivity of outer shells is �∗r,out =
∗out ·
(twall
�r,wall+ tpl
�r,pl
)−1� 34 with t∗
out � tpl + twall . These cutoff fre-
uencies strongly depend on the bacterial dielectric properties, andherefore on the species. For Staphylococcus spp. (Table 1), fcb,1 andcb,2 are approximately equal to 23 MHz and 200 MHz, respectively.t relatively low frequencies (f < fcb,1), the bacterial cell behaves as
large capacitance formed by the cell wall and plasma membrane.owever, at larger frequencies, the cytoplasm dominates either in
resistive (Rcyt) or a capacitive (Ccyt) way.As we consider both the bacterial cell and the electrolyte, the
our main cutoff frequencies must be ordered to understand bac-erial effect on the global impedance. In low-conductive buffers�sol = 1.8 mS/m), the order is the following: fc,1 < fc,2 < fcb,1 < fcb,2.elow fc,1 ≈ 76 kHz, the impedance is hardly affected by the bacte-ial cell since the insulating layer screens both the DL and volumeroperties. However, large values of Cpl, Rwall and C∗
out can stilllightly modify the sensor impedance dominated by Cins. Betweenc,1 and fc,2, the conductive path through electrolyte (Rsol) is short-ned by the large bacterial capacitance Cpl or C∗
out , so that the overallolume resistance decreases. For fc,2 < f < fcb,1, the volume capaci-ance increases since the capacitive path through the electrolyte iseduced by the large bacterial capacitance C∗
out . For fcb,1 < f < fcb,2,he overall capacitance increases for the same reasons, due tohe short circuit behavior of the bacteria cell at these frequenciesf < fcb,2 < 1
2�RcytCsol). Finally, at frequencies larger than fcb,2, the
verall capacitance decreases since �r,cyt < �r,sol.For high-conductive saline buffers such as PBS (�sol = 1.8 S/m),
he order is different: fcb,1 < fc,1 < fcb,2 < fc,2. Again, belowc,1 ≈ 76 MHz, the impedance is hardly impacted by bacteria.etween fc,1 and fcb,2, bacteria have a resistive behavior thatlightly increases the whole medium resistance since �cyt < �sol.t frequencies larger than fcb,2, the bacterial capacitive behaviortill increases the overall impedance, but by reducing the mediumapacitance at f > fc,2 since �r,cyt < �r,sol.
.3. Analytical estimation of the sensitivity
In the frequency range ∈[1 kHz, 10 MHz], the sensor hardlychieves a perfect capacitive behavior since the impedance phaselightly differs from −90◦ (Fig. 2a). It is therefore recommendedo describe the sensor response in terms of the normalized admit-ance modulus ‖Y/ω‖ instead of the capacitance [3]. The sensitivityo adherent bacterial cells is then defined as the relative variationf ‖Y/ω‖, in percent:
(ω) =∣∣∣ ‖Y1(ω)‖ − ‖Y0(ω)‖
‖Y0(ω)‖∣∣∣ (12)
here Y0(ω) and Y1(ω) are the initial and final admittances,efore and after bacterial binding, respectively. The maximal
ensitivity is defined as Smax = maxω{S(ω)} and can be used to
ompare two different conditions independently of the applied fre-uency. To analytically estimate the 2D maximal sensitivity S2D
max atsol = 1.8 mS/m, several assumptions are used:
ators B 211 (2015) 428–438
• The optimal frequency f where the maximal sensitivity isachieved is assumed one order of magnitude larger than fc,2, asexperimentally proven in [3].
• The sensor impedance is dominated by the initial medium capac-itance Csol,0 � �0�r,sol
de· (Ne − 1)Ae · G at the optimal frequency, as
explained in Sections 2.1 and 2.2. Only the capacitance Cins alsoimpacts the impedance, as Cox and Clat
inscan be neglected as
explained in Section 2.1.• To estimate the solution capacitance Csol,1 in presence of
the bacterial cell, the Ne semi-planar electrodes are approxi-mated to perfect parallel conductors of thickness (te + we/2) · G,gap de and length Le, thus giving the same initial capaci-tance as Eq. (3). Furthermore, the bacteria cell is simplifiedby a square box of side deq � (dbact · √�/2), giving an identicalperturbed volume to the spherical bacteria. At the optimal fre-quency, the outer shell capacitance C∗
out dominates the bacterialdielectric behavior. The resulting solution capacitance is thenCsol,1 � �0�r,sol
de· (Ne − 1)Ae · (G + P), with P � deq
te+we/2 · 1−2Tde/deq−1+2T
with T � t∗outde
· �r,sol�∗
r,out· de
deq. The complete development is available
in Supplementary Information.
The following formula are then obtained for the initial
and final admittances: Y0(ω) � jω · (2C−1ins
+ C−1sol,0)
−1and Y1(ω) �
jω · (2C−1ins
+ C−1sol,1)
−1. Consequently, the maximal sensitivity is
approximated to:
S2Dmax �
C−1sol,0 − C−1
sol,1
2C−1ins
+ C−1sol,1
(13)
� P
G· 1
1 + 2 · G+PQ
(14)
with Q � �r,ins�r,sol
· detins
. In this work, since G � 1.28, T � 0.06, P � 0.17
and Q = 13.6, the maximal sensitivity S2Dmax is equal to 11.2%. In real-
ity, the bacterial cytoplasm resistance never perfectly shortens thesensor capacitance, so that �sol, �r,cyt, �cyt, �r,wall, �wall, �r,pl, �pl andother metric parameters can still have a slight impact.
2.4. Impact of metallic connections to IDE
Impact of passivated metallic tracks for connecting cell-substrate impedance sensors (ECIS) have already been reportedto modify the spectral impedance [27,28]. In this section, weshow that similar effects arise for interdigitated microelectrodespatterned in microfluidic channel, and contacted outside the chan-nel by electrical pads through metallic tracks (Fig. 3a). Whenlocated on the same side, the metal accesses can couple to eachother and slightly perturb the global impedance modulus and phaseat low frequency despite the large IDE capacitance, as experimen-tally shown in Fig. 3b (see Section 4 for details about experimentalprocedures). While the low-frequency capacitance is shown toincrease up to 60% due to parasitics, the increase of the impedancephase around 1 kHz expresses the more resistive behavior of theimpedance.
To explain this effect, metal accesses are modeled with twoequivalent electrical circuits (Fig. 3a). On one hand, the part coveredwith a passivation layer such as KMPR photoresist [3] for sealingand electrical isolation from the electrolyte results in a dielectricpassivation capacitance Cpass. The large distance between tracksand the small relative permittivity of the passivation material
makes Cpass dominating in series with Cins,p � Cpass and then beingneglected in parallel with Cins, Gsol or Csol. On the other hand, theunpassivated area has a similar equivalent circuit with Cins,i, Rsol,iand Csol,i as the IDE (Fig. 3a). Because the distance between access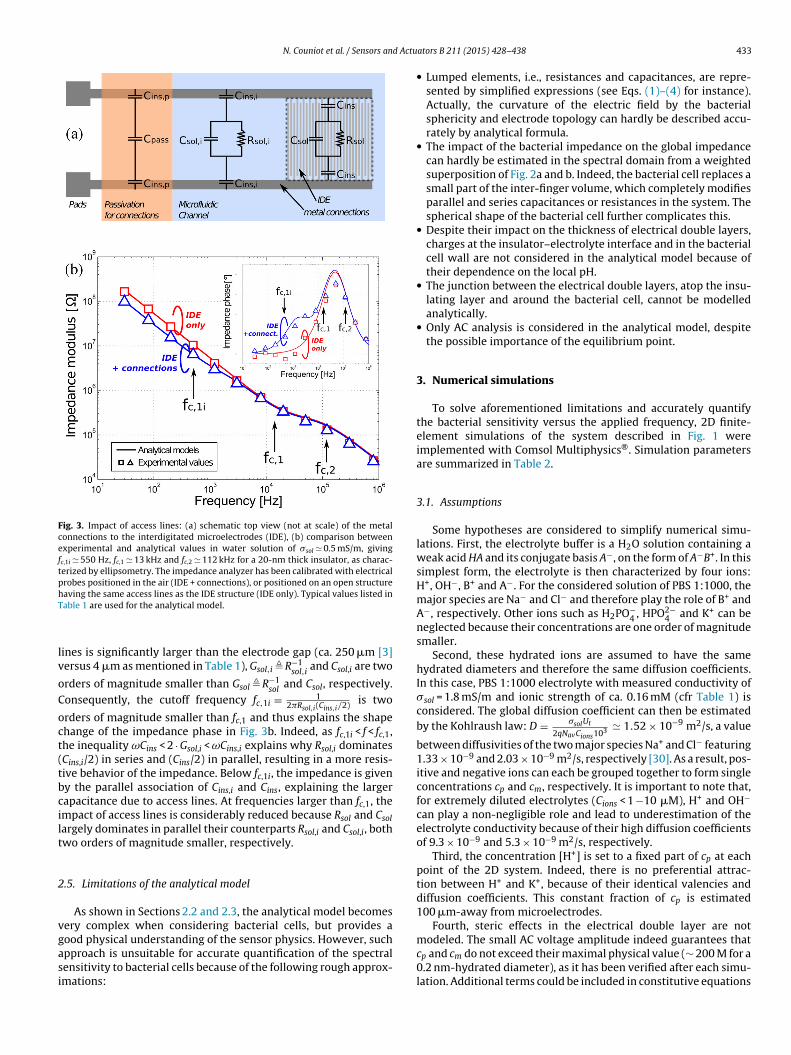
N. Couniot et al. / Sensors and Actu
Fig. 3. Impact of access lines: (a) schematic top view (not at scale) of the metalconnections to the interdigitated microelectrodes (IDE), (b) comparison betweenexperimental and analytical values in water solution of �sol � 0.5 mS/m, givingfc,1i � 550 Hz, fc,1 � 13 kHz and fc,2 � 112 kHz for a 20-nm thick insulator, as charac-terized by ellipsometry. The impedance analyzer has been calibrated with electricalprobes positioned in the air (IDE + connections), or positioned on an open structurehT
lv
oC
oct(tbcilt
2
vgasi
modeled. The small AC voltage amplitude indeed guarantees that
aving the same access lines as the IDE structure (IDE only). Typical values listed inable 1 are used for the analytical model.
ines is significantly larger than the electrode gap (ca. 250 �m [3]ersus 4 �m as mentioned in Table 1), Gsol,i � R−1
sol,iand Csol,i are two
rders of magnitude smaller than Gsol � R−1sol
and Csol, respectively.onsequently, the cutoff frequency fc,1i = 1
2�Rsol,i(Cins,i/2) is two
rders of magnitude smaller than fc,1 and thus explains the shapehange of the impedance phase in Fig. 3b. Indeed, as fc,1i < f < fc,1,he inequality ωCins < 2 · Gsol,i < ωCins,i explains why Rsol,i dominatesCins,i/2) in series and (Cins/2) in parallel, resulting in a more resis-ive behavior of the impedance. Below fc,1i, the impedance is giveny the parallel association of Cins,i and Cins, explaining the largerapacitance due to access lines. At frequencies larger than fc,1, thempact of access lines is considerably reduced because Rsol and Csolargely dominates in parallel their counterparts Rsol,i and Csol,i, bothwo orders of magnitude smaller, respectively.
.5. Limitations of the analytical model
As shown in Sections 2.2 and 2.3, the analytical model becomesery complex when considering bacterial cells, but provides aood physical understanding of the sensor physics. However, such
pproach is unsuitable for accurate quantification of the spectralensitivity to bacterial cells because of the following rough approx-mations:ators B 211 (2015) 428–438 433
• Lumped elements, i.e., resistances and capacitances, are repre-sented by simplified expressions (see Eqs. (1)–(4) for instance).Actually, the curvature of the electric field by the bacterialsphericity and electrode topology can hardly be described accu-rately by analytical formula.
• The impact of the bacterial impedance on the global impedancecan hardly be estimated in the spectral domain from a weightedsuperposition of Fig. 2a and b. Indeed, the bacterial cell replaces asmall part of the inter-finger volume, which completely modifiesparallel and series capacitances or resistances in the system. Thespherical shape of the bacterial cell further complicates this.
• Despite their impact on the thickness of electrical double layers,charges at the insulator–electrolyte interface and in the bacterialcell wall are not considered in the analytical model because oftheir dependence on the local pH.
• The junction between the electrical double layers, atop the insu-lating layer and around the bacterial cell, cannot be modelledanalytically.
• Only AC analysis is considered in the analytical model, despitethe possible importance of the equilibrium point.
3. Numerical simulations
To solve aforementioned limitations and accurately quantifythe bacterial sensitivity versus the applied frequency, 2D finite-element simulations of the system described in Fig. 1 wereimplemented with Comsol Multiphysics®. Simulation parametersare summarized in Table 2.
3.1. Assumptions
Some hypotheses are considered to simplify numerical simu-lations. First, the electrolyte buffer is a H2O solution containing aweak acid HA and its conjugate basis A−, on the form of A−B+. In thissimplest form, the electrolyte is then characterized by four ions:H+, OH−, B+ and A−. For the considered solution of PBS 1:1000, themajor species are Na− and Cl− and therefore play the role of B+ andA−, respectively. Other ions such as H2PO−
4 , HPO2−4 and K+ can be
neglected because their concentrations are one order of magnitudesmaller.
Second, these hydrated ions are assumed to have the samehydrated diameters and therefore the same diffusion coefficients.In this case, PBS 1:1000 electrolyte with measured conductivity of�sol = 1.8 mS/m and ionic strength of ca. 0.16 mM (cfr Table 1) isconsidered. The global diffusion coefficient can then be estimatedby the Kohlraush law: D = �solUt
2qNavCions103 � 1.52 × 10⁻⁹ m2/s, a value
between diffusivities of the two major species Na+ and Cl− featuring1.33 × 10−9 and 2.03 × 10⁻⁹ m2/s, respectively [30]. As a result, pos-itive and negative ions can each be grouped together to form singleconcentrations cp and cm, respectively. It is important to note that,for extremely diluted electrolytes (Cions < 1 −10 �M), H+ and OH−
can play a non-negligible role and lead to underestimation of theelectrolyte conductivity because of their high diffusion coefficientsof 9.3 × 10⁻⁹ and 5.3 × 10⁻⁹ m2/s, respectively.
Third, the concentration [H+] is set to a fixed part of cp at eachpoint of the 2D system. Indeed, there is no preferential attrac-tion between H+ and K+, because of their identical valencies anddiffusion coefficients. This constant fraction of cp is estimated100 �m-away from microelectrodes.
Fourth, steric effects in the electrical double layer are not
cp and cm do not exceed their maximal physical value (∼ 200 M for a0.2 nm-hydrated diameter), as it has been verified after each simu-lation. Additional terms could be included in constitutive equations
4 d Actu
tm
enipuoac
pom
vrcla
3
ecopa
�
c
c
wcA2t∇tpt
I
v
scsi
ptaP
0
J
J
p
34 N. Couniot et al. / Sensors an
o model steric effects, but the formulation would then becomeore intricate.Fifth, only one pair of electrodes are simulated (Fig. 1). Coupled
ffects between non-adjacent electrodes and access lines are thuseglected. These two effects have slight impact on the complex
mpedance (see Section 2.4), but do not constitute the key sensingart as discussed in Section 4. Another geometric feature is thepper and bottom boundary layers of the electrolyte and buriedxide, which are connected to ground and located 100 �m abovend 50 �m below electrodes, respectively, to mimic experimentalonditions [3].
Six, the insulator material is assumed to be an oxide and morerecisely Al2O3 as in [3]. It does not change the dielectric behaviorf the system, but the surface charges of oxide materials can beodelled more easily.Finally, the system is assumed linear because of the small
oltage amplitude (Va < Ut) used in simulations [23], which is rep-esentative to those used in experimental works [3,31,32]. In thisase, the electrical double layer has a linear dependence with theocal potential, contrasting with non-linearity properties reportedt large AC voltages [33].
.2. Constitutive equations
Three variables characterize the system depicted in Fig. 1: thelectrical potential �, the positively and negatively charged ion con-entrations cp and cm, respectively. They are expressed as the sumf the electrostatic and AC terms, the latter being expressed as ahasor thanks to the system linearity and the sinusoidal voltagepplied on electrodes:
= �0 + �a × R{ejωt} (15)
p = cp0 + cpa × R{ejωt} (16)
m = cm0 + cma × R{ejωt} (17)
here subscripts 0 and a stand for DC and AC, respectively. Onceonstitutive equations are solved for �, cp and cm in equilibrium andC regimes, the total current density is extracted at each point of theD system. The conduction current density is given by Jc = � · E ifhe medium conductivity � is known, or by the continuity equation
· Jc = −∂v/∂t otherwise. For the displacement current density,he Maxwell formulation gives Je = jω� · E, with � the local mediumermittivity. By integrating Je on the electrode–oxide interface, theotal current I through the electrode is obtained:
= Ia · R{ejωt} (18)
The impedance is then computed as Z = Va/Ia, where Va is the AColtage amplitude applied on microelectrodes.
Different constitutive equations with �, cp and cm must be con-idered for each medium and additional inputs must sometimes beonsidered, e.g., the surface and space charges. The following sub-ections summarize equations that are used for the different median Fig. 1.
Conductive and dielectric media. They are characterized by a fixedermittivity � and conductivity �. The concerned media in Fig. 1 arehe insulator layer, the buried oxide layer, the bacterial cytoplasmnd plasma membrane. The electrical potential is described by theoisson equation:
= ∇ · ((� + jω�)∇�) (19)
c = −� · ∇� (20)
e = −jω� · ∇�a (21)
Electrolyte and bacterial cell wall. In this case, the mobility ofositively and negatively charged ions intrinsically determines the
ators B 211 (2015) 428–438
electrical conductivity �. For the ion-penetrable bacterial cell wall,the ionic diffusion coefficient is assumed 40% of the one of thesurrounding electrolyte [26]. The ion transport is described by theNernst–Planck equation [20,34,35]:
∂cp,m
∂t= ∇ ·
(D∇cp,m ± D
Ut· cp,m∇�
)(22)
where the negative sign holds only for negatively charged ions (i.e.cm). Four equations are obtained by rewriting these equations atequilibrium (Eq. (23)) and in AC regime (Eq. (24)):
0 = ∇ ·(
∇cp0,m0 ± cp0,m0 · ∇�0
Ut
)(23)
jωcpa,ma
D= ∇ ·
(∇cpa,ma ± cpa,ma · ∇�0
Ut± cp0,m0 · ∇�a
Ut
)(24)
Thanks to the small applied voltage amplitude, the 2nd-order
term cpa,ma · ∇�aUt
· ej2ωt can be neglected and is therefore notincluded in Eq. (23). The electrical potential in DC and AC is obtainedthrough the Poisson equation knowing that v = v0 + va · R{ejωt}with v0 = cp0 − cm0 and va = cpa − cma:
∇ · (−�∇�0,a) = qNav · (cp0,a − cm0,a) (25)
For the current densities, Je has the typical formulation while Jcis obtained by combining ∇ · Jc = −jωva with Eq. (24):
Jc = −qDNav ·(
∇(cpa − cma) + (cpa + cma) · ∇�0
Ut+ (cp0 + cm0) · ∇�a
Ut
)(26)
Je = −jω� · ∇�a (27)
Insulator–electrolyte interface. As explained in Section 3.1, theinsulator material is assumed to be an oxide. Hydroxyl groups atthe insulator–electrolyte interface are subject to protonation ordeprotonation, depending on the local pH value, according to thefollowing chemical reactions [29]:
AOH � AO− + H+ (with Ka) (28)
AOH � AOH+2 + OH− (with Kb) (29)
where Ka � [AO−][H+]/[AOH] and Kb � [AOH+2 ][OH−]/[AOH] are the
corresponding dissociation constants with values for Al2O3 givenin Table 2. Affecting DC and AC ion distributions through Eqs.(23)–(25), the surface charge is thus given by [29]:
�s = qNs ·(
Kb[H+]2 − KaKW
KaKW + KW [H+] + Kb[H+]2
)(30)
Bacterial charge. In most electrolytes, the bacterial cell wall ofGram-positive bacteria is typically negatively charged due to proto-nation or deprotonation of carboxyle, phosphate and amine groupsin the peptidoglycan layer, as expressed by the following chemicalreactions:
HA1 + H2O � A−1 + H3O+ (with Ns1, Ka1) (31)
B2 + H3O+ � HB+2 + H2O (with Ns2, Ka2) (32)
where HA1 andB 2 are anionic and cationic groups, respectively, Ns1and Ns2 the corresponding group densities and Ka1 and Ka2 theirrespective dissociation constants. Uniformly distributed in the cellwall volume because of its ion penetrability, the bacterial charge ischaracterized by a space charge density impacting DC and AC iondistributions through Eqs. (23)–(24) [25]:
v,b = 1twall
·
⎛⎝∑
i
−qNsiKai
Kai + [H+]+
∑j
qNsj[H+]
Kaj + [H+]
⎞⎠ (33)
N. Couniot et al. / Sensors and Actu
Fc
c
3
fvmpiem
iltifi
1
2
3
sd
4
acta
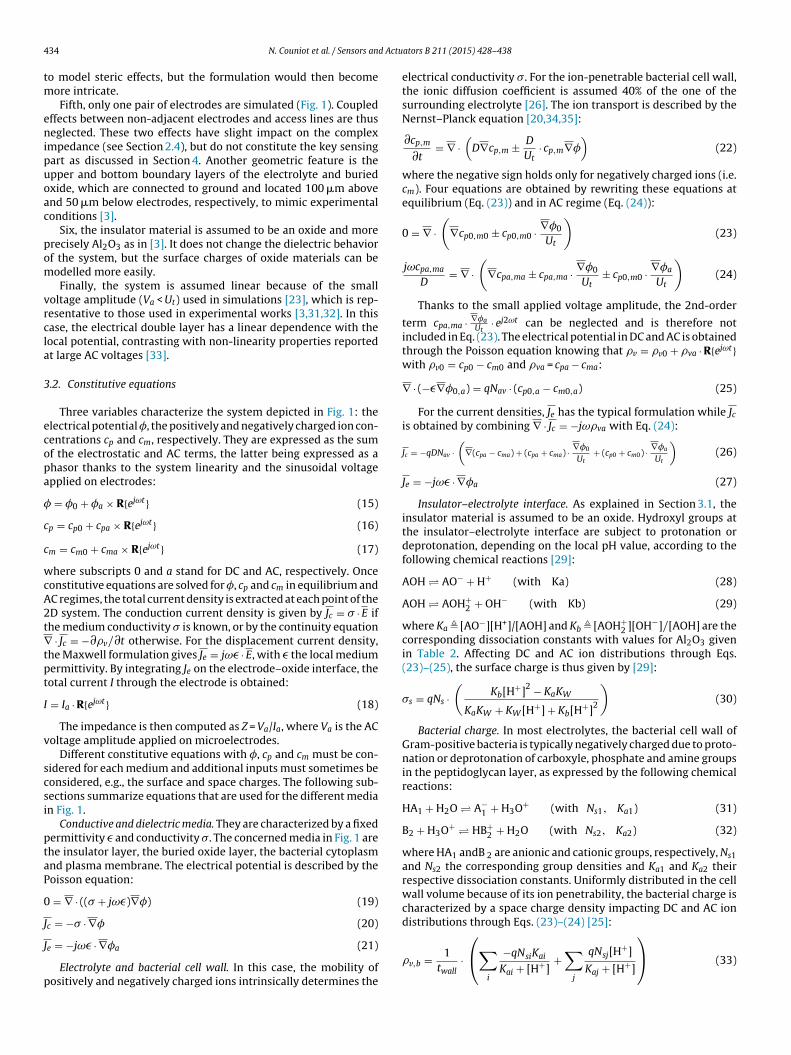
ig. 4. Convergence issue between the oxide surface charge �s and the local pHlose to the electrode in the electrolyte.
The same method can be used for Gram-negative bacteria byonsidering their ionic groups on the outer membrane [25].
.3. Convergence issues
The mesh is strongly refined at the insulator–electrolyte inter-ace (∼0.1 nm), since the electrical double layer can reach very smallalues (∼ nm) in saline buffers. To limit the number of nodes in theicrometer-sized system, we use the “boundary layer mesh” tool
rovided by Comsol Multiphysics®. The mesh error on the extractedmpedance and sensitivity decreased with smaller mesh sizes asxpected (data not shown) and is estimated to 0.01% for the chosenesh configuration.The consideration of the insulator surface charge �s can result
n convergence difficulties. Indeed, as the local pH decreases (i.e.arger local [H+]), �s increases following Eq. (30), but positive ions inhe electrolyte such as H+ are then more repulsed at the same time,ncreasing the local pH. The solver can therefore exhibit difficultiesor converging. To address this problem, a bisection method wasmplemented according to the following steps (Fig. 4):
. The initial pH interval is defined as [pH1; pH2] = [pHsol; PZCins],where pHsol the electrolyte pH and PZCins is the point zero ofcharge of the insulator.
. The system is solved by imposing the �s that correspondsto pH2 (see Eq. (30)). The local pH, denoted pHloc at theinsulator–electrolyte interface, is then extracted.
. If |pH2/pHloc − 1| < 0.1%, the system has converged. If not, a newpH value (w · pH2+pH1)/(w + 1) is computed by defining w asa weight factor, and attributed to pH2 if pHloc> pH2 or to pH1otherwise. The algorithm then goes on at Eq. (2), by using themodified pH value (either pH1 or pH2) for �s computation.
With the simulation framework now completely defined, theimulation results are compared to experimental and analyticalata in the next section.
. Matching with experimental data
The experimental procedures, protocols and electrode design
re detailed in our previous work [3]. Briefly, 250 �m-diameterircular-shape interdigitated microelectrodes consisting of 1 �m-hick, 2 �m-wide and 4 �m-spaced Al fingers covered by 33 nm oftomic layer deposited (ALD)-Al2O3 were fabricated in cleanroomators B 211 (2015) 428–438 435
facilities. A 300 �m-thick microfluidic channel was used to flowsolutions at a 0.5 �L/min flow rate. The impedance modulus andphase were recorded at 50 mV amplitude from 100 Hz to 1 MHzby an impedance analyzer (Agilent LCR4284A). An open calibra-tion was performed with electrical probes 250 �m above the IDEpads to remove parasitic capacitances of BNC cables. For the prepa-ration of the bacterial sample following the overnight culture, S.epidermidis ATCC35984 was resuspended in PBS 1:1000 using threesuccessive centrifugation steps and the number of viable cells wassubsequently estimated to 109 CFU/mL by using agar plates. Duringmeasurements of the capacitive biosensor, real-time observationof the sensor surface was performed using an inverted microscopeand enabled precise estimation of the bacterial surface coverage.
In the two following subsections, the normalized admittance‖Y/ω‖ and sensitivity S(ω) defined in Section 2.3 are obtainedanalytically, numerically and experimentally and a comparisonbetween each case is provided. It is important to note that pre-viously defined figures of merit obtained by 2D analytical modelsand simulations are not strictly representative of those experimen-tally obtained in 3D, since the 2D system in Fig. 1 assumes that thebacterial cell spans infinitely along the third dimension. To enablethe comparison between 2D and 3D figures of merit, the normalizedadmittance at 1 MHz and the maximum sensitivity are equalized byusing a factor K evaluated in next subsections and shown realisticwith regards to theoretical approximations.
4.1. Naked sensor in sterile PBS 1:1000
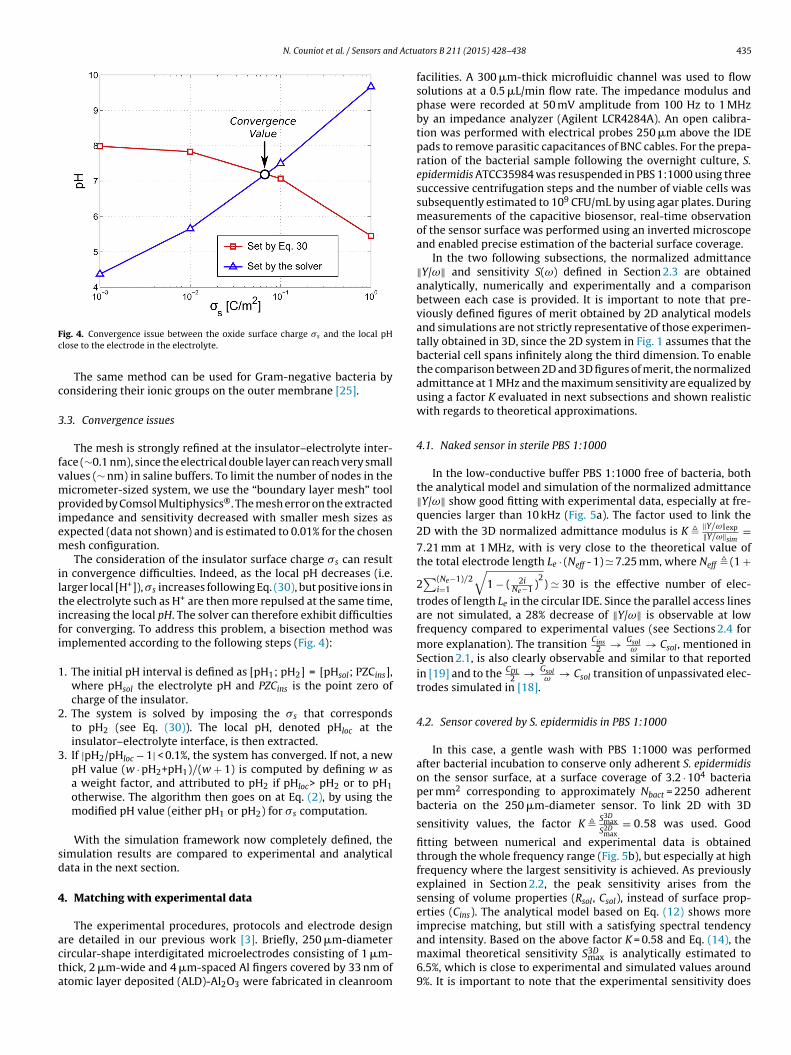
In the low-conductive buffer PBS 1:1000 free of bacteria, boththe analytical model and simulation of the normalized admittance‖Y/ω‖ show good fitting with experimental data, especially at fre-quencies larger than 10 kHz (Fig. 5a). The factor used to link the2D with the 3D normalized admittance modulus is K � ‖Y/ω‖exp
‖Y/ω‖sim=
7.21 mm at 1 MHz, with is very close to the theoretical value ofthe total electrode length Le · (Neff - 1) � 7.25 mm, where Neff � (1 +2∑(Ne−1)/2
i=1
√1 − ( 2i
Ne−1 )2) � 30 is the effective number of elec-
trodes of length Le in the circular IDE. Since the parallel access linesare not simulated, a 28% decrease of ‖Y/ω‖ is observable at lowfrequency compared to experimental values (see Sections 2.4 formore explanation). The transition Cins
2 → Gsolω → Csol , mentioned in
Section 2.1, is also clearly observable and similar to that reportedin [19] and to the CDL
2 → Gsolω → Csol transition of unpassivated elec-
trodes simulated in [18].
4.2. Sensor covered by S. epidermidis in PBS 1:1000
In this case, a gentle wash with PBS 1:1000 was performedafter bacterial incubation to conserve only adherent S. epidermidison the sensor surface, at a surface coverage of 3.2 · 104 bacteriaper mm2 corresponding to approximately Nbact = 2250 adherentbacteria on the 250 �m-diameter sensor. To link 2D with 3D
sensitivity values, the factor K � S3Dmax
S2Dmax
= 0.58 was used. Good
fitting between numerical and experimental data is obtainedthrough the whole frequency range (Fig. 5b), but especially at highfrequency where the largest sensitivity is achieved. As previouslyexplained in Section 2.2, the peak sensitivity arises from thesensing of volume properties (Rsol, Csol), instead of surface prop-erties (Cins). The analytical model based on Eq. (12) shows moreimprecise matching, but still with a satisfying spectral tendency
and intensity. Based on the above factor K = 0.58 and Eq. (14), themaximal theoretical sensitivity S3Dmax is analytically estimated to6.5%, which is close to experimental and simulated values around9%. It is important to note that the experimental sensitivity does

436 N. Couniot et al. / Sensors and Actuators B 211 (2015) 428–438
Fig. 5. Spectral comparison between analytical model, numerical simulations andexperimental data for (a) the modulus of the normalized admittance in PBS 1:1000without bacterial cells with an adjusting factor K between 2D and 3D equal to7.21 mm and (b) the sensitivity to bacterial cells in PBS 1:1000 with a bacterial sur-face coverage of 3.2 × 10⁴ S. epidermidis per mm2, with an adjusting factor K between2D and 3D equal to 0.58. Details of this experimental procedure with bacterial cellsis
nscbvp
cntvRcscrWi
s available in [3]. Parameter values listed in Table 1 are used for analytical models,imulations and experimental procedures.
ot present the bump around 10 kHz predicted by models andimulations, which is related to the slight impedance increaseaused by Rwall in series with Cins. This discrepancy can be explainedy the larger bacterial space charges in reality, impacting the Rwallalue and reducing the related sensitivity as detailed in the nextaragraph.
The impact of oxide surface charges �s and bacterial spaceharges v,b on the sensor impedance and bacterial sensitivity ison-negligible on figures of merit. In PBS 1:1000, ‖Y/ω‖ is showno slightly increase at f < 100 kHz because of the larger Cins pro-ided by �s and more strongly around 10 kHz because of the lowerwall value due to v,b (see Supplementary information). The DLapacitance CDL also slightly increases since the Debye length �D ishortened by larger charge repulsion. At higher frequencies, theharges do not impact ‖Y/ω‖, as expected from previous works
eporting the impact of DNA charges only at low frequency in [35].hen considering the sensitivity S(ω), the bump around 10 kHzs drastically lowered by v,b because of the smaller influence of
Fig. 6. Impact of oxide surface charges �s (see Eq. (30)) and bacterial space chargesv,b (see Eq. (33 ) on the bacterial sensitivity S(ω). The 2D simulations were adjustedto 3D with K = 0.58, similarly to Fig. 5. Typical values listed in Table 1 are used.
Rwall in series with Cins (Fig. 6). It is slightly compensated by oxidecharges �s that increase Cins. At larger frequencies (>100 kHz), thebacterial space charges v,b increase the value of C∗
out , which isbeneficial for the bacterial sensitivity since the medium resistivepath is more perfectly shortened. This charge analysis should beidentical for Gram-negative bacteria, as similar space charge den-sity can be quantified in the outer ion-penetrable layer [25].
5. Conclusion
In this paper, we have proposed a comprehensive study of capac-itive biosensors in presence of bacterial cells. An analytical modelhas first been established to qualitatively and semi-quantitativelyunderstand how the impedance modulus and phase behaves spec-trally in electrolytes with and without bacterial cells. The largesensitivity to bacterial cells was shown to be due to the lowcytoplasmic resistance that shortens electric field lines and there-fore increases the global capacitance between electrodes. Themaximal theoretical sensitivity to bacteria and the impact ofaccess lines has also been investigated by this method. To providea more accurate quantitative analysis of the maximal sensitiv-ity, 2D finite-element simulations have been developed basedon the Poisson–Nernst–Planck equation, accounting for complexphenomena such as ion distribution, charge effects and dielec-tric repartition. The simulation results were shown to accuratelyfit experimental data, and highlight the impact of bacterial spacecharge and oxide surface charge on the impedance and sensitiv-ity. In conclusion, this work provides the necessary analytical andnumerical material to fully understand and optimize capacitivebiosensing of bacterial cells.
Acknowledgments
N. Couniot is F.R.S. – FNRS Research Fellow. The authors thankO. Poncelet for the atomic layer deposition of Al2O3 and T.Vanzieleghem for help with bacterial handling.
Appendix A. Supplementary Data
Supplementary data associated with this article can be found, inthe online version, at http://dx.doi.org/10.1016/j.snb.2015.01.108.
References
[1] V. Tsouti, C. Boutopoulos, I. Zergioti, S. Chatzandroulis, Capacitive microsystemsfor biological sensing, Biosens. Bioelectron. 27 (1) (2011) 1–11.
d Actu
[
[
[
[
[
[
[
[
[
[
[
[
[
[
[
[
[
[
[
[
[
[
[
[
[
[
N. Couniot et al. / Sensors an
[2] M. Varshney, Y. Li, Interdigitated array microelectrodes based impedancebiosensors for detection of bacterial cells, Biosens. Bioelectron. 24 (10) (2009)2951–2960.
[3] N. Couniot, T. Vanzieleghem, J. Rasson, N. Van Overstraeten-Schlöge, O. Pon-celet, J. Mahillon, L. Francis, D. Flandre, Lytic enzymes as selectivity meansfor label-free, microfluidic and impedimetric detection of whole-cell bacte-ria using ALD-Al2O3 passivated microelectrodes, Biosens. Bioelectron. (2015),http://dx.doi.org/10.1016/j.bios.2014.07.084 (in press).
[4] A. Romani, N. Manaresi, L. Marzocchi, G. Medoro, A. Leonardi, L. Altomare,M. Tartagni, R. Guerrieri, Capacitive sensor array for localization of biopar-ticles in CMOS lab-on-a-chip, in: 2004 IEEE International Solid-StateCircuits Conference (ISSCC), 2004. Digest of Technical Papers, IEEE, 2004,pp. 224–225.
[5] S.B. Prakash, P. Abshire, On-chip capacitance sensing for cell monitoring appli-cations, IEEE Sens. J. 7 (3) (2007) 440–447.
[6] E. Ghafar-Zadeh, M. Sawan, V.P. Chodavarapu, T. Hosseini-Nia, Bacteria growthmonitoring through a differential CMOS capacitive sensor, IEEE Trans. Biomed.Circuits Syst. 4 (4) (2010) 232–238.
[7] A.-Y. Chang, M.S.C. Lu, A CMOS magnetic microbead-based capacitive biosen-sor array with on-chip electromagnetic manipulation, Biosens. Bioelectron. 45(2013) 6–12.
[8] N. Couniot, D. Bol, L.A. Poncelet, D. Francis, D.A. Francis, A capacitance-to-frequency converter with on-chip passivated microelectrodes for bacteriadetection in saline buffers up to 575 MHz, IEEE Trans. Circuits Syst. II (2015),http://dx.doi.org/10.1109/TCSII.2014.2369111 (in press).
[9] American Academy of Microbiology, Bringing the Lab to the Patient, 2012, pp.1–24.
10] E. Boubour, R.B. Lennox, Insulating properties of self-assembled monolayersmonitored by impedance spectroscopy, Langmuir 16 (9) (2000) 4222–4228.
11] C. Christensen, R. de Reus, S. Bouwstra, Tantalum oxide thin films as protectivecoatings for sensors, J. Micromech. Microeng. 9 (2) (1999) 113.
12] A. Hierlemann, U. Frey, S. Hafizovic, F. Heer, Growing cells atop microelectronicchips: interfacing electrogenic cells in vitro with CMOS-based microelectrodearrays, Proc. IEEE 99 (2) (2011) 252–284.
13] C. Jungreuthmayer, G.M. Birnbaumer, J. Zanghellini, P. Ertl, 3D numericalsimulation of a lab-on-a-chip – increasing measurement sensitivity of inter-digitated capacitors by passivation optimization, Lab Chip 11 (7) (2011)1318.
14] W. Olthuis, W. Streekstra, P. Bergveld, Theoretical and experimental determina-tion of cell constants of planar-interdigitated electrolyte conductivity sensors,Sens. Actuators B: Chem. 24 (1–3) (1995) 252–256.
15] P. Van Gerwen, W. Laureyn, W. Laureys, G. Huyberechts, M. Op De Beeck, K.Baert, J. Suls, W. Sansen, P. Jacobs, L. Hermans, R. Mertens, Nanoscaled inter-digitated electrode arrays for biochemical sensors, Sens. Actuators B: Chem. 49(1998) 73–80.
16] N. Couniot, D. Flandre, L.A. Francis, A. Afzalian, Signal-to-noise ratio optimiza-tion for detecting bacteria with interdigitated microelectrodes, Sens. ActuatorsB: Chem. 189 (2013) 43–51.
17] M. Webster, I. Timoshkin, S. MacGregor, M. Mattey, Computer aided mod-elling of an interdigitated microelectrode array impedance biosensor forthe detection of bacteria, IEEE Trans. Dielectr. Electr. Insul. 16 (5) (2009)1356–1363.
18] T.T. Ngo, H. Shirzadfar, D. Kourtiche, M. Nadi, A planar interdigital sensor for bio-impedance measurement: theoretical analysis, optimization and simulation, J.Nano Electron. Phys. 6 (1) (2014) 01011.
19] F. Pittino, L. Selmi, F. Widdershoven, Numerical and analytical models toinvestigate the AC high-frequency response of nanoelectrode/SAM/electrolytecapacitive sensing elements, Solid-State Electron. 88 (2013) 82–88.
20] F. Pittino, L. Selmi, Use and comparative assessment of the CVFEM methodfor Poisson–Boltzmann and Poisson–Nernst–Planck three dimensional simula-tions of impedimetric nano-biosensors operated in the DC and AC small signalregimes, Comput. Methods Appl. Mech. Eng. 278 (2014) 902–923.
21] F. Pittino, P. Palestri, P. Scarbolo, D. Esseni, L. Selmi, Solid-State Electronics,Solid-State Electron. 98 (2014) 63–69.
22] A. Sanchis, A.P. Brown, M. Sancho, G. Martínez, J.L. Sebastián, S. Mu noz, J.M.Miranda, Dielectric characterization of bacterial cells using dielectrophoresis,Bioelectromagnetics 28 (5) (2007) 393–401.
23] G. Barbero, A.L. Alexe-Ionescu, I. Lelidis, Significance of small voltage inimpedance spectroscopy measurements on electrolytic cells, J. Appl. Phys. 98(11) (2005) 113703.
24] A. Hassibi, R. Navid, R.W. Dutton, T.H. Lee, Comprehensive study of noise pro-cesses in electrode electrolyte interfaces, J. Appl. Phys. 96 (2) (2004) 1074.
25] A. Poortinga, R. Bos, W. Norde, Electric double layer interactions in bacterialadhesion to surfaces, Surf. Sci. Rep. 47 (1) (2002) 1–32.
26] A. van der Wal, M. Minor, W. Norde, A. Zehnder, J. Lyklema, Conductivity anddielectric dispersion of Gram-positive bacterial cells, J. Colloid Interface Sci. 186(1) (1997) 71–79.
27] A.R. Abdur Rahman, D.T. Price, S. Bhansali, Effect of electrode geometry on theimpedance evaluation of tissue and cell culture, Sens. Actuators B: Chem. 127(1) (2007) 89–96.
28] D.T. Price, A.R.A. Rahman, S. Bhansali, Design rule for optimization of micro-
electrodes used in electric cell–substrate impedance sensing (ECIS)., Biosens.Bioelectron. 24 (7) (2009) 2071–2076.29] R. Van Hal, J. Eijkel, P. Bergveld, A general model to describe the electrostaticpotential at electrolyte oxide interfaces, Adv. Colloid Interface Sci. 69 (1–3)(1996) 31–62.
ators B 211 (2015) 428–438 437
30] M. Flury, T.F. Gimmi, 6.2 Solute Diffusion, Methods of Soil Analysis: Part 4Physical Methods, 2002, pp. 1323–1351.
31] O. Laczka, E. Baldrich, F.X. Munoz, F.J. del Campo, Detection of Escherichia coliand Salmonella typhimurium using interdigitated microelectrode capacitiveimmunosensors: the importance of transducer geometry, Anal. Chem. 80 (19)(2008) 7239–7247.
32] L. Yang, Electrical impedance spectroscopy for detection of bacterial cellsin suspensions using interdigitated microelectrodes, Talanta 74 (5) (2008)1621–1629.
33] L. Højgaard Olesen, M. Bazant, H. Bruus, Strongly nonlinear dynamics of elec-trolytes in large ac voltages, Phys. Rev. E 82 (1) (2010) 011501.
34] M.Z.M. Bazant, K.K. Thornton, A.A. Ajdari, Diffuse-charge dynamics in electro-chemical systems, Phys. Rev. E: Stat. Nonlinear Soft Matter Phys. 70 (2 Pt 1)(2004) 021506.
35] F. Pittino, F. Passerini, L. Selmi, F. Widdershoven, Numerical simulation of theposition and orientation effects on the impedance response of nanoelectrodearray biosensors to DNA and PNA strands, Microelectron. J. 45 (12) (2014)1695–1700.
Biographies
Numa Couniot was born in Charleroi, Belgium, in 1988. He received the ElectricalEngineer degree from the Université catholique de Louvain (UCL), Louvain-la-Neuve,Belgium, in 2011. Since then, he joined the Institute of Information and Communi-cation Technologies, Electronics and Applied Mathematics (ICTEAM), at the UCL,where he is currently pursuing a Ph.D. degree granting by the Fond national de larecherche scientifique (FNRS). His doctoral research focuses on the modeling, opti-mization and characterization of fundamental bioelectronics interactions in orderto optimize the design of integrated biosensor microarrays.
Aryan Afzalian was born in Ottignies, Belgium in 1977. He received the Electrome-chanical Engineer degree and the Ph.D. degree from the Université catholique deLouvain (UCL), Louvain-La-Neuve, Belgium, in 2000, and 2006, respectively. Dur-ing his Ph.D., he was working on the modeling, optimization and characterizationof SOI integrated optical sensors and analog circuits. From 2006 to 2009 he wasa Postdoctoral Research Fellow at Tyndall National Institute, Cork, Ireland, wherehe worked on modeling quantum transport (development of quantum simulatorsbased on the NEGF formalism) in advanced Silicon nanoscale devices, such as SOInanowires and new quantum enhanced architectures such as Resonant tunnelingFETs. He is currently “Chargé de recherche” FNRS with UCL, Belgium, working onmodeling quantum transport in advanced Silicon and alternative channel materials(III–V, Ge, Graphene) nanoscale devices for electronics and bio-electronics applica-tions. Dr. Afzalian has authored or co-authored about 80 technical publications ininternational conferences, journals and books and holds two patents. He is the recip-ient of the 2001 AILV award for his master thesis work on SOI image sensors, andof the 2009 UCC Invention of the year awards for his work on Resonant TunnelingFETs. He also serves as a reviewer for various journal and conferences such as IEEETrans. on Electron Devices, IEEE Trans. on Nanotechnology, Solid-State-Electronicsor IEEE Electron Device Letters.
Nancy Van Overstraeten-Schlögel was born in 1975. She lives in Belgium where sheearned the degree of bioengineer in chemistry and bioindustries from the Univer-sité catholique de Louvain. She completed her education by a master and a Ph.D.in biomedical sciences from the faculty of medicine of the University of Liège.She applied the multidisciplinary approach to postdoctoral scientific projects infundamental and applied research or in development. Her career focuses on theimprovement of the human health through the integration of innovative tech-nologies in ambitious scientific projects. Her most recent endeavour is in thedevelopment of biomedical applications to microelectronic biosensors for creatingnew diagnostic tools.
Laurent A. Francis was born in Louvain-la-Neuve in 1978. He received the M.Eng.degree in materials science and the Ph.D. degree in applied sciences from UCLin 2001 and 2006, respectively. Since September 2007, he holds the Microsys-tems Chair position at UCL as associate professor. His Ph.D. thesis was relatedto acoustic-wave based microsystems for biosensing applications and resultedfrom collaboration between the department of materials science of UCL and IMEC(Interuniversitary MicroElectronics Center) in Leuven. Between 2000 and 2007he was with IMEC as researcher, successively in the Biosensors and RF-MEMSgroups. His scientific interests are related to thin films integration for microsys-tems components (mainly piezoelectric and diamond-like materials), acousticsensors, bio-inspired approaches, extreme miniaturization and device packag-ing. He is regular member of IEEE and of the UCL Alumni. He has authored orco-authored 60 scientific publications in international journals and holds onepatent.
Denis Flandre was born in Charleroi, Belgium, in 1964. He received the ElectricalEngineer degree, the Ph.D. degree and the Post-doctoral thesis degree from the Uni-versité catholique de Louvain (UCL), Louvain-la-Neuve, Belgium, in 1986, 1990 and1999, respectively. His doctoral research was on the modeling of silicon-on-insulator
(SOI) MOS devices for characterization and circuit simulation, and his Post-doctoralthesis on a systematic and automated synthesis methodology for MOS analog cir-cuits. Since 2001, he is a full-time Professor at UCL. He is currently involved inthe research and development of SOI MOS devices, digital and analog circuits aswell as sensors and MEMS, for special applications, more specifically high-speed,
4 d Actu
laotog
38 N. Couniot et al. / Sensors an
ow-voltage low-power, microwave, rad-hard and high-temperature electronics
nd micro-systems. He has authored or co-authored more than 800 technical papersr conference contributions. He holds 10 patents. Prof. Flandre was the recipient ofhe 1992 Biennial Siemens-FNRS Award for an original contribution in the fieldsf electricity and electronics, of a 1997 Wernaers Award for innovation in peda-ogical presentation of advanced research work, and of the 1999 SCK-CEN Prof.ators B 211 (2015) 428–438
Roger Van Geen Prize for innovation in nuclear science instrumentation. He partici-
pated in many short courses on SOI technology in universities, industrial companiesand conferences, as well as organized and lectured several Eurotraining courses onSOI technology, devices and circuits. Prof. Flandre is a co-founder of CISSOID S.A.,a start-up company, which spun-off of UCL in 2000, focusing on SOI circuit designservices.
Related Documents