1 Capital Markets To help to finance Companies 1. Annual Working Capital increases = $ 150 Billion 2. Annual Capital Expenditures “CAPEX” = $ 900 Billion = $ 1,050 Billion Source of funds: 1. Annual Earnings = ($ 800 Billion) GAP $ 250 Billion 2. Need to Issued New Debt ($ 250 Billion) Or Issue new Shares of Equity = $ 0

Welcome message from author
This document is posted to help you gain knowledge. Please leave a comment to let me know what you think about it! Share it to your friends and learn new things together.
Transcript

1
Capital MarketsCapital Markets
To help to finance Companies1. Annual Working Capital increases = $ 150 Billion
2. Annual Capital Expenditures “CAPEX” = $ 900 Billion
= $ 1,050 Billion
Source of funds:1. Annual Earnings = ($ 800 Billion)
GAP $ 250 Billion
2. Need to Issued New Debt ($ 250 Billion)
Or Issue new Shares of Equity = $ 0

2
The Role of Capital MarketsThe Role of Capital Markets
Three Principal Functions
Economic Function: facilitate the transfer of money between savers and borrowers.
Continuous Price Function: provides a liquid market where prices are available moment to moment.
Fair Pricing Function

3
Financial InstrumentsFinancial Instruments
Money Market Certificates of Deposit U.S. Treasury Bills Money Market Funds
Bond Market U.S Treasury Notes and
Bonds U.K. Gilts and Consols Municipal Bonds Corporate Bonds
Equity Market Common Stock Preferred Stock
Derivative Market Options Futures
Other Swaps Pass-throughs

4
From Stock Prices to Stock ReturnsFrom Stock Prices to Stock Returns
Stock Returns: take into account both price changes and dividend income
Over past 50 years, stock returns have ranged from:
+48.28% in 1954 to
-21.45% in 1974
Stock returns over past 50 years have averaged around 11%
From 1998 through mid-’03, DJIA averaged 1.7%

5

6
DJIA annual Returns since 2003DJIA annual Returns since 2003
2003 8341.63 10453.92 2112.29 25.32%
2004 10453.92 10783.01 329.09 3.15%
2005 10783.01 10717.50 -65.51 -0.61%
2006 10717.50 12463.15 1745.65 16.29%
2007 12463.15 13264.82 801.67 6.43%
2008 13264.82 8776.39 -4488.43 -33.84%
2009 8776.39 10428.05 1651.66 18.82%
2010 10428.05 11577.51 1149.46 11.02%
2011 11577.51 12217.56 640.05 5.53%
2012 12217.56 13104.14 886.58 7.26%
Average 5.95% Standard Deviation 16.02%

7
Advantages of Stock OwnershipAdvantages of Stock Ownership
1. Provide opportunity for higher returns than bonds.
2. Over past 50 years, stocks averaged 11% and high-grade corporate bonds averaged 6%.
3. Good inflation hedge since returns typically exceed the rate of inflation.
4. Easy to buy and sell stocks.5. Price and market information is easy to find in financial media.
6. Unit cost per share of stock is lower than for bonds.

8
Disadvantages of Stock OwnershipDisadvantages of Stock Ownership
Stocks are subject to many different kinds of risk: Business risk Financial risk Market risk Event risk
Difficult to predict which stocks will go up in value due to wide swings in profits and general stock market performance
Low current income – Dividends - compared to other investment alternatives

9
Current Income from Stocks versus BondsCurrent Income from Stocks versus Bonds

10
Common Stock ValuesCommon Stock Values
Market Capitalization: the overall current value of the company in the stock market Total number of shares outstanding multiplied by the market
value per share
Investment Value: the amount that investors believe the stock should be trading for, or what they think it’s worth Probably the most important measure for a stockholder

11
Types of StockTypes of Stock
Blue Chip Stocks: financially strong, high-quality stocks with long and stable records of earnings and dividends Companies are leaders in their industries Relatively lower risk due to financial stability
of company Popular with investing public looking for steady growth
potential, perhaps dividend income Provide shelter during unsettled markets Examples: Wal-Mart, Proctor & Gamble, Microsoft, United
Parcel Service, Pfizer and 3M Company

12
Types of Stock (cont’d)Types of Stock (cont’d)
Income Stocks: stocks with long and sustained records of paying higher-than average dividends Dividends tend to increase over time (unlike interest
payments on bonds)
Some companies pay high dividends because they offer limited growth potential
Examples: Verizon, Conagra Foods, Pitney Bowes, Wrigley

13
Types of Stock (cont’d)Types of Stock (cont’d)
Growth Stocks: stocks that experience high rates of growth in operations and earnings
High rate of growth in earnings > market
Higher price appreciation (due to increasing earnings)
Riskier investment because price will fall if earnings growth cannot be maintained
Typically pay little or no dividends
Examples: Lowe’s, Harley-Davidson, Starbucks, Apple

14
Types of Stock (cont’d)Types of Stock (cont’d)
Cyclical Stocks: stocks whose earnings and overall market performance are closely linked to the general state of the economy Stock price tends to move with the business cycle
Tend to do well when economy is growing, poorly in slowing economy
Best for investors willing to move in and out of market as economy changes
Examples: Caterpillar, Maytag Corp.

15
Types of Stock (cont’d)Types of Stock (cont’d)
Defensive Stocks: stocks that tend to hold their value, and even do well, when the economy starts to falter
Stock price remains stable or increases when general economy is slowing
Products are staples that people use in good times and bad times, such as electricity, beverages, foods and drugs
Best for aggressive investors looking for “parking place” during slow economy
Examples: Proctor & Gamble, WD-40, Walmart

16
Market CapitalizationMarket Capitalization
Small-Cap Stocks: under $1 billion
Mid-Cap Stocks: $1 billion to $4 or $5 billion
Large-Cap Stocks: more than $4 or $5 billion

17
Types of StockTypes of Stock
Small-Cap Stocks: small companies with market capitalizations less than $1 billion Provide opportunity for above-average returns
(or losses)
Short financial track record
Erratic earnings
Not widely-traded; liquidity is issue

18
Types of Stock (cont’d)Types of Stock (cont’d)
Mid-Cap Stocks: medium-sized companies with market capitalizations between $1 billion and $4 or $5 billion Provide opportunity for greater capital appreciation
than Large-Cap stocks, but less price volatility than Small-Cap stocks
Long-term track records for profits and stock valuation
“Baby Blues” offer same characteristics of Blue Chip stocks except size
Examples: Wendy’s, Barnes & Noble, Petsmart, Cheesecake Factory

19
Types of Stock (cont’d)Types of Stock (cont’d)
Large-Cap Stocks: large companies with market capitalizations over $4 or $5 billion Number of companies is smaller, but account for 80% to
90% of the total market value of all U.S. equities
Bigger is not necessarily better
Tend to lag behind small-cap and mid-cap stocks, but typically have less volatility
Examples: AT&T, General Motors, Microsoft

20
Investing in Foreign StocksInvesting in Foreign Stocks
Globalization of financial markets is growing U.S. equity market is less than 50% of world
equity markets
Six countries make up 80% of world equity market
Until 1998, the U.S. market was one of best performing equity markets
Until 1998, much of performance of non-U.S. equities was due to changes in currency exchange rates

21
Stock Investment StrategiesStock Investment Strategies
Buy-and-Hold Investors buy high-quality stocks and hold them for
extended time periods
Goal may be current income and/or capital gains
Investors often add to existing stocks over time
Very conservative approach; value-oriented

22
Stock Investment Strategies (cont’d)Stock Investment Strategies (cont’d)
Current Income Investors buy stocks that have high dividend yields
Safety of principal and stability of income are primary goals
May be preferable to bonds because dividends levels tend to increase over time
Often used to provide to supplement other income, such as in retirement

23
Stock Investment Strategies (cont’d)Stock Investment Strategies (cont’d)
Quality Long-Term Growth Investors buy high-quality growth stocks, mid-cap stocks
and tech stocks
Capital gains are primary goal
Higher level of risk due to emphasis on capital gains
Significant trading of stocks may occur over time
Diversification is used to spread risk
“Total Return Approach” is version that emphasizes both capital gains and high income

24
Stock Investment Strategies (cont’d)Stock Investment Strategies (cont’d)
Aggressive Stock Management Investors buy high-quality growth stocks, blue chip stocks,
mid-cap stocks, tech stocks and cyclical stocks
Capital gains are primary goal
High level of risk due to emphasis on capital gains
Investors aggressively trade in and out of stocks, often holding for short periods
Timing the market is key element
Time consuming to manage

25
Stock Investment Strategies (cont’d)Stock Investment Strategies (cont’d)
Speculation and Short-Term Trading Also called “day trading” Investors buy speculative stocks, small-cap stocks and tech
stocks Capital gains are primary goal Highest level of risk due to emphasis on capital gains in
short time period Investors aggressively trade in and out of stocks, often
holding for extremely short periods Looking for “big score” on unknown stock Time consuming & high trading costs

26
What is Security Analysis?What is Security Analysis?
“The process of gathering and organizing information and then using it to determine the intrinsic value of a share of common stock.”

27
What is Intrinsic Value?What is Intrinsic Value?
Intrinsic Value The underlying or inherent value of a stock, as determined
through fundamental analysis
A prudent investor will only buy a stock if its market price does not exceed what the investor thinks the stock is worth.
Intrinsic value depends upon several factors: Estimates of future cash flows Discount rate Amount of risk

28
“Top Down” Approach to Traditional Security Analysis“Top Down” Approach to
Traditional Security Analysis
Step 1: Economic Analysis State of overall economy
Step 2: Industry Analysis Outlook for specific industry Level of competition in industry
Step 3: Fundamental Analysis Financial condition of specific company Historical behavior of specific company’s stock

29
Efficient Market HypothesisEfficient Market Hypothesis
Efficient Market: the concept that markets are efficient in processing new information - securities trade very close to their intrinsic values at all times.
Efficient market advocates believe: Securities are rarely substantially mispriced in
the marketplace No security analysis is capable of finding mispriced
securities more frequently than using random chance – the random walk theory.

30
Efficient Market HypothesisEfficient Market Hypothesis
However, some analysts do generate: above-market returns (> 500-600 bps)
for reasonably long periods of time (2-3 years).
This is called “Alpha”.

31
Who Needs Security Analysis in an Efficient Market?
Who Needs Security Analysis in an Efficient Market?
Fundamental analysis is still important because:
All of the people doing fundamental analysis is the reason the market is efficient
Financial markets may not be perfectly efficient
Pricing errors are inevitable

32
Trading SecuritiesTrading Securities
Fundamental analysis is still important because:
All of the people doing fundamental analysis is the reason the market is efficient
Financial markets may not be perfectly efficient
Pricing errors are inevitable

33
Technical AnalysisTechnical Analysis
Search for time-series patterns in stock prices
Extensive use of Charts
Expectation that there is systematic information in price trends.
Seems like theorizing with hindsight

34
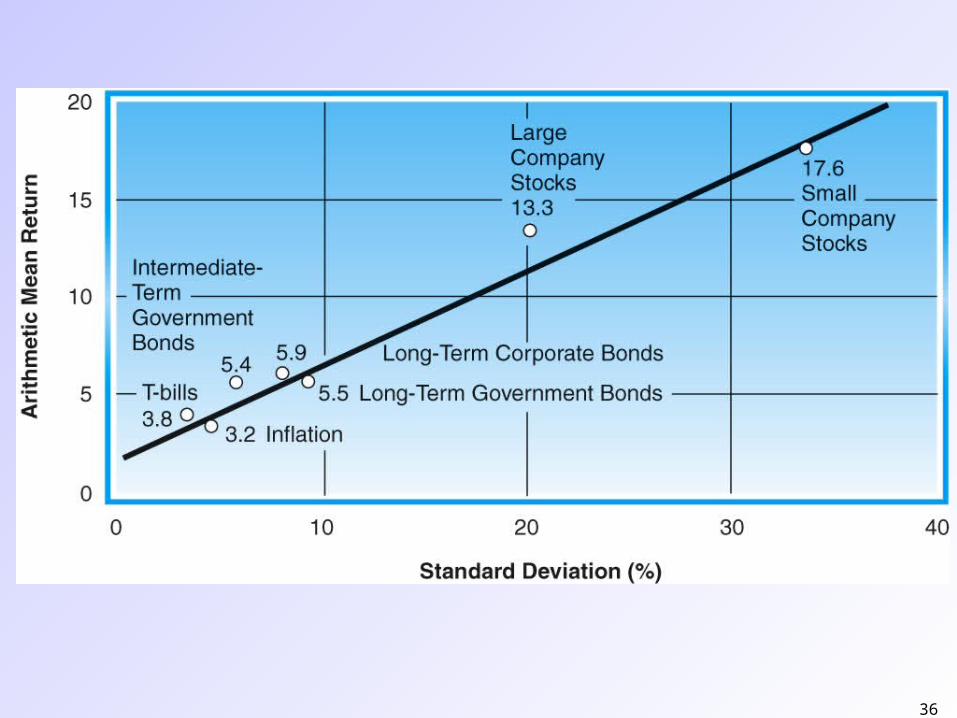
Measuring ReturnsMeasuring Returns
Holding Period Return (HPR): The rate of return over a given investment period.
Arithmetic average: the sum of returns in each period divided by the number of periods.
Geometric average: the nth root of the product of 1 plus the holding period returns for n periods minus 1.
begining
beginingend
P
DPP
HPR
invested dollars
period investment over the earned dollars

35
Measuring RiskMeasuring Risk
Risk of a single asset can be measured by dispersion of r across states, or the variance of the returns.
Variance:Variance: the expected value of the squared deviation from the mean. For a population:
Variance of historical returns or variance of sample data becomes:
2
1
2 r rESSPsS
s
n
t
rn
1
2t
2 r1
1
36

37
Types of MarketsTypes of Markets
Direct Search Market: Buyers and sellers seek each other directly and transact directly.
Brokered Market: A market where an intermediary offers search services to buyers and sellers.
Dealer Market: a market where traders specializing in particular commodities buy and sell assets for their own accounts.
Auction Market: A market where all traders in a good meet to buy or sell an asset.

38
Financial MarketsFinancial Markets
Financial markets are traditionally segmented into:
Money markets Include short-term highly liquid and relatively low risk debt
instruments.
Capital markets Include longer term relatively riskier securities.

39
Primary and Secondary MarketsPrimary and Secondary Markets
Primary market: market for trading newly issued securities.
Secondary markets: Markets where securities are bought and sold subsequent to original issuance.

40
The ExchangesThe Exchanges
National Stock Exchanges: NYSEAMEX
Regional Stock Exchanges:PacificBoston
Chicago
Cincinnati
Philadelphia

41
The NasdaqThe Nasdaq
National Association of Securities Dealer Automated Quotations stock market.
Nasdaq National Market
Nasdaq Small-Cap Market

42
Trading on NasdaqTrading on Nasdaq
Investor broker dealer
Trades negotiated directly through dealers maintaining an inventory of selected securities.
Several dealers compete with a given stock.
After the trade is executed, the parties report the trade and it is transmitted to the outside world. Details are also passed on to Depositary Trust and Clearing Corporation so that settlement can take place after the trade.

43
Auction vs. Dealer Market ModelAuction vs. Dealer Market Model
Floor-based Single Specialist Order-driven Trade halts
Screen-based Competing Market Makers Quote-driven
Auction Market Dealer Market

44
Third MarketsThird Markets
Third markets: Trading of exchange-listed securities among institutional investors and broker/dealers for their own accounts (not as agents for buyers and sellers).
45
Fourth MarketsFourth Markets
Fourth markets: The direct trading of large blocks of securities between institutional investors through a computer network.
Example: Electronic Communication Network (ECNs)
a facility that matches customer buy and sell orders directly through the computer.
Instinet, Island, Archipelgo
Related Documents