Spring 2014 Statistical Abstract: Institutional Data Office of Research and Institutional Effectiveness June 2014 Page 1 of 18 CANISIUS COLLEGE STATISTICAL ABSTRACT INSTITUTIONAL DATA Spring 2014 (201340) Prepared by: Office of Research and Institutional Effectiveness

Welcome message from author
This document is posted to help you gain knowledge. Please leave a comment to let me know what you think about it! Share it to your friends and learn new things together.
Transcript
Spring 2014 Statistical Abstract: Institutional Data
Office of Research and Institutional Effectiveness June 2014 Page 1 of 18
CANISIUS COLLEGE
STATISTICAL ABSTRACT
INSTITUTIONAL DATA
Spring 2014 (201340)
Prepared by:
Office of Research and Institutional Effectiveness

Spring 2014 Statistical Abstract: Institutional Data
Office of Research and Institutional Effectiveness June 2014 Page 2 of 18
Canisius College at a Glance Undergrad. Graduate Total
Enrollment, Spring 2014 2,864 1,375 4,239
Enrollment, Spring 2013 2,897 1,561 4,458
Percent Change in Enrollment -1.1% -11.9% -4.9%
Number Full-time 2,689 556 3,245
Number Part-time 175 819 994
Percent Full-time 93.9% 40.4% 76.6%
Percent Part-time 6.1% 59.6% 23.4%
Credit Hours Attempt. Spring 2014 41,859.5 9,773.5 51,633
Credit Hours Attempt. Spring 2013 42,656 11,824 54,480
Percent Change in CH Attempted -1.9% -17.3% -5.2%
FTE, Spring 2014 2,753 981 3,734
FTE, Spring 2013 2,804 1,168 3,972
Percent Change in FTE -1.8% -16.0% -6.0%
Enrollment by College
College of Arts and Sciences 1,544 73 1,617
School of Ed. & Human Services 414 993 1,407
Wehle School of Business 787 309 1,096
No College Designated 119 0 119
Totals 2,864 1,375 4,239
Enrollment by Gender
Percent Male 48.3% 37.0% 44.6%
Percent Female 51.7% 63.0% 55.4%
Average Age 20.5 29.6 23.5
Enrollment by Residence
On-campus Resident 1,260 34 1,294
Percent Resident 44.0% 2.5% 30.5%
Enrollment by Ethnicity Number Percentage
American Indian/Alaska Native 13 0.3%
Asian 81 1.9%
Black/African American 287 6.8%
Hispanic 129 3.0%
Native Hawaiian/Pacific Islander 2 0.05%
Non-Resident Alien 161 3.8%
Two or More Races 61 1.4%
Unknown 330 7.8%
White 3,175 74.9%
Enrollment by CH Hours Earned
0 to 29 664 15.7%
30 to 59 643 15.2%
60 to 89 705 16.6%
90 plus 852 20.1%
Graduate 1,375 32.4%
Enrollment by Student Type
UG Continuing 2,674 63.1%
UG Cross Registered 74 1.7%
UG High School Students 22 0.5%
UG New First Time (Includes 1st Kings) 9 0.2%
UG Kings Pathway Program Continuing 4 0.1%
UG Re-admit 3 0.07%
UG Transfer 45 1.1%
UG Transient & Visiting 33 0.7%
Grad Continuing 1,189 28.0%
Grad, New First Time 175 4.1%
Grad, Other & King’s Direct Placement 1 0.0%
Enrollment by Residency
Canadian 103 2.4%
International 86 2.0%
New York Resident 3,631 85.7%
Out-of-state Resident 407 9.6%
Unknown 12 0.3%
Receiving Federal Pell Grants
On Campus Resident 829 30.8%
Percent Resident 19 10.9%
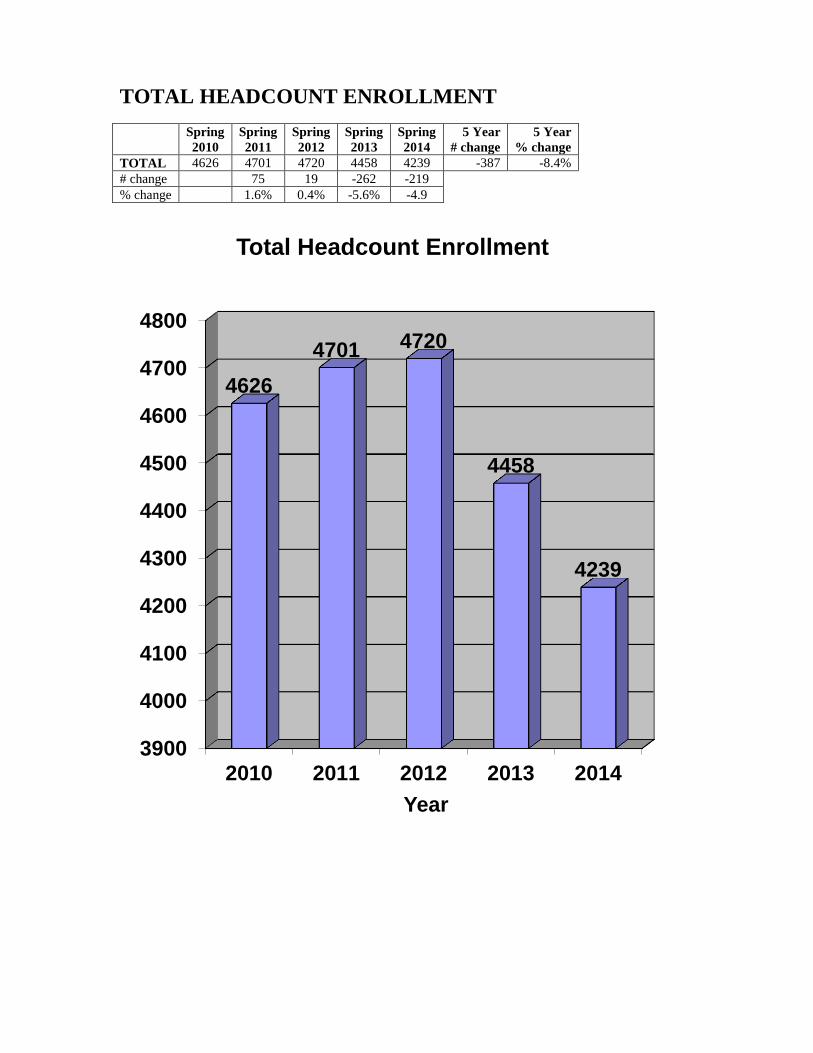
TOTAL HEADCOUNT ENROLLMENT
Spring
2010
Spring
2011
Spring
2012
Spring
2013
Spring
2014
5 Year
# change
5 Year
% change
TOTAL 4626 4701 4720 4458 4239 -387 -8.4%
# change 75 19 -262 -219
% change 1.6% 0.4% -5.6% -4.9
3900
4000
4100
4200
4300
4400
4500
4600
4700
4800
2010 2011 2012 2013 2014
4626
4701 4720
4458
4239
Year
Total Headcount Enrollment
Spring 2014 Statistical Abstract: Institutional Data
Office of Research and Institutional Effectiveness June 2014 Page 4 of 18
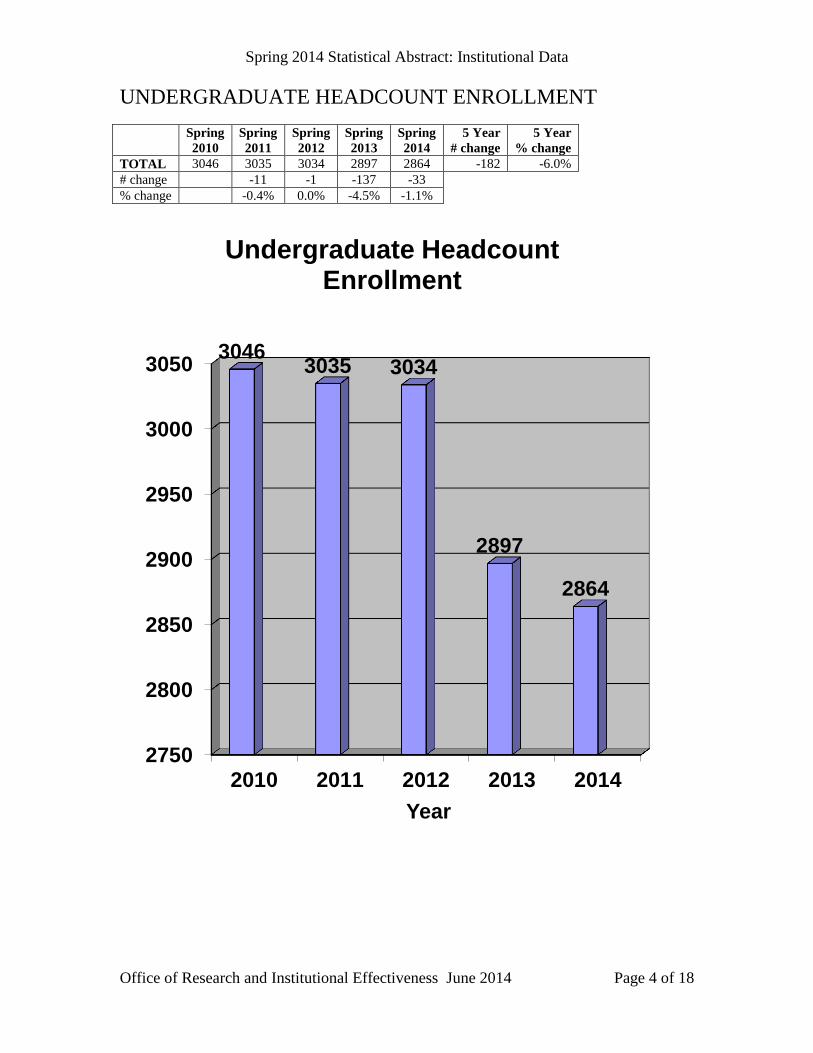
UNDERGRADUATE HEADCOUNT ENROLLMENT
Spring
2010
Spring
2011
Spring
2012
Spring
2013
Spring
2014
5 Year
# change
5 Year
% change
TOTAL 3046 3035 3034 2897 2864 -182 -6.0%
# change -11 -1 -137 -33
% change -0.4% 0.0% -4.5% -1.1%
2750
2800
2850
2900
2950
3000
3050
2010 2011 2012 2013 2014
3046 3035 3034
2897
2864
Year
Undergraduate Headcount Enrollment

Spring 2014 Statistical Abstract: Institutional Data
Office of Research and Institutional Effectiveness June 2014 Page 5 of 18
GRADUATE HEADCOUNT ENROLLMENT
Spring
2010
Spring
2011
Spring
2012
Spring
2013
Spring
2014
5 Year
# change
5 Year
% change
TOTAL 1580 1666 1686 1561 1375 -205 -13.0%
# change 86 20 -125 -186
% change 5.4% 1.2% -7.4% -11.9%
0
200
400
600
800
1000
1200
1400
1600
1800
2010 2011 2012 2013 2014
1580 1666 1686
1561
1375
Year
Graduate Headcount Enrollment

Spring 2014 Statistical Abstract: Institutional Data
Office of Research and Institutional Effectiveness June 2014 Page 6 of 18
TOTAL ENROLLMENT BY SCHOOL
Total Enrollment
Spring
2010
Spring
2011
Spring
2012
Spring
2013
Spring
2014
5 Year
% change
Arts & Sciences 1671 1634 1733 1679 1617 -3.2%
Education & Human Services 1794 1850 1791 1606 1407 -31.6%
Wehle School of Business 1095 1094 1078 1080 1096 0.1%
No College Designated 66 123 118 93 119 75.8%
0
500
1000
1500
2000
2010 2011 2012 2013 2014
Total Enrollment by School
Arts & Sciences
Education & Human Services
Wehle School of Business
No College Designated

Spring 2014 Statistical Abstract: Institutional Data
Office of Research and Institutional Effectiveness June 2014 Page 7 of 18
UNDERGRADUATE ENROLLMENT BY SCHOOL
Undergraduate Enrollment
Spring
2010
Spring
2011
Spring
2012
Spring
2013
Spring
2014
5 Year
% change
Arts & Sciences 1619 1580 1656 1588 1544 -4.6%
Education & Human Services 569 561 505 457 414 -27.2%
Wehle School of Business 792 771 755 760 787 -0.6%
No College Designated 66 123 118 92 119 80.3%
0
200
400
600
800
1000
1200
1400
1600
1800
2010 2011 2012 2013 2014
Undergraduate Enrollment by School
Arts & Sciences
Education & Human Services
Wehle School of Business
No College Designated
Spring 2014 Statistical Abstract: Institutional Data
Office of Research and Institutional Effectiveness June 2014 Page 8 of 18
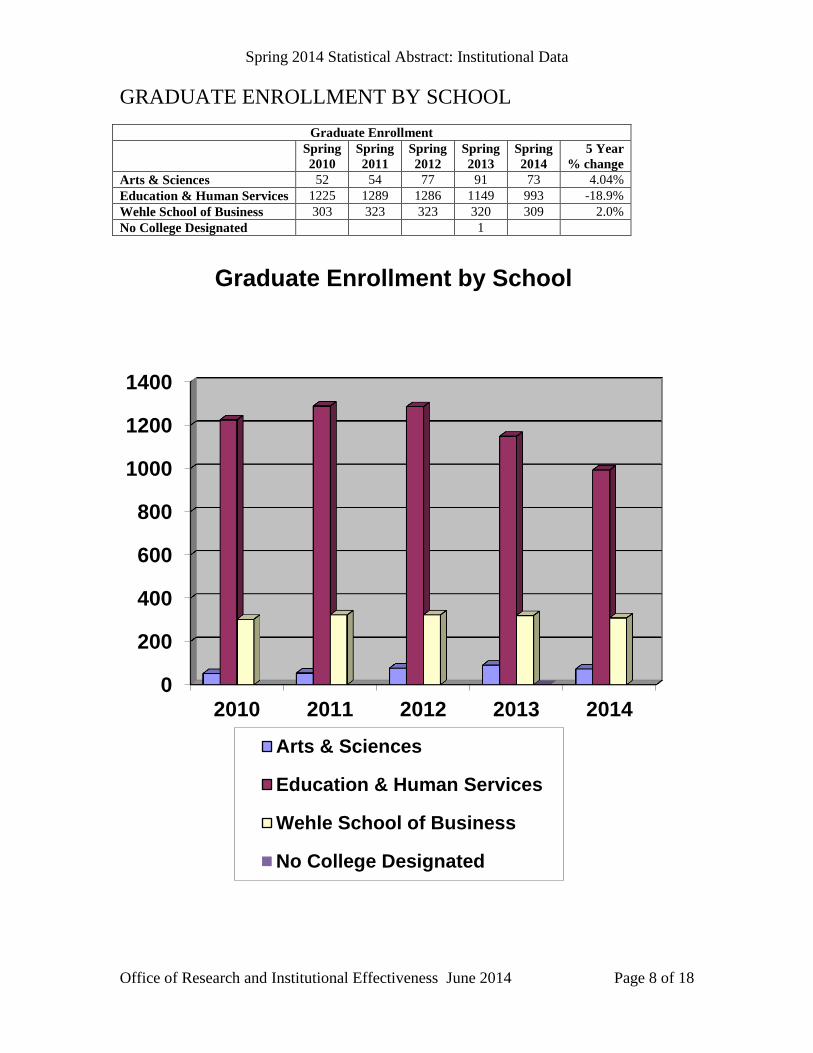
GRADUATE ENROLLMENT BY SCHOOL
Graduate Enrollment
Spring
2010
Spring
2011
Spring
2012
Spring
2013
Spring
2014
5 Year
% change
Arts & Sciences 52 54 77 91 73 4.04%
Education & Human Services 1225 1289 1286 1149 993 -18.9%
Wehle School of Business 303 323 323 320 309 2.0%
No College Designated 1
0
200
400
600
800
1000
1200
1400
2010 2011 2012 2013 2014
Graduate Enrollment by School
Arts & Sciences
Education & Human Services
Wehle School of Business
No College Designated
Spring 2014 Statistical Abstract: Institutional Data
Office of Research and Institutional Effectiveness June 2014 Page 9 of 18
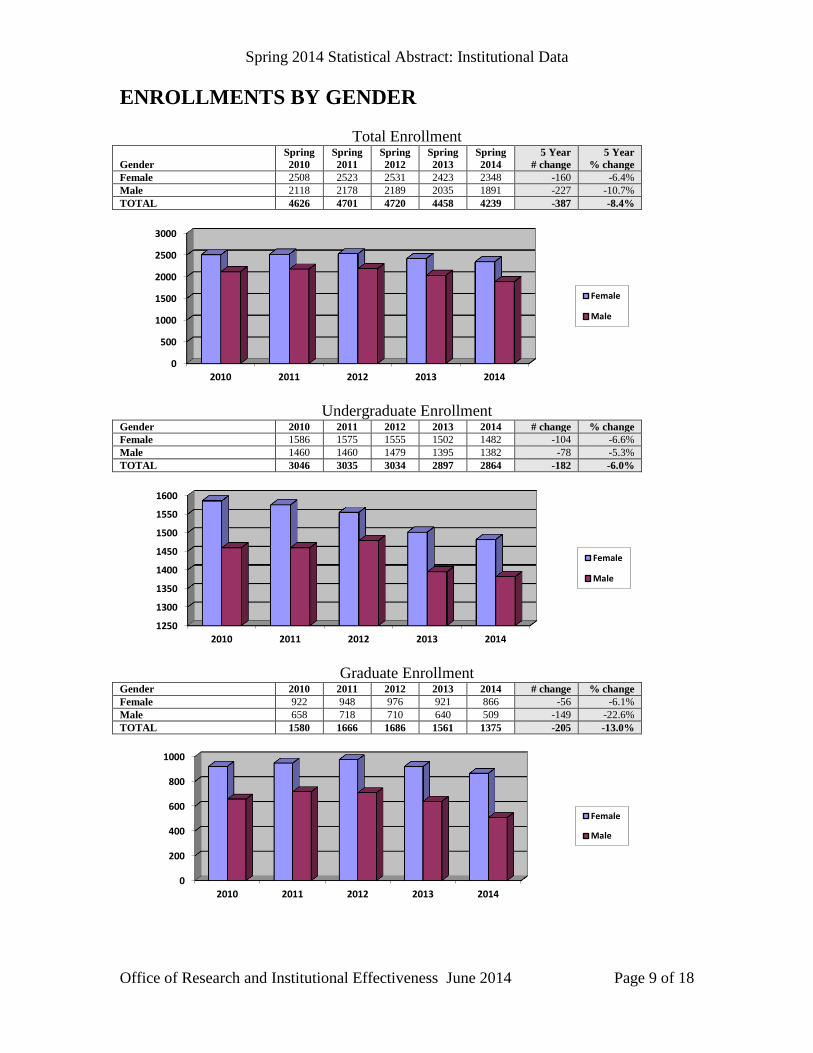
ENROLLMENTS BY GENDER
Total Enrollment
Gender
Spring
2010
Spring
2011
Spring
2012
Spring
2013
Spring
2014
5 Year
# change
5 Year
% change
Female 2508 2523 2531 2423 2348 -160 -6.4%
Male 2118 2178 2189 2035 1891 -227 -10.7%
TOTAL 4626 4701 4720 4458 4239 -387 -8.4%
Undergraduate Enrollment
Gender 2010 2011 2012 2013 2014 # change % change
Female 1586 1575 1555 1502 1482 -104 -6.6%
Male 1460 1460 1479 1395 1382 -78 -5.3%
TOTAL 3046 3035 3034 2897 2864 -182 -6.0%
Graduate Enrollment
Gender 2010 2011 2012 2013 2014 # change % change
Female 922 948 976 921 866 -56 -6.1%
Male 658 718 710 640 509 -149 -22.6%
TOTAL 1580 1666 1686 1561 1375 -205 -13.0%
0
500
1000
1500
2000
2500
3000
2010 2011 2012 2013 2014
Female
Male
1250
1300
1350
1400
1450
1500
1550
1600
2010 2011 2012 2013 2014
Female
Male
0
200
400
600
800
1000
2010 2011 2012 2013 2014
Female
Male
Spring 2014 Statistical Abstract: Institutional Data
Office of Research and Institutional Effectiveness June 2014 Page 10 of 18
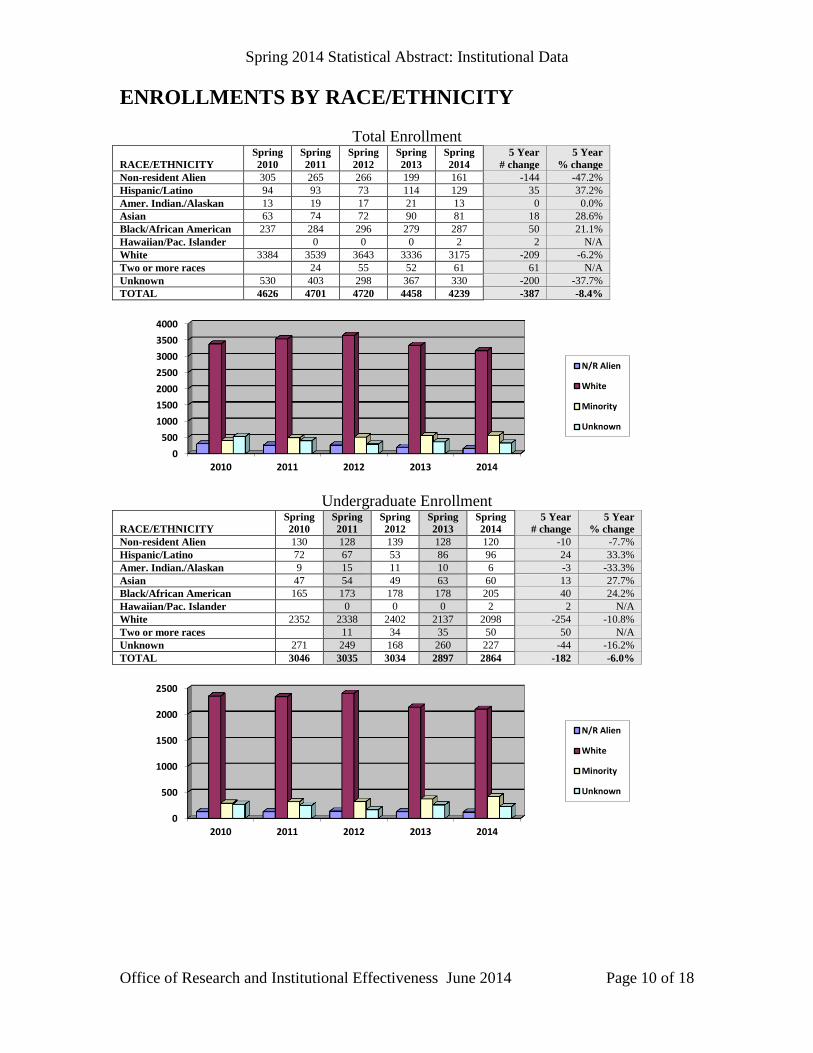
ENROLLMENTS BY RACE/ETHNICITY
Total Enrollment
RACE/ETHNICITY
Spring
2010
Spring
2011
Spring
2012
Spring
2013
Spring
2014
5 Year
# change
5 Year
% change
Non-resident Alien 305 265 266 199 161 -144 -47.2%
Hispanic/Latino 94 93 73 114 129 35 37.2%
Amer. Indian./Alaskan 13 19 17 21 13 0 0.0%
Asian 63 74 72 90 81 18 28.6%
Black/African American 237 284 296 279 287 50 21.1%
Hawaiian/Pac. Islander 0 0 0 2 2 N/A
White 3384 3539 3643 3336 3175 -209 -6.2%
Two or more races 24 55 52 61 61 N/A
Unknown 530 403 298 367 330 -200 -37.7%
TOTAL 4626 4701 4720 4458 4239 -387 -8.4%
Undergraduate Enrollment
RACE/ETHNICITY
Spring
2010
Spring
2011
Spring
2012
Spring
2013
Spring
2014
5 Year
# change
5 Year
% change
Non-resident Alien 130 128 139 128 120 -10 -7.7%
Hispanic/Latino 72 67 53 86 96 24 33.3%
Amer. Indian./Alaskan 9 15 11 10 6 -3 -33.3%
Asian 47 54 49 63 60 13 27.7%
Black/African American 165 173 178 178 205 40 24.2%
Hawaiian/Pac. Islander 0 0 0 2 2 N/A
White 2352 2338 2402 2137 2098 -254 -10.8%
Two or more races 11 34 35 50 50 N/A
Unknown 271 249 168 260 227 -44 -16.2%
TOTAL 3046 3035 3034 2897 2864 -182 -6.0%
0
500
1000
1500
2000
2500
3000
3500
4000
2010 2011 2012 2013 2014
N/R Alien
White
Minority
Unknown
0
500
1000
1500
2000
2500
2010 2011 2012 2013 2014
N/R Alien
White
Minority
Unknown

Spring 2014 Statistical Abstract: Institutional Data
Office of Research and Institutional Effectiveness June 2014 Page 11 of 18
ENROLLMENTS BY RACE/ETHNICITY Cont’d
Graduate Enrollment
RACE/ETHNICITY
Spring
2010
Spring
2011
Spring
2012
Spring
2013
Spring
2014
5 Year
# change
5 Year
% change
Non-resident Alien 175 137 127 71 41 -134 -76.6%
Hispanic/Latino 22 26 20 28 33 11 50.0%
Amer. Indian./Alaskan 4 4 6 11 7 3 75.0%
Asian 16 20 23 27 21 5 31.3%
Black/African American 72 111 118 101 82 10 13.9%
Hawaiian/Pac. Islander 0 0 0 0 0 N/A
White 1032 1201 1241 1199 1077 45 4.4%
Two or more races 13 21 17 11 11 N/A
Unknown 259 154 130 107 103 -156 -60.2%
TOTAL 1580 1666 1686 1561 1375 -205 -13.0%
0
200
400
600
800
1000
1200
1400
2010 2011 2012 2013 2014
N/R Alien
White
Minority
Unknown

Spring 2014 Statistical Abstract: Institutional Data
Office of Research and Institutional Effectiveness June 2014 Page 12 of 18
ENROLLMENTS BY MAJOR *Includes double counting
COLLEGE OF ARTS & SCIENCES
Undergraduate Programs
Code
Major
Spring
2010
Spring
2011
Spring
2012
Spring
2013
Spring
2014
5 yr #
change
5 yr %
change
ABEC Animal Behavior, Ecology & Conservation 36 64 110 143 180 144 400.0%
AHM Art History 19 12 11 11 6 -13 -68.4%
ANT Anthropology 15 19 24 23 24 9 60.0%
BCH Biochemistry 53 51 38 42 39 -14 -26.4%
BCHA Biochemistry, ACS Certified 1 5 4 3 6 5 500.0%
BIF Bioinformatics 4 1 5 6 9 5 125.0%
BIO Biology 222 203 256 233 231 9 4.1%
CHM Chemistry 18 23 23 6 13 -5 -27.8%
CHMA Chemistry, ACS Certified 16 11 8 10 8 -8 -50.0%
CHMH Chemistry, Health Professions 16 12 18 26 24 8 50.0%
CLLA Classical Languages 2 2 0 0 N/A N/A
CLSG Classics, Greek 2 2 3 3 N/A N/A
CLSL Classics, Latin 4 4 4 5 N/A N/A
COM Communication Studies 219 179 168 149 156 -63 -28.8%
CRJ Criminal Justice 112 110 101 106 104 -8 -7.1%
CRWT Creative Writing 20 36 41 42 N/A N/A
CSC Computer Science 33 33 43 41 50 17 51.5%
CSC1 Computer Science 2 1 N/A N/A
CSC2 Computer Science Certificate (CSCC) 1 0 N/A N/A
DMA Digital Media Arts 115 106 95 77 72 -43 -37.4%
ECON Economics 22 31 25 31 31 9 40.9%
EN 32 Physics (Pre-engineering 3+2) 2 6 6 4 N/A N/A
ENG English 99 97 85 73 78 -21 -21.2%
ENGR Pre-Engineering 13 13 12 13 17 4 30.8%
ENV Environmental Sciences 10 8 10 7 10 0 0.0%
EUR European Studies 24 19 13 17 11 -13 -54.2%
EVST Environmental Studies 2 6 12 19 N/A N/A
FRC French 22 20 14 14 11 -11 -50.0%
GER German 13 11 12 14 17 4 30.8%
HIS History 124 101 102 91 67 -57 -46.0%
INT International Relations 61 69 66 61 59 -2 -3.3%
JRN Journalism 12 26 31 27 N/A N/A
LAS Latin American Studies 3 4 N/A N/A
MAT Mathematics 34 34 38 34 38 4 11.8%
MATS Mathematics & Statistics 2 2 5 7 N/A N/A
MLSC Medical Laboratory Science (Was MDT) 10 7 7 12 11 1 10.0%
MUS Music 8 4 7 5 4 -4 -50.0%
MUSP Music Performance 4 7 6 N/A N/A
PHI Philosophy 18 5 2 0 0 -18 -100.0%
PHIH Philosophy, Hypatian Scholar 13 6 9 9 N/A N/A
PHII Philosophy, Ignation Scholar 4 5 2 4 N/A N/A
PHY Physics 9 12 18 16 13 4 44.4%
PSC Political Science 123 124 103 117 106 -17 -13.8%
PSY Psychology 327 322 278 270 268 -59 -18.0%
RST Religious Studies 20 14 4 7 10 -10 -50.0%
SOC Sociology 39 28 26 29 40 1 2.6%
SPA Spanish 39 29 33 32 31 -8 -20.5%
SSC Social Scien. (BA), Adult Acad. Services 1 0 N/A N/A
TLS Technical/Liberal Studies 1 0 0 0 -1 -100.0%
UND Undecided 64 84 101 96 84 20 31.3%
URS Urban Studies 6 7 8 4 9 3 50.0%
WSTC Women’s Studies, Certificate 6 7 N/A N/A
Graduate Programs
Code
Major
Spring
2010
Spring
2011
Spring
2012
Spring
2013
Spring
2014
5 yr #
change
5 yr %
change
ANZO Anthrozoology 33 48 43 N/A N/A
ASNM Arts & Sciences Non-Matriculated 3 2 0 0 N/A N/A
COMG Communication & Leadership 52 51 52 43 43 -9 -17.3%

Spring 2014 Statistical Abstract: Institutional Data
Office of Research and Institutional Effectiveness June 2014 Page 13 of 18
ENROLLMENTS BY MAJOR Cont’d *Includes double counting
SCHOOL OF EDUCATION & HUMAN SERVICES
Undergraduate Programs
Code
Major
Spring
2010
Spring
2011
Spring
2012
Spring
2013
Spring
2014
5 yr #
change
5 yr %
change
ATM Athletic Training 64 54 58 47 50 -14 -21.9%
ECCH Early Childhood/Childhood Ed. Dual 64 77 57 40 37 -27 -42.2%
EDAD Adolescent Education 148 140 87 81 53 -95 -64.2%
EDCH Childhood Education 36 31 25 19 13 -23 -63.9%
EDEC Early Childhood Education 9 11 7 4 2 -7 -77.8%
HEWE Health & Wellness 8 41 74 91 N/A N/A
PEHL Physical/Health Education 108 116 91 66 40 -68 -63.0%
PEM Physical Education 1 0 0 N/A N/A
PESS Physical Education Sport Studies 21 16 9 7 11 -10 -47.6%
PHED Physical Education, Birth-12 18 8 6 4 2 -16 -88.9%
PS1 CC2CC–NCCC Radiologic Tech(OPS) 2 2 2 1 N/A N/A
PS5 CC2CC – GCC Respiratory Care(OPS) 3 2 1 N/A N/A
PS8 1 N/A N/A
PS10 Telecomm Technician (Verizon)(OPS) 1 0 0 N/A N/A
PS11 Professional Technical Studies(OPS) 1 1 N/A N/A
SPE1 Special/Childhood Education, Grades 1-6 81 72 70 61 53 -28 -34.6%
SPEB Special/Early Childhood Ed. Birth-2 18 17 16 10 6 -12 -66.7%
SPMT Sports Management 10 30 42 53 N/A N/A
UND Undecided 2 2 3 0 1 -1 -50.0%
Graduate Programs
Code
Major
Spring
2010
Spring
2011
Spring
2012
Spring
2013
Spring
2014
5 yr #
change
5 yr %
change
CMHC Community Mental Health Counseling 73 83 101 89 90 17 23.3%
CSH Community & School Health(OPS) 19 25 20 N/A N/A
CSP College Student Personnel 45 51 55 57 58 13 28.9%
EDA School/Administration Supervision 23 14 5 18 13 -10 -43.5%
EDAD Adolescent Education 86 74 56 42 25 -61 -70.9%
EDAO Educational Admin./Supervision 14 34 39 N/A N/A
EDBM Business & Marketing Education 24 18 12 7 4 -20 -83.3%
EDC Counseling & Human Services 2 0 0 0 0 -2 -100.0%
EDCH Childhood Education 148 101 84 63 19 -129 -87.2%
EDD Deaf Education 17 10 4 7 6 -11 -64.7%
EDD1 Deaf Childhood Education Grades 1 – 6 5 10 10 7 N/A N/A
EDD7 Deaf Adolescence Education Grades 7 - 12 3 2 1 0 N/A N/A
EDDI Differentiated Instruction 56 57 51 34 25 -31 -55.4%
EDG General Education 2 2 3 1 0 -2 -100.0%
EDN General Education, Non-matriculated 22 18 14 16 17 -5 -22.7%
EDT Education Technologies Certificate 7 14 17 N/A N/A
EDT2 Ed Tech and Emerging Medias 1 2 N/A N/A
EDTL Teacher Leader Certificate 7 4 0 0 0 -7 -100.0%
GEEX Gifted Education Extension 2 1 2 0 N/A N/A
HHP Health & Human Performance(OPS) 25 40 36 34 25 0 0.0%
HIT Health Information Technology 5 N/A N/A
LTCY Literacy Education 49 41 34 29 22 -27 -55.1%
MCXT Middle Childhood Extension 2 1 2 1 1 -1 -50.0%
MSA Sport Administration 79 72 68 46 38 -41 -51.9%
NDEG Non-Degree 1 N/A N/A
NTC1 Applied Nutrition Cert Track 1 1 1 0 N/A N/A
NTR1 Applied Nutrition, Track 1 7 10 18 N/A N/A
NTR2 Applied Nutrition, Track 2 4 9 17 N/A N/A
ONBS Bilingual Special Ed 24 N/A N/A
ONES Teach Eng to Speakers of Other Languages 34 57 N/A N/A
ONLT Literacy Education, On-line 32 70 69 78 66 34 106.3%
ONPE Physical Education, On-line 143 154 154 110 76 -67 -46.9%
ONSA Sports Administration, On-line 60 130 146 162 110 50 83.3%
ONSB School Building Leadership, On-line 39 72 86 70 64 25 64.1%
ONSD School District Leadership, On-line 2 9 19 26 24 1200.0%
OSBD School Building/District Leader, Online 14 22 24 N/A N/A
OTT Online Teaching and Training 1 0 N/A N/A
PEM Physical Education 26 24 14 5 1 -25 -96.2%
PHED Physical Education, Birth-12 57 38 40 29 22 -35 -61.4%

Spring 2014 Statistical Abstract: Institutional Data
Office of Research and Institutional Effectiveness June 2014 Page 14 of 18
Code Enrollments by Major - Continued Includes Double Counting
Spring
2010
Spring
2011
Spring
2012
Spring
2013
Spring
2014
5 yr #
change
5 yr %
change
READ Reading Certificate 1 0 0 N/A N/A
RES 1 Respiratory Care, Track 1 5 10 N/A N/A
RES 2 Respiratory Care, Track 2 1 1 N/A N/A
SAC School/Agency Counseling 90 91 75 40 35 -55 -61.1%
SBDL School Building/District Leadership 4 5 13 11 N/A N/A
SBL School Building Leadership 55 50 48 17 20 -35 -63.6%
SDL School District Leadership 1 1 12 9 9 8 800.0%
SPE1 Special/Childhood Education, Grades 1-6 44 31 25 11 7 -37 -84.1%
SPE7 Special Education, Adolescent 19 10 4 3 2 -17 -89.5%
SPEA Special Education, Advanced 1 8 17 16 13 12 1200.0%
SPM1 Special Education, Childhood 13 8 9 11 N/A N/A
SPM7 Special Education, Adolescent 5 11 6 6 N/A N/A
WEHLE SCHOOL OF BUSINESS
Undergraduate Programs
Code
Major
Spring
2010
Spring
2011
Spring
2012
Spring
2013
Spring
2014
5 yr #
change
5 yr %
change
ACC Accounting 214 232 219 201 215 1 0.5%
ACC1 Accounting 25 12 N/A N/A
ACC2 Professional Accounting 2 1 11 16 15 13 650.0%
AIS Accounting Information Systems 38 31 29 53 65 27 71.1%
ECO Economics 42 38 40 49 68 26 61.9%
ENT Entrepreneurship 41 49 52 43 31 -10 -24.4%
FIN Finance 145 138 141 144 159 14 9.7%
IBUS International Business 71 61 52 57 62 -9 -12.7%
MGT Management 147 122 133 123 119 -28 -19.0%
MIS Information Systems 22 30 22 31 30 8 36.4%
MKT Marketing 160 147 161 143 157 -3 -1.9%
UNBU Undeclared Business 24 23 12 18 21 -3 -12.5%
UND Undecided 28 15 12 11 12 -16 -57.1%
Graduate Programs
Code
Major
Spring
2010
Spring
2011
Spring
2012
Spring
2013
Spring
2014
5 yr #
change
5 yr %
change
BUNM Business, Non-matriculated 12 8 8 7 7 -5 -41.7%
INTB International Business 9 9 10 8 7 -2 -22.2%
MBA MBA, Part-Time Program 216 210 206 202 189 -27 -12.5%
MBA3 Bachelors/MBA 3+2 1 0 N/A N/A
MBAA MBA, Accounting 150 Hour 4 19 18 14 17 13 325.0%
MBAO MBA, One Year Program 20 24 27 21 19 -1 -5.0%
MBAP MBA, Professional Accounting 42 45 44 53 49 7 16.7%
MFA Forensic Accounting 8 10 14 21 N/A N/A
OTHER INFORMATION
Undergraduate Programs
Code
Major
Spring
2010
Spring
2011
Spring
2012
Spring
2013
Spring
2014
5 yr #
change
5 yr %
change
AUDIT Auditing 12 15 26 18 14 2 16.7%
NDEG Non-degree 54 108 92 74 105 51 94.4%
Double Majors 431 415 374 494 517 86 20.0%
Triple Majors 25 27 27 38 43 18 72.0%
Quadruple Majors 3 3 3 4 3 0 0.0%

Spring 2014 Statistical Abstract: Institutional Data
Office of Research and Institutional Effectiveness June 2014 Page 15 of 18
CREDIT HOURS BY DEPARTMENT AND SCHOOL
Spring 2014 Credit Hours
Department
Undergrad.
Graduate
Total
% of
School
% of
College
Animal Behavior, Ecology & Conservation 685 243 928 3.1% 1.8%
Biology 2724 2724 9.0% 5.3%
Chemistry 1172 1172 3.9% 2.3%
Classics 690 690 2.3% 1.4%
College Honors Program 270 270 0.9% 0.5%
Communication Studies 2680 129 2809 9.3% 5.5%
Computer Science 388 388 1.3% 0.8%
English 2718 2718 9.0% 5.3%
English as a Second Language 0.0% 0.0%
Fine Arts 1425 1425 4.7% 2.8%
First Year Seminar 381 381 1.3% 0.7%
History 2484 2484 8.3% 4.9%
Mathematics & Statistics 1959 1959 6.5% 3.8%
Military Science 330 330 1.1% 0.6%
Modern Languages 673 673 2.2% 1.3%
Philosophy 2704 2704 9.0% 5.3%
Physics 546 546 1.8% 1.1%
Political Science 1034 1034 3.4% 2.0%
Psychology 2295 2295 7.6% 4.5%
Religious Studies & Theology 2326 2326 7.7% 4.6%
Sociology/Anthropology & Criminal Justice 2058 2058 6.8% 4.0%
Undeclared(Unallocated) 189 189 0.6% 0.4%
Arts & Sciences 29731 372 30103 59.0%
Department
Undergrad.
Graduate
Total
% of
School
% of
College
Counseling & Human Services 1052 1052 10.2% 2.1%
Teacher Education (1) 1800 712 2512 24.3% 4.9%
Graduate Education & Leadership 516 3615 4131 39.9% 8.1%
Kinesiology 1480 489 1969 19.0% 3.9%
Office of Professional Studies (2) 684 684 6.6% 1.3%
Education & Human Services 3796 6552 10348 20.3%
Department
Undergrad.
Graduate
Total
% of
School
% of
College
Accounting 1418 648 2066 20.9% 4.0%
Economics & Finance 2859 669 3528 35.7% 6.9%
Graduate Business 4 4 0.0% 0.0%
Management 1673 795 2468 25.0% 4.8%
Marketing & Information Systems 1293 531 1824 18.4% 3.6%
Wehle School of Business 7243 2647 9890 19.4%
Department
Undergrad.
Graduate
Total
% of
School
% of
College
Unaffiliated 682 682 1.3%
CANISIUS COLLEGE 41452 9571 51023
(1) Starting in 201230 “Adolescence Ed” & “Education” are combined in “Teachers Education”.
Also, Graduate Education and Leadership includes Sports Administration.
(2) Office of Professional Studies is a Department in Education and Human Services.

Spring 2014 Statistical Abstract: Institutional Data
Office of Research and Institutional Effectiveness June 2014 Page 16 of 18
72% 9%
17% >1/3%
Undergraduate Credit Hours
Arts & Sciences Education and Human Services
Wehle School of Business Unaffiliated
4%
68% 28%
Graduate Credit Hours
Arts & Sciences Education & Human Services
Wehle School of Business
57% 24%
19% >0.6%
Total Credit Hours
Arts & Sciences Education & Human Services
Wehle School of Business Unaffiliated

Spring 2014 Statistical Abstract: Institutional Data
Office of Research and Institutional Effectiveness June 2014 Page 17 of 18
CREDIT HOURS BY DEPARTMENT, 2010-14
Department
Spring
2010
Spring
2011
Spring
2012
Spring
2013
Spring
2014
5 Year
% change
Animal Behavior, Ecology & Conservation 650 786 928 N/A
Biology 2542 2533 2758 2567 2724 7.2%
Chemistry 1108 1007 1331 1269 1172 5.8%
Classics 462 774 636 612 690 49.4%
College Honors Program 258 261 270 N/A
Communication Studies 2925 2794 2590 2814 2809 -4.0%
Computer Science 358 400 448 367 388 8.4%
English 2931 3012 3034 2991 2718 -7.3%
English as a Second Language 182 144 82 N/A
Fine Arts 2063 1780 1647 1412 1425 -30.9%
First Year Seminar 414 432 390 390 381 -8.0%
History 2469 2402 2496 2448 2484 0.6%
Mathematics & Statistics 2069 2160 2140 2030 1959 -5.3%
Military Science 291 331 275 294 330 13.4%
Modern Languages 807 813 885 808 673 -16.6%
Philosophy 3178 2659 3171 2897 2704 -14.9%
Physics 480 518 591 433 546 13.8%
Political Science 1233 1137 1049 1059 1034 -16.1%
Psychology 2370 2282 2259 2371 2295 -3.2%
Religious Studies & Theology 2556 2727 2637 2631 2326 -9.0%
Sociology/Anthropology & CJ 2007 1755 1774 1977 2058 2.5%
Undeclared (Unallocated-Misc.) 6 25 189 N/A
Arts & Sciences 30263 29698 31169 30524 30103 -0.5%
Department
Spring
2010
Spring
2011
Spring
2012
Spring
2013
Spring
2014
5 Year
% change
Adolescence Education 2445 1933 1371 N/A
Counseling & Human Services 1447 1534 1663 1239 1052 -27.3%
Education 4233 3548 3373 N/A
Graduate Education & Leadership 3182 4140 4191 4579 4131 29.8%
Kinesiology 3553 3446 3252 2421 1969 -44.6%
Teacher Education 3736 2512 N/A
Office of Professional Studies 320 750 684 N/A
Education & Human Services 14860 14601 14170 12725 10348 -30.4%
Department
Spring
2010
Spring
2011
Spring
2012
Spring
2013
Spring
2014
5 Year
% change
Accounting 2025 2085 2143 2010 2066 2.0%
Economics & Finance 3436 3624 3500 3459 3528 2.7%
Graduate Business 29 25 30 6 4 -86.2%
Management 2988 3141 2880 2805 2468 -17.4%
Marketing & Information Systems 1782 2068 2038 1618 1824 2.4%
Wehle School of Business 10260 10943 10591 9898 9890 -3.6%
Spring
2010
Spring
2011
Spring
2012
Spring
2013
Spring
2014
5 Year
% change
Unaffiliated 484 467 141 155 682 40.9%
CANISIUS COLLEGE 55867 55709 56071 53302 51023 -8.7%
In Education and Human Services – Ad. Ed. and Ed. are now combined under Teachers Ed; Sports Admin. is part of Grad. Ed. & Leadership;
Office of Professional Studies is now a department within the School of Education and Human Services.
A Transposition Error for Spring 2012 has been corrected In 2012 the Grand Total of Credit Hours was reported as 56017; actual was 56071.

Spring 2014 Statistical Abstract: Institutional Data
Office of Research and Institutional Effectiveness June 2014 Page 18 of 18
0
5000
10000
15000
20000
25000
30000
35000
2010 2011 2012 2013 2014
Year
Spring Credit Hours by School
Arts & Sciences
Education & Human Services
Wehle School of Business
Related Documents