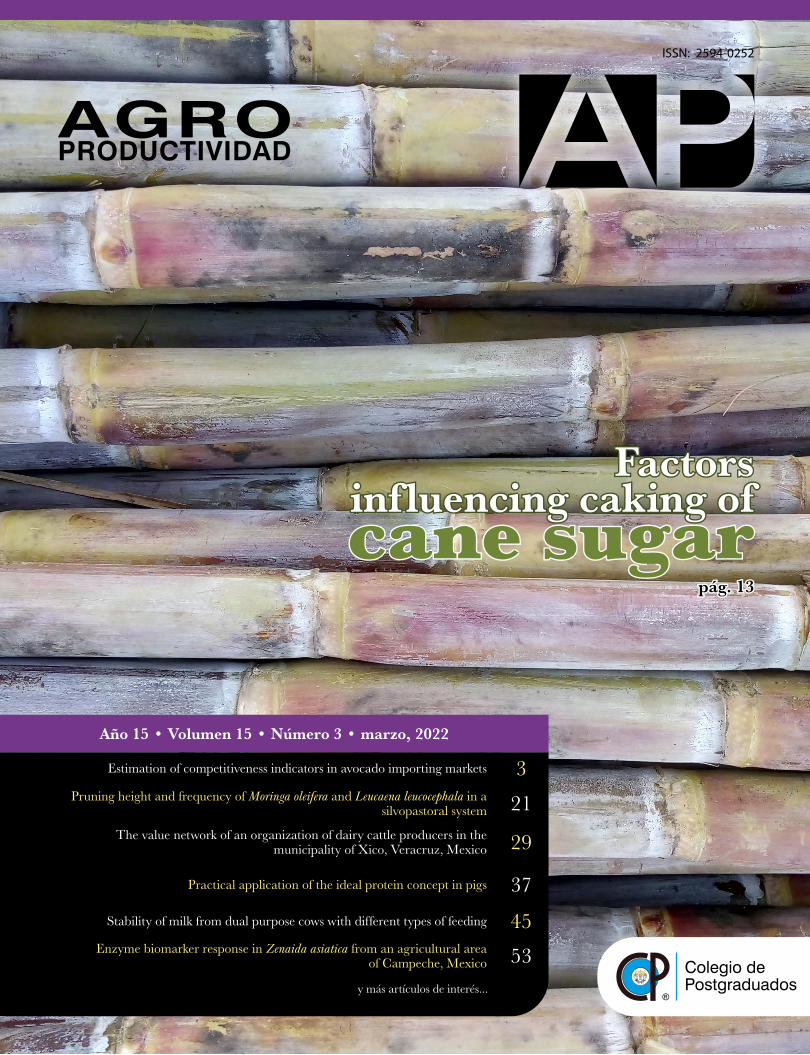
Año 15 • Volumen 15 • Número 3 • marzo, 2022 Estimation of competitiveness indicators in avocado importing markets 3 Pruning height and frequency of Moringa oleifera and Leucaena leucocephala in a silvopastoral system 21 The value network of an organization of dairy cattle producers in the municipality of Xico, Veracruz, Mexico 29 Practical application of the ideal protein concept in pigs 37 Stability of milk from dual purpose cows with different types of feeding 45 Enzyme biomarker response in Zenaida asiatica from an agricultural area of Campeche, Mexico 53 y más artículos de interés... ISSN: 2594-0252 Colegio de Postgraduados pág. 13 pág. 13 Factors Factors influencing caking of influencing caking of cane sugar cane sugar

Welcome message from author
This document is posted to help you gain knowledge. Please leave a comment to let me know what you think about it! Share it to your friends and learn new things together.
Transcript
Año 15 • Volumen 15 • Número 3 • marzo, 2022
Estimation of competitiveness indicators in avocado importing markets 3Pruning height and frequency of Moringa oleifera and Leucaena leucocephala in a
silvopastoral system 21The value network of an organization of dairy cattle producers in the
municipality of Xico, Veracruz, Mexico 29
Practical application of the ideal protein concept in pigs 37Stability of milk from dual purpose cows with different types of feeding 45
Enzyme biomarker response in Zenaida asiatica from an agricultural area of Campeche, Mexico 53
y más artículos de interés...
ISSN: 2594-0252
Colegio dePostgraduados
pág. 13pág. 13
Factors Factors influencing caking ofinfluencing caking of cane sugarcane sugar
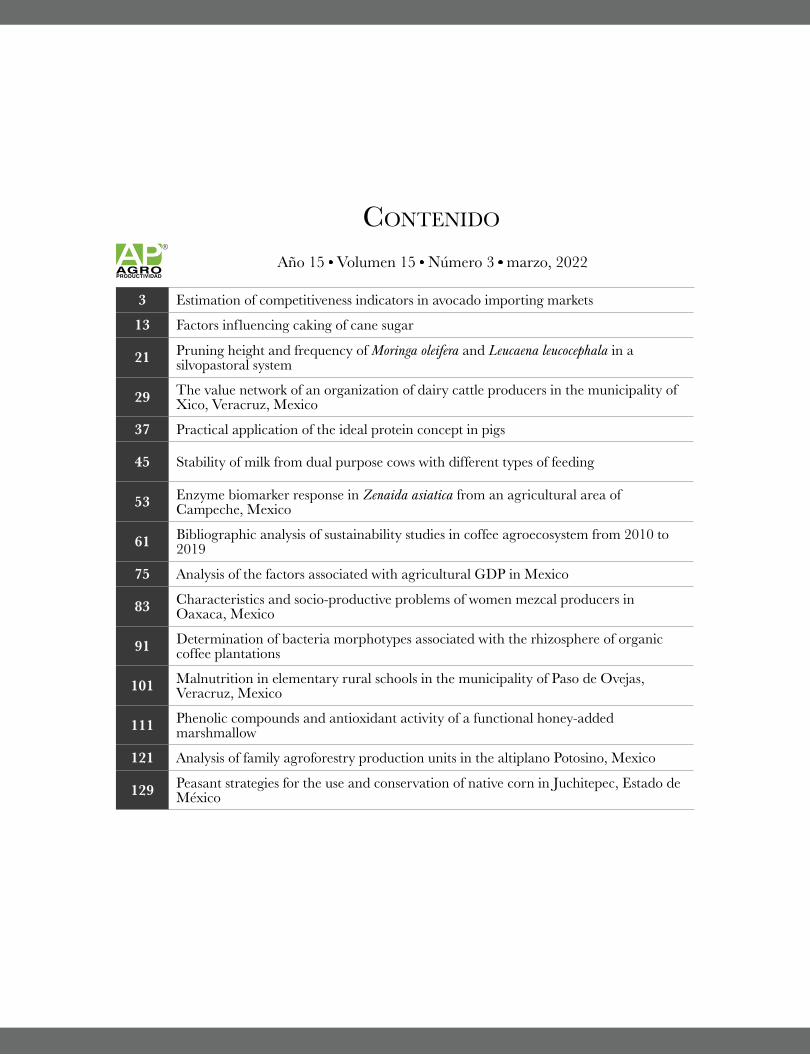
Contenido
AGROPRODUCTIVIDAD
®
Año 15 Volumen 15 Número 3 marzo, 2022
3 Estimation of competitiveness indicators in avocado importing markets
13 Factors influencing caking of cane sugar
21 Pruning height and frequency of Moringa oleifera and Leucaena leucocephala in a silvopastoral system
29 The value network of an organization of dairy cattle producers in the municipality of Xico, Veracruz, Mexico
37 Practical application of the ideal protein concept in pigs
45 Stability of milk from dual purpose cows with different types of feeding
53 Enzyme biomarker response in Zenaida asiatica from an agricultural area of Campeche, Mexico
61 Bibliographic analysis of sustainability studies in coffee agroecosystem from 2010 to 2019
75 Analysis of the factors associated with agricultural GDP in Mexico
83 Characteristics and socio-productive problems of women mezcal producers in Oaxaca, Mexico
91 Determination of bacteria morphotypes associated with the rhizosphere of organic coffee plantations
101 Malnutrition in elementary rural schools in the municipality of Paso de Ovejas, Veracruz, Mexico
111 Phenolic compounds and antioxidant activity of a functional honey-added marshmallow
121 Analysis of family agroforestry production units in the altiplano Potosino, Mexico
129 Peasant strategies for the use and conservation of native corn in Juchitepec, Estado de México
1AGROPRODUCTIVIDAD
Directrices para Autores/asNaturaleza de los trabajos: Las contribuciones que se reciban para su eventual publicación deben ser resultados originales derivados de un trabajo académico de alto nivel sobre los tópicos presentados en la sección de temática y alcance de la revista.
Extensión y formato: Los artículos deberán estar escritos en proce-sador de textos, con una extensión de 15 cuartillas, tamaño carta con márgenes de 2.5 centímetros, Arial de 12 puntos, interlineado doble, sin espacio entre párrafos. Las páginas deberán estar foliadas desde la primera hasta la última en el margen inferior derecho. La extensión total incluye abordaje textual, bibliografía, gráficas, figuras, imágenes y todo material adicional. Debe evitarse el uso de sangría al inicio de los párrafos. Las secciones principales del artículo deberán escribirse en mayúsculas, negritas y alineadas a la izquierda. Los subtítulos de las secciones se escribirán con mayúsculas sólo la primera letra, negri-tas y alineadas a la izquierda.
Exclusividad: Los trabajos enviados a Agro Productividad deberán ser inéditos y sus autores se comprometen a no someterlos simultánea-mente a la consideración de otras publicaciones; por lo que es necesa-rio adjuntar este documento: Carta de originalidad.
Comité CientíficoDr. Giuseppe CollaUniversity of Tuscia, Italia
0000-0002-3399-3622
Dra. Magaly Sánchez de Chial Universidad de Panamá, Panamá
0000-0002-6393-9299
Dra. Maritza EscalonaUniversidad de Ciego de Ávila, Cuba
0000-0002-8755-6356
Dr. Kazuo WatanabeUniversidad de Tsukuba, Japón
0000-0003-4350-0139
Dra. Ryoko Machida HiranoOrganización Nacional de Investigación en Agricultura y Alimentación (NARO-Japón)
0000-0002-7978-0235
Dr. Ignacio de los Ríos CarmenadoUniversidad Politécnica de Madrid, España
0000-0003-2015-8983
Dra. María de Lourdes Arévalo GalarzaColegio de Postgraduados, México
0000-0003-1474-2200
Dra. Libia Iris Trejo TéllezColegio de Postgraduados, México
0000-0001-8496-2095
Comité EditorialDr. Rafael Rodríguez Montessoro† - Director FundadorDr. Jorge Cadena Iñiguez - Editor en JefeDr. Fernando Carlos Gómez Merino - Editor de secciónDr. Ángel Bravo Vinaja - Curador de metadatosM.A. Ana Luisa Mejia Sandoval - AsistenteM.C. Moisés Quintana Arévalo - Cosechador de metadatosM.C. Valeria Abigail Martínez Sias - DiagramadorLic. Hannah Infante Lagarda - FilologoBiól. Valeria J. Gama Ríos - TraductorTéc. Mario Alejandro Rojas Sánchez - Diseñador
Frecuencia de publicación: Cuando un autor ha publicado en la revista como autor principal o de correspondencia, deberá esperar tres números de ésta para publicar nuevamente como autor principal o de correspondencia.
Idiomas de publicación: Se recibirán textos en inglés con títulos, resúmenes y palabras clave en inglés.
ID Autores: El nombre de los autores se escribirán comenzando con el apellido o apellidos unidos por guion, sólo las iniciales del nombre, separados por comas, con un índice progresivo en su caso. Es indis-pensable que todos y cada uno de los autores proporcionen su núme-ro de identificador normalizado ORCID, para mayor información ingresar a (https://orcid.org).
Institución de adscripción: Es indispensable señalar la institución de adscripción y país de todos y cada uno de los autores, indicando ex-clusivamente la institución de primer nivel, sin recurrir al uso de siglas o acrónimos. Se sugiere recurrir al uso de la herramienta wyta (http://wayta.scielo.org/) de Scielo para evitar el uso incorrecto de nombres de instituciones.
AGROPRODUCTIVIDAD
®
Es responsabilidad del autor el uso de las ilustraciones, el material gráfico y el contenido creado para esta publicación.
Las opiniones expresadas en este documento son de exclusiva responsabilidad de los autores, y no reflejan necesariamente los puntos de vista del Colegio de Postgraduados, de la Edito-rial del Colegio de Postgraduados, ni de la Fundación Cole-gio de Postgraduados en Ciencias Agrícolas.
CCAABB AABBSSTTRRAACCTTSS
CCAABBII
Master Journal List
Año 15, Volumen 15, Número 3, marzo 2022, Agro productividad es una publicación mensual editada por el Colegio de Postgraduados. Carretera México-Texcoco Km. 36.5, Montecillo, Texcoco, Estado de México. CP 56230. Tel. 5959284427. www.colpos.mx. Editor responsable: Dr. Jorge Cadena Iñiguez. Reservas de Derechos al Uso Exclusivo No. 04-2017-031313492200-203. ISSN: 2594-0252, ambos otorgados por el Instituto Nacional del Derecho de Autor. Responsable de la última actualización de este número, M.C. Valeria Abigail Martínez Sias. Fecha de última modificación, 5 de abril de 2022.
Las opiniones expresadas por los autores no necesariamente ref lejan la postura del editor de la publicación.
Contacto principalJorge Cadena IñiguezGuerrero 9, esquina avenida Hidalgo, C.P. 56220, San Luis Huexotla, Texcoco, Estado de Mé[email protected]
Contacto de [email protected]
Bases de datos de contenido científico Directorios
Colegio dePostgraduados
2 AGROPRODUCTIVIDAD
Anonimato en la identidad de los autores: Los artículos no debe-rán incluir en ni en cuerpo del artículo, ni en las notas a pie de página ninguna información que revele su identidad, esto con el fin de ase-gurar una evaluación anónima por parte de los pares académicos que realizarán el dictamen. Si es preciso, dicha información podrá agre-garse una vez que se acredite el proceso de revisión por pares.
Estructura de los artículos: Los artículos incluirán los siguientes elementos: Título, title, autores y adscripción, abstract, keywords, resumen, palabras clave, introducción, objetivos, materiales y mé-todos, resultados y discusión, conclusiones y literatura citada en for-mato APA.
Título: Debe ser breve y reflejar claramente el contenido, debe-rá estar escrito en español e inglés. Cuando se incluyan nombres científicos deben escribirse en itálicas. No deberá contener abre-viaturas ni exceder de 20 palabras, se usará solo letras mayúsculas, en negritas, centrado y no llevará punto final.Resumen y Abstract: Deberá integrarse un resumen en inglés y español (siguiendo ese orden), de máximo 250 palabras, donde se destaque obligatoriamente y en este orden: a) objetivo; b) diseño / metodología / aproximación; c) resultados; d) limitaciones / impli-caciones; e) hallazgos/ conclusiones. El resumen no deberá incluir citas, referencias bibliográficas, gráficas ni figuras.Palabras clave y Keywords: Se deberá incluir una lista de 3 a 5 palabras clave en español e inglés que permitan identificar el ámbito temático que aborda el artículo.Introducción: Se asentará con claridad el estado actual del co-nocimiento sobre el tema investigado, su justificación e importan-cia, así como los objetivos del trabajo. No deberá ser mayor a dos cuartillas.Materiales y Métodos: Se especificará cómo se llevó a cabo la investigación, incluyendo el tipo de investigación, diseño experi-mental (cuando se traten de investigaciones experimentales), equi-pos, substancias y materiales empleados, métodos, técnicas, proce-dimientos, así como el análisis estadístico de los datos obtenidos.Resultados y Discusión: Puede presentarse en una sola sección. En caso de presentarse de forma separada, la discusión debe enfo-carse a comentar los resultados (sin repetirlos), en términos de sus características mismas, su congruencia con la hipótesis planteada y sus semejanzas o diferencias con resultados de investigaciones similares previamente realizadas.Conclusiones: Son la generalización de los resultados obtenidos; deben ser puntuales, claras y concisas, y no deben llevar discusión, haciendo hincapié en los aspectos nuevos e importantes de los re-sultados obtenidos y que establezcan los parámetros finales de lo observado en el estudio.Agradecimientos: Son opcionales y tendrán un máximo de tres renglones para expresar agradecimientos a personas e institucio-nes que hayan contribuido a la realización del trabajo.Cuadros: Deben ser claros, simples y concisos. Se ubicarán in-mediatamente después del primer párrafo en el que se mencionen o al inicio de la siguiente cuartilla. Los cuadros deben numerarse progresivamente, indicando después de la referencia numérica el título del mismo (Cuadro 1. Título), y se colocarán en la parte superior. Al pie del cuadro se incluirán las aclaraciones a las que se hace mención mediante un índice en el texto incluido en el cuadro. Se recomienda que los cuadros y ecuaciones se preparen con el editor de tablas y ecuaciones del procesador de textos.Uso de siglas y acrónimos: Para el uso de acrónimos y siglas en el texto, la primera vez que se mencionen, se recomienda escri-bir el nombre completo al que corresponde y enseguida colocar la sigla entre paréntesis. Ejemplo: Petróleos Mexicanos (Pemex), después sólo Pemex.Elementos gráficos: Corresponden a dibujos, gráficas, diagra-mas y fotografías. Deben ser claros, simples y concisos. Se ubi-carán inmediatamente después del primer párrafo en el que se mencionen o al inicio de la siguiente cuartilla. Las figuras deben
numerarse progresivamente, indicando después de la referencia numérica el título del mismo (Figura 1. Título), y se colocarán en la parte inferior. Las fotografías deben ser de preferencia a colores y con una resolución de 300 dpi en formato JPG, TIF o RAW. El autor deberá enviar 2 fotografías adicionales para ilustrar la pági-na inicial de su contribución. Las gráficas o diagramas serán en formato de vectores (CDR, EPS, AI, WMF o XLS).Unidades. Las unidades de pesos y medidas usadas serán las aceptadas en el Sistema Internacional.Citas bibliográficas: deberán insertarse en el texto abriendo un paréntesis con el apellido del autor, el año de la publicación y la página, todo separado por comas. Ejemplo (Zheng et al., 2017). El autor puede introducir dos distintos tipos de citas:
Citas directas de menos de 40 palabras: Cuando se transcri-ben textualmente menos de 40 palabras, la cita se coloca entre comillas y al final se añade entre paréntesis el autor, el año y la página. Ejemplo:
Alineado al Plan Nacional de Desarrollo 2013-2018, (DOF, 2013), el Programa Sectorial de Desarrollo Agropecuario, Pesquero y Alimentario 2013-2018 establece “Construir un nuevo rostro del campo sustentado en un sector agroalimenta-rio productivo, competitivo, rentable, sustentable y justo que garantice la seguridad alimentaria del país” (DOF, 2013).
Citas indirectas o paráfrasis: Cuando se interpretan o se co-mentan ideas que son tomadas de otro texto, o bien cuando se expresa el mismo contenido pero con diferente estructura sintácti-ca. En este caso se debe indicar el apellido del autor y el año de la referencia de donde se toman las ideas. Ejemplo:
Los bajos rendimientos del cacao en México, de acuerdo con Avendaño et al. (2011) y Hernández-Gómez et al. (2015); se debe principalmente a la edad avanzada de las plantaciones.
Las referencias bibliográficas: al final del artículo deberán in-dicarse todas y cada una de las fuentes citadas en el cuerpo del texto (incluyendo notas, fuentes de los cuadros, gráficas, mapas, tablas, figuras etcétera). El autor(es) debe revisar cuidadosamente que no haya omisiones ni inconsistencias entre las obras citadas y la bibliografía. Se incluirá en la lista de referencias sólo las obras citadas en el cuerpo y notas del artículo. La bibliografía deberá presentarse estandarizada recurriendo a la norma APA, ordenarse alfabéticamente según los apellidos del autor. De haber dos obras o más del mismo autor, éstas se listan de manera cronológica iniciando con la más antigua. Obras de un mismo autor y año de publicación se les agregará a, b, c… Por ejemplo:
Ogata N. (2003a).Ogata N. (2003b).
Artículo de revista:Wang, P., Zhang, Y., Zhao, L., Mo, B., & Luo, T. (2017). Effect of Gamma Rays on Sophora davidii and Detection of DNA Polymorphism through ISSR Marker [Research article]. https://doi.org/10.1155/2017/8576404
Libro:Turner J. (1972). Freedom to build, dweller control of the housing process. New York: Macmillan.
Uso de gestores bibliográficos: Se dará prioridad a los artículos enviados con la bibliografía gestionada electrónicamen-te, y presentada con la norma APA. Los autores podrán recurrir al uso de cualquier gestor disponible en el mercado (Reference Manager, Crossref o Mendeley entre otros), o de código abierto tal como Refworks o Zotero.
Colegio dePostgraduados
3
Citation: Cruz-López, D. F., Caamal-Cauich, I., Pat-Fernández, Verna G, Ávila-Dorantes, J. A., & Gómez-Gómez A. A. (2022). Estimation of competitiveness indicators in avocado importing markets. Agro Productividad. https://doi.org/10.32854/agrop.v15i4.1887
Editor in Chief: Dr. Jorge Cadena Iñiguez
Received: November 25, 2020.Accepted: February 17, 2022.Published on-line: April 5, 2022.
Agro Productividad, 15(3). March. 2022. pp: 3-12.
This work is licensed under a Creative Commons Attribution-Non-Commercial 4.0 International license.
Estimation of competitiveness indicators in avocado importing marketsCruz-López, Diego F.1* ; Caamal-Cauich, I.1 ; Pat-Fernández, Verna G.1 ; Ávila-Dorantes, José A.1 ; Gómez-Gómez Alma A.1
1 Universidad Autónoma Chapingo, Carretera Federal México-Texcoco km. 38.5, Chapingo, Texcoco, Estado de México, C.P. 56230.
* Correspondence: [email protected]
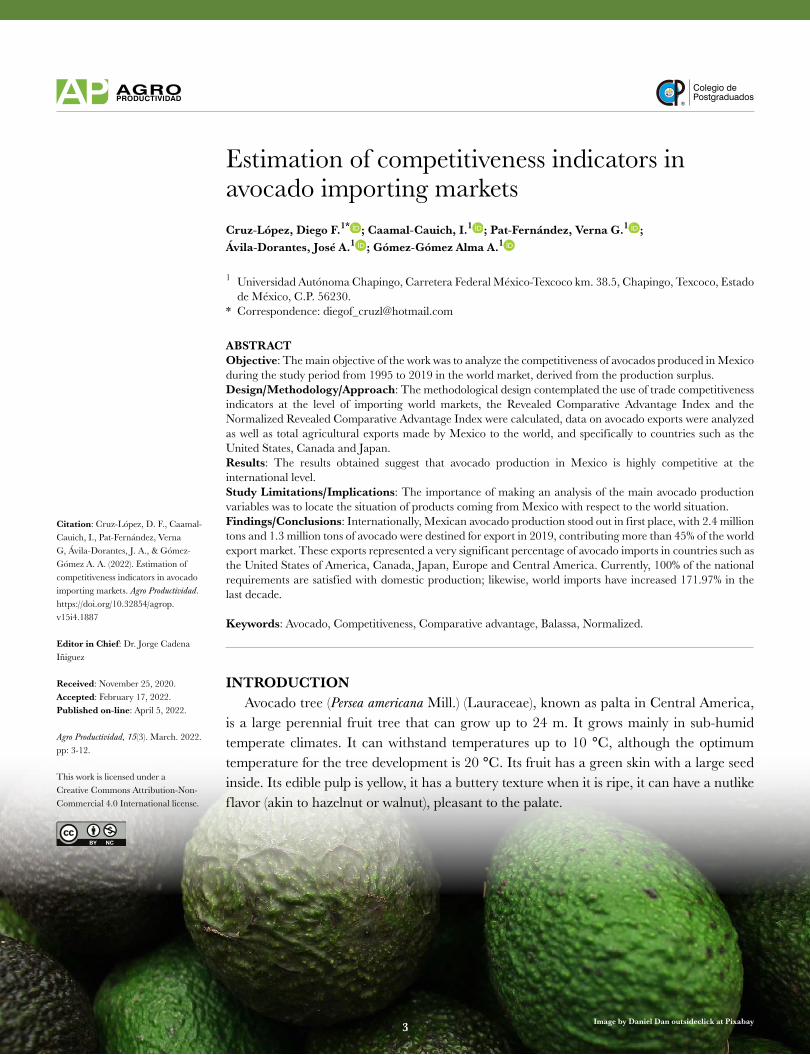
ABSTRACTObjective: The main objective of the work was to analyze the competitiveness of avocados produced in Mexico during the study period from 1995 to 2019 in the world market, derived from the production surplus.Design/Methodology/Approach: The methodological design contemplated the use of trade competitiveness indicators at the level of importing world markets, the Revealed Comparative Advantage Index and the Normalized Revealed Comparative Advantage Index were calculated, data on avocado exports were analyzed as well as total agricultural exports made by Mexico to the world, and specifically to countries such as the United States, Canada and Japan.Results: The results obtained suggest that avocado production in Mexico is highly competitive at the international level.Study Limitations/Implications: The importance of making an analysis of the main avocado production variables was to locate the situation of products coming from Mexico with respect to the world situation.Findings/Conclusions: Internationally, Mexican avocado production stood out in first place, with 2.4 million tons and 1.3 million tons of avocado were destined for export in 2019, contributing more than 45% of the world export market. These exports represented a very significant percentage of avocado imports in countries such as the United States of America, Canada, Japan, Europe and Central America. Currently, 100% of the national requirements are satisfied with domestic production; likewise, world imports have increased 171.97% in the last decade.
Keywords: Avocado, Competitiveness, Comparative advantage, Balassa, Normalized.
INTRODUCTION Avocado tree (Persea americana Mill.) (Lauraceae), known as palta in Central America, is a large perennial fruit tree that can grow up to 24 m. It grows mainly in sub-humid temperate climates. It can withstand temperatures up to 10 °C, although the optimum temperature for the tree development is 20 °C. Its fruit has a green skin with a large seed inside. Its edible pulp is yellow, it has a buttery texture when it is ripe, it can have a nutlike flavor (akin to hazelnut or walnut), pleasant to the palate.
3 Image by Daniel Dan outsideclick at Pixabay
4 Agro productividad 2022. https://doi.org/10.32854/agrop.v15i4.1887
Avocados are used as a complement to a wide variety of foods, due to their high proteins, vitamins, and minerals content. Oils can be extracted from their high fatty matter which, once processed, are used in the cosmetic and pharmaceutical industry. Mexico is one of the largest producing and consuming countries. Avocado is grown in 177,000 hectares, 85% of which are in the State of Michoacán (Consejo Nacional Agropecuario, 2019). In fact, especially in Mexico, dynamics of world avocado production respond to exports. Hass is the most consumed avocado variety in Mexico. In Mexico, the annual per capita consumption of this variety was 3.5 kg in 2019 (USDA, 2019). Mexico is the main avocado producer worldwide: in 2019, it concentrated 30.19% of the world production, followed by Indonesia (6.75%) and Dominican Republic (6.65%) (FAOSTAT, 2019). Mexico has a major role in avocado production and as a price setter country. With a record production of 1,997,629 tons in 2019, Mexico strengthened its position as the main global avocado supplier, with presence in markets of Europe, Asia, Australia, North, Central, and South America. Mexican avocado is a successful export product. México is the main avocado supplier in the international market with a 45.95% share of the world exports value. Exports place Mexico as the main avocado marketer in the world. Currently, the United States of America is the main buyer of Mexican avocado: approximately 75% of its imports come from Mexico, while these represent about 85% of total exports. Avocado demand has increased in 26 countries, including the United States of America, Canada, Japan, Guatemala, and El Salvador (Fundación Produce Michoacán, 2018). The Mexican avocado also arrives to China and member countries of the European Union and the Trans-Pacific Partnership (TPP), as well as nations without free trade agreements with Mexico (Fundación Produce Michoacán, 2018).From 2016 to 2019, the average sales of Mexican avocados to the world were 1,740 million dollars, with a 15.2% Average Annual Growth Rate (AAGR). The main export destinations for this product are the United States of America, Japan, Canada, Spain, France, the Netherlands, El Salvador, China, Honduras, and Guatemala, which together account for approximately 98% of total exports. USA accounts for approximately 76.8% of the Mexican fruit purchases, followed by Japan (7.0%), Canada (6.7%), Spain (1.7%), France (1.7%), and the Netherlands (1.6%) (TRADEMAP, 2019). At the end of 2019, agrifood exports amounted to 29 billion dollars, 34.4% of which was concentrated in products such as beer, tomato, avocado, bovine cattle, beef, and tequila (Consejo Nacional Agropecuario, 2019). The importance of Mexican avocado is growing: out of every ten avocados marketed worldwide, approximately three are sold by Mexican producers (FAOSTAT, 2019). There are two approaches to measure competitiveness: one of them uses direct indicators through production cost comparisons in competing countries or regions, adjusted by logistics costs (transport costs) and marketing support services costs (contributions, fees, and profit margins) (Cafiero, 2006). This comparison is useful, but it has limitations, such as the different transportation costs or the lack of information (Sharples, 1990). Another option is to measure competitiveness through indirect indicators, such as market share or any revealed comparative advantage index. This approach also has
5 Agro productividad 2022. https://doi.org/10.32854/agrop.v15i4.1887
limitations —such as the information searching complexity or the calculation method—, but it has the advantage that it can be calculated with current trade statistics (Fundación Produce Michoacán, 2018). Comparative advantage is a necessary theoretical element to explain the international trade origins. The basis of this theory can be found in Adam Smith and his Inquiry into the Nature and Causes of the Wealth of Nations, in which he discusses the trade logic between people and between countries. This logic is based on the suitability of specializing in the production of what a country can produce at a lower cost and trade it for what other countries do best, for the benefit of both parts; this is the classic division of labor, which depends on the differences of capital, workers, and natural resources, as well as other elements (Ríos, 2006). Subsequently, David Ricardo extended this Division of Labor Theory to the comparative advantage. Heckscher and Ohlin predict that, if a country has a relative abundance of a factor (labor or capital), it will have a comparative and competitive advantage regarding those goods that need a greater number of the said factor: i.e., countries tend to export goods that are intensive in the factors which they have in abundance (Krugman, 2001). The aforementioned model is also known as the factor proportions theory. However, the comparative advantage can be empirically measured by the Revealed Comparative Advantage (RCA) Indexes, which are calculated from observable trade patterns that allow such advantage to be distinguished. This research contributes to the discussion about the vegetable-fruit product competitiveness issue and its close relationship with outstanding performance as an exporter. Specifically, it aims to analyze the aspects related to the competitiveness of avocado produced in Mexico from 1995 to 2019, characterizing the economic variables of the worldwide avocado production and trade.
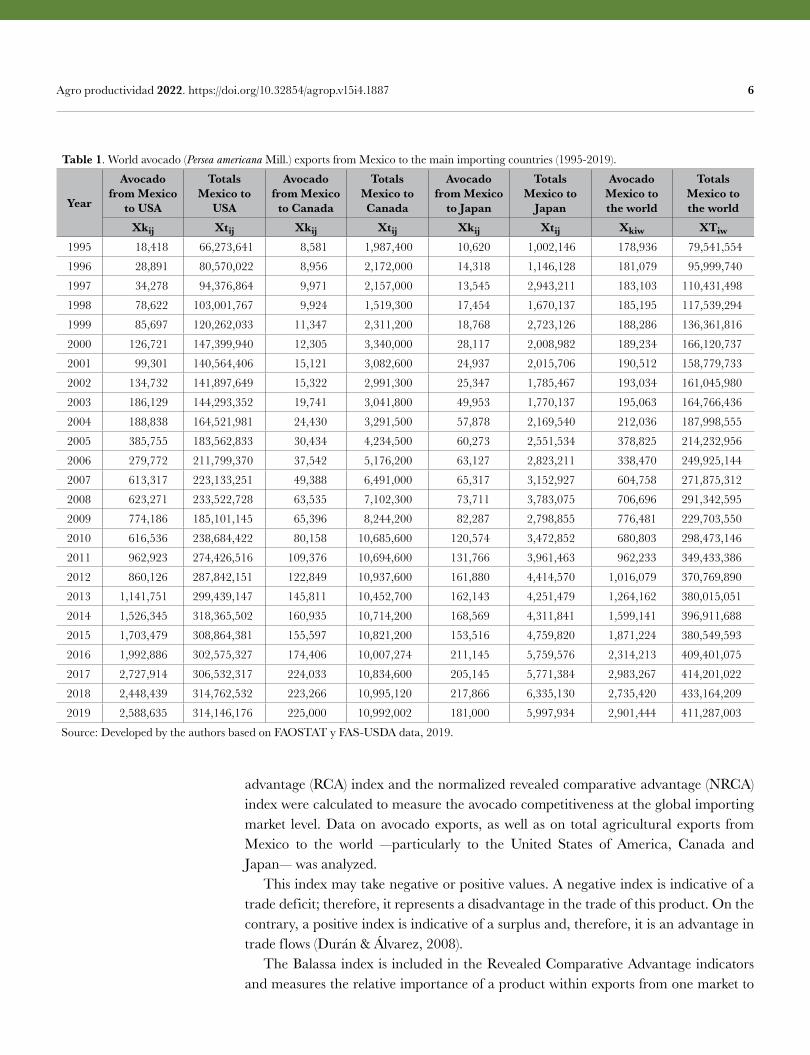
MATERIALS AND METHODSInformation and variables The information about the variables was obtained from the United Nations Statistics Division of the Food and Agriculture Organization (FAOSTAT), United States Department of Agriculture-Foreign Agricultural Service (FAS-USDA), and Hass Avocado Market Information (INFOHASS). The information on the production variables was obtained from these sources, as well as the statistics corresponding to worldwide avocado imports and exports to the United States of America, Canada and Japan. As a result of the said surplus, the period from 1995 to 2019 was analyzed to calculate RCA and NRCA. The information obtained is shown in Table 1.
Indicators of revealed comparative advantage Specifically, the information analysis was performed to calculate the revealed comparative advantage (RCA) index and the normalized revealed comparative advantage (NRCA) index which are described below:
a) Revealed Comparative Advantage (RCA) Index. Competitiveness can be measured at various levels: country, sector, company. In this study the revealed comparative
6 Agro productividad 2022. https://doi.org/10.32854/agrop.v15i4.1887
advantage (RCA) index and the normalized revealed comparative advantage (NRCA) index were calculated to measure the avocado competitiveness at the global importing market level. Data on avocado exports, as well as on total agricultural exports from Mexico to the world —particularly to the United States of America, Canada and Japan— was analyzed. This index may take negative or positive values. A negative index is indicative of a trade deficit; therefore, it represents a disadvantage in the trade of this product. On the contrary, a positive index is indicative of a surplus and, therefore, it is an advantage in trade flows (Durán & Álvarez, 2008). The Balassa index is included in the Revealed Comparative Advantage indicators and measures the relative importance of a product within exports from one market to
Table 1. World avocado (Persea americana Mill.) exports from Mexico to the main importing countries (1995-2019).
Year
Avocado from Mexico
to USA
Totals Mexico to
USA
Avocado from Mexico
to Canada
Totals Mexico to Canada
Avocado from Mexico
to Japan
Totals Mexico to
Japan
Avocado Mexico to the world
Totals Mexico to the world
Xkij Xtij Xkij Xtij Xkij Xtij Xkiw XTiw
1995 18,418 66,273,641 8,581 1,987,400 10,620 1,002,146 178,936 79,541,554
1996 28,891 80,570,022 8,956 2,172,000 14,318 1,146,128 181,079 95,999,740
1997 34,278 94,376,864 9,971 2,157,000 13,545 2,943,211 183,103 110,431,498
1998 78,622 103,001,767 9,924 1,519,300 17,454 1,670,137 185,195 117,539,294
1999 85,697 120,262,033 11,347 2,311,200 18,768 2,723,126 188,286 136,361,816
2000 126,721 147,399,940 12,305 3,340,000 28,117 2,008,982 189,234 166,120,737
2001 99,301 140,564,406 15,121 3,082,600 24,937 2,015,706 190,512 158,779,733
2002 134,732 141,897,649 15,322 2,991,300 25,347 1,785,467 193,034 161,045,980
2003 186,129 144,293,352 19,741 3,041,800 49,953 1,770,137 195,063 164,766,436
2004 188,838 164,521,981 24,430 3,291,500 57,878 2,169,540 212,036 187,998,555
2005 385,755 183,562,833 30,434 4,234,500 60,273 2,551,534 378,825 214,232,956
2006 279,772 211,799,370 37,542 5,176,200 63,127 2,823,211 338,470 249,925,144
2007 613,317 223,133,251 49,388 6,491,000 65,317 3,152,927 604,758 271,875,312
2008 623,271 233,522,728 63,535 7,102,300 73,711 3,783,075 706,696 291,342,595
2009 774,186 185,101,145 65,396 8,244,200 82,287 2,798,855 776,481 229,703,550
2010 616,536 238,684,422 80,158 10,685,600 120,574 3,472,852 680,803 298,473,146
2011 962,923 274,426,516 109,376 10,694,600 131,766 3,961,463 962,233 349,433,386
2012 860,126 287,842,151 122,849 10,937,600 161,880 4,414,570 1,016,079 370,769,890
2013 1,141,751 299,439,147 145,811 10,452,700 162,143 4,251,479 1,264,162 380,015,051
2014 1,526,345 318,365,502 160,935 10,714,200 168,569 4,311,841 1,599,141 396,911,688
2015 1,703,479 308,864,381 155,597 10,821,200 153,516 4,759,820 1,871,224 380,549,593
2016 1,992,886 302,575,327 174,406 10,007,274 211,145 5,759,576 2,314,213 409,401,075
2017 2,727,914 306,532,317 224,033 10,834,600 205,145 5,771,384 2,983,267 414,201,022
2018 2,448,439 314,762,532 223,266 10,995,120 217,866 6,335,130 2,735,420 433,164,209
2019 2,588,635 314,146,176 225,000 10,992,002 181,000 5,997,934 2,901,444 411,287,003
Source: Developed by the authors based on FAOSTAT y FAS-USDA data, 2019.
7 Agro productividad 2022. https://doi.org/10.32854/agrop.v15i4.1887
another market versus the importance of exports of the same product in worldwide exportation. It was calculated as follows:
(1) RCAkij(Xkij / XTij ) / (Xkiw / XTiw )
Where: RCAkij: Revealed Comparative Advantage Index of product k from country i to country j; Xkij: Exports of product k from country i to country j; Xtij: Total exports from country i to country j; Xkiw: Worldwide exports of product k from country i; XTiw: Total worldwide exports from country i.
b) Normalized Revealed Comparative Advantage (NRCA) Index is another variable which is calculated with the coefficient of world imports of the product as the denominator coefficient of exports at the product level, in order to obtain a specialization index.
The calculated index can take values between 1 and 1, where values between 0.33 and 1 ref lect a comparative advantage for the country and, consequently, mean that trade with the analyzed country is favorable. Meanwhile, values between 0.33 and 1 ref lect a comparative disadvantage for the country. Finally, values between 0.33 and 0.33 show a tendency towards intra-product trade, meaning that products of the same technological group are exchanged (Durán and Álvarez, 2008).
To improve the RCA analysis (Durán and Álvarez (2008)), the index is normalized to a maximum of 1 and a minimum of 1, as follows:
(2) NRCA(RCA1) / (RCA1)
Where: NRCA: Normalized Revealed Comparative Advantage Index; RCA: Revealed Comparative Advantage Index.
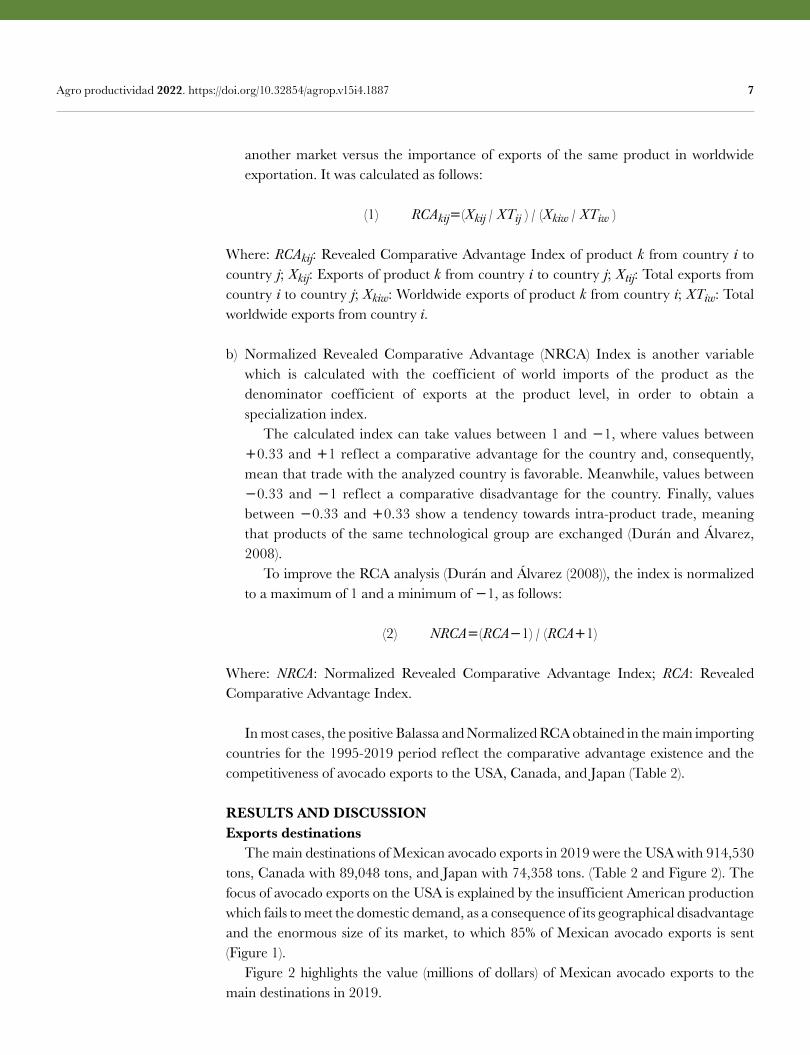
In most cases, the positive Balassa and Normalized RCA obtained in the main importing countries for the 1995-2019 period reflect the comparative advantage existence and the competitiveness of avocado exports to the USA, Canada, and Japan (Table 2).
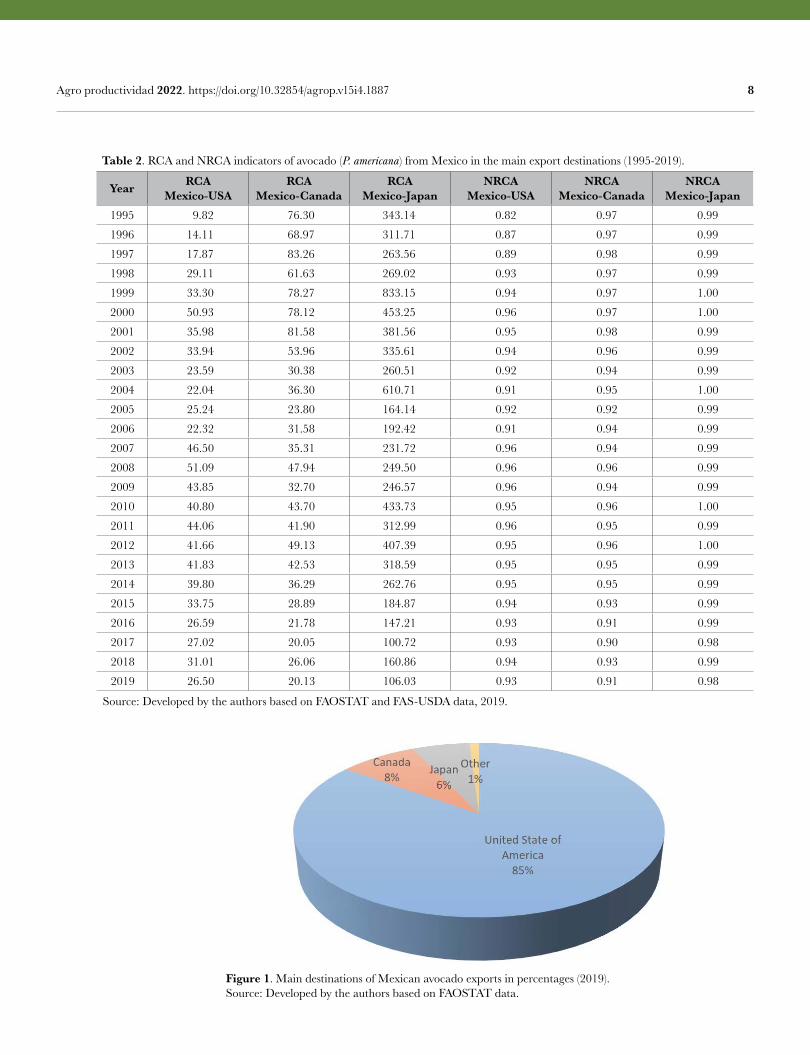
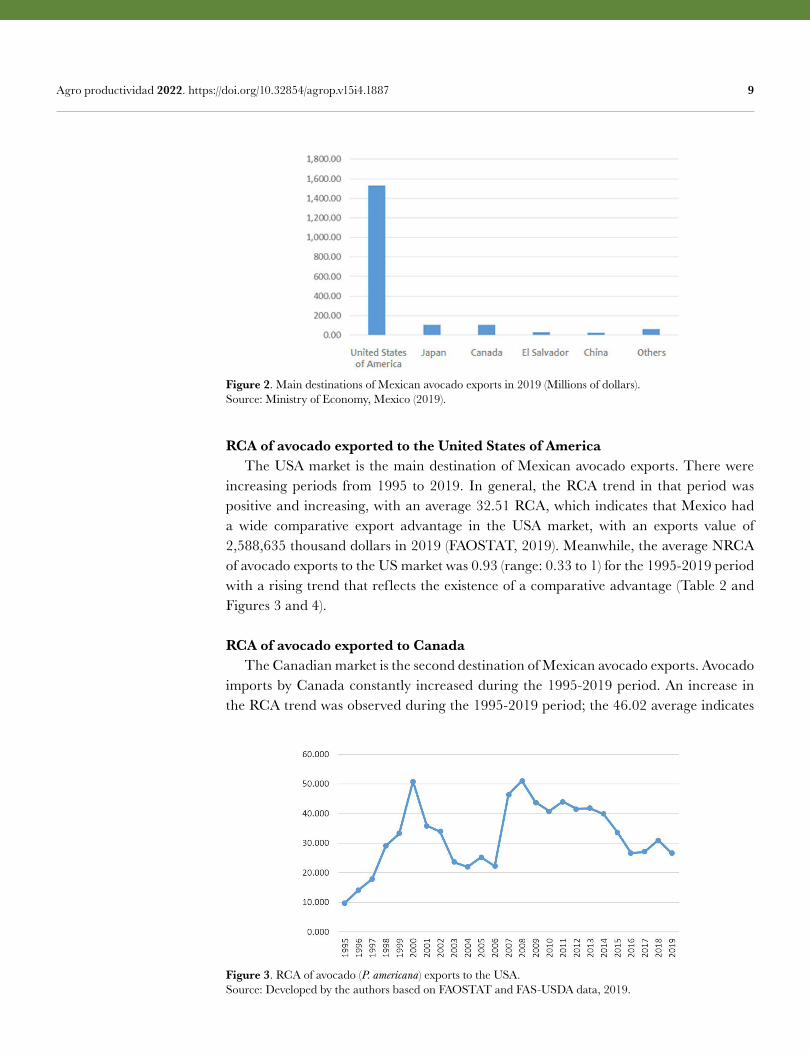
RESULTS AND DISCUSSIONExports destinations The main destinations of Mexican avocado exports in 2019 were the USA with 914,530 tons, Canada with 89,048 tons, and Japan with 74,358 tons. (Table 2 and Figure 2). The focus of avocado exports on the USA is explained by the insufficient American production which fails to meet the domestic demand, as a consequence of its geographical disadvantage and the enormous size of its market, to which 85% of Mexican avocado exports is sent (Figure 1). Figure 2 highlights the value (millions of dollars) of Mexican avocado exports to the main destinations in 2019.
8 Agro productividad 2022. https://doi.org/10.32854/agrop.v15i4.1887
Table 2. RCA and NRCA indicators of avocado (P. americana) from Mexico in the main export destinations (1995-2019).
Year RCA Mexico-USA
RCA Mexico-Canada
RCA Mexico-Japan
NRCA Mexico-USA
NRCA Mexico-Canada
NRCA Mexico-Japan
1995 9.82 76.30 343.14 0.82 0.97 0.99
1996 14.11 68.97 311.71 0.87 0.97 0.99
1997 17.87 83.26 263.56 0.89 0.98 0.99
1998 29.11 61.63 269.02 0.93 0.97 0.99
1999 33.30 78.27 833.15 0.94 0.97 1.00
2000 50.93 78.12 453.25 0.96 0.97 1.00
2001 35.98 81.58 381.56 0.95 0.98 0.99
2002 33.94 53.96 335.61 0.94 0.96 0.99
2003 23.59 30.38 260.51 0.92 0.94 0.99
2004 22.04 36.30 610.71 0.91 0.95 1.00
2005 25.24 23.80 164.14 0.92 0.92 0.99
2006 22.32 31.58 192.42 0.91 0.94 0.99
2007 46.50 35.31 231.72 0.96 0.94 0.99
2008 51.09 47.94 249.50 0.96 0.96 0.99
2009 43.85 32.70 246.57 0.96 0.94 0.99
2010 40.80 43.70 433.73 0.95 0.96 1.00
2011 44.06 41.90 312.99 0.96 0.95 0.99
2012 41.66 49.13 407.39 0.95 0.96 1.00
2013 41.83 42.53 318.59 0.95 0.95 0.99
2014 39.80 36.29 262.76 0.95 0.95 0.99
2015 33.75 28.89 184.87 0.94 0.93 0.99
2016 26.59 21.78 147.21 0.93 0.91 0.99
2017 27.02 20.05 100.72 0.93 0.90 0.98
2018 31.01 26.06 160.86 0.94 0.93 0.99
2019 26.50 20.13 106.03 0.93 0.91 0.98
Source: Developed by the authors based on FAOSTAT and FAS-USDA data, 2019.
Figure 1. Main destinations of Mexican avocado exports in percentages (2019).Source: Developed by the authors based on FAOSTAT data.
9 Agro productividad 2022. https://doi.org/10.32854/agrop.v15i4.1887
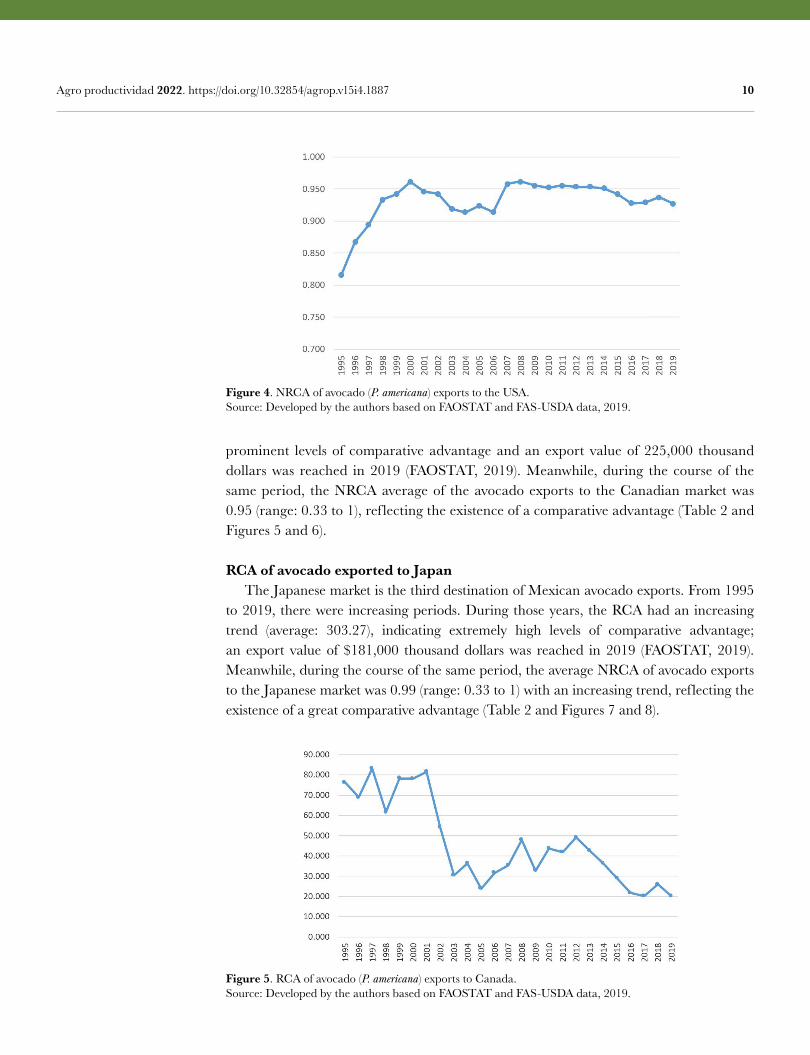
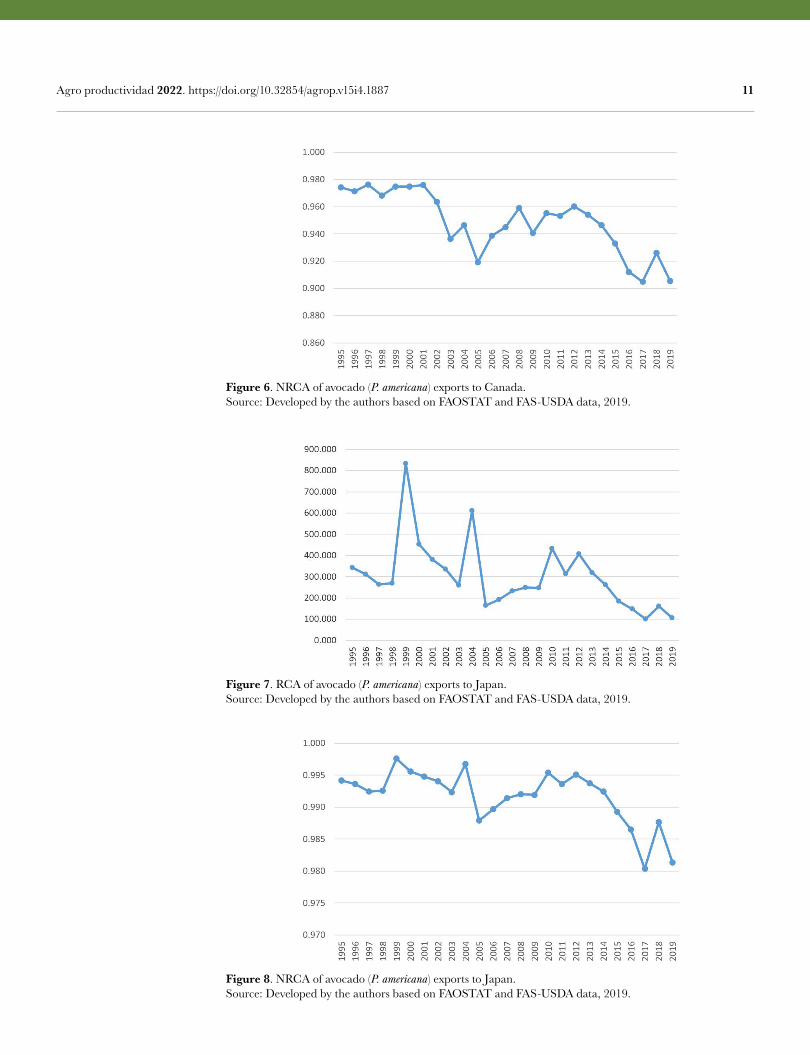
RCA of avocado exported to the United States of America The USA market is the main destination of Mexican avocado exports. There were increasing periods from 1995 to 2019. In general, the RCA trend in that period was positive and increasing, with an average 32.51 RCA, which indicates that Mexico had a wide comparative export advantage in the USA market, with an exports value of 2,588,635 thousand dollars in 2019 (FAOSTAT, 2019). Meanwhile, the average NRCA of avocado exports to the US market was 0.93 (range: 0.33 to 1) for the 1995-2019 period with a rising trend that ref lects the existence of a comparative advantage (Table 2 and Figures 3 and 4).
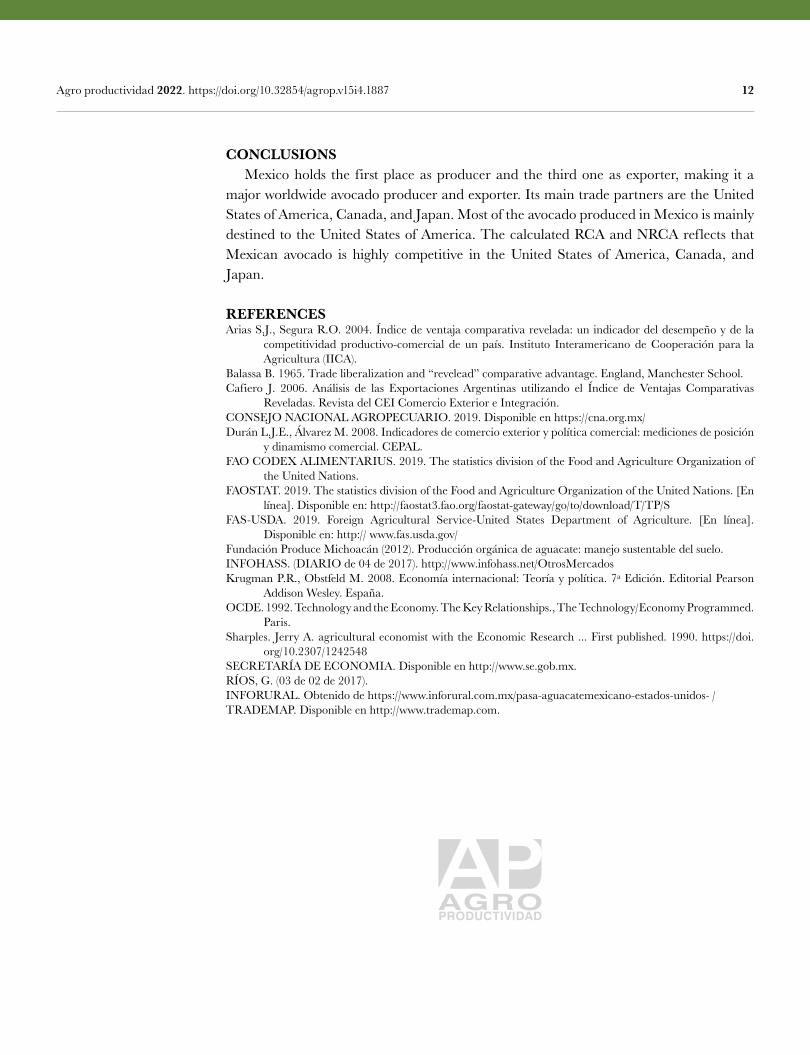
RCA of avocado exported to Canada The Canadian market is the second destination of Mexican avocado exports. Avocado imports by Canada constantly increased during the 1995-2019 period. An increase in the RCA trend was observed during the 1995-2019 period; the 46.02 average indicates
Figure 2. Main destinations of Mexican avocado exports in 2019 (Millions of dollars).Source: Ministry of Economy, Mexico (2019).
Figure 3. RCA of avocado (P. americana) exports to the USA.Source: Developed by the authors based on FAOSTAT and FAS-USDA data, 2019.
10 Agro productividad 2022. https://doi.org/10.32854/agrop.v15i4.1887
Figure 4. NRCA of avocado (P. americana) exports to the USA.Source: Developed by the authors based on FAOSTAT and FAS-USDA data, 2019.
prominent levels of comparative advantage and an export value of 225,000 thousand dollars was reached in 2019 (FAOSTAT, 2019). Meanwhile, during the course of the same period, the NRCA average of the avocado exports to the Canadian market was 0.95 (range: 0.33 to 1), ref lecting the existence of a comparative advantage (Table 2 and Figures 5 and 6).
RCA of avocado exported to Japan The Japanese market is the third destination of Mexican avocado exports. From 1995 to 2019, there were increasing periods. During those years, the RCA had an increasing trend (average: 303.27), indicating extremely high levels of comparative advantage; an export value of $181,000 thousand dollars was reached in 2019 (FAOSTAT, 2019). Meanwhile, during the course of the same period, the average NRCA of avocado exports to the Japanese market was 0.99 (range: 0.33 to 1) with an increasing trend, reflecting the existence of a great comparative advantage (Table 2 and Figures 7 and 8).
Figure 5. RCA of avocado (P. americana) exports to Canada.Source: Developed by the authors based on FAOSTAT and FAS-USDA data, 2019.
11 Agro productividad 2022. https://doi.org/10.32854/agrop.v15i4.1887
Figure 8. NRCA of avocado (P. americana) exports to Japan.Source: Developed by the authors based on FAOSTAT and FAS-USDA data, 2019.
Figure 6. NRCA of avocado (P. americana) exports to Canada.Source: Developed by the authors based on FAOSTAT and FAS-USDA data, 2019.
Figure 7. RCA of avocado (P. americana) exports to Japan.Source: Developed by the authors based on FAOSTAT and FAS-USDA data, 2019.
12 Agro productividad 2022. https://doi.org/10.32854/agrop.v15i4.1887
CONCLUSIONS Mexico holds the first place as producer and the third one as exporter, making it a major worldwide avocado producer and exporter. Its main trade partners are the United States of America, Canada, and Japan. Most of the avocado produced in Mexico is mainly destined to the United States of America. The calculated RCA and NRCA reflects that Mexican avocado is highly competitive in the United States of America, Canada, and Japan.
REFERENCESArias S.J., Segura R.O. 2004. Índice de ventaja comparativa revelada: un indicador del desempeño y de la
competitividad productivo-comercial de un país. Instituto Interamericano de Cooperación para la Agricultura (IICA).
Balassa B. 1965. Trade liberalization and “revelead” comparative advantage. England, Manchester School.Cafiero J. 2006. Análisis de las Exportaciones Argentinas utilizando el Índice de Ventajas Comparativas
Reveladas. Revista del CEI Comercio Exterior e Integración.CONSEJO NACIONAL AGROPECUARIO. 2019. Disponible en https://cna.org.mx/Durán L.J.E., Álvarez M. 2008. Indicadores de comercio exterior y política comercial: mediciones de posición
y dinamismo comercial. CEPAL.FAO CODEX ALIMENTARIUS. 2019. The statistics division of the Food and Agriculture Organization of
the United Nations. FAOSTAT. 2019. The statistics division of the Food and Agriculture Organization of the United Nations. [En
línea]. Disponible en: http://faostat3.fao.org/faostat-gateway/go/to/download/T/TP/SFAS-USDA. 2019. Foreign Agricultural Service-United States Department of Agriculture. [En línea].
Disponible en: http:// www.fas.usda.gov/Fundación Produce Michoacán (2012). Producción orgánica de aguacate: manejo sustentable del suelo. INFOHASS. (DIARIO de 04 de 2017). http://www.infohass.net/OtrosMercados Krugman P.R., Obstfeld M. 2008. Economía internacional: Teoría y política. 7ª Edición. Editorial Pearson
Addison Wesley. España.OCDE. 1992. Technology and the Economy. The Key Relationships., The Technology/Economy Programmed.
Paris.Sharples. Jerry A. agricultural economist with the Economic Research ... First published. 1990. https://doi.
org/10.2307/1242548SECRETARÍA DE ECONOMIA. Disponible en http://www.se.gob.mx. RÍOS, G. (03 de 02 de 2017). INFORURAL. Obtenido de https://www.inforural.com.mx/pasa-aguacatemexicano-estados-unidos- /TRADEMAP. Disponible en http://www.trademap.com.
Colegio dePostgraduados
13
Factors influencing caking of cane sugar Hernández- Reyes, María Lourdes1; Hidalgo-Contreras, Juan Valente1*; Hernández- Cázares, Aleida Selene1; Pascual-Ramírez, Juan2
1 Colegio de Postgraduados. Campus Córdoba. Carretera Federal Córdoba-Veracruz km 348, Manuel León, Amatlán de los Reyes, Veracruz, México. C. P. 94953.
2 Instituto Politécnico Nacional (IPN). Av. Luis Enrique Erro S/N, Unidad Profesional Adolfo López Mateos, Zacatenco, Alcaldía Gustavo A. Madero, C.P. 07738, Ciudad de México.
* Correspondence: [email protected]
ABSTRACTObjective: To identify variables that influence the cane sugar caking process in order to develop a path diagram showing the possible cause-effect relationship between caking and the factors leading to it.Design/methodology/approach: The methodological work was based on a literature review of the subject following a search through the databases of indexed scientific journals.Results: Based on the literature review, the most cited causal factors of cane sugar caking are physicochemical properties, packaging, and storage conditions. These factors were used in constructing the path diagram of the caking phenomenon. Study limitations/implications: Studies carried out on the cause-effect relationship behind this phenomenon have been very limited as evidenced by the small number of scientific papers found on this subject in the search. Additionally, most of these articles are not recent. Findings/Conclusions: The main factors affecting the development of caking in cane sugar can be classified as: physicochemical (moisture, product temperature and particle size), packaging (liner) and storage conditions (ambient relative humidity and temperature).
Keywords: Lumpiness, sugar, path diagrams.
INTRODUCTION The sugar industry is considered one of the oldest in the world. One of the first technologies that gave way to what we know today as mills were trapiches, which used animal power to grind sugar cane to obtain panela, an unrefined whole cane sugar. Later, sugar mills emerged (Von Wobeser, 1988). Currently, Mexico has 51 sugar mills, distributed in 7 regions and 15 states (CONADESUCA, 2019). During the 2020-2021 harvest in Mexico, 49 of the 51 mills in the country were in operation, industrializing a total of 790,000 ha of sugarcane and milling 51 million tons of sugarcane resulting in 5.7 million tons of sugar (CONADESUCA, 2021). The state of Veracruz is home to 18 of the 51 above-mentioned mills, which produced around 2,499,011 tons of sugar, of which 461,725 tons correspond to refined sugar produced by only 4 of the 18 mills in the state (CONADESUCA, 2021). In addition, the sugar agroindustry in Mexico has a very important social weight, providing at least 2 million jobs directly or indirectly to people engaged in activities within the chain (Aguilar-Rivera et al., 2017).
Citation: Hernández- Reyes, M. L., Hidalgo-Contreras, J. V., Hernández- Cázares, A. S. & Pascual-Ramírez, J. (2022). Factors influencing caking of cane sugar. Agro Productividad. https://doi.org/ 10.32854/agrop.v15i4.1992
Editor in Chief: Dr. Jorge Cadena Iñiguez
Received: April 8, 2021.Accepted: February 19, 2022.Published on-line: April 5, 2022.
Agro Productividad, 15(3). March. 2022. pp: 13-19.
This work is licensed under a Creative Commons Attribution-Non-Commercial 4.0 International license.
14 Agro productividad 2022. https://doi.org/10.32854/agrop.v15i4.1992
Against this background, it is of the utmost importance to conduct relevant research that can benefit each of the seven links in the value chain, including cultivation and harvesting, transportation of sugarcane from the field to the factory where it is transformed into sugar, direct or indirect marketing, transportation for sugar distribution, and marketing of the product for direct use, industrial use, and, lastly, the final consumer (Aguilar-Rivera et al., 2017). According to Aguilar-Rivera (2014), the sugar agroindustry has competitiveness problems because it is not energy self-sufficient. As a result, Mexico does not have the capacity to be a sugar exporter. For this reason, the domestic market becomes the basis for the sugar trade. Therefore, the objectives should be focused on reducing field, factory and administration costs (Aguilar-Rivera N., 2010). Sugar caking is a phenomenon that affects the marketing of the product because it does not allow its f luidity during industrial use, making it difficult to apply as a raw material in the food industry. Therefore, this study uses causal analysis to contribute to the identification and quantification of the factors that cause it, which could subsequently contribute to a better understanding of the phenomenon. This study aimed to contribute to improving the competitiveness of the sugar agroindustry by identifying the most relevant factors involved in caking, which has a direct impact on the quality of the final product.
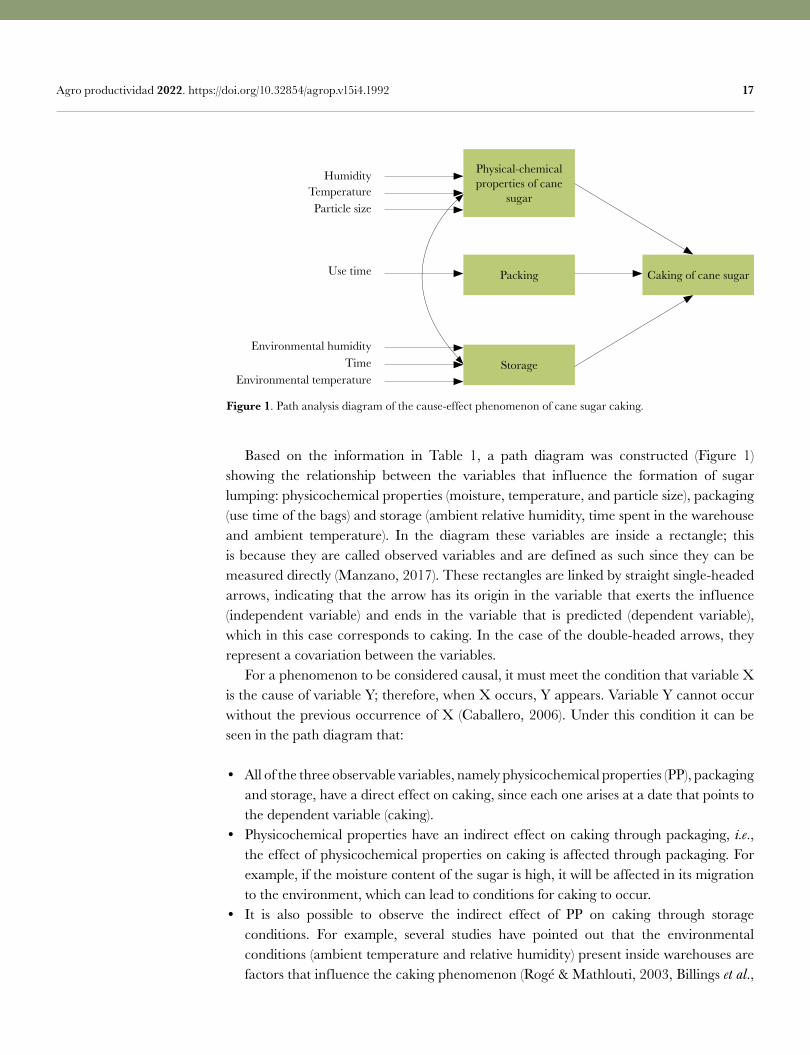
MATERIALS AND METHODS Path analysis is the predecessor model to structural equations. These analyses had their origin in 1917 when the American geneticist Sewall G. Wright designed a model with which he intended to explain the genetic influence between littermates. The relationships found by Wright were represented in a path diagram. In the early 1970s this methodology was taken up and improved by economists and sociologists, making it much more effective, the so-called path analysis, today known as structural equation modeling (Garcia V., 2011). Path analysis is a methodology that facilitates the study of a system of structural equations and is based on three essential components: the path diagram, the identification of correlations and covariance, and the distinction between direct and indirect effects. These diagrams enable visualizing the theory being proposed, since doing so with mathematical equations would make it difficult to understand (Medrano & Muñoz-Navarro, 2017). Figure 1 shows what a path diagram consists of. Through it, direct and indirect effects can be identified; for example, physicochemical properties have a direct effect on caking, but also have an indirect effect on this phenomenon through packaging. The structural equation representing the path diagram in Figure 1 is:
Caking11Physicochemical properties21Packaging31StorageE
where: ij correspond to the correlations associated with the i-th effect of the j-th causal and E is the random error.
To carry out the structural equation methodology, Cupani (2012) recommends following six stages: specification, identification, parameter estimation, fit evaluation, model re-
15 Agro productividad 2022. https://doi.org/10.32854/agrop.v15i4.1992
specification and, finally, interpretation of the results (Cupani, 2012). In this sense, this work shows the specification stage, in which knowledge and understanding of the theory related to the phenomenon to be studied, in this case, caking, is a priority. To achieve this specification, an exhaustive literature review of previous research and theories related to the phenomenon must be carried out. If this stage is not carried out properly, the results may lead to situations where the expected parameters are not correctly assigned. In this study, a search was carried out in the bibliographic databases of the Colegio de Postgraduados and Google Scholar, which in turn directed us to various journals such as the Journal of Food engineering, Advanced Power Technology, and Procedia Engineering. The keywords used in the search were aterronamiento de azúcar and compactación de azúcar. In order to broaden the search, sugar lump, lump, and caking sugar were used, which provided better results. The search was conducted on the basis of research published over the previous ten years; a long time span due to the fact that very few studies have been carried out on this phenomenon. Once the studies were reviewed, a table divided into three columns was drawn up containing the name of the author and the date of his/her work, the research work carried out and finally the causes that led to the caking found by the authors, with the aim of identifying and classifying the causes. Subsequently, the path diagram was made. It should be noted that for this stage there is no methodology as such, but rather the diagrams are built based on the understanding of the phenomenon shown by the researchers, the interaction, and the direction between the variables.
RESULTS AND DISCUSSION Caking is a phenomenon that can be observed during the storage and distribution stages. It is due to the sensitivity of sugar to environmental conditions and grain size. These conditions promote the formation of a crystalline interface and liquid bridges between sugar grains that form a conglomerate unable to flow, which can only be reversed by mechanical means (Castrillon et al., 2011). Sugar is mainly used for domestic consumption and as a raw material for industry. When the lumpiness characteristic is present, its use becomes difficult, and this is a reason for rejecting the product (Pascual-Ramirez et al., 2016). Christakis et al. (2006) explain caking as the exchange of surface water between product particles. When this exchange occurs, the particles absorb moisture and join by means of liquid bridges and when they dry out, they become solid. These bridges can have different strengths related to water activity (Aw) conditions. At an Aw of 0.8, solid bridges become two to three times stronger than liquid bridges (Billings et al., 2006). Regarding this phenomenon, useful research has been carried out for sugar manufacturers in order to minimize this defect in sugar, as well as its negative repercussions. Tait et al. (2010) placed sugar in a dryer in which the air flow was mainly modified, preserving most of the parts of the original machinery but changing the location of some of them for storage in a silo, thus achieving great advances in minimizing the appearance of lumps in the finished product and thereby avoiding the use of machinery provided for the decompaction of packaged sugar. Chitprasert et al. (2006) carried out studies on the effects of grain size, reducing sugar content, temperature, and pressure on caking of cane sugar. Using water
16 Agro productividad 2022. https://doi.org/10.32854/agrop.v15i4.1992
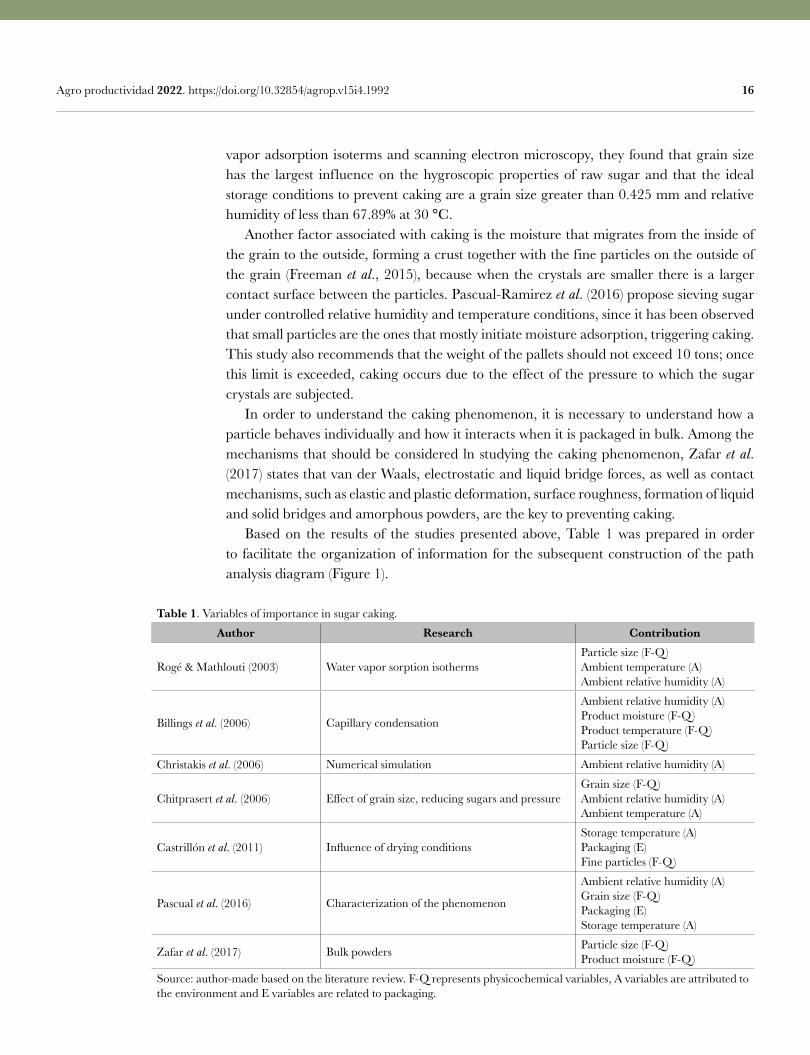
vapor adsorption isoterms and scanning electron microscopy, they found that grain size has the largest influence on the hygroscopic properties of raw sugar and that the ideal storage conditions to prevent caking are a grain size greater than 0.425 mm and relative humidity of less than 67.89% at 30 °C. Another factor associated with caking is the moisture that migrates from the inside of the grain to the outside, forming a crust together with the fine particles on the outside of the grain (Freeman et al., 2015), because when the crystals are smaller there is a larger contact surface between the particles. Pascual-Ramirez et al. (2016) propose sieving sugar under controlled relative humidity and temperature conditions, since it has been observed that small particles are the ones that mostly initiate moisture adsorption, triggering caking. This study also recommends that the weight of the pallets should not exceed 10 tons; once this limit is exceeded, caking occurs due to the effect of the pressure to which the sugar crystals are subjected. In order to understand the caking phenomenon, it is necessary to understand how a particle behaves individually and how it interacts when it is packaged in bulk. Among the mechanisms that should be considered ln studying the caking phenomenon, Zafar et al. (2017) states that van der Waals, electrostatic and liquid bridge forces, as well as contact mechanisms, such as elastic and plastic deformation, surface roughness, formation of liquid and solid bridges and amorphous powders, are the key to preventing caking. Based on the results of the studies presented above, Table 1 was prepared in order to facilitate the organization of information for the subsequent construction of the path analysis diagram (Figure 1).
Table 1. Variables of importance in sugar caking.
Author Research Contribution
Rogé & Mathlouti (2003) Water vapor sorption isothermsParticle size (F-Q)Ambient temperature (A)Ambient relative humidity (A)
Billings et al. (2006) Capillary condensation
Ambient relative humidity (A)Product moisture (F-Q)Product temperature (F-Q)Particle size (F-Q)
Christakis et al. (2006) Numerical simulation Ambient relative humidity (A)
Chitprasert et al. (2006) Effect of grain size, reducing sugars and pressureGrain size (F-Q)Ambient relative humidity (A)Ambient temperature (A)
Castrillón et al. (2011) Influence of drying conditionsStorage temperature (A)Packaging (E)Fine particles (F-Q)
Pascual et al. (2016) Characterization of the phenomenon
Ambient relative humidity (A)Grain size (F-Q)Packaging (E)Storage temperature (A)
Zafar et al. (2017) Bulk powders Particle size (F-Q)Product moisture (F-Q)
Source: author-made based on the literature review. F-Q represents physicochemical variables, A variables are attributed to the environment and E variables are related to packaging.
17 Agro productividad 2022. https://doi.org/10.32854/agrop.v15i4.1992
Based on the information in Table 1, a path diagram was constructed (Figure 1) showing the relationship between the variables that influence the formation of sugar lumping: physicochemical properties (moisture, temperature, and particle size), packaging (use time of the bags) and storage (ambient relative humidity, time spent in the warehouse and ambient temperature). In the diagram these variables are inside a rectangle; this is because they are called observed variables and are defined as such since they can be measured directly (Manzano, 2017). These rectangles are linked by straight single-headed arrows, indicating that the arrow has its origin in the variable that exerts the influence (independent variable) and ends in the variable that is predicted (dependent variable), which in this case corresponds to caking. In the case of the double-headed arrows, they represent a covariation between the variables. For a phenomenon to be considered causal, it must meet the condition that variable X is the cause of variable Y; therefore, when X occurs, Y appears. Variable Y cannot occur without the previous occurrence of X (Caballero, 2006). Under this condition it can be seen in the path diagram that:
• All of the three observable variables, namely physicochemical properties (PP), packaging and storage, have a direct effect on caking, since each one arises at a date that points to the dependent variable (caking).
• Physicochemical properties have an indirect effect on caking through packaging, i.e., the effect of physicochemical properties on caking is affected through packaging. For example, if the moisture content of the sugar is high, it will be affected in its migration to the environment, which can lead to conditions for caking to occur.
• It is also possible to observe the indirect effect of PP on caking through storage conditions. For example, several studies have pointed out that the environmental conditions (ambient temperature and relative humidity) present inside warehouses are factors that influence the caking phenomenon (Rogé & Mathlouti, 2003, Billings et al.,
Figure 1. Path analysis diagram of the cause-effect phenomenon of cane sugar caking.
Physical-chemical properties of cane
sugar
Packing
Storage
Caking of cane sugar
HumidityTemperatureParticle size
Use time
Environmental humidityTime
Environmental temperature
18 Agro productividad 2022. https://doi.org/10.32854/agrop.v15i4.1992
2006, Christakis et al., 2006, Chitprasert et al., 2006, Castrillón et al., 2011, Pascual et al., 2016 and Zafar et al., 2017).
• Regarding packaging, Castrillón et al. (2011) pointed out that it acts as a barrier against the migration of moisture and the internal temperature of the product. Its effect, for example, in slowing down the migration speed of moisture can lead to caking, especially in polypropylene packaging with an internal liner, which acts as a protection against product contamination. This finding coincides with the perception of those who handle packaging presentations with greater product containment (1 and 1.5 tons), called jumbo bags. These bags are reused for 8 to 10 periods (harvests), unlike 50 kg bags that are used only once; the reuse of jumbo bags leads to wear of the internal liner.
The path diagram (Figure 1) represents in a schematic way the causal phenomenon of cane sugar caking, in which the magnitudes and statistical significance of these independent variables (physicochemical, packaging and storage) with respect to the dependent variable (caking) can be evaluated through structural equation modeling (SEM). This multivariate statistical technique can be used to measure the effect (weight) and its significance on the phenomenon under study.
CONCLUSIONS Based on the few published studies related to cane sugar caking, variables related to this phenomenon were identified, namely physicochemical properties (moisture, temperature and particle size), polypropylene packaging (liner) and storage conditions (ambient relative humidity and temperature). The direct and indirect effects of these variables can lead to the formation of association structures between the sugar crystals, thus generating the formation of lumps. The analysis of the variables that promote caking, found through the study of the different publications, allows for a graphic representation of the phenomenon, represented as a path analysis diagram, which will be useful for the decision-making and approaches of future studies, especially those related to the quantification of the magnitude with which these factors induce caking in cane sugar.
REFERENCESAguilar- Rivera, N. (2014). Reconversión de la cadena agroindustrial de la caña de azúcar en Veracruz México.
Nova Scientia, 6 (12), 125-161.Aguilar-Rivera N., R.-L. D.-M. (2010). Azúcar, coproductos y subproductos en la diversificación de la
agroindustria de la caña de azúcar. VirtualPro, 56, 1-28.Aguilar-Rivera, N., Debernadi-Vázquez, T., & Herrera-Paz, H. (2017). Subproductos, coproductos y derivados
de la agroindustria azucarera. Agroproductividad, 10 (11), 13-20.Billings, S., Bronlund, J., & A.H.J., P. (2006). Effects of capillary condensation on the caking of bulk sucrose.
Journal of Food Engineering, LXXVII(4), 887-895.Castrillón, N., Pabón, B., & Reif-Acherman, S. (2011). Influencia de las condiciones del secado en el
aterronamiento y la compactación del azúcar almacenado. Ingeniería y Competitividad, 13(1), 9-23.Chitprasert, P., Chedchant, J., Wanchaitanawong, P., & N., P. (2006). Effects of Grain Size, Reducing Sugar
Content, Temperature and Pressure on Caking of Raw Sugar. Agriculture and Natural Resources 40(5), 141-147.
Christakis, N., Wang, J., Patel, M., Bradley, M. S., Leaper, M. C., & Cross, M. (2006). Aggregation and caking processes of granular materials: continuum model and numerical simulation with application to sugar. Advanced Powder Technol, 17 (5), 543-565.
19 Agro productividad 2022. https://doi.org/10.32854/agrop.v15i4.1992
CONADESUCA. (16 de Octubre de 2019). Comite Nacional para el Desarrollo Sustentable de la caña de Azúcar. Disponible en. https://www.gob.mx/conadesuca/es/articulos/6-informe-estadistico-del-sector-agroindustrial-de-la-cana-de-azucar-en-mexico?idiom=es
CONADESUCA. (2021). Octavo informe estadístico del Sector Agroindustrial de la Caña de Azúcar en México zafras 2011-2012 / 2020-2021. Disponible en: http://conadesuca.gob.mx/documentosexternos/8vo_Informe_estadistico.pdf
Cupani, M. (2012). Análisis de Ecuaciones Estructurales: conceptos, etapas de desarrollo y un ejemplo de aplicación. Revista tesis. 1(1), 186-199.
Freeman, T., Brockbank, K., & Armstrong, B. (2015). Measurement and quantification of caking in powders. Procedia Engineering, 102, 35-44.
Hernández A., F., Valencia O., A., Toledo G., J., & Hernández A., H. (2013). La caña de azúcar en su contexto historico. En El sector cañero en Nayarit desde una perspectiva rganizacional y ambiental (págs. 4-34). España: Fundacion Universitaria Andaluza Inca Garcilaso.
Manzano P., A. (2017). Introduccion a los modelos de ecuaciones estructurales. Investigación en educación medica, 7(25), 67-72.
Medrano, L., & Muñoz-Navarro, R. (2017). Aproximacion conceptual y practica a los modelos de ecuaciones estructurales. Revista digital de investigacion en docencia universitaria, 11(1), 219-239.
Pascual Ramirez, J., Espinoza Enríquez, J., & Linares García, J. (2016). Caracterización de la compactación del azúcar de caña (Saccharum officinalis L.) y propuesta para sus medidas preventivas. Foro de Estudios sobre Guerrero, 2 (3), 79-82.
Pascual-Ramirez, J., & Espinoza-Enríquez, J. &. (2016). Caracterización de la compactación del azúcar de caña (Saccharum officinalis L.) y propuesta para sus medidas preventivas. Revista de simulacion y laboratorio, 2(5), 106-109.
Rogé, B., & Mathouti, M. (2003). Cacking of white crystalline sugar. International Sugar Journal, 105(1251), 128-130.
Tait, P., Blanco, A., & Fanning, M. (2010). The implementation of a dryer/cooler conversion and short residence time conditioning system for refined sugar. Proc. Int. Soc. Sugar Cane Technol, 27(1340), 464-471.
Von Wobeser, G. (1988). Historía mexicana. En La hacienda azucarera en la epoca colonial (págs. 1063-1067).Zafar, U., Vivacqua, V., Calvert, A., Ghadiri, M., & Cleaver, J. (2017). A review of bulk powder caking. Powder
Technology, 313, 389-401. Doi: 10.1016/j.powtec.2017.02.024

Colegio dePostgraduados
21
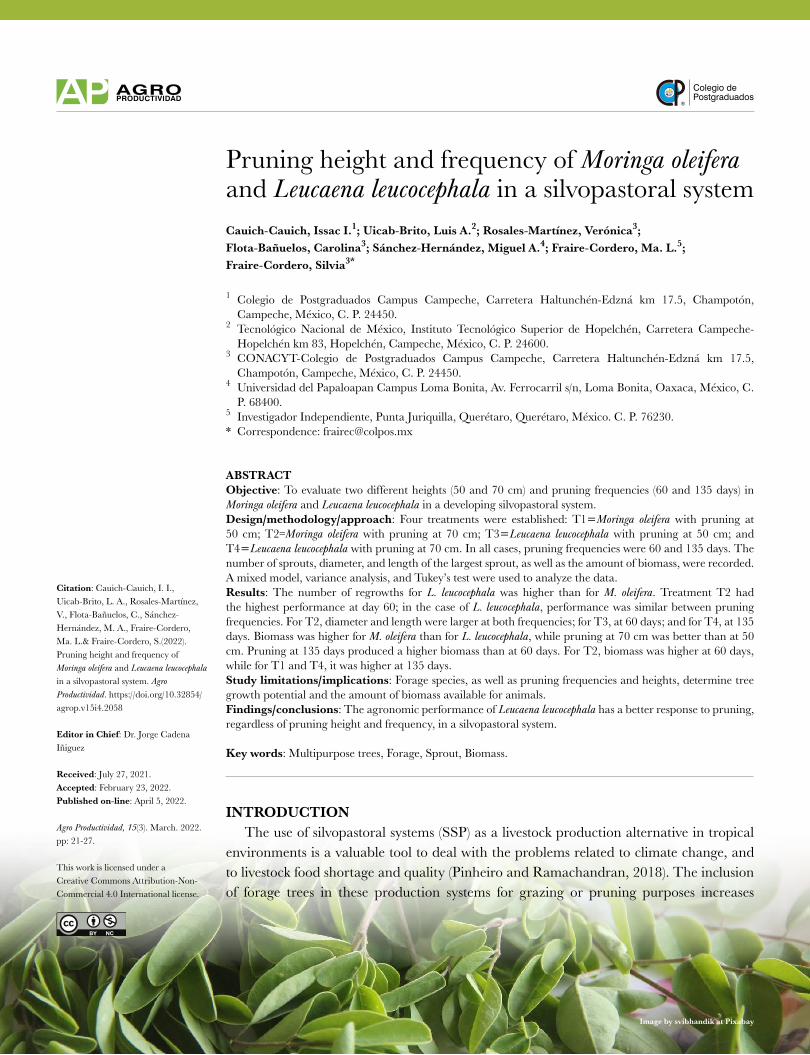
Pruning height and frequency of Moringa oleifera and Leucaena leucocephala in a silvopastoral systemCauich-Cauich, Issac I.1; Uicab-Brito, Luis A.2; Rosales-Martínez, Verónica3; Flota-Bañuelos, Carolina3; Sánchez-Hernández, Miguel A.4; Fraire-Cordero, Ma. L.5; Fraire-Cordero, Silvia3*
1 Colegio de Postgraduados Campus Campeche, Carretera Haltunchén-Edzná km 17.5, Champotón, Campeche, México, C. P. 24450.
2 Tecnológico Nacional de México, Instituto Tecnológico Superior de Hopelchén, Carretera Campeche-Hopelchén km 83, Hopelchén, Campeche, México, C. P. 24600.
3 CONACYT-Colegio de Postgraduados Campus Campeche, Carretera Haltunchén-Edzná km 17.5, Champotón, Campeche, México, C. P. 24450.
4 Universidad del Papaloapan Campus Loma Bonita, Av. Ferrocarril s/n, Loma Bonita, Oaxaca, México, C. P. 68400.
5 Investigador Independiente, Punta Juriquilla, Querétaro, Querétaro, México. C. P. 76230.* Correspondence: [email protected]
ABSTRACTObjective: To evaluate two different heights (50 and 70 cm) and pruning frequencies (60 and 135 days) in Moringa oleifera and Leucaena leucocephala in a developing silvopastoral system.Design/methodology/approach: Four treatments were established: T1Moringa oleifera with pruning at 50 cm; T2=Moringa oleifera with pruning at 70 cm; T3Leucaena leucocephala with pruning at 50 cm; and T4Leucaena leucocephala with pruning at 70 cm. In all cases, pruning frequencies were 60 and 135 days. The number of sprouts, diameter, and length of the largest sprout, as well as the amount of biomass, were recorded. A mixed model, variance analysis, and Tukey’s test were used to analyze the data.Results: The number of regrowths for L. leucocephala was higher than for M. oleifera. Treatment T2 had the highest performance at day 60; in the case of L. leucocephala, performance was similar between pruning frequencies. For T2, diameter and length were larger at both frequencies; for T3, at 60 days; and for T4, at 135 days. Biomass was higher for M. oleifera than for L. leucocephala, while pruning at 70 cm was better than at 50 cm. Pruning at 135 days produced a higher biomass than at 60 days. For T2, biomass was higher at 60 days, while for T1 and T4, it was higher at 135 days.Study limitations/implications: Forage species, as well as pruning frequencies and heights, determine tree growth potential and the amount of biomass available for animals.Findings/conclusions: The agronomic performance of Leucaena leucocephala has a better response to pruning, regardless of pruning height and frequency, in a silvopastoral system.
Key words: Multipurpose trees, Forage, Sprout, Biomass.
INTRODUCTION The use of silvopastoral systems (SSP) as a livestock production alternative in tropical environments is a valuable tool to deal with the problems related to climate change, and to livestock food shortage and quality (Pinheiro and Ramachandran, 2018). The inclusion of forage trees in these production systems for grazing or pruning purposes increases
Citation: Cauich-Cauich, I. I., Uicab-Brito, L. A., Rosales-Martínez, V., Flota-Bañuelos, C., Sánchez-Hernández, M. A., Fraire-Cordero, Ma. L.& Fraire-Cordero, S.(2022). Pruning height and frequency of Moringa oleifera and Leucaena leucocephala in a silvopastoral system. Agro Productividad. https://doi.org/10.32854/agrop.v15i4.2058
Editor in Chief: Dr. Jorge Cadena Iñiguez
Received: July 27, 2021.Accepted: February 23, 2022.Published on-line: April 5, 2022.
Agro Productividad, 15(3). March. 2022. pp: 21-27.
This work is licensed under a Creative Commons Attribution-Non-Commercial 4.0 International license.
Image by svibhandik at Pixabay
22 Agro productividad 2022. https://doi.org/10.32854/agrop.v15i4.2058
productivity. Trees of the Moringa oleifera and Leucaena leucocephala species can be used in tropical SSPs, given the quality of the nutrients that they provide for animals and to the easiness with which they adapt to and grow in this climate. For these trees to have an adequate productivity, they must be pruned in timely manner, since their capacity to produce grazing material for animals and the control of leaf biomass growth depend on that activity (Strnad et al., 2020). The lack of an adequate pruning could make trees susceptible to illnesses, reduce forage quality, or cause irregular yields (Mohammadi et al., 2013). Various works show that both pruning height and frequency are related to the number and size of regrowths and, therefore, to biomass yield and forage production for animals (Ramos et al., 2015). Due to the importance of forage trees as a strategy against climate change and as food for livestock in SSPs, the aim of this study was to evaluate two pruning heights (50 and 70 cm) and frequencies (60 and 135 days) in Moringa oleifera and Leucaena leucocephala trees in a silvopastoral system.
MATERIALS AND METHODS We conducted this research from May to September 2019 at the Colegio de Postgraduados Campus Campeche, located in Carretera Haltunchén-Edzná km 17.5, Champotón, Campeche, México (19° 29’ 51.79” N and 90° 32’ 45.01” W) at an altitude of 24 m. The prevailing climate is hot sub-humid with summer rains, an average annual temperature of 28 °C (maximum: 40 °C ; minimum: 10 °C), and 1200 mm rainfall (García, 2004). The soil is Vertisol (VRnl), with high proportions of expandable clays (FAO, 2014).The M. oleifera and L. leucocephala plants were selected from a developing SSP with a row intercropping arrangement of the two species, 2.0 m between plants and 3.0 m between rows, 1.5-years-old plants, no previous pruning, and no irrigation. We established four treatments with 15 plants each: T1M. oleifera with pruning at 50 cm from the ground; T2M. oleifera with pruning at 70 cm; T3L. leucocephala with pruning at 50 cm; and T4 L. leucocephala with pruning at 70 cm. All plants were initially pruned crosswise with Truper® Tx-21 pruning shears. The number of total regrowths per plant was evaluated every 15 days until total pruning on days 60 and 135 (pruning frequency). During the first measurement, the sprout with the larger diameter for each plant was selected and its length and diameter were monitored until total pruning; to obtain the total fresh weight biomass, the total number of sprouts (foliage and stalks) per plant were weighted on days 60 and 135. The total amount of regrowths and of regrowth length and diameter was subject to an statistical analysis, by means of repeated measurements using the mixed model. The biomass variable was subjected to a variance analysis and the means were compared with Tukey’s test. All analyses were done with the SAS/STAT software (2002). The significance level for all tests was 0.05.
RESULTS AND DISCUSSION The number of sprouts was different (p0.05) between treatments and periods, while the interaction between periods and treatment was similar. L. leucocephala produced an
23 Agro productividad 2022. https://doi.org/10.32854/agrop.v15i4.2058
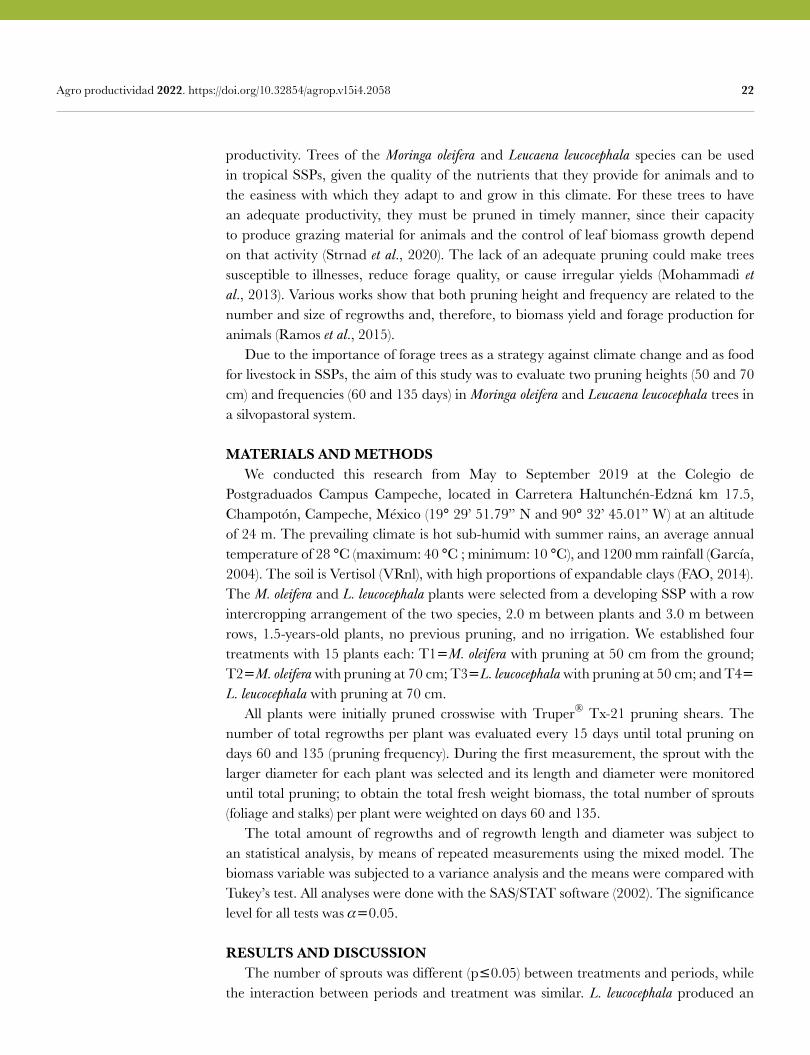
average of 16.1 regrowths per plant, which is higher (p0.05) than the 8.7 regrowths produced by M. oleifera during the experiment. These differences could have been the result of the plant’s biology, since the agronomic handling of both species was the same. In addition, the initial growth of new sprouts, after pruning, depends on the availability of carbohydrates and proteins, which play a very important role (García et al., 2001). Plant performance was similar at both pruning heights and frequencies, although it tended to be better at 70 cm (70 cm: 13.9 and 50 cm: 11.0 regrowths) and 60 days (60 days: 12.9 and 135 days: 12.0 regrowths). The highest number of sprouts was observed on days 30 and 75 for both species and heights. The highest number of sprouts appeared earlier when an initial pruning was carried out versus a 60-day pruning; subsequently this number tends to remain constant, with a better performance by L. leucocephala (Figure 1). When more foliage is taken from a plant, it tends to spontaneously react to recover the foliage and carry out different photosynthetic activities. Therefore, the sprout growth phase in forage trees is delayed when the trees are pruned at low heights (Bacab et al., 2012), because reserve carbohydrates decrease as a consequence of pruning. The performance of L. leucocephala was similar at both pruning heights and throughout time; taller plants were achieved with a 70 cm pruning. These results match the findings of González and Toral (2011), who obtained 7-24 regrowths per L. leucocephala plant; they considered it to be a good production. Wencomo and Ortíz (2011) found that the appearance of new sprouts was slow during the first 28 days, while it rapidly accelerated from day 35, which is similar to what was recorded in this study. The best performance for M. oleifera was observed at a height of 70 cm and pruning frequencies at 60 days. During our research, the number of sprouts decreased with time. This could be the consequence of the dominance of the more developed sprouts, which demand more nutrients and cast shade on the smaller sprouts, causing their death. This also leads to a variability in the number of sprouts throughout time.
Figure 1. Number of regrowths for Moringa oleifera and Leucaena leucocephala at two heights and pruning frequencies.
24 Agro productividad 2022. https://doi.org/10.32854/agrop.v15i4.2058
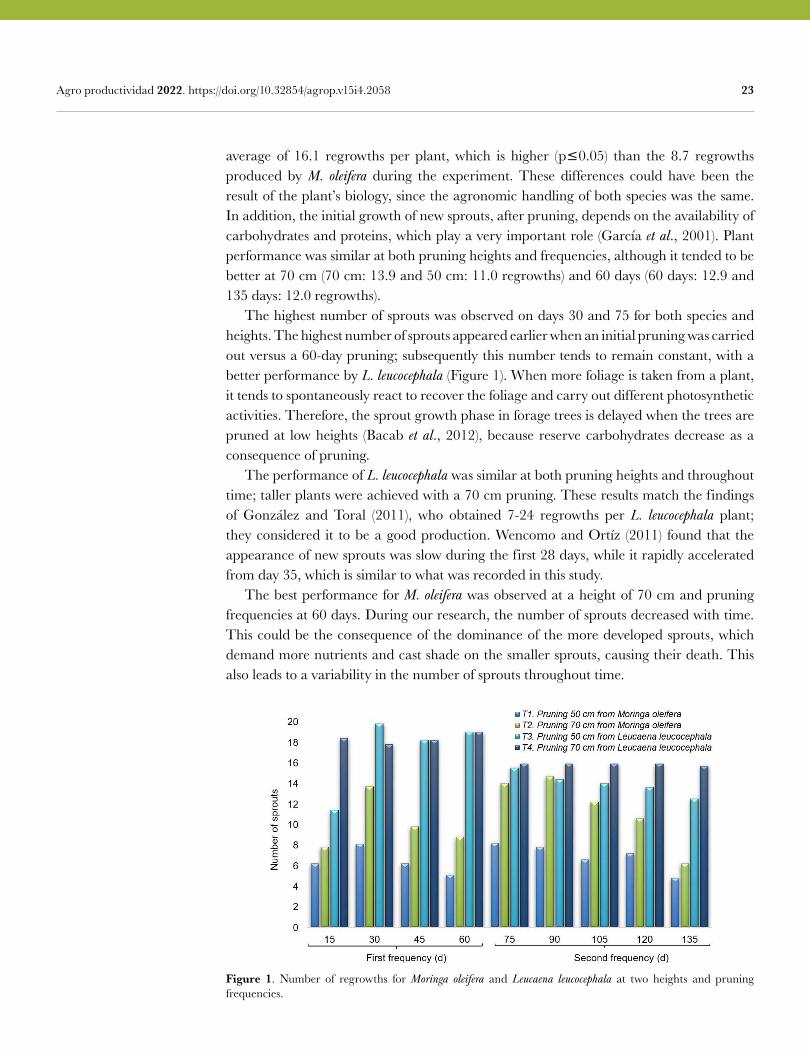
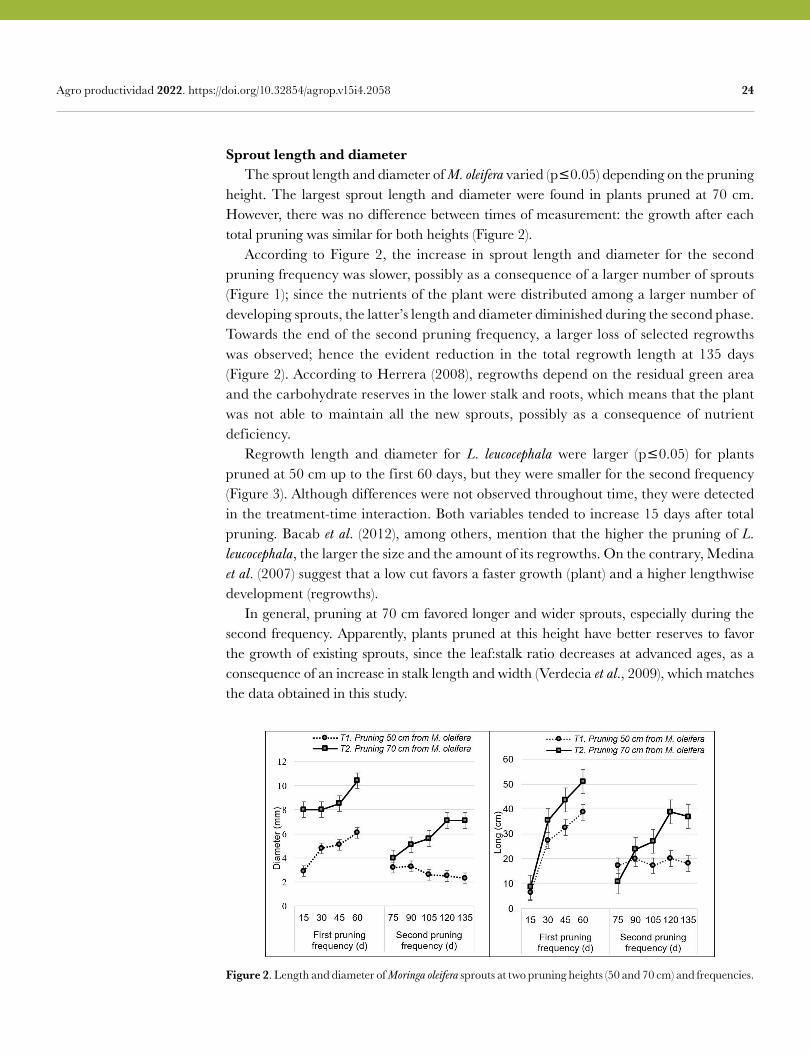
Sprout length and diameter The sprout length and diameter of M. oleifera varied (p0.05) depending on the pruning height. The largest sprout length and diameter were found in plants pruned at 70 cm. However, there was no difference between times of measurement: the growth after each total pruning was similar for both heights (Figure 2). According to Figure 2, the increase in sprout length and diameter for the second pruning frequency was slower, possibly as a consequence of a larger number of sprouts (Figure 1); since the nutrients of the plant were distributed among a larger number of developing sprouts, the latter’s length and diameter diminished during the second phase. Towards the end of the second pruning frequency, a larger loss of selected regrowths was observed; hence the evident reduction in the total regrowth length at 135 days (Figure 2). According to Herrera (2008), regrowths depend on the residual green area and the carbohydrate reserves in the lower stalk and roots, which means that the plant was not able to maintain all the new sprouts, possibly as a consequence of nutrient deficiency. Regrowth length and diameter for L. leucocephala were larger (p0.05) for plants pruned at 50 cm up to the first 60 days, but they were smaller for the second frequency (Figure 3). Although differences were not observed throughout time, they were detected in the treatment-time interaction. Both variables tended to increase 15 days after total pruning. Bacab et al. (2012), among others, mention that the higher the pruning of L. leucocephala, the larger the size and the amount of its regrowths. On the contrary, Medina et al. (2007) suggest that a low cut favors a faster growth (plant) and a higher lengthwise development (regrowths). In general, pruning at 70 cm favored longer and wider sprouts, especially during the second frequency. Apparently, plants pruned at this height have better reserves to favor the growth of existing sprouts, since the leaf:stalk ratio decreases at advanced ages, as a consequence of an increase in stalk length and width (Verdecia et al., 2009), which matches the data obtained in this study.
Figure 2. Length and diameter of Moringa oleifera sprouts at two pruning heights (50 and 70 cm) and frequencies.
25 Agro productividad 2022. https://doi.org/10.32854/agrop.v15i4.2058
According to Toral and Iglesias (2007), regrowth development at a height of 100 cm ensures an adequate area of reserve parenchymal tissue and active meristematic tissue, necessary for regrowth development and a better diameter.
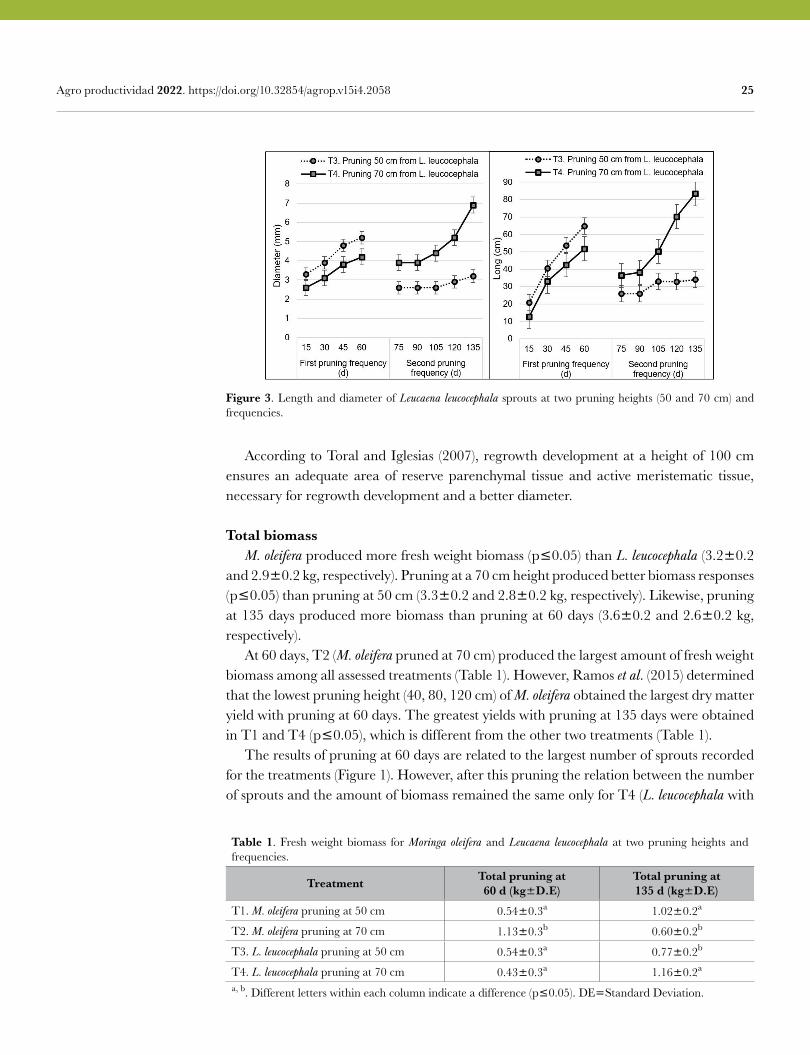
Total biomass M. oleifera produced more fresh weight biomass (p0.05) than L. leucocephala (3.20.2 and 2.90.2 kg, respectively). Pruning at a 70 cm height produced better biomass responses (p0.05) than pruning at 50 cm (3.30.2 and 2.80.2 kg, respectively). Likewise, pruning at 135 days produced more biomass than pruning at 60 days (3.60.2 and 2.60.2 kg, respectively). At 60 days, T2 (M. oleifera pruned at 70 cm) produced the largest amount of fresh weight biomass among all assessed treatments (Table 1). However, Ramos et al. (2015) determined that the lowest pruning height (40, 80, 120 cm) of M. oleifera obtained the largest dry matter yield with pruning at 60 days. The greatest yields with pruning at 135 days were obtained in T1 and T4 (p0.05), which is different from the other two treatments (Table 1). The results of pruning at 60 days are related to the largest number of sprouts recorded for the treatments (Figure 1). However, after this pruning the relation between the number of sprouts and the amount of biomass remained the same only for T4 (L. leucocephala with
Figure 3. Length and diameter of Leucaena leucocephala sprouts at two pruning heights (50 and 70 cm) and frequencies.
Table 1. Fresh weight biomass for Moringa oleifera and Leucaena leucocephala at two pruning heights and frequencies.
Treatment Total pruning at 60 d (kgD.E)
Total pruning at 135 d (kgD.E)
T1. M. oleifera pruning at 50 cm 0.540.3a 1.020.2a
T2. M. oleifera pruning at 70 cm 1.130.3b 0.600.2b
T3. L. leucocephala pruning at 50 cm 0.540.3a 0.770.2b
T4. L. leucocephala pruning at 70 cm 0.430.3a 1.160.2a
a, b. Different letters within each column indicate a difference (p0.05). DEStandard Deviation.
26 Agro productividad 2022. https://doi.org/10.32854/agrop.v15i4.2058
pruning at 70 cm). When plants rest for a longer time, photosynthesis increases, enabling more growth, development, and yield (Noda et al., 2007). These responses will depend on crop handling, as well as on plant physiology. It is important to note that longer pruning intervals result in wider and woodier stalks, with high levels of lignin; this forage can therefore be considered low quality, although it does contribute to generate a higher biomass. Consequently, one handling strategy to favor higher yields and a larger proportion of leaf in leaf biomass would be to prune with a 60-day frequency, since at this age the stalks present a lower lignification level that allows for better animal grazing.
CONCLUSIONS Based on research conditions, L. leucocephala plants respond better to pruning, regardless of height and frequency, than M. oleifera. Pruning at a 70 cm height produces more sprouts in both M. oleifera and L. leucocephala. The highest fresh weight biomass is produced at a pruning height of 70 cm in M. oleifera at 60 days and in L. leucocephala at 135 days.
ACKNOWLEDGEMENTS We are indebted to the Consejo Nacional de Ciencia y Tecnología (CONACyT) through the Cátedras
Project 2181 “Estrategias agroecológicas para la seguridad alimentaria en zonas rurales de Campeche”
[Agroecological strategies for food security in rural areas in Campeche] and to the Colegio de Postgraduados - Campus
Campeche.
REFERENCESBacab, H.M., Solorio, F.J., & Solorio, S.B. (2012). Efecto de la altura de poda en Leucaena leucocephala y su
influencia en el rebrote y rendimiento de Panicum maximum. Avances en Investigación Agropecuaria, 16(1), 65-77.
Gardi, C., Angelini, M., Barceló, S., Comerma, J., Cruz Gaistardo, C.,Encina Rojas, A., Jones, A., Krasilnikov, P., Mendonça Santos Brefin, M.L., Montanarella, L., Muñiz Ugarte, O., Schad, P., Vara Rodríguez, M.I., Vargas, R. (eds), (2014). Atlas de suelos de América Latina y el Caribe. 1ª ed. Oficina de Publicaciones de la Unión Europea, L-2995 Luxemburgo, Luxemburgo.
García, E. (2004). Modificaciones al Sistema de Clasificación Climática de Köppen (para adaptarlo a las condiciones de la República Mexicana). 5ª ed. Instituto de Geografía/UNAM. Ciudad Universitaria, C.U., Coyoacán, 04510 Ciudad de México, México 90 p.
García, H., Nygren, P., & Desfontaines, L. (2001). Dynamics nonstructural carbohydrates and biomass yield in a fodder legume tree at different harvest intensities. Tree Physiology, 21 (8), 523-531. Doi: 10.1093/treephys/21.8.523
González, R.J., & Toral, O. (2011). Calidad de las semillas de accesiones colectadas en las regiones occidental, oriental y central de Cuba. Pastos y Forrajes, 34(3), 259-265.
Herrera, R.S. (2008). Fotosíntesis: en pastos tropicales, contribución a la fisiología, establecimiento, rendimiento de biomasa, producción de biomasa, producción de semillas y reciclaje de nutrientes. Editorial EDICA, ICA, La Habana, Cuba.
Medina, M.G., García, D.E., Clavero, T. & Iglesias, J. M. (2007). Estudio comparativo de Moringa oleifera y Leucaena leucocephala durante la germinación y la etapa inicial de crecimiento. Zootecnia Tropical, 25, 32-38.
Mohammadi, A., Mahmoudi, M.J., & Rezaee, R. (2013). Vegetative and reproductive responses of some Apple cultivars (Malus domestica Borkh) to heading back prunning. International Journal of AgriScience, 3(8), 628-635.
Noda, Y., Martín, G., & Machado, R. (2007). Rendimiento y calidad bromatológica de Morus alba cosechada a diferentes alturas y frecuencias de defoliación. Revista Cubana de Ciencias Agrícolas, 41, 363-369.
27 Agro productividad 2022. https://doi.org/10.32854/agrop.v15i4.2058
Pinheiro, F.M., & Ramachandran, N.P.K. (2018). Silvopasture in the Caatinga biome of Brazil: A review of its ecology, management, and development opportunities. Forest system, 27, 16.
Ramos, T.O., Castillo, H.J., & Sandoval, G.J.J. (2015). Efecto de intervalo y altura de corte en la productividad forrajera de Moringa oleifera. Revista Bio Ciencia, 3(3), 187-194.
SAS Institute (Business Analytics software). (2002). SAS/STAT® 9.9 user’s guide. SAS Institute Cary, North Carolina.
Strnad, D., Kohek, S., Benes, B., Kolmanic, S., & Zalik B. (2020). A framework for multi-objetive optimization of virtual tree pruning base don growth simulation. Expert Systems with Applications, 16, 113792.
Toral, O., & Iglesias, J.M. (2007). Efecto de la poda en el rendimiento de biomasa de 20 accesiones de especies arbóreas. Pastos y Forrajes, 30, 1-7.
Verdecia, D.M., Ramírez, J.L., Leonard, I., & García, F. (2009). Potencialidades agroproductivas de dos cultivares de Panicum maximum (c.v. Mombaza y Uganda) en la provincia Granma. Revista Electrónica de Veterinaria, 10, 1.
Wencomo, H.B., & Ortiz, R. (2011). Capacidad de recuperación de 23 accesiones de Leucaena spp después de la poda. Pastos y Forrajes, 34(1), 53-68.

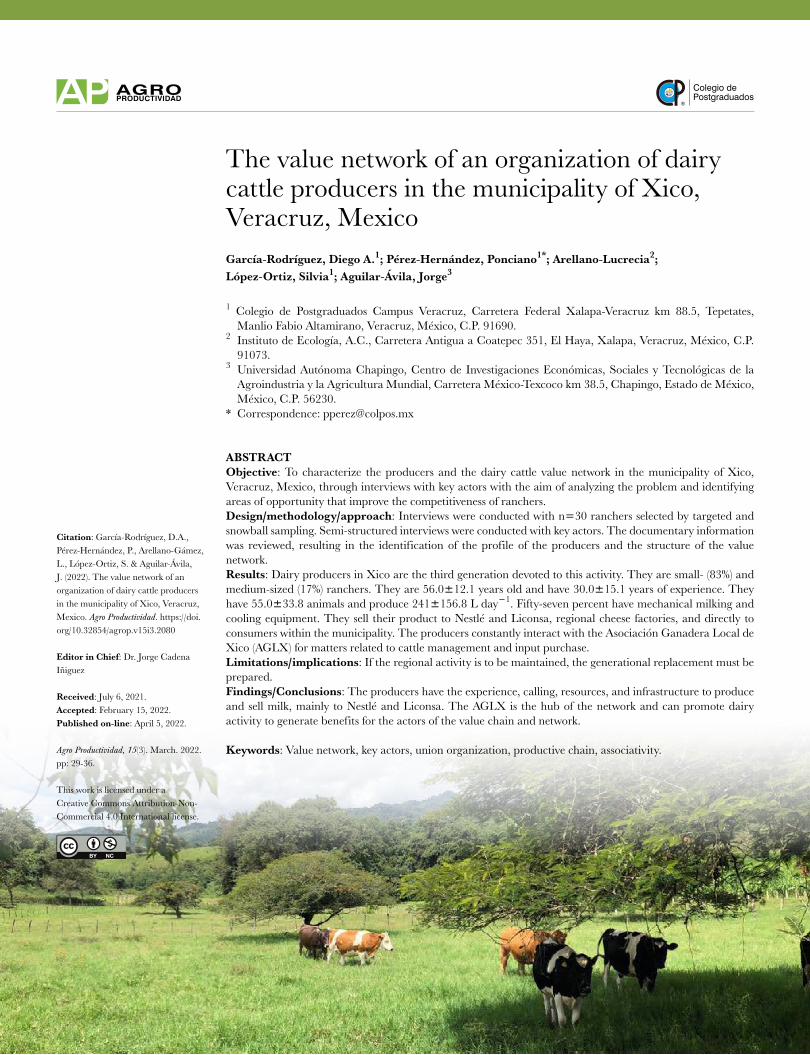
Colegio dePostgraduados
29
Citation: García-Rodríguez, D.A., Pérez-Hernández, P., Arellano-Gámez, L., López-Ortiz, S. & Aguilar-Ávila, J. (2022). The value network of an organization of dairy cattle producers in the municipality of Xico, Veracruz, Mexico. Agro Productividad. https://doi.org/10.32854/agrop.v15i3.2080
Editor in Chief: Dr. Jorge Cadena Iñiguez
Received: July 6, 2021.Accepted: February 15, 2022.Published on-line: April 5, 2022.
Agro Productividad, 15(3). March. 2022. pp: 29-36.
This work is licensed under a Creative Commons Attribution-Non-Commercial 4.0 International license.
The value network of an organization of dairy cattle producers in the municipality of Xico, Veracruz, MexicoGarcía-Rodríguez, Diego A.1; Pérez-Hernández, Ponciano1*; Arellano-Lucrecia2; López-Ortiz, Silvia1; Aguilar-Ávila, Jorge3
1 Colegio de Postgraduados Campus Veracruz, Carretera Federal Xalapa-Veracruz km 88.5, Tepetates, Manlio Fabio Altamirano, Veracruz, México, C.P. 91690.
2 Instituto de Ecología, A.C., Carretera Antigua a Coatepec 351, El Haya, Xalapa, Veracruz, México, C.P. 91073.
3 Universidad Autónoma Chapingo, Centro de Investigaciones Económicas, Sociales y Tecnológicas de la Agroindustria y la Agricultura Mundial, Carretera México-Texcoco km 38.5, Chapingo, Estado de México, México, C.P. 56230.
* Correspondence: [email protected]
ABSTRACTObjective: To characterize the producers and the dairy cattle value network in the municipality of Xico, Veracruz, Mexico, through interviews with key actors with the aim of analyzing the problem and identifying areas of opportunity that improve the competitiveness of ranchers.Design/methodology/approach: Interviews were conducted with n30 ranchers selected by targeted and snowball sampling. Semi-structured interviews were conducted with key actors. The documentary information was reviewed, resulting in the identification of the profile of the producers and the structure of the value network.Results: Dairy producers in Xico are the third generation devoted to this activity. They are small- (83%) and medium-sized (17%) ranchers. They are 56.012.1 years old and have 30.015.1 years of experience. They have 55.033.8 animals and produce 241156.8 L day1. Fifty-seven percent have mechanical milking and cooling equipment. They sell their product to Nestlé and Liconsa, regional cheese factories, and directly to consumers within the municipality. The producers constantly interact with the Asociación Ganadera Local de Xico (AGLX) for matters related to cattle management and input purchase.Limitations/implications: If the regional activity is to be maintained, the generational replacement must be prepared.Findings/Conclusions: The producers have the experience, calling, resources, and infrastructure to produce and sell milk, mainly to Nestlé and Liconsa. The AGLX is the hub of the network and can promote dairy activity to generate benefits for the actors of the value chain and network.
Keywords: Value network, key actors, union organization, productive chain, associativity.
30 Agro productividad 2022. https://doi.org/10.32854/agrop.v15i3.2080
INTRODUCTION Mexico is the fourteenth milk producer worldwide with 12 million L, 6.02% of which were contributed by Veracruz in 2018 (FAOSTAT, 2020). However, the country bought 362 thousand tons of powdered milk and 37 thousand L of fluid milk during the same period, making it the third country with the highest imports (SIAP, 2019). Both the mountainous and coastal regions of central Veracruz have a remarkable dairy production calling, mainly focused on the sale of fluid milk and the production of fresh and matured cheeses. A strategy to strengthen rural companies in the territories is the application of the value network concept proposed by Nalebuff and Brandenburger (2005), which analyzes the importance and interaction of the network actors: producers–agroindustry, complementors, competitors, clients, and suppliers. The methodology is a way to organize a productive system specialized in a common activity, characterized by the territorial concentration of its economic actors and other institutions, as well as by the development of economic and non-economic links that contribute to the creation of value or wealth, both for its members and for its territory (Muñoz and Santoyo, 2011). The cooperation between the various actors of a value network allows achieving common objectives and moving towards win-win relationships. Producers and their organization commonly present areas of opportunity: ranchers need to establish an associative figure, such as a local cattle-raiser association (Asociación Ganadera Local: AGL), where the values of reciprocity, solidarity, assertive communication, and trust are strengthened (Cervantes et al., 2013). Associativity could foster strategies that turn problems into objectives (Granados-Sánchez et al., 2016), based on an improvement strategy. In the municipality of Xico, dairy producers have adopted various innovations for the improvement of their production system (Cruz et al., 2016); however, innovations have decreased in the last ten years, as a consequence of unknown factors. Therefore, the producers and the dairy cattle value network were characterized through interviews with key actors; the aim was to analyze the limitations and, consequently, to identify areas of opportunity for the improvement of the ranchers’ competitiveness.
MATERIALS AND METHODS The study was carried out in the municipality of Xico, located in the Altas Montañas region of Veracruz, at 1,311 masl. The climate, Cf(b), is temperate humid (average annual temperature: 18.8 °C) with rainfall all year (annual rainfall: 1,750 mm). The research focused on dairy producers who are members of the Asociación Ganadera Local de Xico (AGLX), Veracruz. The productive chain and the value network were characterized using the methodology proposed by Nalebuff and Brandenburger (2005) and adapted by Muñoz and Santoyo (2011). The analysis of key actors provided an overview of the environment. Subsequently, the value network dynamics was developed through the analysis of the role of its members. Participating ranchers were identified and selected using the snowball technique (Aguilar et al., 2007), based on the AGLX member registry. The information on the network structure was obtained through semi-structured interviews, with open questions addressed to the different actors of the dairy cattle value network.
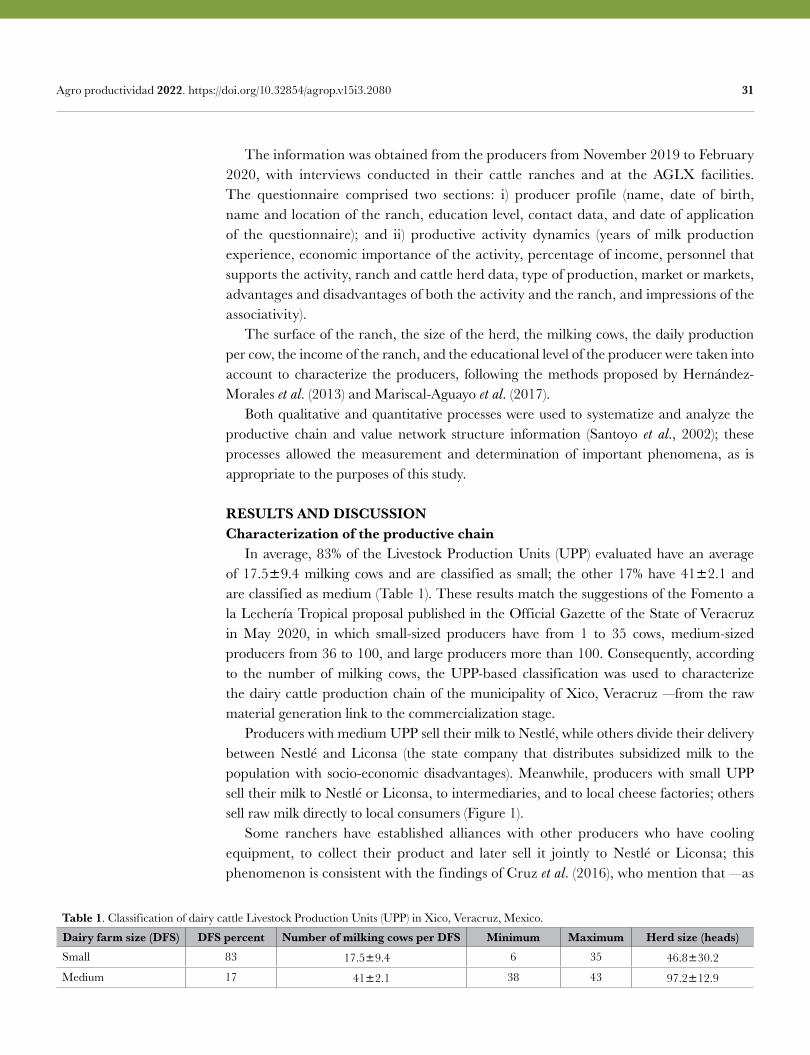
31 Agro productividad 2022. https://doi.org/10.32854/agrop.v15i3.2080
The information was obtained from the producers from November 2019 to February 2020, with interviews conducted in their cattle ranches and at the AGLX facilities. The questionnaire comprised two sections: i) producer profile (name, date of birth, name and location of the ranch, education level, contact data, and date of application of the questionnaire); and ii) productive activity dynamics (years of milk production experience, economic importance of the activity, percentage of income, personnel that supports the activity, ranch and cattle herd data, type of production, market or markets, advantages and disadvantages of both the activity and the ranch, and impressions of the associativity). The surface of the ranch, the size of the herd, the milking cows, the daily production per cow, the income of the ranch, and the educational level of the producer were taken into account to characterize the producers, following the methods proposed by Hernández-Morales et al. (2013) and Mariscal-Aguayo et al. (2017). Both qualitative and quantitative processes were used to systematize and analyze the productive chain and value network structure information (Santoyo et al., 2002); these processes allowed the measurement and determination of important phenomena, as is appropriate to the purposes of this study.
RESULTS AND DISCUSSIONCharacterization of the productive chain In average, 83% of the Livestock Production Units (UPP) evaluated have an average of 17.59.4 milking cows and are classified as small; the other 17% have 412.1 and are classified as medium (Table 1). These results match the suggestions of the Fomento a la Lechería Tropical proposal published in the Official Gazette of the State of Veracruz in May 2020, in which small-sized producers have from 1 to 35 cows, medium-sized producers from 36 to 100, and large producers more than 100. Consequently, according to the number of milking cows, the UPP-based classification was used to characterize the dairy cattle production chain of the municipality of Xico, Veracruz —from the raw material generation link to the commercialization stage. Producers with medium UPP sell their milk to Nestlé, while others divide their delivery between Nestlé and Liconsa (the state company that distributes subsidized milk to the population with socio-economic disadvantages). Meanwhile, producers with small UPP sell their milk to Nestlé or Liconsa, to intermediaries, and to local cheese factories; others sell raw milk directly to local consumers (Figure 1). Some ranchers have established alliances with other producers who have cooling equipment, to collect their product and later sell it jointly to Nestlé or Liconsa; this phenomenon is consistent with the findings of Cruz et al. (2016), who mention that —as
Table 1. Classification of dairy cattle Livestock Production Units (UPP) in Xico, Veracruz, Mexico.
Dairy farm size (DFS) DFS percent Number of milking cows per DFS Minimum Maximum Herd size (heads)Small 83 17.59.4 6 35 46.830.2
Medium 17 412.1 38 43 97.212.9
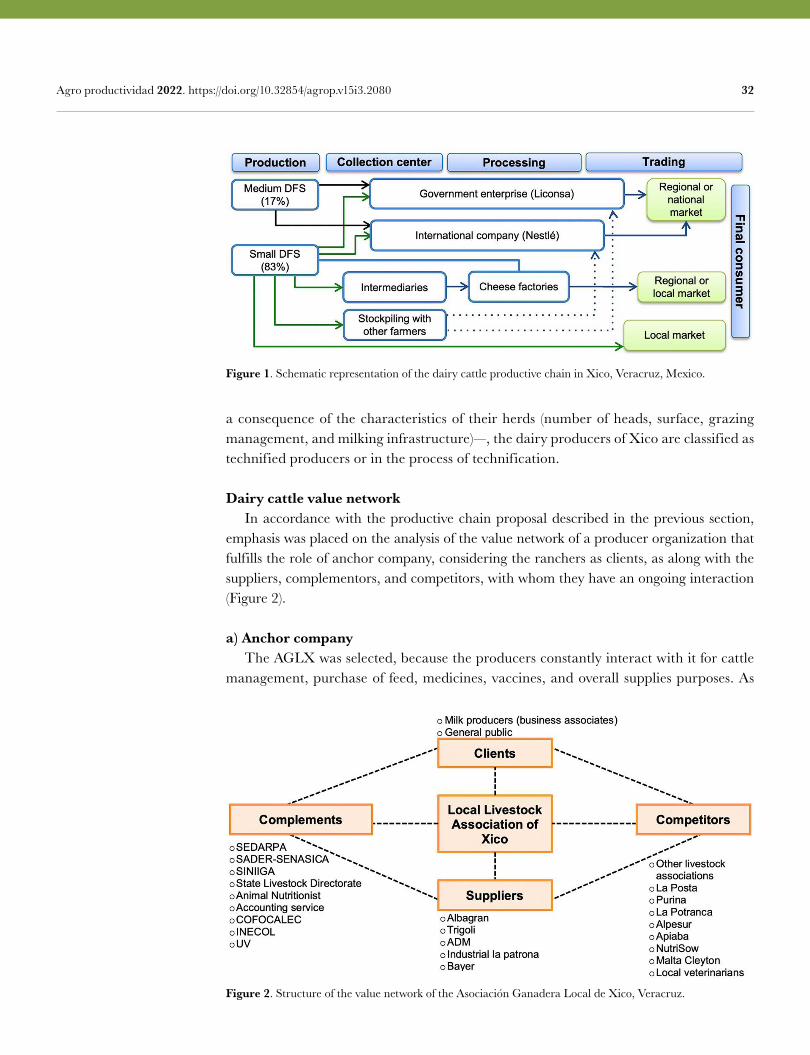
32 Agro productividad 2022. https://doi.org/10.32854/agrop.v15i3.2080
a consequence of the characteristics of their herds (number of heads, surface, grazing management, and milking infrastructure)—, the dairy producers of Xico are classified as technified producers or in the process of technification.
Dairy cattle value network In accordance with the productive chain proposal described in the previous section, emphasis was placed on the analysis of the value network of a producer organization that fulfills the role of anchor company, considering the ranchers as clients, as along with the suppliers, complementors, and competitors, with whom they have an ongoing interaction (Figure 2).
a) Anchor company The AGLX was selected, because the producers constantly interact with it for cattle management, purchase of feed, medicines, vaccines, and overall supplies purposes. As
Figure 1. Schematic representation of the dairy cattle productive chain in Xico, Veracruz, Mexico.
Figure 2. Structure of the value network of the Asociación Ganadera Local de Xico, Veracruz.
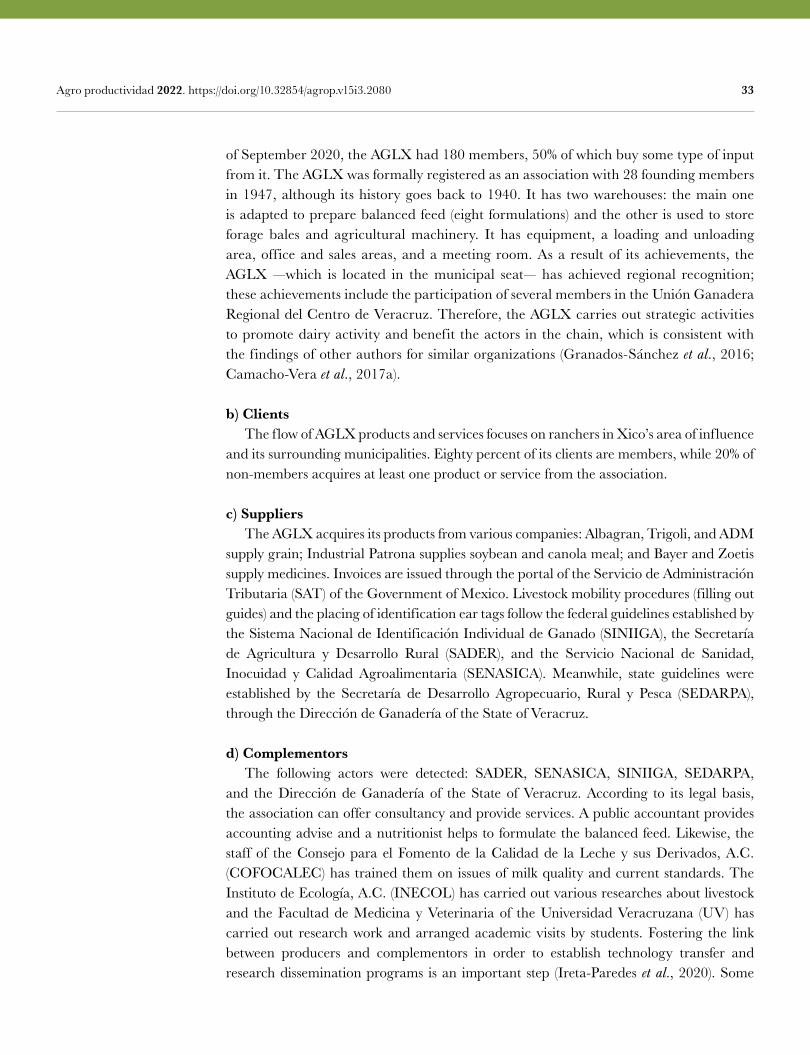
33 Agro productividad 2022. https://doi.org/10.32854/agrop.v15i3.2080
of September 2020, the AGLX had 180 members, 50% of which buy some type of input from it. The AGLX was formally registered as an association with 28 founding members in 1947, although its history goes back to 1940. It has two warehouses: the main one is adapted to prepare balanced feed (eight formulations) and the other is used to store forage bales and agricultural machinery. It has equipment, a loading and unloading area, office and sales areas, and a meeting room. As a result of its achievements, the AGLX —which is located in the municipal seat— has achieved regional recognition; these achievements include the participation of several members in the Unión Ganadera Regional del Centro de Veracruz. Therefore, the AGLX carries out strategic activities to promote dairy activity and benefit the actors in the chain, which is consistent with the findings of other authors for similar organizations (Granados-Sánchez et al., 2016; Camacho-Vera et al., 2017a).
b) Clients The flow of AGLX products and services focuses on ranchers in Xico’s area of influence and its surrounding municipalities. Eighty percent of its clients are members, while 20% of non-members acquires at least one product or service from the association.
c) Suppliers The AGLX acquires its products from various companies: Albagran, Trigoli, and ADM supply grain; Industrial Patrona supplies soybean and canola meal; and Bayer and Zoetis supply medicines. Invoices are issued through the portal of the Servicio de Administración Tributaria (SAT) of the Government of Mexico. Livestock mobility procedures (filling out guides) and the placing of identification ear tags follow the federal guidelines established by the Sistema Nacional de Identificación Individual de Ganado (SINIIGA), the Secretaría de Agricultura y Desarrollo Rural (SADER), and the Servicio Nacional de Sanidad, Inocuidad y Calidad Agroalimentaria (SENASICA). Meanwhile, state guidelines were established by the Secretaría de Desarrollo Agropecuario, Rural y Pesca (SEDARPA), through the Dirección de Ganadería of the State of Veracruz.
d) Complementors The following actors were detected: SADER, SENASICA, SINIIGA, SEDARPA, and the Dirección de Ganadería of the State of Veracruz. According to its legal basis, the association can offer consultancy and provide services. A public accountant provides accounting advise and a nutritionist helps to formulate the balanced feed. Likewise, the staff of the Consejo para el Fomento de la Calidad de la Leche y sus Derivados, A.C. (COFOCALEC) has trained them on issues of milk quality and current standards. The Instituto de Ecología, A.C. (INECOL) has carried out various researches about livestock and the Facultad de Medicina y Veterinaria of the Universidad Veracruzana (UV) has carried out research work and arranged academic visits by students. Fostering the link between producers and complementors in order to establish technology transfer and research dissemination programs is an important step (Ireta-Paredes et al., 2020). Some
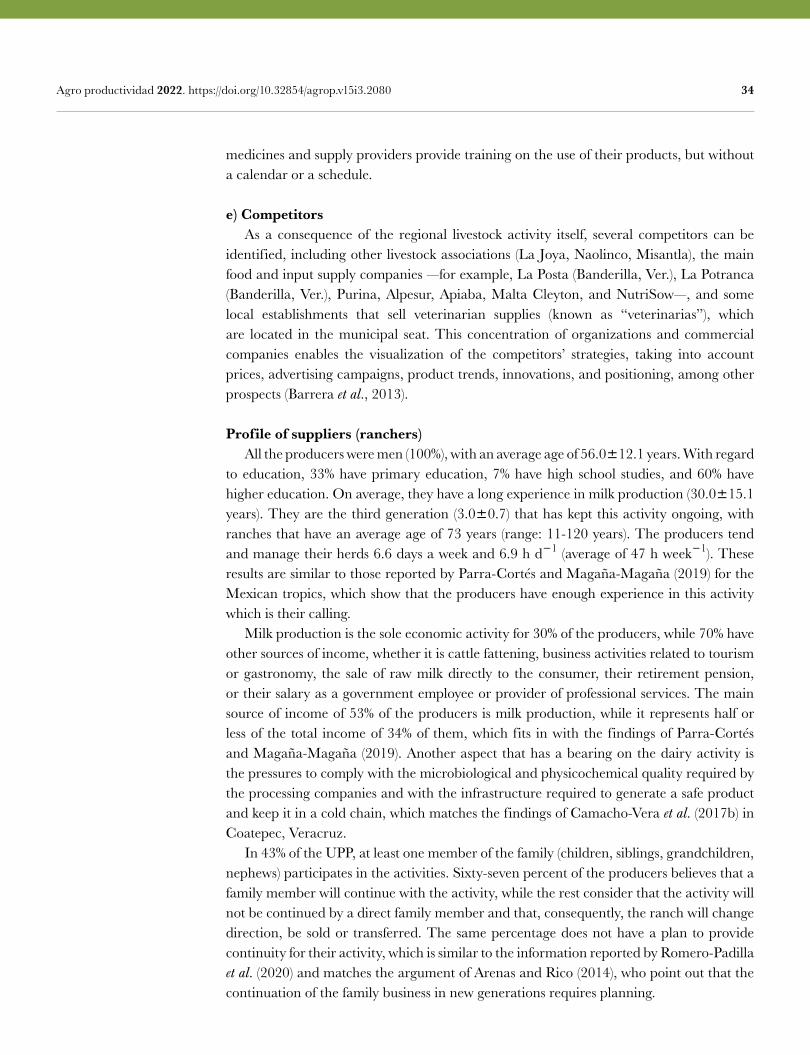
34 Agro productividad 2022. https://doi.org/10.32854/agrop.v15i3.2080
medicines and supply providers provide training on the use of their products, but without a calendar or a schedule.
e) Competitors As a consequence of the regional livestock activity itself, several competitors can be identified, including other livestock associations (La Joya, Naolinco, Misantla), the main food and input supply companies —for example, La Posta (Banderilla, Ver.), La Potranca (Banderilla, Ver.), Purina, Alpesur, Apiaba, Malta Cleyton, and NutriSow—, and some local establishments that sell veterinarian supplies (known as “veterinarias”), which are located in the municipal seat. This concentration of organizations and commercial companies enables the visualization of the competitors’ strategies, taking into account prices, advertising campaigns, product trends, innovations, and positioning, among other prospects (Barrera et al., 2013).
Profile of suppliers (ranchers) All the producers were men (100%), with an average age of 56.012.1 years. With regard to education, 33% have primary education, 7% have high school studies, and 60% have higher education. On average, they have a long experience in milk production (30.015.1 years). They are the third generation (3.00.7) that has kept this activity ongoing, with ranches that have an average age of 73 years (range: 11-120 years). The producers tend and manage their herds 6.6 days a week and 6.9 h d1 (average of 47 h week1). These results are similar to those reported by Parra-Cortés and Magaña-Magaña (2019) for the Mexican tropics, which show that the producers have enough experience in this activity which is their calling. Milk production is the sole economic activity for 30% of the producers, while 70% have other sources of income, whether it is cattle fattening, business activities related to tourism or gastronomy, the sale of raw milk directly to the consumer, their retirement pension, or their salary as a government employee or provider of professional services. The main source of income of 53% of the producers is milk production, while it represents half or less of the total income of 34% of them, which fits in with the findings of Parra-Cortés and Magaña-Magaña (2019). Another aspect that has a bearing on the dairy activity is the pressures to comply with the microbiological and physicochemical quality required by the processing companies and with the infrastructure required to generate a safe product and keep it in a cold chain, which matches the findings of Camacho-Vera et al. (2017b) in Coatepec, Veracruz. In 43% of the UPP, at least one member of the family (children, siblings, grandchildren, nephews) participates in the activities. Sixty-seven percent of the producers believes that a family member will continue with the activity, while the rest consider that the activity will not be continued by a direct family member and that, consequently, the ranch will change direction, be sold or transferred. The same percentage does not have a plan to provide continuity for their activity, which is similar to the information reported by Romero-Padilla et al. (2020) and matches the argument of Arenas and Rico (2014), who point out that the continuation of the family business in new generations requires planning.
35 Agro productividad 2022. https://doi.org/10.32854/agrop.v15i3.2080
CONCLUSIONS In Xico, Veracruz, Mexico, milk is produced by small- (83%) and medium-sized (17%) producers, who have experience, calling, infrastructure, and specialized dairy cows. The main marketing channels are Nestlé and Liconsa. The activity can be strengthened with the participation of the Asociación Ganadera Local de Xico, if it reconsiders its goals and starts providing benefits to its members and actors in the value network, beyond the sale of supplies and services; the said benefits should include training actions and the harmonization of the supplier development system with anchor companies.
ACKNOWLEDGEMENTSThe authors would like to thank the producers of the Asociación Ganadera Local de Xico, Veracruz.
REFERENCESAguilar Ávila, J., Muñoz Rodríguez, M., Rendón Medel, R., & Altamirano Cárdenas, J.R. (2007). Selección de
actores a entrevistar para analizar la dinámica de innovación bajo el enfoque de redes. 1ª ed. Centro de investigaciones económicas, sociales y tecnológicas de la agroindustria y agricultura mundial (CIESTAAM) – Universidad Autónoma Chapingo, México. 33 p.
Arenas Cardona, H.A., & Rico Balvín, D. (2014). La empresa familiar, el protocolo y la sucesión familiar. Estudios Gerenciales. 30 (132). 252-258. Doi: 10.1016/j.estger.2014.02.013
Barrera Rodríguez, A.I., Baca Del Moral, J., Santoyo Cortés, H.V., & Altamirano Cárdenas, J.R. (2013). Propuesta metodológica para analizar la competitividad de redes de valor agroindustriales. Revista Mexicana de Agronegocios. 32. 231-244.
Camacho-Vera, J.H., Cervantes-Escoto, F., Palacios-Rangel, M.I., Rosales-Noriega, F., & Vargas-Canales, J.M. (2017a). Factores determinantes del rendimiento en unidades de producción de lechería familiar. Revista Mexicana de Ciencias Pecuarias. 8(1). 23-29. Doi: 10.22319/rmcp.v8i1.4313
Camacho-Vera, J.H., Cervantes-Escoto, F., Palacios-Rangel, M.I., Cesín-Vargas, A, & Ocampo-Ledezma, J. (2017). Especialización de los sistemas productivos lecheros en México: la difusión del modelo tecnológico Holstein. Revista Mexicana de Ciencias Pecuarias. 8(3). 259-268. Doi: 10.22319/rmcp.v8i3.4191.
Cervantes Escoto, F., Cesín Vargas, A., & Mamani Oño, I. (2013). La calidad estándar de la leche en el estado de Hidalgo, México. Revista Mexicana de Ciencias Pecuarias 4(1). 75-86.
Cruz Rosales, M., Huerta Crespo, C., & Arellano Gámez, L. (2016). Situación actual de la ganadería en la zona centro del municipio de Xico, Veracruz. 1ª ed. Instituto de Ecología, A. C. Xalapa, Veracruz, México. 29 p.
FAOSTAT (Organización de la Naciones Unidad para la Alimentación y la Agricultura). (2020). Producción mundial de leche, importaciones y precio de leche entera y descremada en polvo. Información en línea. Disponible en: http://www.fao.org/faostat/es/#data
Gaceta Oficial del estado de Veracruz. (2021). Ley Ganadera para el Estado de Veracruz de Ignacio de la Llave. H. Congreso del estado de Veracruz. Actualización 31 de marzo 2021.
Granados-Sánchez, M.R., Leos-Rodríguez, J.A., Santoyo-Cortés, V.H., & Gómez-Oliver, L. (2016). Estrategia de fortalecimiento para la ganadería de ovinos del valle de Tulancingo, Hidalgo, México. Agroproductividad 9(5): 9-15.
Hernández-Morales, P., Estrada-Flores, J.G., Avilés-Nova, F., Yong-Ángel, G., López-González, F., Solís-Méndez, A.D., & Castelán-Ortega, O.A. (2013). Tipificación de los sistemas campesinos de producción de leche del sur del estado de México. Universidad y Ciencia. 29(1): 19-31.
Ireta-Paredes, A., Pérez-Hernández, P., Bautista-Ortega, J., Ayala-Garay, A.V., Aguilar-Ávila, J., & Soto-Estrada, A. (2020). The mango value network (Mangifera indica L.) in Campeche, Mexico. Agroproductividad. 13. 109-114. Doi: 10.32854/agrop.v13i11.1813
Mariscal-Aguayo, V., Pacheco-Cervantes, A., Estrella-Quintero, H., Huerta-Bravo, M., Rangel-Santos, R., & Núñez-Domínguez, R. (2017). Estratificación de productores lecheros en los altos de Jalisco. Agricultura Sociedad y Desarrollo 14. 547-563.
36 Agro productividad 2022. https://doi.org/10.32854/agrop.v15i3.2080
Muñoz Rodríguez, M., & Santoyo Cortés, H.V. (2011). La red de valor: herramienta de análisis para la toma de decisiones de política pública y estrategia agroempresarial. 1ª ed. CIESTAAM- Universidad Autónoma Chapingo, México. 16 p.
Parra-Cortés, R.I., & Magaña-Magaña, M.A. (2019). Características técnico-económicas de los sistemas de producción bovina basados en razas criollas introducidas en México. Ecosistemas y Recursos Agropecuarios. 6(18). 535-547. Doi: 10.19136/era.a6n18.2160
Romero-Padilla, A., Márquez-Beber, S.R., Santoyo-Cortés, V.H., Ayala-Garay, A.V., & Altamirano-Cárdenas, J.R. (2020). La sucesión agrícola de unidades de producción del centro de México. ITEA-Información Técnica Económica Agraria. 116(4): 353-370.
Santoyo Cortés, V.H., Ramírez, P., & Suvedi, M. (2002). Manual para evaluación de programas de desarrollo rural. 2ª ed. rev. Mundi Prensa. Rio panuco 141, Colonia Cuahutemoc, Ciudad de México, Mexico. 242 p.
SIAP (Servicio de Información Agroalimentaria y Pesquera). (2019). Boletín de leche enero-marzo 2019. SADER, Gobierno de México. Disponible en: https://www.gob.mx/siap/documentos/boletin-de-leche?state=draft (Consulta: octubre de 2020).
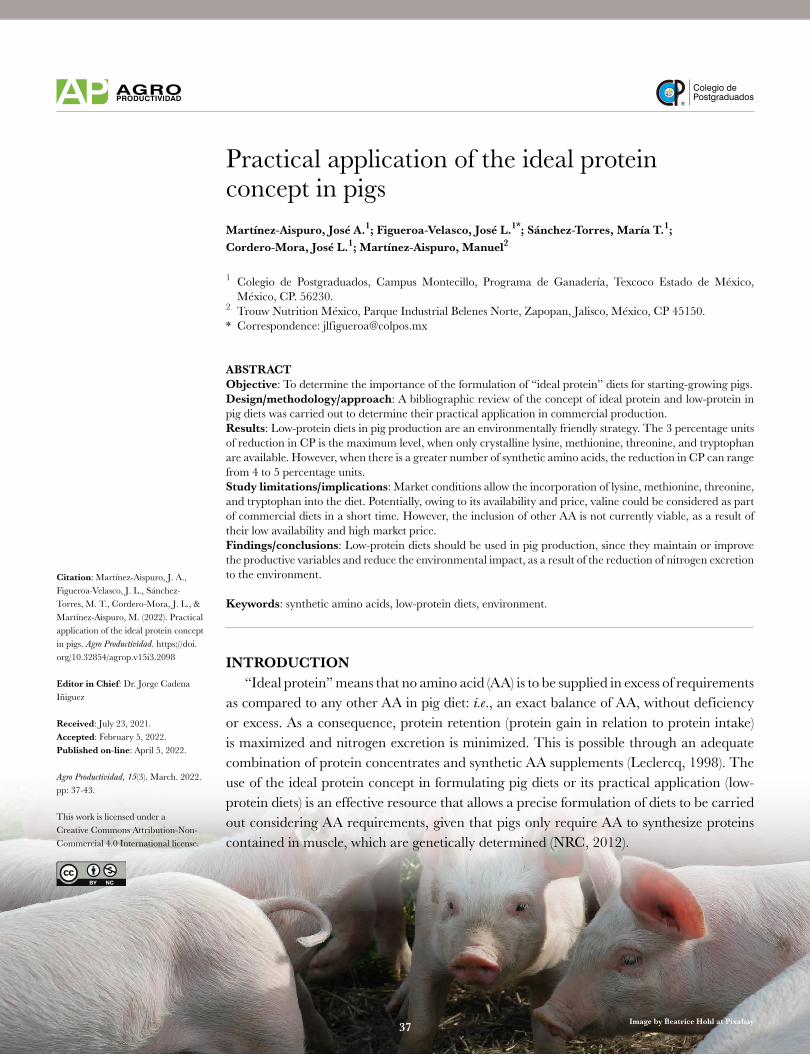
Colegio dePostgraduados
37
Citation: Martínez-Aispuro, J. A., Figueroa-Velasco, J. L., Sánchez-Torres, M. T., Cordero-Mora, J. L., & Martínez-Aispuro, M. (2022). Practical application of the ideal protein concept in pigs. Agro Productividad. https://doi.org/10.32854/agrop.v15i3.2098
Editor in Chief: Dr. Jorge Cadena Iñiguez
Received: July 23, 2021.Accepted: February 5, 2022.Published on-line: April 5, 2022.
Agro Productividad, 15(3). March. 2022. pp: 37-43.
This work is licensed under a Creative Commons Attribution-Non-Commercial 4.0 International license.
Practical application of the ideal protein concept in pigsMartínez-Aispuro, José A.1; Figueroa-Velasco, José L.1*; Sánchez-Torres, María T.1; Cordero-Mora, José L.1; Martínez-Aispuro, Manuel2
1 Colegio de Postgraduados, Campus Montecillo, Programa de Ganadería, Texcoco Estado de México, México, CP. 56230.
2 Trouw Nutrition México, Parque Industrial Belenes Norte, Zapopan, Jalisco, México, CP 45150.* Correspondence: [email protected]
ABSTRACTObjective: To determine the importance of the formulation of “ideal protein” diets for starting-growing pigs.Design/methodology/approach: A bibliographic review of the concept of ideal protein and low-protein in pig diets was carried out to determine their practical application in commercial production.Results: Low-protein diets in pig production are an environmentally friendly strategy. The 3 percentage units of reduction in CP is the maximum level, when only crystalline lysine, methionine, threonine, and tryptophan are available. However, when there is a greater number of synthetic amino acids, the reduction in CP can range from 4 to 5 percentage units.Study limitations/implications: Market conditions allow the incorporation of lysine, methionine, threonine, and tryptophan into the diet. Potentially, owing to its availability and price, valine could be considered as part of commercial diets in a short time. However, the inclusion of other AA is not currently viable, as a result of their low availability and high market price.Findings/conclusions: Low-protein diets should be used in pig production, since they maintain or improve the productive variables and reduce the environmental impact, as a result of the reduction of nitrogen excretion to the environment.
Keywords: synthetic amino acids, low-protein diets, environment.
INTRODUCTION “Ideal protein” means that no amino acid (AA) is to be supplied in excess of requirements as compared to any other AA in pig diet: i.e., an exact balance of AA, without deficiency or excess. As a consequence, protein retention (protein gain in relation to protein intake) is maximized and nitrogen excretion is minimized. This is possible through an adequate combination of protein concentrates and synthetic AA supplements (Leclercq, 1998). The use of the ideal protein concept in formulating pig diets or its practical application (low-protein diets) is an effective resource that allows a precise formulation of diets to be carried out considering AA requirements, given that pigs only require AA to synthesize proteins contained in muscle, which are genetically determined (NRC, 2012).
Image by Beatrice Hohl at Pixabay 37
38 Agro productividad 2022. https://doi.org/10.32854/agrop.v15i3.2098
A diet formulation based on ideal protein and low-protein diets (LPDs) requires a vast amount and variety of high-quality ingredients or the availability of plenty essential synthetic amino acids at an affordable price for producers. LPDs supplemented with synthetic amino acids allow for a reduction in protein ingredients, at a lower feed cost and an economic impact that benefits pig farmers (Wang et al., 2020). Over the last years, as a consequence of the boom in synthetic AA production, a window of possibilities has opened up for the ideal protein concept to be put into practice (Gloaguen et al., 2014; Peng et al., 2016). The aim of this review was to determine the importance of diet formulation for starting-growing pigs under the concept of “Ideal Protein”.
Low-protein diets (LPDs) The reduction in crude protein (CP) in sorghum, corn, soymeal or canola-based diets —associated with an adequate addition of synthetic amino acids (AA)— allows for a reduction in AA deficiency or excess in balanced feeds (ideal protein) (Wang et al., 2020), which may go hand in hand with a reduction in production costs, as well as in the excretion of fecal and urinary nitrogen to the environment (Seradj et al., 2018; Wu et al., 2018; Niyazov et al., 2020). A reduction of 10 g kg1 of CP in diet may lower ammonia emissions in feces and urine by 8% to 10% (Wang et al., 2018). Low-protein diets may also reduce the characteristic odor of pig holdings. Odor emissions were reduced by 4.2% for every percentage point of CP lowered in the diet (Trabue et al., 2021), reaching up to 30% by lowering 3-4 percentage points of CP (Hayes et al., 2004; Leek et al., 2007).
Productive performance and diet formulation CP reduction in diets for starting and growing pigs results in a productive performance similar to standard diets and even improves on certain productive variables (greater weight gain and feed efficiency) (Gloaguen et al., 2014; He et al., 2016; Peng et al., 2016; Figueroa et al., 2019; Wang et al., 2019). This is the result of a better balance between AA for protein synthesis and the fact that AA are not used as a source of energy. However, CP reduction in diet should be no higher than 3 percentage points when only synthetic lysine, methionine, threonine, and tryptophan are used, given its impact on productive performance (associated to a lower lean meat yield and a greater fatty tissue accumulation) (Zamora et al., 2011; Gloaguen et al., 2014; He et al., 2016). The negative response to low-CP diets may be caused by AA deficiency, given that CP reduction limits the concentration of some essential AA, as well as the amount of nitrogen needed for non-essential AA synthesis (Gloaguen et al., 2014). Although the recommendations of the NRC (2012) do not set a CP value, the sum of the values of each AA results in the approximate CP value. However, if only the four most common commercially-available synthetic AA (lysine, methionine, threonine, and tryptophan) can be included in the standard diet (NRC, 2012), the CP value provided by the formulation only allows for a reduction of approximately 1.5 percentage points of CP with regard to the NRC’s (1998) recommendations, if the remaining AA requirements are to be met.
39 Agro productividad 2022. https://doi.org/10.32854/agrop.v15i3.2098
In order to find alternatives to make up for AA deficiency with a CP reduction in diet, there is now a wider variety of synthetic AA available for research or practical application (lysine, methionine, threonine, tryptophan, valine, histidine, leucine, isoleucine, proline, phenylalanine, arginine, and glutamine); however, some of these AA are not readily available in the market or they are exceedingly expensive with regards to the expected financial gain (histidine, leucine, isoleucine, proline, phenylalanine, and glutamine). Through the use of the aforementioned synthetic AA, it is theoretically feasible to balance and drastically reduce protein content in diet (NRC, 2012). However, using nearly 10 synthetic AA in diet allows for a maximum reduction of 4-5 percentage points of CP (Gloaguen et al., 2014; Peng et al., 2016). A higher percentage leads to the growth and development of defective organs, associated with alterations in intestinal morphology and immune function (Peng et al., 2016), as well as a low availability of nitrogen for the synthesis of other AA (Gloaguen et al., 2014). The low productive performance observed with properly-balanced LPDs when a large amount of synthetic AA is added may be caused by an intact protein deficiency or an excess of free AA (Wang et al., 2018). The inclusion of protein-bound AA is more efficient in sustaining nitrogen retention and protein homeostasis in the whole body than free AA (Guay et al., 2006). Additionally, hydrolyzed dipeptide and tripeptide content from intact proteins correlates positively with digestive enzyme activity (Shimizu, 2004). The fastest rate of free AA absorption may induce an excessive AA oxidization, contributing to a decline in the excretion of body proteins and defective growth (Yen et al., 2004). Another important aspect to be considered is that, under the concept of diet formulation for pigs at a minimum cost, it is economically more feasible to exceed the NRC’s recommendations (2012) of certain AA in diet than to attempt to reach the lowest (optimal) values (Dubeau et al., 2011), since basic ingredients (sorghum, corn, soy, and canola) have a high concentration of these AA. Therefore, when attempting to include a large amount of synthetic AA in diets, the fact that this leads to a reduction in base protein ingredients (Gloaguen et al., 2014; Peng et al., 2016; Figueroa et al., 2019) must be considered. Consequently, an economic assessment must be carried out to compare the substitution of one raw material for another.
Low Protein Diets and meat quality A CP reduction of less than two percentage points in pig diet does not affect the percentage of lean meat nor fat in the carcass (Zamora et al., 2011; Qin et al., 2015; Figueroa et al., 2019). There is also evidence that neither sex nor genetics impact the reduction of 2 percentage points of CP over meat percentage, meat yield in the carcass or backfat thickness (Molist et al., 2016). However, González et al. (2016) observed that a reduction of more than three percentage points of CP in pig diet lowered lean meat percentage while increasing fat in the carcass, possibly as a result of a greater availability of net energy for the accumulation of fatty tissue (Li et al., 2016). In a work carried out by Li et al. (2018), a reduction of more than three percentage points of CP increased the red color value (a*), intramuscular fat, monounsaturated fatty acid content, and AA content
40 Agro productividad 2022. https://doi.org/10.32854/agrop.v15i3.2098
related to meat f lavor, while lowering the content of polyunsaturated fatty acids and the cutting force of meat.
Gut health Diet manipulation regarding CP content has been suggested as part of a general strategy for the nutritional management of weaned pigs in order to improve gut health. The use of LPD minimizes the amount of undigested dietary protein that enters the large intestine and is subjected to bacterial fermentation; this is important because protein fermentation leads to the production of toxic metabolites and encourages the proliferation of pathogenic bacteria, causing enteric problems such as post-weaning diarrhea. LPD feeding interferes with enterotoxigenic E. coli adhesion to intestinal mucosa, thus minimizing its ability to cause disease (Nyachoti and Lee, 2020). A moderate restriction of dietary CP can modify the composition of intestinal microbiota (Zhou et al., 2016) and improve the function of the ileal barrier in adult pigs (Fan et al., 2017). A low-protein diet is recommended over a diet with proteins exceeding nutritional needs. The highest levels and undigested protein lead to an increase in pathogenic microorganisms, increasing the associated risk of developing a metabolic disease (Zhao et al., 2019). With moderate CP restriction, pigs are able to adjust their absorption and intake of nutrients to sustain growth, whereas extremely low-protein diets suppress appetite, alter intestinal morphology, decrease lactobacilli and streptococci, and reduce energy intake in pigs (Yu et al., 2019). On the whole, adequate LPD management can reduce the incidence of post-weaning diarrhea, sustain gut health, and modify intestinal morphology and microbiota (Ren et al., 2015; Wang et al., 2018). The use of LPD reduces 2-3 percentage points of CP in diet through synthetic AA supplements for post-weaning pigs and, therefore, can be effective in reducing diarrhea, while improving fecal consistence (Lynegaard et al., 2021). In addition, moderate protein restriction (3 percentage points) can optimize the structure of ileal microbiota, strengthening beneficial microbial populations and suppressing the growth of harmful bacteria, as well as modifying the proliferation of epithelial cells (Chen et al., 2018). There is evidence that reducing CP levels in diet within a range no greater than three percentage points does not modify the integrity of intestinal morphology (Ren et al., 2015; Chen et al., 2018). However, a reduction greater than four percentage points results in reduced villi height in the duodenum and the jejunum, even when diets are complemented with isoleucine, valine, histidine, and phenylalanine (Fan et al., 2017). The reduction in villi height in LPD-fed pigs is probably related with a lower number of the proteins or AA that sustain the architecture of the intestinal epithelium (Wang et al., 2018). However, including nine synthetic AA in nursery piglet diets can reduce CP by five percentage points (from 20% to 15%) with no detrimental effect on immune response; nevertheless, a greater reduction (up to 14%) led to the growth and development of defective organs, associated with modifications of intestinal morphology and immune function (Peng et al., 2016).
41 Agro productividad 2022. https://doi.org/10.32854/agrop.v15i3.2098
The influence of CP levels in diet on intestinal microbiota has been more broadly studied in weaned piglets, because the bacterial composition of growing and finishing pigs remains relatively stable (Wang et al., 2018). A reduction of five percentage points of CP in recently weaned piglet diet lowered counts of Clostridium leptum (Pieper et al., 2012), while pigs fed with 14% CP displayed a lower count of Firmicutes and Clostridium cluster, than those feed with 20% CP, with a minimal impact on other bacterial populations (Luo et al., 2015). For their part, Opapeju et al. (2015) report that a reduction of five percentage points of CP in diets for weaned pigs infected with Escherichia coli reduced its proliferation and fixation in intestinal mucosa. Diet formulation for pigs in starting and growing stages should take into consideration a reduction of three percentage points of CP through the use of the four essential amino acids (lysine, methionine, threonine, and tryptophan) which are readily available for purchase. When other essential or functional amino acids (arginine, valine, leucine, isoleucine, etc.) become readily available or accessible, they should be assessed for application in the formulation, in order to determine if it is economically or functionally feasible to include them in the diet. Although the use of some synthetic amino acids in diet has shown favorable results during experiments, their price and availability are neither feasible nor permissible within current market conditions. Therefore, a greater inclusion of synthetic amino acids will depend on their cost-benefit ratio, in the context of productive performance, sustainability, animal health, and well-being.
CONCLUSIONS The application of the ideal protein concept in starting and growing pigs —through the reduction of protein in diet and the inclusion of synthetic amino acids— improves parameters and productive efficiency, benefits pig health, and implements an environmentally friendly production. A reduction of three percentage points of CP is the maximum level attainable when only synthetic lysine, methionine, threonine, and tryptophan are available. However, when a wider variety of commercial amino acids is available, CP reduction may reach 4-5 percentage points. Pigs fed on conventional diets are unable to synthesize enough amino acids for an optimal gut health and growth. Therefore, an increase in these amino acid levels —through supplements at certain productive stages or physiological stress states— may improve performance response and animal health.
REFERENCESChen, X., Song, P., Fan, P., He, T., Jacobs, D., Levesque, C. L., Johnston, L.J., Ji, L., Ma, N., Chen, Y., Zhang, J.,
Zhao, J., & Ma, X. (2018). Moderate dietary protein restriction optimized gut microbiota and mucosal barrier in growing pig model. Front. Cell. Infect. Microbiol, 8, 246. Doi: 10.3389/fcimb.2018.00246
Dubeau, F., Julien, P.O., & Pomar, C. (2011). Formulating diets for growing pigs: economic and environmental considerations. Annals of Operations Research, 190(1), 239-269. Doi: 10.1007/s10479-009-0633-1
Fan, P., Liu, P., Song, P., Chen, X., & Ma, X. (2017). Moderate dietary protein restriction alters the composition of gut microbiota and improves ileal barrier function in adult pig model. Scientific Reports, 7(1), 1-12. Doi: 10.1038/srep43412
Figueroa, J.L., Martinez, J.A., Sanchez-Torres, M.T., Cordero, J.L., Martinez, M., Valdez, V.M., & Ruiz, A. (2019). Evaluation of reduced amino acids diets added with protected protease on productive performance in 25-100 kg barrows. Austral Journal of Veterinary Sciences, 51(2), 53-60. Doi: 10.4067/S0719-81322019000200053
42 Agro productividad 2022. https://doi.org/10.32854/agrop.v15i3.2098
Gloaguen, M., Le Floc’h, N., Corrent, E., Primot, Y., & van Milgen, J. (2014). The use of free amino acids allows formulating very low crude protein diets for piglets. Journal of Animal Science, 92(2), 637-644. Doi: 10.2527/jas.2013-6514
González, M., Figueroa, J.L., Vaquera, H., Sánchez-Torres, M.T., Ortega, M.E., Copado, J.M.F., & Martínez, J.A. (2016). Meta-análisis del efecto de dietas bajas en proteína y adicionada con aminoácidos sintéticos para cerdos machos castrados en finalización. Archivos de Medicina Veterinaria, 48(1), 50-58.
Guay, F., Donovan, S.M., & Trottier, N.L. (2006). Biochemical and morphological developments are partially impaired in intestinal mucosa from growing pigs fed reduced-protein diets supplemented with crystalline amino acids. Journal of Animal Science, 84(7), 1749-1760. Doi: 10.2527/jas.2005-558
Hayes, E.T., Leek, A.B.G., Curran, T.P., Dodd, V.A., Carton, O.T., Beattie, V.E., & O’Doherty, J.V. (2004). The influence of diet crude protein level on odour and ammonia emissions from pig houses. Bioresource Technology, 91(3), 309-315. Doi: 10.1016/s0960-8524(03)00184-6
He, L., Wu, L., Xu, Z., Li, T., Yao, K., Cui, Z., Yin, Y., & Wu, G. (2016). Low-protein diets affect ileal amino acid digestibility and gene expression of digestive enzymes in growing and finishing pigs. Amino Acids, 48(1), 21-30. Doi: 10.1007/s00726-015-2059-1
Leek, A.B., Hayes, E.T., Curran, T.P., Callan, J.J., Beattie, V.E., Dodd, V.A., & O’Doherty, J.V. (2007). The influence of manure composition on emissions of odour and ammonia from finishing pigs fed different concentrations of dietary crude protein. Bioresource Technology, 98(18), 3431-3439. Doi: 10.1016/j.biortech.2006.11.003
Li, Y. H., Li, F. N., Duan, Y. H., Guo, Q. P., Wen, C. Y., Wang, W. L., Huang, X.G., & Yin, Y. L. (2018). Low-protein diet improves meat quality of growing and finishing pigs through changing lipid metabolism, fiber characteristics, and free amino acid profile of the muscle. Journal of Animal Science, 96(8), 3221-3232. Doi: 10.1093/jas/sky116
Li, Y., Li, F., Chen, S., Duan, Y., Guo, Q., Wang, W., Wen, C., & Yin, Y. (2016). Protein-restricted diet regulates lipid and energy metabolism in skeletal muscle of growing pigs. Journal of Agricultural and Food Chemistry, 64(49), 9412-9420. Doi: 10.1021/acs.jafc.6b03959
Luo, Z., Li, C., Cheng, Y., Hang, S., & Zhu, W. (2015). Effects of low dietary protein on the metabolites and microbial communities in the caecal digesta of piglets. Archives of Animal Nutrition, 69(3), 212-226. Doi: 10.1080/1745039X.2015.1034521
Lynegaard, J.C., Kjeldsen, N.J., Bache, J.K., Weber, N.R., Hansen, C.F., Nielsen, J.P., & Amdi, C. (2021). Low protein diets without medicinal zinc oxide for weaned pigs reduced diarrhoea treatments and average daily gain. Animal, 15(1), 100075. Doi: 10.1016/j.animal.2020.100075
Molist, F., Pijlman, J., van der Aar, P.J., Rovers, M., Ensink, J., & Corrent, E. (2016). Effect of low crude protein diets on growth performance and carcass characteristics of grower-finisher pigs. Journal of Animal Science, 94 (3). 226-229. Doi: 10.2527/jas.2015-9733
Niyazov, N.S.A., Cherepanov, G.G., & Ostrenko, K.S. (2020). Use of low-protein diets for growing pigs to reduce fecal nitrogen excretion. Ukrainian Journal of Ecology, 10, 313-316.
Nyachoti, M., & Lee, J. (2020). 13 Opportunities for using low-protein diets for weanling pigs to improve intestinal health. Journal of Animal Science, 98 (3). 18-19. Doi: 10.1093/jas/skaa054.031
NRC, National Research Council. (1998). Nutrient requirements of swine. 10th Ed. National Academy Press. Washington DC, USA. 212 p.
NRC, National Research Council. (2012). Nutrient Requirements of Swine. 11th Ed. National Academy Press. Washington, DC, USA. 400p.
Opapeju, F.O., Rodriguez-Lecompte, J.C., Rademacher, M., Krause, D.O., & Nyachoti, C.M. (2015). Low crude protein diets modulate intestinal responses in weaned pigs challenged with Escherichia coli K88. Canadian Journal of Animal Science, 95(1), 71-78. Doi: 10.4141/cjas-2014-071
Peng, X., Hu, L., Liu, Y., Yan, C., Fang, Z. F., Lin, Y., Wu, C.M., Chen, D.W., Sunn, H., Wu, D., & Che, L.Q. (2016). Effects of low-protein diets supplemented with indispensable amino acids on growth performance, intestinal morphology and immunological parameters in 13 to 35 kg pigs. Animal, 10(11), 1812-1820. Doi: 10.1017/S1751731116000999
Pieper, R., Kröger, S., Richter, J.F., Wang, J., Martin, L., Bindelle, J., Htoo, J.K., von Smolinski, D., Vahjen, W., Zentek, J., & van Kessel, A. G. (2012). Fermentable fiber ameliorates fermentable protein-induced changes in microbial ecology, but not the mucosal response, in the colon of piglets. The Journal of Nutrition, 142 (4). 661-667. Doi: 10.3945/jn.111.156190
Qin, C., Huang, P., Qiu, K., Sun, W., Xu, L., Zhang, X., & Yin, J. (2015). Influences of dietary protein sources and crude protein levels on intracellular free amino acid profile in the longissimus dorsi muscle of finishing gilts. Journal of Animal Science and Biotechnology, 6(52), 1-10.
43 Agro productividad 2022. https://doi.org/10.32854/agrop.v15i3.2098
Ren, M., Zhang, S. H., Zeng, X. F., Liu, H., & Qiao, S. Y. (2015). Branched-chain amino acids are beneficial to maintain growth performance and intestinal immune-related function in weaned piglets fed protein restricted diet. Asian-Australasian Journal of Animal Sciences, 28(12), 1742-1750. Doi: 10.5713/ajas.14.0131
Seradj, A.R., Balcells, J., Morazan, H., Alvarez-Rodriguez, J., Babot, D., & De la Fuente, G. (2018). The impact of reducing dietary crude protein and increasing total dietary fiber on hindgut fermentation, the methanogen community and gas emission in growing pigs. Animal Feed Science and Technology, 245, 54-66. Doi: 10.1016/j.anifeedsci.2018.09.005
Shimizu, M. (2004). Food-derived peptides and intestinal functions. Biofactors, 21, 43-47.Trabue, S.L., Kerr, B.J., Scoggin, K.D., Andersen, D., & Van Weelden, M. (2021). Swine diets impact manure
characteristics and gas emissions: Part I protein level. Science of the Total Environment, 755 (2), 142528. Doi: 10.1016/j.scitotenv.2020.142528
Wang, Y., Zhou, J., Wang, G., Cai, S., Zeng, X., & Qiao, S. (2018). Advances in low-protein diets for swine. Journal of Animal Science and Biotechnology, 9, 1-14.
Wang, Y.M., Yu, H.T., Zhou, J.Y., Zeng, X.F., Wang, G., Cai, S., Huang, S., Zhu, Z.P., Tan, J.J., Johnston L.J., Levesque C.L., & Qiao, S.Y. (2019). Effects of feeding growing-finishing pigs with low crude protein diets on growth performance, carcass characteristics, meat quality and nutrient digestibility in different areas of China. Animal Feed Science and Technology, 256, 114256. Doi: 10.1016/j.anifeedsci.2019.114256
Wang, H., Long, W., Chadwick, D., Velthof, G.L., Oenema, O., Ma, W., Wang, J., Qin, W., Hou, Y., & Zhang, F. (2020). Can dietary manipulations improve the productivity of pigs with lower environmental and economic cost? A global meta-analysis. Agriculture, Ecosystems & Environment, 289, 106748.
Wu, L., Zhang, X., Tang, Z., Li, Y., Li, T., Xu, Q., Zhen, J., Huang, F., Yang, J., Chen, C., Wu, Z., Li, M., Sun, J., Chen, C., An, R., Zhao, S., Jiang, Q., Zhu, W., Yin, Y., & Sun, Z. (2018). Low-protein diets decrease porcine nitrogen excretion but with restrictive effects on amino acid utilization. Journal of Agricultural and Food Chemistry, 66(31), 8262-8271.
Yen, J.T., Kerr, B.J., Easter, R.A., & Parkhurst, A.M. (2004). Difference in rates of net portal absorption between crystalline and protein-bound lysine and threonine in growing pigs fed once daily. Journal of Animal Science, 82, 1079-90.
Yu, D., Zhu, W., & Hang, S. (2019). Effects of long-term dietary protein restriction on intestinal morphology, digestive enzymes, gut hormones, and colonic microbiota in pigs. Animals, 9(4), 180.
Zamora, V., Figueroa, J.L., Reyna, L., Cordero, J.L., Sánchez-Torres, M.T., & Martínez, M. (2011). Growth performance, carcass characteristics and plasma urea nitrogen concentration of nursery pigs fed low-protein diets supplemented with glucomannans or protease. Journal of Applied Animal Research, 39, 53-56.
Zhao, J., Zhang, X., Liu, H., Brown, M.A., & Qiao, S. (2019). Dietary protein and gut microbiota composition and function. Current Protein and Peptide Science, 20(2), 145-154.
Zhou, L., Fang, L., Sun, Y., Su, Y., & Zhu, W. (2016). Effects of the dietary protein level on the microbial composition and metabolomic profile in the hindgut of the pig. Anaerobe, 38, 61-69

Colegio dePostgraduados
45
Stability of milk from dual purpose cows with different types of feedingHernández-Bautista Jorge1; Rodríguez-Magadán Héctor M.1; Salinas-Ríos Teodulo1*, Pérez-León María I.2; Aquino-Cleto Magaly1; Mariscal-Méndez Araceli1
1 Facultad de Medicina Veterinaria y Zootecnia, Universidad Autónoma Benito Juárez de Oaxaca, Av. Universidad S/N, Ex-Hacienda 5 Señores, 68120, Oaxaca de Juárez, México.
2 Instituto Tecnológico del Valle de Oaxaca, Tecnológico Nacional de México, Ex Hacienda de Nazareno, Agencia de Policía Nazareno Xoxo, Centro, 71230, Santa Cruz Xoxocotlán, Oaxaca, México.
* Correspondence: [email protected]
ABSTRACTObjective: To establish milk stability using the alcohol test in cows with different feeding strategies in the tropical dairy system.Design/methodology/approach: Ten crossbred Holstein Zebu cows whose milk frequently tested positive to the alcohol test were housed in individual yards and distributed into two groups. Experiment 1. T1: cows consumed dry Pangola grass (Digitaria eriantha); T2: cows consumed green Maralfalfa grass (Pennisetum violaceum). Forage was provided ad libitum. Experiment 2. T1 cows were supplemented with a concentrate with higher crude protein and metabolizable energy percentage than T2 cows; this percentage was gradually increased up to 4.0 kg. Milk was subjected to alcohol testing. Variance analyzes were performed under categorical data models.Results: Higher percentages of cases that tested positive for alcohol were observed in cows that consumed dry grass than in cows that consumed green grass (P0.05). The concentrate addition to diets based on dry or green forage reduced the positive case percentage.Implications: A balanced diet improves milk stability.Findings/conclusions: The improvement in the cows’ nutritional value decreases the percentage of milk with positive results in the alcohol test.
Keywords: Forage, tropical dairy, milking, Abnormal Milk Syndrome.
INTRODUCTION In order to establish milk stability at the high temperatures to which it is subjected during its processing, a quick test has been established (Dumpler et al., 2020). This test consists of adding equal amounts of milk and 68% ethanol (NMX-F-700-COFOCALEC-2012). If no clots appear in the milk, it is considered negative and suitable for its pasteurization; however, if coagulation and solid-liquid phase separation occur, it means that the result is positive and consequently milk is rejected. Nowadays, producers and collectors face a serious problem: most of the milk is rejected, because it tests positive for alcohol (Rodríguez-Magadán et al.,
Citation: Hernández-Bautista, J., Rodríguez-Magadán, H. M., Salinas-Ríos, T., Pérez-León, M. I., Aquino-Cleto, M., & Mariscal-Méndez, A. (2022). Stability of milk from dual purpose cows with different types of feeding. Agro Productividad. https://doi.org /10.32854/agrop.v15i3.2119
Editor in Chief: Dr. Jorge Cadena Iñiguez
Received: September 5, 2021.Accepted: February 28, 2022.Published on-line: April 5, 2022.
Agro Productividad, 15(3). March. 2022. pp: 45-51.
This work is licensed under a Creative Commons Attribution-Non-Commercial 4.0 International license.
Image by stux at Pixabay
46 Agro productividad 2022. https://doi.org/ 10.32854/agrop.v15i3.2119
2019). Several studies have been performed in order to identify what causes milk instability. Barchiesi-Ferrari et al. (2007) and other authors suggest that there is a correlation between the positive herds and the lower concentration of dry matter and high crude fiber. In this regard, Chávez et al. (2004) reported that the lower casein concentration of unstable milk does not affect the total protein; meanwhile, Reid et al. (2015) found that increasing protein and phosphorus in the diet results in lower milk stability at a 6.8 pH. Therefore, metabolic changes in lactating dairy cows aimed at maintaining the acid-base status of the blood in balance play an important role in keeping the stability of milk in face of ethanol (Martins et al., 2015), since milk from cows with impaired acid-base balance is less stable, although these alterations do not always cause unstable milk (Fagnani et al., 2014). With regard to the genotype and time of the year, García et al. (2009) reported that the milk from Holstein cows is more stable than Girolando’s; likewise, milk is more stable in the rainy season than in the dry season. Production and cow body condition substantially improve in the rainy season, because cows eat green grass with a large number of sprouts and therefore obtain a better nutritional quality. On the contrary, in the dry season, cattle consume dry forage with higher fiber content and low nutritional concentration, which could influence milk stability. The purpose of this research was to determine the stability of the milk produced by cows managed in the tropical dairy system with different feeding strategies.
MATERIAL AND METHODS The study was performed in the community of San José Manialtepec, Villa de Tututepec, in the coast region of the state of Oaxaca, Mexico (15° 58’ 21” N and 97° 14’ 40” W), at an altitude of 20 masl. The area has an average annual temperature of 28 °C and a 1,300-mm rainfall (INEGI, 2018).
Description of the production system The experimental study was established in a tropical dairy production system in which calves were separated from their mothers the third day after birth and they were provided milk substitute for two months. Cows were fed with Tanzania (Panicum maximum) and Insurgente (Brachiaria brizantha) grasses, collected by grazing. Two milkings were performed per day (06:00 a.m. and 04:00 p.m.).
Description of the animal population and sample characteristics Before the study was established, 11 milk samples (6 in the morning and 5 in the afternoon) were taken from each of the n60 milked cows that constituted the herd; the aim was to identify those cows whose milk frequently tested positive for alcohol. The test consisted of mixing 1 mL of milk with 1 mL of 68% alcohol (NMX-F-700-COFOCALEC-2012); the resulting mix was immediately homogenized, and a reading was taken. The alcohol test was considered positive if coagulation and solid-liquid phase separation of the milk were observed (Carrera et al., 2011). Subsequently, n10 cows were selected because their milk production tested positive more frequently for alcohol. The specimens chosen were crossbred cows (Holstein Zebu) with an average live weight of 369.0844.70 kg. They
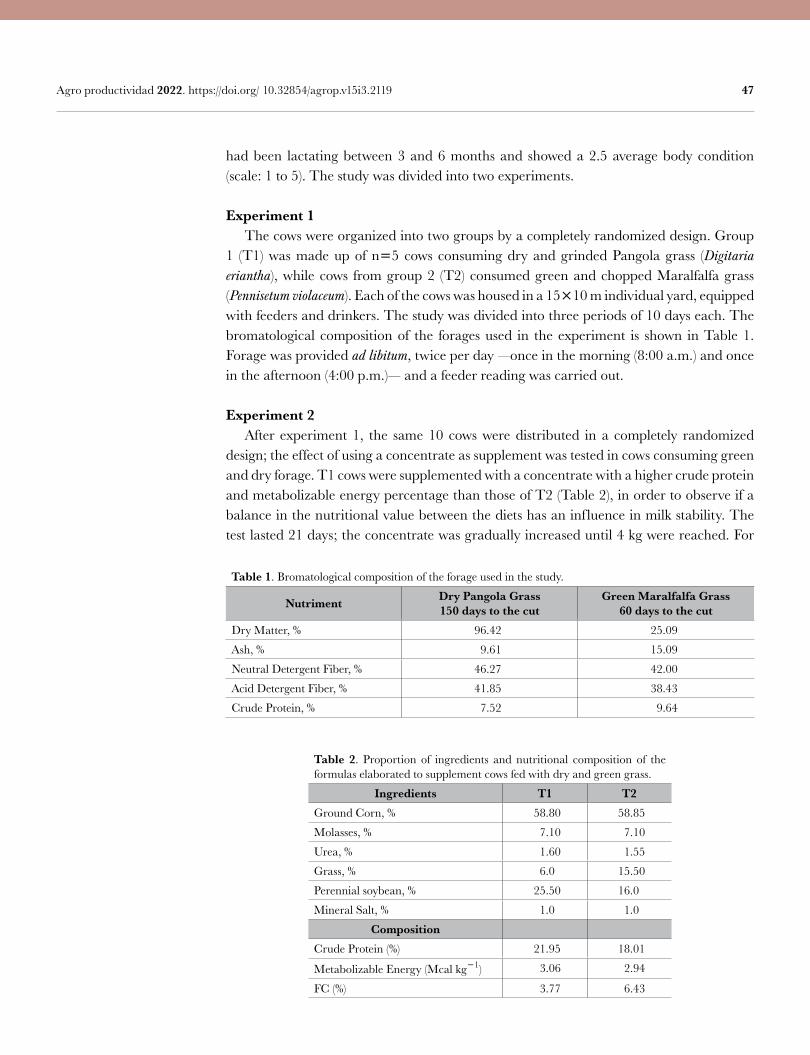
47 Agro productividad 2022. https://doi.org/ 10.32854/agrop.v15i3.2119
had been lactating between 3 and 6 months and showed a 2.5 average body condition (scale: 1 to 5). The study was divided into two experiments.
Experiment 1 The cows were organized into two groups by a completely randomized design. Group 1 (T1) was made up of n5 cows consuming dry and grinded Pangola grass (Digitaria eriantha), while cows from group 2 (T2) consumed green and chopped Maralfalfa grass (Pennisetum violaceum). Each of the cows was housed in a 1510 m individual yard, equipped with feeders and drinkers. The study was divided into three periods of 10 days each. The bromatological composition of the forages used in the experiment is shown in Table 1. Forage was provided ad libitum, twice per day —once in the morning (8:00 a.m.) and once in the afternoon (4:00 p.m.)— and a feeder reading was carried out.
Experiment 2 After experiment 1, the same 10 cows were distributed in a completely randomized design; the effect of using a concentrate as supplement was tested in cows consuming green and dry forage. T1 cows were supplemented with a concentrate with a higher crude protein and metabolizable energy percentage than those of T2 (Table 2), in order to observe if a balance in the nutritional value between the diets has an influence in milk stability. The test lasted 21 days; the concentrate was gradually increased until 4 kg were reached. For
Table 1. Bromatological composition of the forage used in the study.
Nutriment Dry Pangola Grass150 days to the cut
Green Maralfalfa Grass60 days to the cut
Dry Matter, % 96.42 25.09
Ash, % 9.61 15.09
Neutral Detergent Fiber, % 46.27 42.00
Acid Detergent Fiber, % 41.85 38.43
Crude Protein, % 7.52 9.64
Table 2. Proportion of ingredients and nutritional composition of the formulas elaborated to supplement cows fed with dry and green grass.
Ingredients T1 T2Ground Corn, % 58.80 58.85
Molasses, % 7.10 7.10
Urea, % 1.60 1.55
Grass, % 6.0 15.50
Perennial soybean, % 25.50 16.0
Mineral Salt, % 1.0 1.0
CompositionCrude Protein (%) 21.95 18.01
Metabolizable Energy (Mcal kg1) 3.06 2.94
FC (%) 3.77 6.43
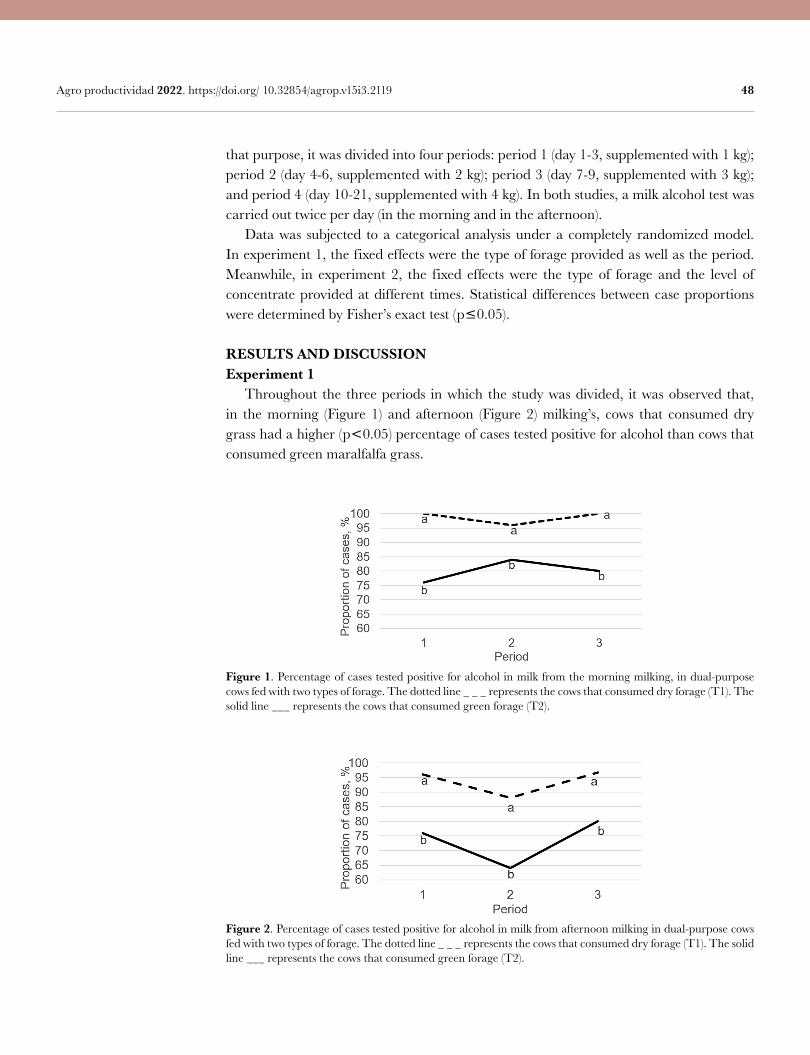
48 Agro productividad 2022. https://doi.org/ 10.32854/agrop.v15i3.2119
that purpose, it was divided into four periods: period 1 (day 1-3, supplemented with 1 kg); period 2 (day 4-6, supplemented with 2 kg); period 3 (day 7-9, supplemented with 3 kg); and period 4 (day 10-21, supplemented with 4 kg). In both studies, a milk alcohol test was carried out twice per day (in the morning and in the afternoon). Data was subjected to a categorical analysis under a completely randomized model. In experiment 1, the fixed effects were the type of forage provided as well as the period. Meanwhile, in experiment 2, the fixed effects were the type of forage and the level of concentrate provided at different times. Statistical differences between case proportions were determined by Fisher’s exact test (p0.05).
RESULTS AND DISCUSSIONExperiment 1 Throughout the three periods in which the study was divided, it was observed that, in the morning (Figure 1) and afternoon (Figure 2) milking’s, cows that consumed dry grass had a higher (p0.05) percentage of cases tested positive for alcohol than cows that consumed green maralfalfa grass.
Figure 1. Percentage of cases tested positive for alcohol in milk from the morning milking, in dual-purpose cows fed with two types of forage. The dotted line _ _ _ represents the cows that consumed dry forage (T1). The solid line ___ represents the cows that consumed green forage (T2).
Figure 2. Percentage of cases tested positive for alcohol in milk from afternoon milking in dual-purpose cows fed with two types of forage. The dotted line _ _ _ represents the cows that consumed dry forage (T1). The solid line ___ represents the cows that consumed green forage (T2).
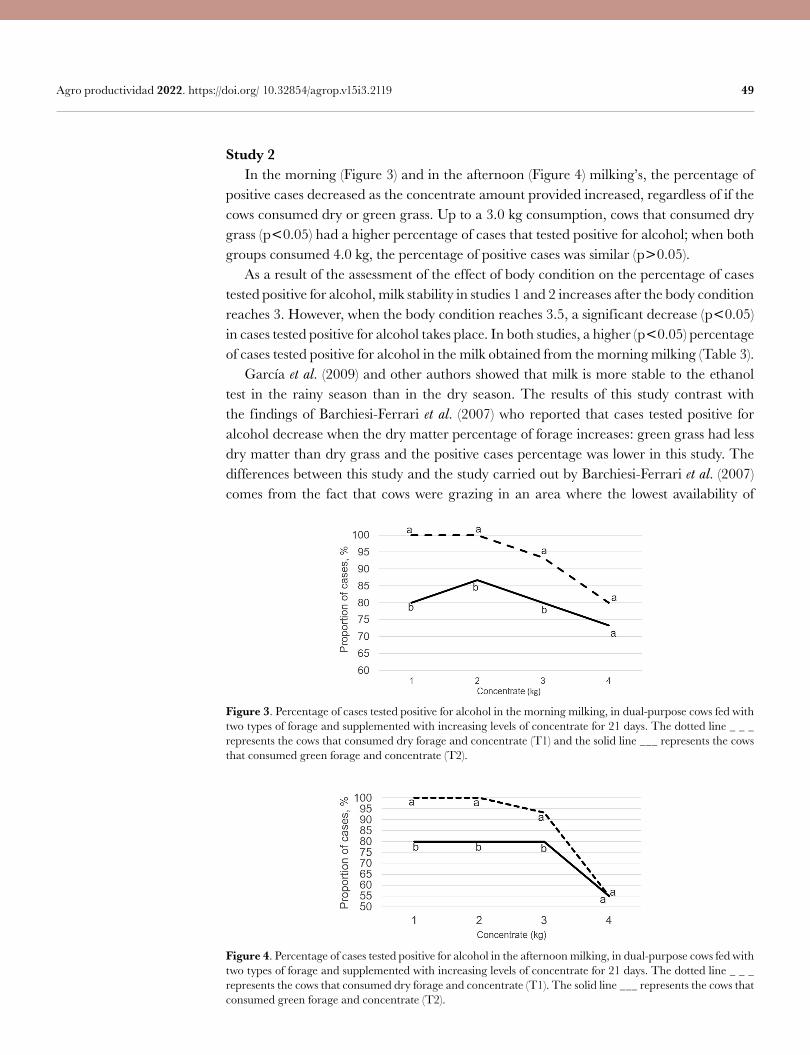
49 Agro productividad 2022. https://doi.org/ 10.32854/agrop.v15i3.2119
Study 2 In the morning (Figure 3) and in the afternoon (Figure 4) milkingʼs, the percentage of positive cases decreased as the concentrate amount provided increased, regardless of if the cows consumed dry or green grass. Up to a 3.0 kg consumption, cows that consumed dry grass (p0.05) had a higher percentage of cases that tested positive for alcohol; when both groups consumed 4.0 kg, the percentage of positive cases was similar (p0.05). As a result of the assessment of the effect of body condition on the percentage of cases tested positive for alcohol, milk stability in studies 1 and 2 increases after the body condition reaches 3. However, when the body condition reaches 3.5, a significant decrease (p0.05) in cases tested positive for alcohol takes place. In both studies, a higher (p0.05) percentage of cases tested positive for alcohol in the milk obtained from the morning milking (Table 3). García et al. (2009) and other authors showed that milk is more stable to the ethanol test in the rainy season than in the dry season. The results of this study contrast with the findings of Barchiesi-Ferrari et al. (2007) who reported that cases tested positive for alcohol decrease when the dry matter percentage of forage increases: green grass had less dry matter than dry grass and the positive cases percentage was lower in this study. The differences between this study and the study carried out by Barchiesi-Ferrari et al. (2007) comes from the fact that cows were grazing in an area where the lowest availability of
Figure 4. Percentage of cases tested positive for alcohol in the afternoon milking, in dual-purpose cows fed with two types of forage and supplemented with increasing levels of concentrate for 21 days. The dotted line _ _ _ represents the cows that consumed dry forage and concentrate (T1). The solid line ___ represents the cows that consumed green forage and concentrate (T2).
Figure 3. Percentage of cases tested positive for alcohol in the morning milking, in dual-purpose cows fed with two types of forage and supplemented with increasing levels of concentrate for 21 days. The dotted line _ _ _ represents the cows that consumed dry forage and concentrate (T1) and the solid line ___ represents the cows that consumed green forage and concentrate (T2).
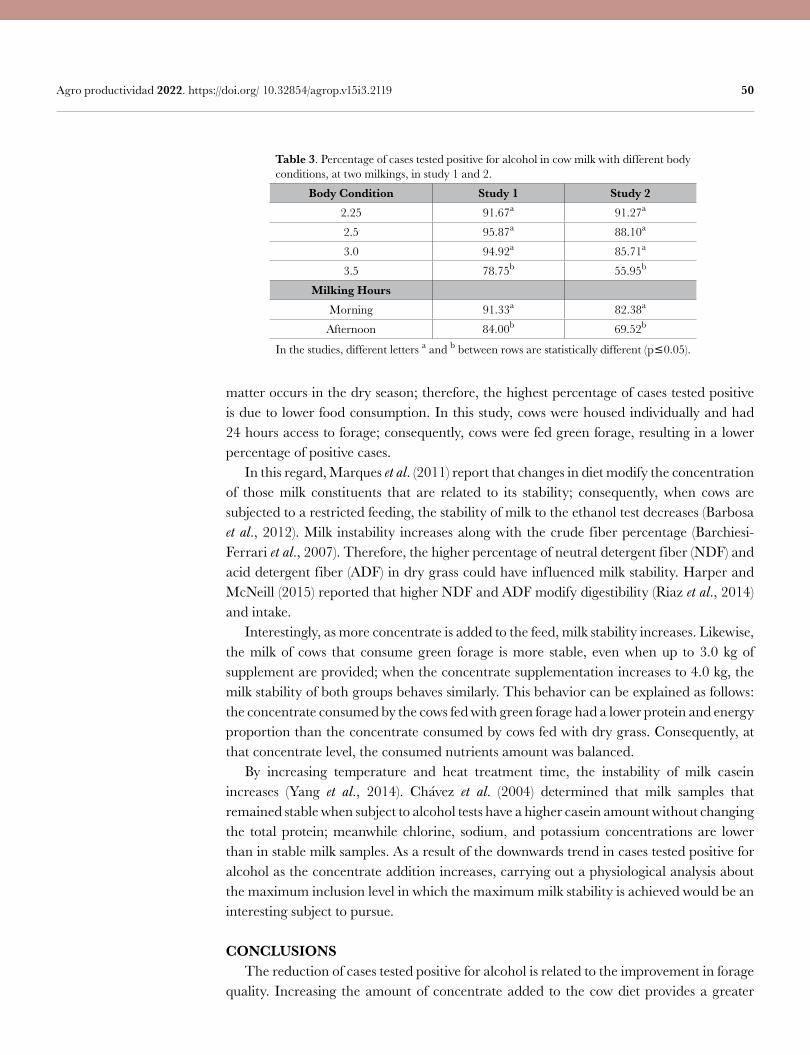
50 Agro productividad 2022. https://doi.org/ 10.32854/agrop.v15i3.2119
matter occurs in the dry season; therefore, the highest percentage of cases tested positive is due to lower food consumption. In this study, cows were housed individually and had 24 hours access to forage; consequently, cows were fed green forage, resulting in a lower percentage of positive cases. In this regard, Marques et al. (2011) report that changes in diet modify the concentration of those milk constituents that are related to its stability; consequently, when cows are subjected to a restricted feeding, the stability of milk to the ethanol test decreases (Barbosa et al., 2012). Milk instability increases along with the crude fiber percentage (Barchiesi-Ferrari et al., 2007). Therefore, the higher percentage of neutral detergent fiber (NDF) and acid detergent fiber (ADF) in dry grass could have influenced milk stability. Harper and McNeill (2015) reported that higher NDF and ADF modify digestibility (Riaz et al., 2014) and intake. Interestingly, as more concentrate is added to the feed, milk stability increases. Likewise, the milk of cows that consume green forage is more stable, even when up to 3.0 kg of supplement are provided; when the concentrate supplementation increases to 4.0 kg, the milk stability of both groups behaves similarly. This behavior can be explained as follows: the concentrate consumed by the cows fed with green forage had a lower protein and energy proportion than the concentrate consumed by cows fed with dry grass. Consequently, at that concentrate level, the consumed nutrients amount was balanced. By increasing temperature and heat treatment time, the instability of milk casein increases (Yang et al., 2014). Chávez et al. (2004) determined that milk samples that remained stable when subject to alcohol tests have a higher casein amount without changing the total protein; meanwhile chlorine, sodium, and potassium concentrations are lower than in stable milk samples. As a result of the downwards trend in cases tested positive for alcohol as the concentrate addition increases, carrying out a physiological analysis about the maximum inclusion level in which the maximum milk stability is achieved would be an interesting subject to pursue.
CONCLUSIONS The reduction of cases tested positive for alcohol is related to the improvement in forage quality. Increasing the amount of concentrate added to the cow diet provides a greater
Table 3. Percentage of cases tested positive for alcohol in cow milk with different body conditions, at two milkings, in study 1 and 2.
Body Condition Study 1 Study 22.25 91.67a 91.27a
2.5 95.87a 88.10a
3.0 94.92a 85.71a
3.5 78.75b 55.95b
Milking HoursMorning 91.33a 82.38a
Afternoon 84.00b 69.52b
In the studies, different letters a and b between rows are statistically different (p0.05).
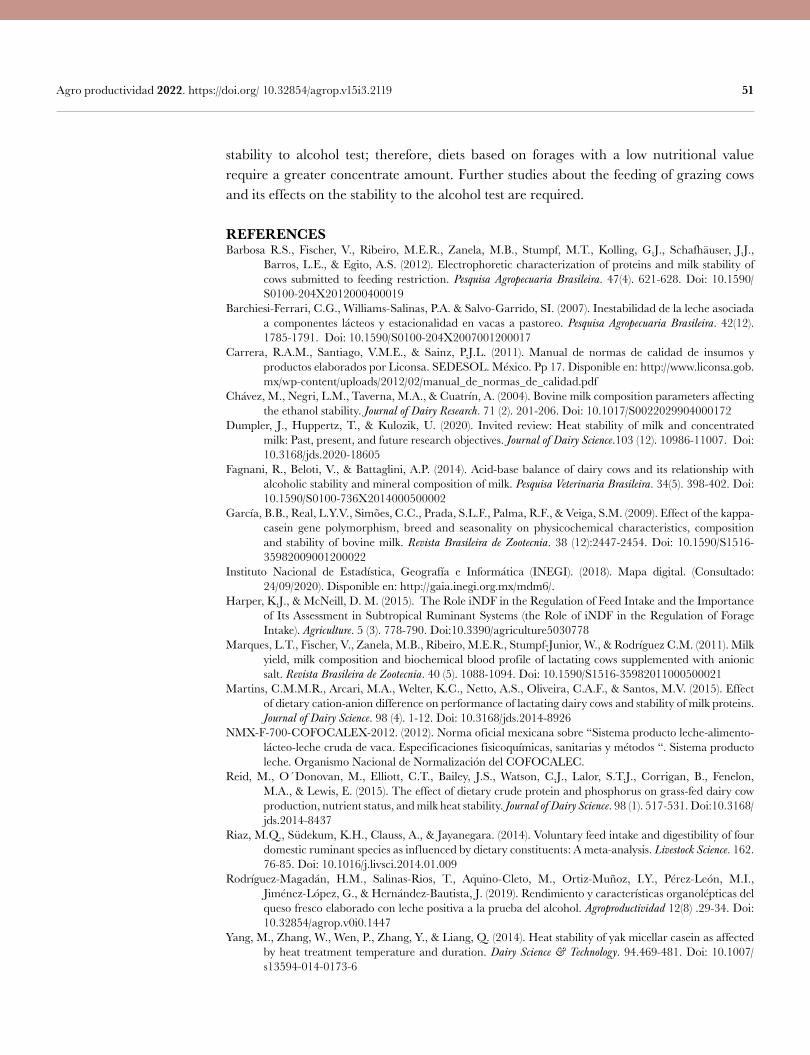
51 Agro productividad 2022. https://doi.org/ 10.32854/agrop.v15i3.2119
stability to alcohol test; therefore, diets based on forages with a low nutritional value require a greater concentrate amount. Further studies about the feeding of grazing cows and its effects on the stability to the alcohol test are required.
REFERENCESBarbosa R.S., Fischer, V., Ribeiro, M.E.R., Zanela, M.B., Stumpf, M.T., Kolling, G.J., Schafhäuser, J.J.,
Barros, L.E., & Egito, A.S. (2012). Electrophoretic characterization of proteins and milk stability of cows submitted to feeding restriction. Pesquisa Agropecuaria Brasileira. 47(4). 621-628. Doi: 10.1590/S0100-204X2012000400019
Barchiesi-Ferrari, C.G., Williams-Salinas, P.A. & Salvo-Garrido, SI. (2007). Inestabilidad de la leche asociada a componentes lácteos y estacionalidad en vacas a pastoreo. Pesquisa Agropecuaria Brasileira. 42(12). 1785-1791. Doi: 10.1590/S0100-204X2007001200017
Carrera, R.A.M., Santiago, V.M.E., & Sainz, P.J.L. (2011). Manual de normas de calidad de insumos y productos elaborados por Liconsa. SEDESOL. México. Pp 17. Disponible en: http://www.liconsa.gob.mx/wp-content/uploads/2012/02/manual_de_normas_de_calidad.pdf
Chávez, M., Negri, L.M., Taverna, M.A., & Cuatrín, A. (2004). Bovine milk composition parameters affecting the ethanol stability. Journal of Dairy Research. 71 (2). 201-206. Doi: 10.1017/S0022029904000172
Dumpler, J., Huppertz, T., & Kulozik, U. (2020). Invited review: Heat stability of milk and concentrated milk: Past, present, and future research objectives. Journal of Dairy Science.103 (12). 10986-11007. Doi: 10.3168/jds.2020-18605
Fagnani, R., Beloti, V., & Battaglini, A.P. (2014). Acid-base balance of dairy cows and its relationship with alcoholic stability and mineral composition of milk. Pesquisa Veterinaria Brasileira. 34(5). 398-402. Doi: 10.1590/S0100-736X2014000500002
García, B.B., Real, L.Y.V., Simões, C.C., Prada, S.L.F., Palma, R.F., & Veiga, S.M. (2009). Effect of the kappa-casein gene polymorphism, breed and seasonality on physicochemical characteristics, composition and stability of bovine milk. Revista Brasileira de Zootecnia. 38 (12):2447-2454. Doi: 10.1590/S1516-35982009001200022
Instituto Nacional de Estadística, Geografía e Informática (INEGI). (2018). Mapa digital. (Consultado: 24/09/2020). Disponible en: http://gaia.inegi.org.mx/mdm6/.
Harper, K.J., & McNeill, D. M. (2015). The Role iNDF in the Regulation of Feed Intake and the Importance of Its Assessment in Subtropical Ruminant Systems (the Role of iNDF in the Regulation of Forage Intake). Agriculture. 5 (3). 778-790. Doi:10.3390/agriculture5030778
Marques, L.T., Fischer, V., Zanela, M.B., Ribeiro, M.E.R., Stumpf-Junior, W., & Rodríguez C.M. (2011). Milk yield, milk composition and biochemical blood profile of lactating cows supplemented with anionic salt. Revista Brasileira de Zootecnia. 40 (5). 1088-1094. Doi: 10.1590/S1516-35982011000500021
Martins, C.M.M.R., Arcari, M.A., Welter, K.C., Netto, A.S., Oliveira, C.A.F., & Santos, M.V. (2015). Effect of dietary cation-anion difference on performance of lactating dairy cows and stability of milk proteins. Journal of Dairy Science. 98 (4). 1-12. Doi: 10.3168/jds.2014-8926
NMX-F-700-COFOCALEX-2012. (2012). Norma oficial mexicana sobre “Sistema producto leche-alimento-lácteo-leche cruda de vaca. Especificaciones fisicoquímicas, sanitarias y métodos “. Sistema producto leche. Organismo Nacional de Normalización del COFOCALEC.
Reid, M., O´Donovan, M., Elliott, C.T., Bailey, J.S., Watson, C.J., Lalor, S.T.J., Corrigan, B., Fenelon, M.A., & Lewis, E. (2015). The effect of dietary crude protein and phosphorus on grass-fed dairy cow production, nutrient status, and milk heat stability. Journal of Dairy Science. 98 (1). 517-531. Doi:10.3168/jds.2014-8437
Riaz, M.Q., Südekum, K.H., Clauss, A., & Jayanegara. (2014). Voluntary feed intake and digestibility of four domestic ruminant species as influenced by dietary constituents: A meta-analysis. Livestock Science. 162. 76-85. Doi: 10.1016/j.livsci.2014.01.009
Rodríguez-Magadán, H.M., Salinas-Rios, T., Aquino-Cleto, M., Ortiz-Muñoz, I.Y., Pérez-León, M.I., Jiménez-López, G., & Hernández-Bautista, J. (2019). Rendimiento y características organolépticas del queso fresco elaborado con leche positiva a la prueba del alcohol. Agroproductividad 12(8) .29-34. Doi: 10.32854/agrop.v0i0.1447
Yang, M., Zhang, W., Wen, P., Zhang, Y., & Liang, Q. (2014). Heat stability of yak micellar casein as affected by heat treatment temperature and duration. Dairy Science & Technology. 94.469-481. Doi: 10.1007/s13594-014-0173-6

Colegio dePostgraduados
53
Enzyme biomarker response in Zenaida asiatica from an agricultural area of Campeche, MexicoCazán-Noz C. A.1 (ID:0000-0003-4924-0235), Rendón-von Osten J.2, (ID:0000-0002-3585-0211), Dzul-Caamal R.2 (ID: 0000-0002-3879-7348), Tarango-Arámbula Luis A.3 (ID:0000-0002-7662-1319), Castillo-Cupul Raúl E.4 (ID:0000-0002-9152-7988), Flota-Bañuelos C.5* (ID:0000-0001-5533-6722)
1 Posgrado en Bioprospección y sustentabilidad agrícola en el trópico, Colegio de Postgraduados Campus Campeche, Carretera Sihochac-Edzná Km 17.5, Champotón, Campeche, Mexico.
2 Instituto de Ecología, Pesquerías y Oceanografía del Golfo de México, Av. Héroe de Nacozari 480, C.P. 24070, San Francisco de Campeche, Campeche, México.
3 Posgrado de Innovación en Manejo de Recursos Naturales, Colegio de Postgraduados Campus San Luis Potosí, Iturbide No. 73, C. P. 78600, Salinas de Hidalgo, San Luis Potosí, Mexico.
4 Instituto Tecnológico de Tizimín, Final Aeropuerto Cupul S/N, CP. 97700, Tizimín, Yucatán.5 CONACYT-Colegio de Postgraduados Campus Campeche, Carretera Sihochac-Edzná Km 17.5,
Champotón, Campeche, Mexico*Correspondence: [email protected]
ABSTRACTObjective: To evaluate the response of CAT, AChE, and GST enzyme biomarkers in Zenaida asiatica from an agricultural area of the municipality of Champotón, Campeche.Design/methodology/approach: The biomarkers AChE, CAT, and GST were analyzed in tissues of 24 birds from backyards and agricultural areas of Champotón, Campeche. The enzymatic activities in the tissues were compared by means of a t test and comparison of means (Tukey p0.05), with the Statistica v. 7 software.Results: The highest AChE activity occurred in the brain (p0.00001), CAT activity in liver (p0.00001), and GST activity in liver and brain (p0.001).Study limitations/implications: To evaluate the effect of pesticides on wild birds, a larger number of individuals is required in different agricultural areas.Findings/conclusions: In the tissues of Z. asiatica from agricultural areas, greater activity of the biomarkers AChE, CAT, and GST was found, reflecting the excessive use of pesticides.
Keywords: Zenaida asiatica, Acetylcholinesterase, Catalase, Glutathione S-Transferase.
INTRODUCTION The agricultural area cultivated in the Mexican Republic comprised 22,148,245.07 ha in the year 2015 (SIAP, 2016). The state of Campeche has 314,812.03 ha (SIAP, 2016), of which 14.3% are located in the Champotón municipality, which grows as its main crops maize (Zea mays L.) and sugar cane (Saccharum spp.), with 34.1% and 32.4%, respectively (SIAP, 2016). The main issues affecting production within these systems include disease and pests, which are mainly controlled with synthetic pesticides (Aktar et al., 2009), such as carbamates, pyrethroids, organochlorines (OCs),
Citation: Cazán-Noz, C. A., Rendón-von, O. J., Dzul-Caamal, R., Tarango-Arámbula, L. A., Castillo-Cupul, R. E., & Flota-Bañuelos, C. (2022). Enzyme biomarker response in Zenaida asiatica from an agricultural area of Campeche, Mexico. Agro Productividad. https://doi.org/ 10.32854/agrop.v15i3.2121
Editor in Chief: Dr. Jorge Cadena Iñiguez
Received: September 7, 2021.Accepted: February 14, 2022.Published on-line: April 5, 2022.
Agro Productividad, 15(3). March. 2022. pp: 53-59.
This work is licensed under a Creative Commons Attribution-Non-Commercial 4.0 International license.
Image by Alejandro Hernández Ortiz at Pixabay
54 Agro productividad 2022. https://doi.org/10.32854/agrop.v15i3.2121
and organophosphates (OFs), among others (CICOPLAFEST, 2013). However, OC pesticides have a high risk of accumulation in the exposed fatty tissues of organisms and of biomagnification in the food web (Chaiyarat et al., 2014); meanwhile, OFs mainly affect the nervous system of vertebrates and invertebrates through the phosphorylation of the acetylcholinesterase enzyme (AChE) in nerve endings (Ghorab and Khalil, 2015). In these agricultural systems, organisms coexist at different levels of the food chain, as is the case with birds (Padoa-Shioppa et al., 2005), which are highly sensitive to the toxic effects of OFs (Robles et al., 2007). Juveniles (nestlings) have the greatest propensity to intoxication, as a consequence of the low concentration of cholinesterase (AChE) per unit of brain tissue, leading to greater absorption of pesticides through contaminated food (grain and insects), through contact with their parents or because their nests are located within agricultural areas (Burgess et al., 1999). The effects caused by exposure to toxic residue can be detected through various biomarkers which quantify stress proteins and the activity of the enzymes catalase (CAT), glutathione-S-transferase (GST), and acetylcholinesterase (AChE) (Arago, 2012). These effects have been evaluated in bird species such as Gallus domesticus, exposed to 3-phenoxybenzyl (permethrin), causing a 10% reduction of liver activity for GST (Ezeji et al., 2012), and under a dosage of 30 ppm of 6,7,8,9,10,10-hexachloro-1,5,5a,6,9,9a-hexahydro-6,9-methano-2,4,3-benzodioxathiepin-3-oxide (endosulfan). This caused reductions in CAT activities and GSH content in blood, as well as an increase in AChE activity (Aggarwal et al., 2008). In white stork (Ciconia ciconia) juveniles and adults, AChE activity in plasma was found to be inhibited by paraoxon-methyl followed by carbofuran and carbaryl (Oropesa et al., 2013). In the blood of Passe domesticus exposed to the use of malathion (Ops) in agricultural areas of Durango, an 11.58% inhibition of butyrylcholinesterase took place (Bujdud et al., 2019). In Palizada, Campeche, Mexico, AChE inhibition in the brains of Dendrocygna autumnalis in rice plantations was recorded (Rendón et al., 2005). A potential relationship between these effects on enzyme biomarkers and pesticides used in the field has been documented. González-Gómez et al. (2020) reported polychlorinated biphenyls (PCB), organochlorine pesticides (OCs), and polybrominated biphenyls concentrations on 90% of the feathers of 71 individuals of Columna livia domestica collected in Asturias and Galicia. However, there is no information about the enzymatic activities of birds present in agricultural areas of the state of Campeche. Therefore, the objective of this study was to evaluate the response of enzyme biomarkers CAT, AChE, and GST in the species Zenaida asiatica from an agricultural area in the municipality of Champotón, Campeche, Mexico.
MATERIALS AND METHODS The study was conducted during the March-August 2017 period in the locality of Santo Domingo Kesté, Champotón, Campeche (19° 30’ 54” N, 90° 26’ 41” W). The weather is warm and sub-humid with an average annual temperature of 26 °C and the town is located 24 meters above sea level. The soil is argillaceous and used mainly for agriculture (INEGI, 2014). The population is largely dedicated to relay agriculture, growing maize (Zea mays), cushaw pumpkin (Cucurbita argyrosperma Huber), beans (Phaseolus spp.), hibiscus (Hibiscus
55 Agro productividad 2022. https://doi.org/10.32854/agrop.v15i3.2121
sabdariffa), and peanuts (Arachis hypogaea), which they use for sale and self-consumption (INEGI, 2010). In maize crops, 61.78% of farmers apply pesticides prior to germination and 55.20% apply some type of insecticide, mainly to stave off armyworms after 30 days of germination (Uzcanga et al., 2015). Insecticides, pesticides, and granular fertilizers are applied, in order to grow cushaw pumpkins (Ireta-Paredes et al., 2017).
Collecting samples of white-winged doves (Zenaida asiatica) Twenty-four white-winged doves were divided into two groups, with group 1 (G1) consisting of 12 birds from the backyards of the Santo Domingo Kesté locality (fed with fruit and vegetable residue) and group 2 (G2) of 12 birds donated by farmers (caught within farming areas for self-consumption). In order to obtain tissue from birds, the recommendations issued by Official Mexican Standard 033-SAG/ZOO-2014 were taken into consideration, following the bird disinfection protocol. Afterwards, each bird was dissected, with a longitudinal incision in order to extract the liver, heart, muscle, and brain, which were placed into 1.5-ml eppendorf tubes, duly labeled with the name of tissue, bird number, and location.
Preparation and determination of acetylcholinesterase (AChE) activity In order to analyze the activity of biomarker AChE in the tissues of Zenaida asiatica, the methodology proposed by Ellman et al. (1961) was employed, whereas to determine the quantity of proteins, the Bradford (1976) method was used.
Preparation and determination of glutathione S-transferase (GST) The activity of biomarker GST in dove tissue was evaluated through the methodology proposed by Habig and Jakoby (1974). Protein quantity was determined through the Bradford (1976) method.
Preparation and determination of catalase (CAT) activity The analysis of biomarker CAT in the tissues of the Z. asiatica dove was measured through the methodology proposed by Aebi (1984), as modified by Regoli (1998). All readings were carried out using a Thermo Scientific® microplate spectrophotometer.
Data analysis The response of biomarkers AChE, GST, and CAT on tissue (heart, liver, brain, and muscle) were compared through a t test, in order to determine significant differences between both groups (G1 and G2). Tukey’s test was used as a multiple comparison test; in both cases, the confidence level was p0.05. Data was analyzed using Statistica v. 7 software.
RESULTS AND DISCUSSIONBiomarker response Acetylcholinesterase (AChE) Activity: The greater AChE activity was found in brain tissue (F17.71, P0.00001), with 105.3234.55 nmol/min/mg protein, followed by heart, liver,
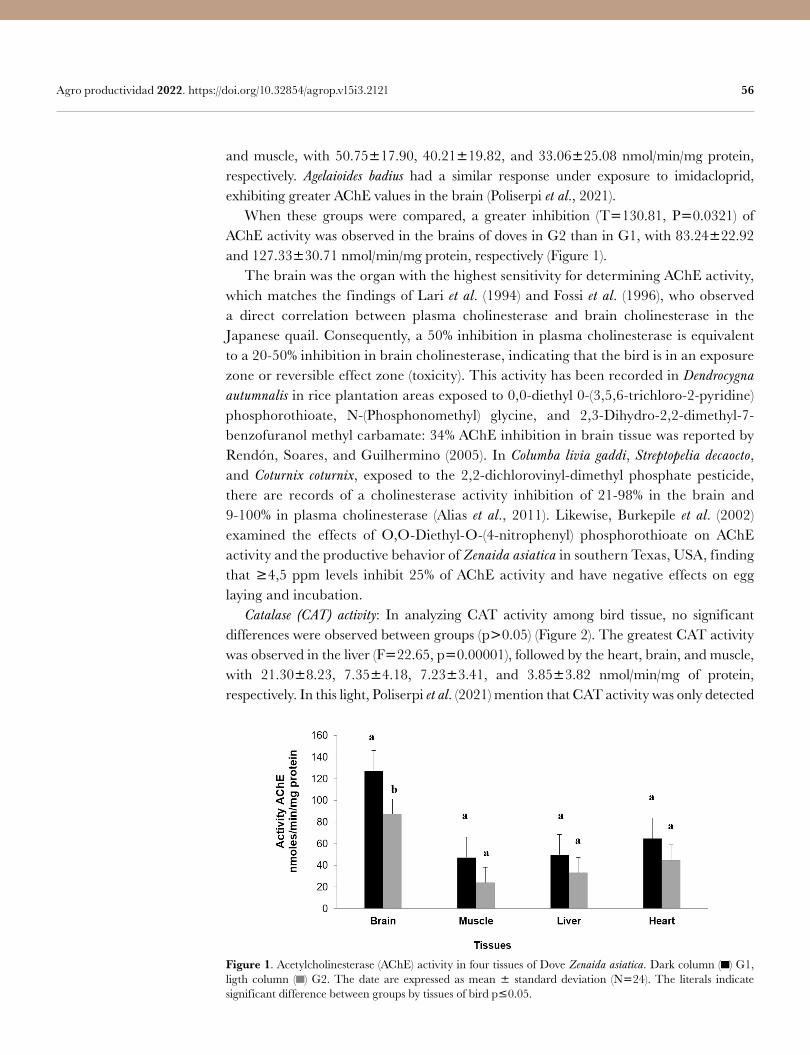
56 Agro productividad 2022. https://doi.org/10.32854/agrop.v15i3.2121
and muscle, with 50.7517.90, 40.2119.82, and 33.0625.08 nmol/min/mg protein, respectively. Agelaioides badius had a similar response under exposure to imidacloprid, exhibiting greater AChE values in the brain (Poliserpi et al., 2021). When these groups were compared, a greater inhibition (T130.81, P0.0321) of AChE activity was observed in the brains of doves in G2 than in G1, with 83.2422.92 and 127.3330.71 nmol/min/mg protein, respectively (Figure 1). The brain was the organ with the highest sensitivity for determining AChE activity, which matches the findings of Lari et al. (1994) and Fossi et al. (1996), who observed a direct correlation between plasma cholinesterase and brain cholinesterase in the Japanese quail. Consequently, a 50% inhibition in plasma cholinesterase is equivalent to a 20-50% inhibition in brain cholinesterase, indicating that the bird is in an exposure zone or reversible effect zone (toxicity). This activity has been recorded in Dendrocygna autumnalis in rice plantation areas exposed to 0,0-diethyl 0-(3,5,6-trichloro-2-pyridine) phosphorothioate, N-(Phosphonomethyl) glycine, and 2,3-Dihydro-2,2-dimethyl-7-benzofuranol methyl carbamate: 34% AChE inhibition in brain tissue was reported by Rendón, Soares, and Guilhermino (2005). In Columba livia gaddi, Streptopelia decaocto, and Coturnix coturnix, exposed to the 2,2-dichlorovinyl-dimethyl phosphate pesticide, there are records of a cholinesterase activity inhibition of 21-98% in the brain and 9-100% in plasma cholinesterase (Alias et al., 2011). Likewise, Burkepile et al. (2002) examined the effects of O,O-Diethyl-O-(4-nitrophenyl) phosphorothioate on AChE activity and the productive behavior of Zenaida asiatica in southern Texas, USA, finding that 4,5 ppm levels inhibit 25% of AChE activity and have negative effects on egg laying and incubation. Catalase (CAT) activity: In analyzing CAT activity among bird tissue, no significant differences were observed between groups (p0.05) (Figure 2). The greatest CAT activity was observed in the liver (F22.65, p0.00001), followed by the heart, brain, and muscle, with 21.308.23, 7.354.18, 7.233.41, and 3.853.82 nmol/min/mg of protein, respectively. In this light, Poliserpi et al. (2021) mention that CAT activity was only detected
Figure 1. Acetylcholinesterase (AChE) activity in four tissues of Dove Zenaida asiatica. Dark column ( ) G1, ligth column ( ) G2. The date are expressed as mean standard deviation (N24). The literals indicate significant difference between groups by tissues of bird p0.05.
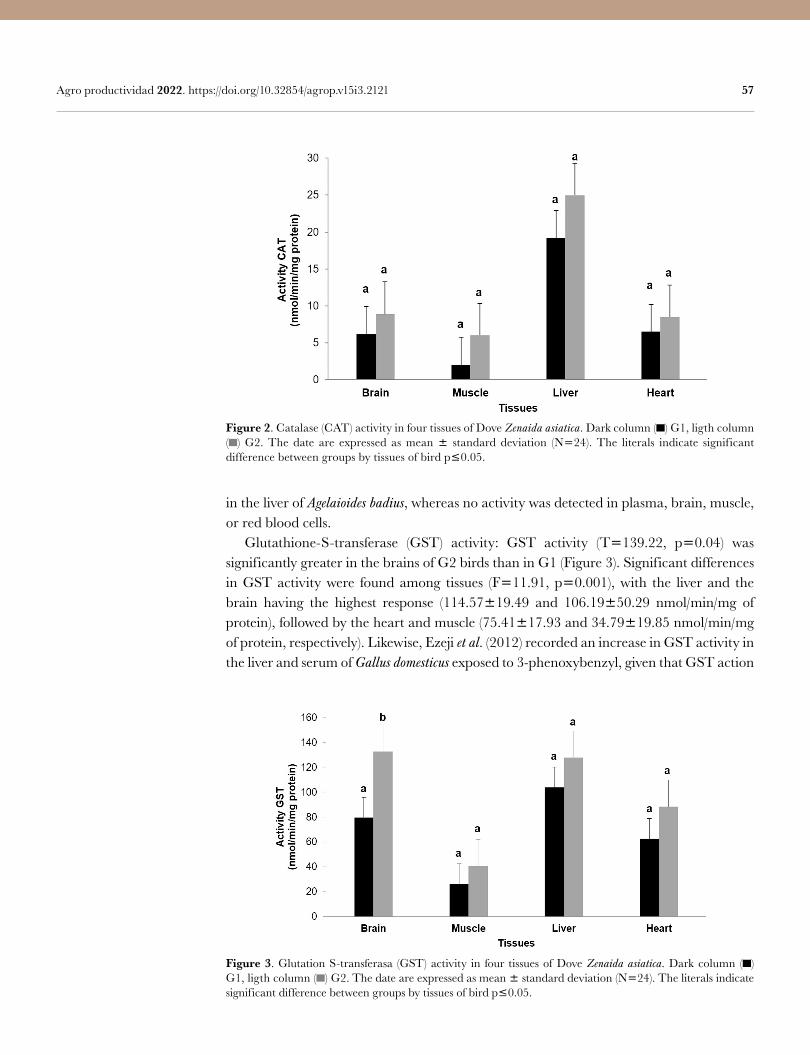
57 Agro productividad 2022. https://doi.org/10.32854/agrop.v15i3.2121
Figure 2. Catalase (CAT) activity in four tissues of Dove Zenaida asiatica. Dark column ( ) G1, ligth column ( ) G2. The date are expressed as mean standard deviation (N24). The literals indicate significant difference between groups by tissues of bird p0.05.
in the liver of Agelaioides badius, whereas no activity was detected in plasma, brain, muscle, or red blood cells. Glutathione-S-transferase (GST) activity: GST activity (T139.22, p0.04) was significantly greater in the brains of G2 birds than in G1 (Figure 3). Significant differences in GST activity were found among tissues (F11.91, p0.001), with the liver and the brain having the highest response (114.5719.49 and 106.1950.29 nmol/min/mg of protein), followed by the heart and muscle (75.4117.93 and 34.7919.85 nmol/min/mg of protein, respectively). Likewise, Ezeji et al. (2012) recorded an increase in GST activity in the liver and serum of Gallus domesticus exposed to 3-phenoxybenzyl, given that GST action
Figure 3. Glutation S-transferasa (GST) activity in four tissues of Dove Zenaida asiatica. Dark column ( ) G1, ligth column ( ) G2. The date are expressed as mean standard deviation (N24). The literals indicate significant difference between groups by tissues of bird p0.05.
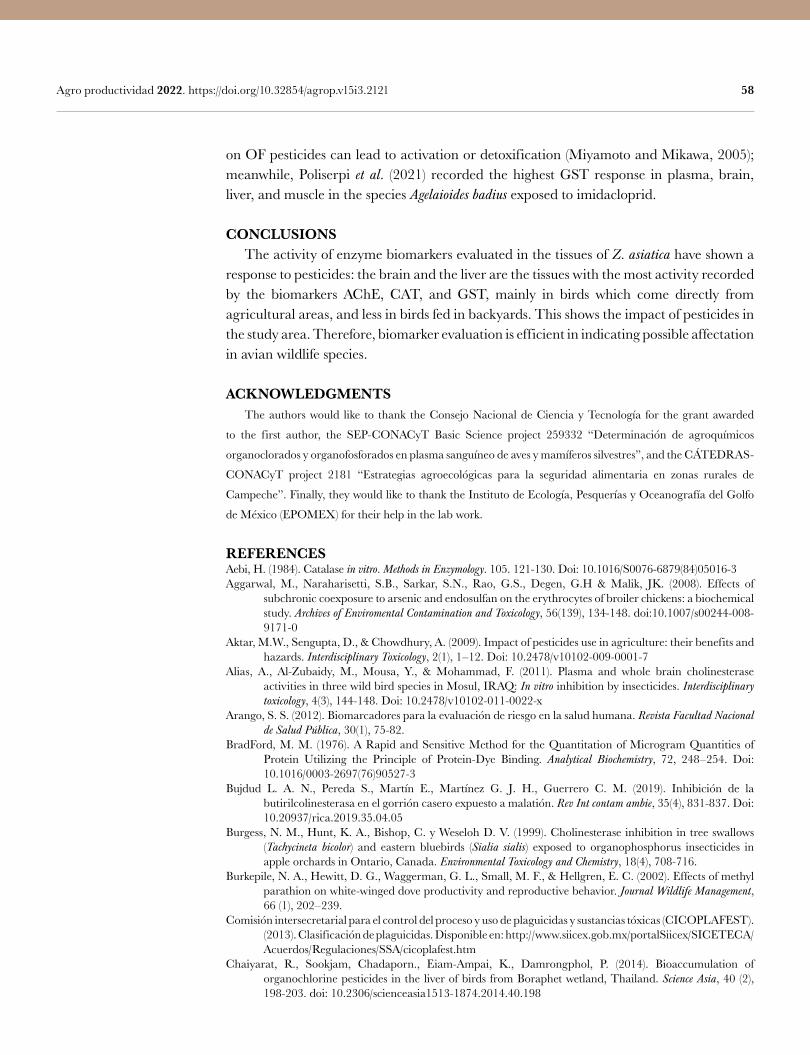
58 Agro productividad 2022. https://doi.org/10.32854/agrop.v15i3.2121
on OF pesticides can lead to activation or detoxification (Miyamoto and Mikawa, 2005); meanwhile, Poliserpi et al. (2021) recorded the highest GST response in plasma, brain, liver, and muscle in the species Agelaioides badius exposed to imidacloprid.
CONCLUSIONS The activity of enzyme biomarkers evaluated in the tissues of Z. asiatica have shown a response to pesticides: the brain and the liver are the tissues with the most activity recorded by the biomarkers AChE, CAT, and GST, mainly in birds which come directly from agricultural areas, and less in birds fed in backyards. This shows the impact of pesticides in the study area. Therefore, biomarker evaluation is efficient in indicating possible affectation in avian wildlife species.
ACKNOWLEDGMENTS The authors would like to thank the Consejo Nacional de Ciencia y Tecnología for the grant awarded
to the first author, the SEP-CONACyT Basic Science project 259332 “Determinación de agroquímicos
organoclorados y organofosforados en plasma sanguíneo de aves y mamíferos silvestres”, and the CÁTEDRAS-
CONACyT project 2181 “Estrategias agroecológicas para la seguridad alimentaria en zonas rurales de
Campeche”. Finally, they would like to thank the Instituto de Ecología, Pesquerías y Oceanografía del Golfo
de México (EPOMEX) for their help in the lab work.
REFERENCESAebi, H. (1984). Catalase in vitro. Methods in Enzymology. 105. 121-130. Doi: 10.1016/S0076-6879(84)05016-3Aggarwal, M., Naraharisetti, S.B., Sarkar, S.N., Rao, G.S., Degen, G.H & Malik, JK. (2008). Effects of
subchronic coexposure to arsenic and endosulfan on the erythrocytes of broiler chickens: a biochemical study. Archives of Enviromental Contamination and Toxicology, 56(139), 134-148. doi:10.1007/s00244-008-9171-0
Aktar, M.W., Sengupta, D., & Chowdhury, A. (2009). Impact of pesticides use in agriculture: their benefits and hazards. Interdisciplinary Toxicology, 2(1), 1–12. Doi: 10.2478/v10102-009-0001-7
Alias, A., Al-Zubaidy, M., Mousa, Y., & Mohammad, F. (2011). Plasma and whole brain cholinesterase activities in three wild bird species in Mosul, IRAQ: In vitro inhibition by insecticides. Interdisciplinary toxicology, 4(3), 144-148. Doi: 10.2478/v10102-011-0022-x
Arango, S. S. (2012). Biomarcadores para la evaluación de riesgo en la salud humana. Revista Facultad Nacional de Salud Pública, 30(1), 75-82.
BradFord, M. M. (1976). A Rapid and Sensitive Method for the Quantitation of Microgram Quantities of Protein Utilizing the Principle of Protein-Dye Binding. Analytical Biochemistry, 72, 248–254. Doi: 10.1016/0003-2697(76)90527-3
Bujdud L. A. N., Pereda S., Martín E., Martínez G. J. H., Guerrero C. M. (2019). Inhibición de la butirilcolinesterasa en el gorrión casero expuesto a malatión. Rev Int contam ambie, 35(4), 831-837. Doi: 10.20937/rica.2019.35.04.05
Burgess, N. M., Hunt, K. A., Bishop, C. y Weseloh D. V. (1999). Cholinesterase inhibition in tree swallows (Tachycineta bicolor) and eastern bluebirds (Sialia sialis) exposed to organophosphorus insecticides in apple orchards in Ontario, Canada. Environmental Toxicology and Chemistry, 18(4), 708-716.
Burkepile, N. A., Hewitt, D. G., Waggerman, G. L., Small, M. F., & Hellgren, E. C. (2002). Effects of methyl parathion on white-winged dove productivity and reproductive behavior. Journal Wildlife Management, 66 (1), 202–239.
Comisión intersecretarial para el control del proceso y uso de plaguicidas y sustancias tóxicas (CICOPLAFEST). (2013). Clasificación de plaguicidas. Disponible en: http://www.siicex.gob.mx/portalSiicex/SICETECA/Acuerdos/Regulaciones/SSA/cicoplafest.htm
Chaiyarat, R., Sookjam, Chadaporn., Eiam-Ampai, K., Damrongphol, P. (2014). Bioaccumulation of organochlorine pesticides in the liver of birds from Boraphet wetland, Thailand. Science Asia, 40 (2), 198-203. doi: 10.2306/scienceasia1513-1874.2014.40.198
59 Agro productividad 2022. https://doi.org/10.32854/agrop.v15i3.2121
Ellman, G.L., Courtney, D., Andres V. Jr. & Featherstone, R.M. (1961). A new rapid colorimetric determination of acetylcholinesterase activity. Biochemistry and Pharmacology, 7 (2), 88-95. Doi: 10.1016/0006-2952(61)90145-9
Ezeji, E. U., Anyalogbu, E. A., Ezejiofor, T. N., & Udensi., J. U. (2012). Determination of reduced glutathione and glutathione S transferasa of poultry birds exposed to permethrin insecticide. American Journal of Biochemistry, 2(3), 21-24. Doi: 10.5923/j.ajb.20120203.01
Fossi, M. C., Lari, L., & Casini, Y.S. (1996). Interspecies variation of “B” esterase in birds: the influence of size and feeding habits. Arch Environ Contam Toxicol, 31, 525–532.
Ghorab, M.A., & Khalil, M.S. (2015) Toxicological Effects of Organophosphates Pesticides. International Journal of Environmental Monitoring and Analysis, 3(4), 218-220. doi: 10.11648/j.ijema.20150304.13.
Habig W. H., Pabst M. J. & Jakoby W. B. (1974). Glutathione S-Transferases: the first enzymatic step in mercapturic acid formation. The Journal of Biological Chemistry, 249(22), 7130-7139.
Lari, L., Massi, A., Fossi, M. C., Casini, Y. S., Leonzio, C., & Focardi, S. (1994). Evaluation of toxic effects of the organophosphorus insecticide Azinphos-Methyl in experimentally and naturally exposed birds. Arch Environ Contam Toxicol, 26, 234–239.
Miyamoto, T., & Mikawa, T. (2005) Oxidative glutathione conjugation and its novel role in activation of the organophosphorus insecticide prothiofos. Journal Pesticide Science, 30 (1), 31–38. Doi: 10.1584/jpestics.30.31
Instituto Nacional de Geografía e Informática, México. (2014). El sector alimentario en México. Serie estadísticas sectoriales. Disponible en: http://internet.contenidos.inegi.org.mx/contenidos/productos/prod_serv/contenidos/espanol/bvinegi/productos/nueva_estruc/SAM/702825066574.pdf
Oropesa, A. L., Gravato, C., Sánchez, S., & Soler, F. (2013). Characterization of plasma cholinesterase from the white stork (Ciconia ciconia) and its in vitro inhibition by anticholinesterase pesticides. Ecotoxicology and environmental safety, 97 (1). 131-138. Doi: 10.1016/j.ecoenv.2013.07.022
Padoa-Shioppa, E., Baietto, M., Massa, R., & Bottoni, L. (2005). Bird communities as biondicators: The focal species concept in agricultural landscapes. Ecological Indicators, 6 (1). 83-93. Doi: 10.1016/j.ecolind.2005.08.006
Poliserpi, M. B., Cristos, D., Pérez-Iglesias, J. M., & Brodeur, J. C. (2021). Tissue distribution and sublethal effects of imidacloprid in the South American grayish baywing (Agelaioides badius). Chemosphere, 284, 131327. Doi: 10.1016/j.chemosphere.2021.131327
Regoli, F. (1998). Trace metals and antioxidant enzymes en gill and digestive gland of the Mediterranean mussel Mytilus galloprovincialis. Archives of Environmental Contamination and Toxicology, 34(1), 48-63.
Rendón, J., Soares, A. M., & Guilhermino, L. (2005), Black-bellied whistling duck (Dendrocygna autumnalis) brain cholinesterase characterization and diagnosis of anticholinesterase pesticide exposure in wild populations from Mexico. Environmental Toxicology and Chemistry, 24 (2), 313–317. doi:10.1897/03-646.1
Robles, J.A., Hernández-Vicente, T.J., & Luque, G. (2007). Tratamiento de la intoxicación por organofosforados en aves rapaces. Revista Complutense de Ciencias Veterinarias, 1(2), 424-437.
Servicio de Información Agroalimentaria y Pesquera. Infosiap.siap.gob.mx. (2017). Cierre de la producción agrícola por estado. Disponible en: http://infosiap.siap.gob.mx/aagricola_siap_gb/icultivo/index.jsp
Secretaría de Agricultura, Ganadería y Desarrollo Rural. Norma Oficial Mexicana NOM-051-ZOO-1995, trato humanitario en la movilización de animales. Disponible en: http://www.fmvz.unam.mx/fmvz/p_estudios/apuntes_bioet/051zoo_movilizacion.pdf
Secretaría de Agricultura, Ganadería y Desarrollo Rural. Norma Oficial Mexicana 033-SAG/ZOO-2014, Sacrificio humanitario de los animales domésticos y silvestres. Disponible en: http://www.dof.gob.mx/nota_detalle.php?codigo= 5405210&fecha=26/08/2020
Swaileh, K. M., & Sansur, R. (2006). Monitoring urban heavy metal pollution using the House Sparrow (Passer domesticus). Journal of Environmental Monitoring; 8, 209-213. doi.10.1039/B510635D

Colegio dePostgraduados
61
Bibliographic analysis of sustainability studies in coffee agroecosystem from 2010 to 2019Pérez-Sánchez, Olivia1; Pérez-Vázquez, Arturo1*; Lango-Reynoso, Verónica1; Gallardo-López, Felipe1; Escamilla-Prado, Esteban2
1 Colegio de Postgraduados Campus Veracruz. Carretera Xalapa-Veracruz km 88.5, Tepetates, municipio de Manlio Fabio Altamirano, Veracruz, C. P. 91690, MÉXICO.
2 Centro Regional Universitario Oriente, Universidad Autónoma de Chapingo.* Correspondence: [email protected]
ABSTRACT Phytosanitary problems and low prices have put coffee production in a critical situation, affecting the economy of producers and the area cultivated with coffee in the state of Veracruz. The objective of this work was to carry out a systematic review of the main researches carried out on sustainability in the coffee agroecosystem and reported in the scientific literature of the last ten years. The methodology applied was documentary in nature and it was based on the bibliographic review in the search engines Google Scholar, Scopus, and Elsevier Science Direct Freedom. The English and Spanish “evaluation”, “sustainability”, and “coffee” concepts were input into the search engines, combined with Boolean operators. In the last ten years, sustainability studies about coffee agroecosystems were published in South America (Colombia, Peru, Ecuador, and Brazil) and Africa (Uganda) analyzing economic, social, and environmental dimensions. With regard to the evaluation methods, 35.71% used sustainability indexes, performing comparisons between agroecosystems, and endeavored to monitor trends. The Framework for the Evaluation of Natural Resource Management Systems Incorporating Sustainability Indicators (MESMIS) supported 28.57% of the methods. The rest of the studies (7.14%) proposed methodologies that have been validated and adapted to the object-context and the objective. In addition, it was identified that the analysis of the sustainability of the coffee agroecosystem is not close related to the type of coffee system (conventional, organic or agroecological), since the interactions that occur within each system are diverse and complex; social or cultural perceptions are factors that reduce or promote the search for sustainability. It is concluded that few studies (14) about sustainability of coffee agroecosystems have been published during 2010-2019 period.
Keywords: Evaluation, sustainability, coffee plantation, literature review, analysis.
INTRODUCTION Coffee (Coffea arabica L.) is one of the most important crops worldwide. It is particularly important in Latin America, as a consequence of its contribution to foreign exchange, based on the sale of grain in the international market (Canet et al., 2016). A shade-grown coffee plantation is a sustainable agroecosystem at several levels: a the environment level, it is considered environmentally friendly, for its contribution to biodiversity conservation (Greenberg et al., 1997; Cruz-Lara et al., 2004; Rivera and Armbrecht, 2005; Macip-Ríos and Casas-Andreu, 2008); at social level, for its contribution to the rural livelihoods of
Citation: Pérez-Sánchez, O., Pérez-Vázquez, A., Lango-Reynoso, V., Gallardo-López, F., & Escamilla-Prado, E. (2022). Bibliographic analysis of sustainability studies in coffee agroecosystem from 2010 to 2019. Agro Productividad. https://doi.org/10.32854/agrop.v15i3.2129
Editor in Chief: Dr. Jorge Cadena Iñiguez
Received: September 20, 2021.Accepted: February 18, 2022.Published on-line: April 5, 2022.
Agro Productividad, 15(3). March. 2022. pp: 61-73.
This work is licensed under a Creative Commons Attribution-Non-Commercial 4.0 International license.
61 Image by butterflystroke at Pixabay
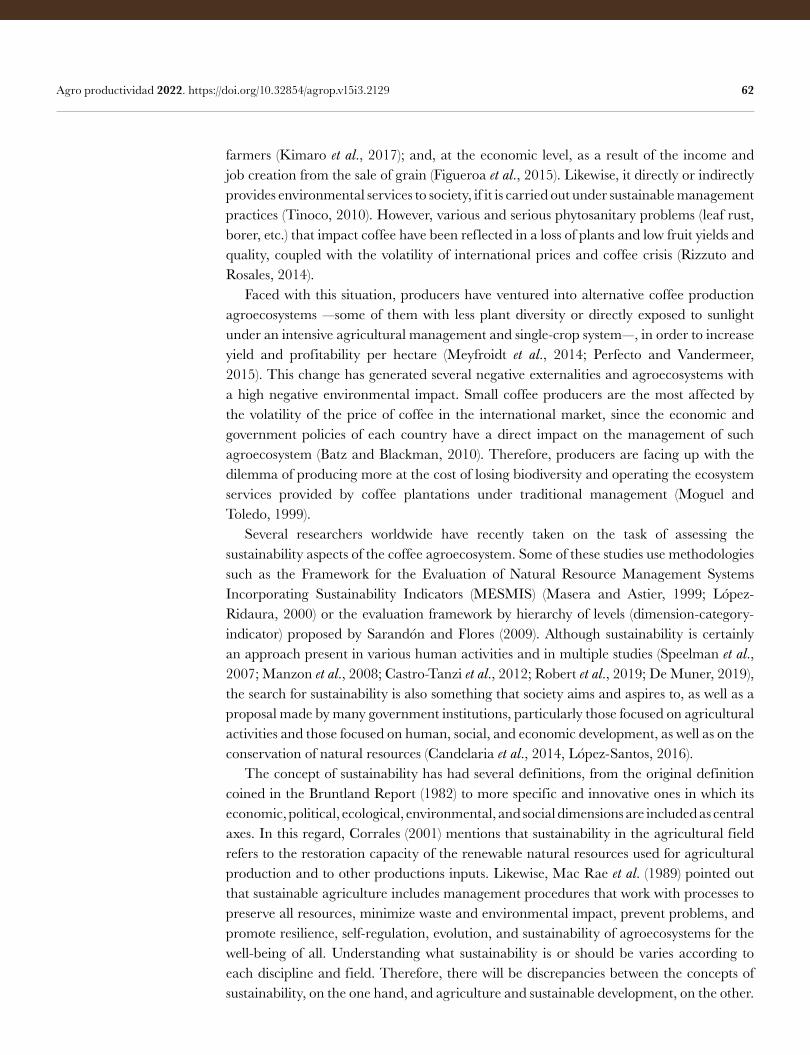
62 Agro productividad 2022. https://doi.org/10.32854/agrop.v15i3.2129
farmers (Kimaro et al., 2017); and, at the economic level, as a result of the income and job creation from the sale of grain (Figueroa et al., 2015). Likewise, it directly or indirectly provides environmental services to society, if it is carried out under sustainable management practices (Tinoco, 2010). However, various and serious phytosanitary problems (leaf rust, borer, etc.) that impact coffee have been reflected in a loss of plants and low fruit yields and quality, coupled with the volatility of international prices and coffee crisis (Rizzuto and Rosales, 2014). Faced with this situation, producers have ventured into alternative coffee production agroecosystems —some of them with less plant diversity or directly exposed to sunlight under an intensive agricultural management and single-crop system—, in order to increase yield and profitability per hectare (Meyfroidt et al., 2014; Perfecto and Vandermeer, 2015). This change has generated several negative externalities and agroecosystems with a high negative environmental impact. Small coffee producers are the most affected by the volatility of the price of coffee in the international market, since the economic and government policies of each country have a direct impact on the management of such agroecosystem (Batz and Blackman, 2010). Therefore, producers are facing up with the dilemma of producing more at the cost of losing biodiversity and operating the ecosystem services provided by coffee plantations under traditional management (Moguel and Toledo, 1999). Several researchers worldwide have recently taken on the task of assessing the sustainability aspects of the coffee agroecosystem. Some of these studies use methodologies such as the Framework for the Evaluation of Natural Resource Management Systems Incorporating Sustainability Indicators (MESMIS) (Masera and Astier, 1999; López-Ridaura, 2000) or the evaluation framework by hierarchy of levels (dimension-category-indicator) proposed by Sarandón and Flores (2009). Although sustainability is certainly an approach present in various human activities and in multiple studies (Speelman et al., 2007; Manzon et al., 2008; Castro-Tanzi et al., 2012; Robert et al., 2019; De Muner, 2019), the search for sustainability is also something that society aims and aspires to, as well as a proposal made by many government institutions, particularly those focused on agricultural activities and those focused on human, social, and economic development, as well as on the conservation of natural resources (Candelaria et al., 2014, López-Santos, 2016). The concept of sustainability has had several definitions, from the original definition coined in the Bruntland Report (1982) to more specific and innovative ones in which its economic, political, ecological, environmental, and social dimensions are included as central axes. In this regard, Corrales (2001) mentions that sustainability in the agricultural field refers to the restoration capacity of the renewable natural resources used for agricultural production and to other productions inputs. Likewise, Mac Rae et al. (1989) pointed out that sustainable agriculture includes management procedures that work with processes to preserve all resources, minimize waste and environmental impact, prevent problems, and promote resilience, self-regulation, evolution, and sustainability of agroecosystems for the well-being of all. Understanding what sustainability is or should be varies according to each discipline and field. Therefore, there will be discrepancies between the concepts of sustainability, on the one hand, and agriculture and sustainable development, on the other.
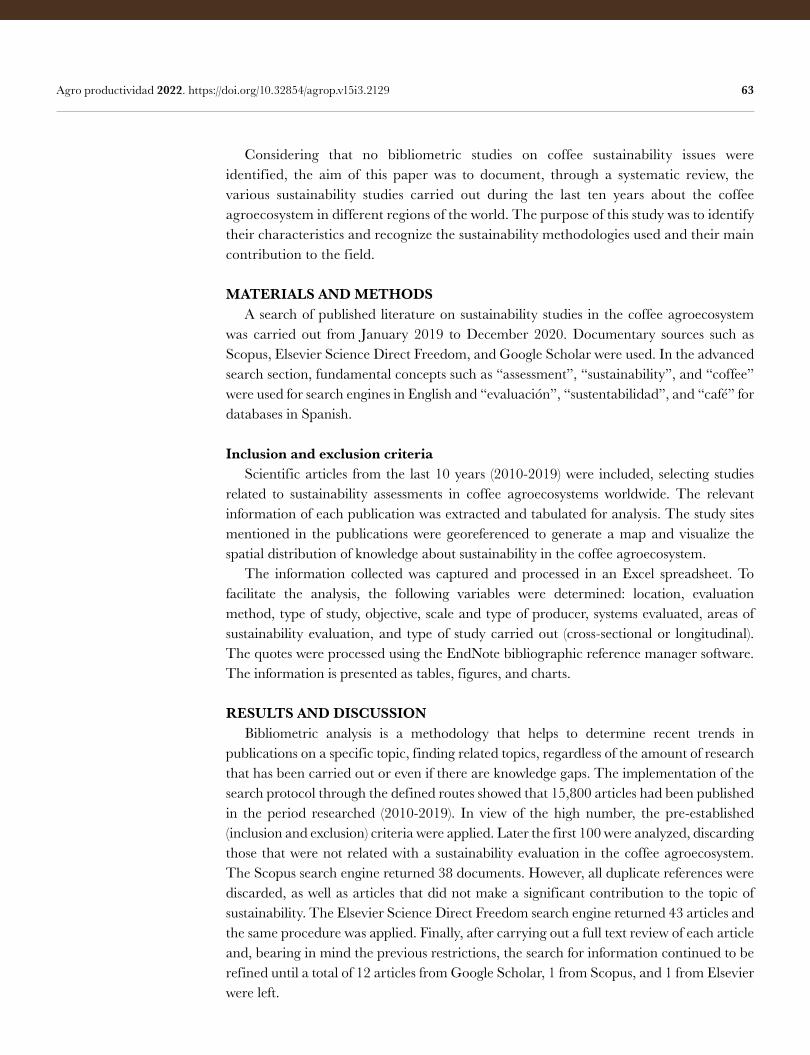
63 Agro productividad 2022. https://doi.org/10.32854/agrop.v15i3.2129
Considering that no bibliometric studies on coffee sustainability issues were identified, the aim of this paper was to document, through a systematic review, the various sustainability studies carried out during the last ten years about the coffee agroecosystem in different regions of the world. The purpose of this study was to identify their characteristics and recognize the sustainability methodologies used and their main contribution to the field.
MATERIALS AND METHODS A search of published literature on sustainability studies in the coffee agroecosystem was carried out from January 2019 to December 2020. Documentary sources such as Scopus, Elsevier Science Direct Freedom, and Google Scholar were used. In the advanced search section, fundamental concepts such as “assessment”, “sustainability”, and “coffee” were used for search engines in English and “evaluación”, “sustentabilidad”, and “café” for databases in Spanish.
Inclusion and exclusion criteria Scientific articles from the last 10 years (2010-2019) were included, selecting studies related to sustainability assessments in coffee agroecosystems worldwide. The relevant information of each publication was extracted and tabulated for analysis. The study sites mentioned in the publications were georeferenced to generate a map and visualize the spatial distribution of knowledge about sustainability in the coffee agroecosystem. The information collected was captured and processed in an Excel spreadsheet. To facilitate the analysis, the following variables were determined: location, evaluation method, type of study, objective, scale and type of producer, systems evaluated, areas of sustainability evaluation, and type of study carried out (cross-sectional or longitudinal). The quotes were processed using the EndNote bibliographic reference manager software. The information is presented as tables, figures, and charts.
RESULTS AND DISCUSSION Bibliometric analysis is a methodology that helps to determine recent trends in publications on a specific topic, finding related topics, regardless of the amount of research that has been carried out or even if there are knowledge gaps. The implementation of the search protocol through the defined routes showed that 15,800 articles had been published in the period researched (2010-2019). In view of the high number, the pre-established (inclusion and exclusion) criteria were applied. Later the first 100 were analyzed, discarding those that were not related with a sustainability evaluation in the coffee agroecosystem. The Scopus search engine returned 38 documents. However, all duplicate references were discarded, as well as articles that did not make a significant contribution to the topic of sustainability. The Elsevier Science Direct Freedom search engine returned 43 articles and the same procedure was applied. Finally, after carrying out a full text review of each article and, bearing in mind the previous restrictions, the search for information continued to be refined until a total of 12 articles from Google Scholar, 1 from Scopus, and 1 from Elsevier were left.
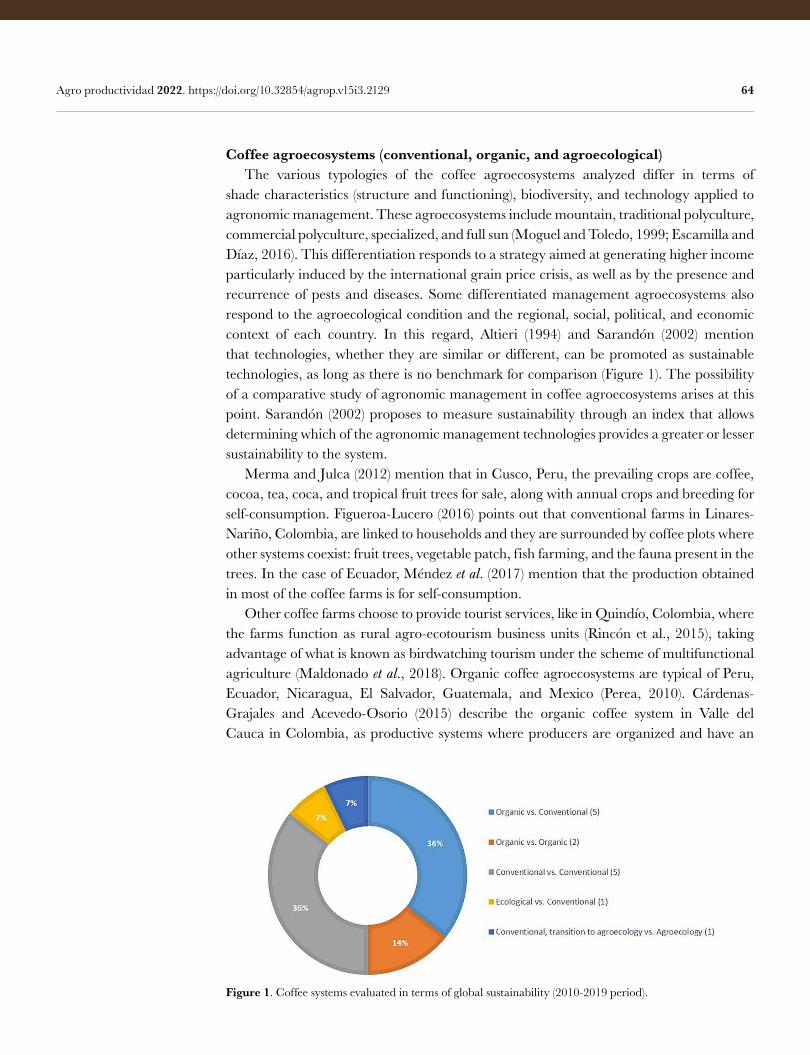
64 Agro productividad 2022. https://doi.org/10.32854/agrop.v15i3.2129
Coffee agroecosystems (conventional, organic, and agroecological) The various typologies of the coffee agroecosystems analyzed differ in terms of shade characteristics (structure and functioning), biodiversity, and technology applied to agronomic management. These agroecosystems include mountain, traditional polyculture, commercial polyculture, specialized, and full sun (Moguel and Toledo, 1999; Escamilla and Díaz, 2016). This differentiation responds to a strategy aimed at generating higher income particularly induced by the international grain price crisis, as well as by the presence and recurrence of pests and diseases. Some differentiated management agroecosystems also respond to the agroecological condition and the regional, social, political, and economic context of each country. In this regard, Altieri (1994) and Sarandón (2002) mention that technologies, whether they are similar or different, can be promoted as sustainable technologies, as long as there is no benchmark for comparison (Figure 1). The possibility of a comparative study of agronomic management in coffee agroecosystems arises at this point. Sarandón (2002) proposes to measure sustainability through an index that allows determining which of the agronomic management technologies provides a greater or lesser sustainability to the system. Merma and Julca (2012) mention that in Cusco, Peru, the prevailing crops are coffee, cocoa, tea, coca, and tropical fruit trees for sale, along with annual crops and breeding for self-consumption. Figueroa-Lucero (2016) points out that conventional farms in Linares-Nariño, Colombia, are linked to households and they are surrounded by coffee plots where other systems coexist: fruit trees, vegetable patch, fish farming, and the fauna present in the trees. In the case of Ecuador, Méndez et al. (2017) mention that the production obtained in most of the coffee farms is for self-consumption. Other coffee farms choose to provide tourist services, like in Quindío, Colombia, where the farms function as rural agro-ecotourism business units (Rincón et al., 2015), taking advantage of what is known as birdwatching tourism under the scheme of multifunctional agriculture (Maldonado et al., 2018). Organic coffee agroecosystems are typical of Peru, Ecuador, Nicaragua, El Salvador, Guatemala, and Mexico (Perea, 2010). Cárdenas-Grajales and Acevedo-Osorio (2015) describe the organic coffee system in Valle del Cauca in Colombia, as productive systems where producers are organized and have an
Figure 1. Coffee systems evaluated in terms of global sustainability (2010-2019 period).
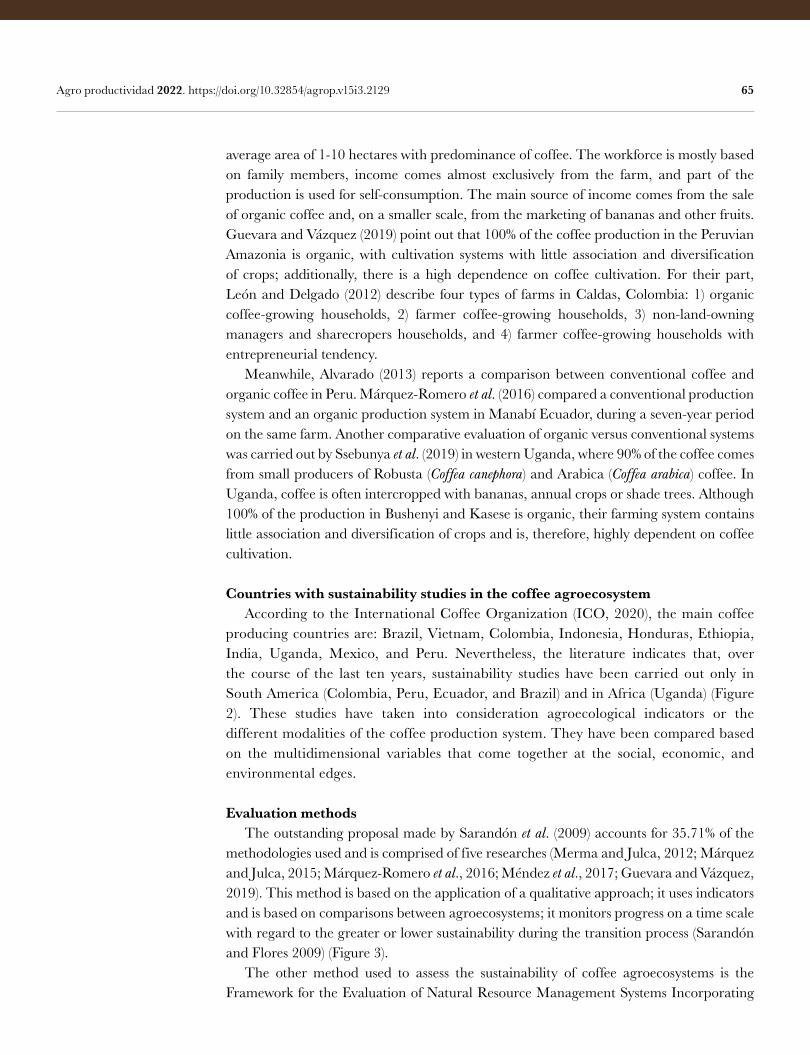
65 Agro productividad 2022. https://doi.org/10.32854/agrop.v15i3.2129
average area of 1-10 hectares with predominance of coffee. The workforce is mostly based on family members, income comes almost exclusively from the farm, and part of the production is used for self-consumption. The main source of income comes from the sale of organic coffee and, on a smaller scale, from the marketing of bananas and other fruits. Guevara and Vázquez (2019) point out that 100% of the coffee production in the Peruvian Amazonia is organic, with cultivation systems with little association and diversification of crops; additionally, there is a high dependence on coffee cultivation. For their part, León and Delgado (2012) describe four types of farms in Caldas, Colombia: 1) organic coffee-growing households, 2) farmer coffee-growing households, 3) non-land-owning managers and sharecropers households, and 4) farmer coffee-growing households with entrepreneurial tendency. Meanwhile, Alvarado (2013) reports a comparison between conventional coffee and organic coffee in Peru. Márquez-Romero et al. (2016) compared a conventional production system and an organic production system in Manabí Ecuador, during a seven-year period on the same farm. Another comparative evaluation of organic versus conventional systems was carried out by Ssebunya et al. (2019) in western Uganda, where 90% of the coffee comes from small producers of Robusta (Coffea canephora) and Arabica (Coffea arabica) coffee. In Uganda, coffee is often intercropped with bananas, annual crops or shade trees. Although 100% of the production in Bushenyi and Kasese is organic, their farming system contains little association and diversification of crops and is, therefore, highly dependent on coffee cultivation.
Countries with sustainability studies in the coffee agroecosystem According to the International Coffee Organization (ICO, 2020), the main coffee producing countries are: Brazil, Vietnam, Colombia, Indonesia, Honduras, Ethiopia, India, Uganda, Mexico, and Peru. Nevertheless, the literature indicates that, over the course of the last ten years, sustainability studies have been carried out only in South America (Colombia, Peru, Ecuador, and Brazil) and in Africa (Uganda) (Figure 2). These studies have taken into consideration agroecological indicators or the different modalities of the coffee production system. They have been compared based on the multidimensional variables that come together at the social, economic, and environmental edges.
Evaluation methods The outstanding proposal made by Sarandón et al. (2009) accounts for 35.71% of the methodologies used and is comprised of five researches (Merma and Julca, 2012; Márquez and Julca, 2015; Márquez-Romero et al., 2016; Méndez et al., 2017; Guevara and Vázquez, 2019). This method is based on the application of a qualitative approach; it uses indicators and is based on comparisons between agroecosystems; it monitors progress on a time scale with regard to the greater or lower sustainability during the transition process (Sarandón and Flores 2009) (Figure 3). The other method used to assess the sustainability of coffee agroecosystems is the Framework for the Evaluation of Natural Resource Management Systems Incorporating
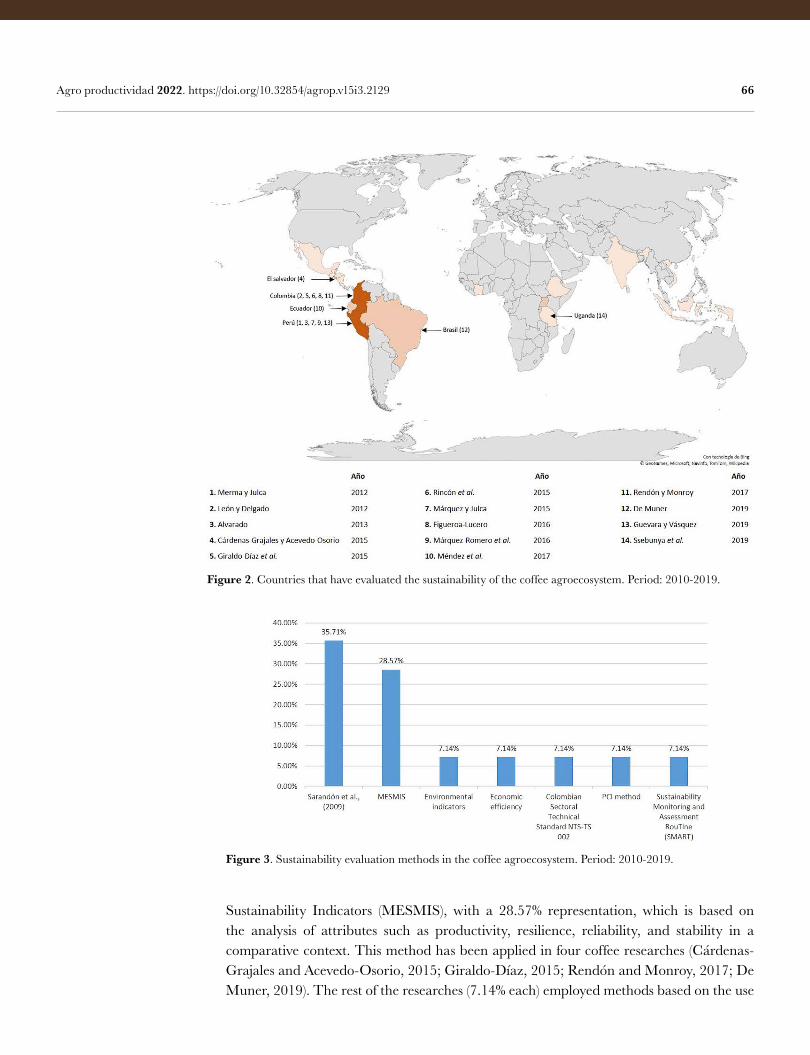
66 Agro productividad 2022. https://doi.org/10.32854/agrop.v15i3.2129
Figure 2. Countries that have evaluated the sustainability of the coffee agroecosystem. Period: 2010-2019.
Figure 3. Sustainability evaluation methods in the coffee agroecosystem. Period: 2010-2019.
Sustainability Indicators (MESMIS), with a 28.57% representation, which is based on the analysis of attributes such as productivity, resilience, reliability, and stability in a comparative context. This method has been applied in four coffee researches (Cárdenas-Grajales and Acevedo-Osorio, 2015; Giraldo-Díaz, 2015; Rendón and Monroy, 2017; De Muner, 2019). The rest of the researches (7.14% each) employed methods based on the use
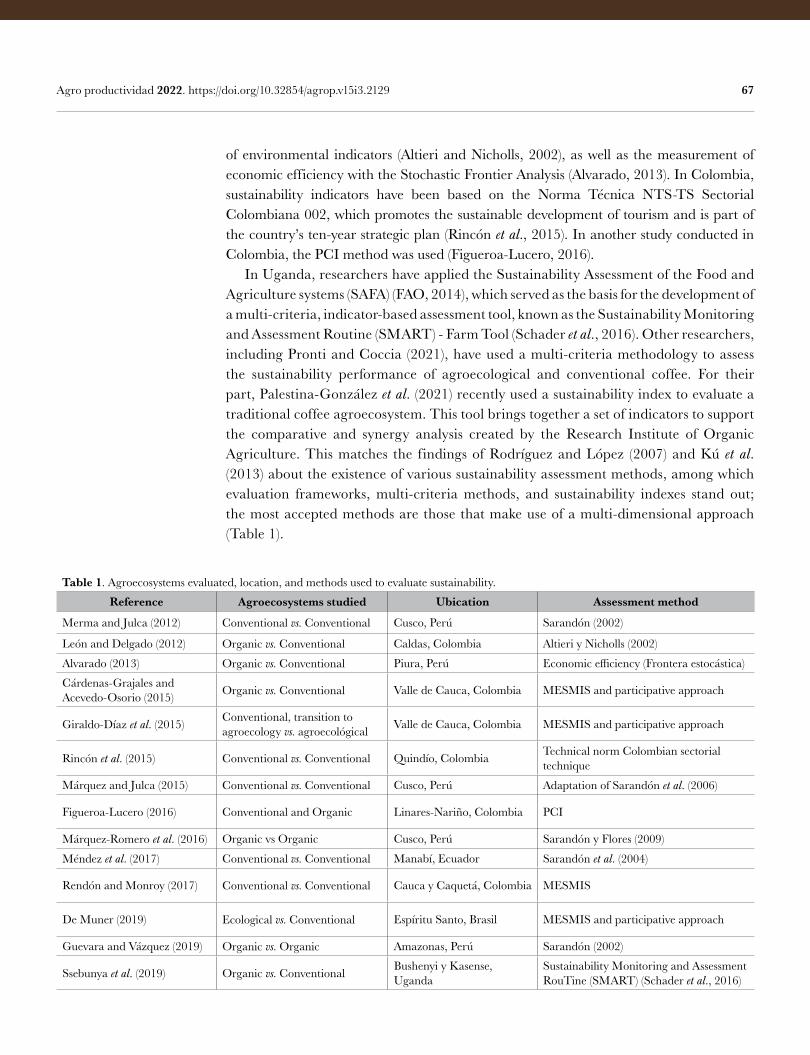
67 Agro productividad 2022. https://doi.org/10.32854/agrop.v15i3.2129
of environmental indicators (Altieri and Nicholls, 2002), as well as the measurement of economic efficiency with the Stochastic Frontier Analysis (Alvarado, 2013). In Colombia, sustainability indicators have been based on the Norma Técnica NTS-TS Sectorial Colombiana 002, which promotes the sustainable development of tourism and is part of the country’s ten-year strategic plan (Rincón et al., 2015). In another study conducted in Colombia, the PCI method was used (Figueroa-Lucero, 2016). In Uganda, researchers have applied the Sustainability Assessment of the Food and Agriculture systems (SAFA) (FAO, 2014), which served as the basis for the development of a multi-criteria, indicator-based assessment tool, known as the Sustainability Monitoring and Assessment Routine (SMART) - Farm Tool (Schader et al., 2016). Other researchers, including Pronti and Coccia (2021), have used a multi-criteria methodology to assess the sustainability performance of agroecological and conventional coffee. For their part, Palestina-González et al. (2021) recently used a sustainability index to evaluate a traditional coffee agroecosystem. This tool brings together a set of indicators to support the comparative and synergy analysis created by the Research Institute of Organic Agriculture. This matches the findings of Rodríguez and López (2007) and Kú et al. (2013) about the existence of various sustainability assessment methods, among which evaluation frameworks, multi-criteria methods, and sustainability indexes stand out; the most accepted methods are those that make use of a multi-dimensional approach (Table 1).
Table 1. Agroecosystems evaluated, location, and methods used to evaluate sustainability.
Reference Agroecosystems studied Ubication Assessment method
Merma and Julca (2012) Conventional vs. Conventional Cusco, Perú Sarandón (2002)
León and Delgado (2012) Organic vs. Conventional Caldas, Colombia Altieri y Nicholls (2002)
Alvarado (2013) Organic vs. Conventional Piura, Perú Economic efficiency (Frontera estocástica)
Cárdenas-Grajales and Acevedo-Osorio (2015) Organic vs. Conventional Valle de Cauca, Colombia MESMIS and participative approach
Giraldo-Díaz et al. (2015) Conventional, transition to agroecology vs. agroecológical Valle de Cauca, Colombia MESMIS and participative approach
Rincón et al. (2015) Conventional vs. Conventional Quindío, Colombia Technical norm Colombian sectorial technique
Márquez and Julca (2015) Conventional vs. Conventional Cusco, Perú Adaptation of Sarandón et al. (2006)
Figueroa-Lucero (2016) Conventional and Organic Linares-Nariño, Colombia PCI
Márquez-Romero et al. (2016) Organic vs Organic Cusco, Perú Sarandón y Flores (2009)
Méndez et al. (2017) Conventional vs. Conventional Manabí, Ecuador Sarandón et al. (2004)
Rendón and Monroy (2017) Conventional vs. Conventional Cauca y Caquetá, Colombia MESMIS
De Muner (2019) Ecological vs. Conventional Espíritu Santo, Brasil MESMIS and participative approach
Guevara and Vázquez (2019) Organic vs. Organic Amazonas, Perú Sarandón (2002)
Ssebunya et al. (2019) Organic vs. Conventional Bushenyi y Kasense, Uganda
Sustainability Monitoring and Assessment RouTine (SMART) (Schader et al., 2016)
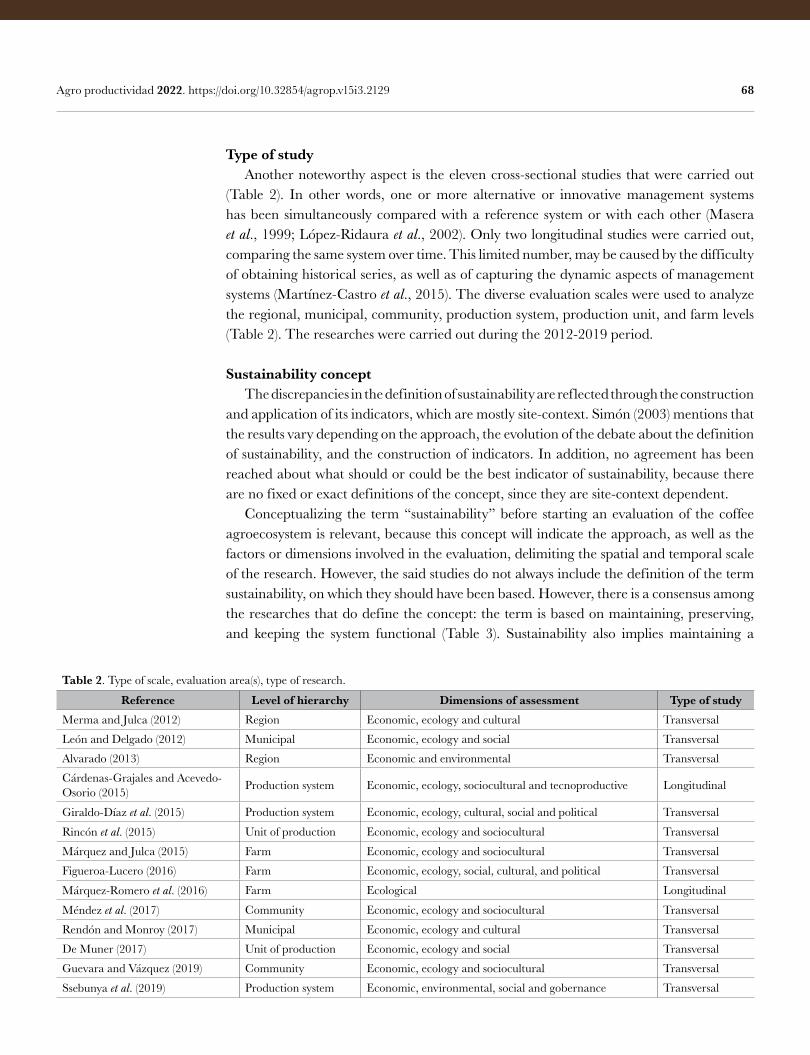
68 Agro productividad 2022. https://doi.org/10.32854/agrop.v15i3.2129
Type of study Another noteworthy aspect is the eleven cross-sectional studies that were carried out (Table 2). In other words, one or more alternative or innovative management systems has been simultaneously compared with a reference system or with each other (Masera et al., 1999; López-Ridaura et al., 2002). Only two longitudinal studies were carried out, comparing the same system over time. This limited number, may be caused by the difficulty of obtaining historical series, as well as of capturing the dynamic aspects of management systems (Martínez-Castro et al., 2015). The diverse evaluation scales were used to analyze the regional, municipal, community, production system, production unit, and farm levels (Table 2). The researches were carried out during the 2012-2019 period.
Sustainability concept The discrepancies in the definition of sustainability are reflected through the construction and application of its indicators, which are mostly site-context. Simón (2003) mentions that the results vary depending on the approach, the evolution of the debate about the definition of sustainability, and the construction of indicators. In addition, no agreement has been reached about what should or could be the best indicator of sustainability, because there are no fixed or exact definitions of the concept, since they are site-context dependent. Conceptualizing the term “sustainability” before starting an evaluation of the coffee agroecosystem is relevant, because this concept will indicate the approach, as well as the factors or dimensions involved in the evaluation, delimiting the spatial and temporal scale of the research. However, the said studies do not always include the definition of the term sustainability, on which they should have been based. However, there is a consensus among the researches that do define the concept: the term is based on maintaining, preserving, and keeping the system functional (Table 3). Sustainability also implies maintaining a
Table 2. Type of scale, evaluation area(s), type of research.
Reference Level of hierarchy Dimensions of assessment Type of studyMerma and Julca (2012) Region Economic, ecology and cultural Transversal
León and Delgado (2012) Municipal Economic, ecology and social Transversal
Alvarado (2013) Region Economic and environmental Transversal
Cárdenas-Grajales and Acevedo-Osorio (2015) Production system Economic, ecology, sociocultural and tecnoproductive Longitudinal
Giraldo-Díaz et al. (2015) Production system Economic, ecology, cultural, social and political Transversal
Rincón et al. (2015) Unit of production Economic, ecology and sociocultural Transversal
Márquez and Julca (2015) Farm Economic, ecology and sociocultural Transversal
Figueroa-Lucero (2016) Farm Economic, ecology, social, cultural, and political Transversal
Márquez-Romero et al. (2016) Farm Ecological Longitudinal
Méndez et al. (2017) Community Economic, ecology and sociocultural Transversal
Rendón and Monroy (2017) Municipal Economic, ecology and cultural Transversal
De Muner (2017) Unit of production Economic, ecology and social Transversal
Guevara and Vázquez (2019) Community Economic, ecology and sociocultural Transversal
Ssebunya et al. (2019) Production system Economic, environmental, social and gobernance Transversal
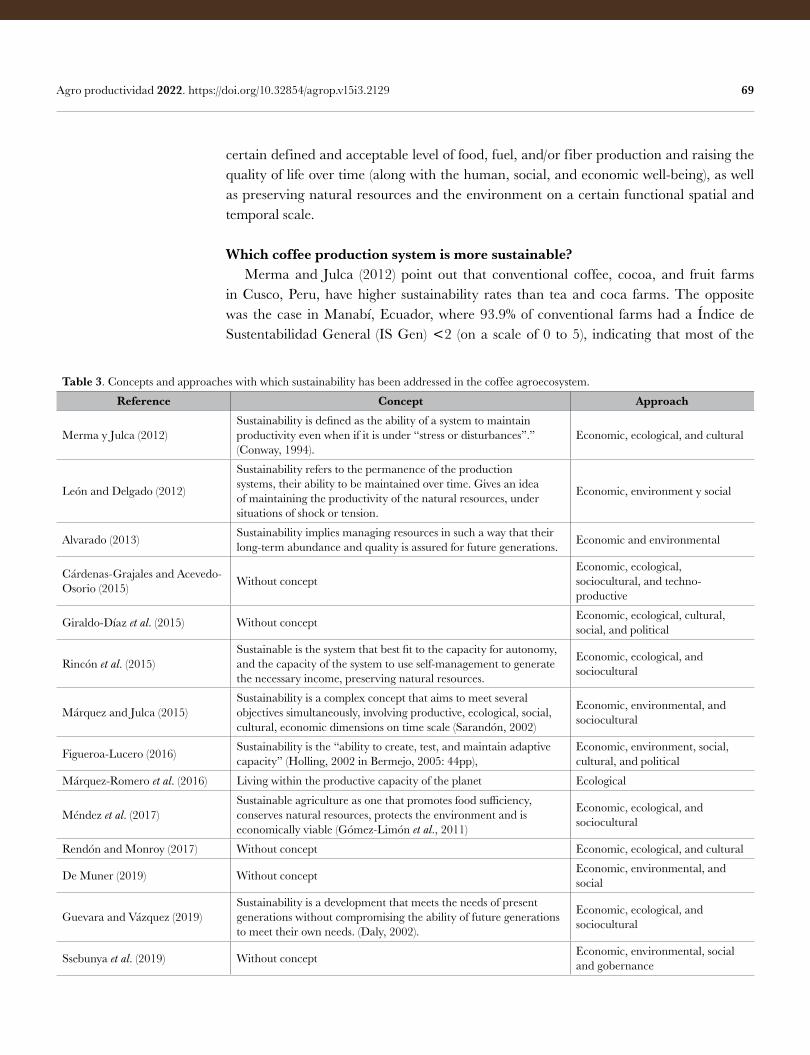
69 Agro productividad 2022. https://doi.org/10.32854/agrop.v15i3.2129
certain defined and acceptable level of food, fuel, and/or fiber production and raising the quality of life over time (along with the human, social, and economic well-being), as well as preserving natural resources and the environment on a certain functional spatial and temporal scale.
Which coffee production system is more sustainable? Merma and Julca (2012) point out that conventional coffee, cocoa, and fruit farms in Cusco, Peru, have higher sustainability rates than tea and coca farms. The opposite was the case in Manabí, Ecuador, where 93.9% of conventional farms had a Índice de Sustentabilidad General (IS Gen) 2 (on a scale of 0 to 5), indicating that most of the
Table 3. Concepts and approaches with which sustainability has been addressed in the coffee agroecosystem.
Reference Concept Approach
Merma y Julca (2012)Sustainability is defined as the ability of a system to maintain productivity even when if it is under “stress or disturbances”.” (Conway, 1994).
Economic, ecological, and cultural
León and Delgado (2012)
Sustainability refers to the permanence of the production systems, their ability to be maintained over time. Gives an idea of maintaining the productivity of the natural resources, under situations of shock or tension.
Economic, environment y social
Alvarado (2013) Sustainability implies managing resources in such a way that their long-term abundance and quality is assured for future generations. Economic and environmental
Cárdenas-Grajales and Acevedo-Osorio (2015) Without concept
Economic, ecological, sociocultural, and techno-productive
Giraldo-Díaz et al. (2015) Without concept Economic, ecological, cultural, social, and political
Rincón et al. (2015)Sustainable is the system that best fit to the capacity for autonomy, and the capacity of the system to use self-management to generate the necessary income, preserving natural resources.
Economic, ecological, and sociocultural
Márquez and Julca (2015)Sustainability is a complex concept that aims to meet several objectives simultaneously, involving productive, ecological, social, cultural, economic dimensions on time scale (Sarandón, 2002)
Economic, environmental, and sociocultural
Figueroa-Lucero (2016) Sustainability is the “ability to create, test, and maintain adaptive capacity” (Holling, 2002 in Bermejo, 2005: 44pp),
Economic, environment, social, cultural, and political
Márquez-Romero et al. (2016) Living within the productive capacity of the planet Ecological
Méndez et al. (2017)Sustainable agriculture as one that promotes food sufficiency, conserves natural resources, protects the environment and is economically viable (Gómez-Limón et al., 2011)
Economic, ecological, and sociocultural
Rendón and Monroy (2017) Without concept Economic, ecological, and cultural
De Muner (2019) Without concept Economic, environmental, and social
Guevara and Vázquez (2019)Sustainability is a development that meets the needs of present generations without compromising the ability of future generations to meet their own needs. (Daly, 2002).
Economic, ecological, and sociocultural
Ssebunya et al. (2019) Without concept Economic, environmental, social and gobernance
70 Agro productividad 2022. https://doi.org/10.32854/agrop.v15i3.2129
farms were not sustainable (Méndez et al., 2017). Meanwhile, Rendón and Monroy (2017) indicate that, in Colombia, the results conclude that the coffee ecosystems of Ufugú (Cauca) are potentially sustainable in the social and ecological spheres, and actually sustainable in the economic sphere. On their part, the agroecosystems of Sucre (Caquetá) are potentially sustainable in the ecological sphere, and moderately sustainable in the social and economic spheres. These results are the consequence of a high level of support for farmer families which have certifications such as the Rainforest Alliance; this type of certificates helps to increase the profitability of the producer and improves cost and benefit of the crop (Rendón and Monroy, 2017). A study carried out in Quindío, Colombia showed a general interest in the environmental management of coffee units with tourist activity (Rincón et al., 2015). Another case reported in the same country registers a general sustainability average of 3.2 (on a scale of 1 to 5) and is therefore sufficient for the sustainability of the conventional coffee agroecosystem (Figueroa-Lucero, 2016). Meanwhile the organic farms in Caldas, Colombia, have better soil quality than conventional coffee production farms. This group presents higher soil quality averages (8.1, on a scale of 1 to 10), because their soils are better managed than the soils of conventional farms, whose averages are lower than 8.0 (León and Delgado, 2012). Similarly, Alvarado (2013) mentions that the net income or benefits of organic producers in Piura, Peru, are higher than those of conventional producers in the four scenarios considered, in which the nutrient balance costs are lower than for organic production. This confirms that this type of production is more sustainable than conventional production. The study carried out in organic farms of Valle del Cauca, Colombia, shows that the sustainability of organic coffee systems had a balanced behavior during the five years of evaluation (Cárdenas-Grajales and Acevedo-Osorio). In a comparative study between certified and non-certified organic farms in Uganda, the scores of certified farms were significantly higher than non-certified farms; this is attributed to the fact that C. arabica producers carry out more collective activities (distribution of labor, saving plans) which have repercussions on the other dimensions (Ssebunya et al., 2019). The foregoing highlights the positive impacts of certification on the livelihoods of small coffee producers; certifications make a significant contribution to the improvement of systems and the ability of farmers to face challenges, through the transfer of knowledge, access to capital, capacity-building (Altenbuchner et al., 2014), and higher income generation (Bolwig et al., 2009; Chiputwa et al., 2015). Meanwhile, Márquez-Romero (2016) reached similar conclusions: the organic certification process enabled the increase of the number of sustainable farms, from 66.6% to 91.1%. Similarly, productivity increased (from 665.16 to 858.38 kg/ha) and grain quality improved (from 80.64 to 82.56 points) after seven years. Although certifications certainly promote sustainability, it also depends, to a large extent, on decision-makers, as is the case of farms with agroecological management in Brazil, where a lower dependence on synthetic inputs for coffee cultivation, less use of technology, and more ecological management were recorded, compared to farms with conventional management (De Muner, 2019). A similar case is that of Valle del Cauca (Colombia), where producers depend largely on products for self-consumption and self-
71 Agro productividad 2022. https://doi.org/10.32854/agrop.v15i3.2129
employment. However, the economic profitability is limited, in many cases, by the lack of spaces for the commercialization of agroecological products (Giraldo-Díaz et al., 2015), putting the sustainability of the system at risk.
CONCLUSIONS During the last ten years, the trend in sustainability research regarding coffee agroecosystems in the scientific literature shows that there have been few studies about this topic. The most sustainable agroecosystems are those that have some type of certification and where the producers are organized or have government support. Unsustainable coffee agroecosystems are those that do not have an extension service, do not implement agroecological practices, do not preserve the soil, and do not have access to financing to renew coffee plantations; additionally, they lack the technical support and economic benefits to which organized producers have access to. Regarding the mostly-downwards fluctuation of prices, coffee producers have established strategies to supplement their income and remain in the activity, even if it is not enough to cover family needs. Finally, the sustainability of the coffee agroecosystem is not merely related to the type of agroecosystem (conventional, organic, traditional, etc.), but depends on prices, support, and the incidence of climatological and biological factors: there are many sustainable conventional coffee plantations and non-sustainable agroecological plantations. The interactions that occur within each type of agroecosystem are diverse and complex. Therefore, further longitudinal, and cross-sectional sustainability studies are necessary to contribute to the identification of the factors that provide greater sustainability to the various coffee agroecosystems. Likewise, it is essential that sustainability assessment have continuity on a larger time scale and on spatial scales, taking in consideration the dynamic dimensions as a whole.
REFERENCESAltieri, M. (1999). Bases científicas para una agricultura sustentable. Editorial Nordan–Comunidad. Avda.
Millán 4113, 12900 Montevideo, Uruguay. 70 p.Batz, M. B., & Blackman A. (2010). Costos de mantenimiento, incertidumbre de precios, y el abandono en la
producción de café de sombra: Costa de Oaxaca, México. Gaceta de Economía. 16. 151-182.Cabrini S., Calcaterra P. M. C., & Lema D.( 2013). Costos ambientales y eficiencia productiva en la producción
agraria del partido de pergamino. Revibec: revista iberoamericana de economía ecológica. 20: 27-43.Candelaria-Martínez B., Ruiz-Rosado O., Pérez-Hernández P., Gallardo-López F., Vargas-Villamil L.,
Martínez-Becerra A., & Flota-Bañuelos C. (2014). Sustentabilidad de los agroecosistemas de la microcuenca Paso de Ovejas 1, Veracruz, México. Cuad. Desarro. Rural 11 (73). 87-104. Doi: 10.11144/Javeriana.cdr11-73.samp
Canet B. G., Soto V. C., Ocampo, T P., Rivera R. J., Navarro H. A., Guatemala M. G., Villanueva R. S. (2016). La situación y tendencias de la producción de café en América Latina y El Caribe. Instituto Interamericano de Cooperación para la Agricultura (IICA). 1ª ed. San José, Costa Rica. 134 p.
Corrales, E. C. (2001). Transformaciones socioeconómicas y situación de la biodiversidad en los Andes Colombianos. Cuadernos de desarrollo rural. 49. 85- 163.
Cruz-Lara, L. E., Lorenzo C., Soto L., Naranjo E. & Ramírez-Marcial N. (2004). Diversidad de mamíferos en cafetales y selva mediana de las cañadas de la selva lacandona, Chiapas, México. Acta Zoológica Mexicana. 20 (1). 63-81.
De Muner, L. H. (2019). El café conilon en la agricultura familiar de Espíritu Santo, Brasil: Bases para evaluar su sostenibilidad. INCAPER. Rua Afonso Sarlo, 160, Bento Ferreira, Brazil. Pp. 33-40.
Figueroa-Lucero, O. A. (2016). Evaluación de la sostenibilidad de los sistemas de producción de café en fincas-hogar del sector San José, municipio de Linares-Nariño. Tendencias. 17 (2). 111-125. Doi: 10.22267/rtend.161702.6
72 Agro productividad 2022. https://doi.org/10.32854/agrop.v15i3.2129
Giraldo-Díaz, R., Nieto-Gómez L. E. & Quiceno-Martínez Á. (2015). Evaluation of sustainability attributes of farming systems in the El Meson, municipality of Palmira, Valle del Cauca (Colombia). Libre empresa. 12 (1). 111-135. Doi: 10.18041/libemp.v23n1.23106
Grajales, G. I. C. y Osorio Á. A. (2015). Evaluación de la sustentabilidad de los sistemas productivos campesinos de la asociacion de caficultores orgánicos de colombia- ACOC- Valle del Cauca. Producción Agropecuaria y Desarrollo Sostenible. 4. 109-135. Doi: 10.5377/payds.v4i0.3967
Greenberg, R., Bichier P., Cruz-Angon A. & Reitsma R. (1997). Bird populations in shade and sun coffee plantations in central guatemala. Conservation Biology. 11 (2). 448-459.
Guevara Z. & Vásquez R. (2019). Caracterización y evaluación de la sustentabilidad de fincas cafetaleras en la localidad de Nuevo Chirimoto, Rodríguez de Mendoza- Región Amazonas. Revista Científica Pakamuros. 7 (1). 46-55. Doi: 10.37787/pakamuros-unj.v7i1.75
Kimaro, P. J., Bee F. K. & Towo E. N. (2017). Coffee Production and Its Implications on Livelihoods among Small Scale Farmers in Hai and Arumeru Districts, Tanzania. International Journal of Novel Research in Marketing Management and Economics. 4 (3). 65-79.
Laura, A. B. (2013). Evaluación de la sustentabilidad de la producción orgánica el café a través de la medición de eficiencia económica con variables ambientales. Natura@ economía. 1 (2). 91-110.
León, J. A. & Delgado J. M. (2012). Evaluación de la sustentabilidad de cafetales en caldas colombia. Revista Agroforestería Neotropical 2: 68-78. Doi: 10.21704/ne.v1i2.1424
López-Santos, A. (2016). Neutralizar la degradación de las tierras, una aspiración global. ¿Es posible lograrlo en México?. Terra Latinoamericana. 34 (2). 239-249.
Macip-Ríos, R. y Casas-Andreu G. (2008). Los cafetales en méxico y su importancia para la conservación de los anfibios y reptiles. Acta Zoológica Mexicana. 24 (2). 143-159.
Mac Rae, R. J., Hill, S. B., Henning, J. & Mehuys, G. R. (1989). Agricultural Science and Sustainable Agriculture: A Review of the Existing Scientific Barriers to Sustainable Food Production and Potential Solutions. Biol. Agric. Hortic. 6. 73–219.
Maldonado, J. H., Moreno-Sánchez, R. P., Espinoza, S., Bruner, A., Garzón N. & Myers J. (2018). Peace is much more than doves: The economic benefits of bird-based tourism as a result of the peace treaty in Colombia. World Development. 106. 78-86.
Manchado, J. C. (2010). La sustentabilidad en la agricultura pampeana: Valoración económica del balance de nutrientes para las principales actividades agropecuarias extensivas en la región Centro Sur de la Provincia de Buenos Aires. Revista Argentina de economía agraria. 7 (2). 51-68.
Márquez, F. R. & Julca, A. M. (2015). Indicadores para evaluar la sustentabilidad en fincas cafetaleras en quillabamba. Cusco. Perú. Saber y Hacer. 2 (1). 128-137.
Márquez-Romero, F., Julca-Otiniano, A., Canto-Saenz, M., Soplín-Villacorta, H., Vargas-Winstanley S. y Huerta-Fernández, P. (2016). Sustentabilidad ambiental en fincas cafetaleras después de un proceso de certificación orgánica en la convención (Cusco, Perú). Ecología Aplicada. 15 (2). 125-132. Doi: 10.21704/rea.v15i2.752
Masera O., Astier, M. y López-Ridaura S. (1999). Sustentabilidad y manejo de recursos naturales: el marco de evaluación MESMIS. Editorial Mundiprensa. Rio Panuco 141, Colonia Cuauhtémoc, Ciudad de Mexico, México. 1ª ed. 101 p.
Méndez, M. S., Otiniano, A. J. y Ventura, R. B. (2016). Sustentabilidad de fincas productoras de café en Jipijapa (Manabí, Ecuador). Saber y Hacer. 3 (1). 23-35.
Merma, I. y Julca, A. (2012). Caracterización y evaluación de la sustentabilidad de fincas en Alto Urubamba, Cusco, Perú. Ecología aplicada. 11 (1). 1-11.
Meyfroidt, P., Carlson, K. M., Fagan M. E., Gutiérrez-Vélez, V. H., Macedo, M. N. Curran, L. M., DeFries, R. S., Dyer, G. A., Gibbs, H. K., Lambin, E. F., Morton, D. C., & Robiglio, V. (2014). Multiple pathways of commodity crop expansion in tropical forest landscapes. Environ. Res. Lett. 9 (7). 1-13.
Palestina-González, M. I., Carranza-Cerda, I., López-Reyes, L., Torres, E., & Silva-Gómez, S. E. (2021). Sustainability Assessment of Traditional Agroecosystems in the High Region of Yaonáhuac, Puebla, Mexico. Environments 8 (5). 6-21. Doi: 10.3390/environments8050040
Perea Q. J. (2010). El café orgánico, una ventaja competitiva para los productores cafetaleros del estado de Veracruz. Investigación Administrativa. 39 (105). 23-39.
Pérez-Soto, F., Figueroa-Hernández, E., Godínez-Montoya, L. (2015) Ciencias Sociales: Economía y Humanidades. In: Figueroa-Hernández, E., Pérez-Soto F., y Godínez-Montoya L. Importancia de la comercialización del café en México. Editorial ECORFAN. V.1. Itzopan, Mza.244, Lt.2, Estado de Mexico, Mexico. pp 64-82.
Perfecto, I., & Vandermeer, J. (2015). Coffee Agroecology- A New Approach to Understanding Agricultural Biodiversity, Ecosystem Services and Sustainable Development. 1ª ed. Routledge editorial. 270 madison ave, New York, NY, United States, US. 358 p.
73 Agro productividad 2022. https://doi.org/10.32854/agrop.v15i3.2129
Pronti A. & Coccia M. (2021). Multicriteria analysis of the sustainability performance between agroecological and conventional coffee farms in the East Region of Minas Gerais (Brazil). Renewable Agriculture and Food Systems. 36 (3). 299-306.
Quintero-Rizzuto, M. L. & Rosales, M. (2014). El mercado mundial del café: tendencias recientes, estructura y estrategias de competitividad. Visión Gerencial. 2. 291-307.
Rincón, A., Pulido, D. M. S., & Villegas L. M. (2015). La sustentabilidad ambiental en las unidades agroturísticas cafeteras en el departamento del Quindío. Contexto. 4. 50-58.
Rivera, L. & Armbrecht, I. (2005). Diversidad de tres gremios de hormigas en cafetales de sombra, de sol y bosques de risaralda. Revista Colombiana de Entomología. 31 (1). 89-96.
Sarandón, S. J., Zuluaga, M. S., Cieza, N. R., Gómez, C., Janjetic, L., & Negrete E. (2006). Evaluación de la sustentabilidad de sistemas agrícolas de fincas en misiones, argentina, mediante el uso de indicadores. Agroecología. 1. 19-28.
Sarandón, S. y Flores, C. (2009). Evaluación de la sustentabilidad en agroecosistemas: una propuesta metodológica. Agroecología. 4. 19-28.
Simon, S. (2003). Sustainability indicators. In: Neumayer, Eric ed. Online Encyclopaedia of Ecological Economics (OEEE). International Society for Ecological Economics (ISEE). Disponible en: http://www.isecoeco.org/pdf/sustindicator.pdf. Consultado en mayo de 2020.
Ssebunya, B. R., Schader, C., Baumgart L., Landert, J., Altenbuchner, C., Schmid, E., & Stolze, M. (2019). Sustainability performance of certified and non-certified smallholder coffee farms in uganda. Ecological Economics. 156. 35-47. Doi: 10.1016/j.ecolecon.2018.09.004
Tinoco R. J. A. (2010). Ordenamiento forestal y evaluación de servicios ambientales: Estrategias para la mitigación y adaptación al cambio climático en el sureste mexicano. Universidad Autónoma Chapingo. Texcoco, Estado de México. 140 p.
Van Calker, K. J., Berentsen, P. B., Giesen, G. W., & R. Huirne, B. (2005). Identifying and ranking attributes that determine sustainability in dutch dairy farming. Agriculture and Human values. 22. 53-63.

Colegio dePostgraduados
75
Analysis of the factors associated with agricultural GDP in MexicoRomero-Padilla, Juan Manuel1 ; Pérez Andrade, Miguel Angel2*
1 Departamento de Estadística, Colegio de Postgraduados, Km. 36.5 Carretera México-Texcoco, Montecillo, Texcoco, Estado de México, C.P. 56230.
2 División de Ciencias Económico Administrativas, Universidad Autónoma Chapingo, Km. 38.5 Carretera México-Texcoco, C. P. 56230.
* Correspondence: [email protected]
ABSTRACTObjective: To detect factors of production which can explain the total value of agricultural production (agricultural GDP) and to carry out a descriptive analysis.Methodology: A multiple linear regression adjustment and a descriptive analysis of the variables were carried out, using the available information.Results: Five variables have a significant association with agricultural GDP. In the last 20 years, the agricultural sector has experienced an exponential economic growth, with a 7.7% annual growth rate (AAGR). About 60% of the total production value is provided only by 7 states. Agricultural exports have increased from 2015, as a result of the USA demands for Mexican fruits and vegetables.Implications: The information available about the state of agriculture in Mexico makes it possible to understand trends and take actions to increase the agricultural GDP. The analysis is limited by the lack of information about many variables.Conclusions: Sown areas have decreased and the factors of production analyzed maintain a positive average annual growth rate, which indicates a process of transition from extensive crops (such as grains and cereals) to intensively exploited crops (such as fruits and vegetables). An investment aimed to generate agricultural data is needed.
Keywords: Factors of production, descriptive analysis, average annual growth rate, multiple regression.
INTRODUCTION The behavior of the agricultural gross domestic product (GDP) is often related to several variables and factors. Perez-Fernández et al. (2018) carried out an analysis taking into account a Cobb-Douglas type model and they found that three explanatory variables shaped the agricultural GDP variations. However, one could guess that more variables would be related to agricultural GDP. Martínez, Salgado, and Vázquez (2017) pointed out that the primary production in Mexico focuses on 30 products, that the agricultural GDP growth has remained lower than the total GDP growth, and that the agricultural sector is highly dependent on the external sector.
Citation: Romero-Padilla, J. M.,Pérez & Andrade, M. A.(2022). Analysis of the factors associated with agricultural GDP in Mexico. Agro Productividad. https://doi.org/ 10.32854/agrop.v15i3.2133
Editor in Chief: Dr. Jorge Cadena Iñiguez
Received: September 24, 2021.Accepted: February 19, 2022.Published on-line: April 5, 2022.
Agro Productividad, 15(3). March. 2022. pp: 75-82.
This work is licensed under a Creative Commons Attribution-Non-Commercial 4.0 International license.
Image by Mickael Guyot at Pixabay 75
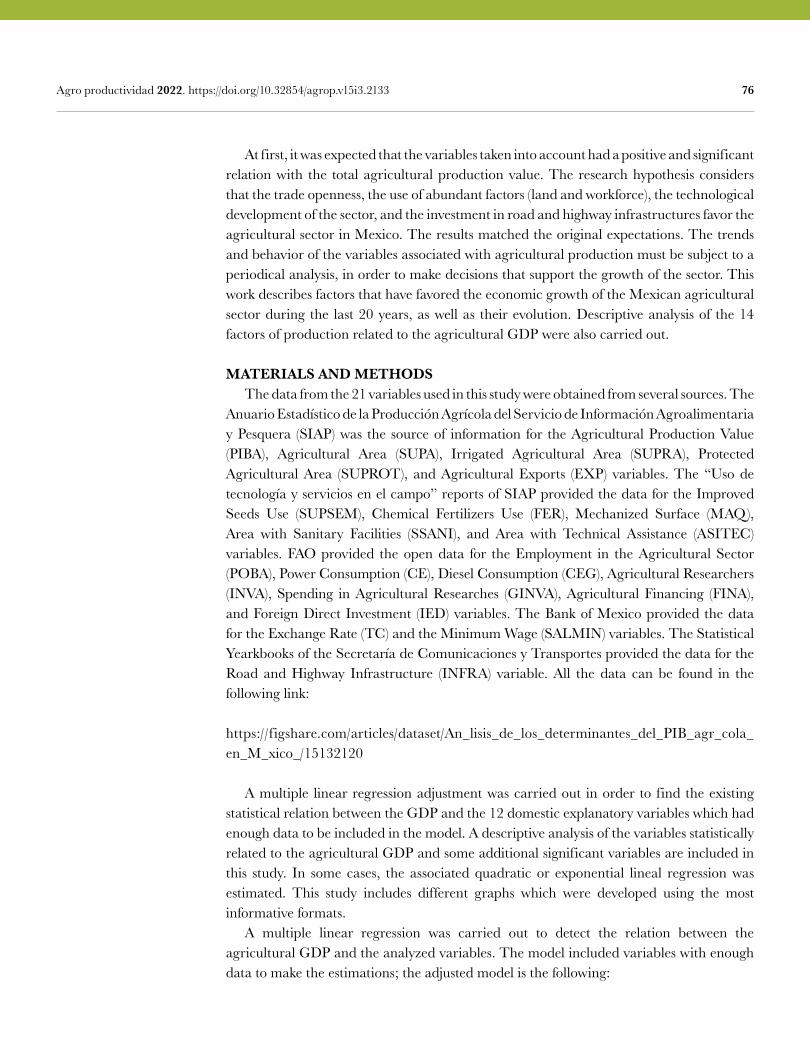
76 Agro productividad 2022. https://doi.org/10.32854/agrop.v15i3.2133
At first, it was expected that the variables taken into account had a positive and significant relation with the total agricultural production value. The research hypothesis considers that the trade openness, the use of abundant factors (land and workforce), the technological development of the sector, and the investment in road and highway infrastructures favor the agricultural sector in Mexico. The results matched the original expectations. The trends and behavior of the variables associated with agricultural production must be subject to a periodical analysis, in order to make decisions that support the growth of the sector. This work describes factors that have favored the economic growth of the Mexican agricultural sector during the last 20 years, as well as their evolution. Descriptive analysis of the 14 factors of production related to the agricultural GDP were also carried out.
MATERIALS AND METHODS The data from the 21 variables used in this study were obtained from several sources. The Anuario Estadístico de la Producción Agrícola del Servicio de Información Agroalimentaria y Pesquera (SIAP) was the source of information for the Agricultural Production Value (PIBA), Agricultural Area (SUPA), Irrigated Agricultural Area (SUPRA), Protected Agricultural Area (SUPROT), and Agricultural Exports (EXP) variables. The “Uso de tecnología y servicios en el campo” reports of SIAP provided the data for the Improved Seeds Use (SUPSEM), Chemical Fertilizers Use (FER), Mechanized Surface (MAQ), Area with Sanitary Facilities (SSANI), and Area with Technical Assistance (ASITEC) variables. FAO provided the open data for the Employment in the Agricultural Sector (POBA), Power Consumption (CE), Diesel Consumption (CEG), Agricultural Researchers (INVA), Spending in Agricultural Researches (GINVA), Agricultural Financing (FINA), and Foreign Direct Investment (IED) variables. The Bank of Mexico provided the data for the Exchange Rate (TC) and the Minimum Wage (SALMIN) variables. The Statistical Yearkbooks of the Secretaría de Comunicaciones y Transportes provided the data for the Road and Highway Infrastructure (INFRA) variable. All the data can be found in the following link:
https://figshare.com/articles/dataset/An_lisis_de_los_determinantes_del_PIB_agr_cola_en_M_xico_/15132120
A multiple linear regression adjustment was carried out in order to find the existing statistical relation between the GDP and the 12 domestic explanatory variables which had enough data to be included in the model. A descriptive analysis of the variables statistically related to the agricultural GDP and some additional significant variables are included in this study. In some cases, the associated quadratic or exponential lineal regression was estimated. This study includes different graphs which were developed using the most informative formats. A multiple linear regression was carried out to detect the relation between the agricultural GDP and the analyzed variables. The model included variables with enough data to make the estimations; the adjusted model is the following:
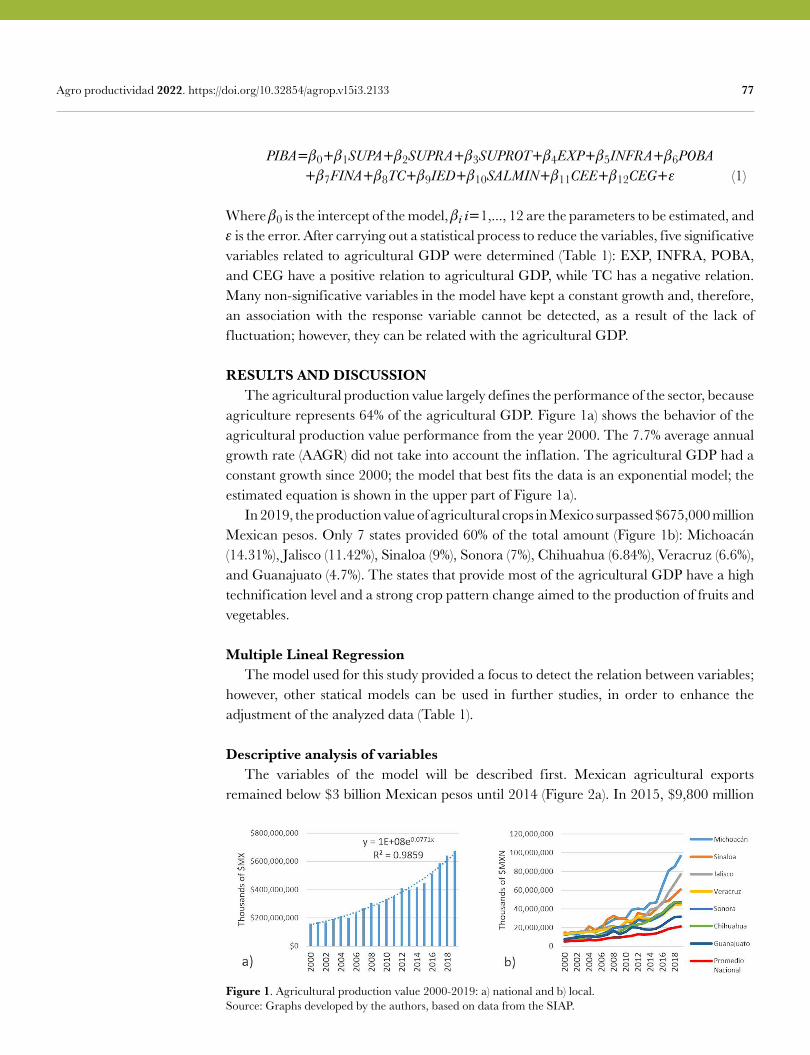
77 Agro productividad 2022. https://doi.org/10.32854/agrop.v15i3.2133
PIBA01SUPA2SUPRA3SUPROT4EXP5INFRA6POBA 7FINA8TC9IED10SALMIN11CEE12CEG (1)
Where 0 is the intercept of the model, i i1,..., 12 are the parameters to be estimated, and is the error. After carrying out a statistical process to reduce the variables, five significative variables related to agricultural GDP were determined (Table 1): EXP, INFRA, POBA, and CEG have a positive relation to agricultural GDP, while TC has a negative relation. Many non-significative variables in the model have kept a constant growth and, therefore, an association with the response variable cannot be detected, as a result of the lack of fluctuation; however, they can be related with the agricultural GDP.
RESULTS AND DISCUSSION The agricultural production value largely defines the performance of the sector, because agriculture represents 64% of the agricultural GDP. Figure 1a) shows the behavior of the agricultural production value performance from the year 2000. The 7.7% average annual growth rate (AAGR) did not take into account the inflation. The agricultural GDP had a constant growth since 2000; the model that best fits the data is an exponential model; the estimated equation is shown in the upper part of Figure 1a). In 2019, the production value of agricultural crops in Mexico surpassed $675,000 million Mexican pesos. Only 7 states provided 60% of the total amount (Figure 1b): Michoacán (14.31%), Jalisco (11.42%), Sinaloa (9%), Sonora (7%), Chihuahua (6.84%), Veracruz (6.6%), and Guanajuato (4.7%). The states that provide most of the agricultural GDP have a high technification level and a strong crop pattern change aimed to the production of fruits and vegetables.
Multiple Lineal Regression The model used for this study provided a focus to detect the relation between variables; however, other statical models can be used in further studies, in order to enhance the adjustment of the analyzed data (Table 1).
Descriptive analysis of variables The variables of the model will be described first. Mexican agricultural exports remained below $3 billion Mexican pesos until 2014 (Figure 2a). In 2015, $9,800 million
Figure 1. Agricultural production value 2000-2019: a) national and b) local.Source: Graphs developed by the authors, based on data from the SIAP.
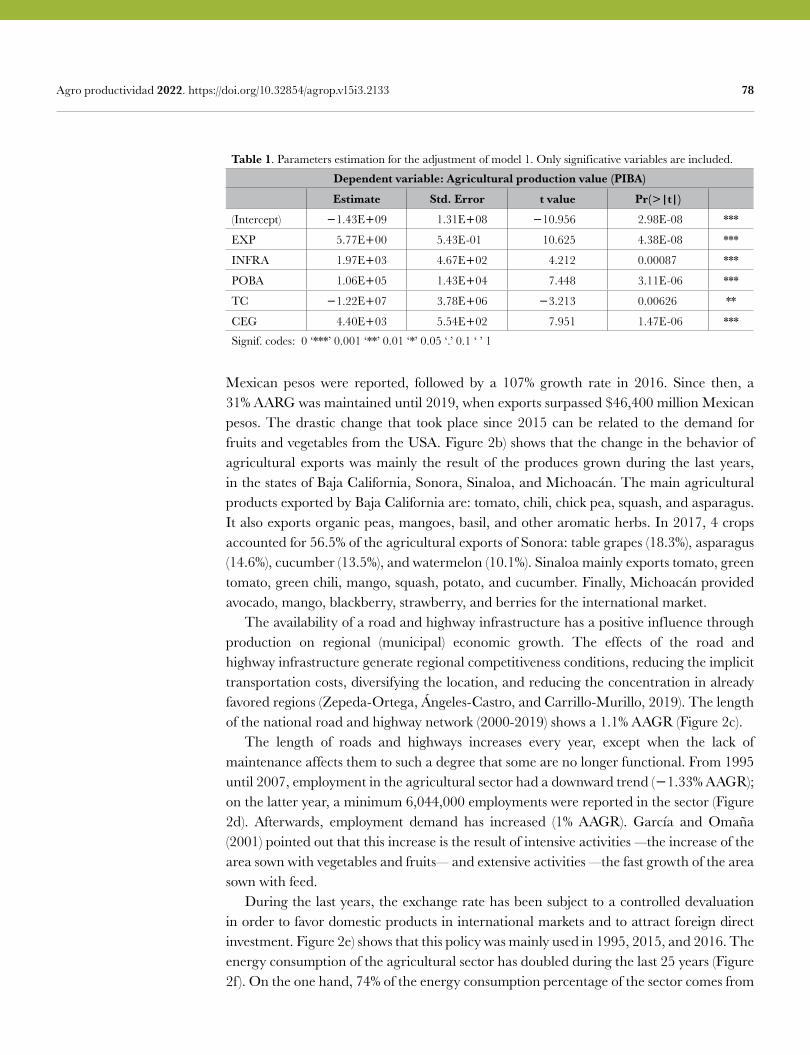
78 Agro productividad 2022. https://doi.org/10.32854/agrop.v15i3.2133
Mexican pesos were reported, followed by a 107% growth rate in 2016. Since then, a 31% AARG was maintained until 2019, when exports surpassed $46,400 million Mexican pesos. The drastic change that took place since 2015 can be related to the demand for fruits and vegetables from the USA. Figure 2b) shows that the change in the behavior of agricultural exports was mainly the result of the produces grown during the last years, in the states of Baja California, Sonora, Sinaloa, and Michoacán. The main agricultural products exported by Baja California are: tomato, chili, chick pea, squash, and asparagus. It also exports organic peas, mangoes, basil, and other aromatic herbs. In 2017, 4 crops accounted for 56.5% of the agricultural exports of Sonora: table grapes (18.3%), asparagus (14.6%), cucumber (13.5%), and watermelon (10.1%). Sinaloa mainly exports tomato, green tomato, green chili, mango, squash, potato, and cucumber. Finally, Michoacán provided avocado, mango, blackberry, strawberry, and berries for the international market. The availability of a road and highway infrastructure has a positive influence through production on regional (municipal) economic growth. The effects of the road and highway infrastructure generate regional competitiveness conditions, reducing the implicit transportation costs, diversifying the location, and reducing the concentration in already favored regions (Zepeda-Ortega, Ángeles-Castro, and Carrillo-Murillo, 2019). The length of the national road and highway network (2000-2019) shows a 1.1% AAGR (Figure 2c). The length of roads and highways increases every year, except when the lack of maintenance affects them to such a degree that some are no longer functional. From 1995 until 2007, employment in the agricultural sector had a downward trend (1.33% AAGR); on the latter year, a minimum 6,044,000 employments were reported in the sector (Figure 2d). Afterwards, employment demand has increased (1% AAGR). García and Omaña (2001) pointed out that this increase is the result of intensive activities —the increase of the area sown with vegetables and fruits— and extensive activities —the fast growth of the area sown with feed. During the last years, the exchange rate has been subject to a controlled devaluation in order to favor domestic products in international markets and to attract foreign direct investment. Figure 2e) shows that this policy was mainly used in 1995, 2015, and 2016. The energy consumption of the agricultural sector has doubled during the last 25 years (Figure 2f). On the one hand, 74% of the energy consumption percentage of the sector comes from
Table 1. Parameters estimation for the adjustment of model 1. Only significative variables are included.
Dependent variable: Agricultural production value (PIBA)
Estimate Std. Error t value Pr(|t|)
(Intercept) 1.43E09 1.31E08 10.956 2.98E-08 ***
EXP 5.77E00 5.43E-01 10.625 4.38E-08 ***
INFRA 1.97E03 4.67E02 4.212 0.00087 ***
POBA 1.06E05 1.43E04 7.448 3.11E-06 ***
TC 1.22E07 3.78E06 3.213 0.00626 **
CEG 4.40E03 5.54E02 7.951 1.47E-06 ***
Signif. codes: 0 ‘***’ 0.001 ‘**’ 0.01 ‘*’ 0.05 ‘.’ 0.1 ‘ ’ 1
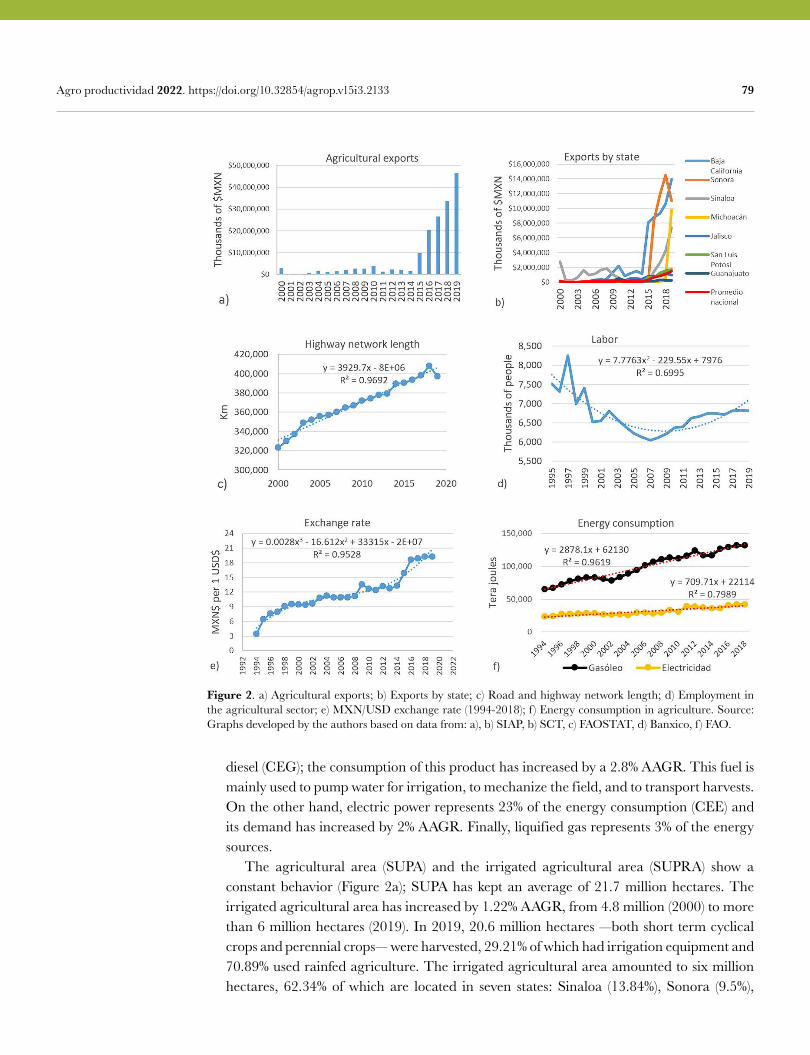
79 Agro productividad 2022. https://doi.org/10.32854/agrop.v15i3.2133
diesel (CEG); the consumption of this product has increased by a 2.8% AAGR. This fuel is mainly used to pump water for irrigation, to mechanize the field, and to transport harvests. On the other hand, electric power represents 23% of the energy consumption (CEE) and its demand has increased by 2% AAGR. Finally, liquified gas represents 3% of the energy sources. The agricultural area (SUPA) and the irrigated agricultural area (SUPRA) show a constant behavior (Figure 2a); SUPA has kept an average of 21.7 million hectares. The irrigated agricultural area has increased by 1.22% AAGR, from 4.8 million (2000) to more than 6 million hectares (2019). In 2019, 20.6 million hectares —both short term cyclical crops and perennial crops— were harvested, 29.21% of which had irrigation equipment and 70.89% used rainfed agriculture. The irrigated agricultural area amounted to six million hectares, 62.34% of which are located in seven states: Sinaloa (13.84%), Sonora (9.5%),
Figure 2. a) Agricultural exports; b) Exports by state; c) Road and highway network length; d) Employment in the agricultural sector; e) MXN/USD exchange rate (1994-2018); f ) Energy consumption in agriculture. Source: Graphs developed by the authors based on data from: a), b) SIAP, b) SCT, c) FAOSTAT, d) Banxico, f ) FAO.
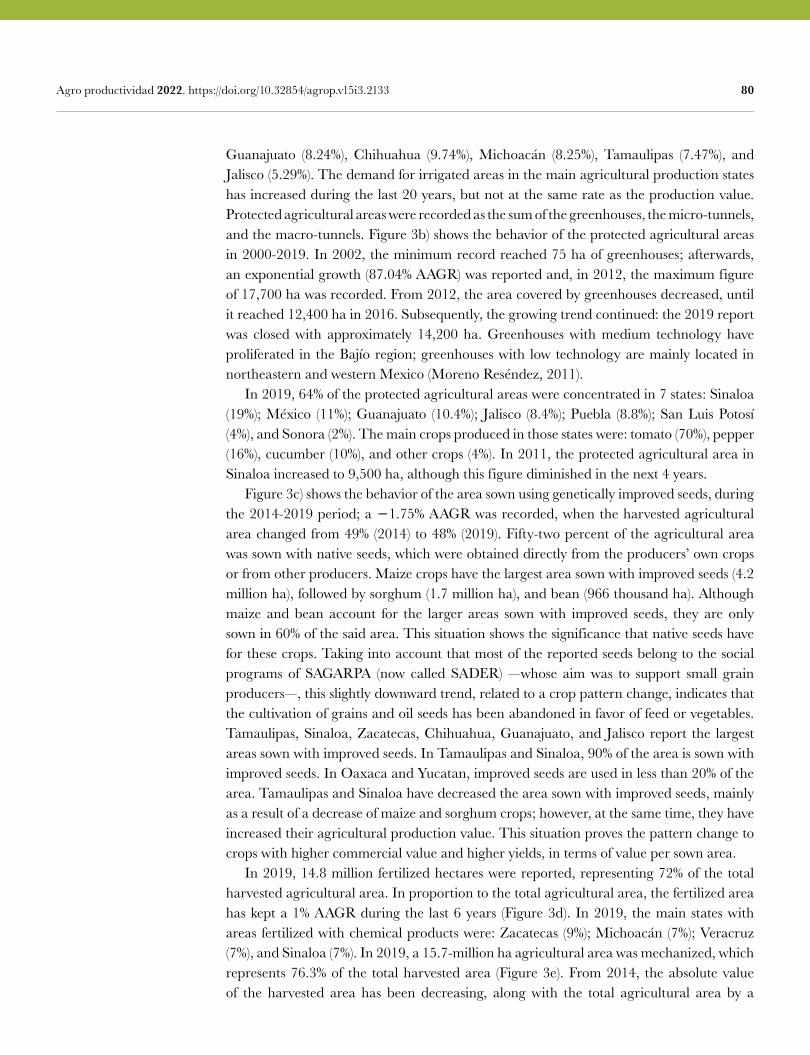
80 Agro productividad 2022. https://doi.org/10.32854/agrop.v15i3.2133
Guanajuato (8.24%), Chihuahua (9.74%), Michoacán (8.25%), Tamaulipas (7.47%), and Jalisco (5.29%). The demand for irrigated areas in the main agricultural production states has increased during the last 20 years, but not at the same rate as the production value. Protected agricultural areas were recorded as the sum of the greenhouses, the micro-tunnels, and the macro-tunnels. Figure 3b) shows the behavior of the protected agricultural areas in 2000-2019. In 2002, the minimum record reached 75 ha of greenhouses; afterwards, an exponential growth (87.04% AAGR) was reported and, in 2012, the maximum figure of 17,700 ha was recorded. From 2012, the area covered by greenhouses decreased, until it reached 12,400 ha in 2016. Subsequently, the growing trend continued: the 2019 report was closed with approximately 14,200 ha. Greenhouses with medium technology have proliferated in the Bajío region; greenhouses with low technology are mainly located in northeastern and western Mexico (Moreno Reséndez, 2011). In 2019, 64% of the protected agricultural areas were concentrated in 7 states: Sinaloa (19%); México (11%); Guanajuato (10.4%); Jalisco (8.4%); Puebla (8.8%); San Luis Potosí (4%), and Sonora (2%). The main crops produced in those states were: tomato (70%), pepper (16%), cucumber (10%), and other crops (4%). In 2011, the protected agricultural area in Sinaloa increased to 9,500 ha, although this figure diminished in the next 4 years. Figure 3c) shows the behavior of the area sown using genetically improved seeds, during the 2014-2019 period; a 1.75% AAGR was recorded, when the harvested agricultural area changed from 49% (2014) to 48% (2019). Fifty-two percent of the agricultural area was sown with native seeds, which were obtained directly from the producers’ own crops or from other producers. Maize crops have the largest area sown with improved seeds (4.2 million ha), followed by sorghum (1.7 million ha), and bean (966 thousand ha). Although maize and bean account for the larger areas sown with improved seeds, they are only sown in 60% of the said area. This situation shows the significance that native seeds have for these crops. Taking into account that most of the reported seeds belong to the social programs of SAGARPA (now called SADER) —whose aim was to support small grain producers—, this slightly downward trend, related to a crop pattern change, indicates that the cultivation of grains and oil seeds has been abandoned in favor of feed or vegetables. Tamaulipas, Sinaloa, Zacatecas, Chihuahua, Guanajuato, and Jalisco report the largest areas sown with improved seeds. In Tamaulipas and Sinaloa, 90% of the area is sown with improved seeds. In Oaxaca and Yucatan, improved seeds are used in less than 20% of the area. Tamaulipas and Sinaloa have decreased the area sown with improved seeds, mainly as a result of a decrease of maize and sorghum crops; however, at the same time, they have increased their agricultural production value. This situation proves the pattern change to crops with higher commercial value and higher yields, in terms of value per sown area. In 2019, 14.8 million fertilized hectares were reported, representing 72% of the total harvested agricultural area. In proportion to the total agricultural area, the fertilized area has kept a 1% AAGR during the last 6 years (Figure 3d). In 2019, the main states with areas fertilized with chemical products were: Zacatecas (9%); Michoacán (7%); Veracruz (7%), and Sinaloa (7%). In 2019, a 15.7-million ha agricultural area was mechanized, which represents 76.3% of the total harvested area (Figure 3e). From 2014, the absolute value of the harvested area has been decreasing, along with the total agricultural area by a
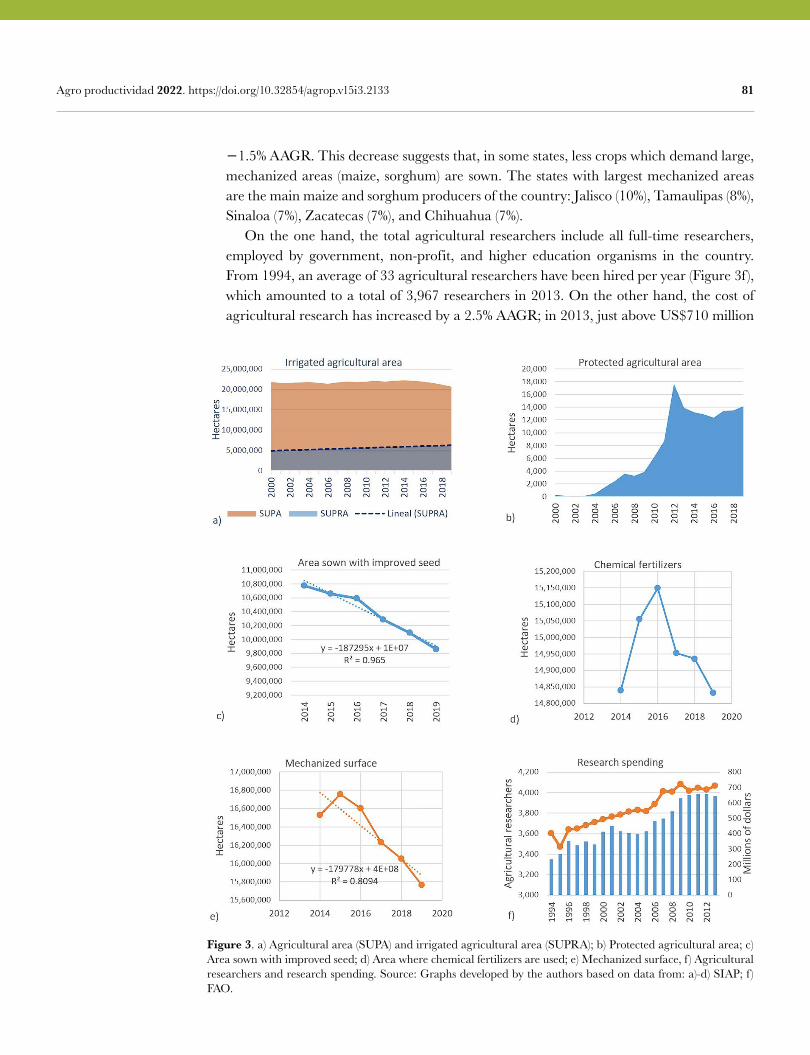
81 Agro productividad 2022. https://doi.org/10.32854/agrop.v15i3.2133
1.5% AAGR. This decrease suggests that, in some states, less crops which demand large, mechanized areas (maize, sorghum) are sown. The states with largest mechanized areas are the main maize and sorghum producers of the country: Jalisco (10%), Tamaulipas (8%), Sinaloa (7%), Zacatecas (7%), and Chihuahua (7%). On the one hand, the total agricultural researchers include all full-time researchers, employed by government, non-profit, and higher education organisms in the country. From 1994, an average of 33 agricultural researchers have been hired per year (Figure 3f), which amounted to a total of 3,967 researchers in 2013. On the other hand, the cost of agricultural research has increased by a 2.5% AAGR; in 2013, just above US$710 million
Figure 3. a) Agricultural area (SUPA) and irrigated agricultural area (SUPRA); b) Protected agricultural area; c) Area sown with improved seed; d) Area where chemical fertilizers are used; e) Mechanized surface, f ) Agricultural researchers and research spending. Source: Graphs developed by the authors based on data from: a)-d) SIAP; f ) FAO.
82 Agro productividad 2022. https://doi.org/10.32854/agrop.v15i3.2133
were allocated for agricultural research. There is no available data about researchers and investment in recent years.
CONCLUSIONS Factors of production related to the total agricultural production value were analyzed. The increase of the total agricultural production value of the country has a positive statistical relation with the increase of agricultural exports, the development of the length of the road and highway infrastructure, the demand for rural workforce, and diesel consumption. During the last 20 years, the agricultural sector has undergone an exponential economic growth (7.7% AAGR) and only 7 states provide almost 60% of the total production value: Michoacán, Jalisco, Sinaloa, Sonora, Chihuahua, Veracruz, and Guanajuato. Agricultural exports increased from 2015, as a consequence of the USA demand for Mexican fruits and vegetables. The states with higher exports were: Baja California, Sonora, Sinaloa, and Michoacán. These exports mainly included avocado, tomato, berries, grapes, peppers, cucumbers, and asparagus. The total agricultural area has remained constant during the last years, while the irrigated area has grown by a 1.22% AAGR; 62% of the said area is located in the states of Sinaloa, Sonora, Guanajuato, Chihuahua, Michoacán, Tamaulipas, and Jalisco. Sixty-four percent of the protected agricultural area is located in the states of Sinaloa, México, Guanajuato, Jalisco, Puebla, San Luis Potosí, and Sonora. The road and highway infrastructure is a development engine that connects regions and promotes trade, reducing transportation costs. The Mexican road and highway network has increased by 1.1% AAGR. The demand for rural workforce, the area sown with improved seed, the area fertilized with chemical products, and mechanized area have kept a 1% AAGR. A smaller area with a higher concentration of resources suggests a crop change pattern, which favors intensive export crops (fruits and vegetables) or products that do not face direct competition from imported products (feed). The relative participation of vegetables, fruits, and feed in the total agricultural value has increased.
REFERENCESGarcía, J. A., & Omaña, J. M. ( junio de 2001). Fuentes de crecimiento del empleo en el sector agrícola del norte
de México. Frontera norte, 13(25), 71-93. Martínez Bautista, G. (2010). Determinantes económicos de la inversión extranjera directa: El caso de la
frontera norte de México durante el periodo del TLCAN (1994-2008). Editorial Académica Española, 1ª ed. Chisinau-2068, str. A.Russo 15, of.61, Republic of Moldova.
Martinez, A., Salgado, A., & Vazquez, S. (2017). Tendencias recientes del sector primario en México. BBVA Research, 1-21.
Moreno Reséndez, A. (2011). Características de la agricultura protegida y su entorno en México. Revista Mexicana de Agronegocios, 29, 763-774.
Pérez-Fernández, A., Caamal-Cauich, I., Pat-Fernandez, V., Martinez-Luis, D., & Reza-Salgado, J. (2018). Análisis de los factores que determinan el crecimiento del sector agrícola de México. Agro Productividad, 11(1), 131-135.
SIAP. (2020). Estadística de uso tecnológico y de servicios en la superficie agrícola. Disponible en: https://www.gob.mx/siap/prensa/estadistica-de-uso-tecnologico-y-de-servicios-en-la-superficie-agricola?idiom=es
Trujillo Félix, J. d. (2004). Las reformas de las políticas agrícolas de Estados unidos, la Unión Europea y México. Análisis comparativo e implicaciones para México. Tesis doctorado. Universidad Autónoma Chapingo, Texcoco, Mexico.
Zepeda Ortega, I. E., Ángeles Castro, G., & Carrillo Murillo, D. G. (16 de Nov de 2019). Infraestructura carretera y crecimiento económico en México. Problemas del desarrollo, 50(198), 145-168. Doi: 10.22201/iiec.20078951e.2019.198.66383.
Colegio dePostgraduados
83
Characteristics and socio-productive problems of women mezcal producers in Oaxaca, MexicoSánchez-Gómez, Julia1; Pardo-Núñez, Joaliné1; Cuevas-Reyes, Venancio2; Romero-Romero, Yair1*
1 CONACyT-Centro de Investigación y Asistencia en Tecnología y Diseño del Estado de Jalisco, A.C. (CIATEJ), Colinas de La Normal, Guadalajara, Jalisco, México, C.P. 44270.
2 Instituto Nacional de Investigaciones Forestales, Agrícolas y Pecuarias (INIFAP) Los Reyes-Lechería, Texcoco, Edo. de México, México, C.P. 56230.
* Correspondence: [email protected]
ABSTRACTObjective: To analyze the characteristics and socio-productive problems of women mezcal producers of Oaxaca, Mexico.Design/methodology/approach: A semi-structured interview was applied in the field to n20 women mezcal producers to obtain the data for this study.Results: The interviewees are middle-aged adult women with an elementary education level and a wide experience in the production of mezcal. Among them, 35% make all decisions in their business and at home. The main problems that they perceive in this activity are the price of mezcal (35%) and the shortage of agave (30%). Women face social limitations such as work overload at home, a lack of financial aids for production, and little involvement in rural organizations.Study limitations/implications: More studies about women mezcal producers in Oaxaca should be conducted.Findings/conclusions: Collective work and organization could be alternatives for women mezcal producers to improve their and their families’ benefits and quality of life. Public policies with a gender perspective should be designed to meet the needs of women who participate in mezcal production.
Key words: Women, Rural, Gender, Mezcal production.
INTRODUCTION There are 14.7 million women (22.7% of the country’s total) living in rural towns in Mexico, among whom 778,000 work in the primary sector. In fact, 15% of the country’s total producers are women, who are also responsible for over 50% of the food produced (SADER, 2020). Moreover, rural women participate in multiple production-related activities such as harvesting food plants, backyard production and stockbreeding, handicrafts, and entrepreneurship activities (Laguna and Del Ponte Flores, 2019). At home, women are in charge of unpaid activities such as domestic chores, preparing food, taking care of children, collecting firewood, and carrying water (Ramírez, 2011; Rosales-Martínez and Leyva-Trinidad, 2019).
Citation: Sánchez-Gómez, J., Pardo-Núñez, J., Cuevas-Reyes, V., & Romero-Romero, Y. (2022). Characteristics and socio-productive problems of women mezcal producers in Oaxaca, Mexico. Agro Productividad. https://doi.org/ 10.32854/agrop.v15i3.2134
Editor in Chief: Dr. Jorge Cadena Iñiguez
Received: September 26, 2021.Accepted: February 5, 2022.Published on-line: April 5, 2022.
Agro Productividad, 15(3). March. 2022. pp: 83-90.
This work is licensed under a Creative Commons Attribution-Non-Commercial 4.0 International license.
Image by Angel Chavez at Pixabay
84 Agro productividad 2022. https://doi.org/ 10.32854/agrop.v15i3.2134
Even though rural women play an important role in production-related activities and in the preservation of their communities’ natural resources (IMCO, 2020), they still face critical circumstances: their participation is not acknowledged and no opportunities have been created for their personal, social, and productive development. Their income still lags behind that of their male counterparts (López-Martínez, 2018). The average number of schooling years among rural women is 7.1, as compared to 10.5 among urban women; only 35.6% of women between 15 and 64 years of age have a paid job (INMUJERES, 2019). In addition, out of the 4.9 million registered owners of agrarian units, only 1.3 million are women (26%) (IMCO, 2020). In this respect, Rosas-Chávez and Rico-Rodríguez (2017) pointed out that country women remain in conditions of inequality, because they have no right to own land, since land ownership is usually limited to men. Rural women’s characteristics and problems vary widely depending on the production sector, the territory, and the economic resources that they count on for production. Statistics and gender studies in the rural context are fundamental for the design of policies, programs, and strategies that seek to improve women’s benefits, income, rights to land ownership, and decision-making capacity (Acosta Reveles, 2008). In the context of mezcal production —an activity seen as masculine and whose producers are known as “maestros mezcaleros” (male master mezcal producers)— most of the work is driven by women, but little is known about them. In light of this, we analyzed the characteristics and socio-productive problems of women mezcal producers of Oaxaca, Mexico, with the aim to broaden the existing knowledge about the attributes and limitations of the women who participate in this activity.
MATERIALS AND METHODS Our research was carried out in the Valles Centrales Region (Ocotlán de Morelos, Santa Catarina Minas), the Mixteca Region (Asunción Nochixtlán, San Pedro Teozacoalco, Villa Tejúpam de la Unión), and the Sierra Sur Region (San Luis Amatlán) in Oaxaca, Mexico (Figure 1). The field work was carried out during the years 2020-2021. A semi-structured interview was applied to n20 women mezcal producers. Likewise, bibliographic sources on mezcal production in Oaxaca were examined. Interviewees were selected using an intentional sampling, where the selection criterion was the women’s full- or part-time dedication to the production of mezcal. To this end, the snowball technique was used to identify individuals of interest based on persons who know them (Martínez-Salgado, 2012). Therefore, women were selected according to other women’s references to their experience and renown in the mezcal trade. During the face-to-face interview with these women, we obtained data about their characteristics (age, education level, experience, and number of children), the kind of mezcal production activities they carry out, the varieties of agave they use, the number of times they cook agave per year (cooking or hornear), the commercialization of their products, governmental financial aids, and the problems and challenges they perceive in this activity. Special emphasis was given to obtaining data about the problems present in the activities carried out by women, and about women’s perception of the potential solutions. An Excel® database was developed with the data collected through the survey.
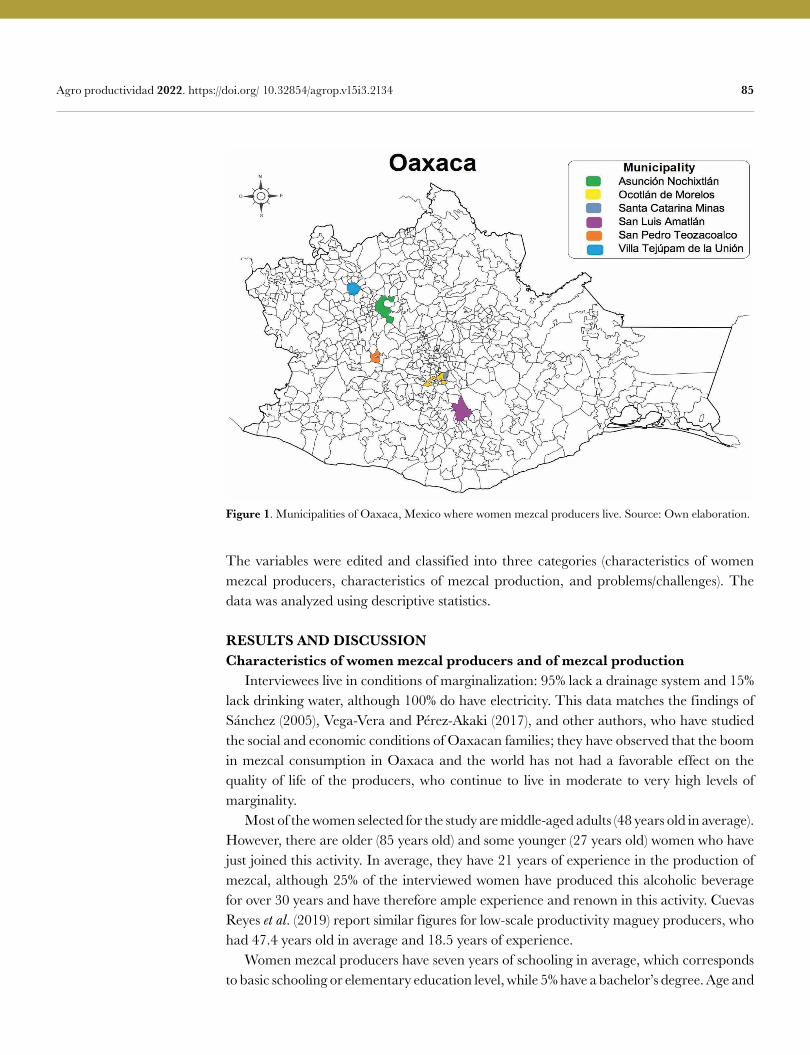
85 Agro productividad 2022. https://doi.org/ 10.32854/agrop.v15i3.2134
Figure 1. Municipalities of Oaxaca, Mexico where women mezcal producers live. Source: Own elaboration.
The variables were edited and classified into three categories (characteristics of women mezcal producers, characteristics of mezcal production, and problems/challenges). The data was analyzed using descriptive statistics.
RESULTS AND DISCUSSIONCharacteristics of women mezcal producers and of mezcal production Interviewees live in conditions of marginalization: 95% lack a drainage system and 15% lack drinking water, although 100% do have electricity. This data matches the findings of Sánchez (2005), Vega-Vera and Pérez-Akaki (2017), and other authors, who have studied the social and economic conditions of Oaxacan families; they have observed that the boom in mezcal consumption in Oaxaca and the world has not had a favorable effect on the quality of life of the producers, who continue to live in moderate to very high levels of marginality. Most of the women selected for the study are middle-aged adults (48 years old in average). However, there are older (85 years old) and some younger (27 years old) women who have just joined this activity. In average, they have 21 years of experience in the production of mezcal, although 25% of the interviewed women have produced this alcoholic beverage for over 30 years and have therefore ample experience and renown in this activity. Cuevas Reyes et al. (2019) report similar figures for low-scale productivity maguey producers, who had 47.4 years old in average and 18.5 years of experience. Women mezcal producers have seven years of schooling in average, which corresponds to basic schooling or elementary education level, while 5% have a bachelor’s degree. Age and
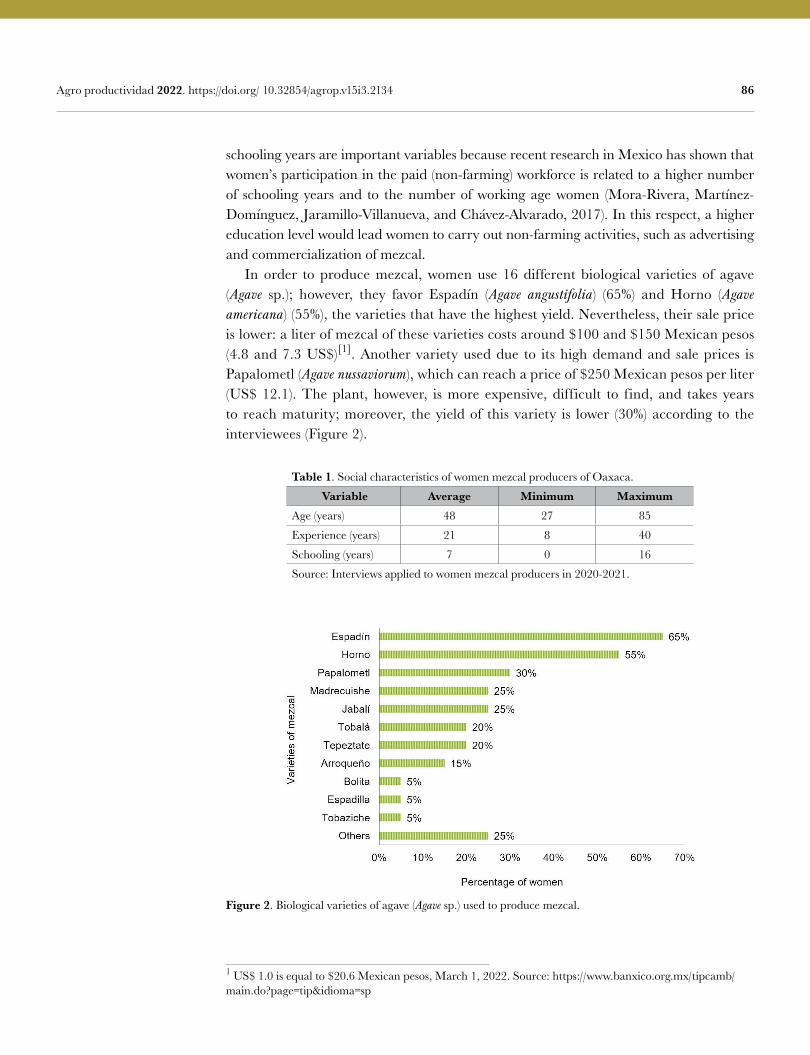
86 Agro productividad 2022. https://doi.org/ 10.32854/agrop.v15i3.2134
schooling years are important variables because recent research in Mexico has shown that women’s participation in the paid (non-farming) workforce is related to a higher number of schooling years and to the number of working age women (Mora-Rivera, Martínez-Domínguez, Jaramillo-Villanueva, and Chávez-Alvarado, 2017). In this respect, a higher education level would lead women to carry out non-farming activities, such as advertising and commercialization of mezcal. In order to produce mezcal, women use 16 different biological varieties of agave (Agave sp.); however, they favor Espadín (Agave angustifolia) (65%) and Horno (Agave americana) (55%), the varieties that have the highest yield. Nevertheless, their sale price is lower: a liter of mezcal of these varieties costs around $100 and $150 Mexican pesos (4.8 and 7.3 US$)[1]. Another variety used due to its high demand and sale prices is Papalometl (Agave nussaviorum), which can reach a price of $250 Mexican pesos per liter (US$ 12.1). The plant, however, is more expensive, difficult to find, and takes years to reach maturity; moreover, the yield of this variety is lower (30%) according to the interviewees (Figure 2).
Table 1. Social characteristics of women mezcal producers of Oaxaca.
Variable Average Minimum MaximumAge (years) 48 27 85
Experience (years) 21 8 40
Schooling (years) 7 0 16
Source: Interviews applied to women mezcal producers in 2020-2021.
Figure 2. Biological varieties of agave (Agave sp.) used to produce mezcal.
1 US$ 1.0 is equal to $20.6 Mexican pesos, March 1, 2022. Source: https://www.banxico.org.mx/tipcamb/main.do?page=tip&idioma=sp
87 Agro productividad 2022. https://doi.org/ 10.32854/agrop.v15i3.2134
The production of mezcal is the main economic activity for these women, who in average carry out six agave cookings per year. However, 20% of them do 12 cookings per year. This allows them to maintain a constant production throughout the year and, therefore, to cover family expenses. Cookings are usually carried out during the dry season, since they grow maize and bean during the rainy season, occasionally combining them with agave. Harvesting and looking after the agave are among the mezcal-related activities that women are in charge of. Nevertheless, their own production or the production of community lands are usually not enough for cooking; therefore, they are forced to buy plants. According to 50% of the interviewees, the raw material used to produce mezcal comes from their own crops and they are even able to sell agave; however, they tend to focus more on processing mezcal, rather than on producing agave for sale. In this regard, 35% mentioned that all the mezcal they produce comes from agave they buy, while 15% pointed out that they grow half of the agave they use for mezcal and buy the other half.
Socio-productive problems of women mezcal producers An aspect not be ignored —given the context of the production of agave/mezcal— are the difficulties faced by women as a consequence of the weaknesses attributed to their gender (lack of physical strength, submissiveness, among other social and cultural aspects). The inequality gap between men and women permeates the public acknowledgement —even within their own social circle— of women’s participation in the mezcal production and other primary activities. Women in the rural sector are usually seen as secondary workers whose function focuses on complementing the household’s income or else they are rendered invisible as unpaid household workers or producers for self-consumption (OIT, 2012). The multiple activities and roles that women mezcal producers —as well as other women in the rural sector— must fulfill have contributed to their scant inclusion in rural organizations and involvement in full-time activities. Only 5% of the interviewees said that they belong to a rural organization and none of them mentioned having received financial aids for production, even though 25% of them are in charge of the whole production process. Some interviewees said they have benefited from social or other kinds of aids to carry out non-farming activities. It should be noted that, in the Mexican rural sector, people usually must organize themselves in advance to have access to governmental aids (Martínez-García, Zapata-Martelo, Alberti-Manzanares, and Díaz-Cervantes, 2005). Besides participating in the production process, women mezcal producers also take on the role of housewives and often help with the commercialization of mezcal. They often must split their time between preparing food and taking care of their children, on the one hand, and carrying wood and water, cultivating agave, cleaning and maintaining the palenque (traditional mezcal factory), cooking, watching over the mezcal distilling, bottling, and selling the final product, among other activities included in the production process, on the other.
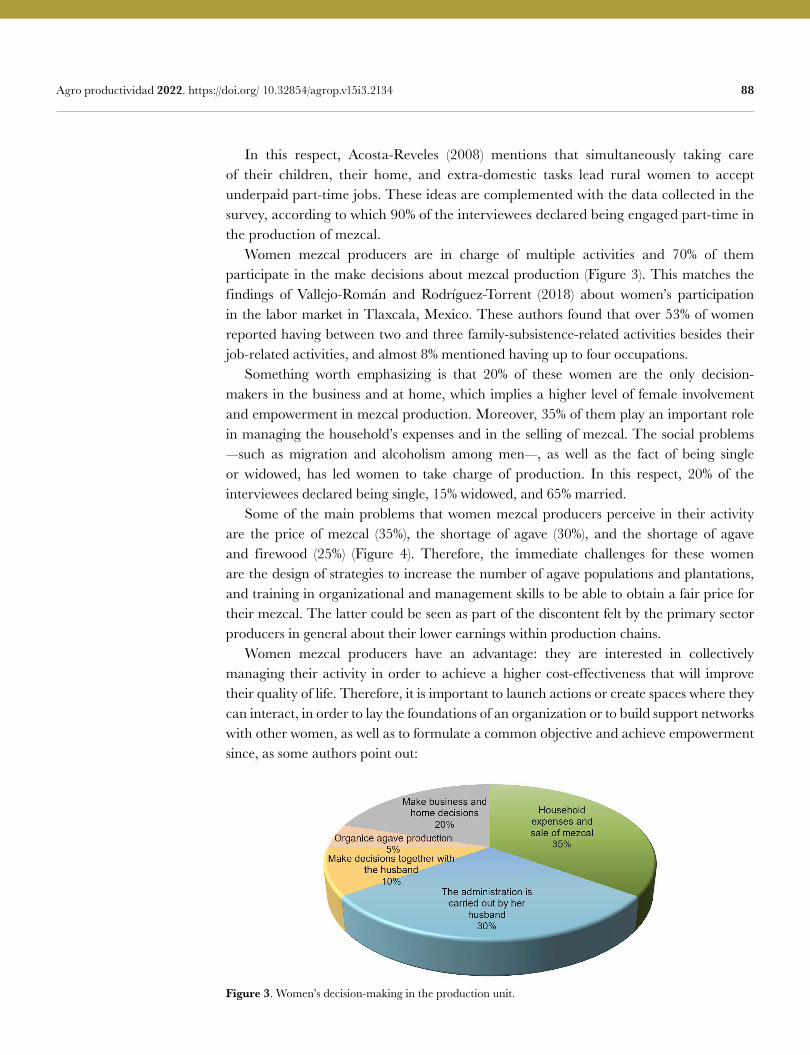
88 Agro productividad 2022. https://doi.org/ 10.32854/agrop.v15i3.2134
In this respect, Acosta-Reveles (2008) mentions that simultaneously taking care of their children, their home, and extra-domestic tasks lead rural women to accept underpaid part-time jobs. These ideas are complemented with the data collected in the survey, according to which 90% of the interviewees declared being engaged part-time in the production of mezcal. Women mezcal producers are in charge of multiple activities and 70% of them participate in the make decisions about mezcal production (Figure 3). This matches the findings of Vallejo-Román and Rodríguez-Torrent (2018) about women’s participation in the labor market in Tlaxcala, Mexico. These authors found that over 53% of women reported having between two and three family-subsistence-related activities besides their job-related activities, and almost 8% mentioned having up to four occupations. Something worth emphasizing is that 20% of these women are the only decision-makers in the business and at home, which implies a higher level of female involvement and empowerment in mezcal production. Moreover, 35% of them play an important role in managing the household’s expenses and in the selling of mezcal. The social problems —such as migration and alcoholism among men—, as well as the fact of being single or widowed, has led women to take charge of production. In this respect, 20% of the interviewees declared being single, 15% widowed, and 65% married. Some of the main problems that women mezcal producers perceive in their activity are the price of mezcal (35%), the shortage of agave (30%), and the shortage of agave and firewood (25%) (Figure 4). Therefore, the immediate challenges for these women are the design of strategies to increase the number of agave populations and plantations, and training in organizational and management skills to be able to obtain a fair price for their mezcal. The latter could be seen as part of the discontent felt by the primary sector producers in general about their lower earnings within production chains. Women mezcal producers have an advantage: they are interested in collectively managing their activity in order to achieve a higher cost-effectiveness that will improve their quality of life. Therefore, it is important to launch actions or create spaces where they can interact, in order to lay the foundations of an organization or to build support networks with other women, as well as to formulate a common objective and achieve empowerment since, as some authors point out:
Figure 3. Women’s decision-making in the production unit.
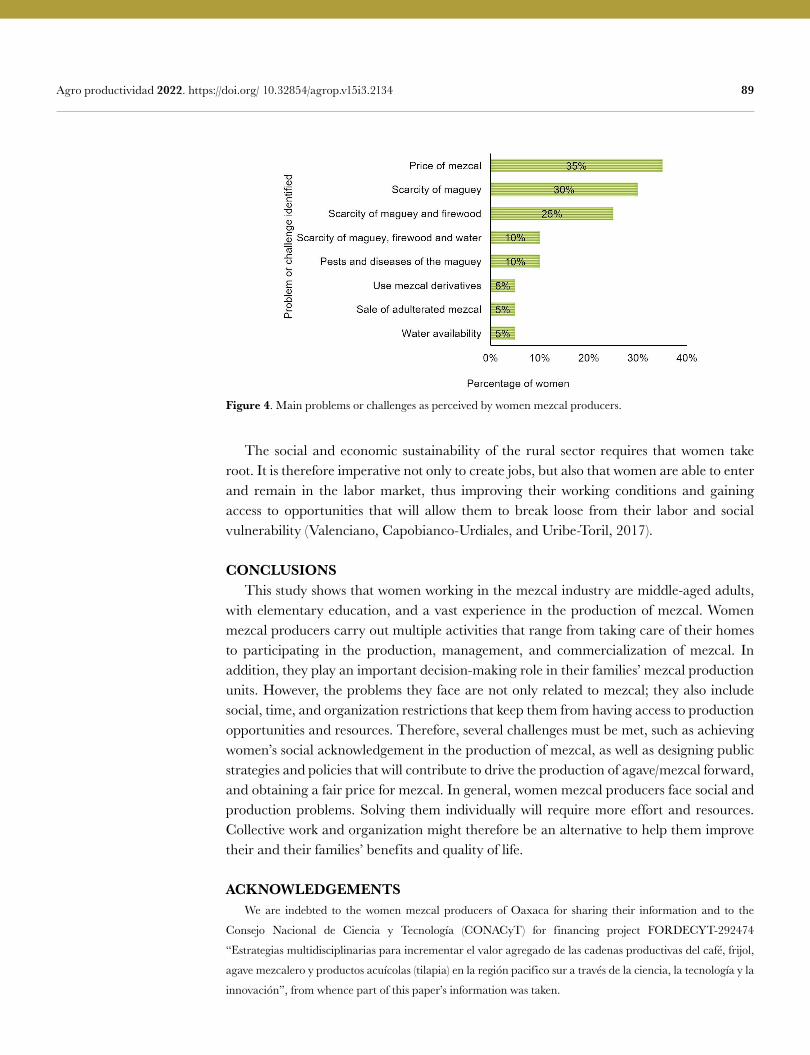
89 Agro productividad 2022. https://doi.org/ 10.32854/agrop.v15i3.2134
The social and economic sustainability of the rural sector requires that women take root. It is therefore imperative not only to create jobs, but also that women are able to enter and remain in the labor market, thus improving their working conditions and gaining access to opportunities that will allow them to break loose from their labor and social vulnerability (Valenciano, Capobianco-Urdiales, and Uribe-Toril, 2017).
CONCLUSIONS This study shows that women working in the mezcal industry are middle-aged adults, with elementary education, and a vast experience in the production of mezcal. Women mezcal producers carry out multiple activities that range from taking care of their homes to participating in the production, management, and commercialization of mezcal. In addition, they play an important decision-making role in their families’ mezcal production units. However, the problems they face are not only related to mezcal; they also include social, time, and organization restrictions that keep them from having access to production opportunities and resources. Therefore, several challenges must be met, such as achieving women’s social acknowledgement in the production of mezcal, as well as designing public strategies and policies that will contribute to drive the production of agave/mezcal forward, and obtaining a fair price for mezcal. In general, women mezcal producers face social and production problems. Solving them individually will require more effort and resources. Collective work and organization might therefore be an alternative to help them improve their and their families’ benefits and quality of life.
ACKNOWLEDGEMENTS We are indebted to the women mezcal producers of Oaxaca for sharing their information and to the
Consejo Nacional de Ciencia y Tecnología (CONACyT) for financing project FORDECYT-292474
“Estrategias multidisciplinarias para incrementar el valor agregado de las cadenas productivas del café, frijol,
agave mezcalero y productos acuícolas (tilapia) en la región pacifico sur a través de la ciencia, la tecnología y la
innovación”, from whence part of this paper’s information was taken.
Figure 4. Main problems or challenges as perceived by women mezcal producers.
90 Agro productividad 2022. https://doi.org/ 10.32854/agrop.v15i3.2134
REFERENCESAcosta Reveles, I. L. (2008). “Mujeres trabajadoras en el medio rural. Una aproximación a la agricultura
mexicana”. Contribuciones a las Ciencias Sociales. Cuevas, R. V., Sánchez T. B. I., Borja, B. M., Espejel, G. A., Sosa M. M., Barrera, R. A. I, & Saavedra, G. M.
J. (2019). Caracterización de la producción de maguey en el Distrito de Miahuatlán, Oaxaca. Revista mexicana de ciencias agrícolas. 10(2), 365-377. Doi: 10.29312/remexca.v10i2.1632
Instituto Nacional de las Mujeres [INMUJERES]. (2019). Boletín N° 11, Desigualdad en cifras. Mujeres rurales. Disponible en: http://cedoc.inmujeres.gob.mx/documentos_download/Boletin11.pdf
IMCO (2020). Mujer rural en la economía. Disponible en: https://imco.org.mx/mujer-rural-en-la-economia/Laguna, M., & Del Ponte Flores, M.A. (2019). Cerrar las brechas, nota de política pública para la inclusión
de la perspectiva de género e intercultural en la agricultura y el desarrollo rural. México: FAO-FIDA. Disponible en: http://www.fao.org/3/CA3278ES/ca3278es.pdf
López Martínez, J. (2018). La situación laboral de la mujer en el sector agropecuario en México, 2008-2016. Análisis Económico, 33(83), 97-123. Doi: 10.24275/uam/azc/dcsh/ae/2018v33n83/lopez
Martínez García, L., Zapata Martelo, E., Díaz Cervantes, R., & Alberti Manzanares, P. (2005). Género y poder en tres organizaciones rurales de la región lagunera. Revista Mexicana de Sociología, 67(2), 271-319.
Martínez-Salgado, C. (2012). El muestreo en investigación cualitativa. Principios básicos y algunas controversias. Ciência & Saúde Coletiva, 17(3),613-619. ISSN: 1413-8123.
Mora-Rivera, J., Martínez Domínguez, M., Jaramillo Villanueva, J. L., & Chávez Alvarado, M. de los Á. (2017). Participación en el sector no agropecuario en el México rural: Una perspectiva de género. Revista Brasileira de Estudos de População, 34(2), 367-389. Doi: 10.20947/s0102-3098a0020
OIT (Organización Mundial del Trabajo). (2012). El empleo de las mujeres rurales en América Latina. Panorama Laboral 2012 (pp. 52-58). Lima: OIT, 2012.
Ramírez, D. (2011). Productividad agrícola de la mujer rural en Centroamérica y México. Comisión Económica para América Latina y el Caribe (CEPAL). Disponible en: http://hdl.handle.net/11362/26078
Rosas Chávez, & Rico Rodríguez. (2017). El papel de las mujeres en la construcción de soberanía alimentaria. Revista de investigación y divulgación sobre los estudios de género. 2 .95-118.
Rosales-Martínez, V., & Leyva-Trinidad, D. A. (2019). El rol de la mujer en el Agroecosistema y su aporte a la producción de Alimentos. Agro Productividad, 12(1), 47-52. Doi: 10.32854/agrop.v0i0.1337
Sánchez, L. A. (2005). Oaxaca, tierra de maguey y mezcal. 1ª Ed. Instituto Tecnológico de Oaxaca. Oaxaca, México. 235 p.
Secretaría de Agricultura y Desarrollo Rural [Sader]. (2020). Mujeres rurales, incesante motor de desarrollo. Disponible en: https://www.gob.mx/agricultura/articulos/mujeres-rurales-incesante-motor-de-desarrollo?idiom=es
Vega Vera, N., & Pérez Akaki, P. (2017). Oaxaca y sus regiones productoras de mezcal: Un análisis desde cadenas globales de valor. Perspectivas Rurales Nueva Época, 15(29), 103-132.
Vallejo Román, J., & Rodríguez Torrent, J. C. (2018). Pluriactividad del trabajo femenino: recurrencias y transiciones. Un estudio de caso en Tlaxcala, México. Cultura-hombre-sociedad, 28(1), 10-33. Doi: 10.7770/0719-2789.2018.cuhso.02.a01
Valenciano, J. de P., Capobianco Urdiales, M., & Uribe Toril, J. U. (2017). Vulnerabilidad laboral de la mujer rural latinoamericana. Nóesis. Revista de Ciencias Sociales y Humanidades, 26(52), 130-151. Doi: 10.20983/noesis.2017.2.6
Colegio dePostgraduados
91
Determination of bacteria morphotypes associated with the rhizosphere of organic coffee plantationsRocío Aguilar-Méndez1*; Cynthia Lizbeth Nicólas-Salazar1, Misael Martínez-Bolaños2; Carlos Hugo Avendaño-Arrazate2; Salvador Lozano-Trejo1; Ernesto Castañeda-Hidalgo1; Gisela Margarita Santiago-Martínez1; Gustavo Omar Diaz-Zorrilla1
1 Tecnológico Nacional de México, Instituto Tecnológico del Valle de Oaxaca, Ex Hacienda de Nazareno, Xoxocotlán, Oaxaca, México, C.P. 71230.
2 Instituto Nacional de Investigaciones Forestales, Agrícolas y Pecuarias (INIFAP), Campo Experimental Rosario Izapa, Tuxtla Chico, Chiapas, México, C.P. 30870.
* Correspondence: m13920209@ voaxaca.tecnm.mx
ABSTRACTObjective: To determine the bacterial diversity in the rhizosphere of coffee (Coffea arabica L.) in coffee plantations in Oaxaca, Mexico.Design/methodology/approach: Soil samples collected from organic arabian coffee plantations in the Loxicha region of Oaxaca were analyzed to isolate and characterize bacterial populations associated with the rhizosphere of those plantations. Samples were collected from six sites in three altitude ranges (two sampling sites per each range): low (1,200, 1,400 masl), medium (1,700, 1,800 masl), and high (1,900 masl). Tukey’s test was used to compare the bacteria population distribution per altitude range. A multivariate analysis (Principal Component Analysis and Hierarchical Cluster Analysis) was performed considering four morphological —shape, surface, border, and color— and two microscopic —type and Gram— characteristics of the colonies.Results: Forty-three bacterial colonies were isolated and purified; their population distribution showed a significant difference (Tukey 0.5) with respect to the altitude range in which they were collected. The Principal Components Analysis showed that the first three principal components accounted for 74.19% of the total variation of the 43 bacterial colonies, indicating that the evaluated characteristics were widely distributed. The Hierarchical Cluster Analysis determined eight groups and divided them into subgroups, based on the semi partial correlation coefficient (0.05).Study limitations/implications: The environmental conditions where bacteria grow allow changes in the interspecific variation of each species.Findings/conclusions: The morphological and microscopic characterization of the bacterial colonies shows a high variability that is expressed in characteristics, indicating a high diversity of bacterial species in organically-managed coffee soils in Oaxaca.
Keywords: Coffea arabica, diversity, microorganisms.
Citation: Aguilar-Méndez, R., Nicólas-Salazar, C. L.,Martínez-Bolaños, M., Avendaño-Arrazate, C.H., Lozano-Trejo, S., Castañeda-Hidalgo, E., Santiago-Martínez, G.M., & Diaz-Zorrilla, G.O. (2022). Determination of bacteria morphotypes associated with the rhizosphere of organic coffee plantations. Agro Productividad. https://doi.org/10.32854/agrop.v15i3.2150
Editor in Chief: Dr. Jorge Cadena Iñiguez
Received: October 8, 2021.Accepted: February 21, 2022.Published on-line: April 5, 2022.
Agro Productividad, 15(3). March. 2022. pp: 91-99.
This work is licensed under a Creative Commons Attribution-Non-Commercial 4.0 International license.
Image by lotus digitals at Pixabay 91
92 Agro productividad 2022. https://doi.org/10.32854/agrop.v15i3.2150
INTRODUCTION Coffee (Coffea arabica L.) production in Mexico is a fundamental strategic activity (Escamilla et al., 2005), whose importance lies in the fact that it generates multiple social, economic, and environmental benefits (Ruiz-García et al., 2020). In Mexico, coffee is grown in 16,020,284 ha (SIAP, 2021), out of which 519,375 ha are located in the state of Oaxaca (SIAP, 2021). Oaxaca sells coffee in market niches such as organic production, organic coffee, fair trade, and shade-grown coffee (CEDRSSA, 2018). Coffee production systems in Oaxaca are characterized by being shade-grown wooded agroecosystems (Sánchez and Schwentesius, 2015), with a wide tree diversity that includes timber and non-timber forest species, as well as shrubs (Román et al., 2016). The management type and intensity of these production systems directly affects the abundance and composition of the biodiversity that is housed in coffee plantations (Rapidelt et al., 2015). The soil is a key element within coffee agroecosystems, due to the wide microbial biodiversity it houses (Raaijmakers et al., 2009), which includes: bacteria, rhizobacteria, mycorrhizal fungi, mycoparasitic fungi, and protozoa (Mendes et al., 2003). Rhizospheric bacteria include those that can improve growth and health of plants (Molina-Romero et al., 2015); however, they also include pathogenic bacteria (Beneduzi et al., 2012). The main growth-promoting genera are: Acidithiobacillus, Aminobacter, Arthrobacter, Azoarcus, Azospirillum, Azotobacter, Bacillus, Burkholderia, Clostridium, Enterobacter, Gluconoacetobacter, Pseudomonas, Serratia, and Sphingomona (Velasco-Jiménez et al., 2020). The nitrogen-fixer genera are: Azospirillum, Azotobacter, Gluconoacetobacter diazotrophicus, and Azocarus (Bhattacharyya and Jha, 2012). Finally, the potassium solubilizers genera include: Acidithiobacillus, Aminobacter, Arthrobacter, Bacillus, Burkholderia, Cladosporium, Enterobacter, Paenibacillus, and Sphingomonas (Etesami et al., 2017). Despite the importance of rhizospheric bacteria, there are few studies about bacterial diversity in coffee soils, which reduces the possibility of taking advantage of this diversity in coffee production systems, both in disease management and in production and yield improvement (Velasco-Jiménez et al., 2020; Granda-Mora et al., 2020). Therefore, the objective of this work was to determine the bacteria morphotypes associated with the rhizosphere of three coffee growing areas located at different altitudes in southern Oaxaca.
MATERIALS AND METHODS Soil samples were collected in six organic coffee plots, in three altitude ranges (two sampling sites per range): low (1200, 1400 m), medium (1700, 1800 m), and high (1900 m). A representative sample of 200 g of soil was obtained from each sampling site using the five diagonal point sampling method. The samples were labeled with a key, protected in polypaper bags, and transported to the phytopathology laboratory of the Instituto Nacional de Investigaciones Forestales, Agrícolas y Pecuarias (INIFAP) - Campo Experimental Rosario Izapa, located in Tuxtla Chico, Chiapas, Mexico. Sampling sites 1 (SBL01) and 2 (SBL02) were located in San Bartolomé Loxicha; sites 3 (SAL01) and 4 (SAL02), in San Agustín Loxicha; and sites 5 (AL01) and 6 (AL02), in El Aguacate Loxicha (Table 1).
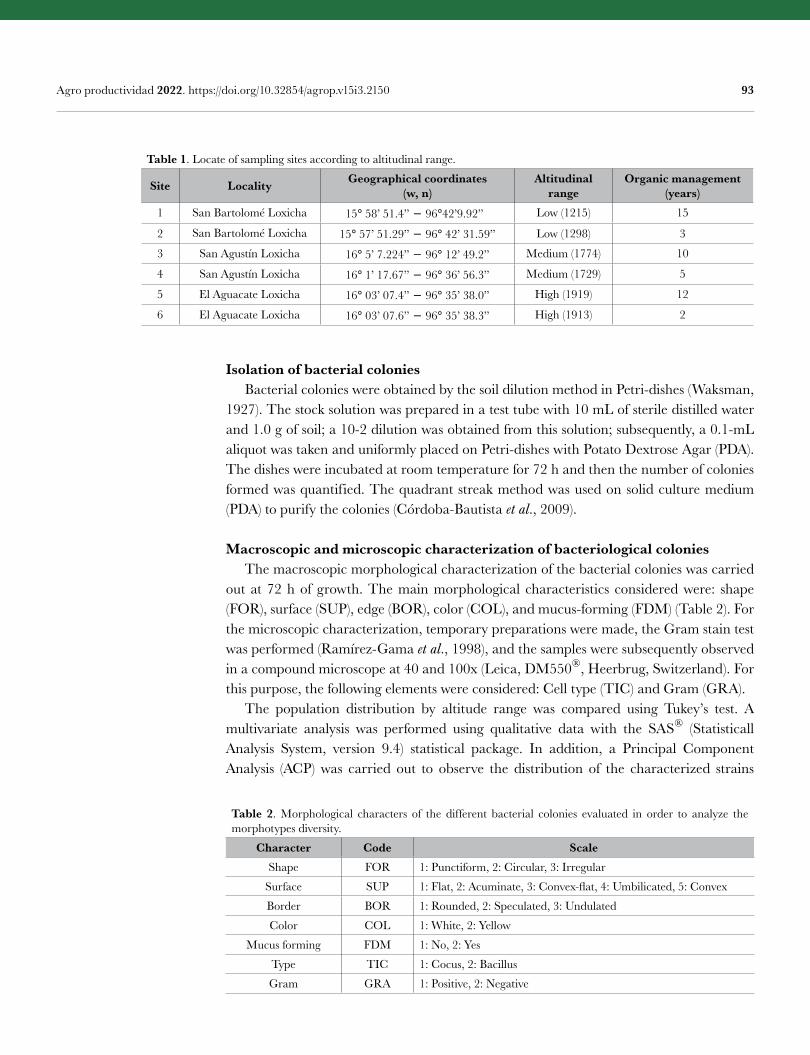
93 Agro productividad 2022. https://doi.org/10.32854/agrop.v15i3.2150
Isolation of bacterial colonies Bacterial colonies were obtained by the soil dilution method in Petri-dishes (Waksman, 1927). The stock solution was prepared in a test tube with 10 mL of sterile distilled water and 1.0 g of soil; a 10-2 dilution was obtained from this solution; subsequently, a 0.1-mL aliquot was taken and uniformly placed on Petri-dishes with Potato Dextrose Agar (PDA). The dishes were incubated at room temperature for 72 h and then the number of colonies formed was quantified. The quadrant streak method was used on solid culture medium (PDA) to purify the colonies (Córdoba-Bautista et al., 2009).
Macroscopic and microscopic characterization of bacteriological colonies The macroscopic morphological characterization of the bacterial colonies was carried out at 72 h of growth. The main morphological characteristics considered were: shape (FOR), surface (SUP), edge (BOR), color (COL), and mucus-forming (FDM) (Table 2). For the microscopic characterization, temporary preparations were made, the Gram stain test was performed (Ramírez-Gama et al., 1998), and the samples were subsequently observed in a compound microscope at 40 and 100x (Leica, DM550®, Heerbrug, Switzerland). For this purpose, the following elements were considered: Cell type (TIC) and Gram (GRA). The population distribution by altitude range was compared using Tukey’s test. A multivariate analysis was performed using qualitative data with the SAS® (Statisticall Analysis System, version 9.4) statistical package. In addition, a Principal Component Analysis (ACP) was carried out to observe the distribution of the characterized strains
Table 1. Locate of sampling sites according to altitudinal range.
Site Locality Geographical coordinates(w, n)
Altitudinal range
Organic management (years)
1 San Bartolomé Loxicha 15° 58’ 51.4” 96°42’9.92” Low (1215) 15
2 San Bartolomé Loxicha 15° 57’ 51.29” 96° 42’ 31.59” Low (1298) 3
3 San Agustín Loxicha 16° 5’ 7.224” 96° 12’ 49.2” Medium (1774) 10
4 San Agustín Loxicha 16° 1’ 17.67” 96° 36’ 56.3” Medium (1729) 5
5 El Aguacate Loxicha 16° 03’ 07.4” 96° 35’ 38.0” High (1919) 12
6 El Aguacate Loxicha 16° 03’ 07.6” 96° 35’ 38.3” High (1913) 2
Table 2. Morphological characters of the different bacterial colonies evaluated in order to analyze the morphotypes diversity.
Character Code ScaleShape FOR 1: Punctiform, 2: Circular, 3: Irregular
Surface SUP 1: Flat, 2: Acuminate, 3: Convex-flat, 4: Umbilicated, 5: Convex
Border BOR 1: Rounded, 2: Speculated, 3: Undulated
Color COL 1: White, 2: Yellow
Mucus forming FDM 1: No, 2: Yes
Type TIC 1: Cocus, 2: Bacillus
Gram GRA 1: Positive, 2: Negative
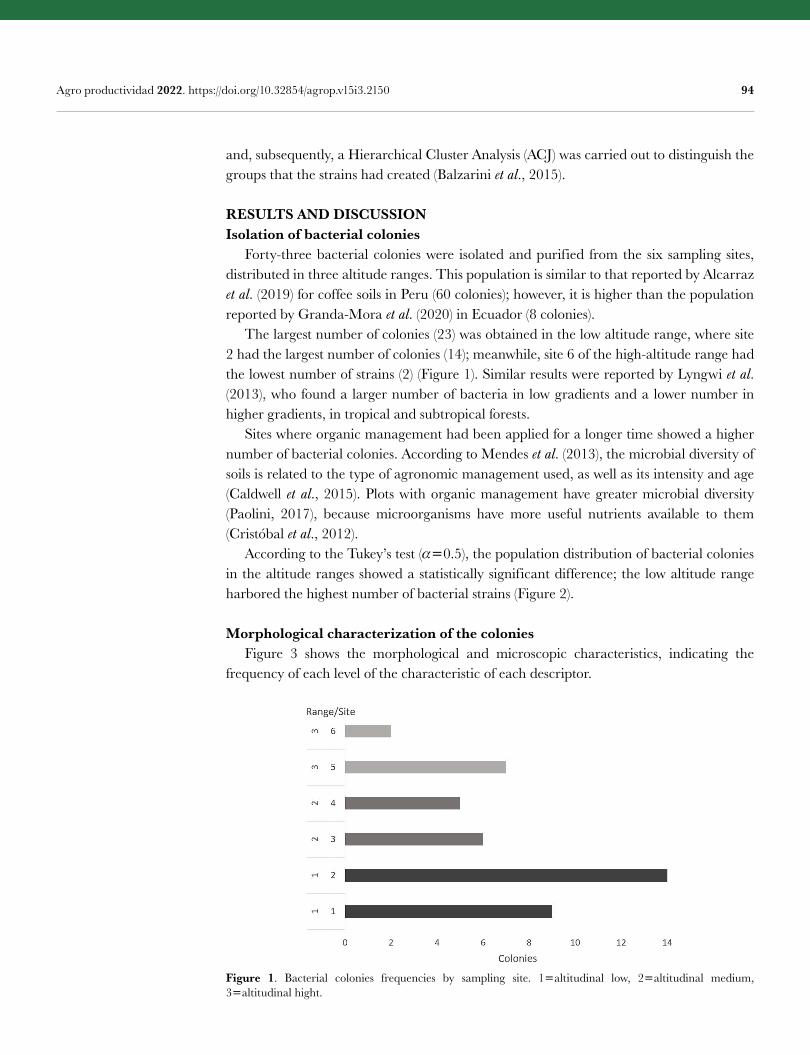
94 Agro productividad 2022. https://doi.org/10.32854/agrop.v15i3.2150
and, subsequently, a Hierarchical Cluster Analysis (ACJ) was carried out to distinguish the groups that the strains had created (Balzarini et al., 2015).
RESULTS AND DISCUSSIONIsolation of bacterial colonies Forty-three bacterial colonies were isolated and purified from the six sampling sites, distributed in three altitude ranges. This population is similar to that reported by Alcarraz et al. (2019) for coffee soils in Peru (60 colonies); however, it is higher than the population reported by Granda-Mora et al. (2020) in Ecuador (8 colonies). The largest number of colonies (23) was obtained in the low altitude range, where site 2 had the largest number of colonies (14); meanwhile, site 6 of the high-altitude range had the lowest number of strains (2) (Figure 1). Similar results were reported by Lyngwi et al. (2013), who found a larger number of bacteria in low gradients and a lower number in higher gradients, in tropical and subtropical forests. Sites where organic management had been applied for a longer time showed a higher number of bacterial colonies. According to Mendes et al. (2013), the microbial diversity of soils is related to the type of agronomic management used, as well as its intensity and age (Caldwell et al., 2015). Plots with organic management have greater microbial diversity (Paolini, 2017), because microorganisms have more useful nutrients available to them (Cristóbal et al., 2012). According to the Tukey’s test (0.5), the population distribution of bacterial colonies in the altitude ranges showed a statistically significant difference; the low altitude range harbored the highest number of bacterial strains (Figure 2).
Morphological characterization of the colonies Figure 3 shows the morphological and microscopic characteristics, indicating the frequency of each level of the characteristic of each descriptor.
Figure 1. Bacterial colonies frequencies by sampling site. 1altitudinal low, 2altitudinal medium, 3altitudinal hight.
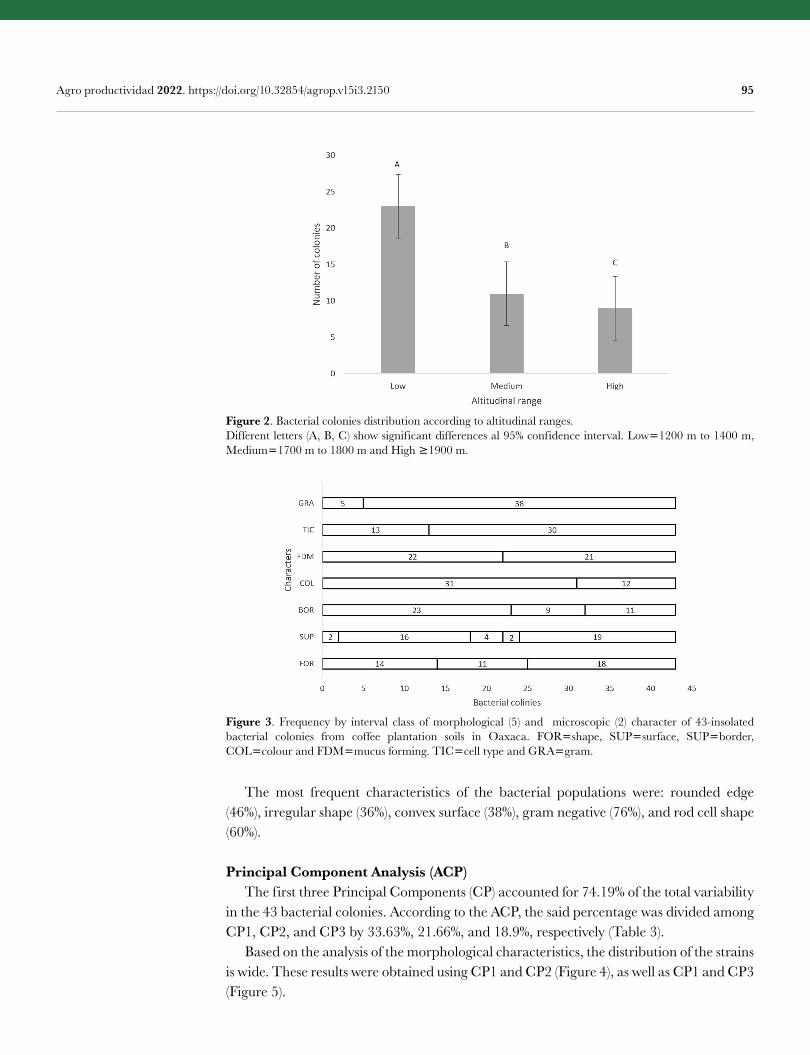
95 Agro productividad 2022. https://doi.org/10.32854/agrop.v15i3.2150
Figure 3. Frequency by interval class of morphological (5) and microscopic (2) character of 43-insolated bacterial colonies from coffee plantation soils in Oaxaca. FORshape, SUPsurface, SUPborder, COLcolour and FDMmucus forming. TICcell type and GRAgram.
Figure 2. Bacterial colonies distribution according to altitudinal ranges.Different letters (A, B, C) show significant differences al 95% confidence interval. Low1200 m to 1400 m, Medium1700 m to 1800 m and High 1900 m.
The most frequent characteristics of the bacterial populations were: rounded edge (46%), irregular shape (36%), convex surface (38%), gram negative (76%), and rod cell shape (60%).
Principal Component Analysis (ACP) The first three Principal Components (CP) accounted for 74.19% of the total variability in the 43 bacterial colonies. According to the ACP, the said percentage was divided among CP1, CP2, and CP3 by 33.63%, 21.66%, and 18.9%, respectively (Table 3). Based on the analysis of the morphological characteristics, the distribution of the strains is wide. These results were obtained using CP1 and CP2 (Figure 4), as well as CP1 and CP3 (Figure 5).
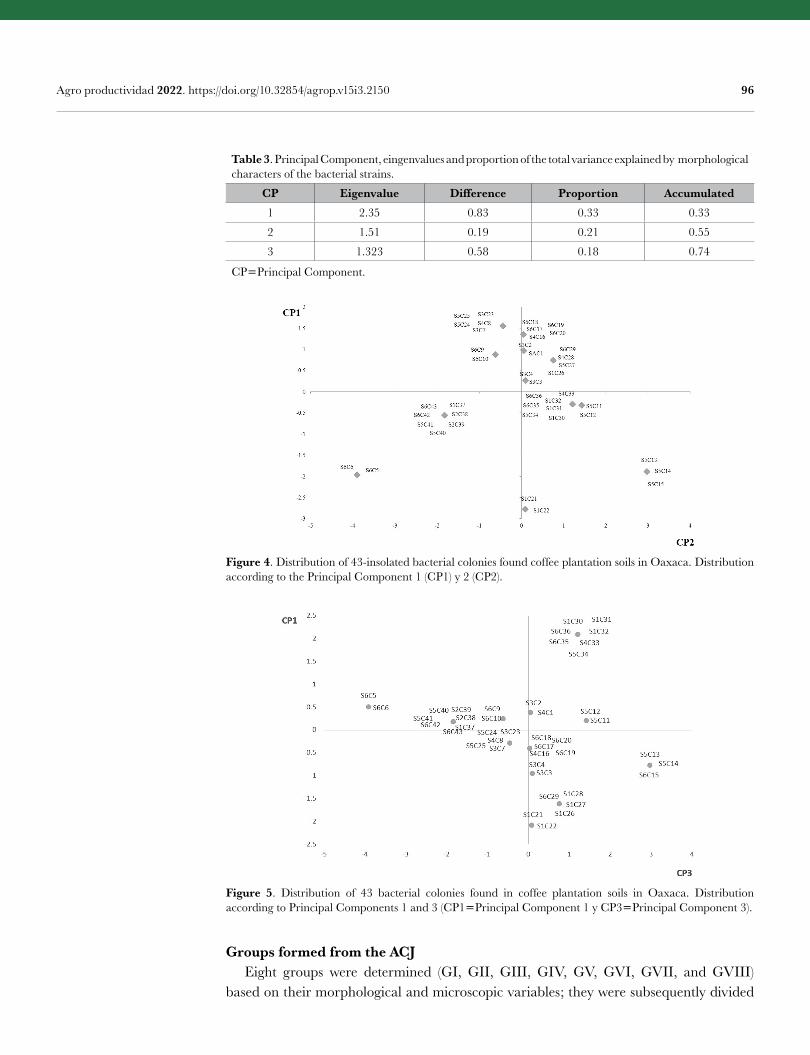
96 Agro productividad 2022. https://doi.org/10.32854/agrop.v15i3.2150
Table 3. Principal Component, eingenvalues and proportion of the total variance explained by morphological characters of the bacterial strains.
CP Eigenvalue Difference Proportion Accumulated1 2.35 0.83 0.33 0.33
2 1.51 0.19 0.21 0.55
3 1.323 0.58 0.18 0.74
CPPrincipal Component.
Figure 5. Distribution of 43 bacterial colonies found in coffee plantation soils in Oaxaca. Distribution according to Principal Components 1 and 3 (CP1Principal Component 1 y CP3Principal Component 3).
Figure 4. Distribution of 43-insolated bacterial colonies found coffee plantation soils in Oaxaca. Distribution according to the Principal Component 1 (CP1) y 2 (CP2).
Groups formed from the ACJ Eight groups were determined (GI, GII, GIII, GIV, GV, GVI, GVII, and GVIII) based on their morphological and microscopic variables; they were subsequently divided
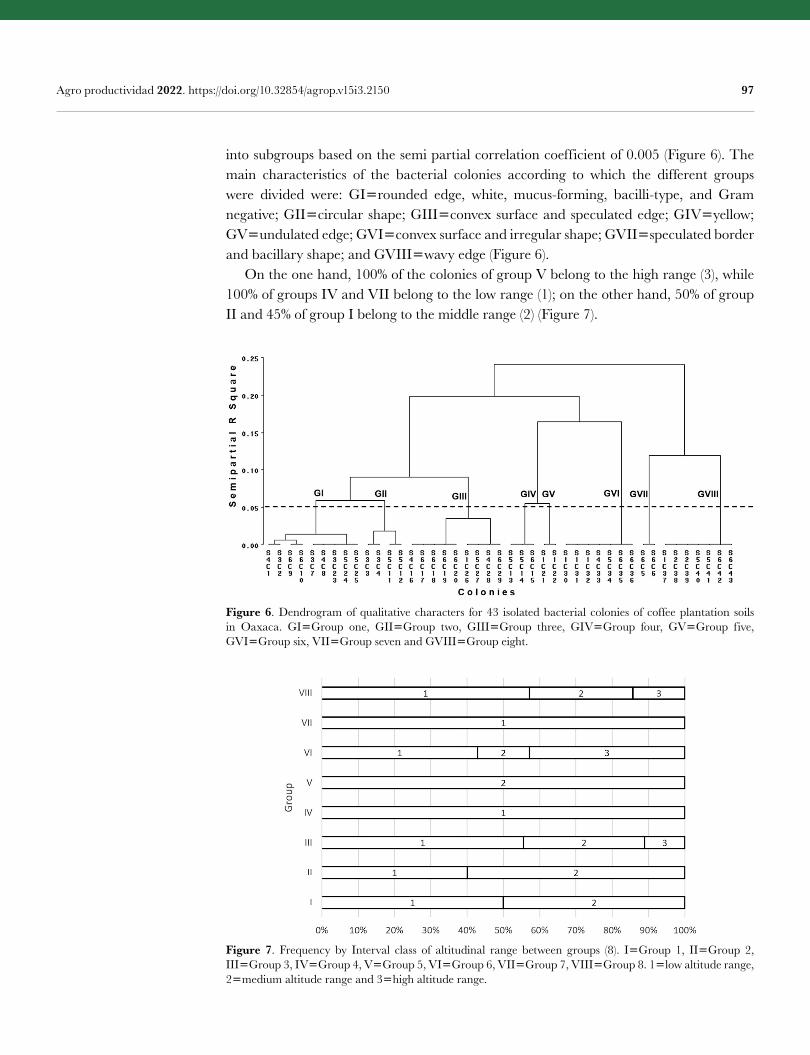
97 Agro productividad 2022. https://doi.org/10.32854/agrop.v15i3.2150
into subgroups based on the semi partial correlation coefficient of 0.005 (Figure 6). The main characteristics of the bacterial colonies according to which the different groups were divided were: GIrounded edge, white, mucus-forming, bacilli-type, and Gram negative; GIIcircular shape; GIIIconvex surface and speculated edge; GIVyellow; GVundulated edge; GVIconvex surface and irregular shape; GVIIspeculated border and bacillary shape; and GVIIIwavy edge (Figure 6). On the one hand, 100% of the colonies of group V belong to the high range (3), while 100% of groups IV and VII belong to the low range (1); on the other hand, 50% of group II and 45% of group I belong to the middle range (2) (Figure 7).
Figure 7. Frequency by Interval class of altitudinal range between groups (8). IGroup 1, IIGroup 2, IIIGroup 3, IVGroup 4, VGroup 5, VIGroup 6, VIIGroup 7, VIIIGroup 8. 1low altitude range, 2medium altitude range and 3high altitude range.
Figure 6. Dendrogram of qualitative characters for 43 isolated bacterial colonies of coffee plantation soils in Oaxaca. GIGroup one, GIIGroup two, GIIIGroup three, GIVGroup four, GVGroup five, GVIGroup six, VIIGroup seven and GVIIIGroup eight.
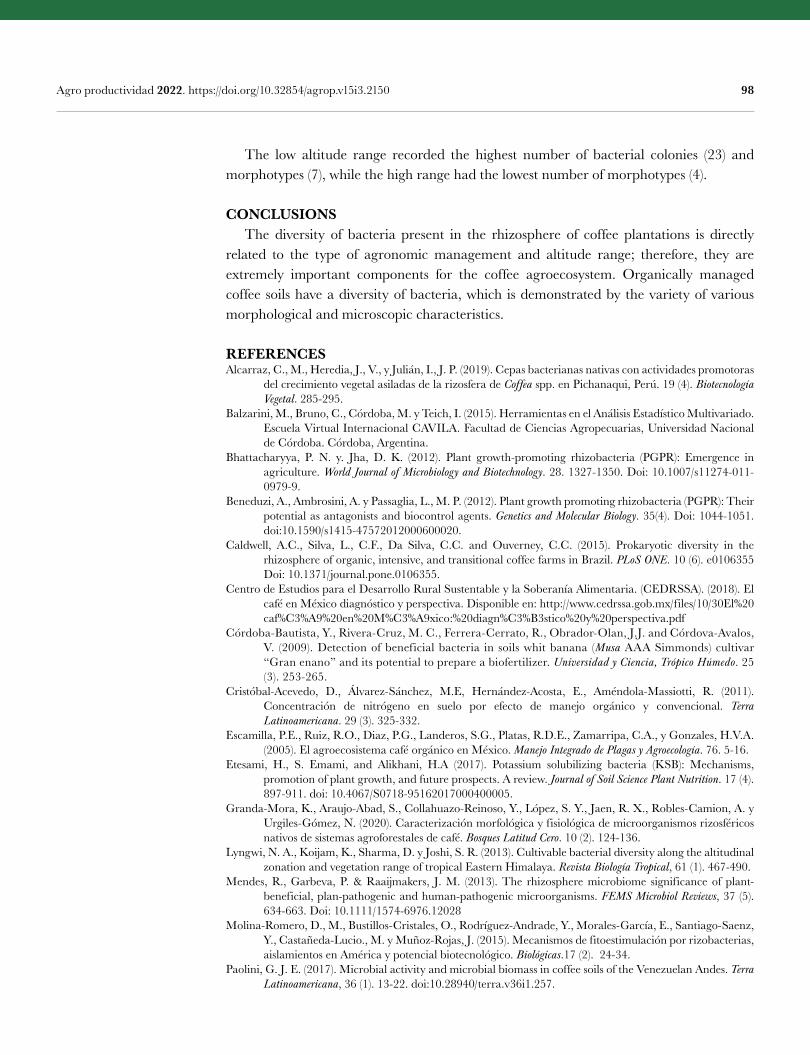
98 Agro productividad 2022. https://doi.org/10.32854/agrop.v15i3.2150
The low altitude range recorded the highest number of bacterial colonies (23) and morphotypes (7), while the high range had the lowest number of morphotypes (4).
CONCLUSIONS The diversity of bacteria present in the rhizosphere of coffee plantations is directly related to the type of agronomic management and altitude range; therefore, they are extremely important components for the coffee agroecosystem. Organically managed coffee soils have a diversity of bacteria, which is demonstrated by the variety of various morphological and microscopic characteristics.
REFERENCESAlcarraz, C., M., Heredia, J., V., y Julián, I., J. P. (2019). Cepas bacterianas nativas con actividades promotoras
del crecimiento vegetal asiladas de la rizosfera de Coffea spp. en Pichanaqui, Perú. 19 (4). Biotecnología Vegetal. 285-295.
Balzarini, M., Bruno, C., Córdoba, M. y Teich, I. (2015). Herramientas en el Análisis Estadístico Multivariado. Escuela Virtual Internacional CAVILA. Facultad de Ciencias Agropecuarias, Universidad Nacional de Córdoba. Córdoba, Argentina.
Bhattacharyya, P. N. y. Jha, D. K. (2012). Plant growth-promoting rhizobacteria (PGPR): Emergence in agriculture. World Journal of Microbiology and Biotechnology. 28. 1327-1350. Doi: 10.1007/s11274-011-0979-9.
Beneduzi, A., Ambrosini, A. y Passaglia, L., M. P. (2012). Plant growth promoting rhizobacteria (PGPR): Their potential as antagonists and biocontrol agents. Genetics and Molecular Biology. 35(4). Doi: 1044-1051. doi:10.1590/s1415-47572012000600020.
Caldwell, A.C., Silva, L., C.F., Da Silva, C.C. and Ouverney, C.C. (2015). Prokaryotic diversity in the rhizosphere of organic, intensive, and transitional coffee farms in Brazil. PLoS ONE. 10 (6). e0106355 Doi: 10.1371/journal.pone.0106355.
Centro de Estudios para el Desarrollo Rural Sustentable y la Soberanía Alimentaria. (CEDRSSA). (2018). El café en México diagnóstico y perspectiva. Disponible en: http://www.cedrssa.gob.mx/files/10/30El%20caf%C3%A9%20en%20M%C3%A9xico:%20diagn%C3%B3stico%20y%20perspectiva.pdf
Córdoba-Bautista, Y., Rivera-Cruz, M. C., Ferrera-Cerrato, R., Obrador-Olan, J.J. and Córdova-Avalos, V. (2009). Detection of beneficial bacteria in soils whit banana (Musa AAA Simmonds) cultivar “Gran enano” and its potential to prepare a biofertilizer. Universidad y Ciencia, Trópico Húmedo. 25 (3). 253-265.
Cristóbal-Acevedo, D., Álvarez-Sánchez, M.E, Hernández-Acosta, E., Améndola-Massiotti, R. (2011). Concentración de nitrógeno en suelo por efecto de manejo orgánico y convencional. Terra Latinoamericana. 29 (3). 325-332.
Escamilla, P.E., Ruiz, R.O., Diaz, P.G., Landeros, S.G., Platas, R.D.E., Zamarripa, C.A., y Gonzales, H.V.A. (2005). El agroecosistema café orgánico en México. Manejo Integrado de Plagas y Agroecología. 76. 5-16.
Etesami, H., S. Emami, and Alikhani, H.A (2017). Potassium solubilizing bacteria (KSB): Mechanisms, promotion of plant growth, and future prospects. A review. Journal of Soil Science Plant Nutrition. 17 (4). 897-911. doi: 10.4067/S0718-95162017000400005.
Granda-Mora, K., Araujo-Abad, S., Collahuazo-Reinoso, Y., López, S. Y., Jaen, R. X., Robles-Camion, A. y Urgiles-Gómez, N. (2020). Caracterización morfológica y fisiológica de microorganismos rizosféricos nativos de sistemas agroforestales de café. Bosques Latitud Cero. 10 (2). 124-136.
Lyngwi, N. A., Koijam, K., Sharma, D. y Joshi, S. R. (2013). Cultivable bacterial diversity along the altitudinal zonation and vegetation range of tropical Eastern Himalaya. Revista Biología Tropical, 61 (1). 467-490.
Mendes, R., Garbeva, P. & Raaijmakers, J. M. (2013). The rhizosphere microbiome significance of plant-beneficial, plan-pathogenic and human-pathogenic microorganisms. FEMS Microbiol Reviews, 37 (5). 634-663. Doi: 10.1111/1574-6976.12028
Molina-Romero, D., M., Bustillos-Cristales, O., Rodríguez-Andrade, Y., Morales-García, E., Santiago-Saenz, Y., Castañeda-Lucio., M. y Muñoz-Rojas, J. (2015). Mecanismos de f itoestimulación por rizobacterias, aislamientos en América y potencial biotecnológico. Biológicas.17 (2). 24-34.
Paolini, G. J. E. (2017). Microbial activity and microbial biomass in coffee soils of the Venezuelan Andes. Terra Latinoamericana, 36 (1). 13-22. doi:10.28940/terra.v36i1.257.
99 Agro productividad 2022. https://doi.org/10.32854/agrop.v15i3.2150
Raaijmakers, J. M., Paulitz, T. C., Steinberg C., Alabouvette C. & Moenne-Loccoz Y. (2009). The rhizosphere: a playground and battlefield for soilborne pathogens and beneficial microorganisms. Plant and Soil. 321, 341–361. doi: 10.1007/s11104-008-9568-6.
Rapidel, B., Allinne, C., Cerdán, C., Meylan, L., Virginio, F. E. M. y Jacques, A. (2015). Efectos ecológicos y productivos del asocio de árboles de sombra con café en sistemas agroforestales. En Montagnini, F., Somarriba, E., Murgueitio, E., Fassola, H. y Eibl, B. (Eds.). Sistemas agroforestales: Funciones productivas, socioeconómicas y ambientales. Cali, Colombia, Turrialba, Costa Rica, CATIE. pp. 5-20.
Román, M. M. L., Mora, A. S. y González, C. G. A. (2016). Sistemas agroforestales con especies de importancia maderable y no maderable, en el trópico seco de México. Avances en investigación Agropecuaria. 20 (2). 53-72.
Sánchez, H. S. y Schewentesius, R. R. E. (2015). Diversidad arbórea en cafetales de San Vicente Yogondoy, Pochutla Oaxaca. Revista de Geografía Agrícola. 54. 25-34.
Servicio de Información Agroalimentaria y Pesquera (SIAP). (2021). Cierre de la producción agrícola por cultivo 2016. Avance de siembras y cosechas por cultivo
Velasco-Jiménez, A., Castellanos-Hernández, O., Acevedo-Hernández, G., Aarland, R. C. y Rodríguez-Sahagún, A. (2020). Bacterias rizosféricas con beneficios potenciales en la agricultura. Terra Latinoamericana. 38 (2). 333-345. doi:10.28940/terra.v38i2.470.
Waksman, S. A. (1927). Principles of soil microbiology. Baltimore MD, USA: The Williams and Wilkins Company.

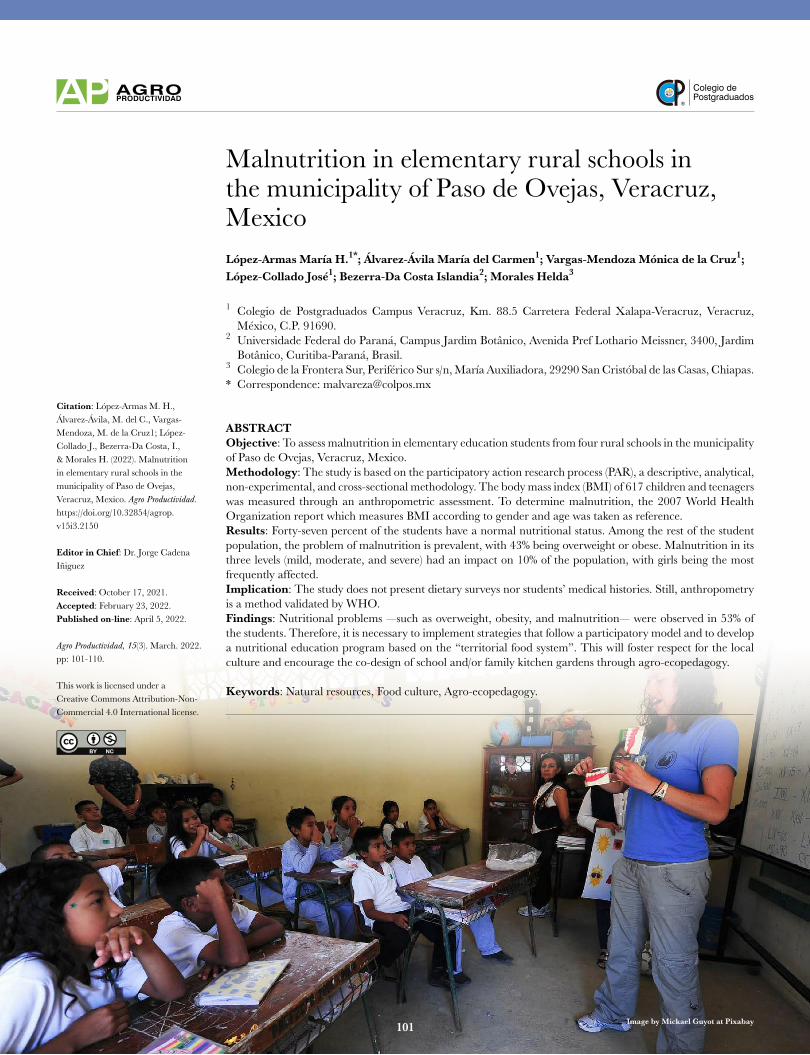
Colegio dePostgraduados
101
Malnutrition in elementary rural schools in the municipality of Paso de Ovejas, Veracruz, MexicoLópez-Armas María H.1*; Álvarez-Ávila María del Carmen1; Vargas-Mendoza Mónica de la Cruz1; López-Collado José1; Bezerra-Da Costa Islandia2; Morales Helda3
1 Colegio de Postgraduados Campus Veracruz, Km. 88.5 Carretera Federal Xalapa-Veracruz, Veracruz, México, C.P. 91690.
2 Universidade Federal do Paraná, Campus Jardim Botânico, Avenida Pref Lothario Meissner, 3400, Jardim Botânico, Curitiba-Paraná, Brasil.
3 Colegio de la Frontera Sur, Periférico Sur s/n, María Auxiliadora, 29290 San Cristóbal de las Casas, Chiapas.* Correspondence: [email protected]
ABSTRACTObjective: To assess malnutrition in elementary education students from four rural schools in the municipality of Paso de Ovejas, Veracruz, Mexico.Methodology: The study is based on the participatory action research process (PAR), a descriptive, analytical, non-experimental, and cross-sectional methodology. The body mass index (BMI) of 617 children and teenagers was measured through an anthropometric assessment. To determine malnutrition, the 2007 World Health Organization report which measures BMI according to gender and age was taken as reference.Results: Forty-seven percent of the students have a normal nutritional status. Among the rest of the student population, the problem of malnutrition is prevalent, with 43% being overweight or obese. Malnutrition in its three levels (mild, moderate, and severe) had an impact on 10% of the population, with girls being the most frequently affected.Implication: The study does not present dietary surveys nor students’ medical histories. Still, anthropometry is a method validated by WHO.Findings: Nutritional problems —such as overweight, obesity, and malnutrition— were observed in 53% of the students. Therefore, it is necessary to implement strategies that follow a participatory model and to develop a nutritional education program based on the “territorial food system”. This will foster respect for the local culture and encourage the co-design of school and/or family kitchen gardens through agro-ecopedagogy.
Keywords: Natural resources, Food culture, Agro-ecopedagogy.
Citation: López-Armas M. H., Álvarez-Ávila, M. del C., Vargas-Mendoza, M. de la Cruz1; López-Collado J., Bezerra-Da Costa, I., & Morales H. (2022). Malnutrition in elementary rural schools in the municipality of Paso de Ovejas, Veracruz, Mexico. Agro Productividad. https://doi.org/10.32854/agrop.v15i3.2150
Editor in Chief: Dr. Jorge Cadena Iñiguez
Received: October 17, 2021.Accepted: February 23, 2022.Published on-line: April 5, 2022.
Agro Productividad, 15(3). March. 2022. pp: 101-110.
This work is licensed under a Creative Commons Attribution-Non-Commercial 4.0 International license.
Image by Mickael Guyot at Pixabay 101
102 Agro productividad 2022. https://doi.org/10.32854/agrop.v15i3.2150
INTRODUCTION The Food and Agriculture Organization of the United Nations (FAO, 2014) defines malnutrition as the abnormal physiological condition caused by an unbalanced (insufficient or excessive) intake of macronutrients (carbohydrates, proteins, and fats) and micronutrients (vitamins and minerals), which are essential for growth and physical and cognitive development in human beings (FAO, 2014, p. 1). Malnutrition and overweight are consequently linked to food insecurity (Rodríguez et al. 2018). These nutritional problems constitute a major public health challenge, in particular obesity, which has been declared a global pandemic. Moreover, in its report on food and nutrition security, FAO (2019) points out that no region is free of overweight and obesity, as a consequence of the consumption of food with little nutritional value. Children of elementary school age constitute the most vulnerable population (FAO, FIDA, OMS, PMA, and UNICEF, 2019). According to the Instituto Nacional de Salud Pública (INSP) and UNICEF Mexico (2016), malnutrition has a severely negative impact on the quality of life and life expectancy of children and teenagers. Child malnutrition (short stature and an inadequate development of the immune system) can be observed in the southern states of Mexico, mostly in rural communities where indigenous households are the most vulnerable. Meanwhile, overweight and obesity are prevalent in urban communities of the northern states, which puts children at risk of developing diabetes, as well as circulatory, heart or kidney problems (INSP and UNICEF, 2016). Mexico ranks first in child obesity worldwide. The most recent records indicate that 33.2% of children between 6 and 11 years old are overweight and/or obese, while 36.3% of teenagers between 12 and 19 years of age have this same problem (ENSANUT, 2016). All this seems to confirm that there is a deficient use of natural resources or a lack of knowledge regarding high protein value food that children must and can include in their diet (Burgess and Dean, 1963). Although Mexico is a megadiverse country with a high number of native species and ecosystems (CONABIO, 2008), its children and teenagers continue to present nutritional deficiencies (overweight and obesity) (ENSANUT, 2012). This situation also holds true for the state of Veracruz, which is located in a geographical environment rich in natural resources. This overview shows that malnutrition is a serious problem that endangers the survival and health of child population in this area, and also that the implementation of public food policies that seek to attain food security have not reached their goals so far. Corzo (2020) observes that successful policies have two basic characteristics: 1) objectives informed by public interest; and 2) a basis in research processes that involve the use of methodology. It is important to make a timely and appropriate diagnosis, one that provides useful results for the design of strategies that may reduce malnutrition and food problems and help fulfill the goals of governmental interventions. In order to understand the issue at hand on a local level, we evaluated malnutrition among elementary education students in four rural schools in the municipality of Paso de Ovejas, Veracruz, Mexico.
103 Agro productividad 2022. https://doi.org/10.32854/agrop.v15i3.2150
MATERIALS AND METHODS This research is based on the participatory action research process (Balcazar, 2003), a descriptive, analytical, non-experimental, and cross-sectional methodology. The study was carried out with the participation of four elementary schools located in the rural communities of Puente Jula, Plan de Manantial, Bandera de Juárez, and Cerro Guzmán, all of them located in the municipality of Paso de Ovejas, Veracruz. We worked with an enrollment of 617 students, including 6- to 12-year-old boys and girls from first to sixth grades, and 12- to 15-year-old teenagers from first to third grade of secondary school. To determine the nutritional status, an anthropometric assessment was carried out in coordination with trained personnel from the Facultad de Nutrición of the Universidad Veracruzana. The children’s physical dimensions were measured to obtain their BMI with the following formula: BMIWeight (kg)/[Height (m)]2 (Kaufer and Toussaint, 2008). The nutritional status classification indicators are: normal, overweight, obesity, mild malnutrition, moderate malnutrition, and severe malnutrition (OMS, 2007; quoted in FANTA, 2013, p. 6, 7). These indicators were obtained by comparing the BMI results with the scale proposed by the World Health Organization in 2007, specifically for girls and boys aged 6 to 18 years old. Data were managed using Microsoft Office Excel 2016, with descriptive statistics of the variables considered in the study. Subsequently, numerical and percentage results were generated, along with comparative graphics.
RESULTS AND DISCUSSION The 617 students were distributed according to their gender (51% male and 49% female). In three of the schools, the disparity between both genders is minimal, while in the Úrsulo Galván elementary school there is a higher prevalence of boys. It is important to note that education is not only a right, but also a fundamental asset to promote health care among students (both male and female), since it encourages access to information, development of skills, and empowerment (De Vincezi and Tedesco, 2009, p.1). However, the education of women brings about the benefit of better care for families, since educated women can champion proper hygiene and a healthy diet (Hill and King, 1955, p.25). After assessing the state of malnutrition, the results were classified into the following categories: normal, overweight, obesity, mild malnutrition, moderate malnutrition, and severe malnutrition. The normal indicator has a frequency of 294 cases (Figure 1) that correspond to 48% of the total population evaluated. Normal weight had a majority distribution of 27% among boys and 21% among girls. The highest incidence of normal weight was registered in boys and 6-, 7-, 9-, and 13-year-old girls. According to these results, more than 50% of the children present malnutrition problems; therefore, cases with overweight, obesity, and malnutrition indicators should be kept in mind. A good immune system should be the mark of the early years of life, increasing the chances of child survival and protecting a person throughout their life. Therefore, keeping a balanced diet and exercising are important for health care, since this combination creates a “state of complete well-being: physical, mental, and social” (UNICEF, 2019, p.14). Regarding the overweight indicator (Figure 2), 167 cases (27%) were observed, 99 of which correspond to girls (16%) and 68 to boys (11%). At the Tomasa Valdés Viuda de
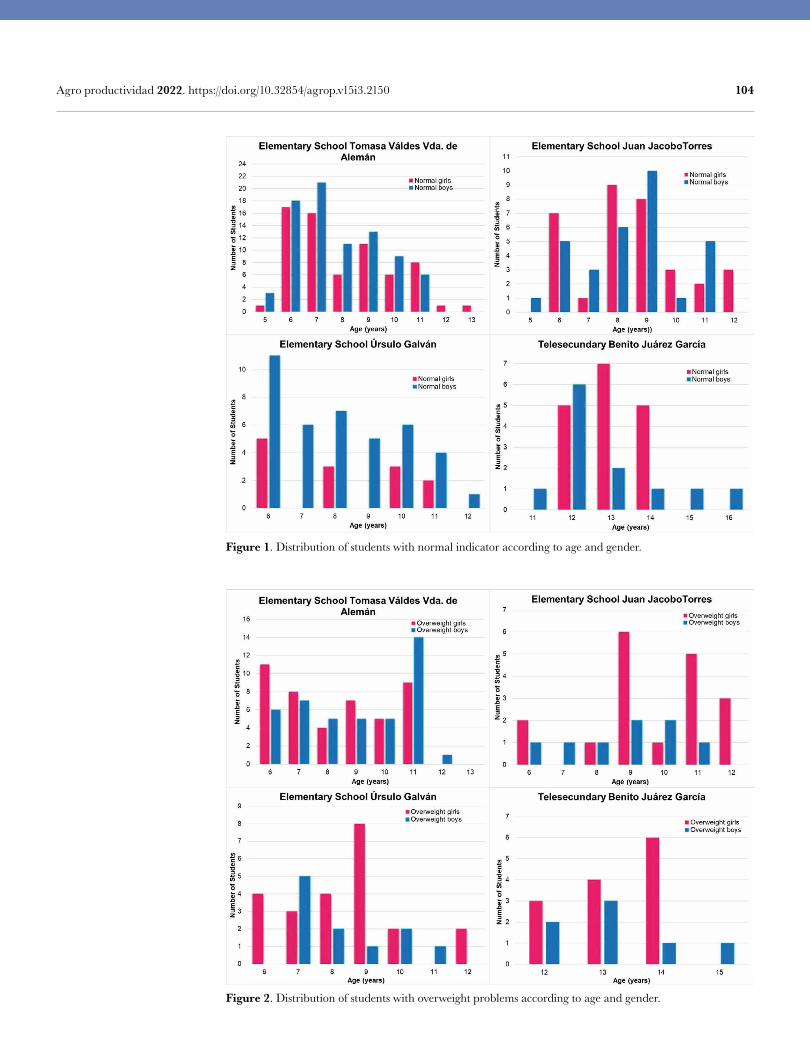
104 Agro productividad 2022. https://doi.org/10.32854/agrop.v15i3.2150
Figure 2. Distribution of students with overweight problems according to age and gender.
Figure 1. Distribution of students with normal indicator according to age and gender.
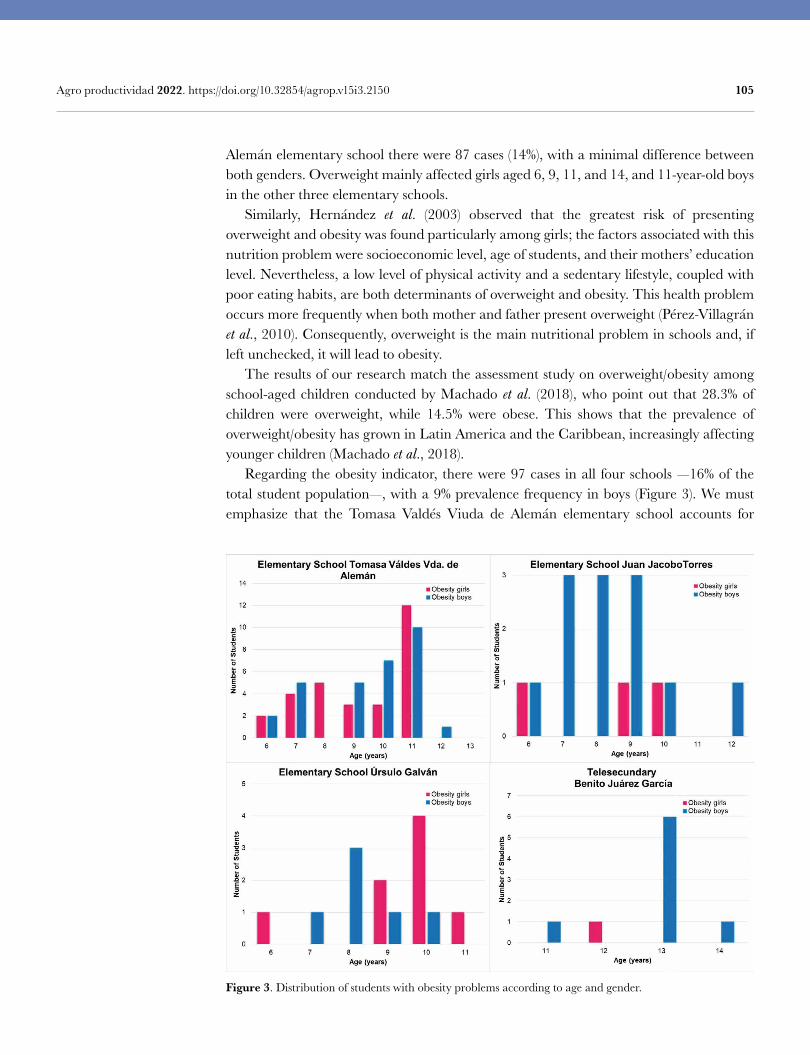
105 Agro productividad 2022. https://doi.org/10.32854/agrop.v15i3.2150
Alemán elementary school there were 87 cases (14%), with a minimal difference between both genders. Overweight mainly affected girls aged 6, 9, 11, and 14, and 11-year-old boys in the other three elementary schools. Similarly, Hernández et al. (2003) observed that the greatest risk of presenting overweight and obesity was found particularly among girls; the factors associated with this nutrition problem were socioeconomic level, age of students, and their mothers’ education level. Nevertheless, a low level of physical activity and a sedentary lifestyle, coupled with poor eating habits, are both determinants of overweight and obesity. This health problem occurs more frequently when both mother and father present overweight (Pérez-Villagrán et al., 2010). Consequently, overweight is the main nutritional problem in schools and, if left unchecked, it will lead to obesity. The results of our research match the assessment study on overweight/obesity among school-aged children conducted by Machado et al. (2018), who point out that 28.3% of children were overweight, while 14.5% were obese. This shows that the prevalence of overweight/obesity has grown in Latin America and the Caribbean, increasingly affecting younger children (Machado et al., 2018). Regarding the obesity indicator, there were 97 cases in all four schools —16% of the total student population—, with a 9% prevalence frequency in boys (Figure 3). We must emphasize that the Tomasa Valdés Viuda de Alemán elementary school accounts for
Figure 3. Distribution of students with obesity problems according to age and gender.
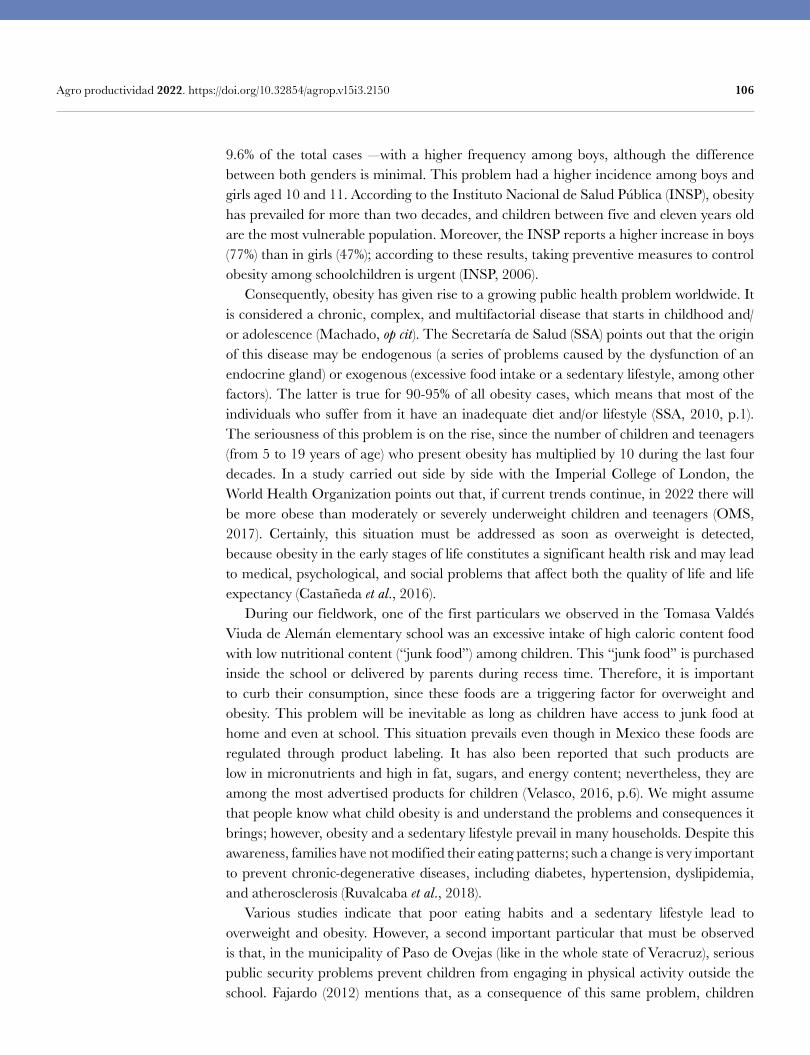
106 Agro productividad 2022. https://doi.org/10.32854/agrop.v15i3.2150
9.6% of the total cases —with a higher frequency among boys, although the difference between both genders is minimal. This problem had a higher incidence among boys and girls aged 10 and 11. According to the Instituto Nacional de Salud Pública (INSP), obesity has prevailed for more than two decades, and children between five and eleven years old are the most vulnerable population. Moreover, the INSP reports a higher increase in boys (77%) than in girls (47%); according to these results, taking preventive measures to control obesity among schoolchildren is urgent (INSP, 2006). Consequently, obesity has given rise to a growing public health problem worldwide. It is considered a chronic, complex, and multifactorial disease that starts in childhood and/or adolescence (Machado, op cit). The Secretaría de Salud (SSA) points out that the origin of this disease may be endogenous (a series of problems caused by the dysfunction of an endocrine gland) or exogenous (excessive food intake or a sedentary lifestyle, among other factors). The latter is true for 90-95% of all obesity cases, which means that most of the individuals who suffer from it have an inadequate diet and/or lifestyle (SSA, 2010, p.1). The seriousness of this problem is on the rise, since the number of children and teenagers (from 5 to 19 years of age) who present obesity has multiplied by 10 during the last four decades. In a study carried out side by side with the Imperial College of London, the World Health Organization points out that, if current trends continue, in 2022 there will be more obese than moderately or severely underweight children and teenagers (OMS, 2017). Certainly, this situation must be addressed as soon as overweight is detected, because obesity in the early stages of life constitutes a significant health risk and may lead to medical, psychological, and social problems that affect both the quality of life and life expectancy (Castañeda et al., 2016). During our fieldwork, one of the first particulars we observed in the Tomasa Valdés Viuda de Alemán elementary school was an excessive intake of high caloric content food with low nutritional content (“junk food”) among children. This “junk food” is purchased inside the school or delivered by parents during recess time. Therefore, it is important to curb their consumption, since these foods are a triggering factor for overweight and obesity. This problem will be inevitable as long as children have access to junk food at home and even at school. This situation prevails even though in Mexico these foods are regulated through product labeling. It has also been reported that such products are low in micronutrients and high in fat, sugars, and energy content; nevertheless, they are among the most advertised products for children (Velasco, 2016, p.6). We might assume that people know what child obesity is and understand the problems and consequences it brings; however, obesity and a sedentary lifestyle prevail in many households. Despite this awareness, families have not modified their eating patterns; such a change is very important to prevent chronic-degenerative diseases, including diabetes, hypertension, dyslipidemia, and atherosclerosis (Ruvalcaba et al., 2018). Various studies indicate that poor eating habits and a sedentary lifestyle lead to overweight and obesity. However, a second important particular that must be observed is that, in the municipality of Paso de Ovejas (like in the whole state of Veracruz), serious public security problems prevent children from engaging in physical activity outside the school. Fajardo (2012) mentions that, as a consequence of this same problem, children
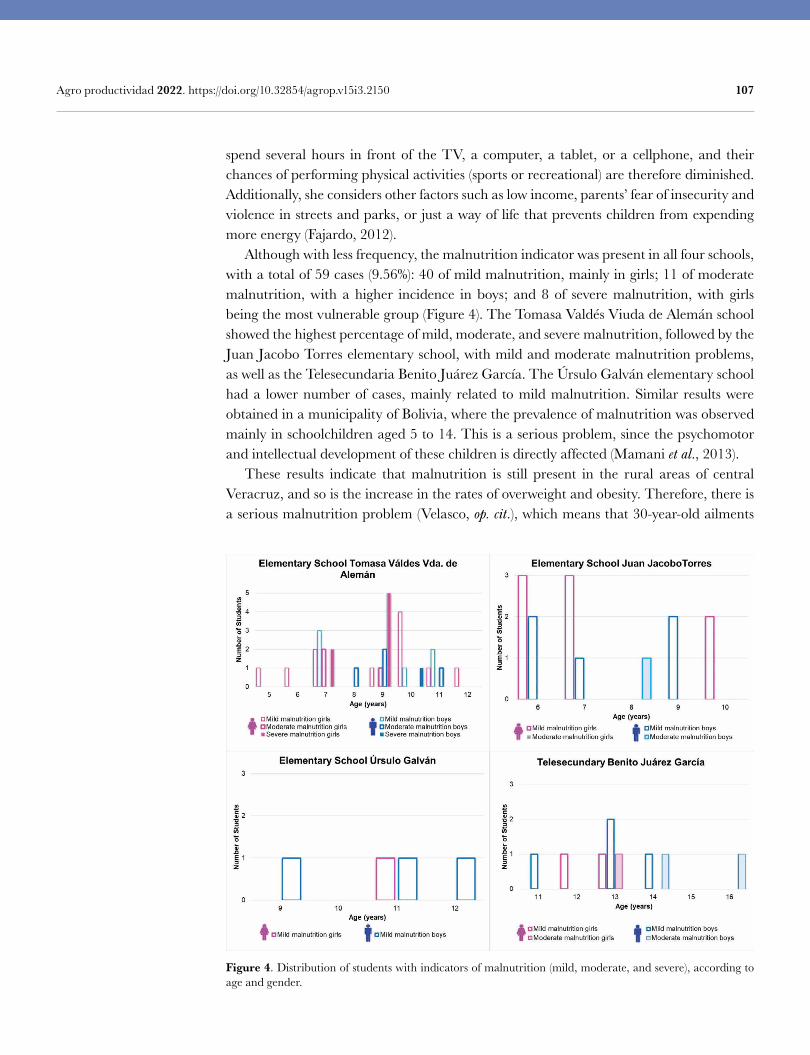
107 Agro productividad 2022. https://doi.org/10.32854/agrop.v15i3.2150
spend several hours in front of the TV, a computer, a tablet, or a cellphone, and their chances of performing physical activities (sports or recreational) are therefore diminished. Additionally, she considers other factors such as low income, parents’ fear of insecurity and violence in streets and parks, or just a way of life that prevents children from expending more energy (Fajardo, 2012). Although with less frequency, the malnutrition indicator was present in all four schools, with a total of 59 cases (9.56%): 40 of mild malnutrition, mainly in girls; 11 of moderate malnutrition, with a higher incidence in boys; and 8 of severe malnutrition, with girls being the most vulnerable group (Figure 4). The Tomasa Valdés Viuda de Alemán school showed the highest percentage of mild, moderate, and severe malnutrition, followed by the Juan Jacobo Torres elementary school, with mild and moderate malnutrition problems, as well as the Telesecundaria Benito Juárez García. The Úrsulo Galván elementary school had a lower number of cases, mainly related to mild malnutrition. Similar results were obtained in a municipality of Bolivia, where the prevalence of malnutrition was observed mainly in schoolchildren aged 5 to 14. This is a serious problem, since the psychomotor and intellectual development of these children is directly affected (Mamani et al., 2013). These results indicate that malnutrition is still present in the rural areas of central Veracruz, and so is the increase in the rates of overweight and obesity. Therefore, there is a serious malnutrition problem (Velasco, op. cit.), which means that 30-year-old ailments
Figure 4. Distribution of students with indicators of malnutrition (mild, moderate, and severe), according to age and gender.
108 Agro productividad 2022. https://doi.org/10.32854/agrop.v15i3.2150
continue to exist, but on an even larger scale, depending on the cultural, economic, social, geographical, and political situation of society (Rodríguez et al., 2018). According to UNICEF (2011), this problem may be rooted in the insufficient food intake (both in quantity and in quality), the lack of health care, the use of unsanitary water and sanitation systems, and poor care and eating practices.
CONCLUSIONS The results of the anthropometric assessment show a higher incidence of overweight and malnutrition in girls, unlike boys, who present more cases of obesity. Based on the previous evidence, the Tomasa Valdés Viuda de Alemán elementary school has the highest population with malnutrition problems. However, the other three schools are not spared from this phenomenon. At recess, children engage in an excessive intake of ultra-processed foods with high caloric content and low nutritional value; this indicates that the situation is probably caused by an unbalanced diet coupled with a sedentary lifestyle. These results allow us to determine the relevance of the problem and to seek alternatives in order to improve food and nutrition security conditions for children and teenagers. The said alternatives should be coupled with a transdisciplinary intervention with a bottom-up approach, based on participatory action research (PAR). An alternative aimed to improve these conditions is the creation of school kitchen gardens, which constitute an educational strategy to fight hunger and poor eating habits, in addition to being an initiative that is legally grounded at the international level by FAO (2005). In practice, these may be spaces where agro-ecopedagogy plays an important role in the improvement of food security conditions and the protection of the environment through a sustainable management of natural resources. Finally, we propose the elaboration of healthy menus based on school kitchen garden and regional products, in addition to encouraging physical activity. Teachers, parents, and students should be involved in this process in order to promote proper eating habits.
ACKNOWLEDGEMENTS We express our gratitude to Mr. Antonio Diaz Vega (ScD), who is responsible for the community
development educational experience of the Facultad de Nutrición de la Universidad Veracruzana and to his
team of nutritionists. We are also grateful for the collaboration of the principals, teachers, parents, and students
of the participant schools.
REFERENCESBalcazar, F. E. (2003). Investigación acción participativa (IAP): Aspectos conceptuales y dificultades de
implementación. Fundamentos en humanidades, 4 (7-8), 59-77.Burgess, A., & Dean, R. F. (1963). La malnutrición y los hábitos alimentarios; informe de una conferencia
internacional e interprofesional. OPS. Publicación Científica No. 91.204 pp.Castañeda-Castaneira, E., Ortiz-Pérez, H., Robles-Pinto, G., & Molina-Frechero, N. (2016). Consumo de
alimentos chatarra y estado nutricio en escolares de la Ciudad de México. Revista Mexicana de pediatría, 83(1), 15-19. Doi: 10.15174/au.2020.2634
CONABIO. 2008. Capital natural de México, vol. I: Conocimiento actual de la biodiversidad. Comisión Nacional para el Conocimiento y Uso de la Biodiversidad, México. Disponible en: biodiversidad.gob.mx/janium/Documentos/6456.pdf
109 Agro productividad 2022. https://doi.org/10.32854/agrop.v15i3.2150
Corzo, J. F. (2020). Diseño de Políticas Públicas 4° Edición: Una guía práctica para transformar ideas en proyectos viables. IEXE editorial. p.82.
De Vincezi, A., & Tedesco, F. (2009). La educación como proceso de mejoramiento de la calidad de vida de los individuos y de la comunidad. Revista iberoamericana de Educación, 49(7). 12 pp.
ENSANUT, (2012). Resultados por entidad federativa. Veracruz. Instituto Nacional de Salud Pública, Primera edición electrónica, 2013, 9-111. Disponible en: https://ensanut.insp.mx/informes/Veracruz-OCT.pdf.
ENSANUT, (2016). Encuesta Nacional de Salud y Nutrición de Medio Camino 2016. 5-145. Disponible en: https://www.gob.mx/cms/uploads/attachment/file/209093/ENSANUT.pdf
Fajardo Bonilla, E. (2012). Obesidad infantil: otro problema de malnutrición. Revista Med, 20(1). Universidad Militar Nueva Granada Bogotá. 6-8. Doi: 10.18359/rmed.1195
FANTA. (2013). Tablas de IMC y tablas de IMC para la edad, de niños(as) y adolescentes de 5 a 18 años de edad y tablas de IMC para adultos(as) no embarazadas, no lactantes 19 años de edad. Food and Nutrition Technical Assistance (USAID From the American People), 1-12. Disponible en: https://www.fantaproject.org/sites/default/files/resources/FANTA-BMI-charts-Enero2013-ESPANOL_2010.pdf
FAO. (2014). Segunda Conferencia Internacional sobre Nutrición: Por qué la nutrición es importante. Disponible en: http://www.fao.org/about/meetings/icn2/photo-contest/why-nutrition-matters/es/
FAO, FIDA, OMS, PMA, y UNICEF. (2019). El estado de la seguridad alimentaria y la nutrición en el mundo 2019: Protegerse frente a la desaceleración y el debilitamiento de la economía. Roma, FAO, 1-206. Disponible en: https://reliefweb.int/sites/reliefweb.int/files/resources/ca5162es.pdf
Hernández, B., Cuevas-Nasu, L., Shamah-Levy, T., Monterrubio, E. A., Ramírez-Silva, C. I., García-Feregrino, R., Rivera, J. A., & Sepúlveda-Amor, J. (2003). Factors associated with overweight and obesity in Mexican school-age children: Results from the National Nutrition Survey 1999. Salud Pública de México, 45 (4). 551-557.
Hill, M. A., & King, E. (1995). Women’s education and economic well-being. Feminist Economics, 1(2). 21-46. Doi: 10.1080/714042230
Instituto Nacional de Seguridad Publica (INSP). (2006). Obesidad Infantil. Boletin de Práctica Médica Efectiva. Instituto Nacional de la Salud Pública. Disponible en: https://www.insp.mx/images/stories/Centros/nucleo/docs/pme_14.pdf
INSP y UNICEF México (2016). Encuesta Nacional de Niños, Niñas y Mujeres. 521 p. Disponible en: https://www.unicef.org/mexico/media/1001/file/UNICEF_ENIM2015.pdf
Machado, K., Gil, P., Ramos, I., y Pírez, C. (2018). Sobrepeso/obesidad en niños en edad escolar y sus factores de riesgo. Archivos de Pediatría del Uruguay, 89, 16-25.
Mamani-Ortiz, Y., Rojas-Salazar, E. G., Caero-Suarez, R. I., y Choque-Ontiveros, M. d. C. (2013). Prevalencia de desnutrición en niños y niñas en edad escolar del municipio de Vinto. Revista Médico-Científica “Luz y Vida”, Vol. 4 (1). 36-40.
OMS. (2017). La obesidad entre los niños y los adolescentes se ha multiplicado por 10 en los cuatro últimos decenios. Disponible en: https://www.who.int/end-childhood-obesity/es/
Pérez-Villagrán, S., Rodríguez-Martín, A., Ruiz-Novalbos, J., Nieto-Martínez, J., y Campoy-Lechuga, J. (2010). Hábitos y estilos de vida modificables en niños con sobrepeso y obesidad. Nutr Hosp, 25(5), 823-831. DOI:10.3305/nh.2010.25.5.4683
Rodríguez Orozco, C. L., Muñiz Granoble, G. J., y Sanchez Hernández, C. A. (2018). La salud nutricional escolar y los cuidados de enfermería. RECIMUNDO, 2(3), 422-438. Doi: 10.26820/recimundo/2.(3).julio.2018.422-438
Ruvalcaba Ledezma, J. C., Hernández Barrera, J., García Díaz, J. R., Lozano Jaén, A., Morales García, L. I., Hernández Medina, M. S., Islas Vega, I., Rivera Gómez, M., y Reynoso Vázquez, J. (2018). Factores desencadenantes de obesidad infantil, un problema de salud pública. JONNPR, 3(8), 614-626. doi:10.19230/jonnpr.2542
SSA. (2010). Obesidad en México: Primera Parte. Sistema Nacional de Vigilancia Epidemiológica. Sistema Único de Información. México, 27, Núm.43., 1-28. Disponible en: https://www.gob.mx/cms/uploads/attachment/file/13056/sem13043.pdf
Rodríguez Villalobos, M. C., Aguayo-Téllez, E., Van Gameren, E., Caamal-Olvera, C., Islas-Camargo, A., Bohara, A., Herrera-Ramos, M., Flores-Curiel, D., Mendoza Velázquez, A., & Luna-Domínguez, E. (2018). La doble carga de la malnutrición: La inseguridad alimentaria y el sobrepeso en México. In. Aguayo-Téllez, E., Rodríguez Villalobos, M. C. (2018). Economía de la Salud en México. Pearson Educación de México, S.A. de C.V. Delegación Álvaro Obregón, México, Ciudad de México, C. P. 01210. 156 pp.
UNICEF. (2011). La desnutrición infantil: causas, consecuencias y estrategias para su prevención y tratamiento. 3-32. Disponible en: https://www.unicef.es/sites/unicef.es/files/Dossierdesnutricion.pdf
110 Agro productividad 2022. https://doi.org/10.32854/agrop.v15i3.2150
UNICEF. (2019). La Agenda de la Infancia y la Adolescencia 2019-2024. UNICEF Para cada niño, 1-22. Disponible en: https://www.unicef.org/mexico/media/306/file/agenda%320de%320la%320infancia%320y%320la%320adolescencia%202019-202024.pdf
Kaufer-Horwitz, M., & Toussaint, G. (2008). Indicadores antropométricos para evaluar sobrepeso y obesidad en pediatría. Boletín médico del Hospital Infantil de México, 65(6), 502-518.
Velasco Lavín, M. d. R. (2016). La desnutrición y la obesidad: dos problemas de salud que coexisten en México. Revista Mexicana de Pediatría, Vol. 83, No. 1, 5-6. Disponible en: https://www.medigraphic.com/pdfs/pediat/sp-2016/sp2161b.pdf
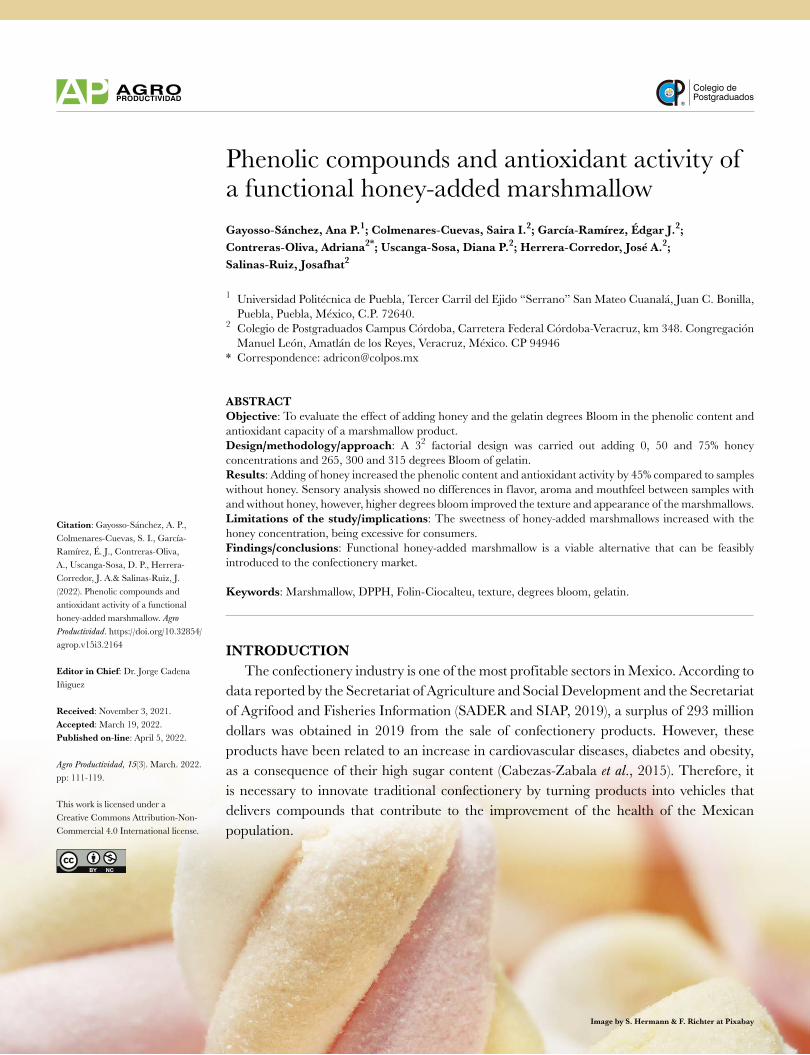
Colegio dePostgraduados
111
Phenolic compounds and antioxidant activity of a functional honey-added marshmallowGayosso-Sánchez, Ana P.1; Colmenares-Cuevas, Saira I.2; García-Ramírez, Édgar J.2; Contreras-Oliva, Adriana2*; Uscanga-Sosa, Diana P.2; Herrera-Corredor, José A.2; Salinas-Ruiz, Josafhat2
1 Universidad Politécnica de Puebla, Tercer Carril del Ejido “Serrano” San Mateo Cuanalá, Juan C. Bonilla, Puebla, Puebla, México, C.P. 72640.
2 Colegio de Postgraduados Campus Córdoba, Carretera Federal Córdoba-Veracruz, km 348. Congregación Manuel León, Amatlán de los Reyes, Veracruz, México. CP 94946
* Correspondence: [email protected]
ABSTRACTObjective: To evaluate the effect of adding honey and the gelatin degrees Bloom in the phenolic content and antioxidant capacity of a marshmallow product.Design/methodology/approach: A 32 factorial design was carried out adding 0, 50 and 75% honey concentrations and 265, 300 and 315 degrees Bloom of gelatin.Results: Adding of honey increased the phenolic content and antioxidant activity by 45% compared to samples without honey. Sensory analysis showed no differences in flavor, aroma and mouthfeel between samples with and without honey, however, higher degrees bloom improved the texture and appearance of the marshmallows. Limitations of the study/implications: The sweetness of honey-added marshmallows increased with the honey concentration, being excessive for consumers.Findings/conclusions: Functional honey-added marshmallow is a viable alternative that can be feasibly introduced to the confectionery market.
Keywords: Marshmallow, DPPH, Folin-Ciocalteu, texture, degrees bloom, gelatin.
INTRODUCTION The confectionery industry is one of the most profitable sectors in Mexico. According to data reported by the Secretariat of Agriculture and Social Development and the Secretariat of Agrifood and Fisheries Information (SADER and SIAP, 2019), a surplus of 293 million dollars was obtained in 2019 from the sale of confectionery products. However, these products have been related to an increase in cardiovascular diseases, diabetes and obesity, as a consequence of their high sugar content (Cabezas-Zabala et al., 2015). Therefore, it is necessary to innovate traditional confectionery by turning products into vehicles that delivers compounds that contribute to the improvement of the health of the Mexican population.
Citation: Gayosso-Sánchez, A. P., Colmenares-Cuevas, S. I., García-Ramírez, É. J., Contreras-Oliva, A., Uscanga-Sosa, D. P., Herrera-Corredor, J. A.& Salinas-Ruiz, J. (2022). Phenolic compounds and antioxidant activity of a functional honey-added marshmallow. Agro Productividad. https://doi.org/10.32854/agrop.v15i3.2164
Editor in Chief: Dr. Jorge Cadena Iñiguez
Received: November 3, 2021.Accepted: March 19, 2022.Published on-line: April 5, 2022.
Agro Productividad, 15(3). March. 2022. pp: 111-119.
This work is licensed under a Creative Commons Attribution-Non-Commercial 4.0 International license.
Image by S. Hermann & F. Richter at Pixabay
112 Agro productividad 2022. https://doi.org/10.32854/agrop.v15i3.2164
On the one hand, marshmallows are aerated confectionery products, with a characteristic foamy structure that is created when air and moisture are incorporated into a syrup mixture. They are composed of a stabilizing agent, a foaming agent, sweeteners, f lavor enhancers and air. Gelatin is the most used stabilizer in marshmallows, because it produces an elastic texture that can be moderated by choosing the degrees bloom (°Bloom) strength. On the other hand, honey is composed of minerals, vitamins, organic acids, proteins, enzymes, and phenolic compounds. The main responsible for the functional properties of honey are phenols, which provide to honey its antioxidant capacity, preventing from cardiovascular diseases and cancer (Viada et al., 2017). Therefore, the objective of this study was to evaluate the effect of the addition of honey and gelatin bloom grades on the total phenolic content (TPC) and total antioxidant activity (TAA) of a marshmallow.
MATERIALS AND METHODS The marshmallows were made with refined sugar (Great Value), glucose syrup (Deiman), 265, 300, and 315 °Bloom gelatin (Progel), egg albumin, and multifloral honey harvested in 2019. The reagents used were: gallic acid (Fermont, Mexico), Na2CO3 (Merck, Germany), 6-hydroxy-2,5,7,8-tetramethylchroman-2-carboxylic acid (Trolox) (Sigma-Aldrich, Russia), 2,2-Diphenyl-1-picryl hydrazyl (DPPH) (Sigma-Aldrich, Germany), and the Folin-Ciocalteu reagent (Sigma-Aldrich, USA).
Determination of honey quality Moisture (AOAC 962.19), ash (AOAC 920.181), hydroxymethylfurfural (HMF) content (AOAC 980.23), total acidity (AOAC 926.19), reducing sugars (NMX-F-274-1984), electrical conductivity (NOM 004-SAG/GAN 2018) and color (Ferreira et al., 2009) were determined using the Pfund scale.
Experimental design A completely randomized design with a 32 factorial structure was used, with honey concentration (0, 50, 75) and gelatin bloom grades (265, 300, and 315) as factors, resulting in a total of nine treatment combinations. The experiment was performed in triplicate and an analysis of variance was performed using the GLIMMIX procedure of SAS.
Marshmallows making To prepare 100 g of marshmallows, 5 mL of egg albumin were beaten in a KSM150PSER mixer (KitchenAid, USA), until stiff peaks were formed; subsequently, caramel (previously prepared with sugar, glucose, and water) was added when it reached a temperature of 121 °C. When the temperature of the mixture dropped to 80 °C, the liquid gelatin was added. In the case of honey-added marshmallows, honey was included after the gelatin had been added, when the mixture had a temperature of 40 °C. All ingredients were beaten at the highest speed (10) of the equipment used. The final mixture was poured into plastic trays with a 3.0-cm-high layer of cornstarch. The cylindrical molds were 2.5 cm wide and 2.0 cm tall. Finally, the marshmallows were covered with
113 Agro productividad 2022. https://doi.org/10.32854/agrop.v15i3.2164
a cornstarch layer and left in the mold for 24 h, packed in cellophane bags and stored at room temperature.
Obtaining extracts To prepare the marshmallow extracts, they were lyophilized with a 9.5101 mm Hg vacuum pressure, at 49 °C for 24 h (Periche et al., 2015). Per each treatment, 2.0 g of lyophilized sample were dissolved with acidified water in a 1:2 ratio (adjusted to pH 2 with 2 N HCl). The solutions were homogenized in a VM-300P vortex mixer (Gemmy, Taiwan) and then they were placed in an ultrasonic bath (Auto-science, Serial Ultrasonic Cleaner, USA) for 30 min. They were allowed to settle for 24 h in the dark, at room temperature. The next day the extracts were centrifuged at 4000 rpm for 20 min, using a Centrifuge 5810 R (Eppendorf, Germany). Each extract was separated from the solid phase by decantation and filtered through cotton. Meanwhile, for honey the extraction procedure was the same used for marshmallows; however, 1 g of honey was weighed to quantify the TPC and 2 g were weighed to determine the TAA. Both samples were dissolved with 10 mL of acidified water.
Total Phenolic Content Quantification The TPC in honey and marshmallows was determined using the Folin-Ciocalteu method, as described by Cedeño-Pinos et al. (2020). The calibration curve was determined using gallic acid as standard. The results were expressed as mg of gallic acid equivalents (EAG)/100 g of sample.
Determination of Total Antioxidant Activity The TAA of marshmallows and honey was determined with the 2,2-Diphenyl-1-picryl hydrazyl (DPPH) synthetic free radical, using the technique implemented by Dżugan et al. (2018). The Trolox compound was used as a standard for the calibration curve. The results were expressed in equivalent mg of Trolox/100 g of sample.
Sensory analysis of marshmallows An acceptance test was performed using a nine-point hedonic scale, ranging from 1) Dislike extremely to 9) Like extremely. The attributes evaluated were appearance, texture, mouthfeel, f lavor, sweetness and aroma (Periche et al., 2015). This analysis was applied to 30 people between 15 and 60 years old, belonging to the community of San José del Corral, Yanga, Veracruz, Mexico. The data obtained were analyzed with the Statgraphics Centurion software, through a multifactorial ANOVA (p0.05).
RESULTS AND DISCUSSIONHoney quality The values of the physicochemical analysis of honey were 226.7 s cm1 (electrical conductivity), 17% (humidity), 0.1% (ash), 19.8 meq kg1 (total acidity), 75.1 (reducing sugars), and 5.6 mg kg1 (hydroxymethylfurfural content). These parameters fell within
114 Agro productividad 2022. https://doi.org/10.32854/agrop.v15i3.2164
the permissible values of the NOM-004-SAG/GAN 2018 standard indicating; honey was suitable for making marshmallows. Regarding color, the honey used in this study had a value of 9.0 mm, which matches the water white color according to the Pfund scale.
Total Phenolic Content and Total Antioxidant Activity in honey The honey used had a TPC of 22.7 mg EAG/100 g of honey and an TAA equivalent to 11.8 mg of trolox/100 g of honey. Several researches correlate the TPC with the color of honey. Sant’Ana et al. (2012) showed that the lowest TPC belongs to white honeys with 63.64 mg EAG/100 g of sample. Pontis et al. (2014) obtained similar data: honeys with lower mm of Pfund had the lowest TPC amount (25 mg EAG/100 g of sample). The honey was stored for four months at room temperature before it was used. Kamal-Eldin and Appelqvist (1996) determined that higher temperatures result in a higher rate of hydroperoxide decomposition, causing an increase in general redox reactions, which probably influences the stability of the antioxidant agents. Šarić et al. (2012) showed that the TPC in acacia and floral honeys decreased 91.8 and 88.6%, respectively, after one year of storage at room temperature. Meanwhile, during processing, the crystallized honey was heated from 38 °C to 42 °C, which could have contributed to the decrease in TPC, since these compounds are susceptible to thermal degradation.
Total Phenolic Content in marshmallows During the storage time, the concentration of the honey and the gelatin bloom grades significantly influenced the TPC of the marshmallows (p0.05), while the treatments without honey (T1-T3) presented a TPC of 5.85-9.07 mg EAG/100 g of marshmallow (Figure 1). This could be caused by the interference of ingredients in the Folin-Ciocalteu assay and not by the presence of phenols. Consequently, gelatin and egg albumin were analyzed and in the latter 1.30 mg EAG/100 mL of albumin was determined. Albumin is a protein that includes amino acid residues such as tryptophan, cysteine, tyrosine and methionine, which can reduce the Folin-Ciocalteu reagent through electron transfer (Elias et al., 2008). Singleton et al. (1999) and other authors showed that reducing sugars, such as glucose and fructose, are involved in the Folin-Ciocalteu assay. During storage time, honey-added marshmallows provided 45% more TPC (10.37-12.82 mg EAG/100 g of marshmallow) than those without honey. There was no significant difference in the TPC between T4-T9 treatments (50 and 75% honey). In addition, these treatments increased the TPC over time. On average, from day 1 to 6 the TPC increased 3.16% and from day 1 to 12 it rose 15.30%. Mandura et al. (2020), Dżugan et al. (2018), and other authors showed that the TPC in candies decreases over time. Therefore, the TPC increase in marshmallows may be the result of the interference of gelatin (made up of 85-92% protein) in the Folin-Ciocalteu reaction: the structure of the gelatin begins to destabilize and fragment into amino acid chains, increasing the number of molecules that interfere with the reaction (Carbajal, 2018).
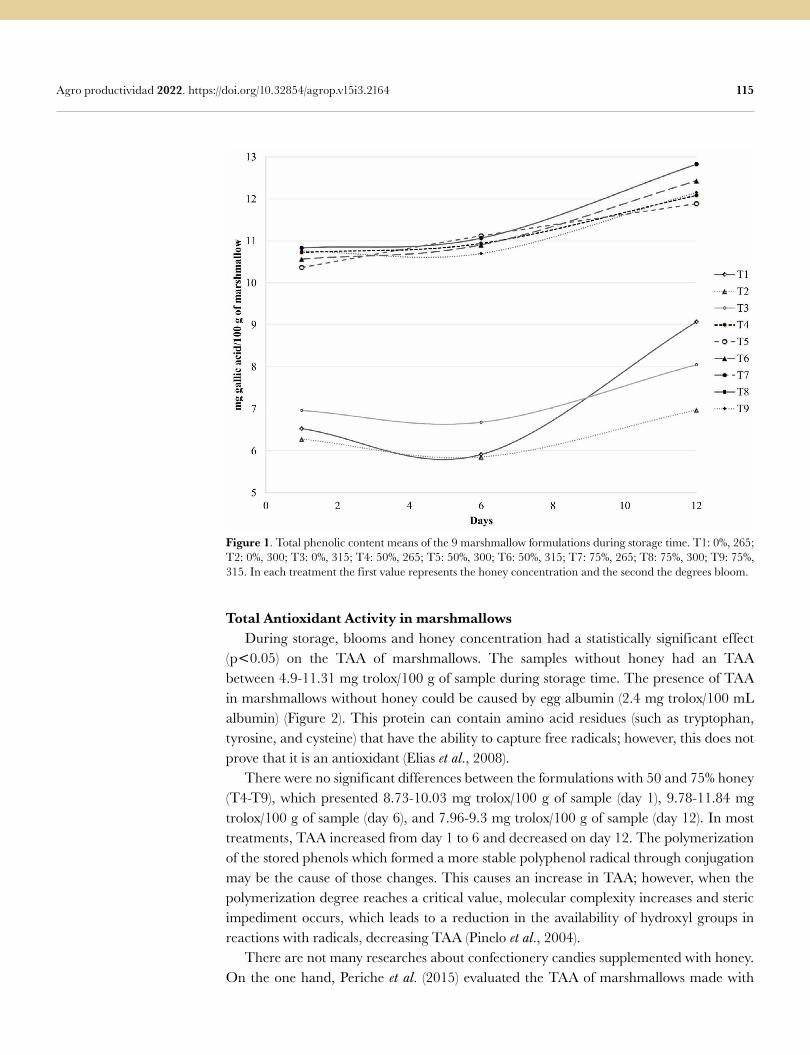
115 Agro productividad 2022. https://doi.org/10.32854/agrop.v15i3.2164
Total Antioxidant Activity in marshmallows During storage, blooms and honey concentration had a statistically significant effect (p0.05) on the TAA of marshmallows. The samples without honey had an TAA between 4.9-11.31 mg trolox/100 g of sample during storage time. The presence of TAA in marshmallows without honey could be caused by egg albumin (2.4 mg trolox/100 mL albumin) (Figure 2). This protein can contain amino acid residues (such as tryptophan, tyrosine, and cysteine) that have the ability to capture free radicals; however, this does not prove that it is an antioxidant (Elias et al., 2008). There were no significant differences between the formulations with 50 and 75% honey (T4-T9), which presented 8.73-10.03 mg trolox/100 g of sample (day 1), 9.78-11.84 mg trolox/100 g of sample (day 6), and 7.96-9.3 mg trolox/100 g of sample (day 12). In most treatments, TAA increased from day 1 to 6 and decreased on day 12. The polymerization of the stored phenols which formed a more stable polyphenol radical through conjugation may be the cause of those changes. This causes an increase in TAA; however, when the polymerization degree reaches a critical value, molecular complexity increases and steric impediment occurs, which leads to a reduction in the availability of hydroxyl groups in reactions with radicals, decreasing TAA (Pinelo et al., 2004). There are not many researches about confectionery candies supplemented with honey. On the one hand, Periche et al. (2015) evaluated the TAA of marshmallows made with
Figure 1. Total phenolic content means of the 9 marshmallow formulations during storage time. T1: 0%, 265; T2: 0%, 300; T3: 0%, 315; T4: 50%, 265; T5: 50%, 300; T6: 50%, 315; T7: 75%, 265; T8: 75%, 300; T9: 75%, 315. In each treatment the first value represents the honey concentration and the second the degrees bloom.
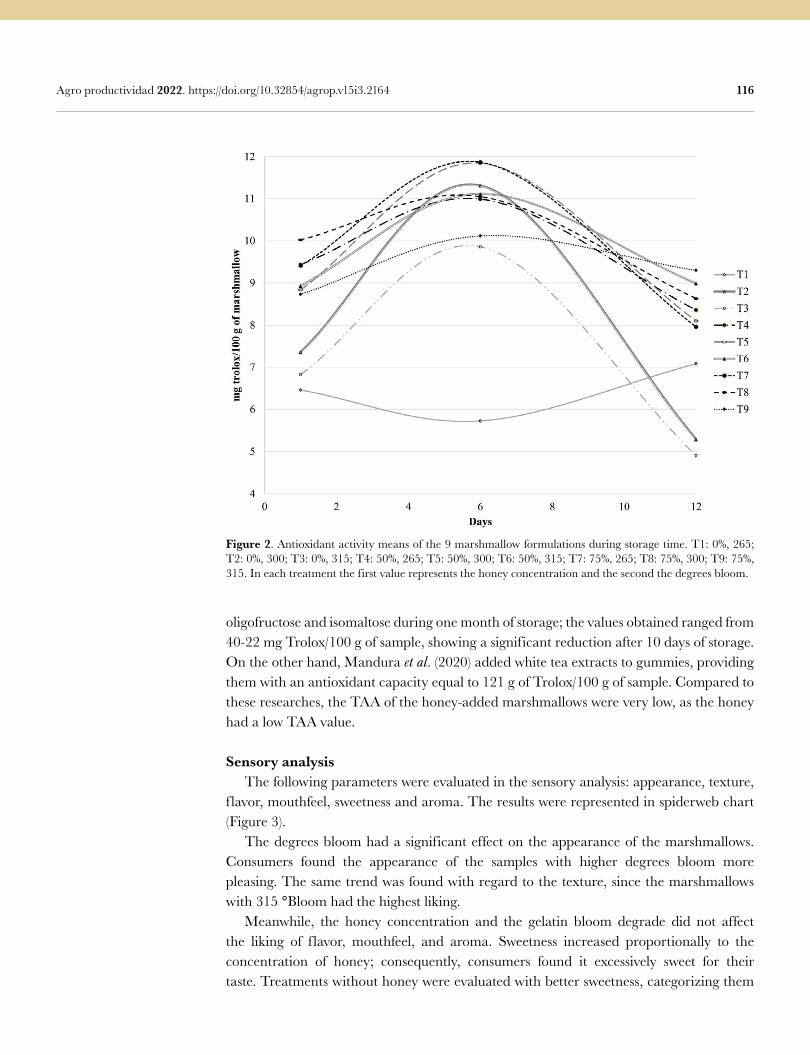
116 Agro productividad 2022. https://doi.org/10.32854/agrop.v15i3.2164
Figure 2. Antioxidant activity means of the 9 marshmallow formulations during storage time. T1: 0%, 265; T2: 0%, 300; T3: 0%, 315; T4: 50%, 265; T5: 50%, 300; T6: 50%, 315; T7: 75%, 265; T8: 75%, 300; T9: 75%, 315. In each treatment the first value represents the honey concentration and the second the degrees bloom.
oligofructose and isomaltose during one month of storage; the values obtained ranged from 40-22 mg Trolox/100 g of sample, showing a significant reduction after 10 days of storage. On the other hand, Mandura et al. (2020) added white tea extracts to gummies, providing them with an antioxidant capacity equal to 121 g of Trolox/100 g of sample. Compared to these researches, the TAA of the honey-added marshmallows were very low, as the honey had a low TAA value.
Sensory analysis The following parameters were evaluated in the sensory analysis: appearance, texture, f lavor, mouthfeel, sweetness and aroma. The results were represented in spiderweb chart (Figure 3). The degrees bloom had a significant effect on the appearance of the marshmallows. Consumers found the appearance of the samples with higher degrees bloom more pleasing. The same trend was found with regard to the texture, since the marshmallows with 315 °Bloom had the highest liking. Meanwhile, the honey concentration and the gelatin bloom degrade did not affect the liking of flavor, mouthfeel, and aroma. Sweetness increased proportionally to the concentration of honey; consequently, consumers found it excessively sweet for their taste. Treatments without honey were evaluated with better sweetness, categorizing them
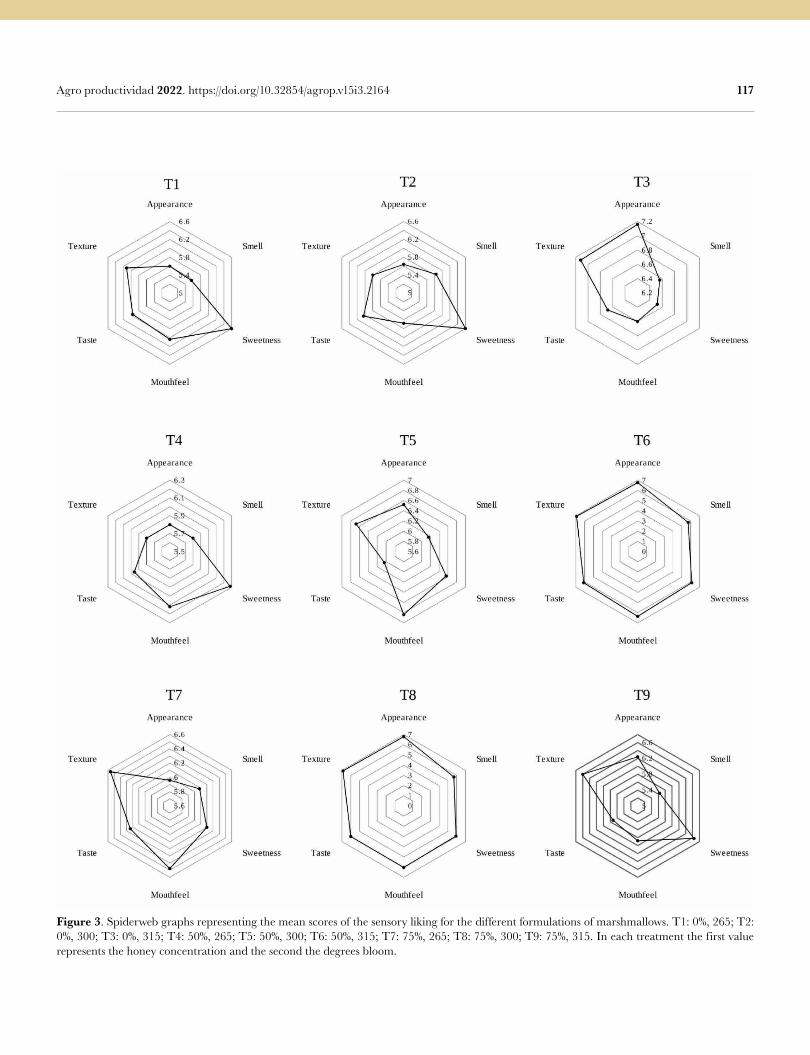
117 Agro productividad 2022. https://doi.org/10.32854/agrop.v15i3.2164
Figure 3. Spiderweb graphs representing the mean scores of the sensory liking for the different formulations of marshmallows. T1: 0%, 265; T2: 0%, 300; T3: 0%, 315; T4: 50%, 265; T5: 50%, 300; T6: 50%, 315; T7: 75%, 265; T8: 75%, 300; T9: 75%, 315. In each treatment the first value represents the honey concentration and the second the degrees bloom.
118 Agro productividad 2022. https://doi.org/10.32854/agrop.v15i3.2164
as “like slightly” (value6). Nevertheless, the most popular treatments regarding most of the parameters evaluated were marshmallows with 50% honey-315 °Bloom and 75% honey-300 °Bloom.
CONCLUSIONS Adding honey to the marshmallows incorporated phenolic compounds into the samples, providing them with antioxidant capacity. There was no difference in phenol content and antioxidant activity between treatments with honey (50 and 75%). Consumers found no difference between marshmallows with and without honey, with the exception of sweetness which was excessive for their flavor in honey-added marshmallows. Additionally, the highest degrees bloom improved the texture and appearance of the samples. Nevertheless, the treatments with honey were generally better qualified and the treatments with 50% honey-315 °Blooms and 75% honey-300 °Blooms had greater acceptance. Therefore, the innovated marshmallows could be well received in the confectionery market.
REFERENCESAssociation of Official Analytical Chemists [AOAC]. (2019). Official Methods of Analysis. 21st ed. Washington,
D.C.Cabezas-Zabala, C. C., Hernández-Torres, B. C., y Vargas-Zárate, M. (2015). Azúcares adicionados a los
alimentos: efectos en la salud y regulación mundial. Revista de la Facultad de Medicina, 64(2), 319-329. DOI: 10.15446/revfacmed.v64n2.52143.
Carbajal, H. M. A. (2018). Rediseño de las columnas de intercambio iónico catiónico en un proceso de producción de grenetina. [Tesina de Licenciatura. Universidad Autónoma del Estado de México].
Cedeño-Pinos, C., Martínez-Tomé, M., Murcia, M. A., Jordán, M. J., y Bañón, S. (2020). Assessment of rosemary (Rosmarinus officinalis L.) extract as antioxidant in jelly candies made with fructan fibres and stevia. Antioxidants, 9(12), 1289. Doi: 10.3390/antiox9121289
Dżugan, M., Tomczyk, M., Sowa, P., y Grabek-Lejko, D. (2018). Antioxidant activity as biomarker of honey variety. Molecules, 23(8), 2069. DOI: 10.3390/molecules23082069.
Elias, R. J., Kellerby, S. S. y Decker, E. A. (2008). Antioxidant activity of proteins and peptides. Critical Reviews in Food Science and Nutrition, 48(5), 431-441. DOI: 10.1080/10408390701425615.
Ferreira, I. C. F. R., Aires, E., Barreira, J. C. M., y Estevinho, L. M. (2009). Antioxidant activity of Portuguese honey samples: Different contributions of the entire honey and phenolic extract. Food Chemistry, 114(4), 1438-1443. DOI: 10.1016/j.foodchem.2008.11.028.
Kamal-Eldin, A. y Appelqvist, L. A. (1996). The chemistry and antioxidant properties of tocopherols and tocotrienols. Lipids, 31(7): 671–701. DOI: 10.1007/BF02522884.
Mandura, A., Šeremet, D., Ščetar, M., Vojvodić Cebin, A., Belščak-Cvitanović, A., y Komes, D. (2020). Physico-chemical, bioactive, and sensory assessment of white tea-based candies during 4-months storage. Journal of Food Processing and Preservation, 44 (8), (14628). DOI: 10.1111/jfpp.14628.
Norma Mexicana NMX-F-274-1984, Determinación de grados brix en muestras de meladura, masas cocidas, mieles “a” y “b” de refinerias y miel final.
Norma Oficial Mexicana NOM-004-SAG/GAN-2018, Producción de miel y especificaciones.Periche, A., Castelló, M. L., Heredia, A., y Escriche, I. (2015). Stevia rebaudiana, oligofructose and isomaltulose
as sugar replacers in marshmallows: stability and antioxidant properties. Journal of Food Processing and Preservation, 40(4), 724-732. DOI: 10.1111/jfpp.12653.
Pinelo, M., Manzocco, L., Nuñez, M. J., y Nicoli, M. C. (2004). Interaction among phenols in food fortification: negative synergism on antioxidant capacity. Journal of Agricultural and Food Chemistry, 52(5), 1177-1180. DOI: 10.1021/jf0350515.
Pontis, J. A., da Costa, L. A. M. A., da Silva, S. J. R., y Flach, A. (2014). Color, phenolic and flavonoid content, and antioxidant activity of honey from Roraima, Brazil. Food Science and Techology, 34(1), 69-73. DOI: 10.1590/S0101-20612014005000015.
Sant’Ana, L. D., Sousa, J. P. L. M., Salgueiro, F. B., Lorenzon, M. C. A., y Castro, R. N. (2012). Characterization of monofloral honeys with multivariate analysis of their chemical profile and antioxidant activity. Journal of Food Science, 77(1), C135-C140. DOI: 10.1111/j.1750-3841.2011.02490.x.
119 Agro productividad 2022. https://doi.org/10.32854/agrop.v15i3.2164
Šarić, G., Marković, K., Major, N., Krpan, M., Uršulin-Trstenjak, N., Hruškar, M., y Vahčić, N. (2012). Changes of antioxidant activity and phenolic content in acacia and multifloral honey during storage. Food Technology and Biotechnology, 50(4), 434-441.
Secretaría de Agricultura y Desarrollo Rural [SADER] y Servicio de Información Agroalimentaria y Pesquera [SIAP]. Expectativas de producción Agropecuaria y Pesquera. Disponible en:https://www.gob.mx/cms/uploads/attachment/file/465358/Expectativas_Mayo_2019.pdf.
Singleton, V. L., Orthofer, R., y Lamuela-Raventos, R. M. (1999). Analysis of total phenols and other oxidation substrates and antioxidants by means of Folin-Ciocalteu reagent. Methods in Enzymology. 299, 152-178. DOI: 10.1016/S0076-6879(99)99017-1.
Viada, E., Gómez, L., y Campaña, I. R. (2017). Estrés oxidativo. Correo Científico Médico, 21(1), 171-186.

Colegio dePostgraduados
121
Analysis of family agroforestry production units in the altiplano Potosino, MexicoSaraí Barajas-Tejeda1; Mercedes A. Jiménez-Velázquez2; Alejandra Olivera-Méndez1; Tomás Martínez-Saldaña2; Margarita Torres-Aquino1*
1 Colegio de Postgraduados, Posgrado en innovación en manejo de Recursos Naturales, Campus San Luis Potosí, Iturbide No. 73, Salinas de Hidalgo, San Luis Potosí, México, C.P. 78620.
2 Desarrollo Rural, Colegio de Postgraduados, Campus Montecillo, Km 36.5 Carretera México-Texcoco, Montecillo, Texcoco, Estado de México, C.P. 56230.
* Correspondence: [email protected]
ABSTRACTObjective: To understand how small producers perceive their family agroforestry production unit (UPAF) from a social, economic, environmental, and technical standpoint.Design/methodology/approach: A non-experimental qualitative analysis of several UPAFs was conducted. The information was gathered through semi-structured interviews, direct participatory observation, and a field diary. The said information was subsequently analyzed through codification, categorization, and the development of comparative and descriptive tables for the two municipalities and the farmer families in each one of them.Results: The UPAFs provide socioeconomic, environmental, and technical-productive benefits to the producers who have adopted and adapted this agroforestry system. Two factors have influenced the adoption of this technology: age and technical monitoring.Study limitations/implications: The main limitation of our study was the small number of agroforestry production units analyzed, as well as the specificity of the project, which restricts the generalization of results.Findings/conclusions: Agroforestry production units are consistent with a farmer economy because they match several of its characteristics: they are family production units with a partially mercantile nature, which require undivided family work, foster group belonging, and allow risk-taking. Therefore, these types of agroecological alternatives are viable for farmers.
Key words: Agroforestry systems, Food production, Food security, Farmer economy.
INTRODUCTION In Mexico, towns with less than 2,500 inhabitants are considered rural. According to INEGI (2020), 21% of Mexicans live in rural towns. There are seven highly marginalized states in the country: Veracruz, Puebla, San Luis Potosí, Yucatán, Michoacán, Hidalgo, and Campeche. Those seven states have 27.4 million inhabitants, which equals roughly one in four Mexicans (CEDRSSA, 2020). Most of the agriculture in these rural communities is rainfed. Therefore, their agrosystems are more vulnerable to the degradation of natural resources and the effects
Citation: Barajas-Tejeda, S., Jiménez-Velázquez, M.A., Olivera-Méndez, A., Martínez-Saldaña, T.,& Torres-Aquino, M. (2022). Analysis of family agroforestry production units in the altiplano Potosino, Mexico. Agro Productividad. https://doi.org/ 10.32854/agrop.v15i3.2168
Editor in Chief: Dr. Jorge Cadena Iñiguez
Received: October 13, 2021.Accepted: February 28, 2022.Published on-line: April 5, 2022.
Agro Productividad, 15(3). March. 2022. pp: 121-128.
This work is licensed under a Creative Commons Attribution-Non-Commercial 4.0 International license.
121
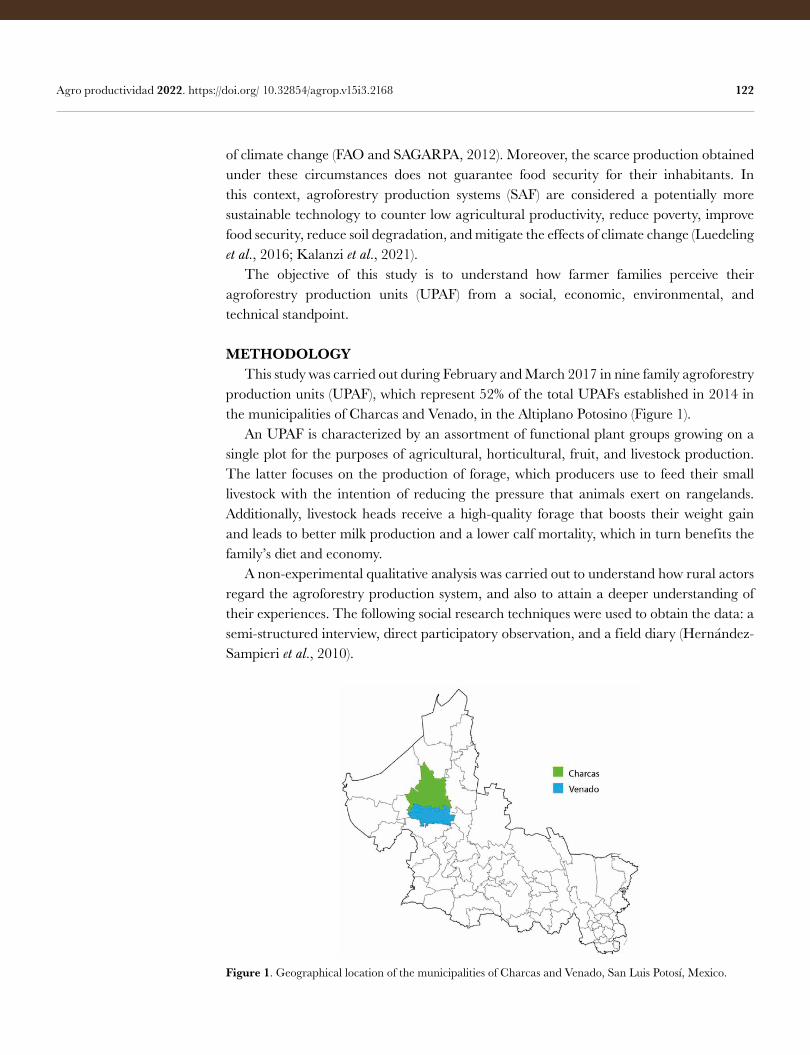
122 Agro productividad 2022. https://doi.org/ 10.32854/agrop.v15i3.2168
of climate change (FAO and SAGARPA, 2012). Moreover, the scarce production obtained under these circumstances does not guarantee food security for their inhabitants. In this context, agroforestry production systems (SAF) are considered a potentially more sustainable technology to counter low agricultural productivity, reduce poverty, improve food security, reduce soil degradation, and mitigate the effects of climate change (Luedeling et al., 2016; Kalanzi et al., 2021). The objective of this study is to understand how farmer families perceive their agroforestry production units (UPAF) from a social, economic, environmental, and technical standpoint.
METHODOLOGY This study was carried out during February and March 2017 in nine family agroforestry production units (UPAF), which represent 52% of the total UPAFs established in 2014 in the municipalities of Charcas and Venado, in the Altiplano Potosino (Figure 1). An UPAF is characterized by an assortment of functional plant groups growing on a single plot for the purposes of agricultural, horticultural, fruit, and livestock production. The latter focuses on the production of forage, which producers use to feed their small livestock with the intention of reducing the pressure that animals exert on rangelands. Additionally, livestock heads receive a high-quality forage that boosts their weight gain and leads to better milk production and a lower calf mortality, which in turn benefits the family’s diet and economy. A non-experimental qualitative analysis was carried out to understand how rural actors regard the agroforestry production system, and also to attain a deeper understanding of their experiences. The following social research techniques were used to obtain the data: a semi-structured interview, direct participatory observation, and a field diary (Hernández-Sampieri et al., 2010).
Figure 1. Geographical location of the municipalities of Charcas and Venado, San Luis Potosí, Mexico.
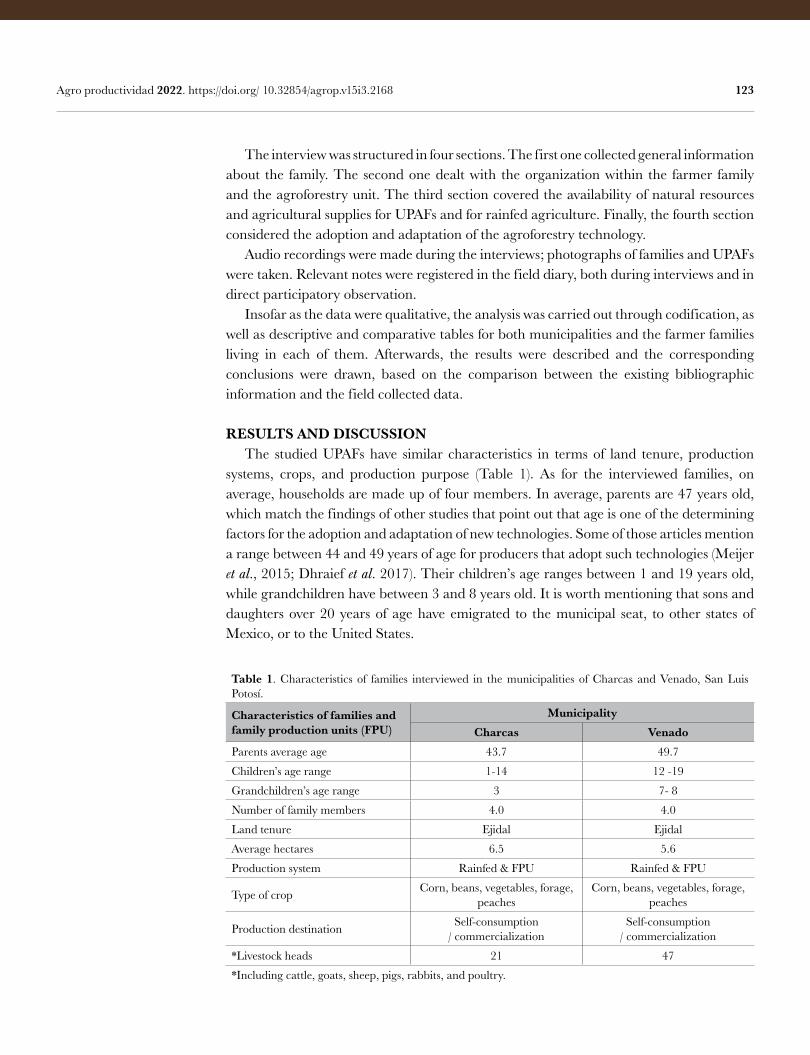
123 Agro productividad 2022. https://doi.org/ 10.32854/agrop.v15i3.2168
The interview was structured in four sections. The first one collected general information about the family. The second one dealt with the organization within the farmer family and the agroforestry unit. The third section covered the availability of natural resources and agricultural supplies for UPAFs and for rainfed agriculture. Finally, the fourth section considered the adoption and adaptation of the agroforestry technology. Audio recordings were made during the interviews; photographs of families and UPAFs were taken. Relevant notes were registered in the field diary, both during interviews and in direct participatory observation. Insofar as the data were qualitative, the analysis was carried out through codification, as well as descriptive and comparative tables for both municipalities and the farmer families living in each of them. Afterwards, the results were described and the corresponding conclusions were drawn, based on the comparison between the existing bibliographic information and the field collected data.
RESULTS AND DISCUSSION The studied UPAFs have similar characteristics in terms of land tenure, production systems, crops, and production purpose (Table 1). As for the interviewed families, on average, households are made up of four members. In average, parents are 47 years old, which match the findings of other studies that point out that age is one of the determining factors for the adoption and adaptation of new technologies. Some of those articles mention a range between 44 and 49 years of age for producers that adopt such technologies (Meijer et al., 2015; Dhraief et al. 2017). Their children’s age ranges between 1 and 19 years old, while grandchildren have between 3 and 8 years old. It is worth mentioning that sons and daughters over 20 years of age have emigrated to the municipal seat, to other states of Mexico, or to the United States.
Table 1. Characteristics of families interviewed in the municipalities of Charcas and Venado, San Luis Potosí.
Characteristics of families and family production units (FPU)
MunicipalityCharcas Venado
Parents average age 43.7 49.7
Children’s age range 1-14 12 -19
Grandchildren’s age range 3 7- 8
Number of family members 4.0 4.0
Land tenure Ejidal Ejidal
Average hectares 6.5 5.6
Production system Rainfed & FPU Rainfed & FPU
Type of crop Corn, beans, vegetables, forage, peaches
Corn, beans, vegetables, forage, peaches
Production destination Self-consumption/ commercialization
Self-consumption/ commercialization
*Livestock heads 21 47
*Including cattle, goats, sheep, pigs, rabbits, and poultry.
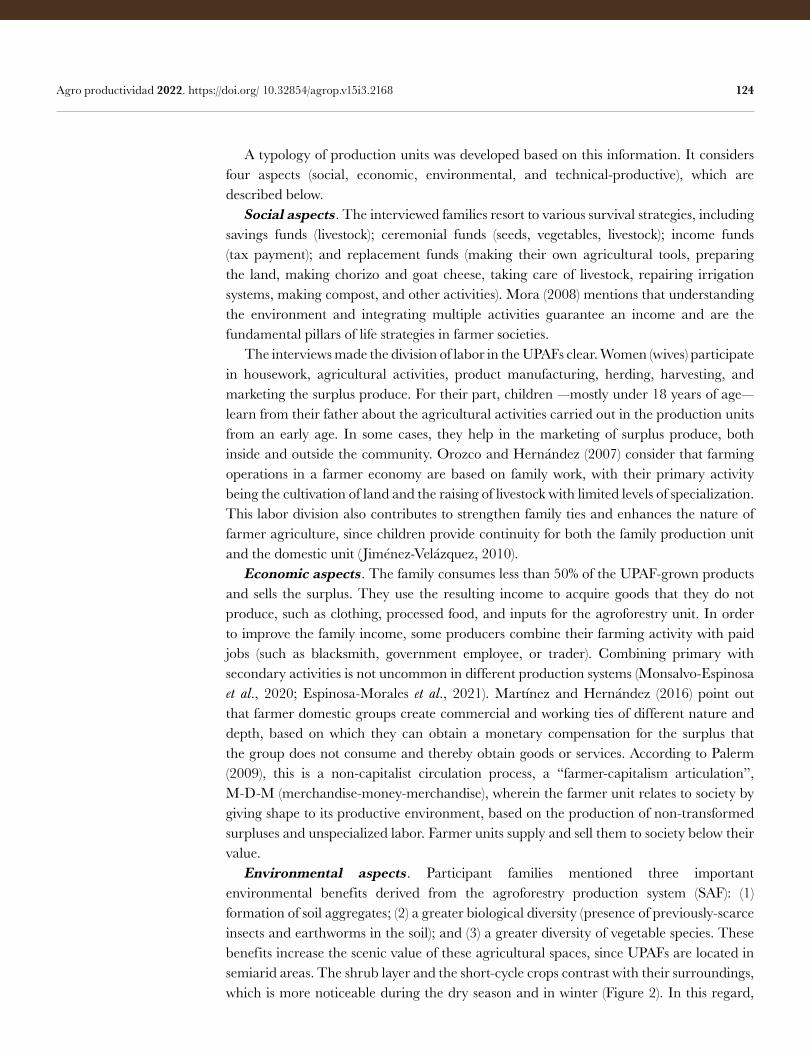
124 Agro productividad 2022. https://doi.org/ 10.32854/agrop.v15i3.2168
A typology of production units was developed based on this information. It considers four aspects (social, economic, environmental, and technical-productive), which are described below. Social aspects. The interviewed families resort to various survival strategies, including savings funds (livestock); ceremonial funds (seeds, vegetables, livestock); income funds (tax payment); and replacement funds (making their own agricultural tools, preparing the land, making chorizo and goat cheese, taking care of livestock, repairing irrigation systems, making compost, and other activities). Mora (2008) mentions that understanding the environment and integrating multiple activities guarantee an income and are the fundamental pillars of life strategies in farmer societies. The interviews made the division of labor in the UPAFs clear. Women (wives) participate in housework, agricultural activities, product manufacturing, herding, harvesting, and marketing the surplus produce. For their part, children —mostly under 18 years of age— learn from their father about the agricultural activities carried out in the production units from an early age. In some cases, they help in the marketing of surplus produce, both inside and outside the community. Orozco and Hernández (2007) consider that farming operations in a farmer economy are based on family work, with their primary activity being the cultivation of land and the raising of livestock with limited levels of specialization. This labor division also contributes to strengthen family ties and enhances the nature of farmer agriculture, since children provide continuity for both the family production unit and the domestic unit ( Jiménez-Velázquez, 2010). Economic aspects. The family consumes less than 50% of the UPAF-grown products and sells the surplus. They use the resulting income to acquire goods that they do not produce, such as clothing, processed food, and inputs for the agroforestry unit. In order to improve the family income, some producers combine their farming activity with paid jobs (such as blacksmith, government employee, or trader). Combining primary with secondary activities is not uncommon in different production systems (Monsalvo-Espinosa et al., 2020; Espinosa-Morales et al., 2021). Martínez and Hernández (2016) point out that farmer domestic groups create commercial and working ties of different nature and depth, based on which they can obtain a monetary compensation for the surplus that the group does not consume and thereby obtain goods or services. According to Palerm (2009), this is a non-capitalist circulation process, a “farmer-capitalism articulation”, M-D-M (merchandise-money-merchandise), wherein the farmer unit relates to society by giving shape to its productive environment, based on the production of non-transformed surpluses and unspecialized labor. Farmer units supply and sell them to society below their value. Environmental aspects. Participant families mentioned three important environmental benefits derived from the agroforestry production system (SAF): (1) formation of soil aggregates; (2) a greater biological diversity (presence of previously-scarce insects and earthworms in the soil); and (3) a greater diversity of vegetable species. These benefits increase the scenic value of these agricultural spaces, since UPAFs are located in semiarid areas. The shrub layer and the short-cycle crops contrast with their surroundings, which is more noticeable during the dry season and in winter (Figure 2). In this regard,
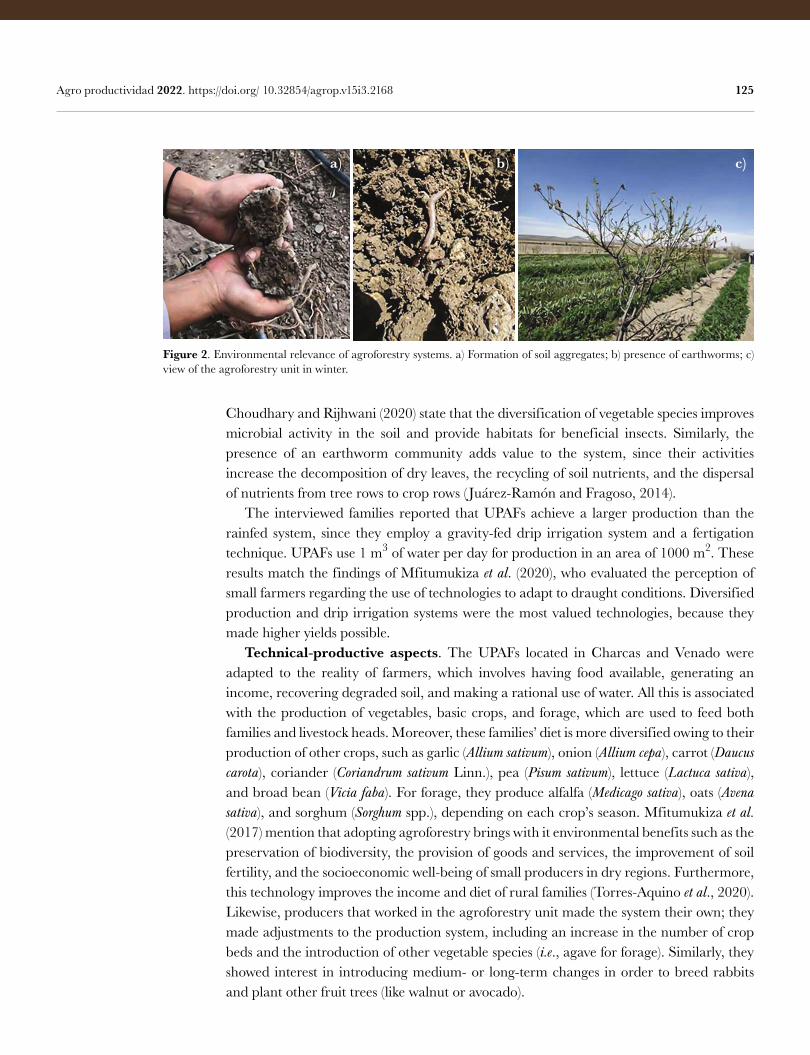
125 Agro productividad 2022. https://doi.org/ 10.32854/agrop.v15i3.2168
Choudhary and Rijhwani (2020) state that the diversification of vegetable species improves microbial activity in the soil and provide habitats for beneficial insects. Similarly, the presence of an earthworm community adds value to the system, since their activities increase the decomposition of dry leaves, the recycling of soil nutrients, and the dispersal of nutrients from tree rows to crop rows ( Juárez-Ramón and Fragoso, 2014). The interviewed families reported that UPAFs achieve a larger production than the rainfed system, since they employ a gravity-fed drip irrigation system and a fertigation technique. UPAFs use 1 m3 of water per day for production in an area of 1000 m2. These results match the findings of Mfitumukiza et al. (2020), who evaluated the perception of small farmers regarding the use of technologies to adapt to draught conditions. Diversified production and drip irrigation systems were the most valued technologies, because they made higher yields possible. Technical-productive aspects. The UPAFs located in Charcas and Venado were adapted to the reality of farmers, which involves having food available, generating an income, recovering degraded soil, and making a rational use of water. All this is associated with the production of vegetables, basic crops, and forage, which are used to feed both families and livestock heads. Moreover, these families’ diet is more diversified owing to their production of other crops, such as garlic (Allium sativum), onion (Allium cepa), carrot (Daucus carota), coriander (Coriandrum sativum Linn.), pea (Pisum sativum), lettuce (Lactuca sativa), and broad bean (Vicia faba). For forage, they produce alfalfa (Medicago sativa), oats (Avena sativa), and sorghum (Sorghum spp.), depending on each crop’s season. Mfitumukiza et al. (2017) mention that adopting agroforestry brings with it environmental benefits such as the preservation of biodiversity, the provision of goods and services, the improvement of soil fertility, and the socioeconomic well-being of small producers in dry regions. Furthermore, this technology improves the income and diet of rural families (Torres-Aquino et al., 2020). Likewise, producers that worked in the agroforestry unit made the system their own; they made adjustments to the production system, including an increase in the number of crop beds and the introduction of other vegetable species (i.e., agave for forage). Similarly, they showed interest in introducing medium- or long-term changes in order to breed rabbits and plant other fruit trees (like walnut or avocado).
Figure 2. Environmental relevance of agroforestry systems. a) Formation of soil aggregates; b) presence of earthworms; c) view of the agroforestry unit in winter.
a) b) c)
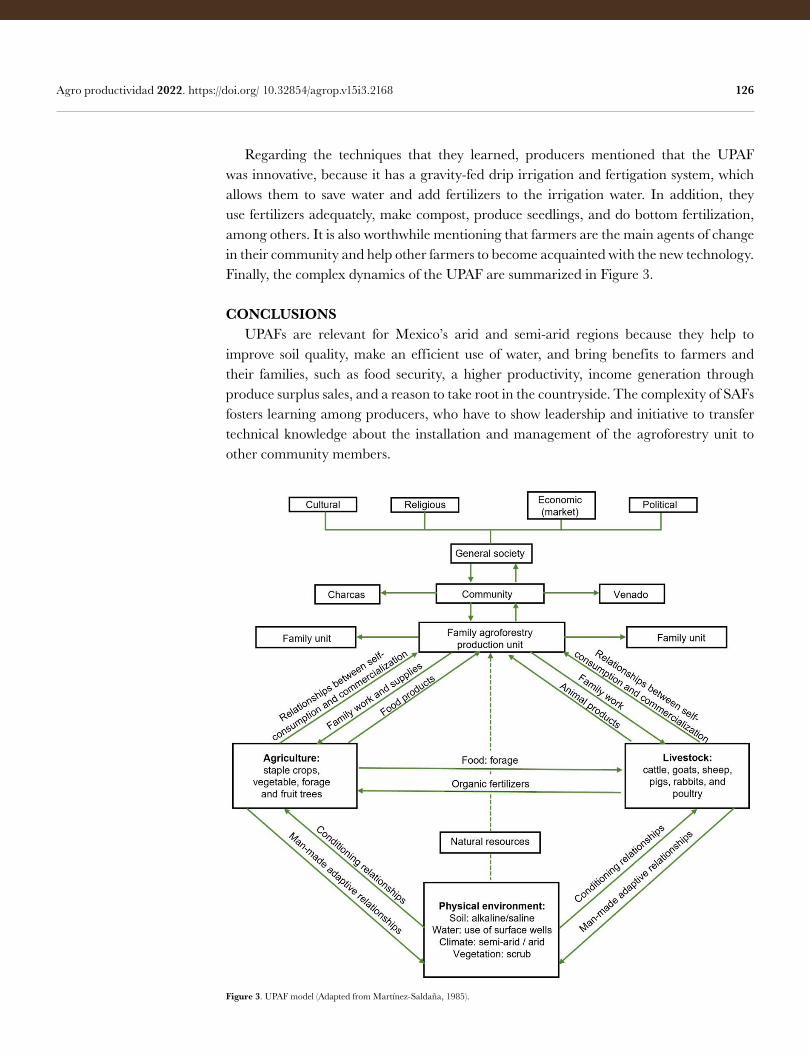
126 Agro productividad 2022. https://doi.org/ 10.32854/agrop.v15i3.2168
Regarding the techniques that they learned, producers mentioned that the UPAF was innovative, because it has a gravity-fed drip irrigation and fertigation system, which allows them to save water and add fertilizers to the irrigation water. In addition, they use fertilizers adequately, make compost, produce seedlings, and do bottom fertilization, among others. It is also worthwhile mentioning that farmers are the main agents of change in their community and help other farmers to become acquainted with the new technology. Finally, the complex dynamics of the UPAF are summarized in Figure 3.
CONCLUSIONS UPAFs are relevant for Mexico’s arid and semi-arid regions because they help to improve soil quality, make an efficient use of water, and bring benefits to farmers and their families, such as food security, a higher productivity, income generation through produce surplus sales, and a reason to take root in the countryside. The complexity of SAFs fosters learning among producers, who have to show leadership and initiative to transfer technical knowledge about the installation and management of the agroforestry unit to other community members.
Figure 3. UPAF model (Adapted from Martínez-Saldaña, 1985).
127 Agro productividad 2022. https://doi.org/ 10.32854/agrop.v15i3.2168
ACKNOWLEDGEMENTS We are extremely grateful to CONACyT for granting the first author a scholarship to complete her
master’s degree. We are also indebted to Fundación Coca-Cola and PRONATURA del NOROESTE, A.C.
for financing the establishment of UPAFs and to the State of San Luis Potosí - SEDARH for the technical
follow-up.
REFERENCESChoudhary, A., & Rijhwani, S. (2020). Microbial diversity in selected agroforestry systems of Central
Rajasthan. International Journal of Life science and Pharma Research,10 (5). 65-73. doi: 10.22376/ijpbs/lpr.2020.10.5.L65-73
CEDRSSA (Centro de Estudios para el Desarrollo Rural Sustentable y la Soberanía Alimentaria) (2020). Dinámica demográfica en localidades rurales. pp 31. Disponible en: http://www.cedrssa.gob.mx/files/b/13/64Dinamica_demografica.pdf
Dhraief, M.Z., Bedhiaf-Romdhania, S., Dhehibib, B., Oueslati-Zlaouia, M., Jebali, O., & Ben-Youssef, S. (2018). Factors affecting the adoption of innovative technologies by livestock farmers in arid area of Tunisia. New Medit, 18 (4).
Espinosa-Morales, J. C., Escalona-Maurice, M. J., Ortega-Méndez C. I., & Fernández-Ordoñez, Y.M. (2021). Characterization of producers of Ejido San Luis Huexotla and relationship with socioeconomic structure and agricultural production. Agroproductividad: 14 (5): 85-92. doi: 10.32854/agrop.v14i05.1860.
FAO & SAGARPA (2012). México: el sector agropecuario ante el desafío del cambio climático. Volumen I. Disponible en: https://www.agricultura.gob.mx/sites/default/files/sagarpa/document/2019/01/28/1608/01022019-cambio-climatico.pdf
Guillerme, S., Kumar, B.M., Menon, A., Hinnewinkel, C., Maire, E., & Santoshkumar, A.V. (2011). Impact of public policies and farmer preferences on agroforestry practices in Kerala, India. Environmental Management, 48 (2): 351-64. doi:10.1007/s00267-011-9628-1
Hernández-Sampieri, R., Fernández-Collado, C., & Baptista-Lucio, M. (2010). Metodología de la investigación. Quinta ed. México D. F.: McGraw-Hill. Disponible en: https://www.uca.ac.cr/wp-content/uploads/2017/10/Investigacion.pdf
INEGI, 2020. Población rural y urbana. Cuentame INEGI: Disponible en: http://cuentame.inegi.org.mx/poblacion/rur_urb.aspx?tema=P
Jiménez-Velázquez, M., (2010). Alimentación y hongos silvestres en la Sierra Nevada de Texcoco. En: Desarrollo Rural en México. Gestión de los recursos naturales, integración comunitaria y género. Texcoco, Edo. de México: Plaza y Valdés, S. A. de C. V., pp. 111-122.
Juárez-Ramón, D., & Fragoso, C. (2014). Comunidades de lombrices de tierra en sistemas agroforestales intercalados, en dos regiones del centro de México. Acta Zoológica Mexicana, 30 (3): 637-654.
Kalanzi, F., Kyazze, F.B., Isubikalu, P., Kiyingi, I., Orikiriza, L.J.B., Okia, C., & Guuroh, R.T. (2021). Inf luence of socio-technological factors on smallholder farmers’ choices of agroforestry technologies in the eastern highlands of Uganda. Small-scale Forestry. 20. 605.-626. Doi: 10.1007/s11842-021-09483-8.
Luedeling, E., Smethurstc, P.J., Baudrond, F., Bayalae, J., Huthf, N.I., van Noordwijkg. et al. (2016). Field-scale modeling of tree–crop interactions: challenges and development needs. Agriculture Systems 142: 51-69. doi: 10.1016/j.agsy.2015.11.005.
Martínez-Corona, B., & Hernández-Flores, J. (2016). Reproducción campesina y conocimiento local en contextos de fragilidad social y ambiental: Estrategias familiares ycomunitarias en la Cordillera del Tentzo, México. Mundo Agrario, 17 (35): e020.
Meijer, S.S., Catacutan, D., Ajayi, O.C., Sileshi, G.D. & Nieuwenhuis, M. (2015). The role of knowledge, attitudes and perceptions in the uptake of agricultural and agroforestry innovations among smallholder farmers in sub-Saharan Africa, International Journal of Agricultural Sustainability, 13:1, 40-54. doi: 10.1080/14735903.2014.912493
Mfitumukiza, D., Bernard, B., & Aringaniza, I. (2017). Determinants of agroforestry adoption as an adaptation means to drought among smallholder farmers in nakasongola DIstrict, Central Uganda. African Journal of Agriculture Research, 12 (23). 2024-2035. doi: 10.5897/AJAR2017.12219.
Mfitumukiza, D., Barasa, B., Kiggundu, N., Nyarwaya, A., & J. P. Muzei, J.P. (2020). Smallholder Farmers’ Perceived Evaluation of Agricultural Drought Adaptation Technologies Used in Uganda: Constraints and Opportunities.” Journal of Arid Environments, 177. 104137. doi: 10.1016/j.jaridenv.2020.104137.
128 Agro productividad 2022. https://doi.org/ 10.32854/agrop.v15i3.2168
Monsalvo-Espinosa, J. A., Coh-Méndez, D., Carrillo-Ávila, E., Santillán-Fernández, A., Arreola-Enríquez, J., & Osnaya-González, M. L. (2020). Características socioeconómicas de los productores de chile habanero (Capsicum chinense Jacq), en Campeche, México. Agroproductividad. 13 (3). 47-54. doi:10.32854/agrop.vi.1596.
Mora, D. J. (2008). Persistencia, conocimiento local y estrategias de vida en sociedades campesinas. Revista de Estudios Sociales, 29: 122-133. doi: 10.7440/res29.2008.07.
Orozco, Hernández, M. E., & López, Andrés, D. (2007). Estrategia de supervivencia familiar en una comunidad campesina del Estado de México. Ciencia ergo sum. 14 (3): 246-254.
Palerm, Á., (2008). Articulación campesinado-capitalismo: sobre la formula M-D-M. En: Antropología y marxismo. México: Centro de Investigaciones y Estudios Superiores en Antropología Social: Universidad Autónoma Metropolitana: Universidad Iberoamericana, pp. 293-327.
Torres-Aquino, M., Sandoval-Noriega, R. A., Martínez-Hernández, J.J., & Gavi-Reyes, F. 2020. Prácticas utilizadas para la producción y mejora de la productividad de un módulo agroforestal. Agroproductividad. 13 (1): 15-21. doi: 10.32854/agrop.vi0.1556
Colegio dePostgraduados
129
Peasant strategies for the use and conservation of native corn in Juchitepec, Estado de MéxicoGonzález-De la Mora Rodrigo1; Navarro-Garza Hermilio1*; Ortega-Paczka Rafael2; Flores-Sánchez D.1; González-Santiago V.2
1 Colegio de Postgraduados en Ciencias Agrícolas, Montecillo, Texcoco, Estado de México, México. C.P. 56230.
2 Universidad Autónoma Chapingo, Texcoco, Estado de México, México, C.P. 56227.*Correspondence: [email protected]
ABSTRACTObjective: To determine the evolution that native corn has had in the municipality of Juchitepec, as well as to describe and analyze the strategies that peasants families are currently implementing for its use and conservation.Design/methodology/approach: A survey was carried out with 20 peasants in the municipality of Juchitepec, chosen from a random sample obtained from the register of the Producción para el Bienestar program. Additionally, a series of semi-structured interviews were conducted with key informants, in order to identify the most important issues around corn in the region.Results: An elderly population was found (x61), but with some young people working decisively in its production units. Seventy-five percent own less than 6 ha, mostly communal land property. Eighty-nine percent of the farmers interviewed continue to grow native corn. They achieve this by adapting their practices and knowledge to the soil and climate conditions of their plots, modifying, for example, the sowing date, the variety or species cultivated, and the place of cultivation. Seventeen percent grow hybrid corn. Two native varieties have recently been introduced as a strategy to obtain greater profitability: ancho and cacahuacintle. Some practices are being modified based on the equipment and the economic resources available, such as the “de dos” labor that only 50% of the farmers carry out. Eighty percent do not have agricultural equipment. The use of chemical fertilizers and herbicides is widespread. The sale of corn husks is an economically important activity. Peasants frequently exchange seeds, usually with other members of their own community. The Ozumba market represents a vitally important marketing channel for native corn. The guaranteed prices established in 2019 were low for this type of corn. Peasants are not formally organized for corn cultivation. Sixty-five percent consider themselves peasants.Study limitations/implications: The study of local agrarian systems with a focus on peasant strategies should contemplate acting under different circumstances, preferably in several work cycles, to better understand their adaptability.Findings/conclusions: Native corn survives in the region, preserved in a socio-productive system based on peasant knowledges, strategies and socio-technical practices that enable its reproduction and recreation. Peasant strategies for the cultivation and use of these corns strengthen their conservation.
Keywords: in situ conservation, plant genetic resources, traditional knowledge.
Citation: González-De la Mora, R., Navarro-Garza, H., Ortega-Paczka, R., Flores-Sánchez D., &González-Santiago, V. (2022). Peasant strategies for the use and conservation of native corn in Juchitepec, Estado de México. Agro Productividad. https://doi.org/10.32854/agrop.v15i3.2180
Editor in Chief: Dr. Jorge Cadena Iñiguez
Received: October 8, 2021.Accepted: February 17, 2022.Published on-line: April 5, 2022.
Agro Productividad, 15(3). March. 2022. pp: 129-143.
This work is licensed under a Creative Commons Attribution-Non-Commercial 4.0 International license.
Image by Ulrike Leone at Pixabay
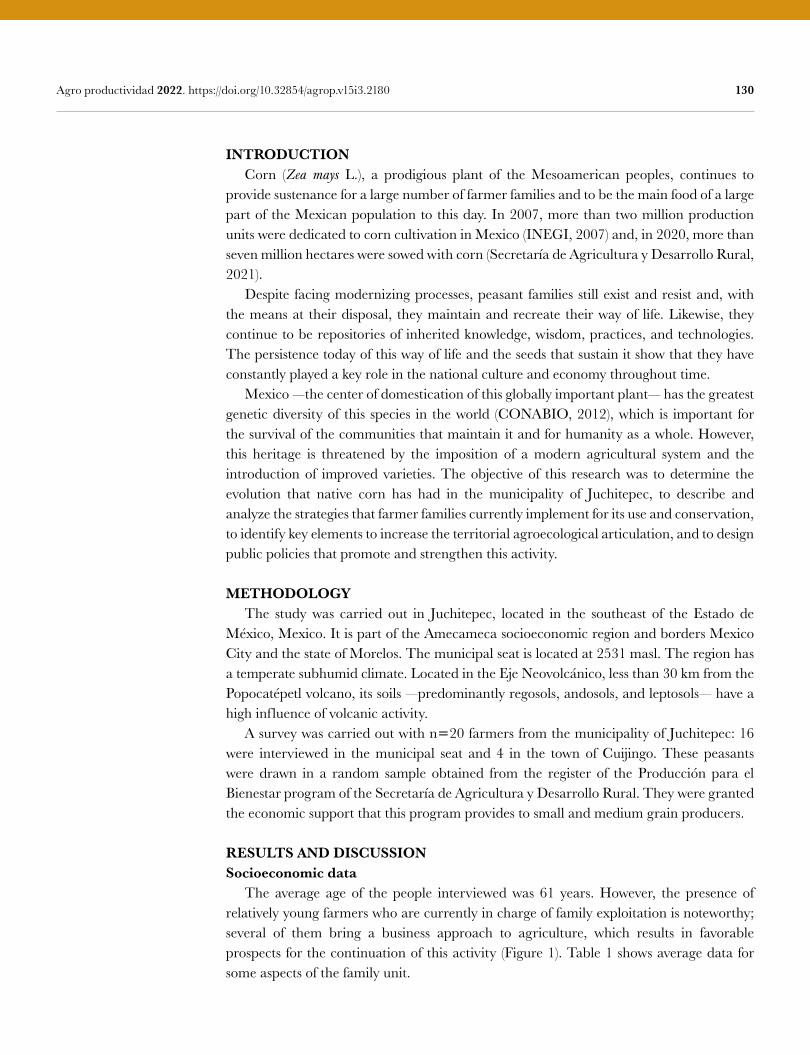
130 Agro productividad 2022. https://doi.org/10.32854/agrop.v15i3.2180
INTRODUCTION Corn (Zea mays L.), a prodigious plant of the Mesoamerican peoples, continues to provide sustenance for a large number of farmer families and to be the main food of a large part of the Mexican population to this day. In 2007, more than two million production units were dedicated to corn cultivation in Mexico (INEGI, 2007) and, in 2020, more than seven million hectares were sowed with corn (Secretaría de Agricultura y Desarrollo Rural, 2021). Despite facing modernizing processes, peasant families still exist and resist and, with the means at their disposal, they maintain and recreate their way of life. Likewise, they continue to be repositories of inherited knowledge, wisdom, practices, and technologies. The persistence today of this way of life and the seeds that sustain it show that they have constantly played a key role in the national culture and economy throughout time. Mexico —the center of domestication of this globally important plant— has the greatest genetic diversity of this species in the world (CONABIO, 2012), which is important for the survival of the communities that maintain it and for humanity as a whole. However, this heritage is threatened by the imposition of a modern agricultural system and the introduction of improved varieties. The objective of this research was to determine the evolution that native corn has had in the municipality of Juchitepec, to describe and analyze the strategies that farmer families currently implement for its use and conservation, to identify key elements to increase the territorial agroecological articulation, and to design public policies that promote and strengthen this activity.
METHODOLOGY The study was carried out in Juchitepec, located in the southeast of the Estado de México, Mexico. It is part of the Amecameca socioeconomic region and borders Mexico City and the state of Morelos. The municipal seat is located at 2531 masl. The region has a temperate subhumid climate. Located in the Eje Neovolcánico, less than 30 km from the Popocatépetl volcano, its soils —predominantly regosols, andosols, and leptosols— have a high influence of volcanic activity. A survey was carried out with n20 farmers from the municipality of Juchitepec: 16 were interviewed in the municipal seat and 4 in the town of Cuijingo. These peasants were drawn in a random sample obtained from the register of the Producción para el Bienestar program of the Secretaría de Agricultura y Desarrollo Rural. They were granted the economic support that this program provides to small and medium grain producers.
RESULTS AND DISCUSSIONSocioeconomic data The average age of the people interviewed was 61 years. However, the presence of relatively young farmers who are currently in charge of family exploitation is noteworthy; several of them bring a business approach to agriculture, which results in favorable prospects for the continuation of this activity (Figure 1). Table 1 shows average data for some aspects of the family unit.
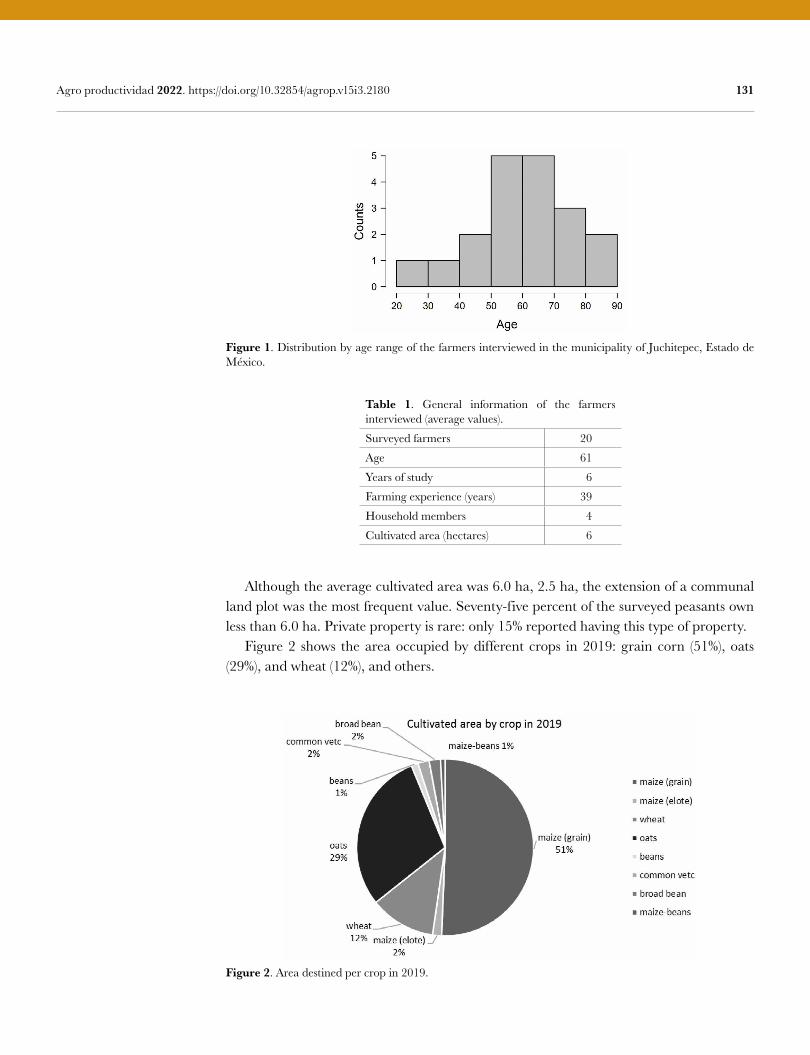
131 Agro productividad 2022. https://doi.org/10.32854/agrop.v15i3.2180
Although the average cultivated area was 6.0 ha, 2.5 ha, the extension of a communal land plot was the most frequent value. Seventy-five percent of the surveyed peasants own less than 6.0 ha. Private property is rare: only 15% reported having this type of property. Figure 2 shows the area occupied by different crops in 2019: grain corn (51%), oats (29%), and wheat (12%), and others.
Table 1. General information of the farmers interviewed (average values).
Surveyed farmers 20
Age 61
Years of study 6
Farming experience (years) 39
Household members 4
Cultivated area (hectares) 6
Figure 1. Distribution by age range of the farmers interviewed in the municipality of Juchitepec, Estado de México.
Figure 2. Area destined per crop in 2019.
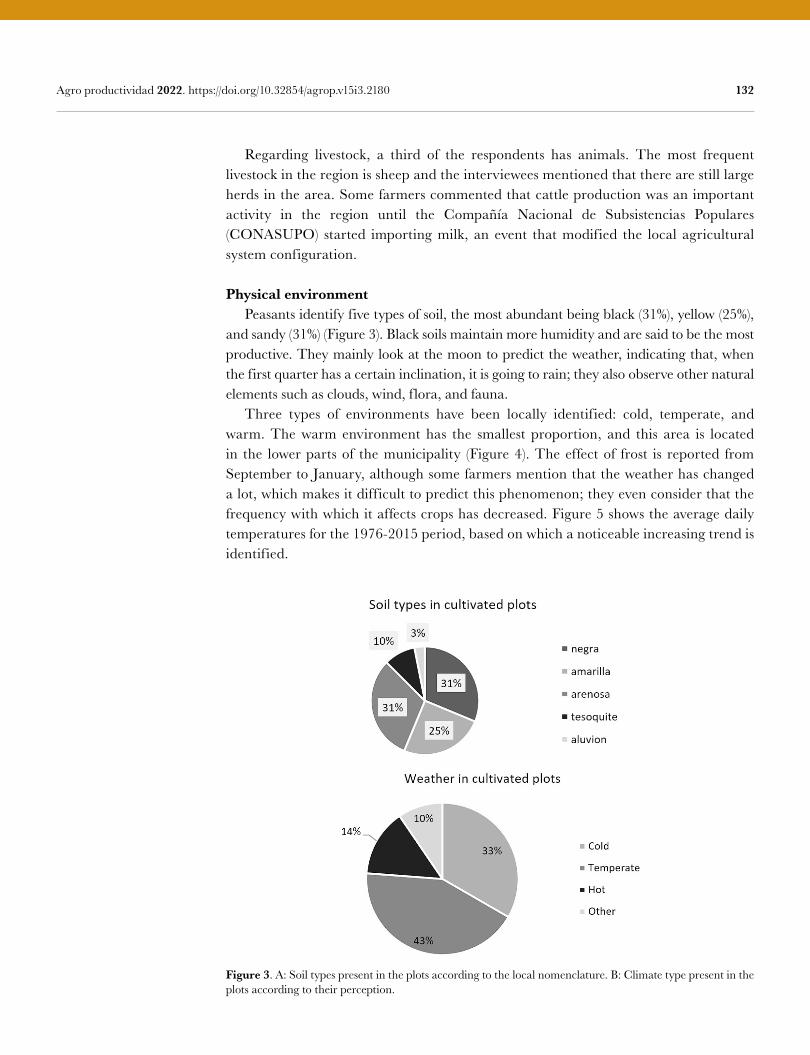
132 Agro productividad 2022. https://doi.org/10.32854/agrop.v15i3.2180
Regarding livestock, a third of the respondents has animals. The most frequent livestock in the region is sheep and the interviewees mentioned that there are still large herds in the area. Some farmers commented that cattle production was an important activity in the region until the Compañía Nacional de Subsistencias Populares (CONASUPO) started importing milk, an event that modified the local agricultural system configuration.
Physical environment Peasants identify five types of soil, the most abundant being black (31%), yellow (25%), and sandy (31%) (Figure 3). Black soils maintain more humidity and are said to be the most productive. They mainly look at the moon to predict the weather, indicating that, when the first quarter has a certain inclination, it is going to rain; they also observe other natural elements such as clouds, wind, flora, and fauna. Three types of environments have been locally identified: cold, temperate, and warm. The warm environment has the smallest proportion, and this area is located in the lower parts of the municipality (Figure 4). The effect of frost is reported from September to January, although some farmers mention that the weather has changed a lot, which makes it difficult to predict this phenomenon; they even consider that the frequency with which it affects crops has decreased. Figure 5 shows the average daily temperatures for the 1976-2015 period, based on which a noticeable increasing trend is identified.
Figure 3. A: Soil types present in the plots according to the local nomenclature. B: Climate type present in the plots according to their perception.
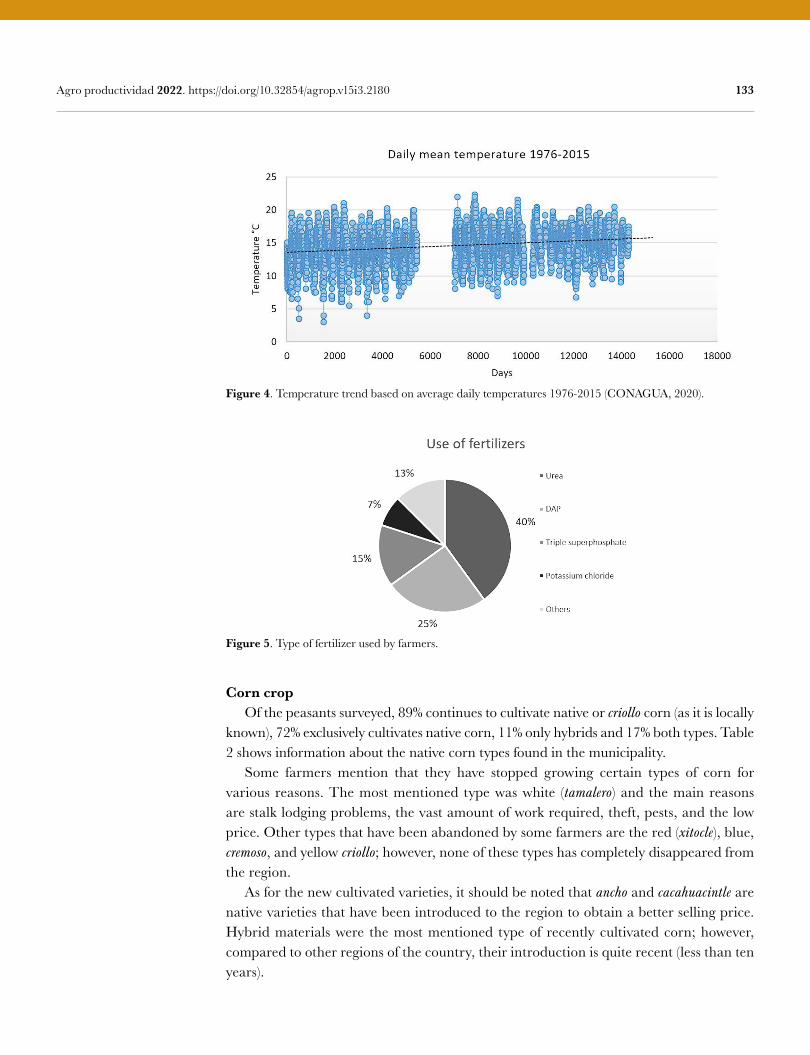
133 Agro productividad 2022. https://doi.org/10.32854/agrop.v15i3.2180
Corn crop Of the peasants surveyed, 89% continues to cultivate native or criollo corn (as it is locally known), 72% exclusively cultivates native corn, 11% only hybrids and 17% both types. Table 2 shows information about the native corn types found in the municipality. Some farmers mention that they have stopped growing certain types of corn for various reasons. The most mentioned type was white (tamalero) and the main reasons are stalk lodging problems, the vast amount of work required, theft, pests, and the low price. Other types that have been abandoned by some farmers are the red (xitocle), blue, cremoso, and yellow criollo; however, none of these types has completely disappeared from the region. As for the new cultivated varieties, it should be noted that ancho and cacahuacintle are native varieties that have been introduced to the region to obtain a better selling price. Hybrid materials were the most mentioned type of recently cultivated corn; however, compared to other regions of the country, their introduction is quite recent (less than ten years).
Figure 4. Temperature trend based on average daily temperatures 1976-2015 (CONAGUA, 2020).
Figure 5. Type of fertilizer used by farmers.
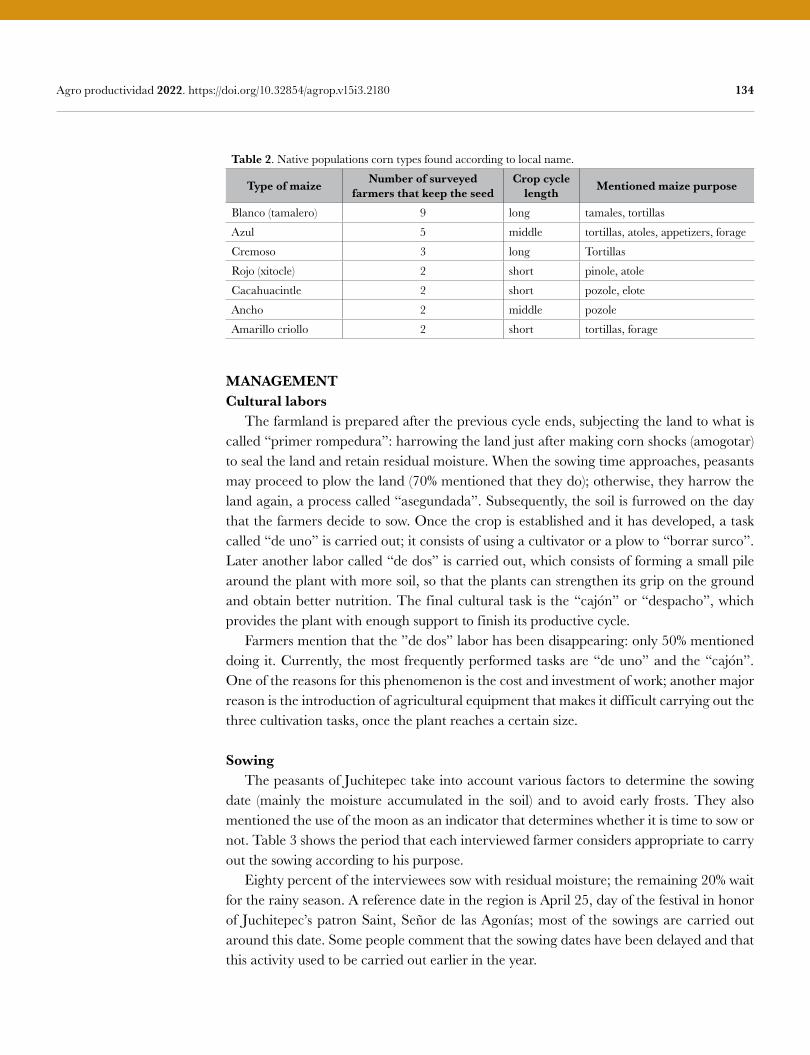
134 Agro productividad 2022. https://doi.org/10.32854/agrop.v15i3.2180
MANAGEMENTCultural labors The farmland is prepared after the previous cycle ends, subjecting the land to what is called “primer rompedura”: harrowing the land just after making corn shocks (amogotar) to seal the land and retain residual moisture. When the sowing time approaches, peasants may proceed to plow the land (70% mentioned that they do); otherwise, they harrow the land again, a process called “asegundada”. Subsequently, the soil is furrowed on the day that the farmers decide to sow. Once the crop is established and it has developed, a task called “de uno” is carried out; it consists of using a cultivator or a plow to “borrar surco”. Later another labor called “de dos” is carried out, which consists of forming a small pile around the plant with more soil, so that the plants can strengthen its grip on the ground and obtain better nutrition. The final cultural task is the “cajón” or “despacho”, which provides the plant with enough support to finish its productive cycle. Farmers mention that the ”de dos” labor has been disappearing: only 50% mentioned doing it. Currently, the most frequently performed tasks are “de uno” and the “cajón”. One of the reasons for this phenomenon is the cost and investment of work; another major reason is the introduction of agricultural equipment that makes it difficult carrying out the three cultivation tasks, once the plant reaches a certain size.
Sowing The peasants of Juchitepec take into account various factors to determine the sowing date (mainly the moisture accumulated in the soil) and to avoid early frosts. They also mentioned the use of the moon as an indicator that determines whether it is time to sow or not. Table 3 shows the period that each interviewed farmer considers appropriate to carry out the sowing according to his purpose. Eighty percent of the interviewees sow with residual moisture; the remaining 20% wait for the rainy season. A reference date in the region is April 25, day of the festival in honor of Juchitepec’s patron Saint, Señor de las Agonías; most of the sowings are carried out around this date. Some people comment that the sowing dates have been delayed and that this activity used to be carried out earlier in the year.
Table 2. Native populations corn types found according to local name.
Type of maize Number of surveyed farmers that keep the seed
Crop cycle length Mentioned maize purpose
Blanco (tamalero) 9 long tamales, tortillas
Azul 5 middle tortillas, atoles, appetizers, forage
Cremoso 3 long Tortillas
Rojo (xitocle) 2 short pinole, atole
Cacahuacintle 2 short pozole, elote
Ancho 2 middle pozole
Amarillo criollo 2 short tortillas, forage
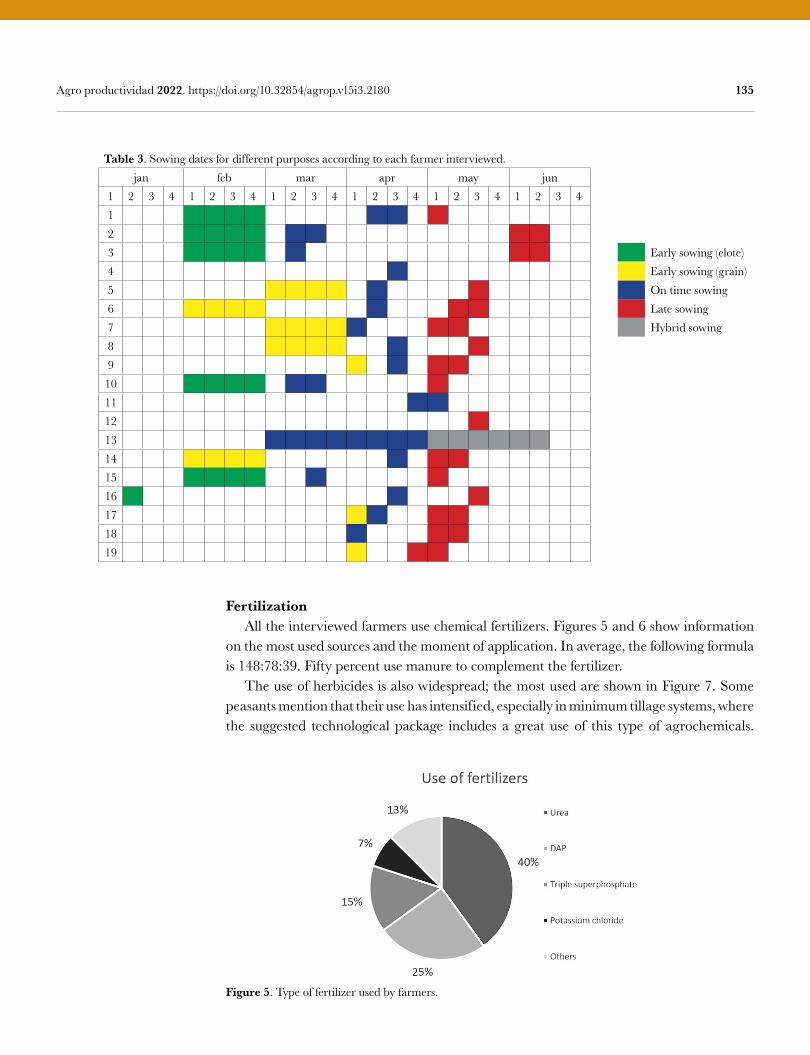
135 Agro productividad 2022. https://doi.org/10.32854/agrop.v15i3.2180
Fertilization All the interviewed farmers use chemical fertilizers. Figures 5 and 6 show information on the most used sources and the moment of application. In average, the following formula is 148:78:39. Fifty percent use manure to complement the fertilizer. The use of herbicides is also widespread; the most used are shown in Figure 7. Some peasants mention that their use has intensified, especially in minimum tillage systems, where the suggested technological package includes a great use of this type of agrochemicals.
Table 3. Sowing dates for different purposes according to each farmer interviewed.jan feb mar apr may jun
1 2 3 4 1 2 3 4 1 2 3 4 1 2 3 4 1 2 3 4 1 2 3 412 3 Early sowing (elote)4 Early sowing (grain)5 On time sowing6 Late sowing7 Hybrid sowing8 9
10 11 12 13 14 15 16 17 18 19
Figure 5. Type of fertilizer used by farmers.
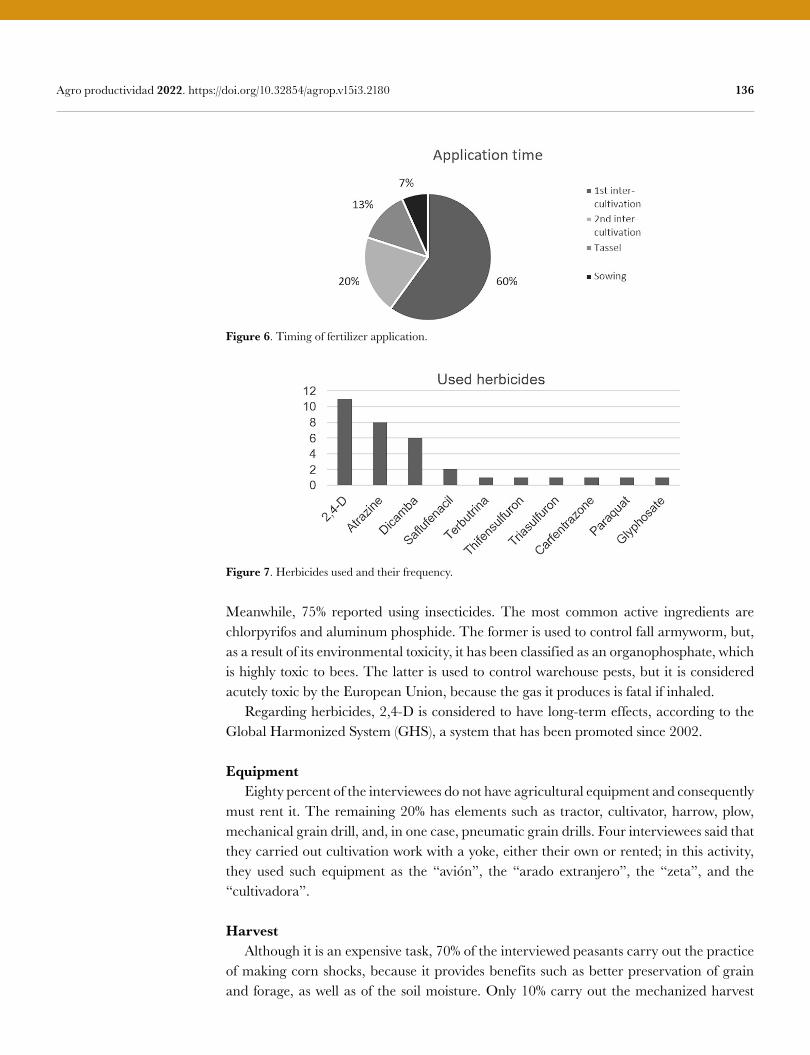
136 Agro productividad 2022. https://doi.org/10.32854/agrop.v15i3.2180
Figure 6. Timing of fertilizer application.
Figure 7. Herbicides used and their frequency.
Meanwhile, 75% reported using insecticides. The most common active ingredients are chlorpyrifos and aluminum phosphide. The former is used to control fall armyworm, but, as a result of its environmental toxicity, it has been classified as an organophosphate, which is highly toxic to bees. The latter is used to control warehouse pests, but it is considered acutely toxic by the European Union, because the gas it produces is fatal if inhaled. Regarding herbicides, 2,4-D is considered to have long-term effects, according to the Global Harmonized System (GHS), a system that has been promoted since 2002.
Equipment Eighty percent of the interviewees do not have agricultural equipment and consequently must rent it. The remaining 20% has elements such as tractor, cultivator, harrow, plow, mechanical grain drill, and, in one case, pneumatic grain drills. Four interviewees said that they carried out cultivation work with a yoke, either their own or rented; in this activity, they used such equipment as the “avión”, the “arado extranjero”, the “zeta”, and the “cultivadora”.
Harvest Although it is an expensive task, 70% of the interviewed peasants carry out the practice of making corn shocks, because it provides benefits such as better preservation of grain and forage, as well as of the soil moisture. Only 10% carry out the mechanized harvest
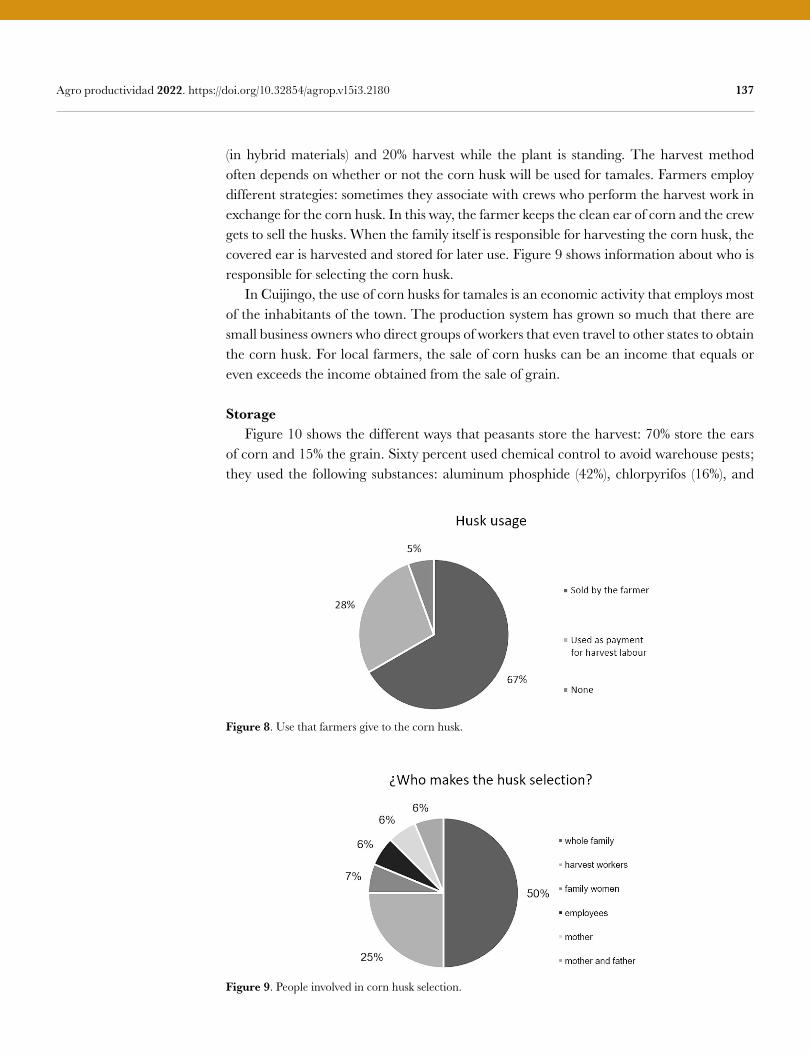
137 Agro productividad 2022. https://doi.org/10.32854/agrop.v15i3.2180
(in hybrid materials) and 20% harvest while the plant is standing. The harvest method often depends on whether or not the corn husk will be used for tamales. Farmers employ different strategies: sometimes they associate with crews who perform the harvest work in exchange for the corn husk. In this way, the farmer keeps the clean ear of corn and the crew gets to sell the husks. When the family itself is responsible for harvesting the corn husk, the covered ear is harvested and stored for later use. Figure 9 shows information about who is responsible for selecting the corn husk. In Cuijingo, the use of corn husks for tamales is an economic activity that employs most of the inhabitants of the town. The production system has grown so much that there are small business owners who direct groups of workers that even travel to other states to obtain the corn husk. For local farmers, the sale of corn husks can be an income that equals or even exceeds the income obtained from the sale of grain.
Storage Figure 10 shows the different ways that peasants store the harvest: 70% store the ears of corn and 15% the grain. Sixty percent used chemical control to avoid warehouse pests; they used the following substances: aluminum phosphide (42%), chlorpyrifos (16%), and
Figure 8. Use that farmers give to the corn husk.
Figure 9. People involved in corn husk selection.
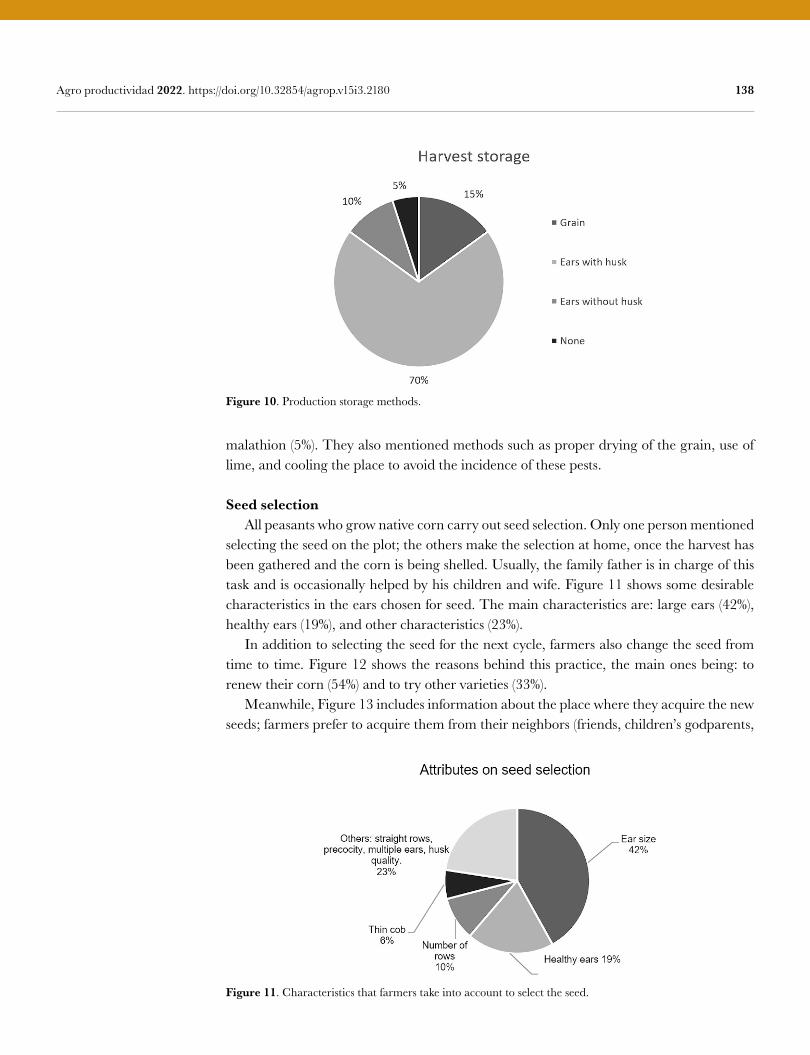
138 Agro productividad 2022. https://doi.org/10.32854/agrop.v15i3.2180
Figure 10. Production storage methods.
malathion (5%). They also mentioned methods such as proper drying of the grain, use of lime, and cooling the place to avoid the incidence of these pests.
Seed selection All peasants who grow native corn carry out seed selection. Only one person mentioned selecting the seed on the plot; the others make the selection at home, once the harvest has been gathered and the corn is being shelled. Usually, the family father is in charge of this task and is occasionally helped by his children and wife. Figure 11 shows some desirable characteristics in the ears chosen for seed. The main characteristics are: large ears (42%), healthy ears (19%), and other characteristics (23%). In addition to selecting the seed for the next cycle, farmers also change the seed from time to time. Figure 12 shows the reasons behind this practice, the main ones being: to renew their corn (54%) and to try other varieties (33%). Meanwhile, Figure 13 includes information about the place where they acquire the new seeds; farmers prefer to acquire them from their neighbors (friends, children’s godparents,
Figure 11. Characteristics that farmers take into account to select the seed.
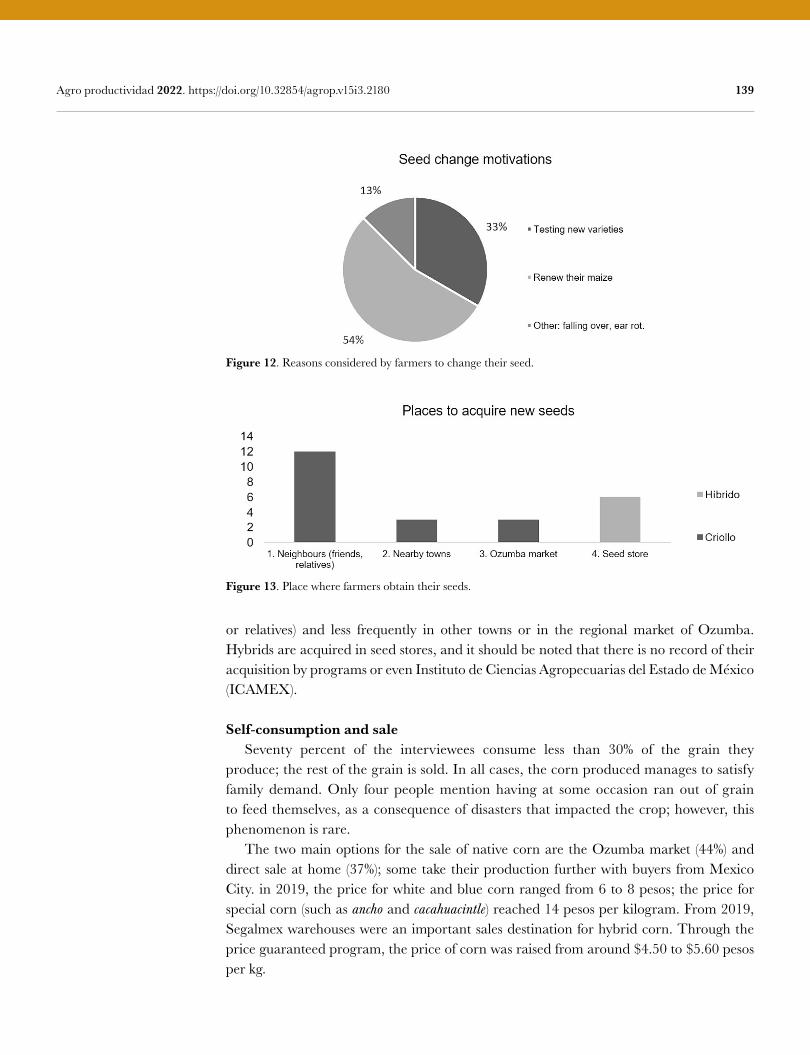
139 Agro productividad 2022. https://doi.org/10.32854/agrop.v15i3.2180
Figure 13. Place where farmers obtain their seeds.
Figure 12. Reasons considered by farmers to change their seed.
or relatives) and less frequently in other towns or in the regional market of Ozumba. Hybrids are acquired in seed stores, and it should be noted that there is no record of their acquisition by programs or even Instituto de Ciencias Agropecuarias del Estado de México (ICAMEX).
Self-consumption and sale Seventy percent of the interviewees consume less than 30% of the grain they produce; the rest of the grain is sold. In all cases, the corn produced manages to satisfy family demand. Only four people mention having at some occasion ran out of grain to feed themselves, as a consequence of disasters that impacted the crop; however, this phenomenon is rare. The two main options for the sale of native corn are the Ozumba market (44%) and direct sale at home (37%); some take their production further with buyers from Mexico City. in 2019, the price for white and blue corn ranged from 6 to 8 pesos; the price for special corn (such as ancho and cacahuacintle) reached 14 pesos per kilogram. From 2019, Segalmex warehouses were an important sales destination for hybrid corn. Through the price guaranteed program, the price of corn was raised from around $4.50 to $5.60 pesos per kg.
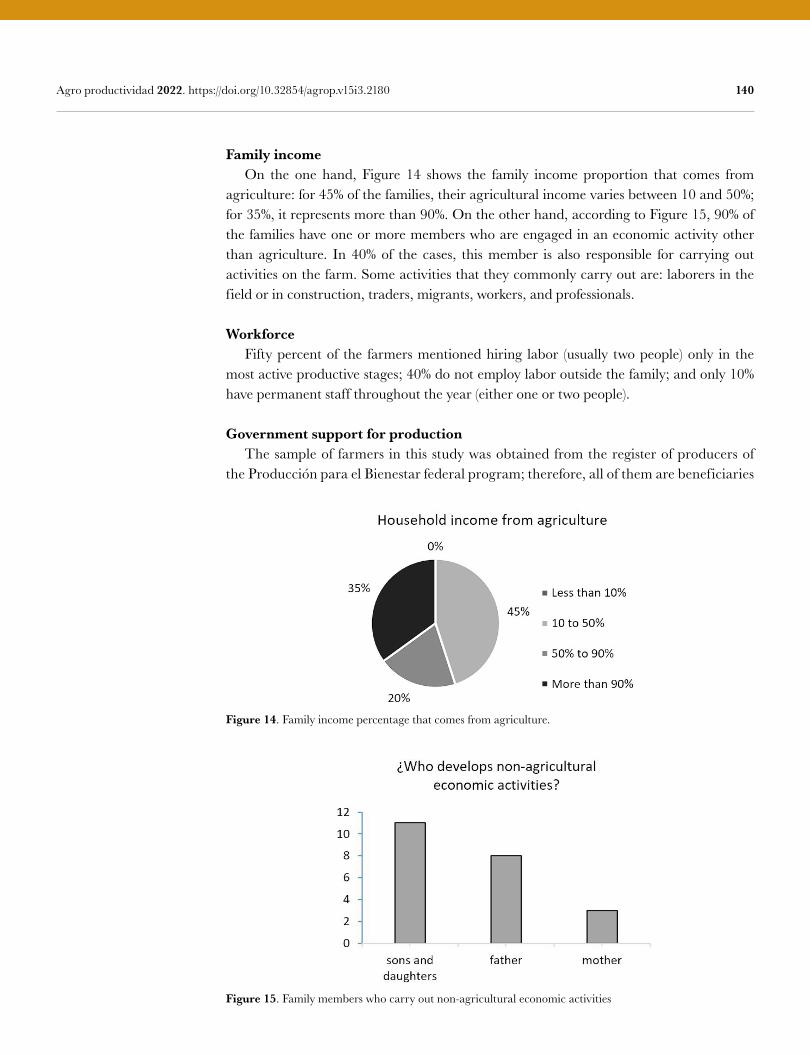
140 Agro productividad 2022. https://doi.org/10.32854/agrop.v15i3.2180
Family income On the one hand, Figure 14 shows the family income proportion that comes from agriculture: for 45% of the families, their agricultural income varies between 10 and 50%; for 35%, it represents more than 90%. On the other hand, according to Figure 15, 90% of the families have one or more members who are engaged in an economic activity other than agriculture. In 40% of the cases, this member is also responsible for carrying out activities on the farm. Some activities that they commonly carry out are: laborers in the field or in construction, traders, migrants, workers, and professionals.
Workforce Fifty percent of the farmers mentioned hiring labor (usually two people) only in the most active productive stages; 40% do not employ labor outside the family; and only 10% have permanent staff throughout the year (either one or two people).
Government support for production The sample of farmers in this study was obtained from the register of producers of the Producción para el Bienestar federal program; therefore, all of them are beneficiaries
Figure 15. Family members who carry out non-agricultural economic activities
Figure 14. Family income percentage that comes from agriculture.
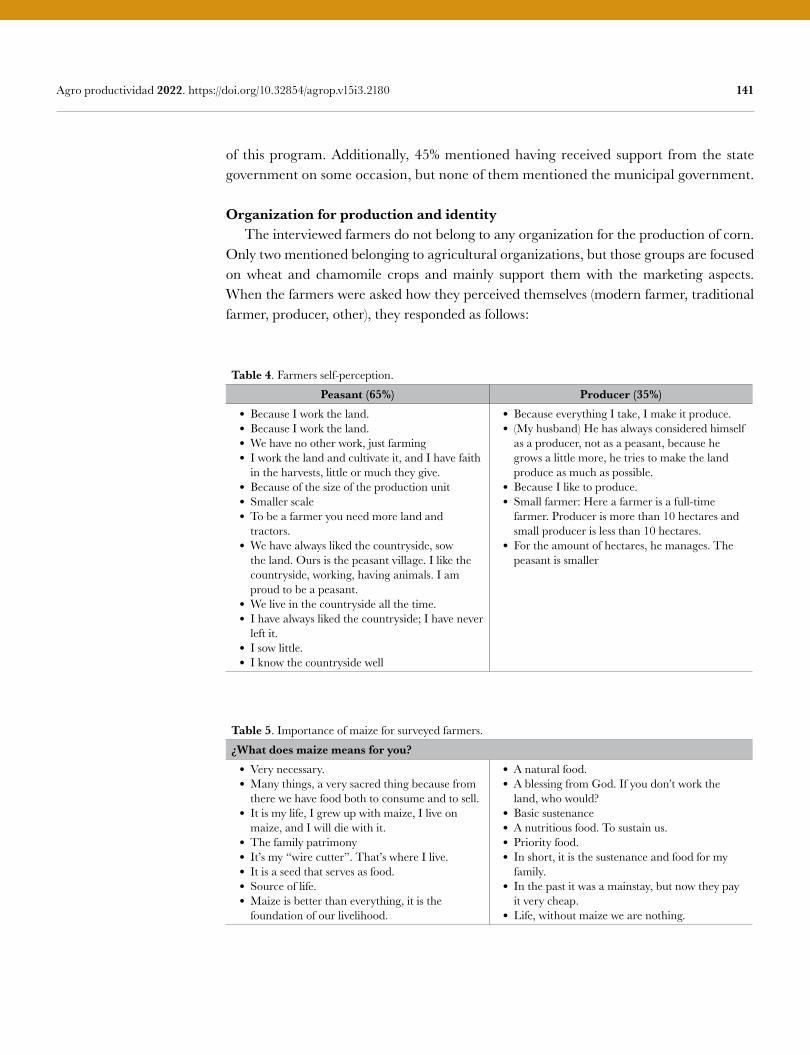
141 Agro productividad 2022. https://doi.org/10.32854/agrop.v15i3.2180
of this program. Additionally, 45% mentioned having received support from the state government on some occasion, but none of them mentioned the municipal government.
Organization for production and identity The interviewed farmers do not belong to any organization for the production of corn. Only two mentioned belonging to agricultural organizations, but those groups are focused on wheat and chamomile crops and mainly support them with the marketing aspects. When the farmers were asked how they perceived themselves (modern farmer, traditional farmer, producer, other), they responded as follows:
Table 4. Farmers self-perception.
Peasant (65%) Producer (35%)• Because I work the land.• Because I work the land.• We have no other work, just farming• I work the land and cultivate it, and I have faith
in the harvests, little or much they give.• Because of the size of the production unit• Smaller scale• To be a farmer you need more land and
tractors.• We have always liked the countryside, sow
the land. Ours is the peasant village. I like the countryside, working, having animals. I am proud to be a peasant.
• We live in the countryside all the time.• I have always liked the countryside; I have never
left it.• I sow little.• I know the countryside well
• Because everything I take, I make it produce.• (My husband) He has always considered himself
as a producer, not as a peasant, because he grows a little more, he tries to make the land produce as much as possible.
• Because I like to produce.• Small farmer: Here a farmer is a full-time
farmer. Producer is more than 10 hectares and small producer is less than 10 hectares.
• For the amount of hectares, he manages. The peasant is smaller
Table 5. Importance of maize for surveyed farmers.
¿What does maize means for you?• Very necessary.• Many things, a very sacred thing because from
there we have food both to consume and to sell.• It is my life, I grew up with maize, I live on
maize, and I will die with it.• The family patrimony• It’s my “wire cutter”. That’s where I live.• It is a seed that serves as food.• Source of life.• Maize is better than everything, it is the
foundation of our livelihood.
• A natural food.• A blessing from God. If you don’t work the
land, who would?• Basic sustenance• A nutritious food. To sustain us.• Priority food.• In short, it is the sustenance and food for my
family.• In the past it was a mainstay, but now they pay
it very cheap.• Life, without maize we are nothing.
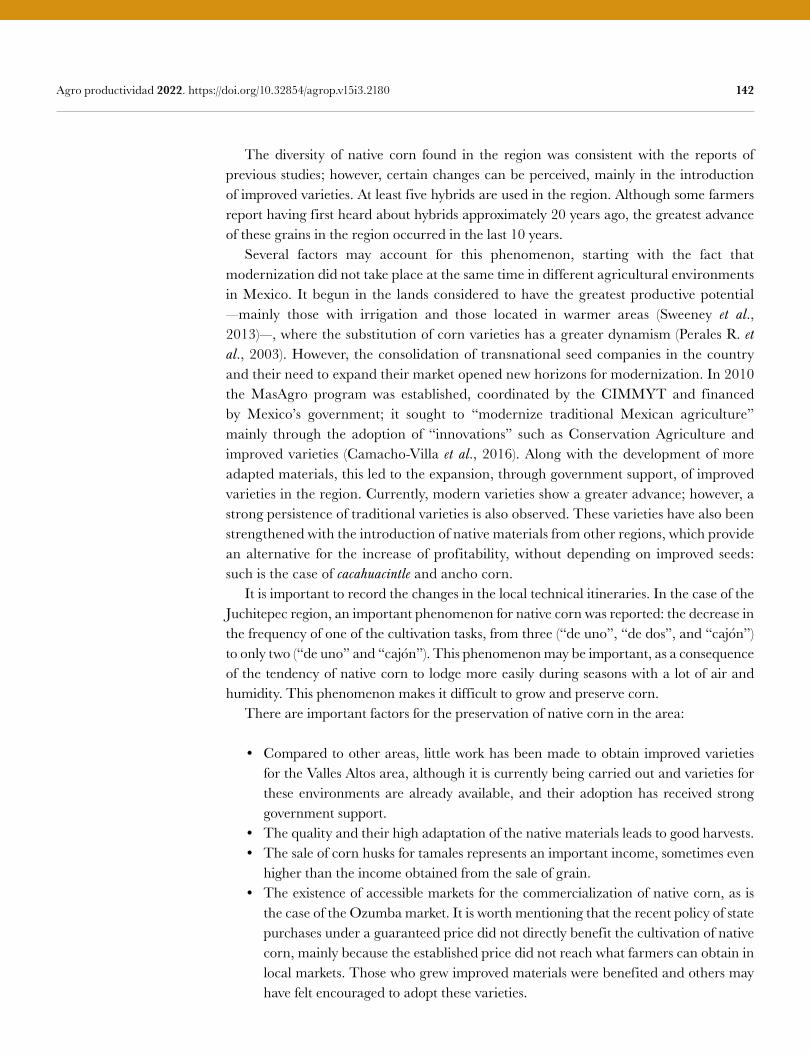
142 Agro productividad 2022. https://doi.org/10.32854/agrop.v15i3.2180
The diversity of native corn found in the region was consistent with the reports of previous studies; however, certain changes can be perceived, mainly in the introduction of improved varieties. At least five hybrids are used in the region. Although some farmers report having first heard about hybrids approximately 20 years ago, the greatest advance of these grains in the region occurred in the last 10 years. Several factors may account for this phenomenon, starting with the fact that modernization did not take place at the same time in different agricultural environments in Mexico. It begun in the lands considered to have the greatest productive potential —mainly those with irrigation and those located in warmer areas (Sweeney et al., 2013)—, where the substitution of corn varieties has a greater dynamism (Perales R. et al., 2003). However, the consolidation of transnational seed companies in the country and their need to expand their market opened new horizons for modernization. In 2010 the MasAgro program was established, coordinated by the CIMMYT and financed by Mexico’s government; it sought to “modernize traditional Mexican agriculture” mainly through the adoption of “innovations” such as Conservation Agriculture and improved varieties (Camacho-Villa et al., 2016). Along with the development of more adapted materials, this led to the expansion, through government support, of improved varieties in the region. Currently, modern varieties show a greater advance; however, a strong persistence of traditional varieties is also observed. These varieties have also been strengthened with the introduction of native materials from other regions, which provide an alternative for the increase of profitability, without depending on improved seeds: such is the case of cacahuacintle and ancho corn. It is important to record the changes in the local technical itineraries. In the case of the Juchitepec region, an important phenomenon for native corn was reported: the decrease in the frequency of one of the cultivation tasks, from three (“de uno”, “de dos”, and “cajón”) to only two (“de uno” and “cajón”). This phenomenon may be important, as a consequence of the tendency of native corn to lodge more easily during seasons with a lot of air and humidity. This phenomenon makes it difficult to grow and preserve corn. There are important factors for the preservation of native corn in the area:
• Compared to other areas, little work has been made to obtain improved varieties for the Valles Altos area, although it is currently being carried out and varieties for these environments are already available, and their adoption has received strong government support.
• The quality and their high adaptation of the native materials leads to good harvests.• The sale of corn husks for tamales represents an important income, sometimes even
higher than the income obtained from the sale of grain.• The existence of accessible markets for the commercialization of native corn, as is
the case of the Ozumba market. It is worth mentioning that the recent policy of state purchases under a guaranteed price did not directly benefit the cultivation of native corn, mainly because the established price did not reach what farmers can obtain in local markets. Those who grew improved materials were benefited and others may have felt encouraged to adopt these varieties.
143 Agro productividad 2022. https://doi.org/10.32854/agrop.v15i3.2180
Analyzing in depth the dynamics of seed exchange and their impact on the genetic structure of native populations is necessary. Several farmers reported making periodic exchanges with the purpose of renewing their materials, although simultaneously they assured that they kept certain seeds for years and even generations. This seems to indicate that native varieties are created and recreated in a community dynamic, adapting over time to the different environments of a given region and developing a regional identity for these varieties. Even in the event that no exchange takes place, the average farmer knows that he needs to rotate the seed between his own plots, to avoid “seed boredom”. The enrichment in the use of the native populations or varieties concept is proposed, through the incorporation of concepts that underline this dynamic, for example: “community territorial varieties”.
CONCLUSIONS Peasant strategies allow the permanence of native corn populations. These strategies make up in themselves a corpus of wisdom and lore historically developed by a certain social group in a certain eco-geographical area. These strategies constitute a very rich and highly important biocultural heritage readily available for their repositories. However, at the same time, they are constantly threatened by new forms of production and technological changes. Its study, understanding, new appreciation, and integration in the design of public policies and programs can guarantee their success, improving their operation and increasing the effectiveness of the benefits they provide to local populations.
ACKNOWLEDGEMENT The authors would like to thank the farmers of the municipality of Juchitepec who kindly participated in
this research. They would also like to thank the Consejo Nacional de Ciencia y Tecnología for the scholarship
granted for the MSc studies under which this research was carried out.
REFERENCESCamacho-Villa, T. C., Almekinders, C., Hellin, J., Martinez-Cruz, T. E., Rendon-Medel, R., Guevara-
Hernández, F., Beuchelt, T. D., & Govaerts, B. (2016). The evolution of the MasAgro hubs: responsiveness and serendipity as drivers of agricultural innovation in a dynamic and heterogeneous context. Journal of Agricultural Education and Extension, 22(5), 455–470. Doi: 10.1080/1389224X.2016.1227091
CONABIO. (2012). Razas de Maíz en México. Biodiversidad Mexicana, 5. Disponible en: http://www.biodiversidad.gob.mx/usos/maices/razas2012.html
CONAGUA. (2020). Datos de la Estación 15039 Juchitepec. Inventario de Registros por Década Año. Disponible en: https://smn.conagua.gob.mx/tools/RESOURCES/Estadistica/13098.pdf
INEGI. (2007). Censo Agrícola, Ganadero y Forestal 2007. Disponible en: https://www.inegi.org.mx/programas/cagf/2007/#Tabulados
Perales R., H., Brush, S. B., & Qualset, C. O. (2003). Landraces of maize in central Mexico: an altitudinal transect. Economic Botany, 57(1), 7–20. Doi: 10.1663/0013-0001(2003)057[0007:LOMICM]2.0.CO;2
Secretaria de Agricultura y Desarrollo Rural. (2021). No Title. Disponible en: https://nube.siap.gob.mx/avance_agricola/
Sweeney, S., Steigerwald, D. G., Davenport, F., & Eakin, H. (2013). Mexican maize production: Evolving organizational and spatial structures since 1980. Applied Geography, 39, 78–92. https://doi.org/10.1016/j.apgeog.2012.12.005
Related Documents