Candidate Gene Promoter Polymorphisms and Antibody Response Kinetics in Chickens: Interferon-γ, Interleukin-2, and Immunoglobulin Light Chain H. Zhou,* A. J. Buitenhuis,† S. Weigend,‡ and S. J. Lamont* ,1 *Department of Animal Science, Iowa State University, Ames, Iowa 50011-3150 †Animal Breeding and Genetics Group, Wageningen University, Marijkeweg 40, 6709 PG Wageningen, The Netherlands; and ‡Institute for Animal Science and Animal Behaviour, Mariensee, 31535 Neustadt, Germany ABSTRACT An F 2 population was produced from mat- ing G 0 highly inbred (>99%) males of two MHC-congenic Fayoumi lines with G-B1 Leghorn hens. The F 2 population was essentially a full-sibship with the F 1 sire line reflecting MHC effect. Adult F 2 hens (n = 158) were injected twice with SRBC and whole fixed Brucella abortus (BA). Aggluti- nating antibody titer at 7 d after primary immunization and mean titer of the final three samples (Days 18, 32, and 63 after the second immunization) were used as pa- rameters for primary and equilibrium phases, respec- tively. Secondary phase parameters of minimum (Ymin), maximum titers (Ymax) and time needed to achieve mini- mum (Tmin) and maximum (Tmax) titers were estimated from seven postsecondary titers with a nonlinear regres- sion model. Three candidate genes, interferon-γ (IFN-γ), interleukin-2 (IL-2), and immunoglobulin G light chain (IgL) were studied. Primers for the promoter regions were (Key words: candidate gene, primary response, secondary response, antibody kinetics, promoter) 2001 Poultry Science 80:1679–1689 INTRODUCTION The immune system plays an important role in pro- tecting poultry from diseases. Disease resistance in poul- try has been associated with higher antibody levels against specific pathogens, such as Escherichia coli and Pasteurella multocida (Hofacre et al., 1986; Leitner et al., 1992). Understanding genetic control of antibody produc- tion may therefore provide an opportunity for genetic enhancement of vaccine-mediated immunity and resis- tance to disease. Candidate genes provide a logical ap- proach to investigate gene associations with antibody production traits. Cytokines regulate the intensity and duration of the immune response by stimulating or inhibiting activation, 2001 Poultry Science Association, Inc. Received for publication January 16, 2001. Accepted for publication August 24, 2001. 1 To whom correspondence should be addressed: sjlamont@iastate. edu. 1679 designed from EMBL chicken genomic sequences. Poly- morphisms between parental lines were detected by di- rect sequencing. Polymerase chain reaction-restriction fragment length polymorphism methods were then de- veloped to directly detect the polymorphism. There were significant main effects (P < 0.05, general linear model analysis) of IFN-γ polymorphism on Ymax of BA anti- body and interaction of IFN-γ by IgL on primary antibody response to SRBC and BA, and on Tmin and Ymin of antibody response to SRBC in F 2 offspring of M5.1 grand- sires. There were significant main effects of IFN-γ poly- morphism on Tmax of BA and interaction of IFN-γ by IL-2 on Ymin to SRBC in F 2 offspring of M15.2 grandsires. The results suggest that IFN-γ genes play an important role in chicken primary and secondary antibody response to SRBC and BA antigens, and there exists interaction among genes for antibody production. proliferation, or differentiation of various cells and by regulating the secretion of antibodies or other cytokines. Interferon-γ (IFN-γ) and interleukin-2 (IL-2) play a critical role in immune system function. IFN-γ increases expres- sion of MHC Class I and Class II molecules that modulate immune response (Kuby, 1997). IL-2 induces the prolifer- ation and differentiation of T, B, and NK cells. IFN-γ has been implicated in immune response to various avian diseases (Kaiser, 1996). Correlation between an IFN-γ pro- moter polymorphism and resistance to Escherichia coli in- fection in chickens has been reported (Kaiser et al., 1998). In humans, a CA repeat polymorphism of the IFN-γ gene Abbreviation Key: BA = Brucella abortus; FDR = false discovery rate; FF = homozygous Fayoumi phenotype; IgL = immunoglobulin light chain; IFN-γ = interferon-γ; IL-2 = interleukin-2; LF = heterozygous Leghorn-Fayoumi phenotype; LL = homozygous Leghorn phenotype; PCR = polymerase chain reaction; QTL = quantitative trait loci; RFLP = restriction fragment length polymorphism; Tmax = time needed to achieve maximum secondary titers; Tmin = time needed to achieve minimum secondary titers; Ymax = maximum secondary titer; Ymin = minimum secondary titer. by guest on April 6, 2016 http://ps.oxfordjournals.org/ Downloaded from

Welcome message from author
This document is posted to help you gain knowledge. Please leave a comment to let me know what you think about it! Share it to your friends and learn new things together.
Transcript

Candidate Gene Promoter Polymorphisms and Antibody Response Kineticsin Chickens: Interferon-γ, Interleukin-2, and Immunoglobulin Light Chain
H. Zhou,* A. J. Buitenhuis,† S. Weigend,‡ and S. J. Lamont*,1
*Department of Animal Science, Iowa State University, Ames, Iowa 50011-3150†Animal Breeding and Genetics Group, Wageningen University, Marijkeweg 40, 6709 PG
Wageningen, The Netherlands; and ‡Institute for Animal Scienceand Animal Behaviour, Mariensee, 31535 Neustadt, Germany
ABSTRACT An F2 population was produced from mat-ing G0 highly inbred (>99%) males of two MHC-congenicFayoumi lines with G-B1 Leghorn hens. The F2 populationwas essentially a full-sibship with the F1 sire line reflectingMHC effect. Adult F2 hens (n = 158) were injected twicewith SRBC and whole fixed Brucella abortus (BA). Aggluti-nating antibody titer at 7 d after primary immunizationand mean titer of the final three samples (Days 18, 32,and 63 after the second immunization) were used as pa-rameters for primary and equilibrium phases, respec-tively. Secondary phase parameters of minimum (Ymin),maximum titers (Ymax) and time needed to achieve mini-mum (Tmin) and maximum (Tmax) titers were estimatedfrom seven postsecondary titers with a nonlinear regres-sion model. Three candidate genes, interferon-γ (IFN-γ),interleukin-2 (IL-2), and immunoglobulin G light chain(IgL) were studied. Primers for the promoter regions were
(Key words: candidate gene, primary response, secondary response, antibody kinetics, promoter)
2001 Poultry Science 80:1679–1689
INTRODUCTION
The immune system plays an important role in pro-tecting poultry from diseases. Disease resistance in poul-try has been associated with higher antibody levelsagainst specific pathogens, such as Escherichia coli andPasteurella multocida (Hofacre et al., 1986; Leitner et al.,1992). Understanding genetic control of antibody produc-tion may therefore provide an opportunity for geneticenhancement of vaccine-mediated immunity and resis-tance to disease. Candidate genes provide a logical ap-proach to investigate gene associations with antibodyproduction traits.
Cytokines regulate the intensity and duration of theimmune response by stimulating or inhibiting activation,
2001 Poultry Science Association, Inc.Received for publication January 16, 2001.Accepted for publication August 24, 2001.1To whom correspondence should be addressed: sjlamont@iastate.
edu.
1679
designed from EMBL chicken genomic sequences. Poly-morphisms between parental lines were detected by di-rect sequencing. Polymerase chain reaction-restrictionfragment length polymorphism methods were then de-veloped to directly detect the polymorphism. There weresignificant main effects (P < 0.05, general linear modelanalysis) of IFN-γ polymorphism on Ymax of BA anti-body and interaction of IFN-γ by IgL on primary antibodyresponse to SRBC and BA, and on Tmin and Ymin ofantibody response to SRBC in F2 offspring of M5.1 grand-sires. There were significant main effects of IFN-γ poly-morphism on Tmax of BA and interaction of IFN-γ byIL-2 on Ymin to SRBC in F2 offspring of M15.2 grandsires.The results suggest that IFN-γ genes play an importantrole in chicken primary and secondary antibody responseto SRBC and BA antigens, and there exists interactionamong genes for antibody production.
proliferation, or differentiation of various cells and byregulating the secretion of antibodies or other cytokines.Interferon-γ (IFN-γ) and interleukin-2 (IL-2) play a criticalrole in immune system function. IFN-γ increases expres-sion of MHC Class I and Class II molecules that modulateimmune response (Kuby, 1997). IL-2 induces the prolifer-ation and differentiation of T, B, and NK cells. IFN-γ hasbeen implicated in immune response to various aviandiseases (Kaiser, 1996). Correlation between an IFN-γ pro-moter polymorphism and resistance to Escherichia coli in-fection in chickens has been reported (Kaiser et al., 1998).In humans, a CA repeat polymorphism of the IFN-γ gene
Abbreviation Key: BA = Brucella abortus; FDR = false discovery rate;FF = homozygous Fayoumi phenotype; IgL = immunoglobulin lightchain; IFN-γ = interferon-γ; IL-2 = interleukin-2; LF = heterozygousLeghorn-Fayoumi phenotype; LL = homozygous Leghorn phenotype;PCR = polymerase chain reaction; QTL = quantitative trait loci; RFLP= restriction fragment length polymorphism; Tmax = time needed toachieve maximum secondary titers; Tmin = time needed to achieveminimum secondary titers; Ymax = maximum secondary titer; Ymin =minimum secondary titer.
by guest on April 6, 2016
http://ps.oxfordjournals.org/D
ownloaded from

ZHOU ET AL.1680
is associated with susceptibility to type 1 diabetes (Jah-romi et al., 2000).
The promoter region located upstream from the initia-tion site plays an important role in regulating gene expres-sion. Several transcription regulatory elements have beenidentified in the mammalian IFN-γ gene promoter, suchas the TATAATA box, the GATA motif, GM-CSF/MIPmotif, and consensus octamer site (ATGCAAAT) (Penixet al., 1993). Some of these elements are conserved inchickens, such as the TATAATA box, GM-CSF/MIP mo-tif, and potential NF-κB family member-binding site. Butthe octamer site is absent from chickens (Kaiser et al.,1998). Potential regulatory sequences identified in thechicken IL-2 promoter include a composite NF-AT/″AP-1″ element, a CD-28 response element, an AP-1 element,an NF-AT element, and the AP-1 part of an AP-1/octamercomposite element (Kaiser and Marani, 1999). The Ig pro-moter region in mammals contains conserved heptamerand octamer elements, which are preferentially involvedin Ig promoter activity (Bemark et al., 1998; Landolfi etal., 1988). The octamer sequence motif has been identifiedas an important region for promoter activity in the Iglambda light chain (IgL) in chickens (Heltemes et al.,1997).
Two common antigens are often used to elicit antibodyproduction in hens: SRBC, a T-cell-dependent antigen,and Brucella abortus (BA), a T-cell-independent antigen(Munns and Lamont, 1991). Use of SRBC and BA allowsevaluation of differences in the induction pathways ofantibody formation.
In addition to the level of the antibody response, thereaction kinetics may play a key role in immunologicaldefense. The kinetics of the antibody response to SRBCand BA antigens may be influenced by the different im-munological pathways triggered by the two antigens(Weigend et al., 1997). The time course of the humoralimmune response is of importance in controlling infectionby pathogens. The early high response in antibody pro-duction after vaccination may positively affect the sur-vival rate in pathogen challenge in chickens. And so, itis of interest to describe such important kinetics features,such as strength and rapidity.
The antibody response in young chickens has beencharacterized in many experiments (Kreukniet and vander Zijpp, 1990; LePage et al., 1996; Karaca et al., 1999;Yang et al., 2000) but is rarely investigated in adults.Antibody production in adults may protect breeder orlayer hens and provide protection for chicks from patho-gens by passive immunity.
The overall goal of this study was to increase knowl-edge of the genes controlling antibody response kineticsin adult chickens. The specific objectives were to identifypromoter polymorphisms in IFN-γ, IL-2, and IgL genesof the chickens, develop polymerase chain reaction (PCR)-restriction fragment length polymorphism (RFLP) meth-
2Difco Laboratories, Detroit, MI 48232.
ods to detect those DNA polymorphisms, and evaluateassociations between promoter polymorphisms and anti-body response kinetics in a unique F2 cross of inbred lines,representing an antibody kinetics resource population forgene mapping.
MATERIALS AND METHODS
Experimental Populations
Genetically distinct, highly inbred (> 99%) chicken lines(Leghorn G-B1 and MHC-congenic Fayoumi M15.2 andM5.1; Warner et al., 1989; Chen and Lamont, 1992; Zhouand Lamont, 1999) were used as parental G0 lines. The Bhaplotypes of G-B1, M15.2, and M5.1 are B50, B43, and B44,respectively (Zhou and Lamont, 1999). One male fromeach Fayoumi line was mated to nine hens of the G-B1line to produce an F1 generation. From F1 offspring ofeach Fayoumi sire, four sires and eight dams, were usedto produce an F2 generation that was, because of thehighly inbred nature of the G0 birds essentially a fullsibship (a clone-ship), with G0 sire lineage reflecting MHCeffect. Therefore, two separate branches of the F2 popula-tion were generated from the two MHC-congenic Fay-oumi sires, M5.1 and M15.2. Because the sires are MHC-congenic, the only difference expected between the twobranches was to be the MHC-bearing microchromosomeinherited from the Fayoumi sires. Females (n = 158) ofthe F2 resource population were used.
Antigen Administrationand Sample Collection
At 19 and 23 wk of age, chickens were injected intra-muscularly with 0.1 mL of undiluted BA antigen2 and 0.1mL of 20% SRBC in phosphate-buffered saline. Bloodsamples were obtained from the peripheral vein of thewing of each bird preceding each immunization to deter-mine the baseline antibody level, and at 7 d after primaryimmunization, and at 4, 7, 10, 18, 32, and 63 d after second-ary immunization. Plasma was collected after centrifug-ing (1,000 rpm, 10 min) the blood samples and was storedat –20 C until all assays were run simultaneously.
Agglutination Assays
The SRBC and BA antibodies were assayed by aggluti-nation (Nelson et al., 1995). The agglutination titer wasexpressed as the log2 of the reciprocal of the greatestdilution showing 50% agglutination.
Development of PCR-RFLP Assays
Chicken genomic DNA was isolated from venous bloodcollected in EDTA. PCR was carried out with 100 nggenomic DNA from one male and one female from eachof the pure inbred lines (G-B1, M15.2, and M5.1) to detectpotential promoter sequence polymorphisms. The PCR
by guest on April 6, 2016
http://ps.oxfordjournals.org/D
ownloaded from

CANDIDATE GENES AND ANTIBODY RESPONSE KINETICS 1681
products were purified by Centri Spin Column3 for DNAsequencing. Purified PCR products were sequenced bythe DNA Sequencing and Synthesis Facility.4 Sequenceswere analyzed using Sequence Navigator version 1.0.15
and were compared by the BLAST program to detectpolymorphisms between the lines. The restriction enzymesites on these sequences were detected by WisconsinPackage 9.1.6
IFN-γ Gene Promoter. The PCR primers (5′ GT AAGGAA CTT CAG CCA TTG 3′; 5′ GAC GAA TGA ACTTCA TCT GCC 3′) were designed to amplify a 670-bpfragment by Oligo 57 according to chicken genomic se-quence (EMBL accession #: Y079221). The IFN-γ genepromoter DNA fragment was generated from genomicDNA of parental lines by PCR. The reaction conditionswere 94 C for 4 min; 30 cycles of 94 C, 1 min; 58 C, for1 min; 72 C, for 1 min; and an extension at 72 C for 10min. The reaction included 100 ng of template, 1 × reactionbuffer, 10 pmol of each primer, 0.2 mM dNTP, 1.5 mMMgCl2, and 1 U Taq polymerase.8
IL-2 Gene Promoter. Primers (5′ TGC TTT TAA CCGTCT TTG 3′; 5′ GAT GCT CCA TAA GCT GTA GT 3′)were designed to amplify a 659-bp fragment using Oligo5, based on chicken genomic sequence in EMBL database(accession #: AJ224516). The PCR reaction conditions werethe same as for the IFN-γ gene promoter, except that theannealing temperature was 61 C.
IgL Gene Promoter. Primers (5′ GCA GGT GGT TCAAAG AAA CGT 3′; 5′ GGC GGA ATC CCA GCA GCTGT 3′) were designed based on database sequence (acces-sion #: M24403), and PCR conditions used were devel-oped by Heltemes et al. (1997). Based on the specificsequence of the lines used in this study, new primers (5′TTT ATA CCC GCG TCC TTC 3′; 5′ GGG AAA TACTGG TGA TAG GTG 3′) were designed to produce a 354-bp fragment. The PCR conditions were the same as above,except for annealing temperature (57 to 61 C).
Screening of the F2 Population
A PCR of DNA of each individual F2 bird was per-formed for each promoter polymorphism according tothe conditions described above. For the IFN-γ gene, thePCR product was digested using 2 U Tsp509 I9 at 65 Covernight. The restriction digests were electrophoresedfor 2 h at 100 V on a 4% agarose gel with ethidium bro-mide. For the IL-2 gene, 5 U Mnl I9 was used to digestat 37 C overnight, and the digested products were runfor 2 h at 100 V on a 3% agarose gel with ethidiumbromide. For the IgL gene, 5 U Sau96 I9 was used to digest
3Princeton Separation, Adelphia, NJ 07710.4Iowa State University, Ames, IA 50011.5Applied Biosystem, Perkin-Elmer, Foster City, CA 94404.6Genetics Computer Group (GCG), Inc., Madison, WI 53711.7National Bioscience, Inc., Plymouth, MN 55447.8Promega Co., Madison, WI 53711.9New England Biolabs, Inc., Beverly, MA 01915-5599.10SAS Institute Inc., Cary, NC 27513.
at 37 C overnight, and digested amplification productswere electrophoresed for 2 h at 80 V on a 3% agarose gelwith ethidium bromide. Samples were scored for theirindividual PCR-RFLP fragment sizes, based on standardDNA molecular weight markers for each gene promoter,by visualizing the banding pattern under UV light.
Statistical Analysis
The analyses of antibody response were separately con-ducted by antigen (SRBC and BA) and by phase (primary,secondary, and equilibrium). For the SRBC and BA pri-mary phase, the single time-point measurement taken at7 d postprimary immunization (Y) was used, because themaximum primary antibody response to these antigens isgenerally between 5 and 8 d after primary immunization(Siegel and Gross, 1980; van der Zijpp, 1983; Scott et al.,1994). Secondary phase parameters of maximum titers(Ymax), time (Tmax) needed to achieve maximum titers,minimum titers (Ymin), and time (Tmin) needed toachieve minimum titers were estimated from seven indi-vidual time-point postsecondary titer values (taken fromDays 4 to 63 after secondary immunization) by using anonlinear regression model (Weigend et al., 1997). Forthe equilibrium phase, the titers of the last three sampletimes were used to calculate the mean of the phase. Thegeneral linear models test was used to estimate Fayoumisire effect and interaction between sire and the three can-didate genes on the antibody response parameters. Be-cause significant interactions (P < 0.05, data not shown)were found between sire and some antibody parameters,data were thereafter analyzed separately for F2 individu-als derived from the two grandsires. This significant inter-action is interpreted as being caused by the only geneticdifference between the grandsires, their MHC. No poly-morphism was found in the IL-2 gene promoter regionbetween the G-B1 and M5.1 lines; therefore, different sta-tistical models were used for F2 individuals derived fromM15.2 and M5.1 line grandsires.
M15.2 Yijkl = µ + IFN-γi + IL-2j + IgLk + IFN-γi × IL-2j
+ IFN-γi × IgLk + IL-2j × IgLk + eijkl
M5.1 Yijk = µ + IFN-γi + IgLj + IFN-γi × IgLj + eijk
where Yijkl and Yijk are defined as the dependent traits(Y, Ymax, Tmax, Ymin, and Tmin). The three candidategenes had three levels of genotypes defined as Leghornhomozygote (LL), heterozygote (LF), and Fayoumi homo-zygote (FF). The JMP� program10 (Sall and Lehman, 1996)was used to conduct the general linear models test forassociation between genotype and antibody response pa-rameters.
RESULTS
Sequence Variation and PCR-RFLP
For the IFN-γ gene promoter region, the amplified, 670-bp product was sequenced for each parent line. There
by guest on April 6, 2016
http://ps.oxfordjournals.org/D
ownloaded from

ZHOU ET AL.1682
FIGURE 1. Polymerase chain reaction-restriction fragment length polymorphism (PCR-RFLP) pattern for candidate genes. AA = Leghornhomozygote, AG = heterozygote, and GG = Fayoumi homozygote. (a) Interferon-γ (IFN-γ) gene promoter with Tsp509 I digestion. (b) Interleukin-2 (IL-2) gene promoter with Mnl I digestion.
were three base-pair mutations between the Leghorn andboth Fayoumi lines (A for G, C for T, and A for G, atbases –277, –317, and –318, respectively). A line-specificrestriction enzyme (Tsp509 I) site at base –318 was identi-fied. The restriction digests produced fragment sizes of123, 99, 88, 56, 55, 53, and 28 bp for both parental lines,whereas the Leghorn line had an additional fragmentof 168 bp, and the Fayoumi lines both had two extrafragments, 104 and 64 bp (Figure 1a).
For the IL-2 promoter region, a 659-bp product wasobtained from Leghorn and Fayoumi lines and se-quenced. An A/G mutation at base –425 was found be-tween Leghorn and Fayoumi M15.2 lines, and no muta-tion was found between Leghorn and M5.1. The restric-tion enzyme Mnl I was used to differentiate between theLeghorn and the M15.2 lines. The digested products hadfragments of 165, 115, and 19 bp for both lines, and aline-specific fragment (251 bp) for M15.2, and two line-specific fragments (139 and 112 bp) for Leghorn (Figure1b).
For the IgL promoter region, a 466-bp fragment con-taining the TATA-box, and the octamer sequence wasobtained for all three lines. Three single base-pair muta-tions (T/C, C/G, and T/C at 30, 46, and 60 bp upstreamof the octamer sequence) were found between the G-B1and Fayoumi line, respectively. The T/C mutation, 60bp upstream of the octamer sequence, could be used todifferentiate between the G-B1 and the Fayoumi lines byusing the restriction enzyme Sau96 I. For more efficientPCR amplification, new primers were designed to pro-duce a 354-bp DNA fragment. Restriction of the amplifiedproduct using Sau96 I resulted in a 161-bp fragment andtwo predicted 10-bp fragments for the Leghorn and Fay-oumi lines. The Leghorn line had an additional line-spe-cific 173-bp fragment. The Fayoumi lines had two addi-tional fragments of 103 and 70 bp (data not shown).
Associaton of Three Candidate GenePromoter Polymorphismswith Antibody Response
The P-values of main effects and interactions are shownin Table 1 of IFN-γ and IgL promoter polymorphisms onchicken antibody parameters of primary, secondary, andequilibrium phase in F2 offspring of M5.1 grandsires andfor IFN-γ, IL-2, and IgL promoter polymorphisms in F2offspring of M15.2 grandsires. The IFN-γ promoter poly-morphism had the most frequent associations with anti-body response parameters. There were significant mainassociations (P < 0.05) between IFN-γ promoter polymor-phism and antibody parameters and significant two-wayinteractions (P < 0.05) of IFN-γ by IgL on antibody param-eters. For F2 offspring of the M5.1 grandsire, there weresignificant associations (P < 0.05) between the IFN-γ poly-morphism and primary antibody response to SRBC andYmax of BA and between the IgL polymorphism andprimary antibody response to both SRBC and BA. Therewere significant (P < 0.05) effects of the two-way interac-tion of IFN-γ by IgL on primary antibody response toSRBC and BA and on Tmin and Ymin to SRBC. For F2 theoffspring of the M15.2 grandsire, there were significanteffects (P < 0.05) of the IFN-γ polymorphism on Tmax ofBA and of the two-way interaction of IFN-γ and IL-2 onYmin of SRBC.
Main Effect of Candidate Gene Alleleson Antibody Response
The allelic effect of IFN-γ and IgL on antibody responseis presented in Table 2 for the five instances of significant(P < 0.05) main effects of genotype. Effect of the candidategene alleles in both MHC-congenic lineages is presented,even though significant differences usually occurred inone only. Most of the candidate gene main effects (four
by guest on April 6, 2016
http://ps.oxfordjournals.org/D
ownloaded from

CANDIDATE GENES AND ANTIBODY RESPONSE KINETICS 1683
TABLE 1. Main effects and interaction (P-values) of interferon-γ gene (IFN-γ), interleukin-2 gene (IL-2), and immunoglobulin light chaingene (IgL) promoter polymorphisms on chicken antibody parameters of primary, secondary,
and equilibrium phases in F2 females of an inbred cross
SRBC Brucella abortus
Y1 Tmin2 Ymin3 Tmax4 Ymax5 Equilibrium6 Y Tmin Ymin Tmax Ymax Equilibrium
M5.1 grandsiresIFN-γ 0.04 0.17 NS7 NS NS 0.18 NS NS NS NS 0.01 0.16IgL 0.03 0.08 NS NS NS NS 0.02 NS NS NS NS NSIFN-γ*Ig 0.02 0.02 0.058 0.13 NS 0.18 0.059 NS 0.07 0.11 NS 0.13
M15.2 grandsiresIFN-γ NS NS NS NS NS NS NS 0.08 NS 0.04 NS NSIL-2 NS NS NS NS NS NS NS NS NS NS NS 0.06IgL NS NS NS NS NS NS NS NS NS NS NS NSIFN-γ*IL-2 NS NS 0.04 NS NS NS NS NS NS NS NS NSIFN-γ*Ig NS NS 0.11 NS NS NS NS NS NS NS NS NSIL-2*Ig NS NS NS NS NS NS NS NS 0.20 NS NS NS
1Primary antibody response.2Time required to achieve minimum secondary antibody titers.3Minimum secondary antibody titers.4Time required to achieve maximum secondary antibody titers.5Maximum secondary antibody titers.6Equilibrium phase antibody titers.7NS, P > 0.20.8All P-values are rounded to two significant digits. Actual value is P = 0.0486.9All P-values are rounded to two significant digits. Actual value is P = 0.0465.
of five) were detected in the M5.1 grandsire lineage. Ofthese four instances, the Leghorn homozygous type (LL)of the candidate gene was most frequently significantlydifferent (P < 0.05, Table 2) from the heterozygous (LF)and other homozygous type (FF). For the primary anti-body response to both antigens, the mean of the IgL-LLhens was significantly lower than the other two alleliccombinations. For the secondary response to BA, how-ever, the hens inheriting both IFN-γ alleles from the Leg-horn line had a significantly higher Ymax. Thus, the Leg-horn-derived alleles are not generally detrimental in re-gards to antibody production but may vary by specificgene. For primary response to SRBC, the IFN-γ heterozy-gous hens had a response significantly higher than theother two genotypes. Only one main effect was detected
TABLE 2. Allelic effect of interferon-γ gene (IFN-γ) and immunoglobulin light chain gene (IgL) genotypeon primary antibody response means to SRBC and Brucella abortus (BA), Tmax, and Ymax antibody
response means to BA in F2 offspring of M5.1 and M15.2 grandsire
M5.11 M15.22
Gene Trait LL3 LF FF LL LF FFP
IgL YS4 (titer log2) 3.90b 5.64a 5.24a 4.75a 5.15a 4.52a
IgL YB5 (titer log2) 9.08b 10.56a 10.85a 9.80a 10.26a 10.28a
IFN-γ YS (titer log2) 4.21b 5.84a 4.72b 5.37a 4.65a 4.40a
IFN-γ TmaxB6 (d) 14.20a 19.33a 13.41a 16.04ab 20.89a 10.56b
IFN-γ YmaxB7 (titer log2) 9.71a 8.02b 8.67b 8.53a 8.88a 8.57a
a-bMeans in a row within a grandsire MHC type with no common superscript differ significantly (P < 0.05).1F2 offspring of M5.1 grandsire.2F2 offspring of M15.2 grandsire.3LL = Leghorn homozygote; LF = Heterozygote of Leghorn and Fayoumi genotype; FF = Fayoumi homozygote.4Primary antibody response to SRBC.5Primary antibody response to Brucella abortus.6Time required to achieve maximum secondary antibody titers to Brucella abortus.7Maximum secondary antibody titers to Brucella abortus.
in the M15.2 lineage, for the IFN-γ effect on Tmax toBA, in which the heterozygous and the Fayoumi-allelehomozygous hens had significantly different responsesfrom each other (heterozygote was higher), but neitherdiffered from the Leghorn-allele homozygous group.
Effect of Candidate Gene AllelicInteractions on Antibody Response
For primary antibody response of hens of the M5.1lineage to both antigens (Figure 2a,b), the birds inheritinghomozygous alleles from the Leghorn line for IgL andIFN-γ had significantly lower antibody levels than anyof the other eight genotypic combinations of these twoloci. To display and test the individual two-way interac-
by guest on April 6, 2016
http://ps.oxfordjournals.org/D
ownloaded from
ZHOU ET AL.1684
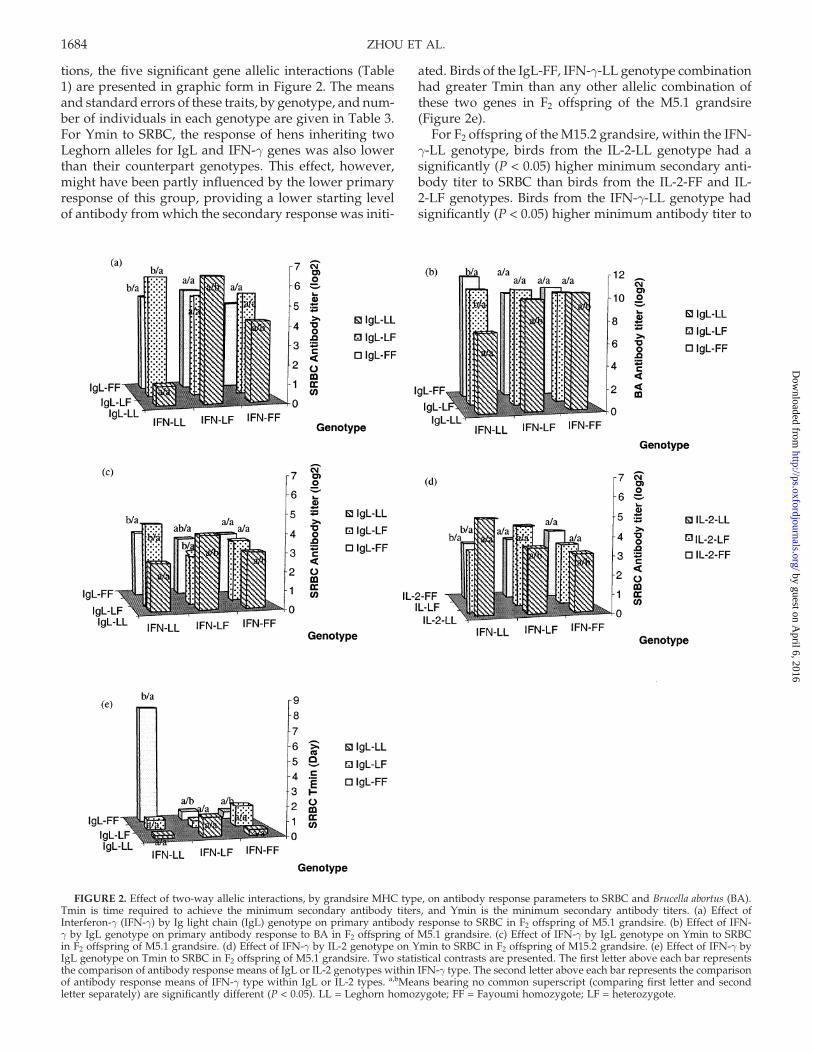
tions, the five significant gene allelic interactions (Table1) are presented in graphic form in Figure 2. The meansand standard errors of these traits, by genotype, and num-ber of individuals in each genotype are given in Table 3.For Ymin to SRBC, the response of hens inheriting twoLeghorn alleles for IgL and IFN-γ genes was also lowerthan their counterpart genotypes. This effect, however,might have been partly influenced by the lower primaryresponse of this group, providing a lower starting levelof antibody from which the secondary response was initi-
FIGURE 2. Effect of two-way allelic interactions, by grandsire MHC type, on antibody response parameters to SRBC and Brucella abortus (BA).Tmin is time required to achieve the minimum secondary antibody titers, and Ymin is the minimum secondary antibody titers. (a) Effect ofInterferon-γ (IFN-γ) by Ig light chain (IgL) genotype on primary antibody response to SRBC in F2 offspring of M5.1 grandsire. (b) Effect of IFN-γ by IgL genotype on primary antibody response to BA in F2 offspring of M5.1 grandsire. (c) Effect of IFN-γ by IgL genotype on Ymin to SRBCin F2 offspring of M5.1 grandsire. (d) Effect of IFN-γ by IL-2 genotype on Ymin to SRBC in F2 offspring of M15.2 grandsire. (e) Effect of IFN-γ byIgL genotype on Tmin to SRBC in F2 offspring of M5.1 grandsire. Two statistical contrasts are presented. The first letter above each bar representsthe comparison of antibody response means of IgL or IL-2 genotypes within IFN-γ type. The second letter above each bar represents the comparisonof antibody response means of IFN-γ type within IgL or IL-2 types. a,bMeans bearing no common superscript (comparing first letter and secondletter separately) are significantly different (P < 0.05). LL = Leghorn homozygote; FF = Fayoumi homozygote; LF = heterozygote.
ated. Birds of the IgL-FF, IFN-γ-LL genotype combinationhad greater Tmin than any other allelic combination ofthese two genes in F2 offspring of the M5.1 grandsire(Figure 2e).
For F2 offspring of the M15.2 grandsire, within the IFN-γ-LL genotype, birds from the IL-2-LL genotype had asignificantly (P < 0.05) higher minimum secondary anti-body titer to SRBC than birds from the IL-2-FF and IL-2-LF genotypes. Birds from the IFN-γ-LL genotype hadsignificantly (P < 0.05) higher minimum antibody titer to
by guest on April 6, 2016
http://ps.oxfordjournals.org/D
ownloaded from

CANDIDATE GENES AND ANTIBODY RESPONSE KINETICS 1685
TA
BL
E3.
Mea
n,s
tan
dar
der
ror,
and
nu
mb
erof
ind
ivid
ual
sof
inte
ract
ion
effe
cts
ofin
terf
eron
-γge
ne
(IFN
-γ)
and
imm
un
oglo
bu
lin
ligh
tch
ain
gen
e(I
gL)
onp
rim
ary
anti
bod
yre
spon
sem
ean
sto
Bru
cell
aab
ortu
s(B
A),
Tm
in,a
nd
Ym
inan
tib
ody
resp
onse
mea
ns
toS
RB
Cin
F 2of
fsp
rin
gof
M5.
1gr
and
sire
and
inte
ract
ion
effe
cts
ofIF
N-γ
and
inte
rleu
kin
-2(I
L-2
)on
Ym
inan
tib
ody
resp
onse
mea
ns
toS
RB
Cin
F 2of
fsp
rin
gM
15.2
gran
dsi
re
IgL
Pri
mar
yan
tibo
dy
resp
onse
toSR
BC
(YS)
Pri
mar
yan
tibo
dy
resp
onse
toB
A(Y
B)
Tim
ere
quir
edto
achi
eve
min
imum
seco
ndar
y(t
iter
log2
)(t
iter
log2
)an
tibo
dy
tite
rsto
SRB
C(T
min
S)(d
)
Gen
eG
enot
ype
LL
1L
FFF
LL
LF
FFL
LL
FFF
IFN
-γL
L1.
00±
1.77
(4)2
6.40
±0.
56(6
)5.
25±
0.88
(5)
5.00
±1.
57(4
)10
.60
±0.
50(6
)11
.75
±0.
79(5
)0.
24±
2.49
(4)
0.71
±1.
76(6
)8.
38±
1.76
(5)
LF
6.40
±0.
79(1
0)5.
40±
0.56
(11)
5.63
±0.
63(1
1)9.
80±
0.70
(10)
10.8
0±
0.50
(11)
10.1
3±
0.56
(11)
1.29
±1.
44(1
0)0.
51±
1.06
(11)
0.63
±1.
33(1
1)FF
4.20
±0.
79(4
)5.
13±
0.46
(8)
4.83
±0.
72(6
)10
.40
±0.
70(4
)10
.29
±0.
42(8
)10
.67
±0.
64(6
)0.
36±
1.58
(4)
1.47
±0.
99(8
)0.
52±
1.44
(6)
IgL
IL-2
Min
imum
seco
ndar
yan
tibo
dy
resp
onse
toSR
BC
Ym
inS
(tit
erlo
g2)
Ym
inS
(tit
erlo
g2)
Gen
eG
enot
ype
LL
LF
FFL
LL
FFF
IFN
-γL
L2.
49±
0.87
(4)
4.49
±0.
41(6
)3.
54±
0.61
(5)
4.54
±0.
47(8
)3.
38±
0.35
(13)
3.38
±0.
56(6
)L
F3.
92±
0.50
(10)
2.68
±0.
37(1
1)3.
23±
0.46
(11)
3.38
±0.
44(9
)4.
39±
0.32
(17)
3.39
±0.
51(7
)FF
2.99
±0.
55(4
)3.
64±
0.34
(8)
3.48
±0.
50(6
)3.
11±
0.51
(7)
3.28
±0.
44(9
)3.
83±
0.42
(9)
1 LL
=L
egho
rnho
moz
ygot
e;L
F=
hete
rozy
gote
ofL
egho
rnan
dFa
youm
ige
noty
pe;F
F=
Fayo
umi
hom
ozyg
ote.
2 Eff
ect
±SE
M(n
).
SRBC than birds from the IFN-γ-LF genotype, within theIL-2-LL genotype (Figure 2d).
Secondary Antibody Response Kinetics
For the candidate genes that showed significant (P <0.05) main effects or interaction among genes on at leastone secondary immune parameter, the secondary anti-body response kinetics curves are presented by genotype(Figure 3).
For the IFN-γ gene effect on SRBC antibody response,in F2 offspring of the M5.1 grandsire, although startingfrom a higher background titer resulting from primaryimmune response, chickens with the LL genotype did notdisplay higher maximum secondary response levels thanthe other genotypes. The rates of antibody decline wereapproximately equal among the genotypes (Figure 3a).For F2 offspring of the M15.2 grandsire, the three geno-types of IFN-γ have similar patterns of secondary anti-body response to SRBC (Figure 3b).
For the IFN-γ gene effect on BA antibody response, inF2 offspring of the M5.1 grandsires, birds with the LLgenotype had a much greater secondary antibody re-sponse and sustained higher level than the other twogenotypes. The rate of decline of the LL genotype wasapproximately parallel with the genotype FF. Birds withthe LF genotype had an earlier but much lower maximumresponse than the other two genotypes (Figure 3c). ForF2 offspring of the M15.2 grandsires, the three genotypeshave similar pattern of secondary responses to BA (Fig-ure 3d).
For IgL gene and IL-2 gene effects on SRBC antibodyresponse, all genotypes display a similar response curvein F2 offspring of the M5.1 grandsire and in F2 offspringof the M15.2 grandsire, respectively (Figure 3e,f).
DISCUSSION
The IFN-γ, IL-2, and IgL genes play crucial roles inimmune response. The promoter region of the gene, espe-cially many of the important transcriptional regulatoryelements, can regulate gene expression. There were threebase-pair changes in the IFN-γ promoter identified in thisstudy, one of which (base –327) was the same as thatidentified in White Leghorn inbred lines by Kaiser et al.(1998). There was a mutation found in the IL-2 promoterregion in the current study between the Leghorn andM15.2 lines, whereas no polymorphism in this gene pro-moter was found by Kaiser and Mariani (1999). No muta-tion was found between the Leghorn and the M5.1 line.Although M15.2 and M5.1 lines are highly inbred MHC-congenic lines, which means that most DNA should bethe same except the MHC-bearing microchromosome, itis possible that random mutations occurred over time.Three mutations were detected in the IgL gene promoterregion between the Leghorn and Fayoumi lines. None ofthese nucleotide changes lies in any of the importantregulatory elements identified by sequence analysis andcomparison to known mammalian IFN-γ, IL-2, and IgL
by guest on April 6, 2016
http://ps.oxfordjournals.org/D
ownloaded from

ZHOU ET AL.1686
FIGURE 3. Chicken secondary antibody response kinetics of the genotypes of three candidate genes to SRBC or Brucella abortus (BA) in F2offspring of M5.1 or M15.2 grandsires. Lines were generated by nonlinear model. (a) Interferon-γ (IFN-γ) genotypes in F2 offspring of M5.1grandsire. (b) IFN-γ genotypes in F2 offspring of M15.2 grandsire. (c) IFN-γ genotypes in F2 offspring of M5.1 grandsire. (d) IFN-γ genotypes inF2 offspring of M15.2 grandsire. (e) Ig light chain genotypes in F2 offspring of M5.1 grandsire. (f) Interleukin-2 (IL-2) genotypes in F2 offspring ofM15.2 grandsire.
gene promoters, which does not, however, rule out theirplaying a role in the expression of these genes in chickens,or serving as linked markers to polymorphisms control-ling biological traits.
Chicken IL-2 was reported to have 44 to 46% similaritiesto bovine IL-2 and IL-15 (Sundick and Gill-Dixon, 1997).Based on the genomic organization, sequence compari-sons between chicken and mammalian species, and sev-eral other laboratory studies of IL-2 (Kaiser and Mariani,1999; Tirunagaru et al., 2000; Zhou et al., 2001), the se-quence identified as chicken IL-2 is truly IL-2, not IL-15.
The postimmunization time period of this study islonger than most studies, which have generally focusedon the primary antibody response to SRBC or BA andsometimes a brief secondary response phase (van derZijpp et al., 1983; Dunnington et al., 1989, 1990; Larsenet al., 1992; Scott et al., 1994; Boa-Amponsem et al., 1997).The extended time frame of this study (63 d postsecond-ary immunization) allows detailed analysis of secondaryantibody response kinetics and the equilibrium phase, aswell as primary response. Investigation of the secondaryand equilibrium phases supplies an opportunity to ex-plore how long hens can passively transmit a high levelof antibodies to chicks, for estimating the capacity for
passive immune protection from pathogens via vaccineantibody passage.
Examination of the gene allelic interaction between theIFN-γ and IgL polymorphisms on primary antibody re-sponse (Figure 2) suggests that inheritance of Leghornalleles, in homozygous form, for IgL and IFN-γ, is detri-mental to primary antibody production to SRBC and BA(Figure 2a,b), compared to Fayoumi alleles. AlthoughSRBC and BA have slightly different antibody inductionpathways (Nelson et al., 1995), hens of the M5.1 lineagewith homozygous Leghorn alleles had lower response toboth antigens. The advantage conferred by the Fayoumialleles appears to be at least partially dominant in that,generally, homozygous and heterozygous Fayoumi-allelehens outperform the Leghorn homozygotes in primaryantibody production (7-d postprimary immunization). Itis evident, however, that the Leghorn-derived alleles donot have a general detrimental effect in regard to antibodyproduction, in that the hens inheriting both IFN-γ allelesfrom the Leghorn line had a significantly higher Ymaxto BA (Table 2) than the other two IFN genotypes, andhens of M15.2 lineage with homozygous Leghorn allelesfor IFN-γ and IL-2 had generally greater Ymin to SRBC(Figure 2d). The most striking allelic interaction was not
by guest on April 6, 2016
http://ps.oxfordjournals.org/D
ownloaded from

CANDIDATE GENES AND ANTIBODY RESPONSE KINETICS 1687
on level of antibody response but on time required toreach the minimum of the secondary response, in whichIgL-FF/IFN-γ-LL hens far exceeded all other genotypiccombinations of alleles at these two loci (Figure 2e).
No significant main effects or interactions were consis-tently shared among the same genes between the primaryand secondary antibody response phases. A single timepoint (7 d) was used to estimate primary antibody re-sponse, whereas multiple time points were used to esti-mate secondary antibody response. Additionally, differ-ent cell types are involved in antibody production be-tween two antibody response phases. Therefore,differences in apparent gene effects are not unexpected.
SRBC is a T-dependent antigen requiring the help of Tcells to produce antibody, whereas BA is a T-independentantigen for which the B cells can produce antibody withlittle help from the T cells. As illustrated in Figure 3(aand c), SRBC and BA generated very different secondaryantibody response kinetics in F2 offspring of the M5.1 line.The patterns for maximum secondary antibody responseand rate of decline among the three genotypes of the IFN-γ gene between two antigens were very different. Birdsof the LL genotype have the greatest secondary antibodyresponse with BA but not with SRBC. The antibody de-cline rates of three genotypes are different with BA butare similar with SRBC antigen, which demonstrates thatdifferent pathways of antibody formation induced by dif-ferent types of antigens affect the secondary antibodyresponse kinetics. Differential effects of the IFN-γ geneon antibody production to the two different antigenswere evident.
The chicken MHC plays an important role in antibodyproduction and disease resistance (Bacon, 1987; Lamont1998a,b; Rothschild et al., 2000). Different kinetic patternsof secondary response effects of the IFN-γ gene in F2 henswere observed in BA antigen between F2 offspring of thetwo congenic grandsires (Figure 3c,d). In contrasting themain effects and interactions between the F2 offspring ofthe two MHC congenic grandsires, more significant ornear-significant effects were found in the M5.1 than inthe M15.2 grandprogeny. The IFN-γ, IL-2, and IgL genesare not linked with MHC. However, it is possible thatinteractions among expressed products of the MHC andthese genes occur during the process of antibody produc-tion. Our results suggest that the MHC, as evaluatedthrough the F2 branches produced from MHC-congenicgrandsires, has a gene interaction effect on the effects thatother candidate genes exert on antibody production.
The IFN-γ, IgL, and IL-2 genes are reported to be im-portant in immune response in chickens or other species(Kaiser, 1996; Kuby, 1997; Bemark et al., 1998) and were,therefore, specifically chosen as strong candidate genesfor antibody response in chickens. Promoter polymor-phisms of three candidate genes were investigated in thecurrent study. We hypothesized that mutations in pro-moter regions may influence gene expression and therebyregulate immune function.
Benjamini and Hochberg (1995) proposed the false dis-covery rate (FDR) approach to establish statistical signifi-
cance in a multiple-test situation. FDR is the proportion offalse-positive tests among the individual comparisonwisetests that are declared significant. Several studies haveapplied this approach for quantitative trait loci (QTL)mapping with multiple markers (Weller et al., 1998; Zay-kin et al., 2000; Mosig et al., 2001). Mosig et al. (2001)used an FDR of 0.10 for the marker-trait association levelin a genome-wide approach to scan QTL affecting milkprotein percentage in Israeli-Holstein cattle. The signifi-cance level α based on FDR value then will be 0.03 to0.10. In the present study, the situation should be lessstrict than Mosig’s study because three selected candidategenes were tested, rather than conducting a genome-widescan. For F2 offspring of the M5.1 grandsire, 18 statisticaltests were conducted for each antigen. At an α = 0.05,one of 18 tests would be expected to falsely appear assignificant. The number of significant associations de-tected in the current study, however, was much higher:five for SRBC and three for BA response (Table 1). Thisfinding gives strong confidence in the true significanceof most of the detected associations. Additionally, clustersof significance were detected as associated with specificgenes or specific antibody phases, giving additional sup-port to the nonrandom nature of the significant gene-traitassociations that were found in the M5.1 branch of F2
hens. This result contrasts with the situation found in theM15.2 branch in which 36 statistical tests were conductedfor each antigen. Only one test was significant at P < 0.05for each antigen, which is interpreted as likely being afalse discovery. In total, evidence is strong for significantcandidate gene-trait associations being detected in theM5.1 branch only. This difference in associations foundbetween the two branches additionally suggests an inter-action of the three candidate genes with the only differ-ence between the two branches, the MHC-bearing mi-crochromosome.
The current study demonstrates that IFN-γ promoterpolymorphisms had an effect on chicken primary andsecondary antibody response to SRBC and BA antigens.This effect is in agreement with the important role of IFN-γ in immune function. IFN-γ secreted by the TH1 subsetpreferentially inhibits proliferation of the TH2 subset(Wang et al. 1997). TH2 cells are specialized for B-cellactivation to produce antibody. The action of IFN-γ isdirectly on the B cell and is dependent on IL-2 and B-cellactivation through the B-cell Ig receptor. IFN-γ has theability to enhance MHC class II expression and antigen-presenting capacity of cells at the time of primary immu-nization, resulting in higher levels of memory T cells. Theclass II pathway is strongly inducible by IFN-γ on nearlyall cells. All the key genes of the class II antigen-presenta-tion pathway, namely class II α- and β-chains, invariantchain, Ii, and the DMA- and DMB-chains, are requiredfor normal expression of class II at the cell surface andare regulated by a single IFN-γ-inducible transcriptionfactor CIITA (class II transactivator) (Boehm et al., 1997).The IFN-γ gene is highly conserved, and changes in IFN-γexpression are probably due to the influence of regulatoryfactors on gene transcription, rather than gene exon poly-
by guest on April 6, 2016
http://ps.oxfordjournals.org/D
ownloaded from

ZHOU ET AL.1688
morphisms (Giedraitis et al., 1999). Lowenthal et al. (1998)reported that coadministration of chicken IFN-γ withSRBC antigen at the time of primary immunization inchickens resulted in a significant enhancement of the sec-ondary antibody response, which persisted at high levelsfor several weeks. In addition, the coadministration ofchicken IFN-γ significantly increased the proportion ofbirds that effectively responded to SRBC immunizationin secondary response from 20 to 90%.
The goal of poultry geneticists is to effect genetic en-hancement of chicken health and productivity. The candi-date gene approach is a powerful method to identifyQTL, such as those controlling immune response andproduction traits (Rothschild and Soller, 1997). Discoveryof the significant effect of the IFN-γ promoter polymor-phism on antibody production response in chickens illus-trates its potential value for use in marker-assisted selec-tion to improve immune response. This study also dem-onstrates the general usefulness of the candidate geneapproach to discover QTL for immune response traits inthe chicken. The population design of a divergent F2 cross,as used in the current study, is very powerful to detectQTL-linked markers, because of the extensive linkage dis-equilibrium generated in the F2 population. There is,therefore, a possibility that the investigated candidategene polymorphisms are linked markers for the actualQTL, rather than the causative mutations of the measuredbiological effect. Future studies, therefore, will clarifywhether the identified IFN-γ promoter polymorphism iscausative by investigating its relationship with IFN-γ pro-tein production and by investigating trait associations ofthe same DNA polymorphisms in other populations.
ACKNOWLEDGMENTS
We thank Ervin Johnson for collecting samples; NaderDeeb for statistical analysis help; and Zhiliang Hu, WeiLiu, and Michael Kaiser for technical support. The Rom-mert D. Politiek Stichting, the Netherlands, is acknowl-edged for the scholarship provided to A. J. Buitenhuis.This is Journal Paper No. J-19135 of the Iowa Agricultureand Home Economics Experiment Station, Ames, IA; Proj-ect numbers 2237 and 3521.
REFERENCES
Bacon, L. D., 1987. Influence of the major histocompatibilitycomplex on disease resistance and productivity. Poultry Sci.66:802–811.
Bemark, M., D. Liberg, and T. Leanderson, 1998. Conservedsequence elements in K promoters from mice and humans:implications for transcriptional regulation and repertoire ex-pression. Immunogenetics 47:183–195.
Benjamini, Y., and Y. Hochberg, 1995. Controlling the false dis-covery rate: a practical and powerful approach to multipletesting. J. R. Stat. Soc. 57:289–300.
Boa-Amponsem, K., E. A. Dunnington, and P. B. Siegel, 1997.Antibody transmitting ability of hens from lines of chickensdiffering in response to SRBC antigen. Br. Poult. Sci.38:480–484.
Boehm, U., T. Klamp, M. Groot, and J. C. Howard, 1997. Cellularresponses to interferon-γ. Annu. Rev. Immunol. 15:749–795.
Chen, Y., and S. J. Lamont, 1992. Major histocompatibility com-plex class I restriction fragment length polymorphism analy-sis in highly inbred chicken lines and lines selected for majorhistocompatibility complex and immunoglobulin produc-tion. Poultry Sci. 71:999–1006.
Dunnington, E. A., W. B. Gross, R. W. Briles, W. E. Briles, andP. B. Siegel, 1990. Production traits and alloantigen systemsin lines of chickens selected for high or low antibody re-sponses to sheep erythrocytes. Poultry Sci. 69:871–878.
Dunnington, E. A., A. Martin, R. W. Briles, W. E. Briles, W. B.Gross, and P. B. Siegel, 1989. Antibody responses to sheeperythrocytes for White Leghorn chickens differing in haplo-types of the major histocompatibility complex. Avian Dis.36:49–53.
Giedraitis, V., B. He, and J. Hillert, 1999. Mutation screening ofthe interferon-gamma gene as a candidate gene for multiplesclerosis. Eur. J. Immunogenet. 26:257–259.
Heltemes, L. M., C. K. Tuggle, and S. J. Lamont, 1997. Octamerfunction in the chicken lambda immunoglubulin light chainpromoter. Immunogenetics 47:73–76.
Hofacre, C. L., J. R. Glisson, and S. H. Kleven, 1986. Comparisonof vaccination protocols of broiler breeder hens for Pasteurellamultocida utilizing enzyme-linked immunosorbent assay andvirulent challenge. Avian Dis. 31:260–263.
Jahromi, M., A. Millward, and A. Demaine, 2000. A CA repeatpolymorphism of the IFN-gamma gene is associated withsusceptibility to type 1 diabetes. J. Interferon Cytokine Res.20:187–190.
Kaiser, P., 1996. Avian cytokines. Pages 83-114 in: Poultry Immu-nology. T. T. Davison, T. R. Morris, and L. N. Payne, ed.Carfax, Abingdon, UK.
Kaiser, P., M. W. Hester, and R. Lisa. 1998. Structure of thechicken interferon-γ gene, and comparison to mammalianhomologues. Gene 207:25–32.
Kaiser, P., and P. Mariani, 1999. Promoter sequence, exon:intronstructure, and synteny of genetic location show that a chickencytokine with T-cell proliferative activity is IL2 and not IL15.Immunogenetics 49:26–35.
Karaca, M., E. Johnson, and S. J. Lamont, 1999. Genetic lineand major histocompatibility complex effects on primary andsecondary antibody responses to T-dependent and T-inde-pendent antigens. Poultry Sci. 78:1518–1525.
Kreukniet, M. B. and A. J. van der Zijpp, 1990. Effect of differentdoses of sheep erythrocytes on the humoral immune re-sponse of chicken lines selected for high or low antibodyproduction. Poultry Sci. 69:608–614.
Kuby, J., 1997. Pages 326–328 in: Immunology. W. H. Freemanand Company, New York, NY.
Lamont, S. J., 1998a. Impact of genetics on disease resistance.Poultry Sci. 77:1111–1118.
Lamont, S.J., 1998b. The chicken major histocompatibility com-plex (MHC) and disease. In: Genetic Resistance to AnimalDisease. OIE Sci. Tech. Rev. 17:128–142.
Landolfi, N. F., X. M. Yin, J. D. Capra, and P. W. Tucker, 1988.A conserved heptamer upstream of the IgH promoter regionoctamer can be the site of a coordinate protein-DNA interac-tion. Nucleic Acids Res. 16:5503–5514.
Larsen, C. T., W. B. Gross, and P. B. Siegel, 1992. Antibodyresponses to combinations of antigens in White Leghornchickens of different background genomes and major histo-compatibility complex genotypes. Poultry Sci. 71:1801–1806.
Leitner, G., Z. Uni, A. Cahaner, M. Gutman, and E. D. Heller,1992. Replicated divergent selection of broiler chickens forhigh or low early antibody response to Escherichia coli vacci-nation. Poultry Sci. 71:27–37.
LePage, K. T., S. E. Bloom, and R. L. Taylor Jr., 1996. Antibodyresponse to sheep red blood cells in major histocompatibility(B) complex aneuploid line of chickens. Poultry Sci.75:346–350.
Lowenthal, J. W., T. E. O’Neil, M. Broadway, A. David, G. Strom,M. R. Digby, M. Andrew, and J. J.York, 1998. Coadministra-
by guest on April 6, 2016
http://ps.oxfordjournals.org/D
ownloaded from

CANDIDATE GENES AND ANTIBODY RESPONSE KINETICS 1689
tion of IFN-γ enhances antibody responses in chickens. J.Interferon Cytokine Res. 18:617–622.
Mosig, M. O., E. Lipkin, G. Khutoreskaya, E. Tchourzyna, M.Soller, and A. Friedmann, 2001. A whole genome scan forquantitative trait loci affecting milk protein percentage inIsraeli- Holstein cattle, by means of selective milk DNA pool-ing in a daughter design, using an adjusted false discoveryrate criterion. Genetics 157:1683–1698.
Munns, P. L., and S. J. Lamont, 1991. Effects of age and immuni-zation interval on the anamnestic response to T-cell-depen-dent and T-cell-independent antigens in chickens. PoultrySci. 70:2371–2374.
Nelson, N. A., N. Lakshmanan, and S. J. Lamont, 1995. Sheepred blood cells and Brucella abortus antibody responses inchickens selected for multitrait immunocompetence. PoultrySci. 74:1603–1609.
Penix, L., W. M. Weaver, Y. Pang, H. A. Young, and C. B. Wilson,1993. Two essential regulatory elements in the human inter-feron-γ promoter confer activation specific expression in Tcells. J. Exp. Med. 178:1483–1496.
Rothschild, M. F., L. Skow, and S. J. Lamont, 2000. The majorhistocompatibility complex and its role in disease resistanceand immune responsiveness. Pages 73–105 in: Breeding forDisease Resistance in Farm Animals. R. E. Axford, ed. CABIPress, Oxon, UK.
Rothschild, M. F., and M. Soller, 1997. Candidate gene analysisto detect traits of economic importance in domestic livestock.Probe 8:13–20.
Sall, J., and A. Lehman, 1996. JMP� Start Statistics: A Guideto Statistical and Data Analysis Using JMP� and JMP IN�Software. Duxbury Press, Wadsworth Publishing Company,Belmont, CA.
Scott, T. R., E. A. Dunnington, and P. B. Siegel, 1994. Brucellaabortus antigen response of White Leghorn chickens selectedfor high and low antibody responsiveness to sheep eythro-cytes. Poultry Sci. 73:346–349.
Siegel, H. S., H. L. Marks, and J. W. Latimer, 1984. Agglutininresponses to Salmonella pullorum in Japanese quail selectedfor plasma cholesterol response to adrenocorticotropin anda model describing the dynamics of the response. PoultrySci. 63:1892–1894.
Siegel, P. B., and W. B. Gross, 1980. Production and persistenceof antibodies in chickens to sheep erythrocytes. 1. Directionalselection. Poultry Sci. 59:1–5.
Sundick, R. S., and C. Gill-Dixon, 1997. A cloned chicken lym-phokine homologous to both mammalian IL-2 and IL-15. J.Immunol. 159:720–725.
Tirunagaru, V. G., L. Sofer, J. Cui, and J. Burnside, 2000. Anexpressed sequence tag database of t-cell-enriched activatedchicken splenocytes: sequence analysis of 5251 clones. Geno-mics 66:144–151.
van der Zijpp, A. J., 1983. The effect of genetic origin, sourceof antigen, and dose of antigen on the immune response ofcockerels. Poultry Sci. 62:205–211.
van der Zijpp, A. J., K. Frankena, J. Boneschanscher, and M. G. B.Nieuwland, 1983. Genetic analysis of primary and secondaryimmune response in the chicken. Poultry Sci. 62:565–572.
Wang, B., I. Andre, A. Gonzalez, J. D. Katz, M. Aguet, C. Benoist,and D. Mathis, 1997. Interferon-gamma impacts at multiplepoints during the progression of autoimmune diabetes. Proc.Natl. Acad. Sci. U.S.A. 94:13844–13849.
Warner, C. B., B. Gerndt, Y. Xu, Y. Bourlet, C. Auffray, S. J.Lamont, and A. Nordskog, 1989. Restriction fragment lengthpolymorphism analysis of major histocompatibility complexclass II genes from inbred chicken lines. Anim. Genet.20:225–231.
Weigend, S., N. Mielenz, and S.J. Lamont, 1997. Application ofa nonlinear regression function to evaluate the kinetics ofantibody response to vaccines in chicken lines divergentlyselected for multitrait immune response. Poultry Sci.76:1248–1255.
Weller, J. I., J. Z. Song, D. W. Heyen, H. A. Lewin, and M. Ron,1998. A new approach to the problem of multiple compari-sons in the genetic dissection of complex traits. Genetics150:1699–1706.
Yang, N., C. T. Larsen, E. A. Dunnington, P. A. Geraert, P. M.Picard, and P. B. Siegel, 2000. Immune competence of chicksfrom two lines divergently selected for antibody response tosheep red blood cells as affected by supplemental vitaminE. Poultry Sci. 79:799–803.
Zaykin, D. V., S. S. Young, and P. H. Westfall, 2000. Using thefalse discovery rate approach in the genetic dissection ofcomplex traits: a response to Weller et al. Genetics154:1917–1918.
Zhou, H., and S. J. Lamont, 1999. Genetic characterization ofbiodiversity in highly inbred chicken lines by microsatellitemarkers. Anim. Genet. 30:256–264.
Zhou, H., W. Liu, and S. J. Lamont, 2001. Genetic variationamong chicken lines and mammalian species in specificgenes. Poultry Sci. 80:284–288.
by guest on April 6, 2016
http://ps.oxfordjournals.org/D
ownloaded from
Related Documents