Cancer survival in Indigenous and non-Indigenous Australian children: what is the difference? Author Valery, Patricia C, Youlden, Danny R, Baade, Peter D, Ward, Leisa J, Green, Adele C, Aitken, Joanne F Published 2013 Journal Title Cancer Causes and Control DOI https://doi.org/10.1007/s10552-013-0287-9 Copyright Statement © 2013 Springer Netherlands. This is an electronic version of an article published in Cancer Causes & Control, December 2013, Volume 24, Issue 12, pp 2099-2106. Cancer Causes & Control is available online at: http://link.springer.com/ with the open URL of your article. Downloaded from http://hdl.handle.net/10072/60190 Griffith Research Online https://research-repository.griffith.edu.au

Welcome message from author
This document is posted to help you gain knowledge. Please leave a comment to let me know what you think about it! Share it to your friends and learn new things together.
Transcript
Cancer survival in Indigenous and non-Indigenous Australianchildren: what is the difference?
Author
Valery, Patricia C, Youlden, Danny R, Baade, Peter D, Ward, Leisa J, Green, Adele C, Aitken,Joanne F
Published
2013
Journal Title
Cancer Causes and Control
DOI
https://doi.org/10.1007/s10552-013-0287-9
Copyright Statement
© 2013 Springer Netherlands. This is an electronic version of an article published in CancerCauses & Control, December 2013, Volume 24, Issue 12, pp 2099-2106. Cancer Causes &Control is available online at: http://link.springer.com/ with the open URL of your article.
Downloaded from
http://hdl.handle.net/10072/60190
Griffith Research Online
https://research-repository.griffith.edu.au
1
Cancer survival in Indigenous and non-Indigenous Australian children: what is the difference?
Patricia C. Valery, PhD 1*
Danny R. Youlden, BSc 2
Peter D. Baade, PhD 2,3, 4,1
Leisa J. Ward 2
Adele C. Green, PhD 5,6
Joanne F. Aitken, PhD 2,7
1. Menzies School of Health Research, Charles Darwin University, Australia
2. Cancer Council Queensland, Australia
3. School of Public Health, Queensland University of Technology, Australia
4. Griffith Health Institute, Griffith University, Australia
5. School of Translational Medicine, University of Manchester, UK
6. Cancer and Population Studies, Queensland Institute of Medical Research, Australia
7. School of Population Health, University of Queensland, Australia
*Correspondence to:
Patricia C Valery
MENZIES SCHOOL OF HEALTH RESEARCH
Level 1/147 Wharf Street, Spring Hill Q 4000 AUSTRALIA
Tel +61 7 3309 3400 Fax +61 7 3832 0030
E-mail [email protected]
Running title: Cancer survival in Indigenous Australian children
Keywords: cancer survival, Indigenous, childhood, Australia

2
ABSTRACT
Purpose: This study assessed variation in childhood cancer survival by Indigenous status in Australia, and explored the effect
of place of residence and socio-economic disadvantage on survival.
Methods: All children diagnosed with cancer during 1997-2007 were identified through the Australian Paediatric Cancer
Registry. Cox regression analysis was used to assess the adjusted differences in survival.
Results: Overall, five-year survival was 75.0% for Indigenous children (n=196) and 82.3% for non-Indigenous children
(n=6376, p=0.008). Compared to other children, Indigenous cases had 1.36 times the risk of dying within 5 years of diagnosis
after adjustments for rurality of residence, socio-economic disadvantage, cancer diagnostic group and year of diagnosis (95%
CI 1.01-1.82). No significant survival differential was found for leukaemias or tumours of the central nervous system;
Indigenous children were 1.83 times more likely (95% CI 1.22-2.74) than other children to die within 5 years from ‘other
tumours’ (e.g. lymphomas, neuroblastoma). Among children who lived in ‘Remote/Very Remote/Outer regional’ areas, and
among children with a subgroup of ‘other tumours’ that were staged, being Indigenous significantly increased the likelihood of
death (HR=1.69, 95% CI 1.10-2.59 and HR=2.99, 95% CI 1.35-6.62, respectively); no significant differences by Indigenous
status were seen among children with stage data missing.
Conclusions: Differences in place of residence, socio-economic disadvantage and cancer diagnostic group only partially
explain the survival disadvantage of Indigenous children. Other reasons underlying the disparities in childhood cancer
outcomes by Indigenous status are yet to be determined, but may involve factors such as differences in treatment.
3
INTRODUCTION
There are an estimated half-million Indigenous Australians (Aboriginal and Torres Strait Islander people), accounting for about
2.5% of the Australian population (2.2% Aboriginal, 0.2% Torres Strait Islander, 0.1% of both Aboriginal and Torres Strait
Islander origin).[1] Although only a minority (25%) of Indigenous Australians overall live in remote areas, the proportion
varies markedly across Australia with up to 80% of Indigenous Australians in the Northern Territory living in remote areas.
Since European colonisation in the late 1700s, Indigenous Australians have lost some of their cultural expression and practices
and their land, , as well as health and wellbeing.[2, 3] Indigenous Australians have poor education, low levels of employment,
and despite the high standard of health experienced in Australia in general, Indigenous Australians are more likely to
experience disability and ill health and die at younger ages.[1]
Cancer is the second leading cause of premature mortality and the third most common cause of death among Indigenous
Australian adults.[1] They have poorer survival following a cancer diagnosis than do other Australians in general,[4-6] due in
part to Indigenous patients having more advanced disease and more co-morbidities at diagnosis, and being less likely to receive
cancer treatment.[5, 7]
The effect of ethnicity and socio-economic status on childhood cancer survival has been investigated in the United States
(US),[8, 9] the United Kingdom (UK),[10, 11] New Zealand (NZ),[12] South Africa (SA) and Namibia, [13-15] with
inconsistent results. In Australia, Indigenous children are 36% less likely to be diagnosed with cancer than their non-
Indigenous counterparts, however they have similar rates of cancer mortality.[16] While this is suggestive of poorer survival,
specific data on cancer survival by Indigenous status among Australian children are lacking. There is a need to quantify the
extent of, and understand reasons for, any survival differential for Indigenous childhood cancer patients, in order to plan
appropriate policies for equitable paediatric cancer care.
Using the Australian Paediatric Cancer Registry (APCR), one of the few national, population-based registries of childhood
cancer in the world, we have assessed possible variation in cancer survival between Indigenous and non-Indigenous Australian
children, and examined whether observed variation is associated with geographic remoteness or area-based socio-economic
disadvantage.
METHODS
Data on children (0-14 years) diagnosed with cancer in Australia during 1997-2007 were accessed from the APCR. As cancer
notification is mandatory and the APCR includes all childhood cancer cases registered by Australia’s state and territory cancer
registries, cases reported here represent all children diagnosed with cancer during 1997-2007.[17] Indigenous status has been
routinely recorded in most public hospitals’ patient administration systems since the mid-1990s and information is provided to
the APCR for each notified case (<3% of children have ‘unknown’ Indigenous status during 1997-2007). Cases diagnosed on
the basis of death certificate only or autopsy with histology (n=30) were excluded, as were those with a reported survival time
of less than 1 day (n=20).
Through site visits by the APCR Data Manager to major children’s hospitals throughout Australia, clinical information (e.g.
stage at diagnosis) was extracted from medical records for all cases using standard data collection forms. Information on
Indigenous status obtained through the case notification was cross-checked with medical notes. Date and cause of death
information are routinely updated in the APCR by linkage with the Australian National Death Index. All cases were followed
until date of death, five years following diagnosis or December 31, 2008, whichever came sooner. Due to the unavailability of
4
accurate life tables for Indigenous Australians during the study period,[18] survival was cause-specific; children who died of
causes unrelated to their cancer (Figure 1) were censored at their date of death (n=25).
Childhood cancers were classified into 12 main groups using the International Classification of Childhood Cancer (ICCC-
3).[19] All invasive cancers were included, as well as intracranial and intraspinal tumors of benign or uncertain behaviour;
cancer with benign or uncertain behaviour (n=47) were excluded (Figure 1). Some of the diagnostic groups were amenable to
being staged (lymphomas, neuroblastoma, renal tumours, and the soft tissue sarcoma subgroup of rhabdomyosarcomas); for
these cancers, stage at diagnosis was summarized as either localised (Stages I-II) or spread beyond the site of origin (Stages
III+).
Survival by Indigenous status was analysed for all cancers and separately for leukaemias and tumours of the central nervous
system, with the remaining cancer types (referred to as ‘other tumours’) aggregated to achieve sufficient numbers for analysis.
As stage at diagnosis is an important determinant of survival,[20, 21] the abovementioned diagnostic groups for which staging
data were recorded were analysed separately.
Geographic remoteness (rurality of residence) was categorised according to the Accessibility/Remoteness Index for Australia
(referred to as remoteness index); groups ranged from ‘Remote/Very Remote (centre of <18,000 persons)’ to ‘Major city
(centre of 250,000+ persons)’.[22] The index of relative socio-economic disadvantage[23] (referred to as socio-economic
index) was used to classify the socio-economic status of the areas where children lived. To achieve sufficient numbers for
analysis it was necessary to aggregate the categories of both indexes as well as year of diagnosis.
The Statistical Package for the Social Sciences version 19 (SPSS, Chicago, Ill) was used for data analysis. Statistical
significance was set at α=0.05. Chi-squared tests or Fisher’s exact test (cell counts <5) were used were used for categorical
data. Unadjusted 5-year survival probabilities by Indigenous status were calculated using the Kaplan–Meier method (log rank
statistic). Multivariate Cox regression analysis reported in terms of hazard ratios (HRs) with associated 95% confidence
intervals (CIs) was used to assess the differences by Indigenous status with respect to cancer survival, after adjustment for
remoteness and socio-economic indexes, diagnostic group, year of diagnosis and stage at diagnosis (where relevant). Variables
included in the model were checked to ensure that they adhered to the assumption of proportional hazards over time. As there
was evidence of statistical interaction between diagnostic grouping and year of diagnosis, the corresponding interaction term
was included in all models that included diagnostic grouping.
A sensitivity analysis was undertaken to examine the potential effect on the findings of excluding children with missing
Indigenous status who would otherwise have been eligible (n=181). Firstly, unadjusted 5-year survival probabilities by
Indigenous status (including ‘unknown’) were calculated (Kaplan–Meier method). Indigenous status was then randomly
allocated to 2.5% and 5% of the subgroup of children with ‘unknown’ status to match the proportion of Indigenous Australians
in the general population (2.5%);[1] remaining children with ‘unknown’ status were classified as non-Indigenous. Unadjusted
HRs were calculated to assess the differences by Indigenous status with respect to cancer survival.
RESULTS
Over the study period, there were 201 Indigenous cases (2.9%), 6440 non-Indigenous (94.0%), and 209 cases with unknown
Indigenous status (3.1%). After exclusions (Figure 1), 196 Indigenous children and 6376 non-Indigenous children were
5
analysed. There was no significant difference in the overall distribution of cancers by diagnostic group, age group, sex or year
of diagnosis by Indigenous status (Table 1). Differences were apparent by rurality of residence, with a much higher proportion
of Indigenous cases living in remote/very remote areas (22.4% vs. 2.6%) and a smaller proportion of Indigenous cases living in
major cities (29.1% vs. 60.9%; p<0.001). Also, a higher proportion of Indigenous cases lived in the ‘most disadvantaged’ areas
compared with non-Indigenous cases (35.2% vs. 14.0%); in contrast the pattern was reversed for affluent areas, with 6.1% of
Indigenous and 20.8% of non-Indigenous cases living in areas classified as ‘least disadvantaged’ (p<0.001).
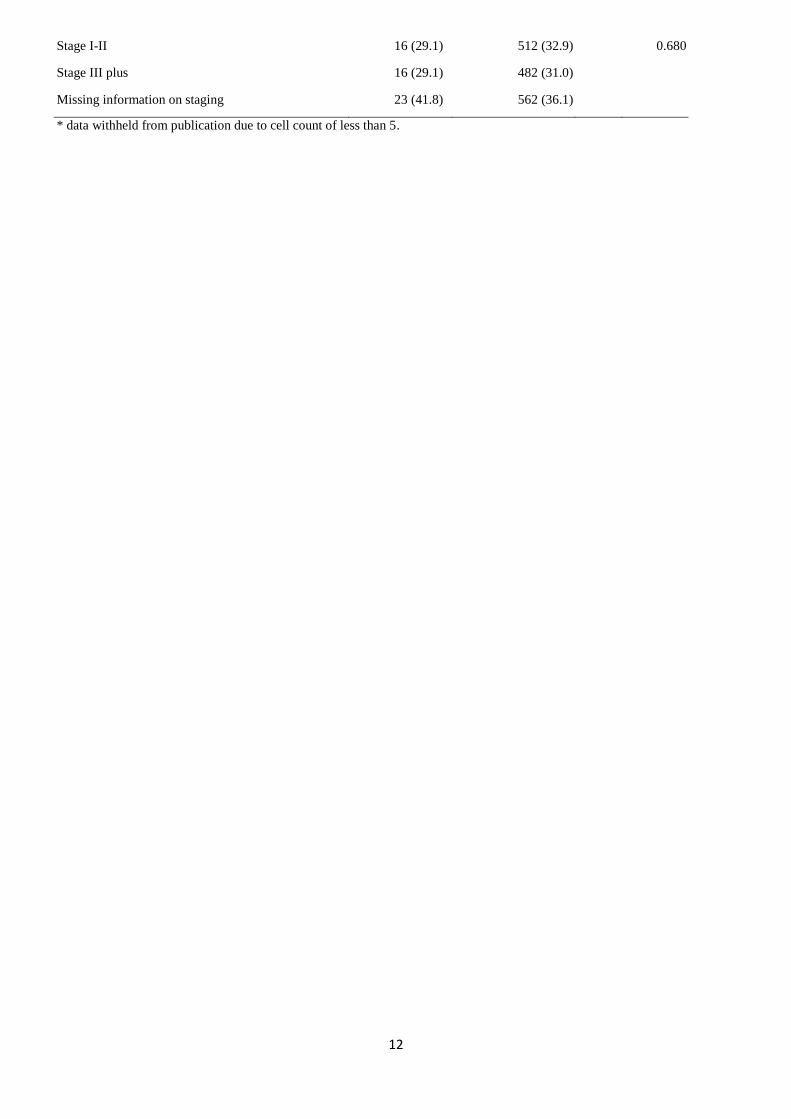
Of 1611 children (55 Indigenous and 1556 non-Indigenous) diagnosed with tumours that were amenable to being staged (Table
1). Indigenous and non-Indigenous cases were similar with regard to cancer stage and the proportion of missing stage: 29.1%
of Indigenous children had Stages I-II, 29.1% Stages III+ and 41.8% missing cancer stage compared to 32.9%, 31.0% and
36.1% of non-Indigenous children, respectively (p=0.680).
Overall 5-year cancer-specific survival was 75.0% (95% CI 68.5-80.7) for Indigenous children and 82.3% (95% CI 81.4-83.3)
for non-Indigenous children (p=0.008). Indigenous children were 1.47 times more likely (95% CI 1.10-1.95, p=0.009) to die
from cancer within 5 years of diagnosis than were non-Indigenous children (Table 2 and Figure 2). After adjustment for
rurality, socio-economic disadvantage, cancer diagnostic group, year of diagnosis and the interaction term ‘cancer diagnostic
group-year of diagnosis’, the hazard ratio reduced slightly to 1.36 (95% CI 1.01-1.82), but remained statistically significant
(p=0.040).
For leukaemia and tumours of the central nervous system there were no statistically significant differences for either the
unadjusted or adjusted hazard ratios by Indigenous status (Table 2). However, for ‘other tumours’, Indigenous children were
1.83 times more likely (95% CI 1.22-2.74, p=0.003) to die from cancer within 5 years of diagnosis than were non-Indigenous
children (HR adjusted for rurality, socio-economic disadvantage and year of diagnosis). When tumours amenable to staging
were examined separately, there was some, although not significant, evidence that Indigenous children appeared to be more
likely (adjusted HR=1.65, 95% CI 0.94-2.91, p=0.083) to die from cancer within 5 years of diagnosis than their counterparts
(adjusted for socio-economic disadvantage, place of residence, year of diagnosis, and stage).
There was no statistically significant interaction between Indigenous status and either remoteness (p=0.313), socio-economic
index (p=0.256), or stage at diagnosis (p=0.577) in the main model. However, stratified analyses showed that among cases
who lived in ‘Remote/Very Remote/Outer regional areas’, being Indigenous increased the likelihood of death within 5 years of
diagnosis (adjusted HR=1.69, 95% CI 1.10-2.59, p=0.017), while among cases who lived in ‘Major city/Inner regional areas’
there was no significant difference in the survival estimates by Indigenous status (Table 3). Among those who lived in ‘Most
disadvantaged’ areas, there was also a suggestion that being Indigenous may be associated with an increased likelihood of
death within 5 years of diagnosis (adjusted HR=1.60, 95% CI 0.98-2.62, p=0.061), although chance could not be ruled out.
There was no significant difference in the survival estimates by Indigenous status among cases who lived in ‘Middle/Least
disadvantaged’ areas. Among cases with Stage I-II cancers, Indigenous children had over 4 times the likelihood of death within
5 years of diagnosis, although numbers were small and this difference was only marginally statistically significant (adjusted
HR=4.57, 95% CI 0.99-21.19, p=0.052); Indigenous children with Stage III+ cancers were three times more likely to die
within 5 years of diagnosis (adjusted HR=2.95, 95% CI 1.14-7.64, p=0.025), and overall, among children with staged cancers,
Indigenous children were three times more likely to die within 5 years of diagnosis compared to non-Indigenous children
(adjusted HR=2.99, 95% CI 1.35-6.62). No significant differences between the groups were seen among children with stage
data missing.
6
Five-year survival was significantly higher for children with unknown Indigenous status compared to Indigenous or non-
Indigenous cases (89.0%, 75.0%, and 82.3%, respectively; p=0.001). Sensitivity analysis showed that when Indigenous status
was randomly allocated to either 2.5% or 5% of these children, unadjusted HRs were similar to the estimates for children with
known Indigenous status (HR=1.48, 95% CI 1.11-1.97, p=0.007 and HR=1.44, 95% CI 1.08-1.92, p=0.012, respectively).
DISCUSSION
We present the results of the first nation-wide analysis of survival from childhood cancer in Australia by Indigenous status.
The overall likelihood of death within 5 years from cancer was about 50% higher for Indigenous cases than for other
Australian children. After adjusting for a range of other key factors (remoteness and socio-economic indexes, diagnostic group
and year of diagnosis), there were no significant differences in survival by Indigenous status for leukaemia and tumours of the
central nervous system, and the disparity was found to be mostly due to an 83% higher chance of death among Indigenous
children diagnosed with ‘other tumours’.
Our findings are consistent with previous reports of poorer cancer survival amongst Indigenous adults compared to other
Australians.[5-7] These studies have found that reduced Indigenous survival for some adult cancers was due to Indigenous
patients having more advanced disease and co-morbidities (e.g. diabetes type 2) at diagnosis, and also being less likely to
receive cancer treatment. In a study conducted in the state of Queensland, 12% of adult Indigenous cases compared to 7% of
non-Indigenous cases had no information on cancer stage recorded in the medical chart.[5] Although a slightly higher
proportion of Indigenous compared to non-Indigenous children had stage data missing in our cohort, the difference was not
statistically significant. Significant differences in survival by Indigenous status remained after stratifying by stage however.
Interestingly, among children with stage I-II and with stage III+, it appeared that Indigenous children were more likely to die
within 5 years of diagnosis compared to non-Indigenous children; however, no significant differences between the groups were
seen among children with stage data missing or cases that were not staged. The present study did not collect information on co-
morbidities. Further work is planned to examine the possible impact of the timing and type of treatment on childhood cancer
survival using data from the APCR.
In the abovementioned Queensland study, adult Indigenous cases were 20% less likely to receive chemotherapy, 9% less likely
to receive radiotherapy, and 24% less likely to have surgery for their cancer than non-Indigenous cases.[5] In a study of head
and neck cancer, Indigenous cases were also significantly less likely to receive any cancer treatment (75% vs. 95%); when
cancer stage, socioeconomic status, comorbidities and cancer treatment were taken into account, Indigenous cases experienced
significant greater risk of death from head and neck cancer and from all other causes than their non-Indigenous
counterparts.[24] The reasons why Indigenous people in these studies were less likely to receive treatment were not
documented.
The effect of ethnicity on the survival of children with cancer has been investigated in other countries, although results have
been inconsistent. In the UK, survival did not differ by ethnicity[10, 11], while in the US, poorer overall and cancer-specific
survival have been reported for black children,[9, 25] Alaska Natives[8] and children from ethnic minorities[25, 26] compared
with white children. In a small NZ study Maori and Pacific Island children had similar survival as other children for all cancers
combined and acute lymphoblastic leukaemia.[12] In the UK, it is likely that ethnic groups reflect migrants rather than
Indigenous subgroups as in our study and the US and NZ studies. Moreover, Australian data includes other ethnic minorities in
the “non-Indigenous” group, so the true differential between Indigenous and Caucasian children may be higher.
7
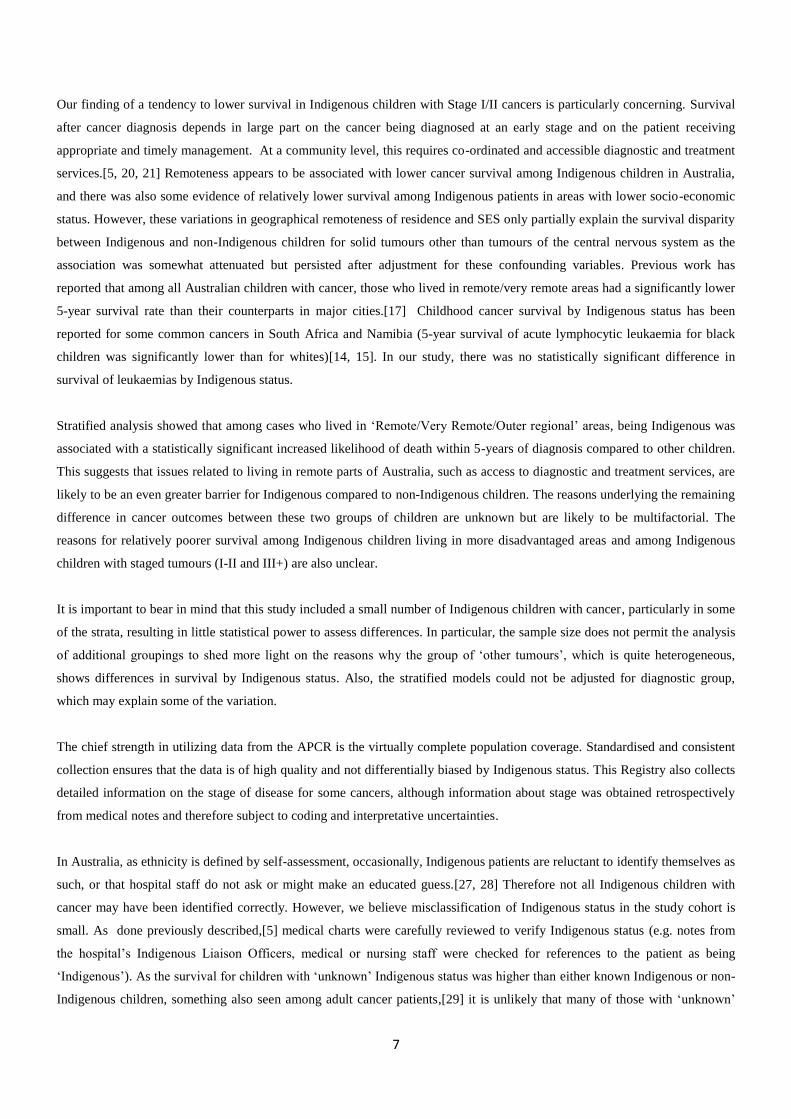
Our finding of a tendency to lower survival in Indigenous children with Stage I/II cancers is particularly concerning. Survival
after cancer diagnosis depends in large part on the cancer being diagnosed at an early stage and on the patient receiving
appropriate and timely management. At a community level, this requires co-ordinated and accessible diagnostic and treatment
services.[5, 20, 21] Remoteness appears to be associated with lower cancer survival among Indigenous children in Australia,
and there was also some evidence of relatively lower survival among Indigenous patients in areas with lower socio-economic
status. However, these variations in geographical remoteness of residence and SES only partially explain the survival disparity
between Indigenous and non-Indigenous children for solid tumours other than tumours of the central nervous system as the
association was somewhat attenuated but persisted after adjustment for these confounding variables. Previous work has
reported that among all Australian children with cancer, those who lived in remote/very remote areas had a significantly lower
5-year survival rate than their counterparts in major cities.[17] Childhood cancer survival by Indigenous status has been
reported for some common cancers in South Africa and Namibia (5-year survival of acute lymphocytic leukaemia for black
children was significantly lower than for whites)[14, 15]. In our study, there was no statistically significant difference in
survival of leukaemias by Indigenous status.
Stratified analysis showed that among cases who lived in ‘Remote/Very Remote/Outer regional’ areas, being Indigenous was
associated with a statistically significant increased likelihood of death within 5-years of diagnosis compared to other children.
This suggests that issues related to living in remote parts of Australia, such as access to diagnostic and treatment services, are
likely to be an even greater barrier for Indigenous compared to non-Indigenous children. The reasons underlying the remaining
difference in cancer outcomes between these two groups of children are unknown but are likely to be multifactorial. The
reasons for relatively poorer survival among Indigenous children living in more disadvantaged areas and among Indigenous
children with staged tumours (I-II and III+) are also unclear.
It is important to bear in mind that this study included a small number of Indigenous children with cancer, particularly in some
of the strata, resulting in little statistical power to assess differences. In particular, the sample size does not permit the analysis
of additional groupings to shed more light on the reasons why the group of ‘other tumours’, which is quite heterogeneous,
shows differences in survival by Indigenous status. Also, the stratified models could not be adjusted for diagnostic group,
which may explain some of the variation.
The chief strength in utilizing data from the APCR is the virtually complete population coverage. Standardised and consistent
collection ensures that the data is of high quality and not differentially biased by Indigenous status. This Registry also collects
detailed information on the stage of disease for some cancers, although information about stage was obtained retrospectively
from medical notes and therefore subject to coding and interpretative uncertainties.
In Australia, as ethnicity is defined by self-assessment, occasionally, Indigenous patients are reluctant to identify themselves as
such, or that hospital staff do not ask or might make an educated guess.[27, 28] Therefore not all Indigenous children with
cancer may have been identified correctly. However, we believe misclassification of Indigenous status in the study cohort is
small. As done previously described,[5] medical charts were carefully reviewed to verify Indigenous status (e.g. notes from
the hospital’s Indigenous Liaison Officers, medical or nursing staff were checked for references to the patient as being
‘Indigenous’). As the survival for children with ‘unknown’ Indigenous status was higher than either known Indigenous or non-
Indigenous children, something also seen among adult cancer patients,[29] it is unlikely that many of those with ‘unknown’
8
Indigenous status were truly Indigenous. Even when we randomly allocated up to 5% of the ‘unknown’ cancer patients to the
Indigenous group, the significant survival differential remained.
Navigating through the complex health care system for cancer care can be arduous and fraught with uncertainty and fear.[30]
This can be worse for an Indigenous person, who might not always utilize nor understand Western health care systems. The
diagnosis of cancer is regarded as meaning death, as it can be (for many Indigenous adults) rapidly fatal.[31] Cultural and
cross-cultural issues, such as fear of death or failure to be offered or to fully understand treatment options, play a substantial
part in treatment compliance. Many adult Indigenous cancer patients simply withdraw from active treatment after their initial
experience of it.[32] Although treatment refusal is an infrequent occurrence in paediatric oncology in general,[33] overseas
studies have found that treatment adherence ranges from 41-98%.[34, 35] Information about treatment refusal and compliance
among Indigenous children diagnosed with cancer is not available.
Differences in treatment (timing of and uptake) have been reported as contributing factors for the poorer cancer survival of
Indigenous adults when compared to other Australians.[5, 24] Comprehensive investigation of cancer treatment and
compliance are therefore needed as they could also potentially be contributing factors to the disparity in cancer survival among
children with certain cancers; better understanding of the patterns of care will help to identify factors where modification may
improve outcomes. This could translate into meaningful public-health and clinical interventions to improve cancer survival in
Indigenous Australian children.
ACKNOWLEDGEMENTS
The clinical advice from Dr Tim Hassall, Royal Children Hospital, Brisbane, and the support and assistance of staff at
Australian State and Territory Cancer Registries, the Australian Institute of Health and Welfare, and the Medical Records
department at each of the national paediatric oncology treating hospitals are gratefully acknowledged. The Australian
Paediatric Cancer Registry is funded by Cancer Council Queensland. PC Valery was supported by an Australian Research
Council Future Fellowship (#FT100100511). AC Green is partly supported by a Fellowship from the Medical Research
Council (#89912). PD Baade was supported by a National Health and Medical Research Council Career Development
Fellowship (#1005334). Throughout the study, the Queensland Aboriginal and Islander Health Council acted as a community
resource to provide consultation and support. Necessary approvals for this work were obtained from the ethics committees of
the Queensland Institute of Medical Research, the University of Queensland, the cancer registries in all States and Territories,
and all hospitals who assisted in the data collection.
9
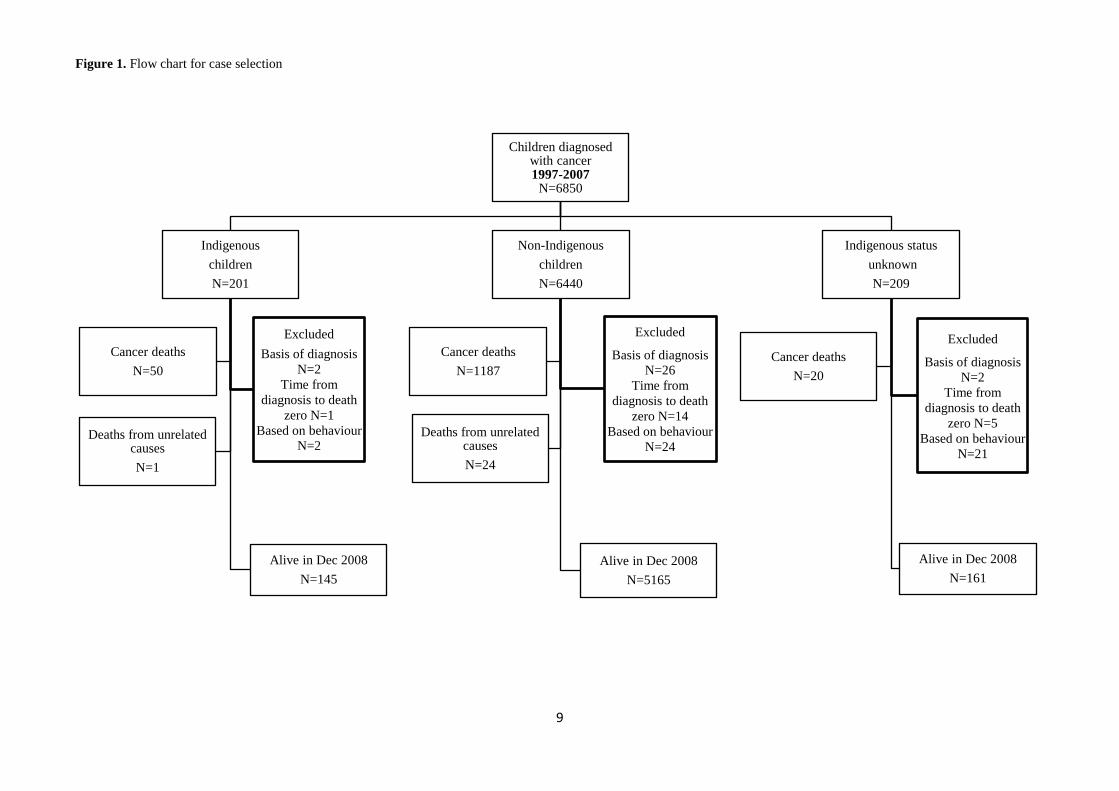
Figure 1. Flow chart for case selection
Children diagnosed with cancer 1997-2007
N=6850
Indigenous
children
N=201
Alive in Dec 2008
N=145
Excluded
Basis of diagnosis
N=2
Time from
diagnosis to death
zero N=1
Based on behaviour
N=2
Cancer deaths
N=50
Deaths from unrelated causes
N=1
Non-Indigenous
children
N=6440
Alive in Dec 2008
N=5165
Excluded
Basis of diagnosis
N=26
Time from
diagnosis to death
zero N=14
Based on behaviour
N=24
Cancer deaths
N=1187
Deaths from unrelated causes
N=24
Indigenous status
unknown
N=209
Alive in Dec 2008
N=161
Excluded
Basis of diagnosis
N=2
Time from
diagnosis to death
zero N=5
Based on behaviour
N=21
Cancer deaths
N=20

10
Figure 2. Adjusted cumulative survival for childhood cancer to 5 years after diagnosis by Indigenous status, Australia, 1997-
2008
HR= 1•47 (95% CI 1•10-1•95) p=0•009
Non-Indigenous
Indigenous

11
Table 1. Demographic characteristics, distribution of childhood cancers (ICCC-3 diagnostic group) and cancer stage at
diagnosis of the study population by Indigenous status, Australia, 1997-2007
Indigenous
N=196 (%)
Non-Indigenous
N=6376 (%)
p-value
Age group
0-4 yrs 88 (44.9) 2981 (46.8) 0.290
5-9 yrs 59 (30.1) 1612 (25.3)
10-14 yrs 49 (25.0) 1783 (28.0)
Sex
Male 100 (51.0) 3481 (54.6) 0.344
Female 96 (49.0) 2895 (45.4)
Rurality of residence (remoteness index)
Remote or very remote 44 (22.4) 166 (2.6) <0.001
Outer regional 42 (21.4) 772 (12.1)
Inner regional 53 (27.0) 1562 (24.3)
Major city 57 (29.1) 3886 (60.9)
Socio-economic index
Most disadvantaged (quintile 1) 69 (35.2) 893 (14.0) <0.001
Middle socio-economic status (quintiles 2–4) 115 (58.7) 4155 (65.2)
Least disadvantaged (quintile 5) 12 (6.1) 1328 (20.8)
Year of diagnosis
1997-2001 74 (37.8) 2840 (44.5) 0.068
2002-2007 122 (63.2) 3536 (55.5)
Diagnostic group
I. Leukaemias 51 (26.0) 2195 (34.4) 0.264
II. Lymphomas 23 (11.7) 647 (10.1)
III. Tumours of the central nervous system 50 (25.5) 1433 (22.5)
IV. Neuroblastoma 14 (7.1) 393 (6.2)
V. Retinoblastoma * (*) 159 (2.5)
VI. Renal tumours 9 (4.6) 343 (5.4)
VII. Hepatic tumours * (*) 94 (1.5)
VIII. Malignant bone tumours 6 (3.1) 276 (4.3)
IX. Soft tissue sarcomas 18 (9.2) 343 (5.4)
X. Germ cell tumours 9 (4.6) 248 (3.9)
XI. Other malignant epithelial neoplasms 9 (4.6) 230 (3.6)
XII. Other & unspecified malignant neoplasms * (*) 15 (0.2)
Cancer stage at diagnosis
12
Stage I-II 16 (29.1) 512 (32.9) 0.680
Stage III plus 16 (29.1) 482 (31.0)
Missing information on staging 23 (41.8) 562 (36.1)
* data withheld from publication due to cell count of less than 5.
13
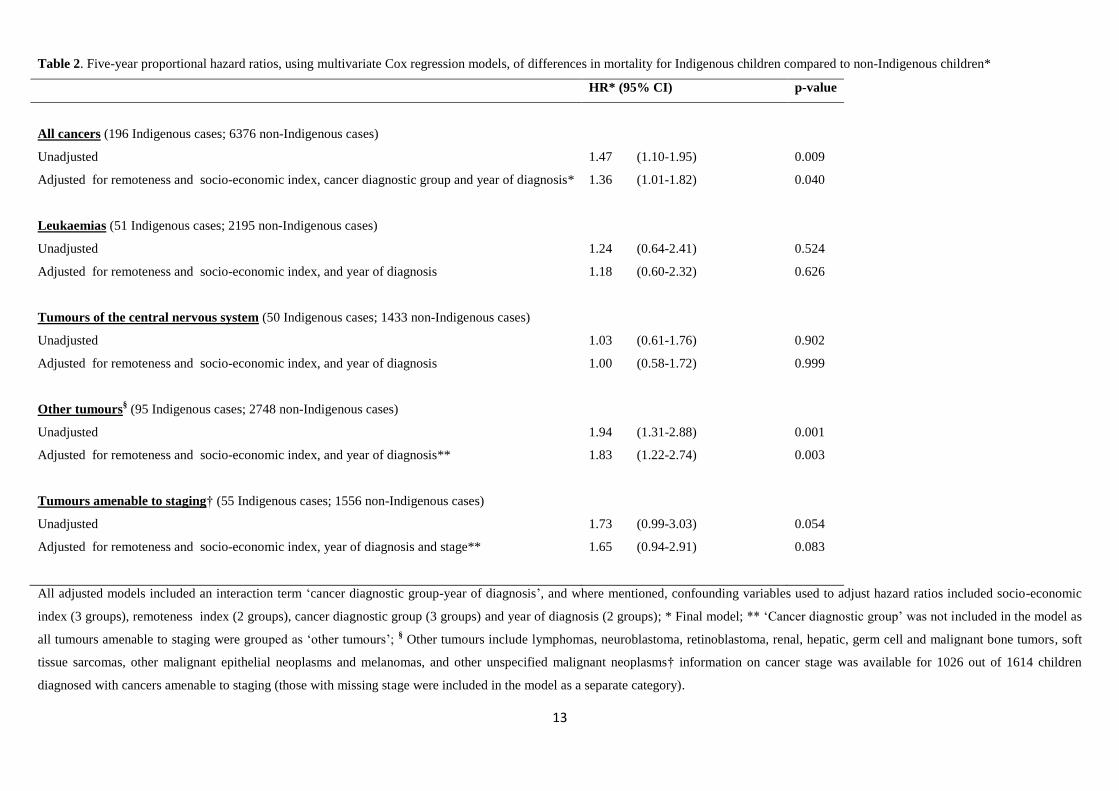
Table 2. Five-year proportional hazard ratios, using multivariate Cox regression models, of differences in mortality for Indigenous children compared to non-Indigenous children*
HR* (95% CI) p-value
All cancers (196 Indigenous cases; 6376 non-Indigenous cases)
Unadjusted 1.47 (1.10-1.95) 0.009
Adjusted for remoteness and socio-economic index, cancer diagnostic group and year of diagnosis*
1.36 (1.01-1.82) 0.040
Leukaemias (51 Indigenous cases; 2195 non-Indigenous cases)
Unadjusted 1.24 (0.64-2.41) 0.524
Adjusted for remoteness and socio-economic index, and year of diagnosis
1.18 (0.60-2.32) 0.626
Tumours of the central nervous system (50 Indigenous cases; 1433 non-Indigenous cases)
Unadjusted 1.03 (0.61-1.76) 0.902
Adjusted for remoteness and socio-economic index, and year of diagnosis
1.00 (0.58-1.72) 0.999
Other tumours§ (95 Indigenous cases; 2748 non-Indigenous cases)
Unadjusted 1.94 (1.31-2.88) 0.001
Adjusted for remoteness and socio-economic index, and year of diagnosis**
1.83 (1.22-2.74) 0.003
Tumours amenable to staging† (55 Indigenous cases; 1556 non-Indigenous cases)
Unadjusted 1.73 (0.99-3.03) 0.054
Adjusted for remoteness and socio-economic index, year of diagnosis and stage**
1.65 (0.94-2.91) 0.083
All adjusted models included an interaction term ‘cancer diagnostic group-year of diagnosis’, and where mentioned, confounding variables used to adjust hazard ratios included socio-economic
index (3 groups), remoteness index (2 groups), cancer diagnostic group (3 groups) and year of diagnosis (2 groups); * Final model; ** ‘Cancer diagnostic group’ was not included in the model as
all tumours amenable to staging were grouped as ‘other tumours’; § Other tumours include lymphomas, neuroblastoma, retinoblastoma, renal, hepatic, germ cell and malignant bone tumors, soft
tissue sarcomas, other malignant epithelial neoplasms and melanomas, and other unspecified malignant neoplasms† information on cancer stage was available for 1026 out of 1614 children
diagnosed with cancers amenable to staging (those with missing stage were included in the model as a separate category).
14
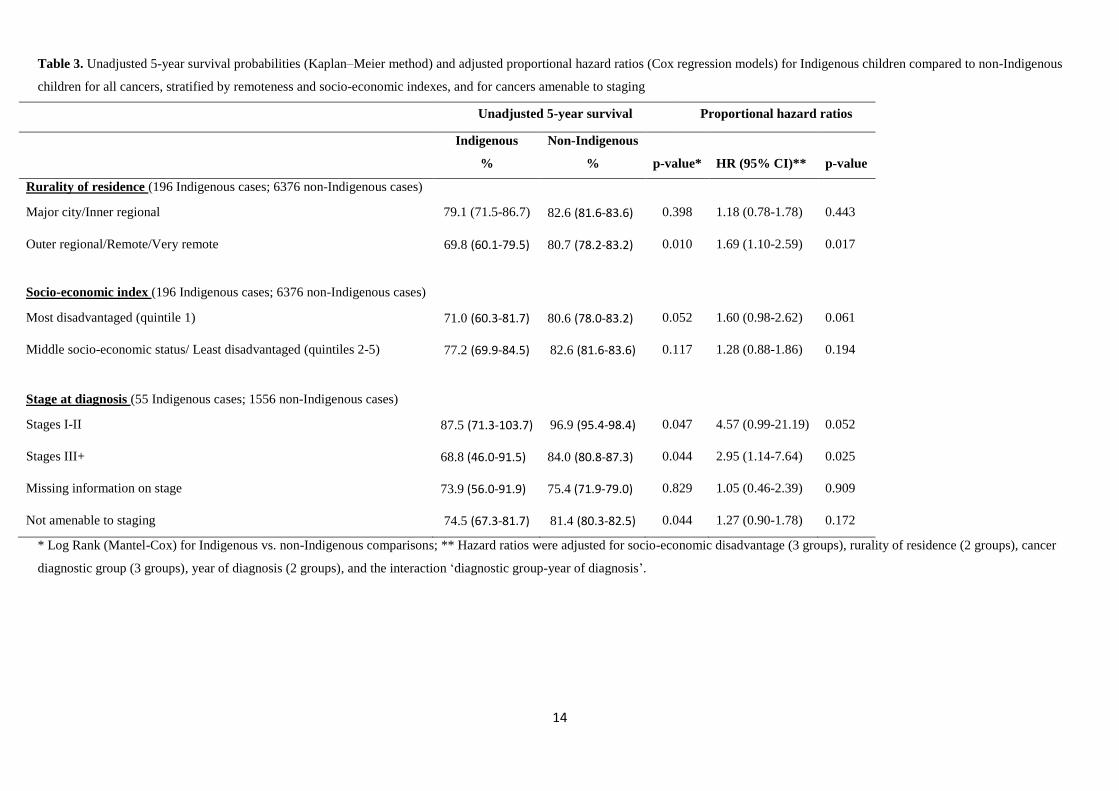
Table 3. Unadjusted 5-year survival probabilities (Kaplan–Meier method) and adjusted proportional hazard ratios (Cox regression models) for Indigenous children compared to non-Indigenous
children for all cancers, stratified by remoteness and socio-economic indexes, and for cancers amenable to staging
Unadjusted 5-year survival Proportional hazard ratios
Indigenous
%
Non-Indigenous
% p-value* HR (95% CI)** p-value
Rurality of residence (196 Indigenous cases; 6376 non-Indigenous cases)
Major city/Inner regional 79.1 (71.5-86.7) 82.6 (81.6-83.6) 0.398 1.18 (0.78-1.78) 0.443
Outer regional/Remote/Very remote
69.8 (60.1-79.5) 80.7 (78.2-83.2) 0.010 1.69 (1.10-2.59) 0.017
Socio-economic index (196 Indigenous cases; 6376 non-Indigenous cases)
Most disadvantaged (quintile 1) 71.0 (60.3-81.7) 80.6 (78.0-83.2) 0.052 1.60 (0.98-2.62) 0.061
Middle socio-economic status/ Least disadvantaged (quintiles 2-5) 77.2 (69.9-84.5) 82.6 (81.6-83.6) 0.117 1.28 (0.88-1.86) 0.194
Stage at diagnosis (55 Indigenous cases; 1556 non-Indigenous cases)
Stages I-II 87.5 (71.3-103.7) 96.9 (95.4-98.4) 0.047 4.57 (0.99-21.19) 0.052
Stages III+ 68.8 (46.0-91.5) 84.0 (80.8-87.3) 0.044 2.95 (1.14-7.64) 0.025
Missing information on stage 73.9 (56.0-91.9) 75.4 (71.9-79.0) 0.829 1.05 (0.46-2.39) 0.909
Not amenable to staging 74.5 (67.3-81.7) 81.4 (80.3-82.5) 0.044 1.27 (0.90-1.78) 0.172
* Log Rank (Mantel-Cox) for Indigenous vs. non-Indigenous comparisons; ** Hazard ratios were adjusted for socio-economic disadvantage (3 groups), rurality of residence (2 groups), cancer
diagnostic group (3 groups), year of diagnosis (2 groups), and the interaction ‘diagnostic group-year of diagnosis’.
15
References
1. Australian Bureau of Statistics. (2011) The health and welfare of Aboriginal and Torres Strait Islander peoples.
Canberra: Australia Bureau of Statistics.
2. Eckerman A, Dowd T, Martin M, Dixon L, Gray R, Chong E. (1992) Bina[ng] goonj : bridging cultures in Aboriginal
health. Armidale, N.S.W.: Dept. of Aboriginal and Multicultural Studies, University of New England,.
3. Durie M. (2004) Understanding health and illness: research at the interface between science and indigenous
knowledge. International journal of epidemiology. 33: 1138-43.
4. Cottrell J, Street J, Chong A, Roder D. (2007) Comparing cancer profiles and survival of aboriginal and non-
aboriginal patients in South Australia: where are the opportunities for improving Aboriginal health? Asian Pac J Cancer Prev.
8: 495-501.
5. Valery PC, Coory M, Stirling J, Green AC. (2006) Cancer diagnosis, treatment, and survival in Indigenous and non-
Indigenous Australians: a matched cohort study. Lancet. 367: 1842-8.
6. Cramb SM, Garvey G, Valery PC, Williamson JD, Baade PD. (2012) The first year counts: cancer survival among
Indigenous and non-Indigenous Queenslanders, 1997-2006. Med J Aust. 196: 270-4.
7. Condon JR, Barnes T, Armstrong BK, Selva-Nayagam S, Elwood JM. (2005) Stage at diagnosis and cancer survival
for Indigenous Australians in the Northern Territory. Med J Aust. 182: 277-80.
8. Lanier AP, Holck P, Ehrsam Day G, Key C. (2003) Childhood cancer among Alaska Natives. Pediatrics. 112: e396.
9. Linabery AM, Ross JA. (2008) Childhood and adolescent cancer survival in the US by race and ethnicity for the
diagnostic period 1975-1999. Cancer. 113: 2575-96.
10. McKinney PA, Feltbower RG, Parslow RC, et al. (1999) Survival from childhood cancer in Yorkshire, U.K.: effect of
ethnicity and socio-economic status. Eur J Cancer. 35: 1816-23.
11. Stiller CA, Bunch KJ, Lewis IJ. (2000) Ethnic group and survival from childhood cancer: report from the UK
Children's Cancer Study Group. Br J Cancer. 82: 1339-43.
12. Douglas NM, Dockerty JD. (2007) Survival by ethnicity for children diagnosed with cancer in New Zealand during
1990-1993. J Paediatr Child Health. 43: 173-7.
13. Stefan DC, Stones D, Dippenaar A, Kidd M. (2009) Ethnicity and characteristics of Hodgkin lymphoma in children.
Pediatr Blood Cancer. 52: 182-5.
14. MacDougall LG. (1985) Acute childhood leukaemia in Johannesburg. Leuk Res. 9: 765-7.
15. Hesseling PB, Wessels G, van Riet FA. (1995) The Tygerberg Hospital Children's Tumour Registry 1983-1993. Eur J
Cancer. 31A: 1471-5.
16. Valery PC, Youlden DR, Baade PD, Ward LJ, Green AC, Aitken JF. (2013) Cancer incidence and mortality in
Indigenous Australian children, 1997-2008. Pediatric blood & cancer. 60: 156-8.
17. Youlden DR, Baade PD, Valery PC, Ward LJ, Green AC, Aitken JF. (2011) Differentials in survival for childhood
cancer in Australia by remoteness of residence and area disadvantage. Cancer Epidemiol Biomarkers Prev. 20: 1649-56.
18. Australian Bureau of Statistics. (2011) Deaths Australia 2010 [Cat no 3302.0]. Canberra: Australian Bureau of
Statistics.
19. Steliarova-Foucher E, Stiller C, Lacour B, Kaatsch P. (2005) International Classification of Childhood Cancer, third
edition. Cancer. 103: 1457-67.
20. Desandes E, Berger C, Tron I, et al. (2008) Childhood cancer survival in France, 1990-1999. Eur J Cancer. 44: 205-
15.
21. Baade PD, Youlden DR, Valery PC, et al. (2010) Population-based survival estimates for childhood cancer in
Australia during the period 1997-2006. Br J Cancer. 103: 1663-70.
16
22. Department of Health and Aged Care. (2000) Measuring Remoteness: Accessibility/Remoteness Index of Australia
(ARIA). Canberra (ACT): Department of Health and Aged Care.
23. Australian Bureau of Statistics. (2004) Census of population and housing : Socio-Economic Indexes for Area's
(SEIFA), Australia, 2001. Canberra: Australian Bureau of Statistics.
24. Moore SP, Green AC, Garvey G, Coory MD, Valery PC. (2011) A study of head and neck cancer treatment and
survival among indigenous and non-indigenous people in Queensland, Australia, 1998 to 2004. BMC cancer. 11: 460.
25. Children's Oncology G, Aplenc R, Alonzo TA, et al. (2006) Ethnicity and survival in childhood acute myeloid
leukemia: a report from the Children's Oncology Group. Blood. 108: 74-80.
26. Redaniel MT, Laudico A, Mirasol-Lumague MR, Alcasabas AP, Pulte D, Brenner H. (2010) Geographic and ethnic
differences in childhood leukaemia and lymphoma survival: comparisons of Philippine residents, Asian Americans and
Caucasians in the United States. Br J Cancer.
27. Paradies Y, Cunningham J. (2002) Placing Aboriginal and Torres Strait Islander mortality in an international context.
Aust N Z J Public Health. 26: 11-6.
28. Young M. (2001) Assessing the quality of identification of Aboriginal and Torres Strait Islander people in Western
Australian hospital data, 2000\. Perth: Health Department of Western Australia.
29. Dasgupta P, Baade PD, Aitken JF, Turrell G. (2012) Multilevel determinants of breast cancer survival: association
with geographic remoteness and area-level socioeconomic disadvantage. Breast cancer research and treatment. 132: 701-10.
30. Wells KJ, Battaglia TA, Dudley DJ, et al. (2008) Patient navigation: state of the art or is it science? Cancer. 113:
1999-2010.
31. Shahid S, Finn L, Bessarab D, Thompson SC. (2009) Understanding, beliefs and perspectives of Aboriginal people in
Western Australia about cancer and its impact on access to cancer services. BMC Health Serv Res. 9: 132.
32. Clinical Oncological Society of Australia, The Cancer Council Australia, The National Cancer Control Initiative
2002. (2003) Optimising Cancer Care in Australia. Melbourne: National Cancer Control Initiative. pp. 1-122.
33. Alessandri AJ. (2011) Parents know best: or do they? Treatment refusals in paediatric oncology. J Paediatr Child
Health. 47: 628-31.
34. Mancini J, Simeoni MC, Parola N, et al. (2012) Adherence to leukemia maintenance therapy: a comparative study
among children, adolescents, and adults. Pediatric hematology and oncology. 29: 428-39.
35. Landier W. (2011) Age span challenges: adherence in pediatric oncology. Seminars in oncology nursing. 27: 142-53.
Related Documents