See discussions, stats, and author profiles for this publication at: https://www.researchgate.net/publication/7717528 Cancer cell adaptation to chemotherapy Article in BMC Cancer · July 2005 DOI: 10.1186/1471-2407-5-78 · Source: PubMed CITATIONS 70 READS 46 18 authors, including: Federica Di Nicolantonio Università degli Studi di Torino 132 PUBLICATIONS 7,394 CITATIONS SEE PROFILE Louise Knight National Health Service 24 PUBLICATIONS 495 CITATIONS SEE PROFILE Sharon Glaysher Portsmouth Hospitals NHS Trust 29 PUBLICATIONS 397 CITATIONS SEE PROFILE Ian A Cree University College London 314 PUBLICATIONS 5,884 CITATIONS SEE PROFILE All content following this page was uploaded by Sharon Glaysher on 01 December 2016. The user has requested enhancement of the downloaded file. All in-text references underlined in blue are linked to publications on ResearchGate, letting you access and read them immediately.

Welcome message from author
This document is posted to help you gain knowledge. Please leave a comment to let me know what you think about it! Share it to your friends and learn new things together.
Transcript

Seediscussions,stats,andauthorprofilesforthispublicationat:https://www.researchgate.net/publication/7717528
Cancercelladaptationtochemotherapy
ArticleinBMCCancer·July2005
DOI:10.1186/1471-2407-5-78·Source:PubMed
CITATIONS
70
READS
46
18authors,including:
FedericaDiNicolantonio
UniversitàdegliStudidiTorino
132PUBLICATIONS7,394CITATIONS
SEEPROFILE
LouiseKnight
NationalHealthService
24PUBLICATIONS495CITATIONS
SEEPROFILE
SharonGlaysher
PortsmouthHospitalsNHSTrust
29PUBLICATIONS397CITATIONS
SEEPROFILE
IanACree
UniversityCollegeLondon
314PUBLICATIONS5,884CITATIONS
SEEPROFILE
AllcontentfollowingthispagewasuploadedbySharonGlaysheron01December2016.
Theuserhasrequestedenhancementofthedownloadedfile.Allin-textreferencesunderlinedinbluearelinkedtopublicationsonResearchGate,lettingyouaccessandreadthemimmediately.

BioMed CentralBMC Cancer
ss
Open AcceResearch articleCancer cell adaptation to chemotherapyFederica Di Nicolantonio1, Stuart J Mercer1, Louise A Knight1, Francis G Gabriel1, Pauline A Whitehouse1, Sanjay Sharma1, Augusta Fernando1, Sharon Glaysher1, Silvana Di Palma1, Penny Johnson1, Shaw S Somers2, Simon Toh2, Bernie Higgins3, Alan Lamont4, Tim Gulliford5, Jeremy Hurren2, Constantinos Yiangou2 and Ian A Cree*1Address: 1Translational Oncology Research Centre, Department of Histopathology, Queen Alexandra Hospital, Portsmouth PO6 3LY, UK, 2Department of Surgery, Queen Alexandra Hospital, Portsmouth PO6 3LY, UK, 3Department of Mathematics and Statistics, University of Portsmouth, Buckingham Building, Lion Terrace, Portsmouth PO1 3HE, UK, 4Department of Radiotherapy and Oncology, Southend Hospital, Prittlewell Chase, Westcliff-on-Sea, Essex SS0 0RY, UK and 5Department of Radiotherapy and Oncology, St Mary's Hospital, Milton Road, Portsmouth PO3 6AD, UK
Email: Federica Di Nicolantonio - [email protected]; Stuart J Mercer - [email protected]; Louise A Knight - [email protected]; Francis G Gabriel - [email protected]; Pauline A Whitehouse - [email protected]; Sanjay Sharma - [email protected]; Augusta Fernando - [email protected]; Sharon Glaysher - [email protected]; Silvana Di Palma - [email protected]; Penny Johnson - [email protected]; Shaw S Somers - [email protected]; Simon Toh - [email protected]; Bernie Higgins - [email protected]; Alan Lamont - [email protected]; Tim Gulliford - [email protected]; Jeremy Hurren - [email protected]; Constantinos Yiangou - [email protected]; Ian A Cree* - [email protected]
* Corresponding author
AbstractBackground: Tumor resistance to chemotherapy may be present at the beginning of treatment,develop during treatment, or become apparent on re-treatment of the patient. The mechanismsinvolved are usually inferred from experiments with cell lines, as studies in tumor-derived cells aredifficult. Studies of human tumors show that cells adapt to chemotherapy, but it has been largelyassumed that clonal selection leads to the resistance of recurrent tumors.
Methods: Cells derived from 47 tumors of breast, ovarian, esophageal, and colorectal origin and16 paired esophageal biopsies were exposed to anticancer agents (cisplatin; 5-fluorouracil;epirubicin; doxorubicin; paclitaxel; irinotecan and topotecan) in short-term cell culture (6 days).Real-time quantitative PCR was used to measure up- or down-regulation of 16 different resistance/target genes, and when tissue was available, immunohistochemistry was used to assess the proteinlevels.
Results: In 8/16 paired esophageal biopsies, there was an increase in the expression of multi-drugresistance gene 1 (MDR1) following epirubicin + cisplatin + 5-fluorouracil (ECF) chemotherapy andthis was accompanied by increased expression of the MDR-1 encoded protein, P-gp. Followingexposure to doxorubicin in vitro, 13/14 breast carcinomas and 9/12 ovarian carcinomas showed >2-
Published: 18 July 2005
BMC Cancer 2005, 5:78 doi:10.1186/1471-2407-5-78
Received: 23 November 2004Accepted: 18 July 2005
This article is available from: http://www.biomedcentral.com/1471-2407/5/78
© 2005 Di Nicolantonio et al; licensee BioMed Central Ltd. This is an Open Access article distributed under the terms of the Creative Commons Attribution License (http://creativecommons.org/licenses/by/2.0), which permits unrestricted use, distribution, and reproduction in any medium, provided the original work is properly cited.
Page 1 of 16(page number not for citation purposes)

BMC Cancer 2005, 5:78 http://www.biomedcentral.com/1471-2407/5/78
fold down-regulation of topoisomerase IIα (TOPOIIα). Exposure to topotecan in vitro, resulted in>4-fold down-regulation of TOPOIIα in 6/7 colorectal tumors and 8/10 ovarian tumors.
Conclusion: This study suggests that up-regulation of resistance genes or down-regulation intarget genes may occur rapidly in human solid tumors, within days of the start of treatment, andthat similar changes are present in pre- and post-chemotherapy biopsy material. The molecularprocesses used by each tumor appear to be linked to the drug used, but there is also heterogeneitybetween individual tumors, even those with the same histological type, in the pattern andmagnitude of response to the same drugs. Adaptation to chemotherapy may explain why predictionof resistance mechanisms is difficult on the basis of tumor type alone or individual markers, andsuggests that more complex predictive methods are required to improve the response rates tochemotherapy.
BackgroundTumor resistance to chemotherapy is a well-known clini-cal phenomenon that is now yielding its secrets to investi-gation at the molecular level in biopsy material. Studies incell lines do not always correlate well with results fromtumor tissue [1], which may consist largely of non-neo-plastic cells that support and modify the biology of neo-plastic cells. Thus it is important to validate themechanisms important in vitro with the situation in thepatient. Nevertheless, cell line studies and immunohisto-chemical studies of tumors suggest that resistance is aselective process: only those cells that survive a drug-induced insult will re-grow.
We have previously shown development of such resist-ance to combination chemotherapy in tumor-derivedcells from matched biopsies collected from breast cancerpatients before and after administration of doxorubicin-containing chemotherapy [2]. In this study we show sim-ilar results in patients with esophageal cancer from biop-sies obtained prior to and several months afterchemotherapy. Two cycles of the combination of epiru-bicin, cisplatin and 5-FU (ECF) are given to these patientsprior to resection, allowing studies to be performed withpaired samples before and after chemotherapy. We haveused real-time quantitative RT-PCR (qRT-PCR) andimmunohistochemistry (IHC) to assess targets known tobe of importance to resistance to these agents.
The mechanisms involved in resistance to chemotherapyusually involve up-regulation of resistance mechanisms,or down-regulation of target genes. Examples of theformer include drug efflux pump molecules such as multi-drug resistance gene 1/P-glycoprotein (MDR1/P-gp),while the latter include topoisomerases (TOPOs), targetsof drugs such as etoposide and doxorubicin. Many papersattest to the importance of clonal selection in this process:it is for instance possible to expose cell lines to low con-centrations of drugs and, over time, to produce highlyresistant sub-clones [3]. However, there is another poten-tial mechanism that does not require clonal selection:
cells may be able to adapt by regulation of expression ofresistance or target molecules individually if they survivethe initial exposure to the drug. This could be a morerapid process and would require changes in molecularexpression, possibly due to epigenetic change, rather thangenetic mechanisms such as mutation [4]. As a result,resistance may therefore arise rapidly following treatmentwith chemotherapy.
Recent studies have shown that the expression of MDR1/P-gp is up-regulated within hours of anti-cancer drugtreatment in vivo in patient samples [5-8], although thiseffect was not observed in all patients. We thereforewished to examine how quickly and in how many casesthese resistance molecules were up-regulated in tumor-derived cells from several tumor types. We have usedselective short-term cell culture (6 days) to examine thechanges in expression that occur following exposure tochemotherapy compared to medium-only control cellsfrom the same samples. Our short-term culture systememploys a serum-free medium and polypropylene 96 'U'well microplates. This inhibits the proliferation and sur-vival of normal cells and allows selective survival of a neo-plastic cell population [9]. The short incubation periodalso limits the possibility of selection of clones or sub-populations in vitro. However, the presence of non-neo-plastic cells for most of the incubation period allows theinteraction between stromal cells and neoplastic cells, afactor that appears to be important to maintain the chem-osensitivity profile [10].
MethodsPatients and tissue samples for in vitro studiesTumor derived cells were obtained from 17 breast cancerpatients (16 primaries; 1 pre-treated with mitoxantroneand paclitaxel), 13 ovarian cancer patients (all pre-treatedwith a cisplatin-based regimen), 10 colorectal cancerpatients (all primaries) and 7 esophageal cancer patients(3 untreated; 4 treated with ECF). Cells were grown for 6days in serum-free medium with or without drugs, beforeRNA extraction and further PCR analysis.
Page 2 of 16(page number not for citation purposes)
BMC Cancer 2005, 5:78 http://www.biomedcentral.com/1471-2407/5/78
Patients and tissue samples for in vivo studyThirty-four esophageal adenocarcinoma biopsies, thirty-two of which were paired samples were obtained frompatients (17M:1F; median age 57, range 42–81) beforeand after administration of 2 cycles of ECF chemotherapy.After enzymatic digestion, tumor derived cells were centri-fuged over Ficoll (Sigma Chemical Co, Poole, UK, Cat.No. 1077-1) to remove blood contaminating cells,washed in PBS, and stored in RNA later (Ambion,Huntingdon, UK) at -80°C until further molecular analy-sis was performed. Tissue sections from these sampleswere stained for GST-π, MRP1, P-gp and TS. All tumorsamples were removed as part of patient treatment, withconsent for tissue donation and local research ethics com-mittee approval for use of the tissue surplus to diagnosticrequirements for cellular and molecular assays. Chemo-sensitivity data were available for 9 patients with recurrentovarian cancer, before treatment and on relapse, thoughin only one case was material available from both samplesfor quantitative RT-PCR.
DrugsCisplatin, 5-fluorouracil (5-FU), epirubicin, doxorubicin,irinotecan, paclitaxel (Taxol®) and topotecan (Hycamp-tin®) were obtained from the pharmacy at Queen Alexan-dra Hospital (Portsmouth, UK). Cisplatin, 5-FU,irinotecan and paclitaxel were stored at room tempera-ture, while all other drugs were stored at -20°C, as previ-ously reported [11]. Test drug concentrations (TDC) were10.0 µM for cisplatin, 345 µM for 5-FU, 148 µM for iri-notecan, 15.9 µM for paclitaxel, 2.5 µM for doxorubicin,0.862 µM for epirubicin, and 1.64 µM for topotecan.Combinations were made up by adding two or three drugsconcurrently at their 200% TDC at the beginning of theATP-cell viability assay and diluted in a constant ratio:sequential studies were not performed.
Short-term cell cultureBriefly, tumor tissue or fluid was taken by a histopatholo-gist or surgeon under sterile conditions, and transportedto the laboratory in cell culture medium of Dulbecco'smodified Eagle's medium (DMEM; Sigma Cat No.D5671) with antibiotics (100 U/ml penicillin and 100 µg/ml streptomycin, Sigma, Cat No. P0781) at 4°C. Cellswere obtained from solid tumors by enzymatic dissocia-tion, usually 0.75 mg/ml collagenase (Sigma Cat No. C-8051) overnight. Viable tumor-derived cells were purifiedby density centrifugation (Histopaque 1077-1, Sigma),washed, counted and resuspended to 100,000 cells/ml incase of effusions or 200,000 cells/ml for solid biopsies. Inthe meantime 96-well polypropylene microplates (Corn-ing-Costar, High Wycombe, UK; Cat No. 3790) were pre-pared with each drug/combination at six doublingdilutions in triplicate from 200% TDC to 6.25% TDC,according to Andreotti et al. [9]. Approximately 10,000–
20,000 cells/well were added to the plates to a final vol-ume of 200 µl/well. The plates were then incubated at37°C in 5% CO2 for 6 days, after which the degree of cellinhibition was assessed by measurement of the remainingATP in comparison with negative control (no drug, MO)and positive control (maximum inhibitor, MI) rows of 12wells each. Prior to cell lysis with an ATP-extracting rea-gent, an aliquot of 150 µl of cell suspension were removedfrom each well, centrifuged, washed with phosphate buff-ered saline (PBS) and stored at -80°C in a GTIC-contain-ing solution (lysis buffer RA1, Macherey-Nagel, Düren,Germany; Cat. No.740961) until further molecular analy-sis was carried out. The RNA was subsequently extractedfrom aliquots that had been exposed to a drug concentra-tion capable of inhibiting cell growth by 40–60%. ATPwas extracted from the remaining 50 µl cell suspensionand measured by light output in a microplate luminome-ter (Berthold Diagnostic Systems GmbH, Pforzheim, Ger-many) following addition of luciferin-luciferase.
RNA extractionCells obtained after enzymatic dissociation from endo-scopic esophageal biopsies or short term cell culture wereeither resuspended in RNA later (Ambion, Huntingdon,UK; Cat No. 7020) or lysed with buffer RA1 and stored at-80°C until RNA extraction. Total RNA was extracted fromat least 50,000 cells with a commercially available kit(NucleoSpin® RNA II mini, Macherey-Nagel; Cat No.740955) according to the manufacturer's instructions.The protocol included a DNase digestion step to preventcarry-over of genomic DNA in further analysis.
qRT-PCRA two-step protocol was employed. Firstly, total RNA wasreverse-transcribed using the Promega reverse transcrip-tion system (Promega, Southampton, UK; Cat No.A3500) including 8 µl RNA, 0.5 µg random primers, 20units of recombinant RNasin® ribonuclease inhibitor and15 units of reverse transcriptase AMV (Promega, Cat No.M9004) to each 20 µl reaction. The resulting c-DNA wasamplified by qPCR on a Biorad iCycler instrument (Bio-Rad Laboratories, Hemel Hampstead, UK). The constitu-ents of each PCR reaction (25 µl) were 1 µl of cDNA (orH2O), 200–500 nM of each primer (Table 1), 200 µMeach dATP, dCTP, dGTP, 400 µM dUTP, 3.0–5.0 mMMgCl2, 0.125 units AMPErase® UNG, 0.625 units of Ampl-iTaq Gold DNA polymerase and 1 × SYBR Green PCRbuffer (all reagents were from Applied Biosystems, War-rington, UK). Product amplification was performed up to45 PCR cycles, after uracil removal (2 min at 50°C) andpolymerase activation (10 min at 95°C). Each two-stepPCR cycle comprised denaturing (15 s at 95°C), anneal-ing, and extending (1 min at 60°C). At the end of each runa final melt curve cycle (cooling to 50°C and then increas-ing stepwise 1°C to 95°C) was performed to exclude the
Page 3 of 16(page number not for citation purposes)
BMC Cancer 2005, 5:78 http://www.biomedcentral.com/1471-2407/5/78
presence of primer-dimer artefacts. At least 3 housekeep-ing genes were used for each experiment chosen from thefollowing: glyceraldehyde-3 phosphate dehydrogenase(GAPDH), hypoxanthine phosphoribosyltransferase 1(HPRT1), human porphobilinogen deaminase (PBGD),succinate dehydrogenase complex-subunit A (SDHA) and
TATA box binding protein (TBP). The internal referencegenes were selected due to their relative low abundance innormal tissue [12]. The housekeeping genes were ampli-fied parallel to the target genes in separate wells. Whenpossible, primer sequences (Table 1) were chosen to spanexon boundaries to the following targets: breast cancer
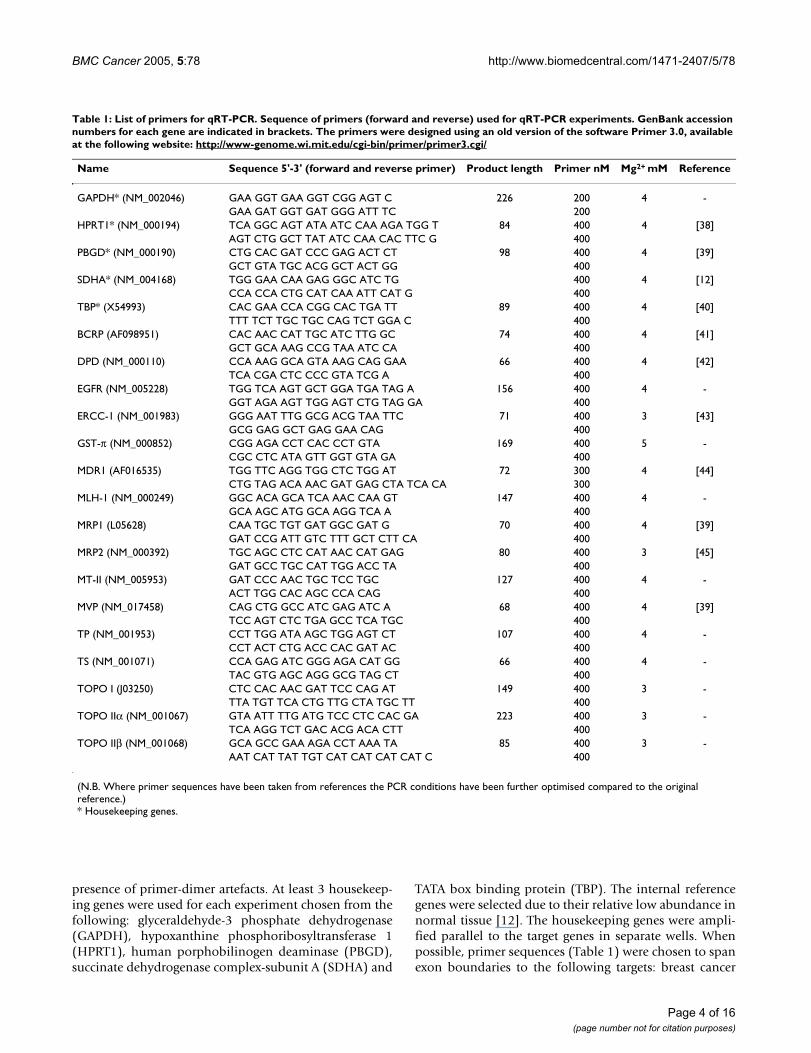
Table 1: List of primers for qRT-PCR. Sequence of primers (forward and reverse) used for qRT-PCR experiments. GenBank accession numbers for each gene are indicated in brackets. The primers were designed using an old version of the software Primer 3.0, available at the following website: http://www-genome.wi.mit.edu/cgi-bin/primer/primer3.cgi/
Name Sequence 5'-3' (forward and reverse primer) Product length Primer nM Mg2+ mM Reference
GAPDH* (NM_002046) GAA GGT GAA GGT CGG AGT C 226 200 4 -GAA GAT GGT GAT GGG ATT TC 200
HPRT1* (NM_000194) TCA GGC AGT ATA ATC CAA AGA TGG T 84 400 4 [38]AGT CTG GCT TAT ATC CAA CAC TTC G 400
PBGD* (NM_000190) CTG CAC GAT CCC GAG ACT CT 98 400 4 [39]GCT GTA TGC ACG GCT ACT GG 400
SDHA* (NM_004168) TGG GAA CAA GAG GGC ATC TG 400 4 [12]CCA CCA CTG CAT CAA ATT CAT G 400
TBP* (X54993) CAC GAA CCA CGG CAC TGA TT 89 400 4 [40]TTT TCT TGC TGC CAG TCT GGA C 400
BCRP (AF098951) CAC AAC CAT TGC ATC TTG GC 74 400 4 [41]GCT GCA AAG CCG TAA ATC CA 400
DPD (NM_000110) CCA AAG GCA GTA AAG CAG GAA 66 400 4 [42]TCA CGA CTC CCC GTA TCG A 400
EGFR (NM_005228) TGG TCA AGT GCT GGA TGA TAG A 156 400 4 -GGT AGA AGT TGG AGT CTG TAG GA 400
ERCC-1 (NM_001983) GGG AAT TTG GCG ACG TAA TTC 71 400 3 [43]GCG GAG GCT GAG GAA CAG 400
GST-π (NM_000852) CGG AGA CCT CAC CCT GTA 169 400 5 -CGC CTC ATA GTT GGT GTA GA 400
MDR1 (AF016535) TGG TTC AGG TGG CTC TGG AT 72 300 4 [44]CTG TAG ACA AAC GAT GAG CTA TCA CA 300
MLH-1 (NM_000249) GGC ACA GCA TCA AAC CAA GT 147 400 4 -GCA AGC ATG GCA AGG TCA A 400
MRP1 (L05628) CAA TGC TGT GAT GGC GAT G 70 400 4 [39]GAT CCG ATT GTC TTT GCT CTT CA 400
MRP2 (NM_000392) TGC AGC CTC CAT AAC CAT GAG 80 400 3 [45]GAT GCC TGC CAT TGG ACC TA 400
MT-II (NM_005953) GAT CCC AAC TGC TCC TGC 127 400 4 -ACT TGG CAC AGC CCA CAG 400
MVP (NM_017458) CAG CTG GCC ATC GAG ATC A 68 400 4 [39]TCC AGT CTC TGA GCC TCA TGC 400
TP (NM_001953) CCT TGG ATA AGC TGG AGT CT 107 400 4 -CCT ACT CTG ACC CAC GAT AC 400
TS (NM_001071) CCA GAG ATC GGG AGA CAT GG 66 400 4 -TAC GTG AGC AGG GCG TAG CT 400
TOPO I (J03250) CTC CAC AAC GAT TCC CAG AT 149 400 3 -TTA TGT TCA CTG TTG CTA TGC TT 400
TOPO IIα (NM_001067) GTA ATT TTG ATG TCC CTC CAC GA 223 400 3 -TCA AGG TCT GAC ACG ACA CTT 400
TOPO IIβ (NM_001068) GCA GCC GAA AGA CCT AAA TA 85 400 3 -AAT CAT TAT TGT CAT CAT CAT CAT C 400
(N.B. Where primer sequences have been taken from references the PCR conditions have been further optimised compared to the original reference.)* Housekeeping genes.
Page 4 of 16(page number not for citation purposes)

BMC Cancer 2005, 5:78 http://www.biomedcentral.com/1471-2407/5/78
resistance protein (BCRP), dihydropyrimidine dehydro-genase (DPD), epidermal growth factor receptor (EGFR),excision repair cross-complementing 1 (ERCC1) gene,glutathione-S-transferase isoform π (GST-π), multi-drugresistance gene 1 (MDR1), MLH1, multi-drug resistancerelated protein 1 (MRP1), multi-drug resistance relatedprotein 2 (MRP2), metallothionein (MT), major vaultprotein (MVP), thymidine phosphorylase (TP), thymi-dylate synthase (TS), topoisomerase I (TOPO I), topoi-somerase IIα and β (TOPO IIα and TOPO IIβ). Eachamplicon was amplified in a separate reaction to preventcompetition among multiple sets of primers. A positivecontrol (pooled c-DNA from a variety of human tumors,including breast, ovarian, colorectal and esophageal carci-noma) and negative controls with no template and RT-negative as template were added in every experiment. Allassays were run in triplicate. Validation experiments wererun to show that the efficiencies of the target and referencegenes amplifications were approximately equal, and inthe range 95–105%. The PCR cycle number that generatedthe first fluorescence signal above a threshold (thresholdcycle, Ct; 10 standard deviations above the mean fluores-cence generated during the baseline cycles) was deter-mined, and a comparative Ct method was then used tomeasure relative gene expression [13]. The following for-mula was used to calculate the relative amount of the tran-script in the sample: 2-∆∆Ct, where ∆Ct is the difference inCt between the gene of interest and the mean of the atleast two reference genes, and ∆∆Ct = ∆Ct of drug non-exposed cells – ∆Ct of drug-exposed cells, for the ex-vivoexperiments, or ∆∆Ct = ∆Ct of pre-chemotherapy sample– ∆Ct of post-chemotherapy sample, for matched tumorbiopsies.
ImmunohistochemistryThe monoclonal antibodies (Abs) for GST-π, MRP1, Pg-p,and TP (Table 2) were detected using the Chemicon IHCSelect™ – Immuno Peroxidase secondary detection system
(Chemicon International, Chandlers Ford, Southampton,UK, Cat# Det-HP1000) and stained with 3,3' diami-nobenzidine (DAB; HD Supplies, Aylesbury, UK, Cat.4170) on a Dako Autostainer instrument (Dako, Ely, UK).Positive and negative controls were included with eachrun. Volumes of 50 µl avidin/ml goat serum and 50 µlbiotin/ml primary Ab were used to block endogenous avi-din binding. The slides were counterstained with GillsHaematoxylin, dehydrated and cleared using the Leica© XLslide staining machine and mounted in Styrolite® mount-ing medium (BDH, Poole, Dorset, UK; Cat No. 361704Y).
Data analysisThe luminometer readings obtained from the ATP-TCAwere entered into an Excel 2000 spreadsheet (Microsoft)which calculated the percentage of cell inhibition for eachdrug concentration according to the previous publishedformula: 1 - [(Test - MI)/(MO - MI)]*100 [9]. For eachdrug-response curve, the 50% inhibitory concentration(IC50) and the 90% inhibitory concentration (IC90) werealso calculated as previously described [14].
Assessment of slides was done using the H-score. Stainingintensity (none, 0 points; weak, 1 point; moderate, 2points; strong, 3 points) and percentage of positive tumorcells were multiplied to achieve a score between 0 and300. A H-score of 100 or more was regarded as positiveand results less than 100 were regarded as negative. Thecorrelation coefficients were calculated by the method ofthe least squares, and the correlation between the IC90and IC50 values and immunohistochemistry indices wasassessed using univariate linear regression (Statsdirect,Sale, UK).
Non-parametric statistical methods were used. The calcu-lated and descriptive data were entered into an Access2000 database (Microsoft) and analysed using a Wilcoxontwo-tailed paired rank sum test for paired data or the
Table 2: List of antibodies used for immunohistochemical studies.
Antibody Pre-Treatment Dilution Incubation Cat No. Source Control Tissue
Glutathione S-Transferase pi GST-π (polyclonal)
None 1:150 30 min RT PU249-UP BioGenex (Distributor: Menarini Diagnostics, Wokingham, UK)
Breast Ca
P-glycoprotein (MDR-1) (Clone JSB-1)
Pressure Cook 2 min pH 6.0
1:100 Overnight 4°C NCL-JSB1 Novo Castra Newcastle-upon-Tyne, UK
Kidney
Multidrug Resistant-Related Protein (MRP) (Clone MRPm6, specific for MRP-1)
Pressure Cook 2 min pH 7.0
1:30 30 min RT MAB4122 Chemicon International Chandlers Ford, UK
Kidney
Thymidylate Synthase TS (Clone TS 106)
Pressure Cook 2 min pH 6.0
1:20 30 min RT MS471P Neo Markers (Distributor: Lab Vision, Newmarket, UK)
Colon Ca
When sections required microwaving a Matsui MIIOM microwave was used at 800 W power. Pressure cooking was performed with a Tefal Clipso Pressure Cooker using 70 P power.
Page 5 of 16(page number not for citation purposes)
BMC Cancer 2005, 5:78 http://www.biomedcentral.com/1471-2407/5/78
Mann-Whitney U test for unpaired data, as appropriate(Statsdirect). IC50 and IC90 values for each compoundwere correlated to the relative mRNA levels of target genesusing Spearman's rank correlation coefficient and multi-variate analysis. On statistical advice, we chose not to usea Bonferroni's correction, but it should be noted thatsome technically statistically significant results could havearisen by chance.
ResultsChemotherapy-induced changes in mRNA levels in biopsy materialFigures 1a–e illustrate changes to IC50 µM values in pre-and post chemotherapy ovarian tumor-derived cells testedwith a variety of chemotherapeutic agents. There is a gen-eral increase in resistance to doxorubicin when anthracy-cline-based regimens (mitoxantrone + paclitaxel orliposomal doxorubicin) are administered to ovariancancer patients (Fig. 1a). We observed little cross-resist-ance for mitoxantrone, topotecan, paclitaxel, and cispla-tin following anthracycline-based chemotherapy (Fig.1b–e), [15], although some patients do show alteration ofsensitivity to other agents. Similar changes can be seen inbreast cancer biopsies before and after administration of achemotherapy regimen [2]. The increase in resistance todoxorubicin shown in Figure 1a was accompanied bychanges in drug resistance gene expression. Figure 1f high-lights such up-regulation of MDR1 and breast cancerresistance protein (BCRP) observed in ovarian-tumorderived cells from a single patient.
Membrane proteins such as MDR1/P-gp, multi-drugresistance protein 1 (MRP1) and major vault protein(MVP) have been demonstrated to confer resistance toepirubicin by pumping the cytotoxic drug out of cells [16].Paired esophageal samples were obtained from the samesix patients both before and after chemotherapy; in all 6biopsy pairs (Table 3), there was an increase of the mRNAlevels of MDR1 following ECF chemotherapy (Fig. 2a). Ina larger series of 20 esophageal samples (including thosethat did not have a paired biopsy), divided in two groupsaccording to the patients' exposure to treatment, there wasa 5-fold increase in MDR1 expression in the post-chemo-therapy group (median expression index 0.07 pre- and0.37 post-chemotherapy, p < 0.0001, Mann-Whitneynon-parametric unpaired U test). The paired samplesfrom patients before and after ECF chemotherapy alsoshowed a trend towards increased expression of MRP1and MVP (Table 3), with three tumors showing concomi-tant up-regulation of both genes. Furthermore, theincreased expression of MRP1 paralleled that of glutath-ione-S-transferase isoform π (GST-π) in 2 of these 3 sam-ples, consistent with the mechanism of detoxification ofMRP1 that involves transport of glutathione-conjugatedmolecules [17].
We then determined the relative mRNA levels of enzymesthat have previously been correlated with 5-FU sensitivity:dihydropyrimidine dehydrogenase (DPD), thymidinephosphorylase (TP) and thymidylate synthase (TS) [18].No significant difference was found for these 3 geneswhen we compared their expression pre- and post-chem-otherapy in unpaired samples (Table 3). However, wefound a modest increase of TS expression in 5/6 pairedsamples (Fig. 2b), 3 of which also showed a concomitantdecrease in TP levels. One sample showed a paradoxicaldecrease in TS, indicating some heterogeneity. Althoughthe sample size is small, the trend of increased TS levels inECF exposed tumors is consistent with a number of previ-ous reports that demonstrated an acute induction of TSexpression in cell lines, animal models and humantumors following 5-FU treatment [18,19].
It should be noted that these qRT-PCR results were allobtained from samples that included normal cells presentin the tumor as well as neoplastic cells, and could beaffected by changes in normal cells as well as malignantcells.
Chemotherapy-induced changes in protein levels in biopsy materialIHC was performed on 16 paired esophageal biopsies:qRT-PCR data were obtained for four of these pairs. Over-all, we were able to confirm an increased expression of theMDR-1 encoded protein, P-gp (Table 4), in 8/16 pairedtumor samples obtained from patients who had beenexposed to ECF chemotherapy. TS positivity (Table 4) wasfound in 10/16 samples obtained before treatment and10/16 post-chemotherapy specimens; in this instance themodest induction of TS seen at the mRNA level did notreflect an increase in protein level (data not shown). Wefound GST-π (Table 4) positivity in 5/16 pre-chemother-apy biopsies. In the post-chemotherapy specimens wedetected strong expression of GST-π in all but one of thesamples. In one case that had been negative at diagnosiswe measured a marginal increase of mRNA levels withqRT-PCR. A total of 13/16 pre- and 12/16 post-chemo-therapy biopsies were found to be positive for MRP1(Table 4). Overall, these data show little correlationbetween the mRNA and the degree of expression of pro-tein levels determined by IHC. Confounding factors maybe the presence of non-cancerous cells as mentionedabove, but also the nature of IHC, which is at best a semi-quantitative technique.
Changes in short-term cell cultureOf the 47 solid tumor samples studied in short-term cul-tures, 7 were esophago-gastric, 17 were breast carcinomas,13 were ovarian carcinomas and 10 were colorectaltumors. A total of 93 experiments were performed, as in
Page 6 of 16(page number not for citation purposes)

BMC Cancer 2005, 5:78 http://www.biomedcentral.com/1471-2407/5/78
Changes due to chemotherapy in biopsies taken before and after chemotherapyFigure 1Changes due to chemotherapy in biopsies taken before and after chemotherapy. Cytotoxicity of a) doxorubicin; b) mitox-antrone; c) topotecan; d) paclitaxel and e) cisplatin (expressed as IC50 µM) in paired samples obtained from ovarian cancer patients before and after they were treated with an anthracycline containing regimen (paclitaxel+mitoxantrone n = 7; liposomal doxorubicin n = 2). Each line represents an individual patient. (f) Gene expression changes pre- and post-treatment (paclitaxel plus mitoxantrone chemotherapy) in one patient were analysed by qRT-PCR following in vitro exposure to doxorubicin.
0.0
0.5
1.0
1.5
2.0
2.5
3.0
3.5
Pre-chemotherapy----------------> Post-chemotherapy
Do
xo
rub
icin
IC
50
M
a)
0.0
0.5
1.0
1.5
2.0
2.5
3.0
3.5
Pre-chemotherapy----------------> Post-chemotherapy
Mit
ox
an
tro
ne
IC5
0M
b)
0.0
0.5
1.0
1.5
2.0
2.5
3.0
3.5
4.0
Pre-chemotherapy----------------> Post-chemotherapy
To
po
teca
n I
C5
0M
c)
0.0
10.0
20.0
30.0
40.0
50.0
60.0
70.0
80.0
Pre-chemotherapy----------------> Post-chemotherapy
Pa
clit
ax
el I
C5
0M
d)
0.18
114
3.4
0.1
1
10
100
1000
Pre-chemotherapy------------------->Post-chemotherapy
Rel
ati
ve
gen
e ex
pre
ssio
n [
2-
Ct ]
BCRP
MDR1
MRP1
MVP
TOPO I
TOPO II
TOPO II
f)
0.0
5.0
10.0
15.0
20.0
25.0
30.0
35.0
40.0
Pre-chemotherapy----------------> Post-chemotherapy
Cis
pla
tin
IC
50
M
e)
Page 7 of 16(page number not for citation purposes)

BMC Cancer 2005, 5:78 http://www.biomedcentral.com/1471-2407/5/78
most cases the same sample was treated with 2 or moredrugs.
Doxorubicin effects in short-term cell cultureIn the first instance, we decided to study the effects ofanthracycline exposure for 6 days on tumour-derivedcells. Our in vitro experiments showed a significant down-regulation of TOPO IIα; its median levels decreased from0.546 (range 0.005–1.782) to 0.017 (range 0.0004–0.595) units in a group of 14 breast samples (p < 0.0001,Wilcoxon matched pairs test) and from 1.491 (range0.080–6.884) to 0.089 (range 0.003–3.605) units in theovarian cancer subgroup (p < 0.0015, Wilcoxon matchedpairs test). The down-regulation of TOPO IIα levels wasgreater than 2-fold in 13/14 breast samples and in 9/12ovarian samples (Fig. 3a). It has been suggested that can-cer cells can concomitantly down-regulate TOPO IIα andup-regulate TOPO I in response to treatment withtopoisomerase II inhibitors [20]. In our series we noted ageneral trend of diminished levels of TOPO I, particularlyin the ovarian subgroup (Fig 3b). It is possible that doxo-rubicin exposure resulted in quiescence of cells whichwere not killed, and which would not therefore requirehigher levels of TOPO I, or that doxorubicin may alsopartly inhibit TOPO I, as suggested by a previous study[21].
We observed a significant up-regulation of MRP-1 (p <0.0001, Wilcoxon matched pairs test; Fig. 3c) and of MVP(p < 0.0023, Wilcoxon; Table 5) in the breast cancer sub-group. The same effect was not found in the ovariancancer group, in which the levels of MRP-1 and MVPincreased over 0.5 fold in only 4/12 and 3/12 samples,respectively (Table 5). No significant changes were foundin the expression of MDR-1 and BCRP, although it shouldbe noted that there was substantial heterogeneity amongindividual tumors (Table 5). For example, we measured a
greater than 2-fold increase of MDR-1 levels in 2/12 ovar-ian samples (none of whom had received a MDR-1pumped chemotherapeutic agent before), and a signifi-cant up-regulation of BCRP in 3/12 ovarian samples.
Topoisomerase I inhibitors effects in short-term cell cultureSubsequently we looked at the effect of 2-camptothecinderivatives, irinotecan and topotecan, on colorectal andovarian tumor cells, respectively (Table 6). As bothcompounds act by TOPO I inhibition, we firstly measuredthe levels of their target enzyme. We noted a trend towardsdown-regulation of TOPO I in treated cells: exposure toirinotecan decreased TOPO I levels >2-fold in 3/7 colorec-tal tumors, while topotecan caused down-regulation in 4/10 ovarian samples (Fig. 3d). The decrease of TOPO I wasaccompanied by a concomitant reduction of TOPO IIαexpression, which was particularly pronounced (>4-fold)in 6/7 colorectal tumors and 8/10 ovarian tumors (Fig.3e).
No significant changes were observed in the expression ofthe drug efflux molecules, MDR-1, BCRP and MRP-1(Table 6), though, as in the case of doxorubicin, consider-able heterogeneity was noted. We observed an increase ofBCRP levels after irinotecan or topotecan exposure in 2/7colorectal samples and 3/9 ovarian samples.
Amongst the genes implicated in DNA repair (Table 6),the modest down-regulation of MLH1 by topotecan expo-sure was not found statistically significant, although it wasnoted in 7/10 ovarian samples. Up-regulation of ERCC1expression was found in all 10 ovarian cancer samplesexposed to topotecan (p < 0.002, Wilcoxon), and in all 7colorectal specimens treated with irinotecan, although inthis group the increase was modest (p = 0.016, Wilcoxon).
Table 3: Relative expression of mRNA levels in esophageal samples obtained from patients before and after chemotherapy (median values). The last 2 columns on the right represent values for the 12 paired biopsies. The p values have been calculated using non parametric statistics, and in detail the Mann Whitney U test for unpaired samples, and the Wilcoxon matched pairs test for paired samples.
All esophageal samples Paired esophageal samples
Target gene Pre-chemo n = 13 Post-chemo n = 6 p Pre-chemo n = 6 Post-chemo n = 6 p
DPD 0.71 1.09 0.4117 0.68 1.09 0.3750GST-π 4.39 0.88 0.1969 1.61 1.85 0.8438MDR1 0.07 0.37 <0.0001 0.11 0.43 0.0313MRP1 4.81 10.60 0.1624 4.58 10.77 0.4375MT II 36.35 23.43 0.5846 12.49 24.12 0.8438MVP 6.61 8.57 0.6544 6.39 9.11 0.5625TP 4.21 2.58 0.2326 3.56 3.01 >0.999TS 1.11 2.43 0.1851 1.27 2.27 0.4375
Page 8 of 16(page number not for citation purposes)

BMC Cancer 2005, 5:78 http://www.biomedcentral.com/1471-2407/5/78
Changes in relative gene expression in 6 paired esophageal tumor biopsiesFigure 2Changes in relative gene expression in 6 paired esophageal tumor biopsies. a) Changes in MDR1 relative gene expression and b) changes in TS relative gene expression. Each dot represents the relative mRNA level for an individual tumor, measured before and after ECF chemotherapy.
a)
0.01
0.1
1
Pre-ECF ---------------------------------> Post-ECF
MD
R1 R
elati
ve
exp
ress
ion
(2-
Ct )
b)
0.1
1
10
100
1000
Pre-ECF -----------------------------------> Post-ECF
TS
Rel
ati
ve
exp
ress
ion
(2
-C
t )
Page 9 of 16(page number not for citation purposes)

BMC Cancer 2005, 5:78 http://www.biomedcentral.com/1471-2407/5/78
Table 4: Median expression (range in brackets) of protein levels in paired esophageal samples (n = 16) obtained from patients before and after chemotherapy. Slides were assessed using the H-score. A H-score of 100 or more was regarded as positive and below 100 was regarded as negative.
Antibody Pre-chemotherapy Post-chemotherapy
GST-π 35 (0–300) 200 (70–300)P-gP 45 (0–300) 100 (0–300)MRP 100 (0–200) 100 (10–200)TS 120 (0–300) 100 (0–300)
Changes in relative expression of putative chemoresistance genes in tumor-derived cellsFigure 3Changes in relative expression of putative chemoresistance genes in tumor-derived cells. Each dot represents the relative mRNA level for an individual sample, measured after in vitro drug exposure compared with untreated control cells. (a) TOPO IIα expression in breast (black lines) and ovarian (red lines) tumor cells after doxorubicin exposure. (b) TOPO I expression in breast (black lines) and ovarian (red lines) tumor cells after doxorubicin exposure. (c) MRP1 expression in breast (black lines) and ovarian (red lines) tumor cells after doxorubicin exposure. (d) TOPO I expression in ovarian tumor cells after topotecan exposure. (e) TOPO IIα expression in ovarian tumor cells after topotecan exposure. (f) TS expression in breast (red lines) and colorectal (black lines) tumor cells after 5-FU exposure. (g) ERCC1 expression in breast (black lines) and ovarian (red lines) tumor cells after cisplatin exposure. (h) TS expression in esophageal tumor cells after ECF exposure. The numerical data for these graphs is summarized in Tables 5-8.
0.0001
0.001
0.01
0.1
1
10
Control --------------------------> Doxorubicin
TO
PO
IIαα αα
rela
tiv
eex
pre
ssio
n(2
- ∆∆ ∆∆C
t )
1
10
100
Control -----------------------------> Doxorubicin
TO
PO
Ire
lati
ve
exp
ress
ion
(2- ∆∆ ∆∆
Ct )
0.1
1
10
Control ----------------------------> Doxorubicin
MR
P1
rela
tiv
eex
pre
ssio
n(2
- ∆∆ ∆∆C
t )
1
10
Control -----------------------------------> Topotecan
TO
PO
Ire
lati
ve
exp
ress
ion
(2- ∆∆ ∆∆
Ct )
0.001
0.01
0.1
1
10
Control -----------------------------------> Topotecan
TO
PO
IIαα αα
rela
tiv
eex
pre
ssio
n(2
- ∆∆ ∆∆C
t )
0.1
1
10
100
Control --------------------------------> 5-FU
TS
rela
tive
exp
ress
ion
(2- ∆∆ ∆∆
Ct )
0.1
1
10
Control --------------------------------> Cisplatin
ER
CC
1re
lati
ve
exp
ress
ion
(2- ∆∆ ∆∆
Ct )
1
10
100
Control -------------------------------------------> ECF
TS
rela
tiv
eex
pre
ssio
n(2
- ∆∆ ∆∆C
t )
a) b) c) d)
e) f) g) h)
Page 10 of 16(page number not for citation purposes)
BMC Cancer 2005, 5:78 http://www.biomedcentral.com/1471-2407/5/78
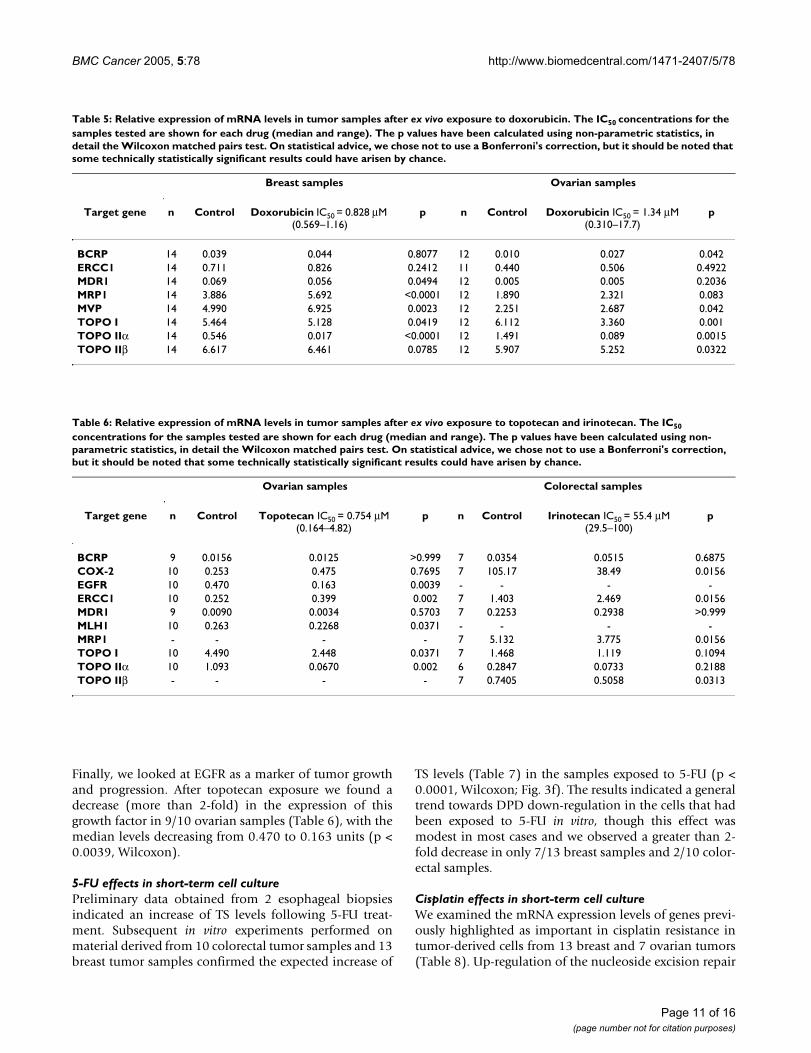
Finally, we looked at EGFR as a marker of tumor growthand progression. After topotecan exposure we found adecrease (more than 2-fold) in the expression of thisgrowth factor in 9/10 ovarian samples (Table 6), with themedian levels decreasing from 0.470 to 0.163 units (p <0.0039, Wilcoxon).
5-FU effects in short-term cell culturePreliminary data obtained from 2 esophageal biopsiesindicated an increase of TS levels following 5-FU treat-ment. Subsequent in vitro experiments performed onmaterial derived from 10 colorectal tumor samples and 13breast tumor samples confirmed the expected increase of
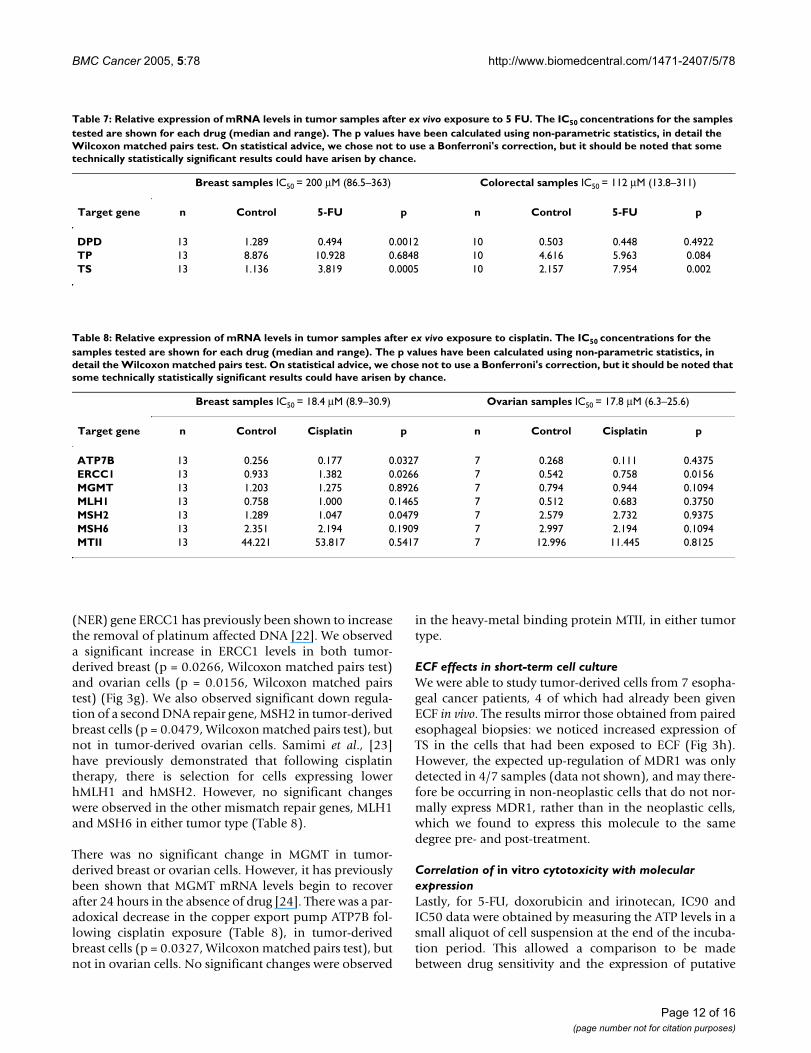
TS levels (Table 7) in the samples exposed to 5-FU (p <0.0001, Wilcoxon; Fig. 3f). The results indicated a generaltrend towards DPD down-regulation in the cells that hadbeen exposed to 5-FU in vitro, though this effect wasmodest in most cases and we observed a greater than 2-fold decrease in only 7/13 breast samples and 2/10 color-ectal samples.
Cisplatin effects in short-term cell cultureWe examined the mRNA expression levels of genes previ-ously highlighted as important in cisplatin resistance intumor-derived cells from 13 breast and 7 ovarian tumors(Table 8). Up-regulation of the nucleoside excision repair
Table 5: Relative expression of mRNA levels in tumor samples after ex vivo exposure to doxorubicin. The IC50 concentrations for the samples tested are shown for each drug (median and range). The p values have been calculated using non-parametric statistics, in detail the Wilcoxon matched pairs test. On statistical advice, we chose not to use a Bonferroni's correction, but it should be noted that some technically statistically significant results could have arisen by chance.
Breast samples Ovarian samples
Target gene n Control Doxorubicin IC50 = 0.828 µM (0.569–1.16)
p n Control Doxorubicin IC50 = 1.34 µM (0.310–17.7)
p
BCRP 14 0.039 0.044 0.8077 12 0.010 0.027 0.042ERCC1 14 0.711 0.826 0.2412 11 0.440 0.506 0.4922MDR1 14 0.069 0.056 0.0494 12 0.005 0.005 0.2036MRP1 14 3.886 5.692 <0.0001 12 1.890 2.321 0.083MVP 14 4.990 6.925 0.0023 12 2.251 2.687 0.042TOPO I 14 5.464 5.128 0.0419 12 6.112 3.360 0.001TOPO IIα 14 0.546 0.017 <0.0001 12 1.491 0.089 0.0015TOPO IIβ 14 6.617 6.461 0.0785 12 5.907 5.252 0.0322
Table 6: Relative expression of mRNA levels in tumor samples after ex vivo exposure to topotecan and irinotecan. The IC50
concentrations for the samples tested are shown for each drug (median and range). The p values have been calculated using non-parametric statistics, in detail the Wilcoxon matched pairs test. On statistical advice, we chose not to use a Bonferroni's correction, but it should be noted that some technically statistically significant results could have arisen by chance.
Ovarian samples Colorectal samples
Target gene n Control Topotecan IC50 = 0.754 µM (0.164–4.82)
p n Control Irinotecan IC50 = 55.4 µM (29.5–100)
p
BCRP 9 0.0156 0.0125 >0.999 7 0.0354 0.0515 0.6875COX-2 10 0.253 0.475 0.7695 7 105.17 38.49 0.0156EGFR 10 0.470 0.163 0.0039 - - - -ERCC1 10 0.252 0.399 0.002 7 1.403 2.469 0.0156MDR1 9 0.0090 0.0034 0.5703 7 0.2253 0.2938 >0.999MLH1 10 0.263 0.2268 0.0371 - - - -MRP1 - - - - 7 5.132 3.775 0.0156TOPO I 10 4.490 2.448 0.0371 7 1.468 1.119 0.1094TOPO IIα 10 1.093 0.0670 0.002 6 0.2847 0.0733 0.2188TOPO IIβ - - - - 7 0.7405 0.5058 0.0313
Page 11 of 16(page number not for citation purposes)
BMC Cancer 2005, 5:78 http://www.biomedcentral.com/1471-2407/5/78
(NER) gene ERCC1 has previously been shown to increasethe removal of platinum affected DNA [22]. We observeda significant increase in ERCC1 levels in both tumor-derived breast (p = 0.0266, Wilcoxon matched pairs test)and ovarian cells (p = 0.0156, Wilcoxon matched pairstest) (Fig 3g). We also observed significant down regula-tion of a second DNA repair gene, MSH2 in tumor-derivedbreast cells (p = 0.0479, Wilcoxon matched pairs test), butnot in tumor-derived ovarian cells. Samimi et al., [23]have previously demonstrated that following cisplatintherapy, there is selection for cells expressing lowerhMLH1 and hMSH2. However, no significant changeswere observed in the other mismatch repair genes, MLH1and MSH6 in either tumor type (Table 8).
There was no significant change in MGMT in tumor-derived breast or ovarian cells. However, it has previouslybeen shown that MGMT mRNA levels begin to recoverafter 24 hours in the absence of drug [24]. There was a par-adoxical decrease in the copper export pump ATP7B fol-lowing cisplatin exposure (Table 8), in tumor-derivedbreast cells (p = 0.0327, Wilcoxon matched pairs test), butnot in ovarian cells. No significant changes were observed
in the heavy-metal binding protein MTII, in either tumortype.
ECF effects in short-term cell cultureWe were able to study tumor-derived cells from 7 esopha-geal cancer patients, 4 of which had already been givenECF in vivo. The results mirror those obtained from pairedesophageal biopsies: we noticed increased expression ofTS in the cells that had been exposed to ECF (Fig 3h).However, the expected up-regulation of MDR1 was onlydetected in 4/7 samples (data not shown), and may there-fore be occurring in non-neoplastic cells that do not nor-mally express MDR1, rather than in the neoplastic cells,which we found to express this molecule to the samedegree pre- and post-treatment.
Correlation of in vitro cytotoxicity with molecular expressionLastly, for 5-FU, doxorubicin and irinotecan, IC90 andIC50 data were obtained by measuring the ATP levels in asmall aliquot of cell suspension at the end of the incuba-tion period. This allowed a comparison to be madebetween drug sensitivity and the expression of putative
Table 7: Relative expression of mRNA levels in tumor samples after ex vivo exposure to 5 FU. The IC50 concentrations for the samples tested are shown for each drug (median and range). The p values have been calculated using non-parametric statistics, in detail the Wilcoxon matched pairs test. On statistical advice, we chose not to use a Bonferroni's correction, but it should be noted that some technically statistically significant results could have arisen by chance.
Breast samples IC50 = 200 µM (86.5–363) Colorectal samples IC50 = 112 µM (13.8–311)
Target gene n Control 5-FU p n Control 5-FU p
DPD 13 1.289 0.494 0.0012 10 0.503 0.448 0.4922TP 13 8.876 10.928 0.6848 10 4.616 5.963 0.084TS 13 1.136 3.819 0.0005 10 2.157 7.954 0.002
Table 8: Relative expression of mRNA levels in tumor samples after ex vivo exposure to cisplatin. The IC50 concentrations for the samples tested are shown for each drug (median and range). The p values have been calculated using non-parametric statistics, in detail the Wilcoxon matched pairs test. On statistical advice, we chose not to use a Bonferroni's correction, but it should be noted that some technically statistically significant results could have arisen by chance.
Breast samples IC50 = 18.4 µM (8.9–30.9) Ovarian samples IC50 = 17.8 µM (6.3–25.6)
Target gene n Control Cisplatin p n Control Cisplatin p
ATP7B 13 0.256 0.177 0.0327 7 0.268 0.111 0.4375ERCC1 13 0.933 1.382 0.0266 7 0.542 0.758 0.0156MGMT 13 1.203 1.275 0.8926 7 0.794 0.944 0.1094MLH1 13 0.758 1.000 0.1465 7 0.512 0.683 0.3750MSH2 13 1.289 1.047 0.0479 7 2.579 2.732 0.9375MSH6 13 2.351 2.194 0.1909 7 2.997 2.194 0.1094MTII 13 44.221 53.817 0.5417 7 12.996 11.445 0.8125
Page 12 of 16(page number not for citation purposes)

BMC Cancer 2005, 5:78 http://www.biomedcentral.com/1471-2407/5/78
resistance genes in the cells that had been exposed tochemotherapeutic agents. Using multivariate analysis, theIC90 of 5-FU was correlated with the median change ofmRNA levels of both TS and DPD measured in 5-FUtreated tumor-derived cells compared to control cells(expressed as 2-∆∆Ct) (R2 = 0.872704; p = 0.0006 for DPD;p < 0.0001 for TS). In addition, expression of ERCC1mRNA correlated with the IC50 values determined fordoxorubicin in 11 breast samples (R = 0.7204, p <0.0124). No other correlations were noted between sensi-tivity to the drugs and gene expression levels.
DiscussionOur results suggest that rapid adaptation to chemotherapymay result in a resistant phenotype. This is mediated bydown- or up-regulation of genes that are usually corre-lated to the mechanism of action of the individual chem-otherapeutic agent or relevant resistance mechanisms.Our data suggest that short-term cell culture of tumor-derived cells with drugs could provide a suitable modelfor studying resistance mechanisms. The mechanismsobserved appeared to be more specific to the drug usedthan to the tumor type: constitutive resistance probablyreflects pre-chemotherapy expression of resistance mech-anisms (e.g. drug efflux molecule expression in esopha-geal carcinoma). Acquired resistance develops rapidly andis likely to reflect changes in gene regulation rather thanmutation-dependent selection of clones. Clonal selectionmay be important in some rapidly growing tumors andcell lines grown in serum-containing media, but isunlikely to be the major factor in solid tumors which haverelatively low doubling rates. While mutation-mediatedresistance can be much more profound than that observedhere, our data suggest that the functional effects may stillbe sufficient to render the patient's tumor resistant totreatment within one cycle of chemotherapy.
Changes in resistance and target moleculesA large proportion of the published studies on resistanceto chemotherapy have investigated the development ofresistance using cell lines generated in the lab after pro-longed and step-wise exposure to anti-cancer drugs. Thesein vitro models are not necessarily representative of the invivo situation, when patients are usually administered onecycle of chemotherapy every 3–4 weeks. There are fewstudies in clinical samples. Our approach allows us toexpose the tumor cells to single drugs under carefully con-trolled conditions, even if this would be an inappropriatedrug for that particular patient. We are then able to lookconcomitantly at cytotoxicity, and molecular markers ofresistance in the same experiment.
Anthracyclines have a mechanism of action that includesTOPO IIα inhibition via DNA intercalation. Resistance toanthracyclines is thought to be mediated by a number of
different mechanisms, which include mutation or altera-tion of its target enzyme, TOPO IIα, and up-regulation ofdrug efflux proteins, such as BCRP, MRP1, MVP and MDR-1 [25]. Our data show that many of the cell line data arecorrect: in most solid tumors, it appears that anthracyclineand topotecan exposure do lead to decreased topoisomer-ase II and I expression respectively, while inducing theexpression of drug efflux pump molecules. The reason forthe alteration in topoisomerase II expression followingtopotecan exposure is not clear, but topotecan does affectcell proliferation, and any reduction in proliferationwould indirectly affect the expression of topoisomerase IIalpha induced during S phase. However, our results alsosuggest that the heterogeneity of chemosensitivitybetween tumors is reflected by heterogeneity of moleculardeterminants of resistance/sensitivity.
The increased TS levels in ECF and 5-FU exposed cells isconsistent with a number of previous reports. Geneamplification of TS with consequent increases in TSmRNA and protein has been observed in cell lines that areresistant to 5-FU and fluorodeoxyuridine (FUDR) [26,27].Treatment with 5-FU has been shown to acutely induce TSexpression in cell lines, animal models and humantumors [19,28-30]. In general there is strong evidence thatthe expression of DPD and TS in GI cancers is predictiveof response to 5-FU. It should be noted that the concom-itant measurement of both these markers markedlyenhanced the ability to predict tumor response to 5-FU-based chemotherapy in a number of studies [31-34].
Gene profiling and drug responseThere are few studies comparing gene expression beforeand after chemotherapy. A few studies have reportedmicroarray data in biopsy material taken before and after(or even during) chemotherapy. These studies are of greatinterest, though normal cell effects cannot be excludedfrom the results. Buchholz et al. [35] employed cDNAmicroarray to measure gene expression changes duringchemotherapy in 5 patients with breast cancer. Clarke etal. [36] studied gene expression changes in 18 rectal can-cer patients undergoing therapy with Mitomycin C or 5-FU. This study reported a number of genes implicated inprotein synthesis and RNA metabolism to be significantlydecreased during drug treatment. These studies are notdirectly comparable: tumors of different types respondbetter to different drugs, and differences in their adapta-tion to these drugs are therefore expected on the basis oftheir innate sensitivity or resistance.
The potential for positive selection: molecular chessIt is common to show a cross-over effect with clinical trialsof treatments with differing mechanisms of action, inwhich patients treated with one type of chemotherapyshow sensitivity to the alternative regimen following fail-
Page 13 of 16(page number not for citation purposes)

BMC Cancer 2005, 5:78 http://www.biomedcentral.com/1471-2407/5/78
ure of the one to which they were allocated. The recogni-tion that selection of a molecular phenotype by exposureto one anti-cancer agent may leads to the expression ofmolecular targets for other drugs raises the possibility thatit might be possible to enhance sensitivity to second-lineor maintenance therapy by careful selection of patients forfirst-line therapy [37]. This approach would providepatients with a "backstop" for their first-line chemother-apy. One can envisage a series of interlocking treatmentsusing drugs with specific molecular targets, monitored bymolecular assays, which would allow the oncologist toemploy a form of molecular chess to defeat the tumor.This approach might overcome the inherent heterogene-ity, which is likely to underlie the variable results obtainedfrom sequential chemotherapy to date. Assessment of thisprocess in tumors could provide predictive assays allow-ing the oncologist to tailor therapy to the patient andavoid the development of resistance within the tumor.
ConclusionIn summary, this study suggests that up-regulation ofresistance genes or down-regulation in target genes mayoccur rapidly in human solid tumors, within days of thestart of treatment, and that similar changes are present inpre- and post-chemotherapy biopsy material. The molec-ular processes used by each tumor appear to be linked tothe drug used, but there is heterogeneity betweenindividual tumors, even those with the same histologicaltype, in the pattern and magnitude of response to thesame drugs. Adaptation to chemotherapy may explainwhy prediction of resistance mechanisms is difficult onthe basis of tumor type alone or individual markers, andsuggests that more complex predictive methods arerequired to improve the response rates to chemotherapy.
List of abbreviationsGene names were abbreviated as follows: glyceraldehyde-3 phosphate dehydrogenase (GAPDH), hypoxanthinephosphoribosyltransferase 1 (HPRT1), human porpho-bilinogen deaminase (PBGD), succinate dehydrogenasecomplex-subunit A (SDHA) and TATA box binding pro-tein (TBP), breast cancer resistance protein (BCRP), dihy-dropyrimidine dehydrogenase (DPD), excision repaircross-complementing 1 (ERCC1) gene, epidermal growthfactor receptor (EGFR), glutathione-S-transferase isoformπ (GST-π), multi-drug resistance gene 1 (MDR1), mutLhomologue 1 (MLH1), multi-drug resistance related pro-tein 1 (MRP1), multi-drug resistance related protein 2(MRP2), metallothionein II (MT II), major vault protein(MVP), thymidine phosphorylase (TP), thymidylate syn-thase (TS), topoisomerase I (TOPO I), topoisomerase IIαand β (TOPO II).
Competing interestsIAC is a director of CanTech Ltd. The remaining authorsdeclare that they have no competing interests.
Authors' contributionsIAC, FDN and SJM conceived and designed the study.FDN, SJM, LAK, PAW, SS, AF and SG participated in theshort-term cell culture studies. FDN, SJM, LAK and FGGalso carried out the qRT-PCR studies. PJ carried out theimmunohisotochemical studies and IAC and SDP carriedout histological analysis. IAC, FDN, SJM and BH partici-pated in the statistical analysis. All authors participated inthe data analysis, drafting of the manuscript and read andapproved the final version.
AcknowledgementsThis project was funded by Portsmouth Hospitals NHS Trust, CanTech Ltd, the BBSRC (Ref 31/ABY14513), the Royal Navy (SJM), the European Com-mission (grant number BMH4-CT98-9522; FDN), and was supported by a donation from Schering Plough Ltd (LAK). We are grateful to the NHS pre-dictive oncology programme and all the patients, oncologists and surgeons who submitted material for chemosensitivity testing to make this study pos-sible. We thank Christine Seddon for assistance with data entry.
References1. Andreotti PE, Linder D, Hartmann DM, Cree IA, Pazzagli M, Bruckner
HW: TCA-100 tumour chemosensitivity assay: differences insensitivity between cultured tumour cell lines and clinicalstudies. J Biolumin Chemilumin 1994, 9:373-378.
2. Cree IA, Kurbacher CM, Untch M, Sutherland LA, Hunter EM, SubediAM, James EA, Dewar JA, Preece PE, Andreotti PE: Correlation ofthe clinical response to chemotherapy in breast cancer withex vivo chemosensitivity. Anti-Cancer Drugs 1996, 7:630-635.
3. Matsumoto Y, Takano H, Fojo T: Cellular adaptation to drugexposure: evolution of the drug-resistant phenotype. CancerRes 1997, 57:5086-5092.
4. Egger G, Liang G, Aparicio A, Jones PA: Epigenetics in human dis-ease and prospects for epigenetic therapy. Nature 2004,429:457-463.
5. Abolhoda A, Wilson AE, Ross H, Danenberg PV, Burt M, Scotto KW:Rapid activation of MDR1 gene expression in human meta-static sarcoma after in vivo exposure to doxorubicin. Clin Can-cer Res 1999, 5:3352-3356.
6. Hu XF, Slater A, Kantharidis P, Rischin D, Juneja S, Rossi R, Lee G,Parkin JD, Zalcberg JR: Altered multidrug resistance phenotypecaused by anthracycline analogues and cytosine arabinosidein myeloid leukemia. Blood 1999, 93:4086-4095.
7. Stein U, Jurchott K, Schlafke M, Hohenberger P: Expression ofmultidrug resistance genes MVP, MDR1, and MRP1 deter-mined sequentially before, during, and after hyperthermicisolated limb perfusion of soft tissue sarcoma and melanomapatients. J Clin Oncol 2002, 20:3282-3292.
8. Tada Y, Wada M, Migita T, Nagayama J, Hinoshita E, Mochida Y, Mae-hara Y, Tsuneyoshi M, Kuwano M, Naito S: Increased expressionof multidrug resistance-associated proteins in bladder can-cer during clinical course and drug resistance to doxorubicin.Int J Cancer 2002, 98:630-635.
9. Andreotti PE, Cree IA, Kurbacher CM, Hartmann DM, Linder D,Harel G, Gleiberman I, Caruso PA, Ricks SH, Untch M: Chemosen-sitivity testing of human tumors using a microplate adenos-ine triphosphate luminescence assay: clinical correlation forcisplatin resistance of ovarian carcinoma. Cancer Research1995, 55:5276-5282.
10. Wilmanns C, Fan D, O'Brian CA, Bucana CD, Fidler IJ: Orthotopicand ectopic organ environments differentially influence thesensitivity of murine colon carcinoma cells to doxorubicinand 5-fluorouracil. Int J Cancer 1992, 52:98-104.
Page 14 of 16(page number not for citation purposes)
http://www.ncbi.nlm.nih.gov/entrez/query.fcgi?cmd=Retrieve&db=PubMed&dopt=Abstract&list_uids=7879653
http://www.ncbi.nlm.nih.gov/entrez/query.fcgi?cmd=Retrieve&db=PubMed&dopt=Abstract&list_uids=7879653
http://www.ncbi.nlm.nih.gov/entrez/query.fcgi?cmd=Retrieve&db=PubMed&dopt=Abstract&list_uids=7879653
http://www.ncbi.nlm.nih.gov/entrez/query.fcgi?cmd=Retrieve&db=PubMed&dopt=Abstract&list_uids=8913430
http://www.ncbi.nlm.nih.gov/entrez/query.fcgi?cmd=Retrieve&db=PubMed&dopt=Abstract&list_uids=8913430
http://www.ncbi.nlm.nih.gov/entrez/query.fcgi?cmd=Retrieve&db=PubMed&dopt=Abstract&list_uids=8913430
http://www.ncbi.nlm.nih.gov/entrez/query.fcgi?cmd=Retrieve&db=PubMed&dopt=Abstract&list_uids=9371507
http://www.ncbi.nlm.nih.gov/entrez/query.fcgi?cmd=Retrieve&db=PubMed&dopt=Abstract&list_uids=9371507
http://www.ncbi.nlm.nih.gov/entrez/query.fcgi?cmd=Retrieve&db=PubMed&dopt=Abstract&list_uids=7585588
http://www.ncbi.nlm.nih.gov/entrez/query.fcgi?cmd=Retrieve&db=PubMed&dopt=Abstract&list_uids=7585588
http://www.ncbi.nlm.nih.gov/entrez/query.fcgi?cmd=Retrieve&db=PubMed&dopt=Abstract&list_uids=7585588
http://www.ncbi.nlm.nih.gov/entrez/query.fcgi?cmd=Retrieve&db=PubMed&dopt=Abstract&list_uids=1500231
http://www.ncbi.nlm.nih.gov/entrez/query.fcgi?cmd=Retrieve&db=PubMed&dopt=Abstract&list_uids=1500231

BMC Cancer 2005, 5:78 http://www.biomedcentral.com/1471-2407/5/78
11. Hunter EM, Sutherland LA, Cree IA, Subedi AM, Hartmann D, LinderD, Andreotti PE: The influence of storage on cytotoxic drugactivity in an ATP-based chemosensitivity assay. AnticancerDrugs 1994, 5:171-176.
12. Vandesompele J, De Preter K, Pattyn F, Poppe B, Van Roy N, DePaepe A, Speleman F: Accurate normalization of real-timequantitative RT-PCR data by geometric averaging of multi-ple internal control genes. Genome Biology 2002,3:research0034.0031-research0034.0011.
13. Applied Biosystems: ABI PRISM 7700 Sequence Detection Sys-tem user Bulletin #2. Relative Quantitation of Gene Expression (P/N4303859B) 1997, 10/2001:11-15.
14. Cree IA: Luminescence-Based cell viability testing. In Biolumi-nescence Methods and Protocols Edited by: LaRossa RA. Totowa, NJ:Humana Press Inc; 1998:169-177.
15. Kurbacher CM, Cree IA, Brenne U, Bruckner HW, Kurbacher JA,Mallmann P, Andreotti PE, Krebs D: Heterogeneity of in vitrochemosensitivity in perioperative breast cancer cells tomitoxantrone versus doxorubicin evaluated by a microplateATP bioluminescence assay. Breast Cancer Res Treat 1996,41(2):161-70.
16. Gottesman MM, Fojo T, Bates SE: Multidrug resistance in cancer:role of ATP-dependent transporters. Nat Rev Cancer 2002,2:48-58.
17. Borst P, Evers R, Kool M, Wijnholds J: A family of drug transport-ers: the multidrug resistance-associated proteins. J Natl Can-cer Inst 2000, 92:1295-1302.
18. Longley DB, Harkin DP, Johnston PG: 5-fluorouracil: mechanismsof action and clinical strategies. Nat Rev Cancer 2003, 3:330-338.
19. Chu E, Koeller DM, Johnston PG, Zinn S, Allegra CJ: Regulation ofthymidylate synthase in human colon cancer cells treatedwith 5-fluorouracil and interferon-gamma. Mol Pharmacol1993, 43:527-533.
20. Wang JC: DNA topoisomerases. Annu Rev Biochem 1996,65:635-692.
21. Foglesong PD, Reckord C, Swink S: Doxorubicin inhibits humanDNA topoisomerase I. Cancer Chemother Pharmacol 1992,30:123-125.
22. Dabholkar M, Vionnet J, Bostick-Bruton F, Yu JJ, Reed E: MessengerRNA levels of XPAC and ERCC1 in ovarian cancer tissuecorrelate with response to platinum-based chemotherapy. JClin Invest 1994, 94:703-708.
23. Samimi G, Fink D, Varki NM, Husain A, Hoskins WJ, Alberts DS,Howell SB: Analysis of MLH1 and MSH2 expression in ovariancancer before and after platinum drug-based chemotherapy.Clinical Cancer Research: an Official Journal of the American Association forCancer Research 2000, 6:1415-1421.
24. D'Atri S, Graziani G, Lacal PM, Nistico V, Gilberti S, Faraoni I, WatsonAJ, Bonmassar E, Margison GP: Attenuation of O(6)-methylgua-nine-DNA methyltransferase activity and mRNA levels bycisplatin and temozolomide in jurkat cells. J Pharmacol Exp Ther2000, 294:664-671.
25. Beck WT, Morgan SE, Mo YY, Bhat UG: Tumor cell resistance toDNA topoisomerase II inhibitors: new developments. DrugResist Updat 1999, 2:382-389.
26. Johnston PG, Drake JC, Trepel J, Allegra CJ: Immunological quan-titation of thymidylate synthase using the monoclonal anti-body TS 106 in 5-fluorouracil-sensitive and -resistant humancancer cell lines. Cancer Res 1992, 52:4306-4312.
27. Copur S, Aiba K, Drake JC, Allegra CJ, Chu E: Thymidylate syn-thase gene amplification in human colon cancer cell linesresistant to 5-fluorouracil. Biochem Pharmacol 1995,49:1419-1426.
28. Welsh SJ, Titley J, Brunton L, Valenti M, Monaghan P, Jackman AL,Aherne GW: Comparison of thymidylate synthase (TS) pro-tein up-regulation after exposure to TS inhibitors in normaland tumor cell lines and tissues. Clin Cancer Res 2000,6:2538-2546.
29. Swain SM, Lippman ME, Egan EF, Drake JC, Steinberg SM, Allegra CJ:Fluorouracil and high-dose leucovorin in previously treatedpatients with metastatic breast cancer. J Clin Oncol 1989,7:890-899.
30. Peters GJ, van der Wilt CL, van Triest B, Codacci-Pisanelli G, John-ston PG, van Groeningen CJ, Pinedo HM: Thymidylate synthaseand drug resistance. Eur J Cancer 1995, 31A:1299-1305.
31. Salonga D, Danenberg KD, Johnson M, Metzger R, Groshen S, Tsao-Wei DD, Lenz HJ, Leichman CG, Leichman L, Diasio RB, DanenbergPV: Colorectal tumors responding to 5-fluorouracil have lowgene expression levels of dihydropyrimidine dehydrogenase,thymidylate synthase, and thymidine phosphorylase. Clin Can-cer Res 2000, 6:1322-1327.
32. Ishikawa Y, Kubota T, Otani Y, Watanabe M, Teramoto T, Kumai K,Takechi T, Okabe H, Fukushima M, Kitajima M: Dihydropyrimidinedehydrogenase and messenger RNA levels in gastric cancer:possible predictor for sensitivity to 5-fluorouracil. Jpn J CancerRes 2000, 91:105-112.
33. Ichikawa W, Uetake H, Shirota Y, Yamada H, Nishi N, Nihei Z, Sugi-hara K, Hirayama R: Combination of dihydropyrimidine dehy-drogenase and thymidylate synthase gene expressions inprimary tumors as predictive parameters for the efficacy offluoropyrimidine-based chemotherapy for metastatic color-ectal cancer. Clin Cancer Res 2003, 9:786-791.
34. Kornmann M, Schwabe W, Sander S, Kron M, Strater J, Polat S, Ket-tner E, Weiser HF, Baumann W, Schramm H, Hausler P, Ott K,Behnke D, Staib L, Beger HG, Link KH: Thymidylate synthase anddihydropyrimidine dehydrogenase mRNA expression levels:predictors for survival in colorectal cancer patients receivingadjuvant 5-fluorouracil. Clin Cancer Res 2003, 9:4116-4124.
35. Buchholz TA, Stivers DN, Stec J, Ayers M, Clark E, Bolt A, Sahin AA,Symmans WF, Hess KR, Kuerer HM, Valero V, Hortobagyi GN, Pusz-tai L: Global gene expression changes during neoadjuvantchemotherapy for human breast cancer. Cancer J 2002,8:461-468.
36. Clarke PA, George ML, Easdale S, Cunningham D, Swift RI, Hill ME,Tait DM, Workman P: Molecular pharmacology of cancer ther-apy in human colorectal cancer by gene expression profiling.Cancer Res 2003, 63:6855-6863.
37. Kurata T, Tamura K, Kaneda H, Nogami T, Uejima H, Asai Go G,Nakagawa K, Fukuoka M: Effect of re-treatment with gefitinib('Iressa', ZD1839) after acquisition of resistance. Ann Oncol2004, 15:173-174.
38. Moniotte S, Vaerman JL, Kockx MM, Larrouy D, Langin D,Noirhomme P, Balligand JL: Real-time RT-PCR for the detectionof beta-adrenoceptor messenger RNAs in small humanendomyocardial biopsies. J Mol Cell Cardiol 2001, 33:2121-2133.
39. van den Heuvel-Eibrink MM, Wiemer EA, Prins A, Meijerink JP, Vosse-beld PJ, van der Holt B, Pieters R, Sonneveld P: Increased expres-sion of the breast cancer resistance protein (BCRP) inrelapsed or refractory acute myeloid leukemia (AML). Leuke-mia 2002, 16:833-839.
40. Bieche I, Onody P, Laurendeau I, Olivi M, Vidaud D, Lidereau R,Vidaud M: Real-Time Reverse Transcription-PCR Assay forFuture Management of ERBB2-based Clinical Applications.Clin Chem 1999, 45:1148-1156.
41. Faneyte IF, Kristel PM, Maliepaard M, Scheffer GL, Scheper RJ, Schel-lens JH, van de Vijver MJ: Expression of the breast cancer resist-ance protein in breast cancer. Clin Cancer Res 2002, 8:1068-1074.
42. Blanquicett C, Gillespie GY, Nabors LB, Miller CR, Bharara S, Buchs-baum DJ, Diasio RB, Johnson MR: Induction of thymidine phos-phorylase in both irradiated and shielded, contralateralhuman U87MG glioma xenografts: implications for a dualmodality treatment using capecitabine and irradiation. MolCancer Ther 2002, 1:1139-1145.
43. Lord RV, Brabender J, Gandara D, Alberola V, Camps C, Domine M,Cardenal F, Sanchez JM, Gumerlock PH, Taron M, Sanchez JJ, Danen-berg KD, Danenberg PV, Rosell R: Low ERCC1 expression corre-lates with prolonged survival after cisplatin plus gemcitabinechemotherapy in non-small cell lung cancer. Clin Cancer Res2002, 8:2286-2291.
44. Yague E, Armesilla AL, Harrison G, Elliott J, Sardini A, Higgins CF,Raguz S: P-glycoprotein (MDR1) expression in leukemic cellsis regulated at two distinct steps, mRNA stabilization andtranslational initiation. J Biol Chem 2003, 278:10344-10352.
45. Taipalensuu J, Tornblom H, Lindberg G, Einarsson C, Sjoqvist F, Mel-hus H, Garberg P, Sjostrom B, Lundgren B, Artursson P: Correlationof gene expression of ten drug efflux proteins of the ATP-binding cassette transporter family in normal human jeju-num and in human intestinal epithelial Caco-2 cellmonolayers. J Pharmacol Exp Ther 2001, 299:164-170.
Page 15 of 16(page number not for citation purposes)
http://www.ncbi.nlm.nih.gov/entrez/query.fcgi?cmd=Retrieve&db=PubMed&dopt=Abstract&list_uids=8049500
http://www.ncbi.nlm.nih.gov/entrez/query.fcgi?cmd=Retrieve&db=PubMed&dopt=Abstract&list_uids=8049500
http://www.ncbi.nlm.nih.gov/entrez/query.fcgi?cmd=Retrieve&db=PubMed&dopt=Abstract&list_uids=8944334
http://www.ncbi.nlm.nih.gov/entrez/query.fcgi?cmd=Retrieve&db=PubMed&dopt=Abstract&list_uids=8944334
http://www.ncbi.nlm.nih.gov/entrez/query.fcgi?cmd=Retrieve&db=PubMed&dopt=Abstract&list_uids=8944334
http://www.ncbi.nlm.nih.gov/entrez/query.fcgi?cmd=Retrieve&db=PubMed&dopt=Abstract&list_uids=8474431
http://www.ncbi.nlm.nih.gov/entrez/query.fcgi?cmd=Retrieve&db=PubMed&dopt=Abstract&list_uids=8474431
http://www.ncbi.nlm.nih.gov/entrez/query.fcgi?cmd=Retrieve&db=PubMed&dopt=Abstract&list_uids=8474431
http://www.ncbi.nlm.nih.gov/entrez/query.fcgi?cmd=Retrieve&db=PubMed&dopt=Abstract&list_uids=8811192
http://www.ncbi.nlm.nih.gov/entrez/query.fcgi?cmd=Retrieve&db=PubMed&dopt=Abstract&list_uids=1318169
http://www.ncbi.nlm.nih.gov/entrez/query.fcgi?cmd=Retrieve&db=PubMed&dopt=Abstract&list_uids=1318169
http://www.ncbi.nlm.nih.gov/entrez/query.fcgi?cmd=Retrieve&db=PubMed&dopt=Abstract&list_uids=8040325
http://www.ncbi.nlm.nih.gov/entrez/query.fcgi?cmd=Retrieve&db=PubMed&dopt=Abstract&list_uids=8040325
http://www.ncbi.nlm.nih.gov/entrez/query.fcgi?cmd=Retrieve&db=PubMed&dopt=Abstract&list_uids=8040325
http://www.ncbi.nlm.nih.gov/entrez/query.fcgi?cmd=Retrieve&db=PubMed&dopt=Abstract&list_uids=1643628
http://www.ncbi.nlm.nih.gov/entrez/query.fcgi?cmd=Retrieve&db=PubMed&dopt=Abstract&list_uids=1643628
http://www.ncbi.nlm.nih.gov/entrez/query.fcgi?cmd=Retrieve&db=PubMed&dopt=Abstract&list_uids=1643628
http://www.ncbi.nlm.nih.gov/entrez/query.fcgi?cmd=Retrieve&db=PubMed&dopt=Abstract&list_uids=7763285
http://www.ncbi.nlm.nih.gov/entrez/query.fcgi?cmd=Retrieve&db=PubMed&dopt=Abstract&list_uids=7763285
http://www.ncbi.nlm.nih.gov/entrez/query.fcgi?cmd=Retrieve&db=PubMed&dopt=Abstract&list_uids=7763285
http://www.ncbi.nlm.nih.gov/entrez/query.fcgi?cmd=Retrieve&db=PubMed&dopt=Abstract&list_uids=2661735
http://www.ncbi.nlm.nih.gov/entrez/query.fcgi?cmd=Retrieve&db=PubMed&dopt=Abstract&list_uids=2661735
http://www.ncbi.nlm.nih.gov/entrez/query.fcgi?cmd=Retrieve&db=PubMed&dopt=Abstract&list_uids=2661735
http://www.ncbi.nlm.nih.gov/entrez/query.fcgi?cmd=Retrieve&db=PubMed&dopt=Abstract&list_uids=7577040

BMC Cancer 2005, 5:78 http://www.biomedcentral.com/1471-2407/5/78
Publish with BioMed Central and every scientist can read your work free of charge
"BioMed Central will be the most significant development for disseminating the results of biomedical research in our lifetime."
Sir Paul Nurse, Cancer Research UK
Your research papers will be:
available free of charge to the entire biomedical community
peer reviewed and published immediately upon acceptance
cited in PubMed and archived on PubMed Central
yours — you keep the copyright
Submit your manuscript here:http://www.biomedcentral.com/info/publishing_adv.asp
BioMedcentral
Pre-publication historyThe pre-publication history for this paper can be accessedhere:
http://www.biomedcentral.com/1471-2407/5/78/prepub
Page 16 of 16(page number not for citation purposes)
Related Documents