March 2017 Study No. 164 CANADIAN ENERGY RESEARCH INSTITUTE Canadian Energy Research Instute | Relevant • Independent • Objecve ECONOMIC POTENTIALS AND EFFICIENCIES OF OIL SANDS OPERATIONS: PROCESSES AND TECHNOLOGIES

Welcome message from author
This document is posted to help you gain knowledge. Please leave a comment to let me know what you think about it! Share it to your friends and learn new things together.
Transcript

March 2017
Study No. 164
CANADIAN ENERGYRESEARCHINSTITUTE
Canadian Energy Research Institute | Relevant • Independent • Objective
ECONOMIC POTENTIALS AND EFFICIENCIES OF OILSANDS OPERATIONS: PROCESSES AND TECHNOLOGIES
Economic Potentials and Efficiencies of Oil Sands Operations: i Processes and Technologies
March 2017
Executive Summary Whenever the WTI price increases by one Canadian dollar, Canadian GDP is estimated to gain about $1.7 billion.1 Similarly, a reduction in production costs of Canadian oil is likely to bring a comparative benefit to the economy. The Bank of Canada estimates that the lower oil and commodity prices since 2014 resulted in a 1 percent drop in Canada’s GDP and a loss of ~$60 billion in national income2. These underscore the role of production cost reductions in the competitiveness of Alberta’s oil sands industry and the Canadian economy in general.
Given the unstable and current low oil price environment, booming US shale oil production, global oil supply glut, increasingly stringent emissions regulations, and social pressure to reduce
GHG emissions, the survival or growth of the oil sands industry will depend on how quickly it can innovate to address these challenges.
This study shows that the costs and emissions challenges facing the oil sands industry are real and serious, and if not urgently addressed may stunt the growth of the industry. The 100 MtCO2eq. emissions per year cap imposed on the oil sands industry will be reached by 2028. This means that the industry has about 10 years to act in order to continue oil sands production growth by reducing its emissions intensity. On the other hand, high bitumen supply cost is another important factor that makes oil sands production less competitive relative to other competing world crude oils.
This study identifies clear technological pathways that will enable the oil sands industry to
significantly reduce costs as well as emissions. Six technology configurations that reduce both bitumen supply costs and GHG emissions are identified: one for brownfield and five for greenfield developments. With the implementation of any of the configurations, chances of reaching the 100 MtCO2eq./year cap are reduced to zero within the study period (2016-2036).
1 Millington, D., 2016. Low crude oil prices and their impact on the Canadian economy. Canadian Energy Research Institute Study Report No. 156. February 2016. Available online at http://resources.ceri.ca/PDF/Pubs/Studies/Study_156_Full_Report.pdf 2 Statement made by Lynn Patterson, the Deputy Governor of Bank of Canada at the Edmonton Chamber of Commerce on March 30, 2016

ii Canadian Energy Research Institute
March 2017
Table E.1: Optimal Technology Configurations for Brown and Greenfield Developments
Compatible Processes and Technologies
Business Management & Data Analytics
(BM)
Wells and Well Pads
(WWP)
Reservoirs (RES)
Water and Waste
Treatment (WWT)
Steam Generation
(SG)
Brownfield development
Steam solvent Steam flood management
Steam Solvent
Magox precipitation
and CO2
conversion
OTSG
Greenfield development
Steam with CO2 co-injection
Digitalization of EPC
Steam flood management
Well pad standardization
Steam/CO2 co-injection
Evaporator
DCSG
Steam with CoGen
Steam SOFC
Steam-solvent Steam
Solvent
Chemical water
treatment
RT-OTSG
Steam-solvent Cogen
SOFC
Pure Solvent Pure
Solvent
Source: CERI
The technology configurations that meet the minimum costs and emissions objective criteria will allow for significantly more room for oil sands production growth. These technology configurations have the potential to reduce bitumen supply cost by 34-40 percent, reduce fuel-derived emissions from in situ oil sands production by more than 80 percent, and consequently delay the time until the emissions cap is reached by several decades.
Figure E.1 shows the impact on supply cost and emissions by the identified optimal technology configurations applicable to green and brownfields.
Economic Potentials and Efficiencies of Oil Sands Operations: iii Processes and Technologies
March 2017
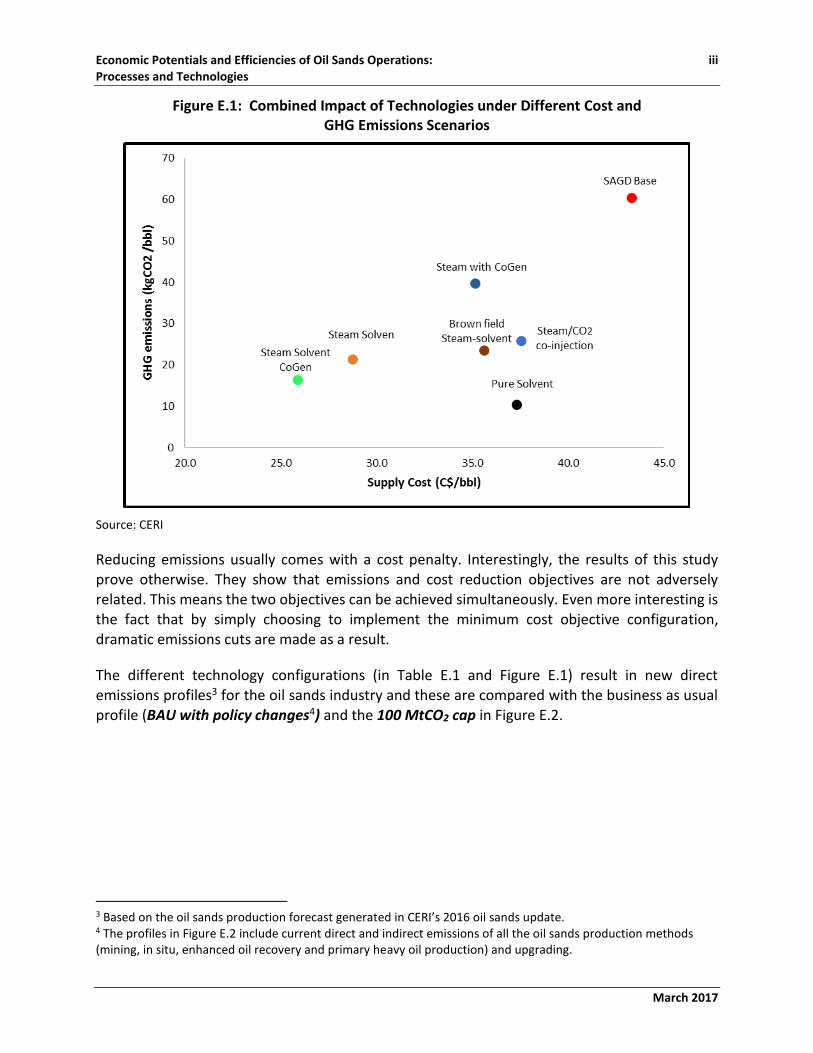
Figure E.1: Combined Impact of Technologies under Different Cost and GHG Emissions Scenarios
Source: CERI
Reducing emissions usually comes with a cost penalty. Interestingly, the results of this study prove otherwise. They show that emissions and cost reduction objectives are not adversely related. This means the two objectives can be achieved simultaneously. Even more interesting is the fact that by simply choosing to implement the minimum cost objective configuration, dramatic emissions cuts are made as a result.
The different technology configurations (in Table E.1 and Figure E.1) result in new direct emissions profiles3 for the oil sands industry and these are compared with the business as usual profile (BAU with policy changes4) and the 100 MtCO2 cap in Figure E.2.
3 Based on the oil sands production forecast generated in CERI’s 2016 oil sands update. 4 The profiles in Figure E.2 include current direct and indirect emissions of all the oil sands production methods (mining, in situ, enhanced oil recovery and primary heavy oil production) and upgrading.

iv Canadian Energy Research Institute
March 2017
Figure E.2: GHG Emissions Profile for the Oil Sands Industry and the 100 MtCO2/year Emissions Cap
Source: CERI
The new GHG emissions profiles5 based on the optimal cost and emissions technology configurations will allow for oil sands production growth. These technology configurations have the potential to reduce bitumen supply cost by 40 percent, and avoid reaching the 100 Mt CO2eq. per year cap during the study period (2016-2036).
However, further research and development work is needed to de-risk the promising technologies through pilot and field demonstration studies if the prospects of delivering these costs and emissions reductions are to be realized. For more information on possible ways of how
to fuel a greener and more cost competitive oil sands industry, see the Appendix.
5 Based on the oil sands production forecast generated in CERI’s 2016 oil sands update.
40.00
50.00
60.00
70.00
80.00
90.00
100.00
110.00
120.00
130.00
140.00
20
15
20
16
20
17
20
18
20
19
20
20
20
21
20
22
20
23
20
24
20
25
20
26
20
27
20
28
20
29
20
30
20
31
20
32
20
33
20
34
20
35
20
36
GH
G E
mis
sio
ns
(MtC
O2e
q./
year
)
Steam-solvent Cogen (SOFC) Scenario Pure Solvent Scenario
Steam-Solvent (FTB w/o DCSG) Scenario Total emissions - Coal Phase Out
100 MtCO2 Cap Total Direct Emissions with CH4 Policy
100 MtCO2eq. Cap
Minimum Emissions Objective
Economic Potentials and Efficiencies of Oil Sands Operations: v Processes and Technologies
March 2017
Key Findings The key findings of this study are presented below:
1. The 100 MtCO2eq. emissions per year cap imposed on the oil sands industry will be reached by 2028. This means that the industry has about 10 years to act to raise the ceiling on oil sands growth by reducing its emissions intensity.
2. High bitumen supply cost is another important factor in the competitiveness of the oil sands industry.
3. Identification of clear technological pathways to significantly reduce costs as well as emissions. With the implementation of any of the configurations, chances of reaching the 100 MtCO2eq./year cap are eliminated within the study period (2016-2036).
4. The technology configurations that meet the minimum costs and emissions objective criteria can achieve potential reduction of bitumen supply cost by 34-40 percent, reduce fuel-derived emissions from in situ oil sands production by more than 80 percent, and consequently delay the time until the emissions cap is reached by several decades.
5. Emissions and cost reduction objectives are not adversely related. For example, by choosing to implement the minimum cost objective configuration, dramatic emissions cuts are made as a result.
6. Further research and development work is needed to de-risk the promising technologies through pilot and field demonstration studies if the prospects of delivering these costs and emissions reductions are to be realized.
Related Documents