1 Canada’s Natural Resources and Energy Sector Analysis The University of Toronto

Welcome message from author
This document is posted to help you gain knowledge. Please leave a comment to let me know what you think about it! Share it to your friends and learn new things together.
Transcript
1
Canada’s Natural Resources
and Energy
Sector Analysis
The University of Toronto

2
Presentation Overview
1. Industry Overview
– Introduction
– Performance
2. Forest
– Sector Profile
– Performance
– Employment
– Trade
– Paper Manufacturing Sub Sector
- Introduction
- Employment
- Performance
– Wood Products Manufacturing Sub Sector
- Introduction
- Employment
- Performance

3
Presentation Overview
3. Minerals and Mines
– Sector Profile
– Performance
– Employment
– Trade
– Mining and Quarrying Sub Sector
- Introduction
- Performance
4. Energy
– Sector Profile
– Performance
– Employment
– Trade
– Crude Oil Sub Sector
– Natural Gas Sub Sector
– Petroleum Sub Sector
– Electricity Sub Sector
– Renewable Energy Sub Sector
5. Emerging Trends

4
Canada Natural Resources and Energy
Industry Overview
Canada Natural Resources and Energy
Introduction
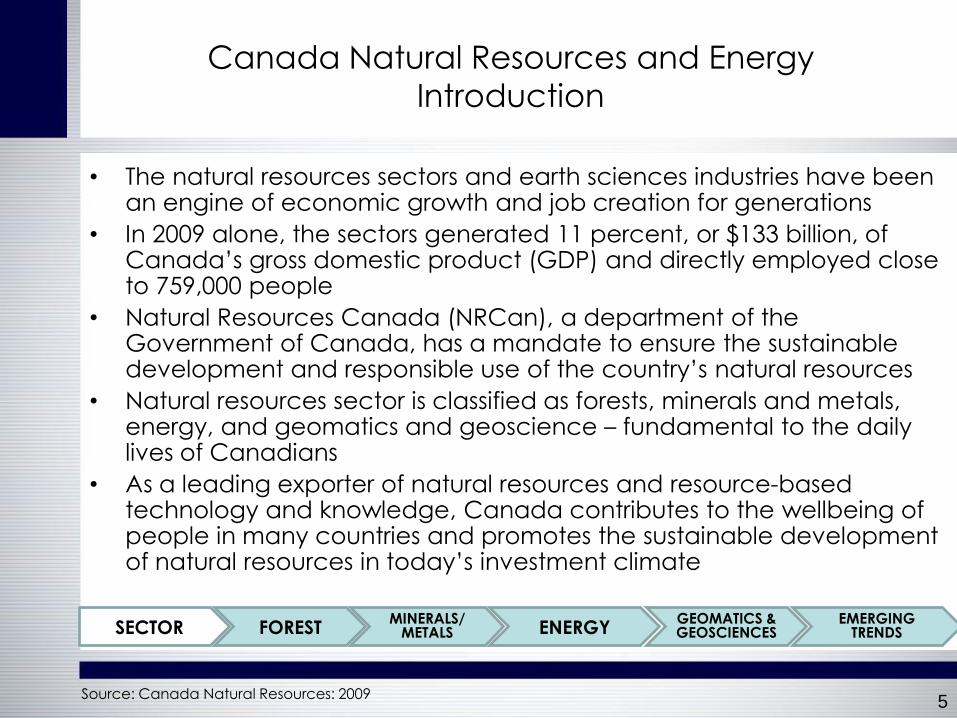
• The natural resources sectors and earth sciences industries have been an engine of economic growth and job creation for generations
• In 2009 alone, the sectors generated 11 percent, or $133 billion, of Canada’s gross domestic product (GDP) and directly employed close to 759,000 people
• Natural Resources Canada (NRCan), a department of the Government of Canada, has a mandate to ensure the sustainable development and responsible use of the country’s natural resources
• Natural resources sector is classified as forests, minerals and metals, energy, and geomatics and geoscience – fundamental to the daily lives of Canadians
• As a leading exporter of natural resources and resource-based technology and knowledge, Canada contributes to the wellbeing of people in many countries and promotes the sustainable development of natural resources in today’s investment climate
5 Source: Canada Natural Resources: 2009
SECTOR FOREST MINERALS/
METALS ENERGY GEOMATICS & GEOSCIENCES
EMERGING TRENDS

6
Canada Natural Resources and Energy
Industry Performance
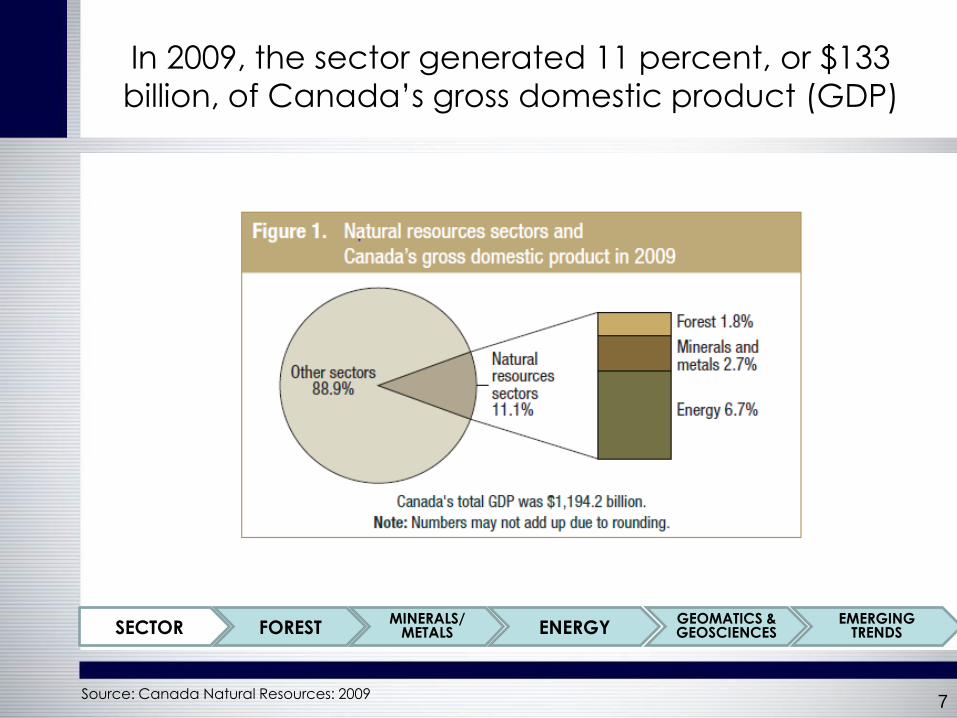
In 2009, the sector generated 11 percent, or $133
billion, of Canada’s gross domestic product (GDP)
7 Source: Canada Natural Resources: 2009
SECTOR FOREST MINERALS/
METALS ENERGY GEOMATICS & GEOSCIENCES
EMERGING TRENDS

The natural resources sector was a major contributor
to the Canadian economy with a GDP of $133 billion
8 Source: Canada Natural Resources: 2009
SECTOR FOREST MINERALS/
METALS ENERGY GEOMATICS & GEOSCIENCES
EMERGING TRENDS

In 2009, the natural resources sectors (energy, forest
and mining) had a trade balance of $69.5 billion (33%)
9 Source: Canada Natural Resources: 2009
SECTOR FOREST MINERALS/
METALS ENERGY GEOMATICS & GEOSCIENCES
EMERGING TRENDS

In 2009, the natural resources sectors played a
important role in GDP Employment, Trade and New
Capital Investments
10 Source: Canada Natural Resources: 2009
SECTOR FOREST MINERALS/
METALS ENERGY GEOMATICS & GEOSCIENCES
EMERGING TRENDS
11
Forest sector
Introduction
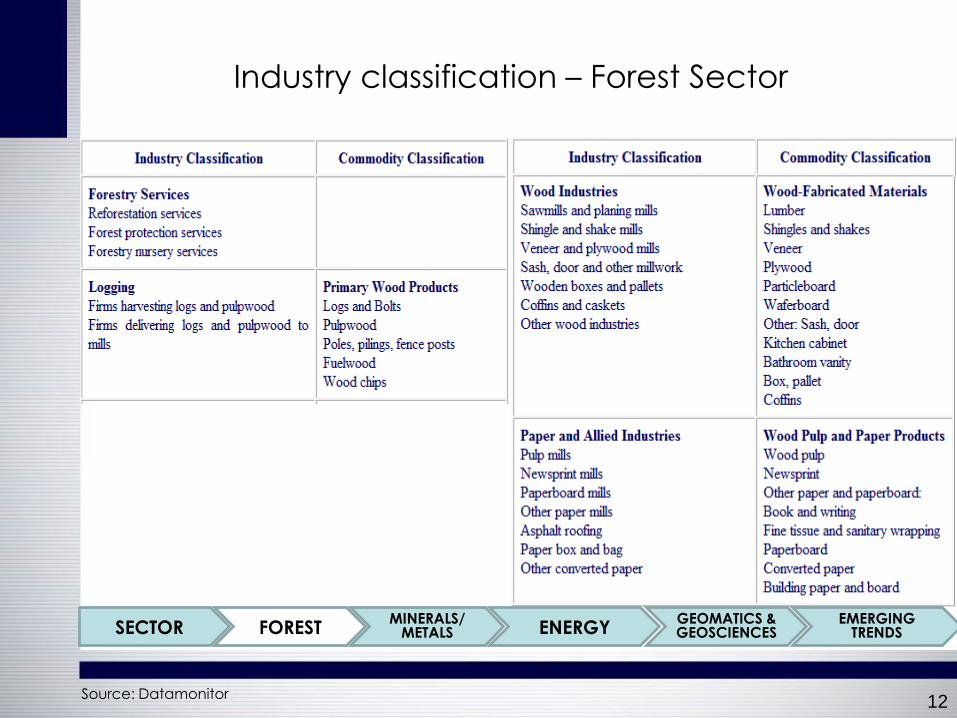
Industry classification – Forest Sector
12 Source: Datamonitor
SECTOR FOREST MINERALS/
METALS ENERGY GEOMATICS & GEOSCIENCES
EMERGING TRENDS

Canada’s Forest Sector is one of the leading sectors in
the world
• ƒCanada has 10 percent of the world’s forests
• Canada’s forest, other wooded land and other land with tree cover
are made up of 347.7 million ha (87.5 percent) of forest, 41.8 million ha
(10.5 percent) of other wooded land and 7.8 million ha (2 percent) of
other land with tree cover
• Annually, less that 1 percent of Canada’s forests are harvested; 0.7
million ha were harvested in 2008
• Revenues from the sale of timber from provincial and territorial crown
lands were estimated to be $0.7 billion in 2008
13 Source: Canada Natural Resources: 2009
SECTOR FOREST MINERALS/
METALS ENERGY GEOMATICS & GEOSCIENCES
EMERGING TRENDS

Forest sector has three main subsectors, Solid wood
product manufacturing, Pulp and paper product
manufacturing and Forestry and logging
There are three main subsectors:
• Solid wood product manufacturing
• Pulp and paper product manufacturing
• Forestry and logging
14 Source: NRCAN- Natural Resource Canada
SECTOR FOREST MINERALS/
METALS ENERGY GEOMATICS & GEOSCIENCES
EMERGING TRENDS

The contribution of forest biomass to Canada’s
secondary energy use has increased from about 3.5%
in the 1970s to about 6.5% today
15 Source: NRCAN- Natural Resource Canada
SECTOR FOREST MINERALS/
METALS ENERGY GEOMATICS & GEOSCIENCES
EMERGING TRENDS

16
Forest sector
Industry Performance

Forest Sector contributes to 1.8% of the Canadian
GDP
• The forest sector’s contribution to the Canadian economy (GDP)
in 2002 constant dollars was $20.9 billion, or 1.8 percent, in 2009
• In 2009, shipments of pulp, paper and paperboard reached a
level of 21.1 million tonnes (t), a decrease of 16.1 percent from the
previous year
• Production of softwood lumber was 44.4 million cubic meters in
2009
• New capital investments totaled $1.6 billion in 2009: pulp and
paper product manufacturing industry, $0.9 billion (56.2 percent);
wood product manufacturing industry, $0.5 billion (31.3 percent);
and forestry and logging industry, $0.2 billion (12.5 percent)
• Revenue from goods manufactured was $60.8 billion in 2008
17 Source: Canada Natural Resources: 2009
SECTOR FOREST MINERALS/
METALS ENERGY GEOMATICS & GEOSCIENCES
EMERGING TRENDS
Canada’s forest industry varies across the country
• Eastern Canada is dominated by pulp and paper product
manufacturing
• Western Canada is dominated by wood product manufacturing
• Quebec, Ontario and British Columbia have the greatest numbers
of forest workers
• The Atlantic Provinces, Quebec and British Columbia are the most
forest-dependent regions, with a large share of their economy
based on the sector
18 Source: Canada Natural Resources: 2009
SECTOR FOREST MINERALS/
METALS ENERGY GEOMATICS & GEOSCIENCES
EMERGING TRENDS

19
Forest sector
Employment

The Forest sector provides direct employment to 1.3 %
of Canadian work force
• In 2009, the sector provided direct employment for 195 300 people,
representing 1.3 percent of total employment in Canada: wood
industries, for 89 400 people; pulp and paper product manufacturing
industry, for 66 600 people; forestry and logging industry, for 28 300
people; and support activities for forestry industry, for 11 000 people
• Employment is spread across Canada but is primarily in Quebec (68
000 people), British Columbia (46 800 people) and Ontario (40 700
people)
• Wages and salaries for direct employment were $10.3 billion in 2008
20 Source: Canada Natural Resources: 2009
SECTOR FOREST MINERALS/
METALS ENERGY GEOMATICS & GEOSCIENCES
EMERGING TRENDS

21
Forest sector
Trade
Canada is the world’s largest forest product exporter
• ƒIn 2009, Canada was the world’s third-largest forest-product exporter
(8.3 percent)
• Forest products were a major contributor to Canada’s surplus balance
of trade in 2009 ($14.4 billion)
• The total value of Canadian forest-product domestic exports
decreased by 21.7 percent in 2009 to $23.6 billion
• British Columbia accounted for $7.5 billion (31.8 percent); Quebec,
$7.4 billion (31.4 percent); Ontario, $4.0 billion (17.0 percent); and
other provinces and territories, $4.7 billion (19.8 percent)
22
SECTOR FOREST MINERALS/
METALS ENERGY GEOMATICS & GEOSCIENCES
EMERGING TRENDS
Source: Canada Natural Resources: 2009

23
Paper Manufacturing subsector
Introduction

Ontario has the highest number of Paper
Manufacturing establishments
24 Source: Canadian Industry Statistics
SECTOR FOREST MINERALS/
METALS ENERGY GEOMATICS & GEOSCIENCES
EMERGING TRENDS
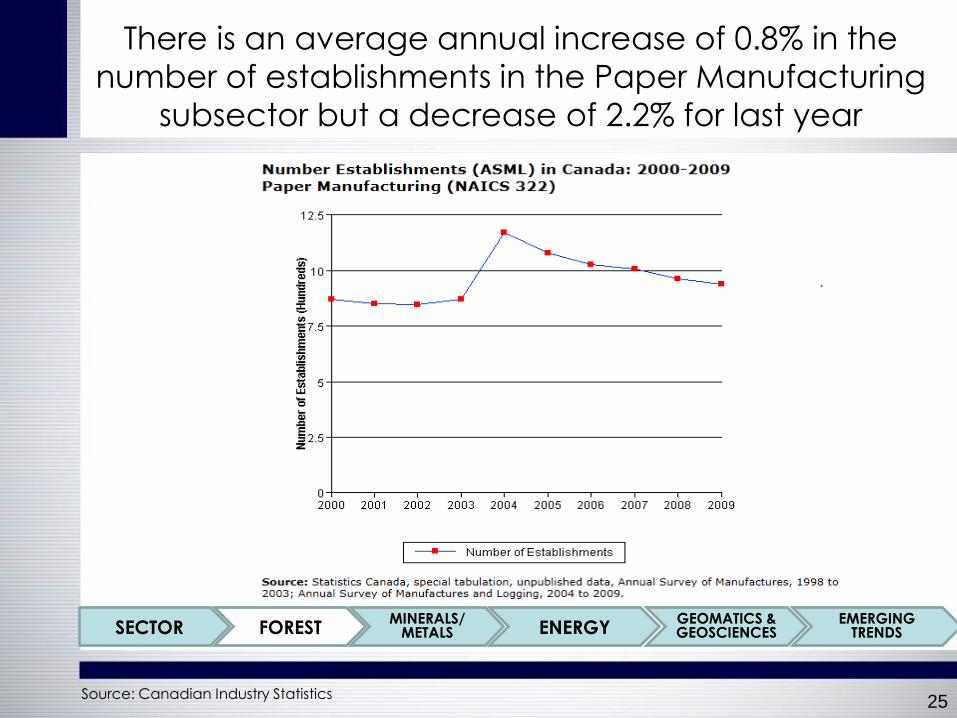
There is an average annual increase of 0.8% in the
number of establishments in the Paper Manufacturing
subsector but a decrease of 2.2% for last year
25 Source: Canadian Industry Statistics
SECTOR FOREST MINERALS/
METALS ENERGY GEOMATICS & GEOSCIENCES
EMERGING TRENDS

The percentage of small and medium-sized businesses
that were profitable in the Paper Manufacturing
subsector in 2008 was 65.9%, with 34.1% of firms failing
to turn a profit
26
SECTOR FOREST MINERALS/
METALS ENERGY GEOMATICS & GEOSCIENCES
EMERGING TRENDS
Source: Canadian Industry Statistics

27
Paper Manufacturing subsector
Employment
28
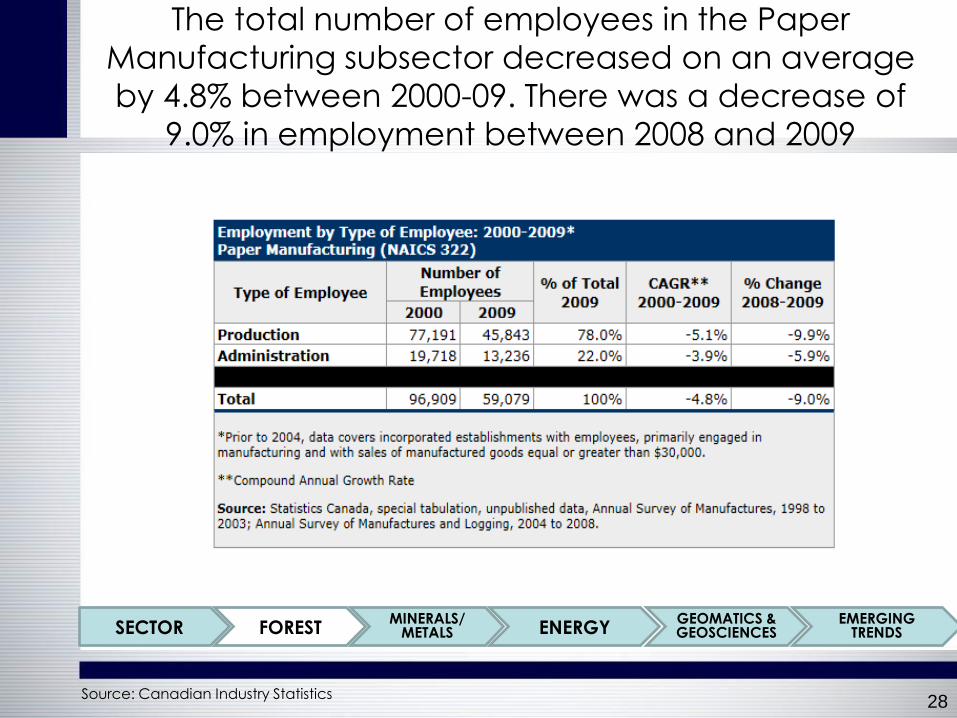
The total number of employees in the Paper
Manufacturing subsector decreased on an average
by 4.8% between 2000-09. There was a decrease of
9.0% in employment between 2008 and 2009
Source: Canadian Industry Statistics
SECTOR FOREST MINERALS/
METALS ENERGY GEOMATICS & GEOSCIENCES
EMERGING TRENDS

The number of production employees saw a decrease of
5.1% per year on average and a decrease of 9.9% in the
last year. Administrative employees saw a decrease of
3.9% per year and a decrease of 5.9%in the last year
29 Source: Canadian Industry Statistics
SECTOR FOREST MINERALS/
METALS ENERGY GEOMATICS & GEOSCIENCES
EMERGING TRENDS
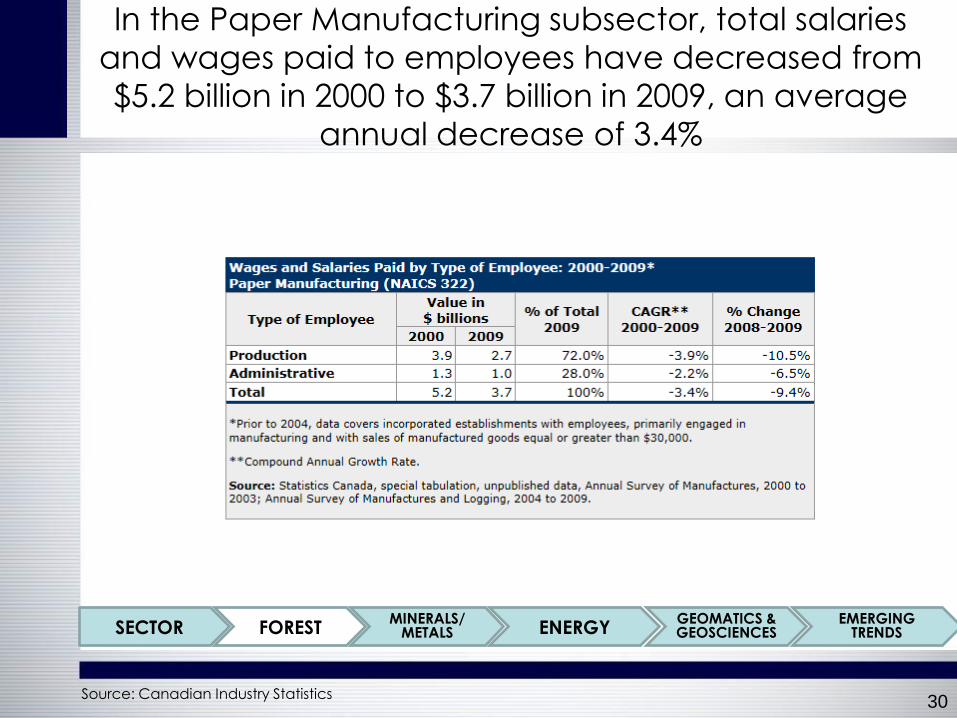
In the Paper Manufacturing subsector, total salaries
and wages paid to employees have decreased from
$5.2 billion in 2000 to $3.7 billion in 2009, an average
annual decrease of 3.4%
30 Source: Canadian Industry Statistics
SECTOR FOREST MINERALS/
METALS ENERGY GEOMATICS & GEOSCIENCES
EMERGING TRENDS
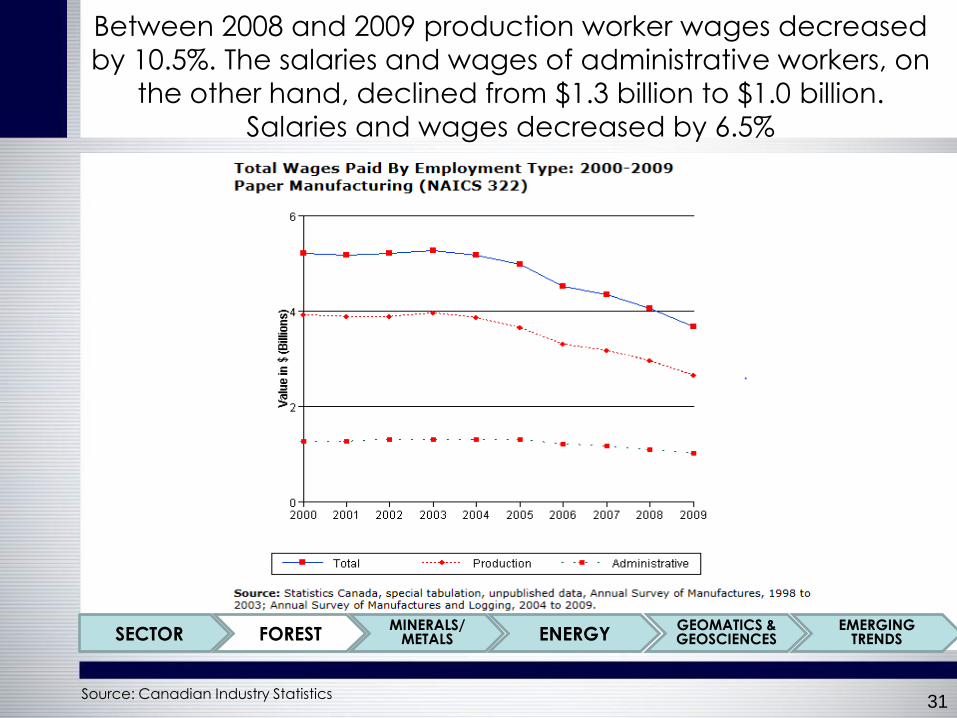
Between 2008 and 2009 production worker wages decreased
by 10.5%. The salaries and wages of administrative workers, on
the other hand, declined from $1.3 billion to $1.0 billion.
Salaries and wages decreased by 6.5%
31 Source: Canadian Industry Statistics
SECTOR FOREST MINERALS/
METALS ENERGY GEOMATICS & GEOSCIENCES
EMERGING TRENDS

32
Paper Manufacturing subsector
Performance
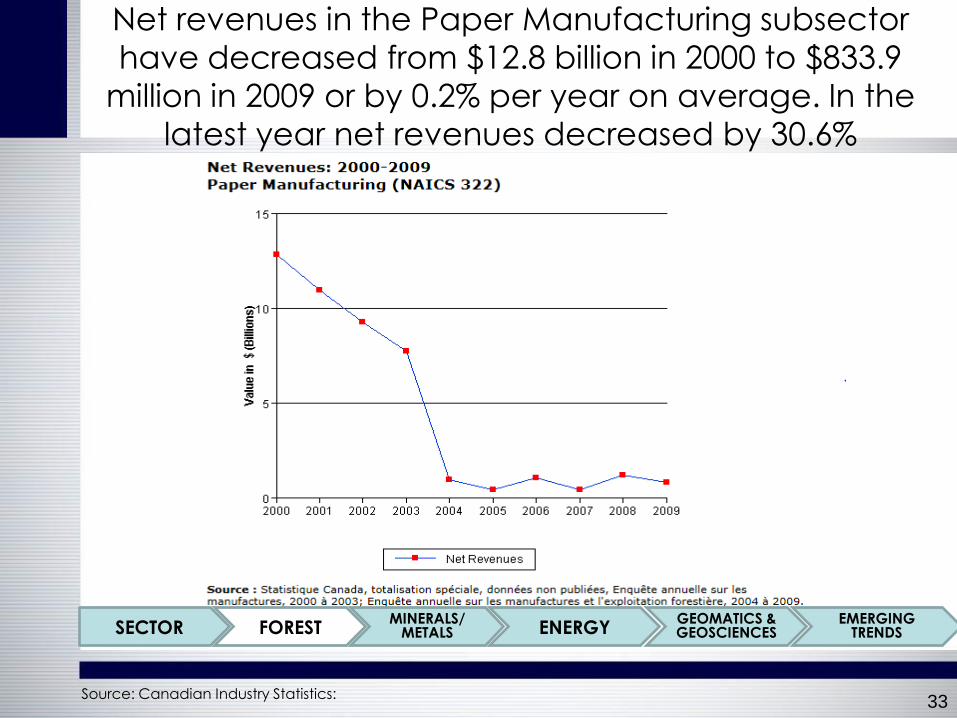
Net revenues in the Paper Manufacturing subsector
have decreased from $12.8 billion in 2000 to $833.9
million in 2009 or by 0.2% per year on average. In the
latest year net revenues decreased by 30.6%
33 Source: Canadian Industry Statistics:
SECTOR FOREST MINERALS/
METALS ENERGY GEOMATICS & GEOSCIENCES
EMERGING TRENDS
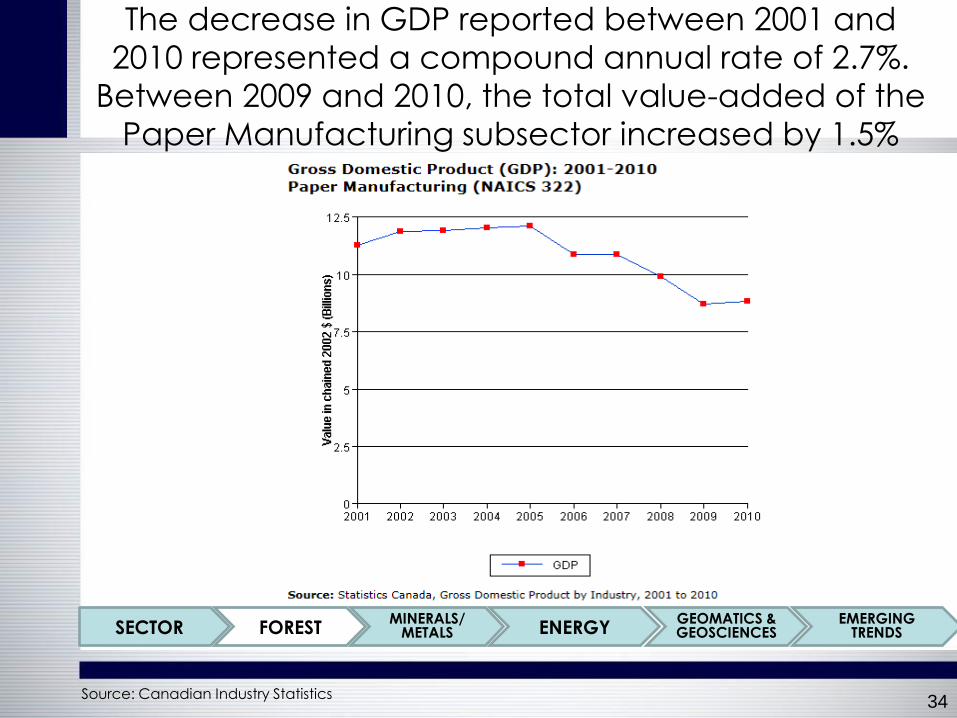
The decrease in GDP reported between 2001 and
2010 represented a compound annual rate of 2.7%.
Between 2009 and 2010, the total value-added of the
Paper Manufacturing subsector increased by 1.5%
34
SECTOR FOREST MINERALS/
METALS ENERGY GEOMATICS & GEOSCIENCES
EMERGING TRENDS
Source: Canadian Industry Statistics

Exports from Canada to US is way higher compared to
exports to other countries
35
SECTOR FOREST MINERALS/
MINES ENERGY GEOMATICS & GEOSCIENCES
EMERGING TRENDS
Source: Canadian Industry Statistics

Most of the exports happen out of the province of
Quebec
36
SECTOR FOREST MINERALS/
METALS ENERGY GEOMATICS & GEOSCIENCES
EMERGING TRENDS
Source: Canadian Industry Statistics

37
Wood manufacturing subsector
Introduction
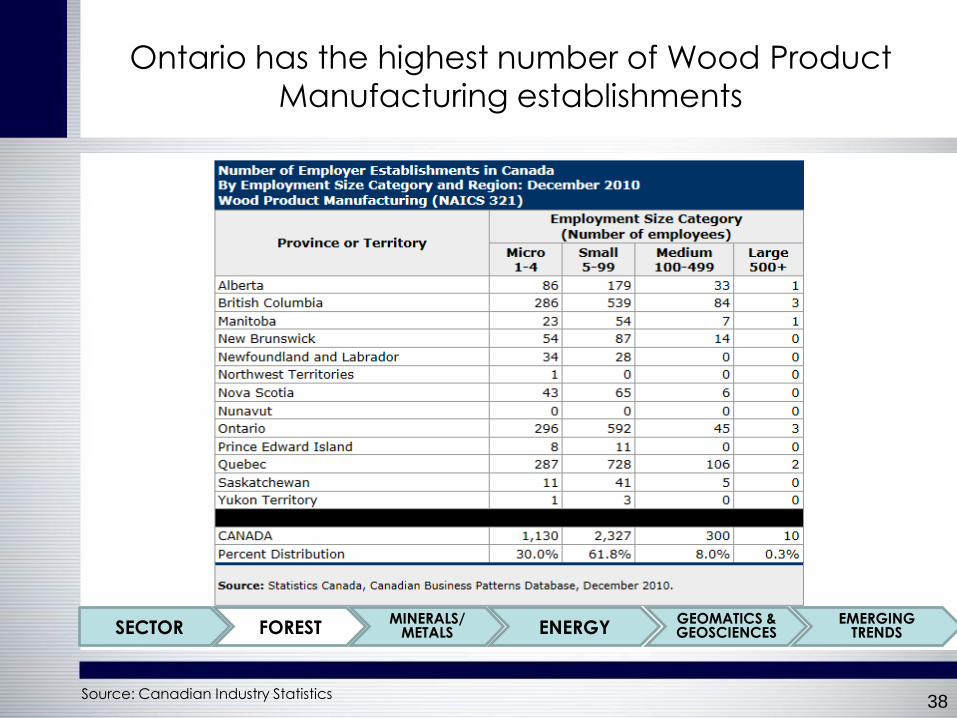
Ontario has the highest number of Wood Product
Manufacturing establishments
38 Source: Canadian Industry Statistics
SECTOR FOREST MINERALS/
METALS ENERGY GEOMATICS & GEOSCIENCES
EMERGING TRENDS
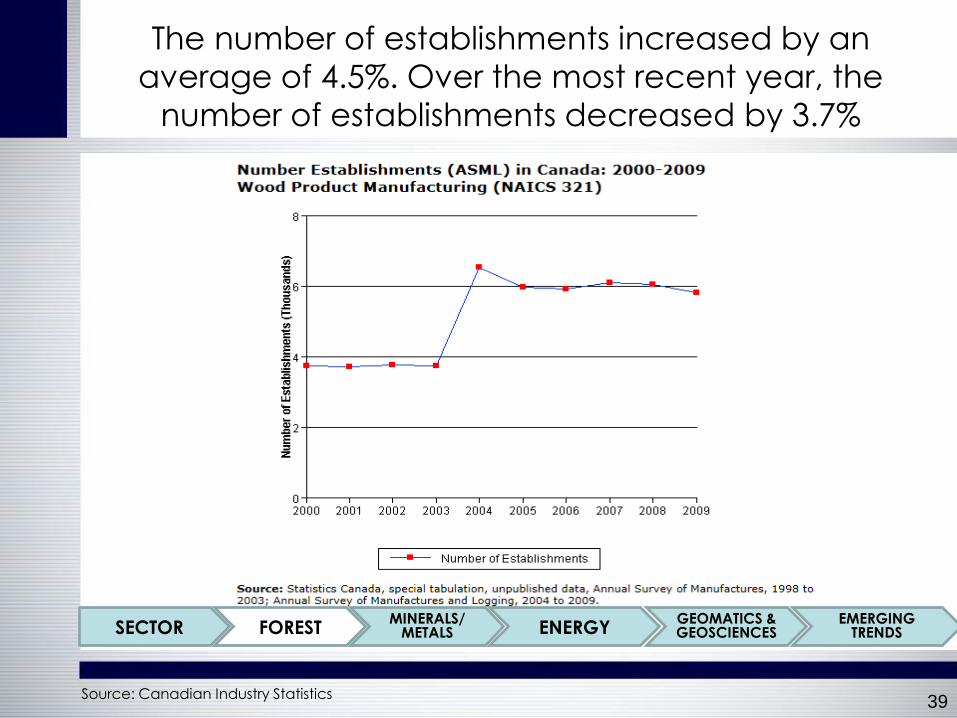
The number of establishments increased by an
average of 4.5%. Over the most recent year, the
number of establishments decreased by 3.7%
39 Source: Canadian Industry Statistics
SECTOR FOREST MINERALS/
METALS ENERGY GEOMATICS & GEOSCIENCES
EMERGING TRENDS

The percentage of small and medium-sized businesses
that were profitable in the Wood Product
Manufacturing subsector in 2008 was 73.2%, with 26.8%
of firms failing to turn a profit
40
SECTOR FOREST MINERALS/
METALS ENERGY GEOMATICS & GEOSCIENCES
EMERGING TRENDS
Source: Canadian Industry Statistics

41
Wood manufacturing subsector
Employment
42
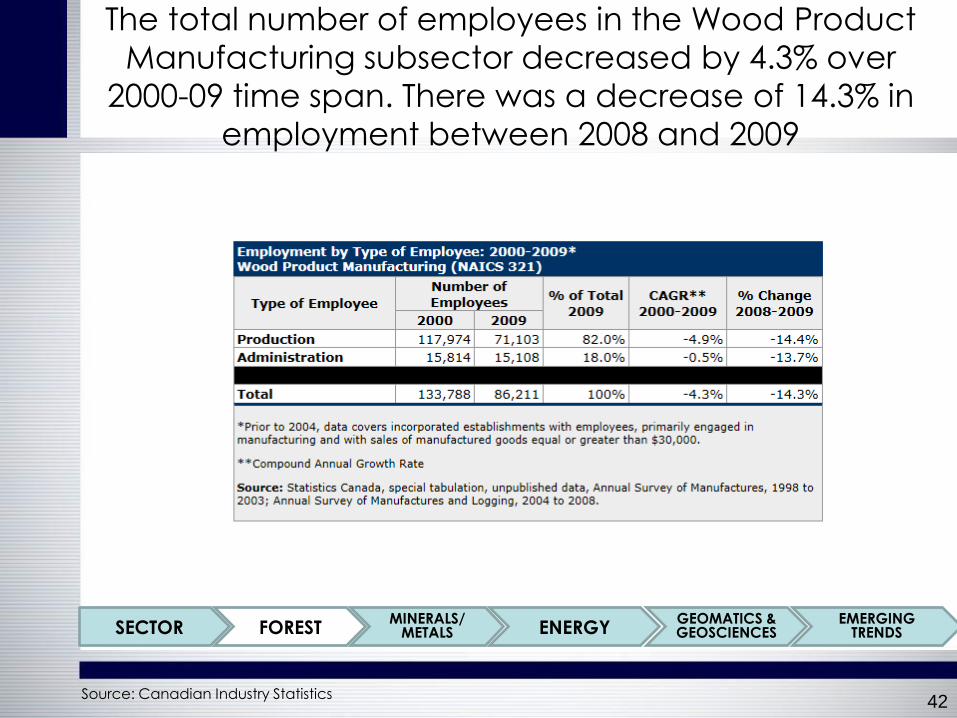
The total number of employees in the Wood Product
Manufacturing subsector decreased by 4.3% over
2000-09 time span. There was a decrease of 14.3% in
employment between 2008 and 2009
Source: Canadian Industry Statistics
SECTOR FOREST MINERALS/
METALS ENERGY GEOMATICS & GEOSCIENCES
EMERGING TRENDS

The percentage of employees that are production
workers decreased from 88.0% in 2000 to 82.0% in 2009. As a result, there was a relative increase in the
proportion of administrative workers
43 Source: Canadian Industry Statistics
SECTOR FOREST MINERALS/
METALS ENERGY GEOMATICS & GEOSCIENCES
EMERGING TRENDS

The average annual salaries for employees of the
Wood Product Manufacturing subsector rose at an
average rate of 1.2% per year. There was a decrease
of 0.6% over the 2008-2009 period
44 Source: Canadian Industry Statistics
SECTOR FOREST MINERALS/
METALS ENERGY GEOMATICS & GEOSCIENCES
EMERGING TRENDS
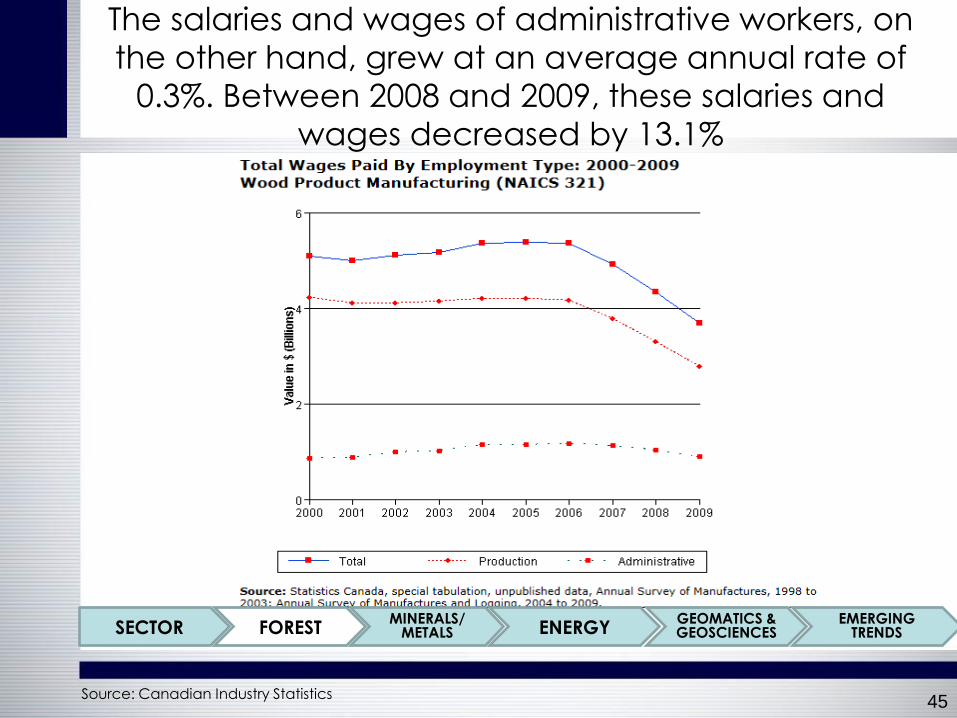
The salaries and wages of administrative workers, on
the other hand, grew at an average annual rate of
0.3%. Between 2008 and 2009, these salaries and
wages decreased by 13.1%
45 Source: Canadian Industry Statistics
SECTOR FOREST MINERALS/
METALS ENERGY GEOMATICS & GEOSCIENCES
EMERGING TRENDS

46
Wood manufacturing subsector
Performance

Net revenues in the Wood Product Manufacturing
subsector have not changed significantly
47 Source: Canadian Industry Statistics
SECTOR FOREST MINERALS/
METALS ENERGY GEOMATICS & GEOSCIENCES
EMERGING TRENDS

The decrease in GDP reported between 2001 and
2010 represented a compound annual rate of 0.8%
48
SECTOR FOREST MINERALS/
METALS ENERGY GEOMATICS & GEOSCIENCES
EMERGING TRENDS
Source: Canadian Industry Statistics
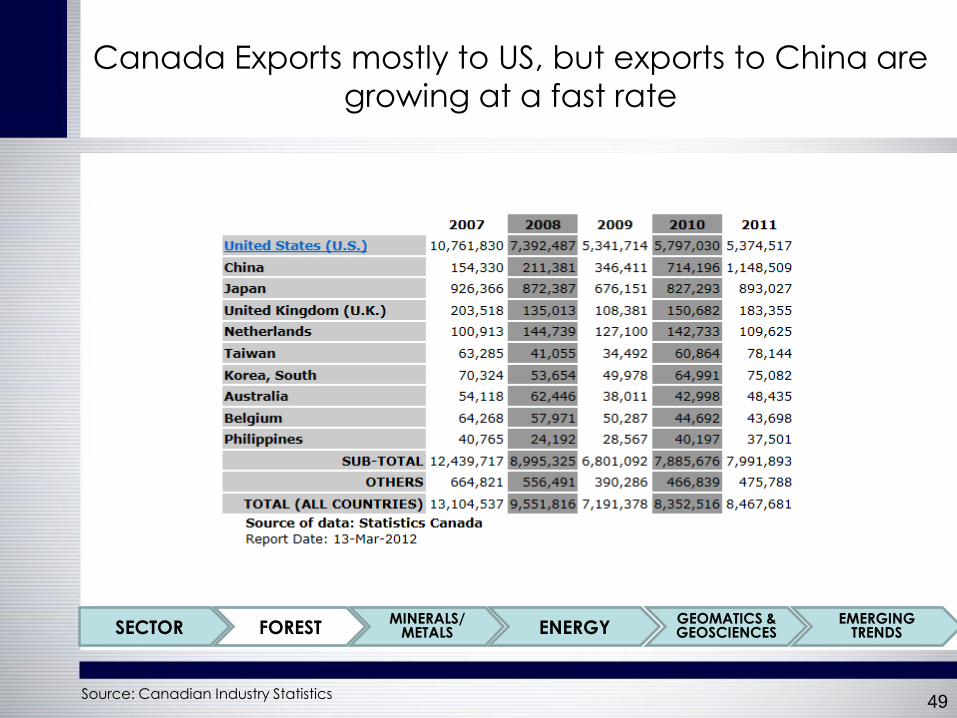
Canada Exports mostly to US, but exports to China are
growing at a fast rate
49
SECTOR FOREST MINERALS/
METALS ENERGY GEOMATICS & GEOSCIENCES
EMERGING TRENDS
Source: Canadian Industry Statistics

Most of the exports happen out of the province of
British Columbia
50
SECTOR FOREST MINERALS/
METALS ENERGY GEOMATICS & GEOSCIENCES
EMERGING TRENDS
Source: Canadian Industry Statistics

51
Minerals and Metals Sector
Introduction

Canada is one of the leading mining nations in the
world
• Canada is one of the leading mining nations in the world, producing
more than 60 minerals and metals
• In 2009, more than 220 principal producing mines (metal, non-metals
and coal mines), more than 3000 stone quarries and sand and gravel
pits, and about 50 non-ferrous smelters and refineries and steel mills
were operating in Canada
• Canada’s estimated mineral production in 2009 was $32.2 billion
• Nearly 80 percent of the total was accounted for by Ontario (19.7
percent), Quebec (19.3 percent), British Columbia (17.8 percent),
Saskatchewan (15.6 percent) and Newfoundland and Labrador (7.1
percent
52 Source: Canada Natural Resources: 2009
SECTOR FOREST MINERALS/
METALS ENERGY GEOMATICS & GEOSCIENCES
EMERGING TRENDS

53
Minerals and Metals Sector
Industry Performance
Mining and mineral-processing industries generated
2.7 %of the Canadian GDP
• Mining and mineral-processing industries generated 2.7 percent of the
national GDP and contributed $31.9 billion to the Canadian economy
• Exploration and deposit appraisal expenditures were $1.9 billion, and
spending intentions for 2010 indicate an increase to $2.8 billion
• Capital investment spending in the mining and mineral processing
industries were $9.8 billion in 2009. Spending intentions for 2010 are
expected to reach $11.9 billion
• Gold was the top metallic mineral produced in Canada, with
shipments valued at $3.7 billion, followed by iron ore at $3.2 billion and
aluminum at $3.0 billion
• The leading non-metallic minerals were potash, which had a value of
$3.4 billion; diamonds, at $1.7 billion; and sand and gravel, at $1.5
billion. Coal was the top mineral produced in Canada, with shipments
valued at $4.5 billion
54 Source: Canada Natural Resources: 2009
SECTOR FOREST MINERALS/
METALS ENERGY GEOMATICS & GEOSCIENCES
EMERGING TRENDS

In 2009, Canada exported minerals and metals worth
over $66 billion ($49 billion in metals, $12 billion in
nonmetals, and $5 billion in coal), accounting for 18%
of Canada’s total exports
55
SECTOR FOREST MINERALS/
METALS ENERGY GEOMATICS & GEOSCIENCES
EMERGING TRENDS
Source: NRCAN, Natural Resources Canada

Value of Metallic mineral production is higher in
Canada
56
SECTOR FOREST MINERALS/
METALS ENERGY GEOMATICS & GEOSCIENCES
EMERGING TRENDS
Source: NRCAN, Natural Resources Canada

Production of Canada’s Leading Minerals
57
SECTOR FOREST MINERALS/
METALS ENERGY GEOMATICS & GEOSCIENCES
EMERGING TRENDS
Source: NRCAN, Natural Resources Canada

Production of Canada’s Leading Minerals
58 Source: NRCAN, Natural Resources Canada
SECTOR FOREST MINERALS/
METALS ENERGY GEOMATICS & GEOSCIENCES
EMERGING TRENDS

59
Minerals and Metals Sector
Employment

The Mining and Mineral processing sector provides
direct employment to 2.1 % of Canadian work force
• In 2009, total direct employment in the mining and mineral
processing industries – 307 000 people – accounted for 2.1 percent
of Canada’s total employment.
• Approximately 51 000 people were employed in mining, 59 000
people were employed in smelting and refining, and 197 000 people
were employed in the mineral-processing and manufacturing
industries
• Wages and salaries remained competitive in mining and mineral-
processing industries, with 2009 average weekly earnings at $1,056
60 Source: Canada Natural Resources: 2009
SECTOR FOREST MINERALS/
METALS ENERGY GEOMATICS & GEOSCIENCES
EMERGING TRENDS
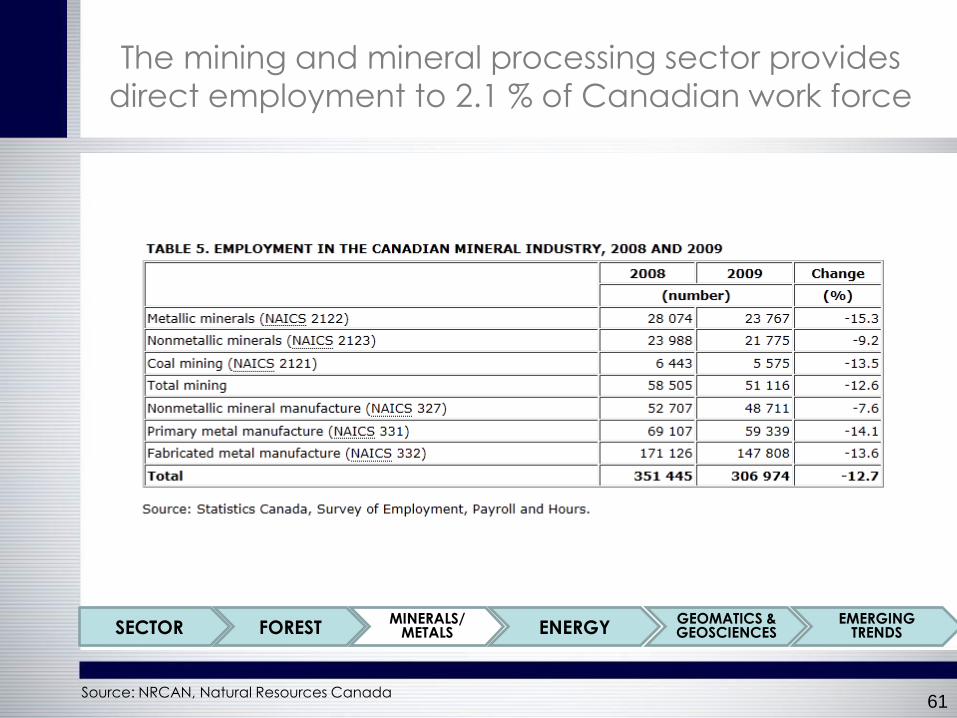
The mining and mineral processing sector provides
direct employment to 2.1 % of Canadian work force
61
SECTOR FOREST MINERALS/
METALS ENERGY GEOMATICS & GEOSCIENCES
EMERGING TRENDS
Source: NRCAN, Natural Resources Canada

62
Minerals and Metals Sector
Trade
Canada is one of the world’s leading exporters of
minerals and mineral products
• ƒCanada is one of the world’s leading exporters of minerals and
mineral products. These products make a significant contribution to
Canada’s international trade, accounting for 19.2 percent of
Canada’s domestic exports in 2009
• Canada continues to be the world’s leader in the production (by
volume) of potash, and it ranks in the top five countries for the
production of primary aluminum, cobalt, molybdenum, nickel,
platinum group metals, salt, titanium concentrate, uranium and zinc
• Canada ranks second in the world in value of diamond production
• Canada continues to be the third-largest producer of primary
aluminum in the world
• Mineral and metals products (including coal) accounted for almost 35
percent of coastwise shipping and more than 52 percent of
international shipping in 2007
63
SECTOR FOREST MINERALS/
METALS ENERGY GEOMATICS & GEOSCIENCES
EMERGING TRENDS
Source: Canada Natural Resources: 2009

Canada is one of the world’s leading exporters of
minerals and mineral products
64
SECTOR FOREST MINERALS/
METALS ENERGY GEOMATICS & GEOSCIENCES
EMERGING TRENDS
Source: Canada Natural Resources: 2009

65
Mining and Quarrying subsector
Introduction

Ontario has the highest number of Mining, Quarrying
and Extraction establishments
66 Source: Canadian Industry Statistics
SECTOR FOREST MINERALS/
METALS ENERGY GEOMATICS & GEOSCIENCES
EMERGING TRENDS
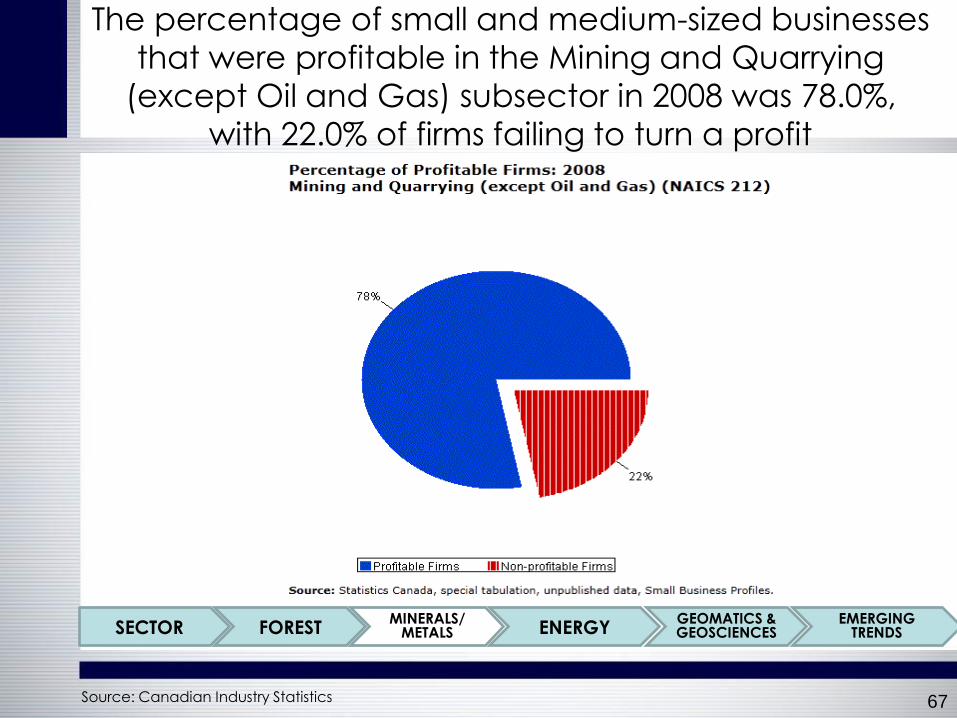
The percentage of small and medium-sized businesses
that were profitable in the Mining and Quarrying
(except Oil and Gas) subsector in 2008 was 78.0%,
with 22.0% of firms failing to turn a profit
67
SECTOR FOREST MINERALS/
METALS ENERGY GEOMATICS & GEOSCIENCES
EMERGING TRENDS
Source: Canadian Industry Statistics

68
Mining and Quarrying subsector
Industry Performance

Products are predominantly exported to US from the
year 2009 prior to that it was the UK
69
SECTOR FOREST MINERALS/
METALS ENERGY GEOMATICS & GEOSCIENCES
EMERGING TRENDS
Source: Canadian Industry Statistics

Most of the exports happen out of the province of
Ontario
70
SECTOR FOREST MINERALS/
METALS ENERGY GEOMATICS & GEOSCIENCES
EMERGING TRENDS
Source: Canadian Industry Statistics

71
Energy sector
Introduction

Canada produces large quantities of energy for both
domestic consumption and export
• Canada has a vast and diversified portfolio of energy resources
• Taking advantage of this endowment, Canada produces large
quantities of energy for both domestic consumption and export
• In 2009, Canada’s production of “primary” energy – i.e. energy found
in nature before conversion or transformation – totaled 16,543
petajoules (PJ). Fossil fuels accounted for the greatest share of this
production, with crude oil representing 36.8 percent; natural gas, 37.7
percent; and coal, 8.2 percent
• Renewable energy sources were also important, with hydroelectricity
representing 7.9 percent; wood, 3.4 percent; and emerging forms
(e.g. wind, tidal and solar), 0.1 percent. Nuclear energy (generated
from the primary source of uranium) accounted for 5.9 percent
72 Source: Canada Natural Resources: 2009
SECTOR FOREST MINERALS/
METALS ENERGY GEOMATICS & GEOSCIENCES
EMERGING TRENDS
Canada has the second largest oil resource base
second only to Saudi Arabia
• Crude oil reserves at the beginning of 2009 were estimated at 27.8 billion
cubic metres (bcm) – providing Canada with a resource base second only to Saudi Arabia
• Oil sands represented the majority of these reserves with 27.0 bcm, while conventional sources amounted to 0.8 bcm. The ultimate recoverable
potential from the Alberta oil sands is estimated to be more than 50.0 bcm
• Production of crude oil in Canada totalled 158 million cubic meter, or 433.1 thousand cubic meter per day, in 2009
• Conventional sources provided 51.0 percent of total production, while oil sands production, which has been growing in recent years, accounted for
the remainder
• About two thirds of crude oil production is exported, while the balance is processed by Canadian refineries into refined petroleum products, such as gasoline, diesel and heating oil
73 Source: Canada Natural Resources: 2009
SECTOR FOREST MINERALS/
METALS ENERGY GEOMATICS & GEOSCIENCES
EMERGING TRENDS

95% of the Natural gas is from Conventional sources
• ƒNatural gas reserves at the beginning of 2009 totaled 1,754 bcm. Of
this amount, about 95 percent is from conventional sources, and the
remainder is from unconventional sources (such as coal bed methane
and shale gas)
• The total potential from conventional resources is estimated to be 10.1
trillion cubic metres (tcm), while recent estimates suggest that the
potential from unconventional resources is in the range of 10.7 to 26.8
tcm
• Marketable production of natural gas in Canada amounted to 147.5
bcm in 2009. Close to two thirds of this production was exported to
the United States (U.S.), and the balance was sold to Canadian
consumers
74 Source: Canada Natural Resources: 2009
SECTOR FOREST MINERALS/
METALS ENERGY GEOMATICS & GEOSCIENCES
EMERGING TRENDS
Hydroelectricity represented 60.4 percent of total
generation in Canada
• Electricity generation in Canada amounted to 585 terawatt hours in 2009
• Canada’s abundant water resources provided a significant contribution in
this regard, as hydroelectricity represented 60.4 percent of total
generation. Other sources of electricity supply included coal (16.9 percent);
nuclear (14.6 percent); petroleum products, natural gas and waste (7.5
percent); and emerging renewable sources (0.6 percent), i.e. solar, wind
and tidal
• Quebec accounted for 33 percent of that amount (97 percent from hydro),
and Ontario accounted for 25 percent (56 percent from nuclear sources)
• On a regional basis, Alberta accounted for 64 percent of Canada’s energy
production. Other leading energy provinces were British Columbia (13
percent), Saskatchewan (7 percent), Quebec (5 percent) and Ontario (3
percent)
• Alberta is the leading producer of fossil fuels, Quebec is the largest
producer of hydroelectricity, and Ontario is the largest producer of nuclear
energy
75 Source: Canada Natural Resources: 2009
SECTOR FOREST MINERALS/
METALS ENERGY GEOMATICS & GEOSCIENCES
EMERGING TRENDS

76
Energy sector
Industry Performance

Energy sector accounts for 6.7 percent of Canadian
GDP
• In 2009, the GDP of Canada’s energy sector – i.e. industries involved in the
production, transformation and transportation of energy – reached $80.2 billion (in 2002 constant dollars), accounting for 6.7 percent of Canadian GDP
• In 2009, new capital investments in energy-related industries represented 20.1 percent of Canadian investments
• The oil and gas extraction industry accounted for about half of this amount, while the electric power industry accounted for about one third
• The energy sector, excluding service stations and wholesale trade in petroleum products, provided direct employment for 257 462 people in
2009, or 1.8 percent of employment in Canada. In addition, service stations and wholesale trade in petroleum products provided direct employment for 96 199 people (0.7 percent)
• In 2009, energy accounted for 21.6 percent of merchandise exports. The energy trade balance ranked first as a contributor to Canada's positive
overall trade balance
77 Source: Canada Natural Resources: 2009
SECTOR FOREST MINERALS/
METALS ENERGY GEOMATICS & GEOSCIENCES
EMERGING TRENDS

US is Canada’s biggest market for energy products
• ƒCanada is an open economy, and taking advantage of its sizeable
energy resources, it has become an important and reliable energy provider to the world. In 2009, Canada exported $77.9 billion of energy products, of which 97 percent was to the United States
• Exports of crude oil amounted to 109.2 million m3 in 2009, representing a
value of $42.9 billion. Canadian crude oil accounted for 21 percent of U.S. crude imports and held a 15 percent share of the overall U.S. market. Exports of refined petroleum products in 2009 totaled 24.4 million cubic meter, or $14.2 billion
• Canada exported 93.8 bcm of natural gas, all of it to the United States.
The value of these exports was $16.0 billion. Canadian natural gas accounted for more than 87 percent of U.S. gas imports and held a 13 percent share of the overall U.S. market
• Canada also imported $34.0 billion of energy products, mostly crude oil, refined petroleum products and natural gas
78 Source: Canada Natural Resources: 2009
SECTOR FOREST MINERALS/
METALS ENERGY GEOMATICS & GEOSCIENCES
EMERGING TRENDS

US is Canada’s biggest market for energy products
79 Source: Canada Natural Resources: 2009
SECTOR FOREST MINERALS/
METALS ENERGY GEOMATICS & GEOSCIENCES
EMERGING TRENDS

80
Crude Oil, Natural Gas and Petroleum

81
Production and Demand for Crude Oil and Natural
Gas depends upon how well the economy is doing
SECTOR FOREST MINERALS/
METALS ENERGY GEOMATICS & GEOSCIENCES
EMERGING TRENDS
Source: NRCAN, Natural Resources Canada

82
Crude Oil

83
Canada is a leading oil producer in the world
SECTOR FOREST MINERALS/
METALS ENERGY GEOMATICS & GEOSCIENCES
EMERGING TRENDS
Source: NRCAN, Natural Resources Canada
• Canada is the 6th largest oil producer in the world, and a price taker in a
global oil market
• Canadian crude oil is sold both domestically and in the US market at the world price
• Despite the fact that Canada is a major net exporter of crude oil, refineries in Atlantic Canada and central Canada continue to import
crude from producers overseas
• This occurs because of the low cost of moving crude oil by ship, and the relatively high cost of pipelining crude oil across Canada
• Some of the crude imported is re-exported to the US in the form of refined
petroleum products
• Canada consumes far less crude oil than it produces, and this situation is likely to continue into the foreseeable future. In 2009, Canada recorded a huge net surplus of more than 840 thousand barrels per day (kb/d). Nearly all crude oil exported from Canada was to the US market

84
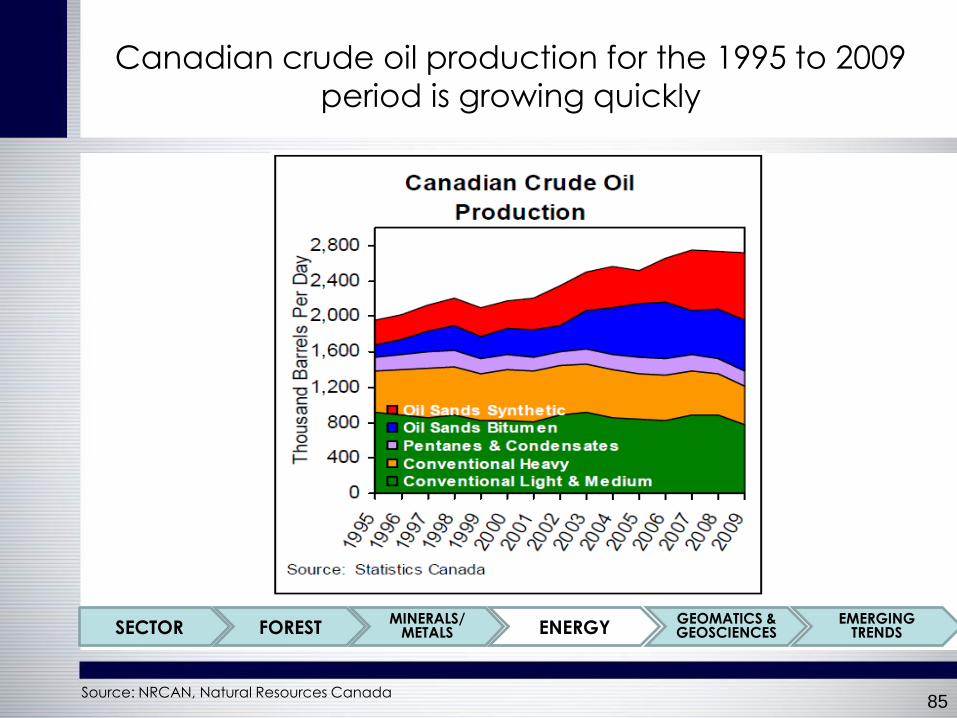
Between 2000 and 2009, Canadian demand for crude
oil ranged from 1.7 to 1.85 million barrels per day
(mb/d). Canadian demand for crude oil peaked in
2007, at 1.85 mb/d
SECTOR FOREST MINERALS/
METALS ENERGY GEOMATICS & GEOSCIENCES
EMERGING TRENDS
Source: NRCAN, Natural Resources Canada
85
Canadian crude oil production for the 1995 to 2009
period is growing quickly
SECTOR FOREST MINERALS/
METALS ENERGY GEOMATICS & GEOSCIENCES
EMERGING TRENDS
Source: NRCAN, Natural Resources Canada

86
The August 2009 merger between Suncor Energy and
Petro-Canada created Canada’s largest energy
company
SECTOR FOREST MINERALS/
METALS ENERGY GEOMATICS & GEOSCIENCES
EMERGING TRENDS
Source: NRCAN, Natural Resources Canada

87
Canada accounts for about 12% of the world’s
proved oil reserves, and 97% of Canadian
reserves are in the form of oil sands
SECTOR FOREST MINERALS/
METALS ENERGY GEOMATICS & GEOSCIENCES
EMERGING TRENDS
Source: NRCAN, Natural Resources Canada
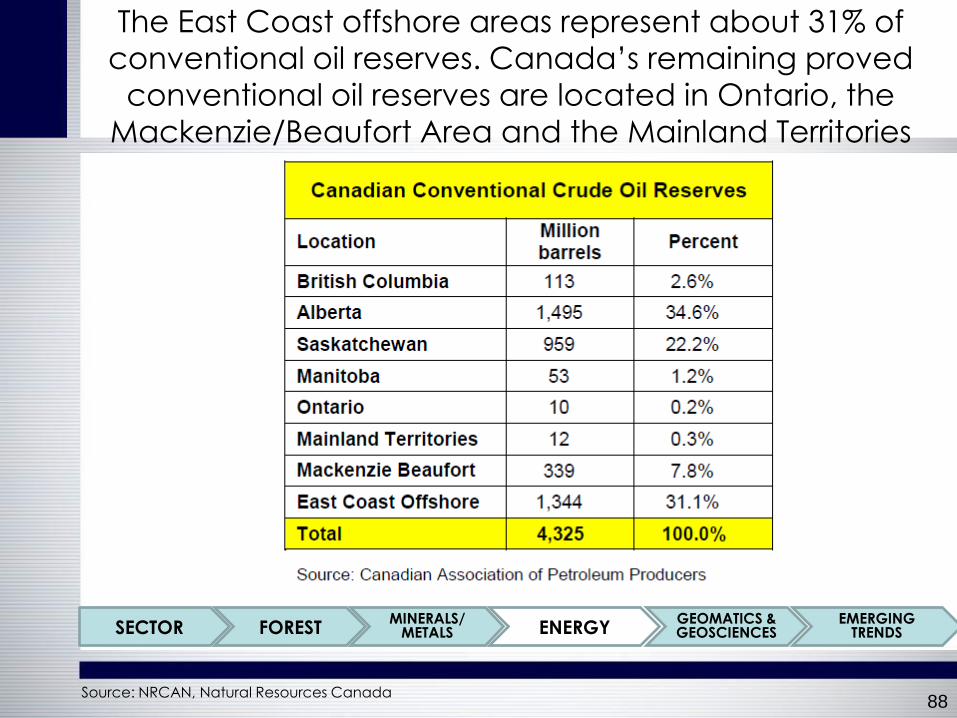
88
The East Coast offshore areas represent about 31% of
conventional oil reserves. Canada’s remaining proved conventional oil reserves are located in Ontario, the
Mackenzie/Beaufort Area and the Mainland Territories
SECTOR FOREST MINERALS/
METALS ENERGY GEOMATICS & GEOSCIENCES
EMERGING TRENDS
Source: NRCAN, Natural Resources Canada

89
Canadian oil imports by source for 2008 and 2009
SECTOR FOREST MINERALS/
METALS ENERGY GEOMATICS & GEOSCIENCES
EMERGING TRENDS
Source: NRCAN, Natural Resources Canada

90
The lower revenue figures are not a reflection of less
product being exported, but of the lower price of
Canadian crude oil in 2009 compared with 2008
SECTOR FOREST MINERALS/
METALS ENERGY GEOMATICS & GEOSCIENCES
EMERGING TRENDS
Source: NRCAN, Natural Resources Canada

91
Natural Gas
92
The Canadian natural gas market is affected by
market conditions in both Canada and the US
SECTOR FOREST MINERALS/
METALS ENERGY GEOMATICS & GEOSCIENCES
EMERGING TRENDS
Source: NRCAN, Natural Resources Canada
• The Canadian natural gas market is part of a continental market, and
is affected by market conditions in both Canada and the US
• In this market, natural gas flows seamlessly across borders via
extensive pipeline networks connecting supply basins to demand
centers
• Regional prices, reflecting natural gas pipeline transportation costs,
are established within this market
• Unlike crude oil, there is no global price for natural gas

93
Total North American demand for natural gas in
2009 was about 25.5 Tcf (trillion cubic feet) or
about 70 Bcf/d (billion cubic feet per day)
SECTOR FOREST MINERALS/
METALS ENERGY GEOMATICS & GEOSCIENCES
EMERGING TRENDS
Source: NRCAN, Natural Resources Canada

94
US production increased 5% largely on account of
surging shale gas production. Meanwhile, Canadian
production declined 4% owing to the maturing
Western Canada Sedimentary Basin (WCSB)
SECTOR FOREST MINERALS/
METALS ENERGY GEOMATICS & GEOSCIENCES
EMERGING TRENDS
Source: NRCAN, Natural Resources Canada

95
While there are hundreds of natural gas producers in
Canada, the top ten control 52% of production
SECTOR FOREST MINERALS/
METALS ENERGY GEOMATICS & GEOSCIENCES
EMERGING TRENDS
Source: NRCAN, Natural Resources Canada
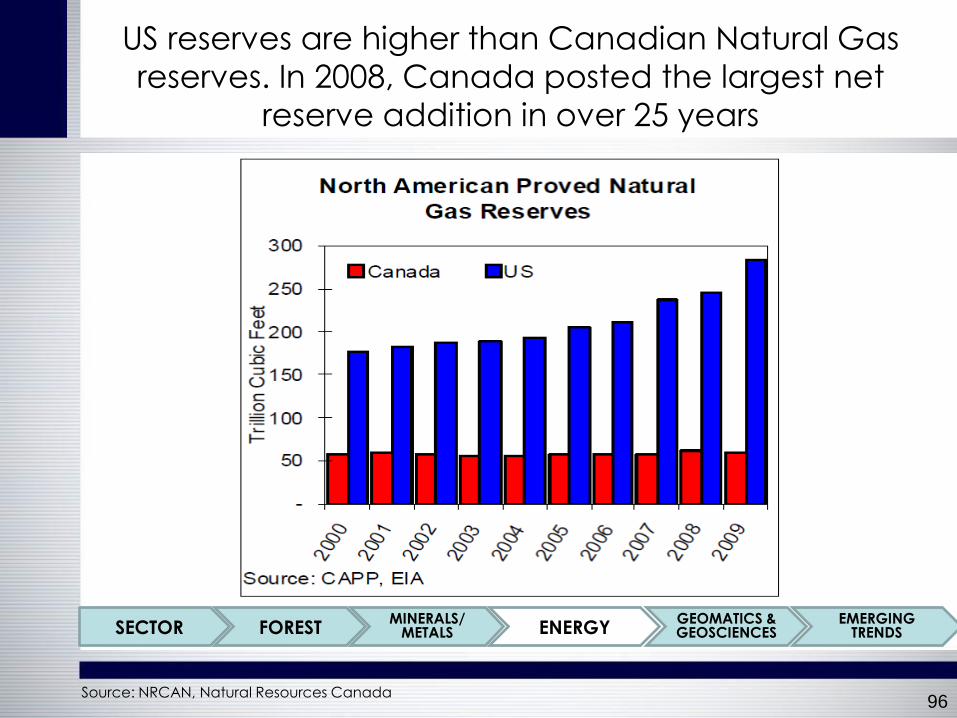
96
US reserves are higher than Canadian Natural Gas
reserves. In 2008, Canada posted the largest net
reserve addition in over 25 years
SECTOR FOREST MINERALS/
METALS ENERGY GEOMATICS & GEOSCIENCES
EMERGING TRENDS
Source: NRCAN, Natural Resources Canada
97
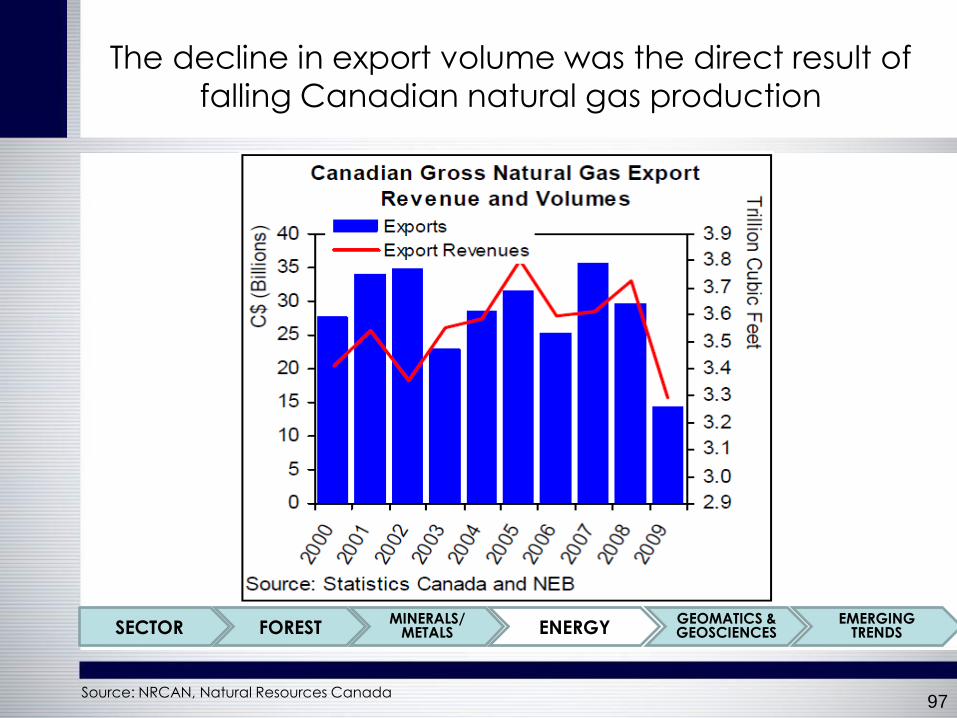
The decline in export volume was the direct result of
falling Canadian natural gas production
SECTOR FOREST MINERALS/
METALS ENERGY GEOMATICS & GEOSCIENCES
EMERGING TRENDS
Source: NRCAN, Natural Resources Canada

98
Petroleum Products

99
Petroleum Products market
SECTOR FOREST MINERALS/
METALS ENERGY GEOMATICS & GEOSCIENCES
EMERGING TRENDS
Source: NRCAN, Natural Resources Canada
• Canadian petroleum product prices are essentially set in a global
market
• For example, Canadian wholesale gasoline prices are driven by US
benchmark prices, such as the New York Harbour price. These US
benchmark prices reflect the international crude oil price and such
factors as seasonal demand and inventory levels
• Canadian wholesale prices must remain competitive with these US
benchmark prices
• This is because if Canadian refiners’ prices (for products) are lower,
products will flow out of the country. If refiners’ prices are higher,
marketers will import lower priced products
• The price of crude generally drives the prices of refined petroleum
products. Despite this, crude oil and petroleum product prices can, at
times, move in opposite directions

100
The demand for refined petroleum products
in Canada fluctuates along with seasonal demand
(e.g. increased demand for gasoline during the
summer, more heating oil used in winter)
SECTOR FOREST MINERALS/
METALS ENERGY GEOMATICS & GEOSCIENCES
EMERGING TRENDS
Source: NRCAN, Natural Resources Canada
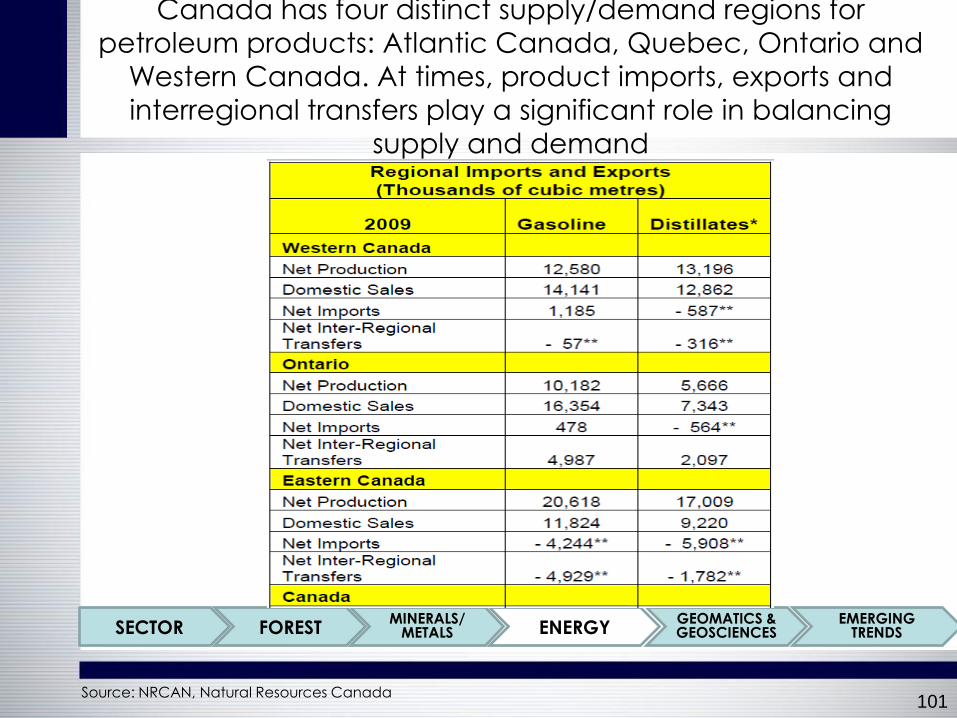
101
Canada has four distinct supply/demand regions for
petroleum products: Atlantic Canada, Quebec, Ontario and
Western Canada. At times, product imports, exports and
interregional transfers play a significant role in balancing
supply and demand
SECTOR FOREST MINERALS/
METALS ENERGY GEOMATICS & GEOSCIENCES
EMERGING TRENDS
Source: NRCAN, Natural Resources Canada

102
As both imports and exports have increased over the
last decade, net exports remain relatively unchanged
when compared to 2000
SECTOR FOREST MINERALS/
METALS ENERGY GEOMATICS & GEOSCIENCES
EMERGING TRENDS
Source: NRCAN, Natural Resources Canada

103
Electric Power Generation, Transmission and
Distribution
104
Quebec is the largest producer of electric power in
Canada
SECTOR FOREST MINERALS/
METALS ENERGY GEOMATICS & GEOSCIENCES
EMERGING TRENDS
Source: NRCAN, Natural Resources Canada
• In 2007, coal accounted for 76% of all the fuels consumed to generate
electricity in Canada and 35% of the cost of these fuels
• Conversely, natural gas accounted for 14% of all fuels consumed in 2007 but
48% of the cost of fuels used
• Alberta (45.2%), Ontario (26.1%), and Saskatchewan (14.3%) were the three
largest users of fuels for the production of electricity in Canada in 2007
• Overall, Alberta used 52% of all coal and 36% of all the natural gas consumed
in Canada for the production of electricity, while Ontario consumed 24% and
34% respectively and Saskatchewan consumed 17% and 9% respectively
• In 2007, Quebec was again the largest producer of electric power in Canada
generating 31.1% of all of Canada’s electric power and 49.7% of all hydro-
electric power. Quebec used only 2.0% of total fuels consumed for other forms
of electricity production
• Electricity generated by wind increased again in 2007, up 19.5% 2,925 GW.h
from 2,448 GW.h in 2006. This represents 0.5% of the total electricity generated
in Canada in 2007, up from 0.4% in 2006

105
Renewable Energy
106
Canada is a world leader in the production and use
of energy from renewable resources
SECTOR FOREST MINERALS/
METALS ENERGY GEOMATICS & GEOSCIENCES
EMERGING TRENDS
Source: NRCAN, Natural Resources Canada
• Canada, with its large landmass and diversified geography, has
substantial renewable resources that can be used to produce energy; these resources include moving water, biomass, and wind, solar, geothermal and ocean energy
• Canada is a world leader in the production and use of energy from renewable resources. Renewable energy sources currently provide about
16% of Canada's total primary energy supply
• Moving water is the most important renewable energy source in Canada, providing about 59 percent of Canada's electricity. In fact, Canada is the second largest producer of hydroelectricity in the world
• Biomass is the second most important renewable energy source in Canada. The primary types of bioenergy include electricity and industrial heat from wood waste, space heating from firewood, and biofuels from agricultural crops
• While they are emerging sources, wind and solar energy are experiencing
high growth rates
107
Geomatics and Geoscience sector
Introduction

Geomatics and Geoscience provide a detailed
picture of the physical world
• ƒGeomatics and geoscience are complementary earth sciences that
provide a detailed picture of the physical world and our place in it
• Geomatics consists of products, services and tools involved in the
collection, integration and management of geographic data
• Geographic information can be retrieved from various sources,
including earth-orbiting satellites, ground-based instruments and
airborne and seaborne sensors. These data are transformed into
digital maps and other usable forms with state-of-the-art information
technology
• Geoscience includes geology, geophysics, geochemistry and
geodesy. It deals with all aspects of the physical earth, including
mineral and energy resources; hazards such as earthquakes, tsunamis,
landslides and space weather phenomena; and geological controls
on groundwater and climate
108 Source: Canada Natural Resources: 2009
SECTOR FOREST MINERALS/
METALS ENERGY GEOMATICS & GEOSCIENCES
EMERGING TRENDS
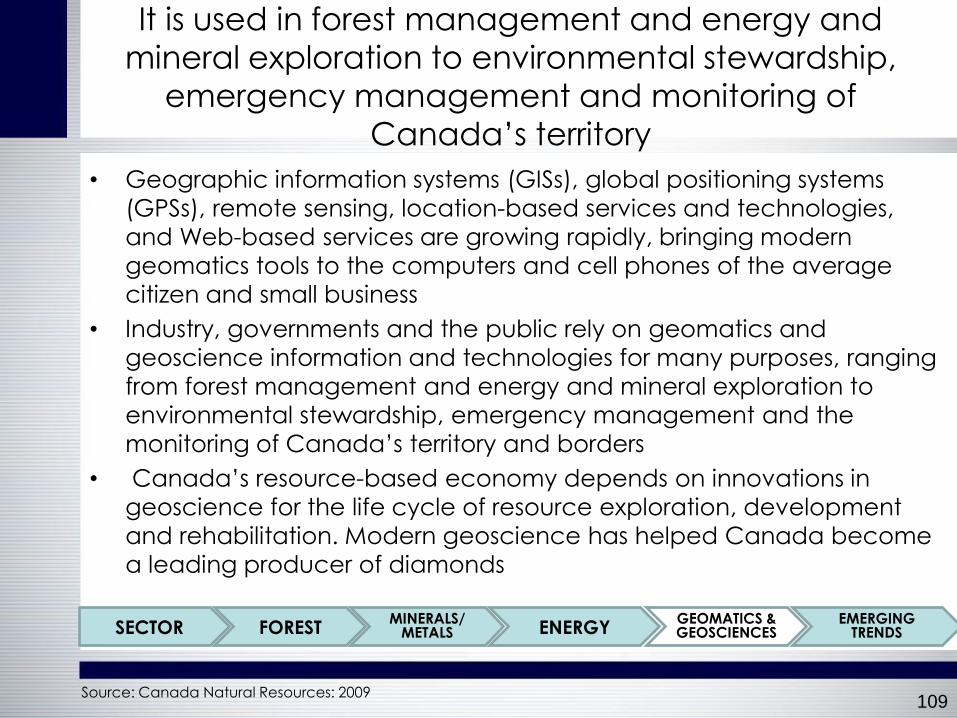
It is used in forest management and energy and
mineral exploration to environmental stewardship,
emergency management and monitoring of
Canada’s territory
• Geographic information systems (GISs), global positioning systems
(GPSs), remote sensing, location-based services and technologies,
and Web-based services are growing rapidly, bringing modern
geomatics tools to the computers and cell phones of the average
citizen and small business
• Industry, governments and the public rely on geomatics and
geoscience information and technologies for many purposes, ranging
from forest management and energy and mineral exploration to
environmental stewardship, emergency management and the
monitoring of Canada’s territory and borders
• Canada’s resource-based economy depends on innovations in
geoscience for the life cycle of resource exploration, development
and rehabilitation. Modern geoscience has helped Canada become
a leading producer of diamonds
109 Source: Canada Natural Resources: 2009
SECTOR FOREST MINERALS/
METALS ENERGY GEOMATICS & GEOSCIENCES
EMERGING TRENDS

110
Geomatics and Geoscience sector
Industry Performance

Canada continues to be a world leader in
geoscience and geomatics applications and
technology
• Canada is a world leader in the niche markets of remote sensing data and
applications, including mapping from space, sea-floor mapping and
hydrography
• Canada is recognized internationally for developing customized GIS
applications for urban planning, agriculture, geo-marketing and natural
resources management
• Major international markets for Canadian geomatics firms include North
America, the Middle East and Latin America
• International demand for geomatics products and services will continue to
increase, stimulating the growth of the industry in the coming years
• Canada continues to be a world leader in geoscience and geomatics
applications and technology, principally in minerals and energy
exploration and development
• Canada provides much of the information, expertise and technology used
around the world for the responsible development of natural resources
111 Source: Canada Natural Resources: 2009
SECTOR FOREST MINERALS/
METALS ENERGY GEOMATICS & GEOSCIENCES
EMERGING TRENDS

112
Emerging Trends

Emerging Trends in the Forest Industry Sector
• Industry transformation and a focus on innovation are leading to
improvements that will strengthen the competitiveness of Canada’s forest
sector in all areas
• Market challenges have been faced head on, and new market opportunities
are being targeted. Work is underway to identify both new products from fibre
and new markets for Canada’s traditional products
• Non-traditional products and services are the focus of intensive research and
development. Of particular note are those products and services derived from
forest biomass (for example, bioenergy, bioproducts and biochemicals).
Increased production of bioproducts is expected to give the industry a
significant boost in the highly competitive global marketplace
• The importance of environmental sustainability has been recognized across
the forest sector by government, industry and other players. Sustainable forest
management practices at every stage of production demonstrate responsible
resource stewardship and respond to the expectations of the new “green
movement” reality of today’s global marketplace
113 Source: NRCAN – Natural Resources Canada
SECTOR FOREST MINERALS/
METALS ENERGY GEOMATICS & GEOSCIENCES
EMERGING TRENDS
Emerging Trends in the Metals and Minerals Sector
• Looking ahead, the mining and mineral processing industries should
be an important source of economic growth in Canada
• As a result of expected relatively stronger prices, mines are projected
to open, re-open or expand production in Canada in 2010
• Export Development Canada forecasted that Canada’s exports of
ores and metals should rise by 10% in 2010
• According to a study by Informetrica, the mining and mineral
processing industries are forecast to grow by 6.4% y/y over the period
2010-13, which is double the expected growth rate of the total
economy
114 Source: NRCAN – Natural Resources Canada
SECTOR FOREST MINERALS/
METALS ENERGY GEOMATICS & GEOSCIENCES
EMERGING TRENDS
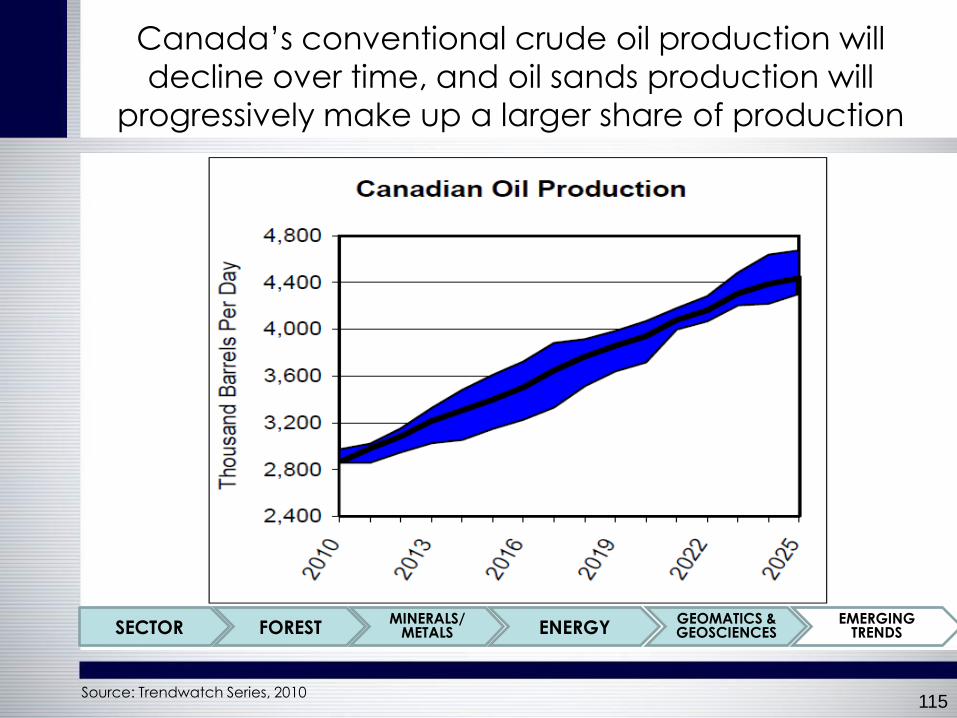
Canada’s conventional crude oil production will
decline over time, and oil sands production will
progressively make up a larger share of production
115
SECTOR FOREST MINERALS/
METALS ENERGY GEOMATICS & GEOSCIENCES
EMERGING TRENDS
Source: Trendwatch Series, 2010

All forecasts point to declining production of Natural
Gas in the coming years but recovering over the long
term
116
SECTOR FOREST MINERALS/
METALS ENERGY GEOMATICS & GEOSCIENCES
EMERGING TRENDS
Source: Trendwatch Series, 2010

China has drawn on its large foreign currency reserves
and cash to acquire stakes in Canadian-traded
natural resource companies
• In April 2010, the state-owned enterprise China Petroleum & Chemical
Corporation (more commonly known as Sinopec), one of the largest
integrated energy and chemical companies in China, offered to
acquire from ConocoPhillips Company its 9 per cent stake in Alberta
oil sands producer, Syncrude Canada Ltd. for US$4.65 billion
• This followed PetroChina’s August 2009 agreement to buy a 60 per
cent stake in two oil sands properties held by Athabasca Oil Sands
Corp. for $1.9 billion, and preceded the $817-million acquisition by
China Investment Corp. (CIC) of a 45 per cent stake in an oil sands
project held by Penn West Energy Trust, and a concurrent $435-million
investment for a 5 per cent stake of Penn West
• CIC had already made its mark in the Canadian mining sector earlier
this year when it acquired a 17 per cent interest in B-class shares of
Teck Resources Limited for $1.74 billion
117
SECTOR FOREST MINERALS/
METALS ENERGY GEOMATICS & GEOSCIENCES
EMERGING TRENDS
Source: Trendwatch Series, 2010
China has drawn on its large foreign currency reserves
and cash to acquire stakes in Canadian-traded
natural resource companies
Other significant transactions include:
• The signing of a memorandum of understanding between TSX-listed
Quadra Mining Ltd. and a subsidiary of State Grid Corporation of
China, the largest Chinese utility company and a major end user of
copper, to form a joint venture with respect to two of Quadra’s
properties which represent $900 million in assets
• The offer by Jinchuan Group Ltd., China’s largest producer of nickel,
cobalt and platinum, to acquire all common shares of Crowflight
Minerals Inc., a Canadian junior nickel producer, for $150 million
• The successful joint takeover bid by China’s Jilin Jien Nickel Industry
Co., Ltd. and Goldbrook Ventures Inc. of the junior nickel explorer
Canadian Royalties Inc. This was the first hostile takeover bid by a
Chinese company in Canada
118
SECTOR FOREST MINERALS/
METALS ENERGY GEOMATICS & GEOSCIENCES
EMERGING TRENDS
Source: Trendwatch Series, 2010
Related Documents


