Canada’s Greenhouse Gas Emissions Kyoto and Beyond

Canada’s Greenhouse Gas Emissions Kyoto and Beyond.
Jan 03, 2016
Welcome message from author
This document is posted to help you gain knowledge. Please leave a comment to let me know what you think about it! Share it to your friends and learn new things together.
Transcript
Canada’s Greenhouse Gas Emissions
Kyoto and Beyond

Canada’s Kyoto Committments
• Committed to a 5.4% reduction from 1990 emissions levels by the 2008-2012 period
• Canada emitted approximately 601 megatonnes eCO2 in 1990
• BAU is projected to be 809 MT in 2010
• This equates to a required reduction of 240 megatonnes from 2010 BAU

The Big Picture

Some numbers to think about
CO2 in parts per million
Increase over natural level
Comment
275 None Stable here until mid-19th century
370 85 ppm Causing whatever climate change we are already experiencing
450 175 ppm We can’t stop the concentration from getting at least this high
550 275 ppm Over three times what we have already added.
850 575 ppm The path we appear to be on…

300
400
500
600
700
800
900E
mis
sion
s of
eC
O2
(MT
)
BAU
Kyoto
Gap -240 MT
720 MT
BAU - 809 MT
Target -569 MT
Canada’s Kyoto Committments

Some questions….
• From what sectors of the economy do these GHG emissions originate?
• What fuels are the most important in terms of GHG emissions?
• On a per capita basis, how ‘GHG’ intensive are Canadians (i.e amount of GHGs annually)?
• What ‘everyday’ activities lead to these emissions?
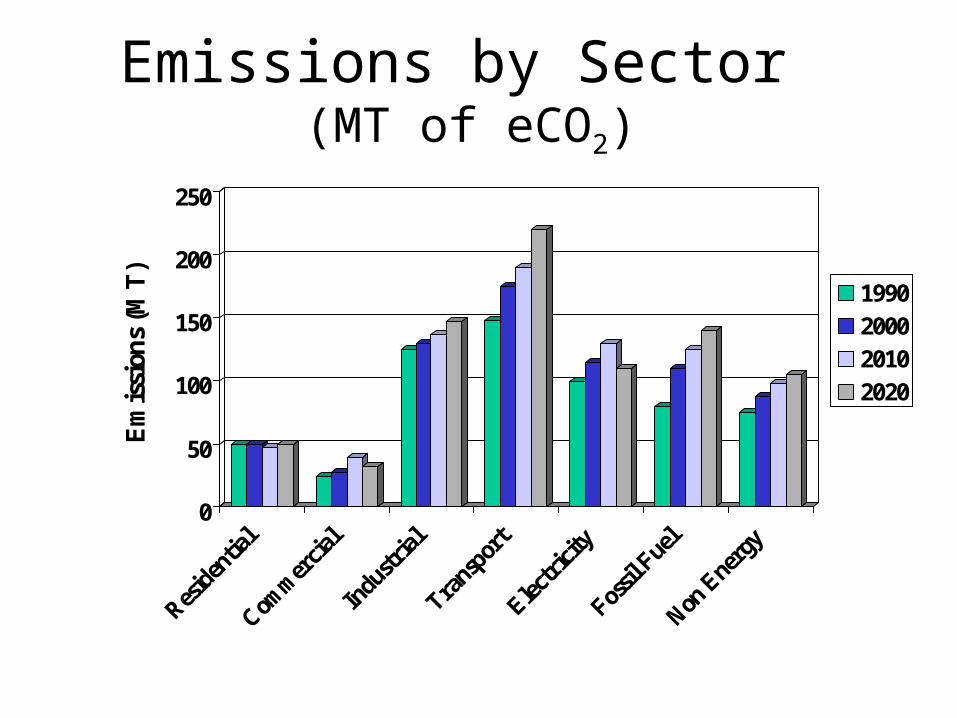
Emissions by Sector (MT of eCO2)
0
50
100
150
200
250
Em
issi
ons
(MT
)
1990200020102020

Emissions by Sector - Direct and Indirect Emissions - MT in 2004
0
100
200
300
400
500
600
700
800
Emis
sio
ns
of
eC
O2
(M
T) NFC
FC

Emission Intensity of Fuel
Fuel
Emission Factor (kg of eCO2 per GJ of energy)
Natural Gas 49Fuel Oil 73Gasoline 68Diesel 80Kerosene 67Propane 60Coal 86
Alberta 260British Columbia SmallManitoba SmallNew Brunswick 125Newfoundland 62Nova Scotia 261Ontario 87PEI 140Quebec SmallSaskatchewan 222
Current Electricity Emission Factors (kg
CO2 per GJ)

What is a GJ and what is a megatonne?
• A gigajoule is 1 billion joules, equal to 278 Kwh. More simply, this equals running 2,780 100 watt lightbulbs for 1 hour
• Each year Canada consumes nearly 9,500 PJs of energy (1 PJ = 1,000,000 GJ), the equivalent of leaving 157 billion 100 watt light bulbs on for one week

And a megatonne...
• A megatonne is a million tonnes
• One tonne is 1000 kilograms
• 1 kilogram is 100 grams
• One tonne of CO2 would completely fill the inside of an ordinary house

Fuel Consumption in Canada
Energy Consumption in Canada by Sector in 1998 (TJ)
0
500,000
1,000,000
1,500,000
2,000,000
2,500,000
3,000,000
3,500,000
4,000,000
4,500,000
Indu
stry
Trans
port
Agricu
lture
Comm
ercia
l
Resid
ential
Electricity
Fuel Oil
Gas/Diesel
Kerosene
Gasoline
Natural Gas
Coal/Coal Products

Per Capita Emissions • If 720 MT of eCO2 emissions per year, 30 million
people, then…
• Each person is responsible for 24 tonnes of eCO2 a year!
• However, if only personal actions are included, this equals 5.4 tonnes/year.
• The main activities which lead to this which we can directly impact are: transportation, home energy services, and waste
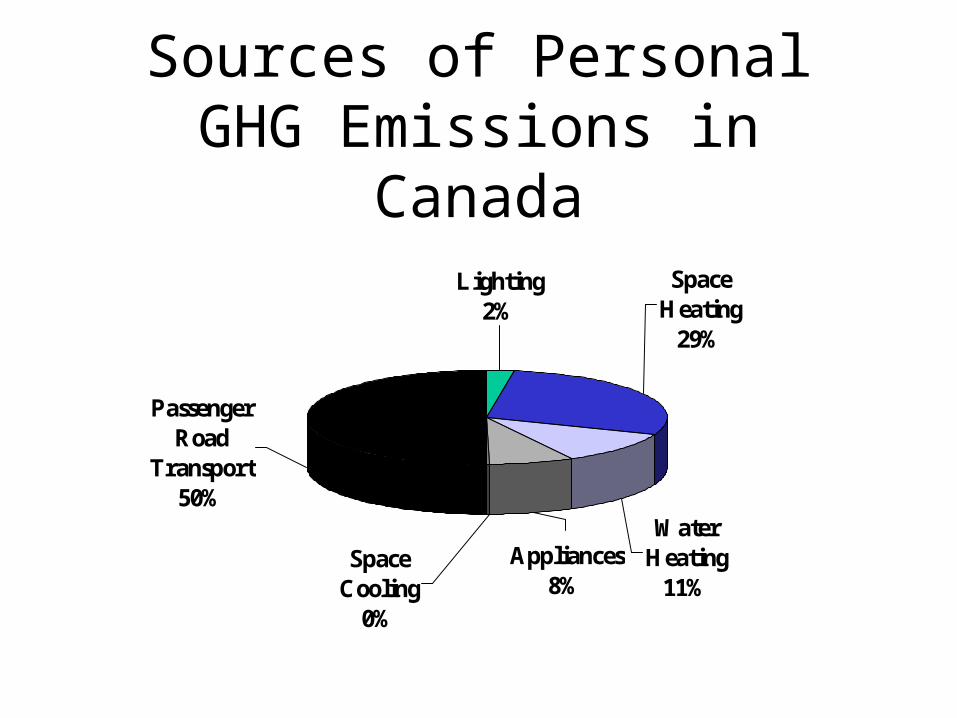
Sources of Personal GHG Emissions in Canada
Passenger Road
Transport50%
Appliances8%
Space Cooling
0%
Water Heating
11%
Space Heating
29%
Lighting2%
What actions can we take?
• What do you think are the best actions which both society and we as individuals could take to mitigate greenhouse gas emissions?
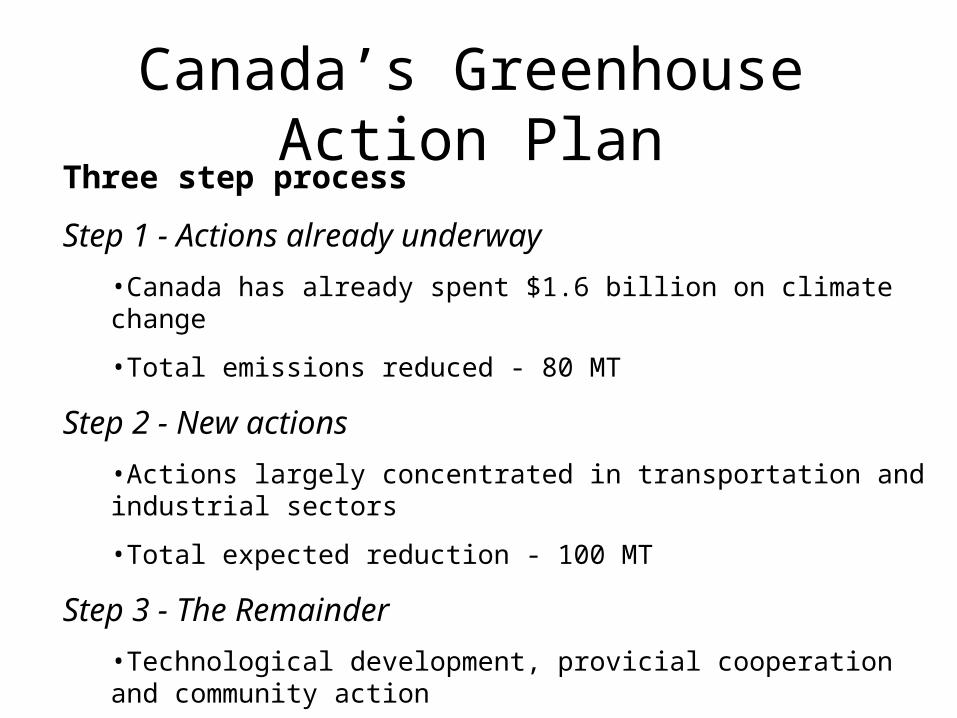
Canada’s Greenhouse Action Plan
Three step process
Step 1 - Actions already underway
•Canada has already spent $1.6 billion on climate change
•Total emissions reduced - 80 MT
Step 2 - New actions
•Actions largely concentrated in transportation and industrial sectors
•Total expected reduction - 100 MT
Step 3 - The Remainder
•Technological development, provicial cooperation and community action
•Total expected reduction - 60 MT
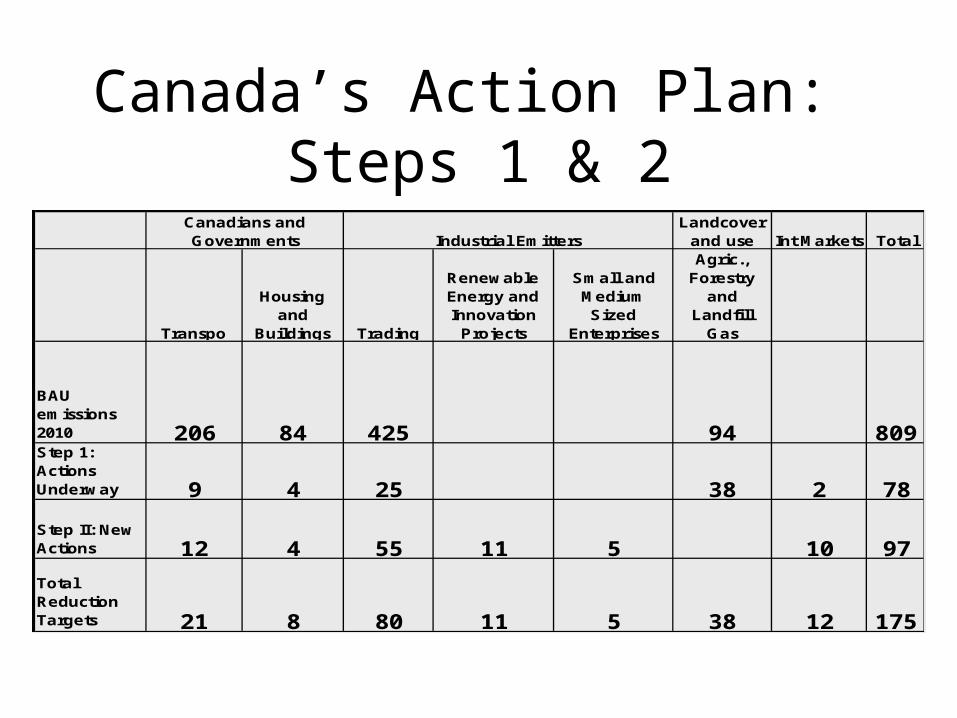
Canada’s Action Plan: Steps 1 & 2
Landcover and use Int Markets Total
Transpo
Housing and
Buildings Trading
Renewable Energy and Innovation
Projects
Small and Medium Sized
Enterprises
Agric., Forestry
and Landfill
Gas
BAU emissions 2010 206 84 425 94 809Step 1: Actions Underway 9 4 25 38 2 78
Step II: New Actions 12 4 55 11 5 10 97
Total Reduction Targets 21 8 80 11 5 38 12 175
Canadians and Governments Industrial Emitters

Where we have come from...
1.00
1.50
2.00
2.50
19
70
=1
.0 GDP
Energy
Emissions

New primary energy in Canada: 1970 -1990
Oil
Gas
Coal HydroNuclear Wood
Energy Productivity
0
500
1000
1500
2000
2500
3000
3500
4000
4500 PJ

The action plan for the residential sector
• Actions underway and proposed (goal - 8 MT)
• Improving EE of buildings (1.2 MT)
• EE evaluations (0.7 MT)
• Improving EE standards for equipment and appliances (1.6 MT)
• EE retrofit of 20% of housing (1.5 MT)

Emissions in the residential sector
13.29%4.40%
59.84%
0.40%
22.08%
AppliancesLightingSpace HeatingSpace CoolingWater Heating

Examples from the past: space heating

Examples from the past..appliances
Appliance 1985 1999 ChangeStock (000's)
Savings (MT
eCO2)Refrigerator 1,753 995 56.76% 14,692 18.45
Freezer 1,430 841 58.81% 6,825 6.89
Dishwasher 176 106 60.23% 5,876 0.72
Clothes Washer 113 87 76.99% 9,402 0.65
Clothes Dryer 1,425 1,063 74.60% 9,184 8.21
Range 814 782 96.07% 11,761 4.97
Total 57,740 39.89
Unit Energy Consumption (Kwh/year)

The action plan for the transportation sector
Actions underway and proposed (goal - 21 MT)•25% improvement in new vehicle fuel efficiency (5.2 MT)
•Integrated planning to reduce urban transportation emissions (0.8 MT)
•Voluntary fuel efficiency improvements in air, rail, truck and marine sectors (2 MT)
•Increased ethanol blend to 35% of fuel mix (2 MT)
•Increased public transport (7 MT)

Emissions in the transportation sector
Off road11%
Air11%Marine
5%
Rail6%
Trucks22%
Light duty vehicles
45%

Fuel efficiency of transportation modes

How much CO2 would result from a 50 km round trip
commute?• If vehicle is a mid sized car, perhaps 10 litres/100 km fuel
efficient
• Therefore 5 litres per 50 km round trip
• 5 litres of gas equals 0.1645 GJ of energy in gas
• 0.1645 GJ equals 11 kgs of CO2 (69 kgs CO2/GJ)
• Therefore, in one round trip of 50 km, this equals 11 kgs of CO2.
• If this is done 240 times a year, this equals 2.6 tonnes of CO2!

The action plan for the electricity sector
Actions underway and proposed (goal - 22.6
MT)• incentive for wind power generation (2.8 MT)
• increased interprovincial trade and transmission (5.4 MT)
• 10% new generation from emerging renewable sources (3.9 MT)
• Clean coal technology (4.5 MT)

Emissions in the electricity sector

Emission intensity by province
0
0.1
0.2
0.3
0.4
0.5
0.6
0.7
0.8
0.9
1
Em
issi
on in
ten
sity
(kg
/KW
h)
Man
Que
NF
LD
BC
YT
NW
T
Nun
Ont
NB
PE
I
Sas
k
NS
Alb

What does this mean for the average family?
Appliance Kwh/year Alberta Ontario ManitobaRefrigerator 995 937.29 266.66 1.65Freezer 841 792.22 225.39 1.40Dishwasher 106 99.85 28.41 0.18Clothes Washer 87 81.95 23.32 0.14Clothes Dryer 1,063 1001.35 284.88 1.76Range 782 736.64 209.58 1.30Total 3,649 1,038 6
Kilograms eCO2/Year
In terms of appliance use...

Latest action in the news...
Alberta Government to Buy 45% of Electricity From Green Producer 20 Year Contract Awarded to Canadian Hydro Developers
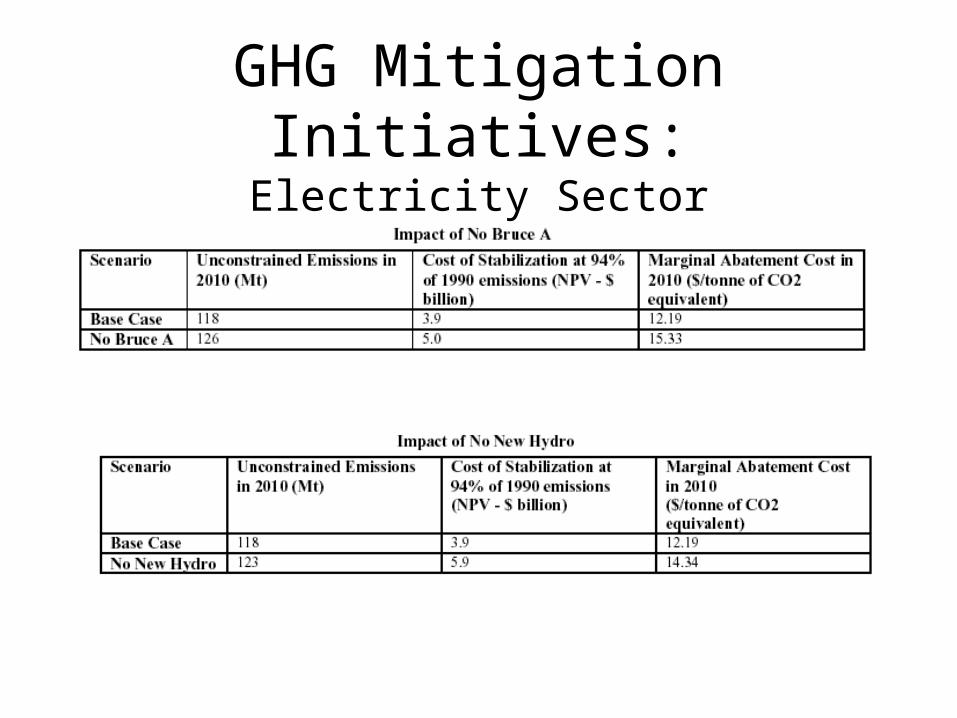
GHG Mitigation Initiatives:Electricity Sector

Carbon taxes - an economic instrument
Carbon Taxes
Objectives?
• Reduce emissions of CO2
• Create environmental beneficial incentives
• Equalize maringal cost across tax base
• Spur innovation
• Raise revenues
How?
CO2 = (CO2/E)*(E/ES)*(ES/I)*(I/O)*O
Related Documents