® Digital Intelligence Copyright ©2010 eMarketer, Inc . All rights reserved. November2010 Executive Summary: Canadaboastssomeofthehighestinternetpenetrationandsocialnetworking usageratesintheworld.Socialnetworkusersviewsocialmediaastheironlinehome—ahubfor communication,entertainmentandinformation. 121176 Canadiansreadilyadoptsocialnetworkactivities,oftenatrates higherthanusersintheUS,butgainingthetrustofusersona socialnetworkisabrandmanager’sbiggestobstacle. AsCanadianusershavegrownmorefamiliarwithsocialmedia, theyhavealsobecomemoreacceptingofadvertisinginthe space.Incorporatingstrategiesthatinvolvesocialmediaintothe everydayhabitsofuserscandriveengagement,benetingboth thebrandandsocialnetwork. Key Questions ■ HowmanypeopleinCanadausesocialmedia? ■ WhatarethedemographicsofsocialmediausersinCanada? ■ HowmuchtimeareCanadiansspendingwithsocialmedia? ■ Howdousersinteractwithbrandsonsocialmedia? ■ Whatarebestpracticesforsocialmediamarketing? The eMarketer View 2 Canada Internet User and Online Ad Refresher 2 Social Media Usage 3 Engaging Consumers with Social Media 6 Looking Ahead 9 Conclusions 9 Endnotes 10 Related Information and Links 11 millions and % of internet users Social Network Users in Canada, 2008-2014 2008 11.4 (46%) 2009 13.6 (54%) 2010 15.1 (59%) 2011 16.1 (62%) 2012 16.9 (64%) 2013 17.7 (66%) 2014 18.4 (68%) Note: social network sites include sites where social networking is the primary activity (e.g., Facebook, MySpace, LinkedIn), social network sites linked to portals such as Google and niche social network sites devoted to a specific hobby or interest Source: eMarketer, Oct 2010 121176 www.eMarketer.com Mike Froggatt [email protected] Canada Social Media Marketing

Welcome message from author
This document is posted to help you gain knowledge. Please leave a comment to let me know what you think about it! Share it to your friends and learn new things together.
Transcript

8/3/2019 Canada Social Media Marketing
http://slidepdf.com/reader/full/canada-social-media-marketing 1/11
®Digital Intelligence Copyright ©2010 eMarketer, Inc. All rights reserved
November2010
Executive Summary: Canadaboastssomeofthehighestinternetpenetrationandsocialnetworking
usageratesintheworld.Socialnetworkusersviewsocialmediaastheironlinehome—ahubfor
communication,entertainmentandinformation.
121176
Canadiansreadilyadoptsocialnetworkactivities,oftenatrateshigherthanusersintheUS,butgainingthetrustofusersona
socialnetworkisabrandmanager’sbiggestobstacle.
AsCanadianusershavegrownmorefamiliarwithsocialmedia,
theyhavealsobecomemoreacceptingofadvertisinginthe
space.Incorporatingstrategiesthatinvolvesocialmediaintothe
everydayhabitsofuserscandriveengagement,benetingboth
thebrandandsocialnetwork.
Key Questions
■ HowmanypeopleinCanadausesocialmedia?
■ WhatarethedemographicsofsocialmediausersinCanada?
■ HowmuchtimeareCanadiansspendingwithsocialmedia?
■ Howdousersinteractwithbrandsonsocialmedia?
■ Whatarebestpracticesforsocialmediamarketing?
The eMarketer View 2
Canada Internet User and Online Ad Refresher 2
Social Media Usage 3
Engaging Consumers with Social Media 6
Looking Ahead 9
Conclusions 9
Endnotes 10
Related Information and Links 11
millions and % of internet usersSocial Network Users in Canada, 2008-2014
2008
11.4(46%)
2009
13.6(54%)
2010
15.1(59%)
2011
16.1(62%)
2012
16.9(64%)
2013
17.7(66%)
2014
18.4(68%)
Note: social network sites include sites where social networking is the primary activity (e.g., Facebook, MySpace, LinkedIn), social network siteslinked to portals such as Google and niche social network sites devoted to a specific hobby or interest Source: eMarketer, Oct 2010
121176 www.eMarketer.com
Mike Froggatt [email protected]
Canada Social MediaMarketing

8/3/2019 Canada Social Media Marketing
http://slidepdf.com/reader/full/canada-social-media-marketing 2/11
Canada Social Media Marketing 2®
The eMarketer View
121483
Key eMarketer Numbers: Canada Social Media
27.1 million Internet users in 2014, up from 25.7 million in 2010
18.4 million Social network users in 2014, up from 15.1 millionin 2010
68% Social network users % of internet users in 2014,up from 59% in 2010
$3.69 billion Online ad spending* in 2014, up from $2.11 billion
in 2010Note: *in Canadian dollars
Source: eMarketer, Nov 2010
Canada boasts one of the most mature online
markets in the world.Canadianinternetusersin2010will
total25.7millionandby2014riseto27.1million,nearly78%
ofthetotalpopulation.Onlineadspendingin2010willreach
CAD2.11billion($1.85billion)andby2014willincreaseto
CAD3.69billion($3.24billion),morethan27%oftotal
mediaspending.
A majority of internet users in Canada are on social
networks.In2010,eMarketerestimatedthat59%ofinternetusersusedasocialnetworkatleastonceamonth,agure
settoriseto68%by2014.Theseincludeusersonprimary
socialnetworkslikeFacebook,MySpaceandLinkedInaswell
asportal-linkedsocialnetworksandnichesitesforspecic
interestgroups.
Social network users are beginning to expect and
appreciate targeted ads, but brands have to tread
carefully.AccordingtoasurveybyTrendstream,32%of
internetusersagreedthattargetedadvertisingimproved
theiropinionofabrand.WhileVisionCriticalfoundthat77%
ofinternetuserswereconcernedwithprivacyonsocial
networks,advertiserawarenessandregulationchangeswill
helptoaddressconcerns.Facebook,forexample,promisedto
implementenhancedprivacyprotectionsafterconcernswere
raisedbyCanada’sprivacycommissioner.
Social media marketing is an essential tool for
online brand managers.Asinternetusersincreasethe
timetheyspendonsocialnetworks,socialmediaaccounts
foranincreasingshareofadimpressions.Pricesremainlow
becauseofabundantinventory,butincreasingbudgetsand
competitionforinventorywilldrivepricesupinthefuture.As
aresult,nowisthetimeforbrandmanagerstotestnewsocial
mediacampaignsonusers.
Canada Internet User and OnlineAd Refresher
InternetusageinCanadahasreacheda
saturationpoint.eMarketerestimatesthat25.7
millionpeoplewillgoonlineatleastoncea
monthin2010,foratotalpenetrationof75.9%.
Growthwillremaingradualandtherewillbe27.1
millionusersand77.9%penetrationby2014.
121118
millions and % of populationInternet Users and Penetration in Canada, 2008-2014
2008
24.7(74.5%)
2009
25.2(75.2%)
2010
25.7(75.9%)
2011
26.0(76.5%)
2012
26.4(77.0%)
2013
26.8(77.5%)
2014
27.1(77.9%)
Note: an internet user is a person of any age who uses the internet from any location at least once per month Source: eMarketer, Oct 2010
121118 www.eMarketer.com
Bycomparison,internetpenetrationintheUSwas71.2%
in2010.

8/3/2019 Canada Social Media Marketing
http://slidepdf.com/reader/full/canada-social-media-marketing 3/11
Canada Social Media Marketing 3®
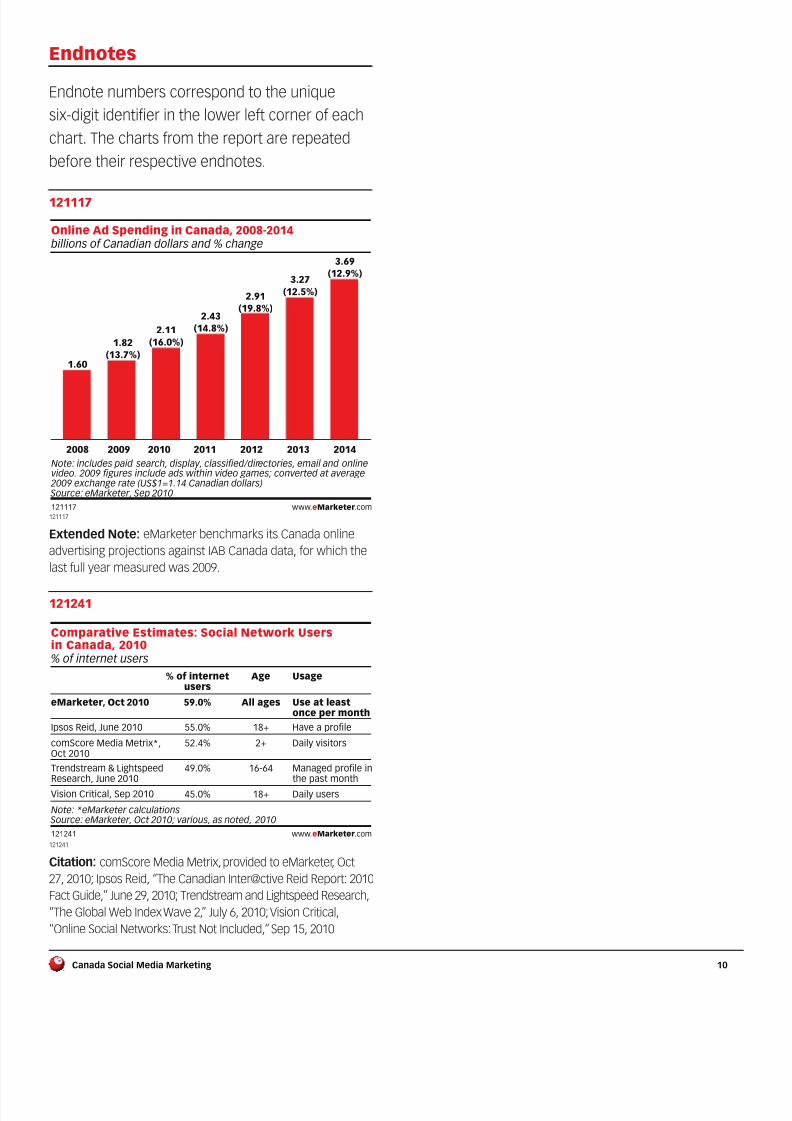
OnlineadvertisinginCanadahasgrownatdouble-digitrates,
rising13.7%in2009.Thatgrowthwillcontinuethrough2014.
121117
billions of Canadian dollars and % changeOnline Ad Spending in Canada, 2008-2014
2008
1.60
2009
1.82
(13.7%)
2010
2.11(16.0%)
2011
2.43
(14.8%)
2012
2.91
(19.8%)
2013
3.27
(12.5%)
2014
3.69
(12.9%)
Note: includes paid search, display, classified/directories, email and onlinevideo. 2009 figures include ads within video games; converted at average 2009 exchange rate (US$1=1.14 Canadian dollars) Source: eMarketer, Sep 2010
121117 www.eMarketer.com
For additional information on this chart, see the Endnotes section.
Totalonlineadspendingisexpectedtomorethandoublefrom
CAD1.82billion($1.60billion)in2009toCAD3.69billion($3.24
billion)in2014,acompoundannualgrowthrateof15.2%.
Bycomparison,onlineadspendingCAGRduringthesame
periodintheUSwillbelowerat9.8%.
For more inormation on internet usage and onlinemarketing in Canada, see eMarketer’s October 2010report “Canada Advertising and the Online Consumer.”
Social Media Usage
AmajorityofinternetusersinCanadahave
alreadytakentosocialnetworks.eMarketer
estimatesthat59%ofallCanadianinternetusers
and44.8%ofthetotalCanadianpopulationare
onsocialnetworksin2010.Morethanhalfofthe
totalpopulation,53%,isexpectedtobeactiveon
socialnetworksby2014.
121176
millions and % of internet usersSocial Network Users in Canada, 2008-2014
2008
11.4(46%)
2009
13.6(54%)
2010
15.1(59%)
2011
16.1(62%)
2012
16.9(64%)
2013
17.7(66%)
2014
18.4(68%)
Note: social network sites include sites where social networking is the primary activity (e.g., Facebook, MySpace, LinkedIn), social network siteslinked to portals such as Google and niche social network sites devoted to a specific hobby or interest Source: eMarketer, Oct 2010
121176 www.eMarketer.com
Thenumberofpeoplevisitingsocialnetworksatleastoncea
monthis15.1millionin2010,risingto18.4millionin2014.
AnIpsosReidsurveyofCanadiansshowedthat55%ofonline
adultsages18andolderhadasocialnetworkprole.Similarly,
comScoreMediaMetrixfound52.4%ofinternetusershad
visitedasocialnetworkdailyinSeptember2010.
121241
% of internet users
Comparative Estimates: Social Network Usersin Canada, 2010
eMarketer, Oct 2010
Ipsos Reid, June 2010
comScore Media Metrix*,Oct 2010
Trendstream & LightspeedResearch, June 2010
Vision Critical, Sep 2010
% of internetusers
59.0%
55.0%
52.4%
49.0%
45.0%
Age
All ages
18+
2+
16-64
18+
Usage
Use at leastonce per month
Have a profile
Daily visitors
Managed profile inthe past month
Daily users
Note: *eMarketer calculations Source: eMarketer, Oct 2010; various, as noted, 2010
121241 www.eMarketer.com
For additional information on this chart, see the Endnotes section.
8/3/2019 Canada Social Media Marketing
http://slidepdf.com/reader/full/canada-social-media-marketing 4/11
Canada Social Media Marketing 4®
TrendstreamandVisionCriticalreported49%and45%,
respectively,ofinternetuserssurveyedwereonsocialnetworks.
comScoreestimatedmonthlyvisitorstosocialnetworking
websiteshadapenetrationrateof95%.comScore’spanel
datameasuresanyonewhovisitsasocialnetworkdomain,
notnecessarilyactualusersofthesite,whichiswhy
eMarketerincludeddailyvisitorsinitscomparativeestimate
insteadofthemonthlygures.
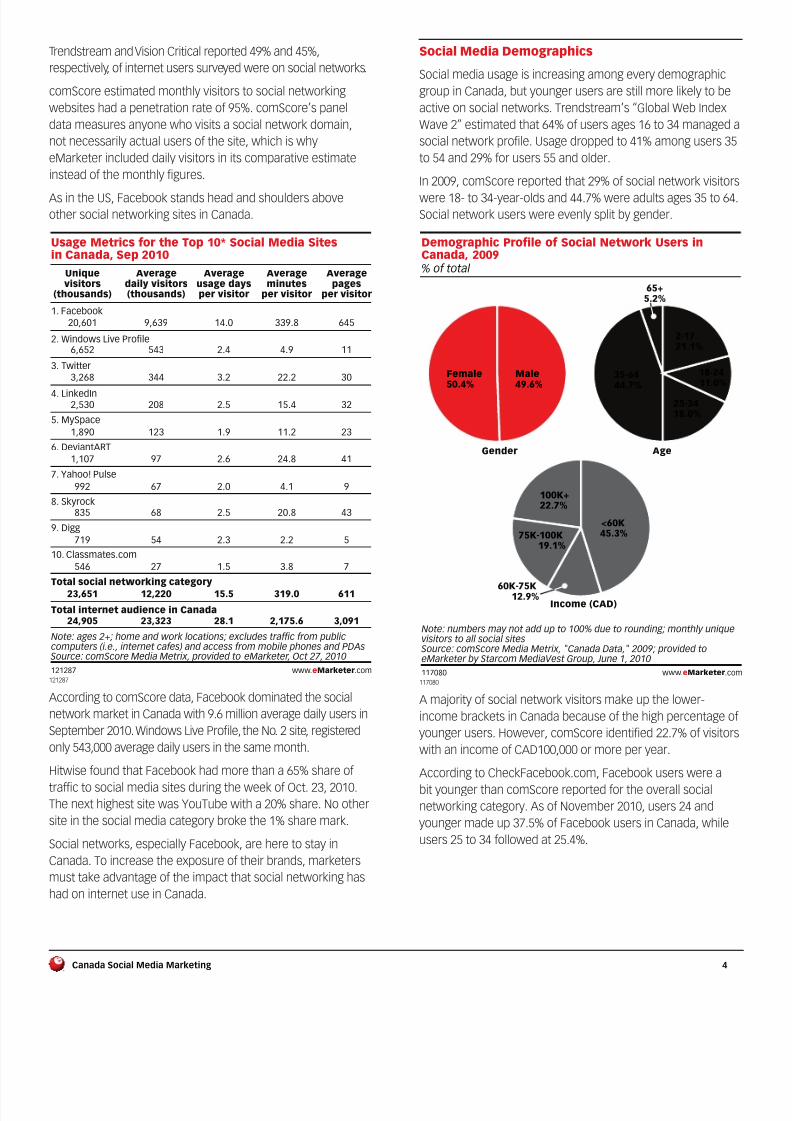
AsintheUS,FacebookstandsheadandshouldersaboveothersocialnetworkingsitesinCanada.
121287
Usage Metrics for the Top 10* Social Media Sitesin Canada, Sep 2010
1. Facebook
2. Windows Live Profile
3. Twitter
4. LinkedIn
5. MySpace
6. DeviantART
7. Yahoo! Pulse
8. Skyrock
9. Digg
10. Classmates.com
Total social networking category
Total internet audience in Canada
Uniquevisitors
(thousands)
20,601
6,652
3,268
2,530
1,890
1,107
992
835
719
546
23,651
24,905
Averagedaily visitors(thousands)
9,639
543
344
208
123
97
67
68
54
27
12,220
23,323
Averageusage daysper visitor
14.0
2.4
3.2
2.5
1.9
2.6
2.0
2.5
2.3
1.5
15.5
28.1
Averageminutes
per visitor
339.8
4.9
22.2
15.4
11.2
24.8
4.1
20.8
2.2
3.8
319.0
2,175.6
Averagepages
per visitor
645
11
30
32
23
41
9
43
5
7
611
3,091
Note: ages 2+; home and work locations; excludes traffic from publiccomputers (i.e., internet cafes) and access from mobile phones and PDAs Source: comScore Media Metrix, provided to eMarketer, Oct 27, 2010
121287 www.eMarketer.com
AccordingtocomScoredata,Facebookdominatedthesocial
networkmarketinCanadawith9.6millionaveragedailyusersin
September2010.WindowsLiveProle,theNo.2site,registered
only543,000averagedailyusersinthesamemonth.
HitwisefoundthatFacebookhadmorethana65%shareof
trafctosocialmediasitesduringtheweekofOct.23,2010.ThenexthighestsitewasYouTubewitha20%share.Noother
siteinthesocialmediacategorybrokethe1%sharemark.
Socialnetworks,especiallyFacebook,areheretostayin
Canada.Toincreasetheexposureoftheirbrands,marketers
musttakeadvantageoftheimpactthatsocialnetworkinghas
hadoninternetuseinCanada.
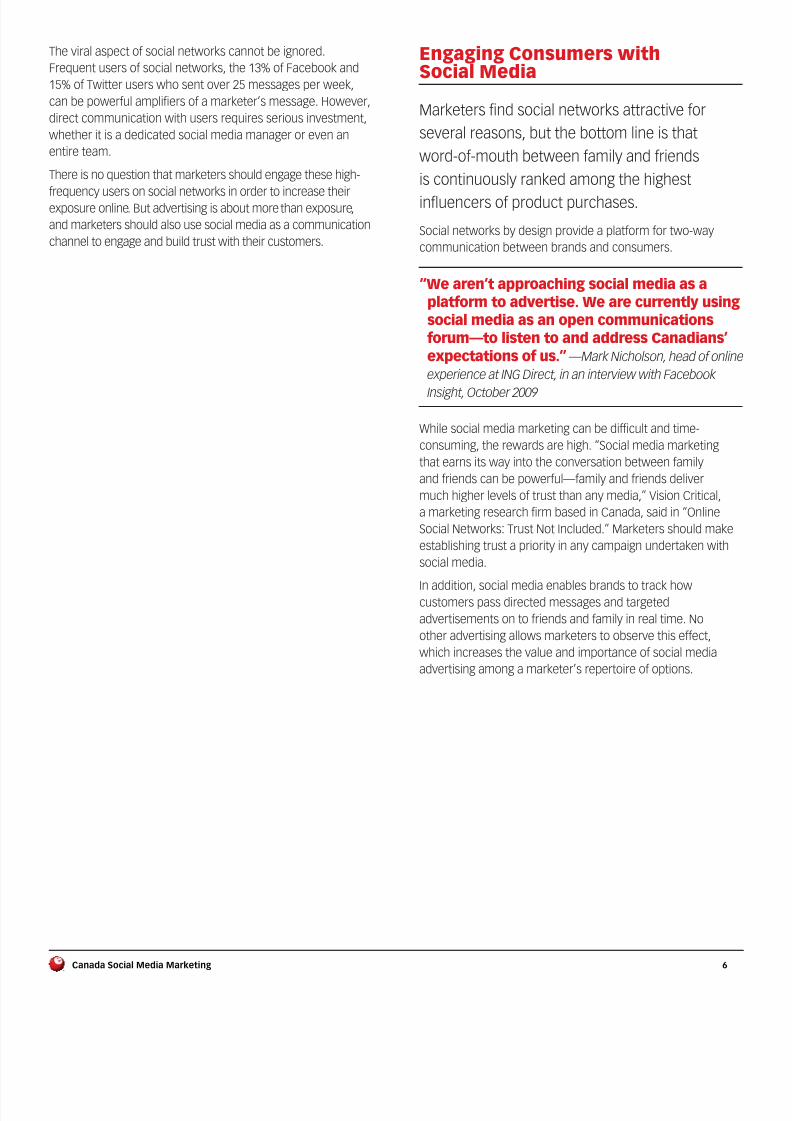
Social Media Demographics
Socialmediausageisincreasingamongeverydemographic
groupinCanada,butyoungerusersarestillmorelikelytobe
activeonsocialnetworks.Trendstream’s“GlobalWebIndex
Wave2”estimatedthat64%ofusersages16to34manageda
socialnetworkprole.Usagedroppedto41%amongusers35
to54and29%forusers55andolder.
In2009,comScorereportedthat29%ofsocialnetworkvisitors
were18-to34-year-oldsand44.7%wereadultsages35to64.Socialnetworkuserswereevenlysplitbygender.
117080
% of total
Demographic Profile of Social Network Users inCanada, 2009
Note: numbers may not add up to 100% due to rounding; monthly uniquevisitors to all social sites Source: comScore Media Metrix, "Canada Data," 2009; provided toeMarketer by Starcom MediaVest Group, June 1, 2010
117080 www.eMarketer.com
65+5.2%
Gender Age
Income (CAD)
Male49.6%
Female50.4%
2-1721.1%
18-2411.0%
25-3418.0%
35-6444.7%
<60K45.3%
60K-75K12.9%
75K-100K19.1%
100K+22.7%
Amajorityofsocialnetworkvisitorsmakeupthelower-
incomebracketsinCanadabecauseofthehighpercentageof
youngerusers.However,comScoreidentied22.7%ofvisitors
withanincomeofCAD100,000ormoreperyear.
AccordingtoCheckFacebook.com,Facebookuserswerea
bityoungerthancomScorereportedfortheoverallsocial
networkingcategory.AsofNovember2010,users24and
youngermadeup37.5%ofFacebookusersinCanada,while
users25to34followedat25.4%.

8/3/2019 Canada Social Media Marketing
http://slidepdf.com/reader/full/canada-social-media-marketing 5/11
Canada Social Media Marketing 5®
Socialnetworksusersoftenprovidedemographicdatawhile
signingup,offeringawealthofinformationnotavailable
anywhereelse.Inmostcases,networksoffertoolstohelp
marketerstargetadsbasedonthatdata.Effectivetargeting
canoftenmakethedifferencewhenitcomestoconsumers
relatingto—andultimatelypurchasing—productsorservices
featuredinads.
Time Spent on Social Networks
comScorefoundthattheaverageuserspent5.3hourson
socialnetworkingsitesduringSeptember2010.Facebook
usagecameinslightlyhigher,averaging5.6hoursperuser.
Accordingtoitsreport,“The2009CanadaDigitalYearin
Review,”internetusersinCanadaledtheworldwithan
averageof40socialnetworkingsitevisitspermonth.Engaging
thiscaptiveaudienceshouldbehighonthelistofanyonline
marketer’splaninCanada.
AnAccenturesurveyshowedthatfrom2008to2009,
employedmillennialinternetusers(ages18to27)spent
moretimeonsocialnetworkingwebsitesthancomScore’s
September2010dataindicated,at2hoursperweek,alittle
over8hourspermonth.
121917
hours
Time Spent Using Social Media Tools per Week byMillennial* Internet Users in Canada, 2008-2009
Social network sites 2.0
Virtual communities0.4
Blogging or Twitter0.2
Note: *ages 18-27, employed Source: Accenture, "Jumping the Boundaries of Corporate IT: AccentureGlobal Research on Millennials' Use of Technology," Feb 10, 2010
121917 www.eMarketer.com
Addingintimespentonvirtualcommunities,blogsand
microblogslikeTwitter,Acccenturefoundthatmillennialsin
Canadaspent2.6hoursperweek,ormorethan10hoursper
month,onsocialmedia.
Inits“ConsumerologyReport:TechnologyandCanadian
Consumers,”BensimonByrnereportedthat24%ofFacebook
usersages18to34spendatleast1hourdailyonthesite,
comparedwithonly15%ofallusers.
120043
% of respondents
Facebook Users* in Canada, by Age & Gender, Nov2009
Gender
Female 16%
Male 13%
Age
18-34 24%
35-54 13%
55+ 7%
Total 15%
Note: *used for 1+ hours yesterday Source: Bensimon Byrne, "Consumerology Report: Technology andCanadian Consumers" conducted by The Gandalf Group, Jan 1, 2010
120043 www.eMarketer.com
IpsosReidreportedthatFacebookuserssentanaverageof
15.7messagesaweek,and13%sentmorethan25.
121687
% of internet users
Average Number of Emails/Messages Sent Weekly viaTwitter or Facebook in Canada, Q1 2010
0
4%
17%
1
9%
15%
2
14%
14%
3
13%
11%
4-5
21%
12%
6-10
15%
8%
11-25
13%
7%
25+
13%
15%
Facebook Twitter
Note: numbers may not add up to 100% due to rounding; average number of messages sent on Facebook=15.7 and Twitter=11.5 Source: Ipsos Reid, "Ipsos Interactive Reid Report" as cited in press release,
June 29, 2010121687 www.eMarketer.com
IpsosReid’ssampleofTwitteruserswassmallerandless
activethanitssampleofFacebookusers,butfrequent
tweeterscarriedthelaggards.Consideringthat78%ofTwitter
userstweeted10orfewertimesweekly,the15%thatdid
tweetfrequentlyboostedtheaverageto11.5tweetsaweek.
8/3/2019 Canada Social Media Marketing
http://slidepdf.com/reader/full/canada-social-media-marketing 6/11
Canada Social Media Marketing 6®
Theviralaspectofsocialnetworkscannotbeignored.
Frequentusersofsocialnetworks,the13%ofFacebookand
15%ofTwitteruserswhosentover25messagesperweek,
canbepowerfulampliersofamarketer’smessage.However,
directcommunicationwithusersrequiresseriousinvestment,
whetheritisadedicatedsocialmediamanagerorevenan
entireteam.
Thereisnoquestionthatmarketersshouldengagethesehigh-
frequencyusersonsocialnetworksinordertoincreasetheirexposureonline.Butadvertisingisaboutmorethanexposure,
andmarketersshouldalsousesocialmediaasacommunication
channeltoengageandbuildtrustwiththeircustomers.
Engaging Consumers withSocial Media
Marketersndsocialnetworksattractivefor
severalreasons,butthebottomlineisthat
word-of-mouthbetweenfamilyandfriends
iscontinuouslyrankedamongthehighest
inuencersofproductpurchases.
Socialnetworksbydesignprovideaplatformfortwo-way
communicationbetweenbrandsandconsumers.
“We aren’t approaching social media as aplatform to advertise. We are currently usingsocial media as an open communicationsforum—to listen to and address Canadians’
expectations of us.” —Mark Nicholson, head of online
experience at ING Direct, in an interview with Facebook
Insight, October 2009
Whilesocialmediamarketingcanbedifcultandtime-
consuming,therewardsarehigh.“Socialmediamarketing
thatearnsitswayintotheconversationbetweenfamily
andfriendscanbepowerful—familyandfriendsdeliver
muchhigherlevelsoftrustthananymedia,”VisionCritical,
amarketingresearchrmbasedinCanada,saidin“Online
SocialNetworks:TrustNotIncluded.”Marketersshouldmake
establishingtrustapriorityinanycampaignundertakenwith
socialmedia.
Inaddition,socialmediaenablesbrandstotrackhowcustomerspassdirectedmessagesandtargeted
advertisementsontofriendsandfamilyinrealtime.No
otheradvertisingallowsmarketerstoobservethiseffect,
whichincreasesthevalueandimportanceofsocialmedia
advertisingamongamarketer’srepertoireofoptions.
8/3/2019 Canada Social Media Marketing
http://slidepdf.com/reader/full/canada-social-media-marketing 7/11
Canada Social Media Marketing 7®
InitsreportcoveringCanada,theUKandtheUS,VisionCritical
foundthatgainingconsumertrustthroughonlinesocial
networkscannotbetakenforgranted.InCanada,only10%of
consumerstrustedsocialnetworksand4%trustedforums,
blogs,reviewsandchatrooms.
121780
% of respondents
Consumers in Canada Who Trust Select Media, by Age,March 2010
18-34 35-54 55+ Total
Broadcast radio 45% 56% 49% 50%
Print newspapers 47% 48% 38% 45%
Online news 34% 43% 34% 38%
TV 28% 40% 41% 37%
Print magazines 32% 33% 22% 29%
Online social networks 11% 12% 6% 10%
Online forums, blogs, reviews or chat rooms 5% 4% 2% 4%
Note: respondents who say the medium is "completely" or "very trustworthy" Source: Vision Critical, "Online Social Networks: Trust Not Included," Sep15, 2010
121780 www.eMarketer.com
Thegoodnewsisthatthe18-to34-year-oldswereslightlymore
likelytotrustsocialmediasources:11%trustedsocialnetworksand5%trustedforums,blogs,reviewsorchatrooms.
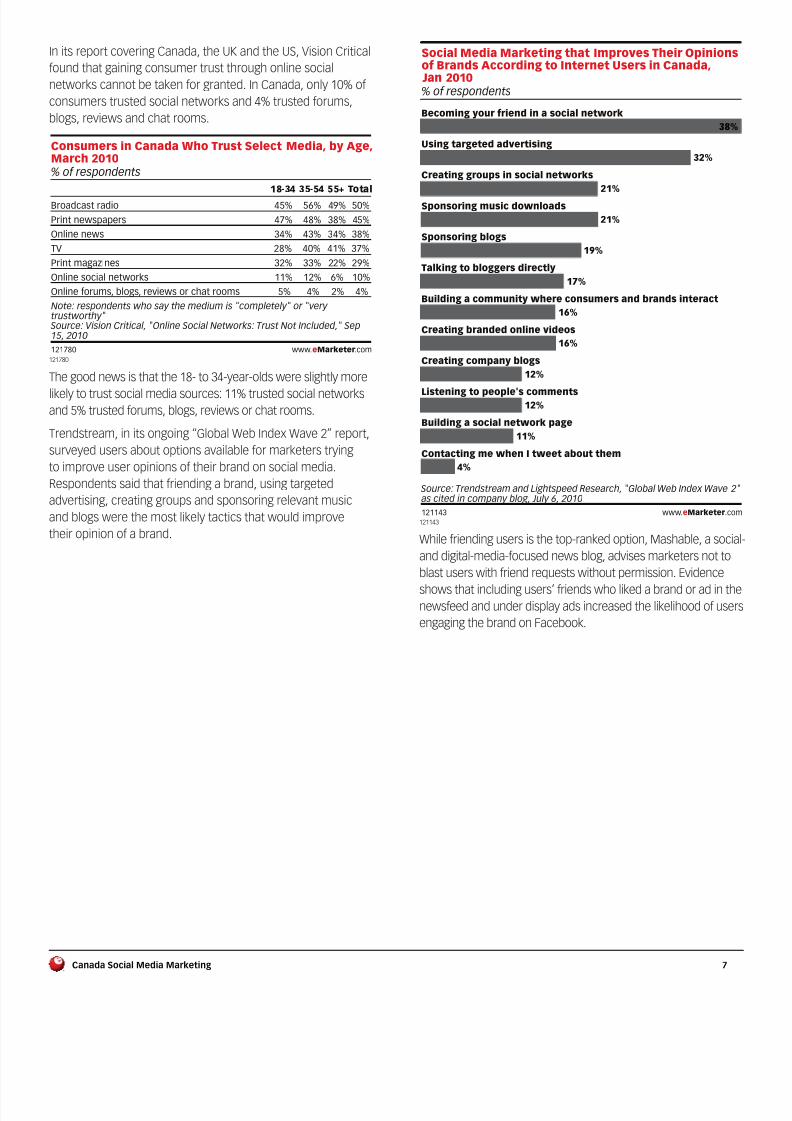
Trendstream,initsongoing“GlobalWebIndexWave2”report,
surveyedusersaboutoptionsavailableformarketerstrying
toimproveuseropinionsoftheirbrandonsocialmedia.
Respondentssaidthatfriendingabrand,usingtargeted
advertising,creatinggroupsandsponsoringrelevantmusic
andblogswerethemostlikelytacticsthatwouldimprove
theiropinionofabrand.121143
% of respondents
Social Media Marketing that Improves Their Opinionsof Brands According to Internet Users in Canada, Jan 2010
Becoming your friend in a social network
38%
Using targeted advertising
32%
Creating groups in social networks
21%
Sponsoring music downloads
21%
Sponsoring blogs
19%
Talking to bloggers directly
17%
Building a community where consumers and brands interact
16%
Creating branded online videos
16%
Creating company blogs
12%
Listening to people's comments12%
Building a social network page
11%
Contacting me when I tweet about them
4%
Source: Trendstream and Lightspeed Research, "Global Web Index Wave 2" as cited in company blog, July 6, 2010
121143 www.eMarketer.com
Whilefriendingusersisthetop-rankedoption,Mashable,asocia
anddigital-media-focusednewsblog,advisesmarketersnotto
blastuserswithfriendrequestswithoutpermission.Evidence
showsthatincludingusers’friendswholikedabrandoradinthenewsfeedandunderdisplayadsincreasedthelikelihoodofusers
engagingthebrandonFacebook.

8/3/2019 Canada Social Media Marketing
http://slidepdf.com/reader/full/canada-social-media-marketing 8/11
Canada Social Media Marketing 8®
Engagementincreasesasusersbecomemorefamiliarwith
socialnetworksasawhole.VisionCriticalreportedthat54%
ofuserswhovisitedsocialnetworksdailythoughtthatonline
socialnetworksweregoodplacesforbrandstoadvertiseto
consumers,comparedwith43%oftotalconsumers.Another
35%ofdailysocialnetworkuserssaidtheyenjoyedbrand
informationthatwaspushedtothemthroughtheirnetwork.
121400
% of respondents
Attitude Toward Brand/Product Info on Social Media
According to Daily Social Media Users vs. TotalConsumers in Canada, March 2010
Online social networks are good places for brands/products toadvertise to consumers
54%
43%
I enjoy learning about brands/products via online socialnetworks
35%
25%
I am able to make more informed purchase decisions because of online social networks
24%
19%I have purchased a product because of something I saw on anonline social network
19%
13%
Visit social networks daily Total consumers
Note: n=1,011 ages 18+ Source: Vision Critical, "Online Social Networks: Trust Not Included," Sep15, 2010
121400 www.eMarketer.com
Acrosstheboard,dailysocialnetworkusersweremore
receptivetobrandsonsocialnetworks.Thehighdegreeof
engagementpositivelyaffectscustomers’viewsofbrands
onthesites.Thiscanbeharnessedtoincreaseabrand’s
presenceonlineandultimatelyincreasesales.
Brandmarketingcampaignsthatengagetheircustomersand
encouragedailyusearegoingtobemoresuccessfulwith
theirsocialmediaefforts.Socialmediamarketingeffortsthat
increasethefrequencyofuserinteractionaredoublyeffective:
Usersbecomemorefamiliarwithsocialmediaandbrandsat
thesametime.
Spotlight: Facebook Best Practices
Facebook is the dominant social network in Canada.
Marketers have several options to engage their targets onthe social network through its many eatures.
The March 2010 ICOM report “The Infuencer: A ConsumerVoice with Legs” ound that 56% o internet users in Canadahad a Facebook account. However, just 12% o internetusers read about brands on Facebook and 6% addedcontent to a brand’s Facebook page.
Mashable recommends integrating “Like” buttons into abrand’s website and email campaigns. Brands can even goas ar as sponsorships or running contests or users that
“Like” a brand. The possibilities are essentially limitless aslong as the creative element is there to connect with theirtargets. Mashable also recommends taking advantage o new eatures on Facebook:
■ Groups, or building potential online reviews, eventsand live chats with customers.
■ Questions, or posing questions to users who have“Liked” a brand.
■ Places, specically or brands that can use Facebook in
physical locations.Many brands in Canada have already implementedcampaigns on Facebook with great success. Telus, oneo Canada’s largest mobile providers, successully tiedtogether cause marketing with social media. In September2010, Telus pledged to donate $200,000 to the “Go Pink”campaign to help local health organizations purchasedigital mammography equipment i they achieved 500,000Facebook “Likes.” By November 2010, Telus had more than502,000 “Likes” o its Facebook page.
Telus combined the power o a compelling cause andsocial networking to gain measurable value rom brandrecognition on Facebook.
Another example comes rom Molson Canadian, whichextended its “Made From Canada” promotion with the “Seizethe Summer” campaign in June 2010. Customers were drivento the brewery’s Facebook page through TV, online ads andpromotional product inserts. Conceived by agency CP+BCanada, the campaign implemented a Facebook applicationthat awarded users with badges or activities.
Facebook users could receive a “Super AwesomenessBadge” by completing specic tasks. In order to receivethe badges on their page, users had to veriy completiono tasks using a photo, riend conrmation or GPS tagging.Oten the badges included Canada-specic elements o humor or adventure that would appeal to the targeted
demographic o young beer drinkers. Two examples thatexempliy the creative were “Cooked meat over re” and“Saw a whale” badges.
“It’s really an opportunity to put our consumer at the centero our campaign.”—John Francis, brand manager at Molson Canadian, asquoted in Marketing Magazine, July 19, 2010
Completing a specic task entered users into weeklycontests or prizes like trips to Canadian Football Leaguegames and music estivals. At the beginning o thecampaign, Molson Canadian had nearly 370,000 Facebook“Likes.” According to Marketing Magazine, by July 2010,they reached 404,000 and by November were over 437,000.

8/3/2019 Canada Social Media Marketing
http://slidepdf.com/reader/full/canada-social-media-marketing 9/11
Canada Social Media Marketing 9®
Looking Ahead
Socialmediaadvertisingisheretostay.
Econsultancy,inits“SocialMediaandOnline
PRReport2010,”foundthat73%ofcompanies
surveyedworldwideincreasedbudgetallocation
forsocialmediain2010.Only3%decreasedthe
amount.Another83%ofcompaniesexpectedto
increasespendingin2011.
eMarketerestimateddisplayspendingatCAD698million($612
million)in2010,agurethatwillrisetooverCAD1billionby
2014.Accordingtothe“2009CanadaDigitalYearinReview”
reportfromcomScore,conversationalmediaaccountedfor
nearly25%ofalldisplaymediaimpressionsfortheentireyear.
Fortunatelyforthriftymarketers,socialmediaimpressions
remainrelativelycheapandtotalshareofimpressionswillnot
equaltheshareofspendinganytimeinthenearfuture.But
conversationalmedia’sshareofdisplayimpressionswillgrow
withtheincreaseinusersandtimespent.Associalnetwork
penetrationreachessaturation,inventorymaybecome
limited,causingpricestorise.
Fornow,guresforsocialnetworkusersfaroutpacethatof
spendingandpriceswillremaindepressed.Thetimetotest
newcreativeandsocialmediamarketinginCanadaisnow,
whilethecostisnotprohibitive.
However,keepinmindthatcreative,compellingcontent
remainsessential.MitchJoel,frequentbloggerandfounder
ofTwistImage,amediaandmarketingrmbasedinCanada,
highlightsthemostimportantassetofsocialmedia,theability
totellstoriesthatconnectwithyourcustomers.“Thebigidea
here,”saidJoel,“isthatifyourbrandiscompellingenough—
andiftheprizeisworthyenough—customersarenotonly
willingtocreatecompelling(andbranded)content,butthey’re
alsowillingtotellandsharetheirstorieswithanybodyand
everybodythey’reconnectedto.”
Conclusions
Social networks are where to nd the users.
Canadahassomeofthehighestinternetpenetrationand
saturationofsocialnetworkingusageintheworld.Acrossall
demographics,socialmediaactsasconsumers’onlinehome
andaplacewheretheygoforcommunication,entertainment
andinformation.Inaddition,alloftheusercontributeddata
canbetargetedthroughtoolsprovidedbysocialnetworks,
likeFacebookAd,creatinganindispensabletoolforany
marketer’smix.
Trust is essential for word-of-mouth.Gainingthetrust
ofsocialnetworkusersisabrand’sbiggestobstacle.Once
trustisgained,userscanspreadbrandcampaignsinstantlyto
theirentireonlinenetworks.Butbrandshavetobecarefulnot
tooverstepuser’strust;afull77%ofinternetuserssurveyed
byVisionCriticallistedprivacyasamajorconcern.
Daily users are more engaged with brands. Asusers
becomemoreaccustomedtovisitingsocialnetworksdaily,they
alsobecomemoreacceptingofbrandsthere.Savvymarketersshouldusesocialnetworkstointegratebrandsintothedaily
onlinelivesofcustomersandincreaseoverallexposureand
word-of-mouth,leadingtomoreinteractionandsales.
Abundant ad inventory is keeping prices low.Display
adsonsocialnetworksareinexpensive,butthereturnon
investmentfromcreatingcompellingcontent,engagingin
communicationwithcustomersandtellingrelevantstories
canleadtomeasureableresults.Whilepricesarelow,nowis
thetimeformarketerstoexperimentandndtherightmixof
display,sponsorshipsandcausemarketingtoimplementon
socialmedia.
8/3/2019 Canada Social Media Marketing
http://slidepdf.com/reader/full/canada-social-media-marketing 10/11
Canada Social Media Marketing 10®
Endnotes
Endnotenumberscorrespondtotheunique
six-digitidentierinthelowerleftcornerofeach
chart.Thechartsfromthereportarerepeated
beforetheirrespectiveendnotes.
121117
121117
billions of Canadian dollars and % changeOnline Ad Spending in Canada, 2008-2014
2008
1.60
2009
1.82
(13.7%)
2010
2.11
(16.0%)
2011
2.43
(14.8%)
2012
2.91
(19.8%)
2013
3.27
(12.5%)
2014
3.69
(12.9%)
Note: includes paid search, display, classified/directories, email and onlinevideo. 2009 figures include ads within video games; converted at average 2009 exchange rate (US$1=1.14 Canadian dollars) Source: eMarketer, Sep 2010
121117 www.eMarketer.com
Extended Note:eMarketerbenchmarksitsCanadaonline
advertisingprojectionsagainstIABCanadadata,forwhichthe
lastfullyearmeasuredwas2009.
121241
121241
% of internet users
Comparative Estimates: Social Network Usersin Canada, 2010
eMarketer, Oct 2010
Ipsos Reid, June 2010
comScore Media Metrix*,Oct 2010
Trendstream & LightspeedResearch, June 2010
Vision Critical, Sep 2010
% of internetusers
59.0%
55.0%
52.4%
49.0%
45.0%
Age
All ages
18+
2+
16-64
18+
Usage
Use at leastonce per month
Have a profile
Daily visitors
Managed profile inthe past month
Daily users
Note: *eMarketer calculations Source: eMarketer, Oct 2010; various, as noted, 2010
121241 www.eMarketer.com
Citation:comScoreMediaMetrix,providedtoeMarketer,Oct
27,2010;IpsosReid,“TheCanadianInter@ctiveReidReport:2010
FactGuide,”June29,2010;TrendstreamandLightspeedResearch,
“TheGlobalWebIndexWave2,”July6,2010;VisionCritical,
“OnlineSocialNetworks:TrustNotIncluded,”Sep15,2010
8/3/2019 Canada Social Media Marketing
http://slidepdf.com/reader/full/canada-social-media-marketing 11/11
Canada Social Media Marketing 11®
Related Information and Links
comScore
http://www.comscore.com
ICOM, a division o Epsilon Targeting
http://www.epsilon.com
Ipsos Reid
http://www.ipsos-na.com
Trendstream
http://www.trendstream.net
Vision Critical
http://www.visioncritical.com
Contact
eMarketer,Inc. Toll-Free:800-405-084475BroadStreet OutsidetheUS:212-763-6010Floor31 Fax:212-763-6020NewYork,NY10004 [email protected]
Editorial and Production ContributorsSusanReiter ManagingEditorDanielMcMahon SeniorCopyEditorMegProssnitz EditorialAssistantDanaHill ProductionManagerJoanneDiCamillo ProductionArtistStephanieGehrsitz ProductionArtistAllisonSmith DirectorofChartsAlisonBerge ChartEditorElissaHunter EditorChrisMcNinch ChartDataSpecialist
About eMarketer
eMarketerisabusinessserviceunlikeany
other.eMarketerdoesnotconductresearch.
Itaggregatesandanalyzesalltheavailable
research,surveysanddataonagiventopic.So
youseefarmorethanasinglesourcecould
everprovide.eMarketerdoesn’tdeliverone
pointofview—itgivesyouthousands.Providing
overviewsandinsightsavailablenowhereelse,
eMarketerreportsonthereports,analyzesthe
analystsanddissectsthedata.
A Trusted Resource
eMarketerservesasatrusted,third-partyresource,cutting
throughtheclutterandhype–helpingbusinessesmake
senseofthenumbersandtrends.eMarketer’sproductsandserviceshelpcompaniesmakebetter,moreinformed
businessdecisionsby
■ Streamliningresearchsourcesandreducingcosts
■ Eliminatingcriticaldatagaps
■ Providinganobjective,bird’s-eyeviewoftheentirelandscape
■ Betterdeployingandsharinginformationacrossthecompany
■ Buildingsolidbusinesscasesbackedupbyharddata
■ Reducingbusinessrisk
■ Savingvaluabletime
To learn more about subscriptions to eMarketer,call 800-405-0844 (outside the U.S. and Canada,call 001-212-763-6010), or email [email protected].
Related Documents