ISSN: 2306-9007 Cates, Cojanu & Pettine (2013) 1025 Can You Lead Effectively? An Analysis of the Leadership Styles of Four Generations of American Employees STEVEN V. CATES Professor at Kaplan University USA Email: [email protected] Tel: +3366239274 KEVIN A. COJANU Professor at Kaplan University USA Email: [email protected] Tel:+7723407201 SUSAN PETTINE Professor at Kaplan University USA Email: [email protected] Abstract The main purpose of this research is to determine the preferred leadership style(s) of the different generations of workers in the U.S. A sample population of 328 respondents in all four generations responded to 8 questions posed in a Survey conducted online using working adults taking a course in a graduate school. Responses indicate that preferred leadership styles differ significantly among the four generations. It is further noted that the greater the difference is in age groups the more significant the difference in leadership behavioral preferences. This is significant for managers in order for them to adapt their leadership styles for the specific generation of employee to be managed to gain the highest level of motivation and job performance. Key Words: Leadership, Employee Generation, Traditionalists, Boomers, Generation” x”, generation” y”. Introduction In today’s workforce, there are now four distinct generations of employees that must partner and work together. The current workforce includes Veterans, referred to as Matures or traditionalists (age 66+), Baby Boomers (age 47-65), Generation X (age 32-46), and Generation Y, also referred to as Millenials (age 18-31). It’s important to note that these age groups can vary slightly according to the researcher involved. However, these are the age groups that we are focusing on for this particular study. It is critical that organizations should understand the management preference styles for each of these generations so that it may harness the true potential of its workforce and maintain a competitive edge. The ability to provide good leadership training is key to a healthy organization. But a more productive and forward-thinking company must recognize that being able to understand leadership preferences by generation and then training to match the style as appropriate will provide these organizations with a true competitive advantage. It is important to recognize that generations of employees are molded by the times in which they came of age (Bennis & Thomas, 2002). Conger (1997) stated that each generational time period has a "distinct wind or character" (Hesselbein, Goldsmith, & Beckhard (Eds), 1997). Matures, or Veterans, have a respect for authority and a sense of duty and honor (Hammill, 2005; and Brown, 2003). Baby Boomers are typically described as “workaholics” who derive fulfillment from their jobs (Hammill, 2005; Brown, I www.irmbrjournal.com December 2013 International Review of Management and Business Research Vol. 2 Issue.4 R M B R

Welcome message from author
This document is posted to help you gain knowledge. Please leave a comment to let me know what you think about it! Share it to your friends and learn new things together.
Transcript
ISSN: 2306-9007 Cates, Cojanu & Pettine (2013)
1025
Can You Lead Effectively? An Analysis of the Leadership
Styles of Four Generations of American Employees
STEVEN V. CATES Professor at Kaplan University USA
Email: [email protected]
Tel: +3366239274
KEVIN A. COJANU Professor at Kaplan University USA
Email: [email protected]
Tel:+7723407201
SUSAN PETTINE Professor at Kaplan University USA
Email: [email protected]
Abstract
The main purpose of this research is to determine the preferred leadership style(s) of the different
generations of workers in the U.S. A sample population of 328 respondents in all four generations
responded to 8 questions posed in a Survey conducted online using working adults taking a course in a
graduate school. Responses indicate that preferred leadership styles differ significantly among the four
generations. It is further noted that the greater the difference is in age groups the more significant the
difference in leadership behavioral preferences. This is significant for managers in order for them to adapt
their leadership styles for the specific generation of employee to be managed to gain the highest level of
motivation and job performance.
Key Words: Leadership, Employee Generation, Traditionalists, Boomers, Generation” x”, generation” y”.
Introduction
In today’s workforce, there are now four distinct generations of employees that must partner and work
together. The current workforce includes Veterans, referred to as Matures or traditionalists (age 66+),
Baby Boomers (age 47-65), Generation X (age 32-46), and Generation Y, also referred to as Millenials (age
18-31). It’s important to note that these age groups can vary slightly according to the researcher involved.
However, these are the age groups that we are focusing on for this particular study. It is critical that
organizations should understand the management preference styles for each of these generations so that it
may harness the true potential of its workforce and maintain a competitive edge. The ability to provide
good leadership training is key to a healthy organization. But a more productive and forward-thinking
company must recognize that being able to understand leadership preferences by generation and then
training to match the style as appropriate will provide these organizations with a true competitive
advantage. It is important to recognize that generations of employees are molded by the times in which they
came of age (Bennis & Thomas, 2002). Conger (1997) stated that each generational time period has a
"distinct wind or character" (Hesselbein, Goldsmith, & Beckhard (Eds), 1997). Matures, or Veterans, have
a respect for authority and a sense of duty and honor (Hammill, 2005; and Brown, 2003). Baby Boomers
are typically described as “workaholics” who derive fulfillment from their jobs (Hammill, 2005; Brown,
I
www.irmbrjournal.com December 2013
International Review of Management and Business Research Vol. 2 Issue.4
R M B R

ISSN: 2306-9007 Cates, Cojanu & Pettine (2013)
1026
2003). Generation X is the first workforce generation to have a comfort level with technology are self-
reliant, and skeptical of other generational values (Hammill, 2005; Brown, 2003). Generation Y, or
Millenials, are entrepreneurial, able to easily multitask, and prefer immediate feedback and response
(Hammill, 2005; Brown, 2003).
Ultimately, different generations in the workforce may have the same basic values; however, they do
express these differently from each other. According to Deal (2007), much of the intergenerational
struggles seen in the workplace have to do with a struggle for power based on these values Deal ( 2007).
Typically, one generation will have more of the power, and the other will struggle against it using values as
a basis. Therefore, it is vital for productive organizations to recognize this and the need to better
understand how to effectively utilize leadership styles to effectively engage the different generations in the
workforce (Pitt-Catsouphes &Matz-Costa, 2009). “In any human group, the leader has maximum power to
sway everyone’s emotions” (Goleman, Boyatzis, & McGee, 2004).
The differences among these generational groups are examined with regard to leadership style preferences.
Providing a clearer understanding of these leadership preferences, will help to delineate the types of styles
to be utilized with the appropriate generation in the workplace. Such targeted leadership style usage will
help to develop more effective communication, provide a more productive workflow, and facilitate
intergenerational trust building in the workplace.
Literature Review Background of This Study
The four generations in the workplace are represented in Figure 1 (Sprague, 2008). Baby Boomers and
Generation Y, or Millenials, are the two largest groups. Figure 2 provides a representation of past, current,
and future shifts in the labor composition among the different generations (Sprague, 2008).
Figure 1
Four Generations in the Workplace
Source: (Sprague, 2008)
I
www.irmbrjournal.com December 2013
International Review of Management and Business Research Vol. 2 Issue.4
R M B R

ISSN: 2306-9007 Cates, Cojanu & Pettine (2013)
1027
Figure 2
Shifts in the Labor Force Composition
Source: Sprague (2008)
Characteristics of the Four Generation
Veteran Generation
The Veterans, also known as Matures or Traditionalists, are sometimes referred to as the “silent
generation”. They were born between 1928 and 1945. Much of this generation grew up during World War
II, and was influenced by the calls for sacrifice and duty for their country at the time. The oldest members
of this generation came up during the aftermath of the Depression (Scheef & Thielfoldt, 2008). This was
also a time of sacrifice and struggle. The Veterans are characterized by a respect for authority, an
acceptance of conformity, and a reliance on discipline (Hammill, 2005). Many of the Veterans do not
possess a formal educational background, and instead,, worked to climb the corporate ladder based on
experience (Scheef & Thielfoldt, 2008).
Veterans view work as an obligation; however, it’s important to note that the term obligation is not a
negative for this generation. The perceived leadership style that is preferred is one of command and
control, and one that is comprised of specific directives (Hammill, 2005). This reflects the era in which
they came up. The post-Depression years and the years during World War II were ones that were filled
with directives from the government that citizens felt were a call to duty for honor and country.
Veterans typically have a more individual work style (Hammill, 2005). This represents a preference to be
self-reliant. These workers are engaged by challenging work where they feel they are making a difference
in the organization. Even though the Veterans typically did not have access to computers and technology at
the starting or up until mid-points of their careers, many still have a positive view of technology (Scheef &
Thielfoldt, 2005).
I
www.irmbrjournal.com December 2013
International Review of Management and Business Research Vol. 2 Issue.4
R M B R

ISSN: 2306-9007 Cates, Cojanu & Pettine (2013)
1028
This generation responds well to more formal communication methods, such as a typed memo distributed
to their desk, or to a face-to-face office meeting. They do not require frequent and effusive feedback on
their work. They derive a satisfaction from a job that’s well done. They are effectively engaged when they
feel that their experience is valued (Pitt-Catsouphes &Matz-Costa, 2009).. And when it comes to jobs and
family, in the mind of a Veteran, they are two separate entities (Hammill, 2005).
Baby Boomer Generation
The Baby Boomers were born between 1946 and 1964. This was a time of complex changes. Some of this
generation grew up in the post World War II boom years of prosperity. But then there was the advent of
the Korean War and the Vietnam War. Then there were the Kennedy and King assassinations, the era of
Woodstock and the sexual revolution, and even the Watergate scandal (Wallace, 2006). It was a time of
much change and flux. Dittman noted that “every generation is influenced by its period’s economic,
political and social events” (2005, ¶3). There were great demands put on family providers in these
turbulent times; therefore, Baby Boomers typically value work and the fulfillment that it can provide.
Baby Boomers view work as an exciting adventure. The perceived leadership style that is preferred is one
that is collegial and seeks a consensus from those involved. There’s the feeling that everyone is important
and can make a valued contribution. This reflects the era in which they grew up. In the fast-changing era
of the Baby Boomers, information and input became valuable commodities. The advent of more
availability of televisions in homes and the input of more new programs provided this generation with a
value for input and contribution to the knowledge base. As such, Baby Boomers can be utilized as mentors
in organizations (Lindenberger & Stoltz-Loike, n.d.).
Baby Boomers usually have an interactive team player style in the workplace (Hammill, 2005). This
represents the desire to be providing more input into the whole of the team. The Baby Boomers desire to
have more influence on the operations of the workplace. There is an identity that they find in the jobs.
They seek to be acknowledged for their hard work and prefer, mostly, that this comes in the form of a
monetary acknowledgement (Rau-Foster, 2000). Additionally, many Baby Boomers may not have had
access to computers and technology early on in their careers; however, most have had access by mid-level
in their careers at the latest. Therefore, there are more comfort levels with technology in this generation.
This generation responds well to a participatory communication style. This includes face-to-face meetings,
teleconferences, and virtual meetings. However, the preferred method for communication is usually face-
to-face. Baby Boomers appreciate monetary rewards and titles as recognition for their hard work. They do
not require frequent feedback on their work. The feedback they do receive should include the message that
they are valued in the organization as this is a motivator for them. And when it comes to jobs and family,
Baby Boomers do not always seek balance. Instead they work to live (Hammill, 2005).
Generation X
Generation Xers were born between 1965 and 1979. This era was characterized by changes in the various
social movements (civil rights, feminism), the advent of more televisions (multiple sets) in more homes,
computerized games and access to more technology, as well as great political changes, such as the fall of
the Soviet Union and the virtual domination of American economic power (Bennis & Thomas, 2002). This
generation is characterized by a focus on self-reliance, but also a need for structure and direction.
Generation Xers can be skeptical of the world around them as well. They would often prefer to do things
their own way and jettison any rules they feel are unnecessary (Hammill, 2005).
Generation Xers view work as contractual, and a difficult challenge. As managers, they do not view
themselves as simply the boss, as Baby Boomers do, but rather as part of the whole team. They are
participatory, yet will exercise authority when necessary. The perceived leadership style that is preferred is
I
www.irmbrjournal.com December 2013
International Review of Management and Business Research Vol. 2 Issue.4
R M B R
ISSN: 2306-9007 Cates, Cojanu & Pettine (2013)
1029
one where everyone is treated the same and where everyone is in this together. Generation Xers will often
challenge others in order to ask what they view is the important question: Why (Hammill, 2005). As a
generation that came up with access to even more available information on a global level, the need to know
and understand “Why” is important to them. This is not a need for challenge alone. Instead, it is a way to
provide a solid foundation that they feel comfortable to work from.
This generation typically displays a more entrepreneurial work style (Hammill, 2005). This represents their
desire to do things their own way and move forward. This generation has had more access to computers
and technology than the Veterans and Baby Boomers, so they will more easily acclimate to technological
changes. Generation Xers embraced and drove the advent of the dot-com boom; therefore, their work with
technology puts them at ease (Gordinier, 2008).
Members of Generation X respond well to straightforward and candid communications (Sheef and
Thielfoldt, n.d.; Raines, 1997). Since they have a more informal communication style and a need for
structure, communications can be face-to-face, telephonic, or virtual. As long as the structure and candor is
there, the communication style will be appropriate. Direct and immediate feedback is something that
Generation Xers require. Having the freedom to continue in the manner that they see as most productive is
the best reward for these employees (Dittman, 2005). And when it comes to jobs and family, this
generation prefers a balance for both. They work and family life with equal importance and thus, expect a
balance of both (Hammill, 2005).
Generation Y
Generation Yers, also known as Millenials, were born after 1980. This era was characterized by power,
wealth, and prosperity. The American economic powered up after the fall of the Soviet Union and
continued on into the 1990’s when the dot-com boom took over. During this period the economy of the
United States became the envy of many other countries (London, 2005). Generation Yers experienced
respect and accommodation. They were also guided in this by their parents, and as such, they bring a
sense of entitlement to their workplace experiences (Sujansky, 2009). Additionally, their access to a
global view of the world provides them with a more socially aware outlook. They are more globally
conscious (Salkowitz, 2008). This generation is characterized by looking to what’s next, the idea of
multitasking, goal orientation, and tolerance (Hammill, 2005).
This generation views work a means to an end. They value a work environment that is fun and provides
opportunities for creative communication as well as recognition. They seek access to up-to-date
technology, career development opportunities, and workplace flexibility. The perceived leadership style
that is preferred is one where there is nurturing and appreciation for their work. Generation Yers will often
require more feedback and attention in order for them to feel the fulfillment that they require in their
workplace. That is not to say that they don’t enjoy challenges. Keeping meaningful challenges available
for Generation Yers is important (Sujansky, 2009). Some may characterize this generation as expecting to
have a good job experience and feeling entitled to having a manager that can cater to their employment
needs. This can often seem the case; however, with effective coaching, members of this generation can be
valuable employees that deliver superior service (Tulgan, 2009). Members of Generation Y typically have
a more participative work style (Hammill, 2005). This represents their desire to work with other creative
and bright people and to be energized by their work. This generation is quite adept at the use of computers
and technology as it has grown up with it. In fact, this generation can often seem consumed with
technology. They thrive on virtual connections with others via social networking. They are exceptionally
comfortable utilizing technology in their everyday lives. They view technology as way to make life easier
and to connect with friends and family (Taylor & Keeter, 2010).
Generation Yers respond well to communications via technology (Hammill, 2005). This is due to the
interconnectivity of technology in their everyday lives from an early age. Since members of this generation
enjoy interactions with others that they view as bright and collaborative, team engagements using virtual
I
www.irmbrjournal.com December 2013
International Review of Management and Business Research Vol. 2 Issue.4
R M B R
ISSN: 2306-9007 Cates, Cojanu & Pettine (2013)
1030
meeting arrangements can be quite beneficial. Additionally, since Generation Yers require a nurturing
environment, then communication should be frequent with positive notes touched upon first. In order for
them to be prepared to hear anything negative, they must have the right frame of mind by first hearing
something positive. Engaging with this generation to make improvements to work performance is best
when done in an environment that focuses on nurturing and appreciation. Members of this generation also
view work as just a piece of the puzzle of life. Family, friends, home life, recreational activities, and work
life are all part of the mix (Chester, 2002). But work is not the first and foremost consideration for this
generation. It is just one part of the mix (Tulgan, 2009).
Xxxx (Text in Times New Roman 10 Font, single spacing) In order to retain customer it is important to
satisfied them (Jhon 2013). The study of Sesmi (2013) shows that customer satisfaction is one of the most
important factors for consumer retention.
Research Question and Hypotheses Given the characteristics on the different generations of employees in the U.S., the following question is
posed for consideration: What is the most desired leadership style for each of the four generations of
workers in America today?
Given the above Research Question, the following hypotheses are posited for testing.
H1: There is no significant differences in desired leadership styles among the different work groups of U.S.
employees
H2: There is no significant difference in desired leadership styles between Generation Y (Milennials) and
Gen X’ers.
H3: There is no significant difference in desired leadership styles between Generation Y (Millennials) and
Baby Boomers.
H4: There is no significant difference in desired leadership styles between Generation X and Baby
Boomerss.
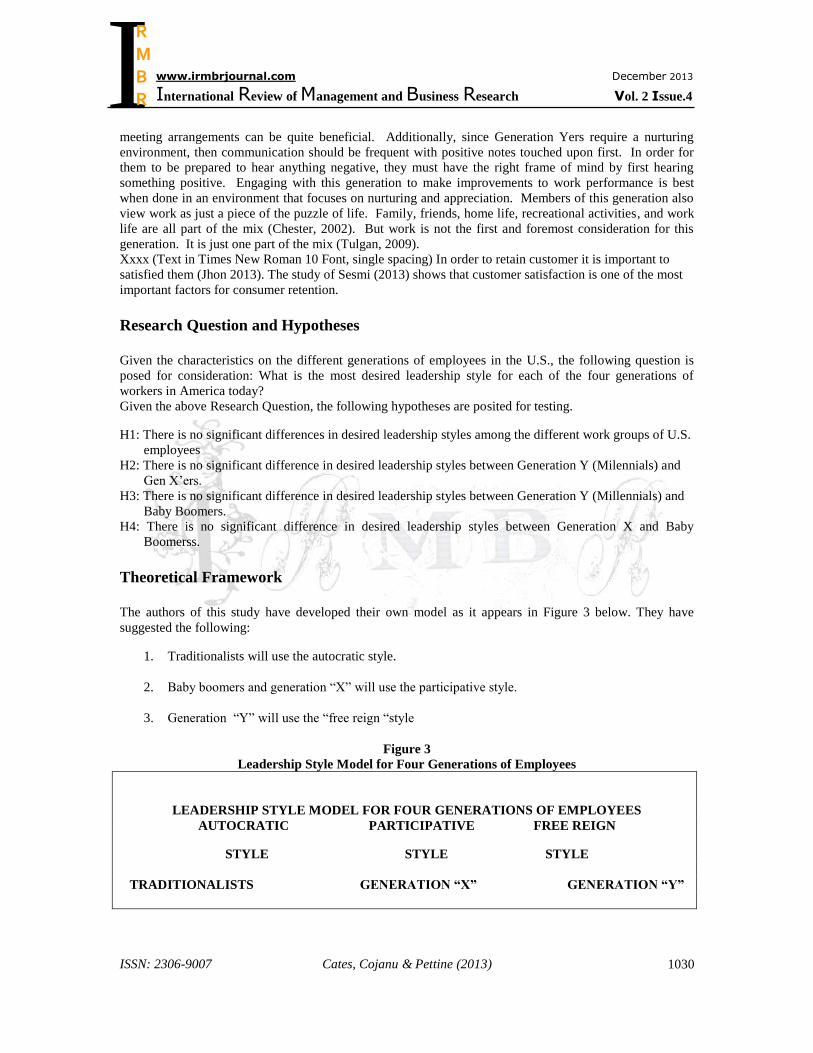
Theoretical Framework The authors of this study have developed their own model as it appears in Figure 3 below. They have
suggested the following:
1. Traditionalists will use the autocratic style.
2. Baby boomers and generation “X” will use the participative style.
3. Generation “Y” will use the “free reign “style
Figure 3
Leadership Style Model for Four Generations of Employees
LEADERSHIP STYLE MODEL FOR FOUR GENERATIONS OF EMPLOYEES
AUTOCRATIC PARTICIPATIVE FREE REIGN
STYLE STYLE STYLE
TRADITIONALISTS GENERATION “X” GENERATION “Y”
I
www.irmbrjournal.com December 2013
International Review of Management and Business Research Vol. 2 Issue.4
R M B R

ISSN: 2306-9007 Cates, Cojanu & Pettine (2013)
1031
Baby Boomers
Analysis Survey Instrument
A survey instrument consisting of eight questions taken from the literature (Allen, Drevs, & Ruhe, 1999;
Kleinman, 2004; Robbins, 1998; Spector, 1997; Yukl, 1998). A pilot study was undertaken with 49
subjects to determine the validity and reliability of the survey instrument. A chrombach alpha test was
administered to the results of the survey data and a reliability test of 8.87 was determined. Based on the
reliability of the results it was determined this survey would be a valid instrument for testing the remainder
of the subjects in this study. A copy of the utilized instrument is presented in Appendix 1.
Data Analysis
The respondents were asked to voluntarily complete the survey and were rewarded 2 points on their final
grade. Surveys were collected and data extracted, coded, and placed in a data spread sheet for input for
statistical analysis.
Table 1
Descriptive Statistics: Total Population of Survey Respondents.
I like a boss who watches
my every move.
I like a boss who is there
when I need them but
allows me freedom to
perform my duties
independently.
I prefer a boss who allows
me to be involved in the
decision making process
on issues that affect me
directly.
I prefer a boss who
inspires confidence and is
charismatic.
Mean 1.244 Mean 4.865 Mean 4.710 Mean 4.524
Standard Error 0.030 Standard Error 0.021 Standard Error 0.029 Standard Error 0.035
Median 1 Median 5 Median 5 Median 5
Mode 1 Mode 5 Mode 5 Mode 5
Standard Deviation 0.549 Standard Deviation 0.376 Standard Deviation 0.529 Standard Deviation 0.625
Sample Variance 0.301 Sample Variance 0.141 Sample Variance 0.280 Sample Variance 0.391
Kurtosis 10.715 Kurtosis 12.845 Kurtosis 7.426 Kurtosis 0.379
Skewness 2.851 Skewness -3.171 Skewness -2.153 Skewness -1.037
Range 4 Range 3 Range 4 Range 3
Minimum 1 Minimum 2 Minimum 1 Minimum 2
Maximum 5 Maximum 5 Maximum 5 Maximum 5
Sum 408 Sum 1591 Sum 1545 Sum 1484
Count 328 Count 327 Count 328 Count 328
Confidence Level(95.0%) 0.060 Confidence Level(95.0%) 0.041 Confidence Level(95.0%) 0.057 Confidence Level(95.0%) 0.068
Employee
Leader
Leader
Employee Given the
above Research
Question, the following
hypotheses are posited
for testing.
H1: There is no
significant differences in
desired leadership styles
among the different
work groups of U.S.
employees
H2: There is no
significant
difference in
desired leadership
styles between
Generation Y
(Milennials) and
Gen X’ers.
H3: There is no
significant
difference in
desired
leadership styles
between
Generation Y
(Millennials) and
Baby Boomers.
H4: There is no
significant
difference in
desired leadership
styles between
Generation X and
Baby Boomerss.
yee
Leader
Employee
I
www.irmbrjournal.com December 2013
International Review of Management and Business Research Vol. 2 Issue.4
R M B R
ISSN: 2306-9007 Cates, Cojanu & Pettine (2013)
1032
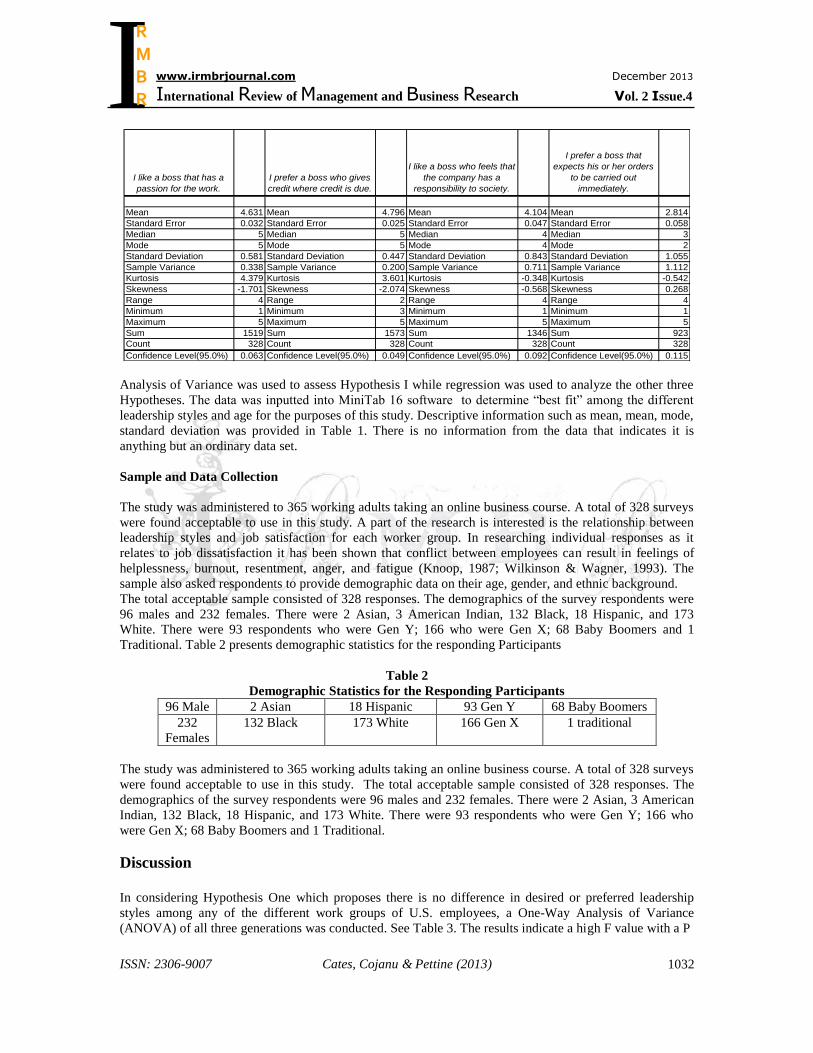
I like a boss that has a
passion for the work.
I prefer a boss who gives
credit where credit is due.
I like a boss who feels that
the company has a
responsibility to society.
I prefer a boss that
expects his or her orders
to be carried out
immediately.
Mean 4.631 Mean 4.796 Mean 4.104 Mean 2.814
Standard Error 0.032 Standard Error 0.025 Standard Error 0.047 Standard Error 0.058
Median 5 Median 5 Median 4 Median 3
Mode 5 Mode 5 Mode 4 Mode 2
Standard Deviation 0.581 Standard Deviation 0.447 Standard Deviation 0.843 Standard Deviation 1.055
Sample Variance 0.338 Sample Variance 0.200 Sample Variance 0.711 Sample Variance 1.112
Kurtosis 4.379 Kurtosis 3.601 Kurtosis -0.348 Kurtosis -0.542
Skewness -1.701 Skewness -2.074 Skewness -0.568 Skewness 0.268
Range 4 Range 2 Range 4 Range 4
Minimum 1 Minimum 3 Minimum 1 Minimum 1
Maximum 5 Maximum 5 Maximum 5 Maximum 5
Sum 1519 Sum 1573 Sum 1346 Sum 923
Count 328 Count 328 Count 328 Count 328
Confidence Level(95.0%) 0.063 Confidence Level(95.0%) 0.049 Confidence Level(95.0%) 0.092 Confidence Level(95.0%) 0.115
Analysis of Variance was used to assess Hypothesis I while regression was used to analyze the other three
Hypotheses. The data was inputted into MiniTab 16 software to determine “best fit” among the different
leadership styles and age for the purposes of this study. Descriptive information such as mean, mean, mode,
standard deviation was provided in Table 1. There is no information from the data that indicates it is
anything but an ordinary data set.
Sample and Data Collection
The study was administered to 365 working adults taking an online business course. A total of 328 surveys
were found acceptable to use in this study. A part of the research is interested is the relationship between
leadership styles and job satisfaction for each worker group. In researching individual responses as it
relates to job dissatisfaction it has been shown that conflict between employees can result in feelings of
helplessness, burnout, resentment, anger, and fatigue (Knoop, 1987; Wilkinson & Wagner, 1993). The
sample also asked respondents to provide demographic data on their age, gender, and ethnic background.
The total acceptable sample consisted of 328 responses. The demographics of the survey respondents were
96 males and 232 females. There were 2 Asian, 3 American Indian, 132 Black, 18 Hispanic, and 173
White. There were 93 respondents who were Gen Y; 166 who were Gen X; 68 Baby Boomers and 1
Traditional. Table 2 presents demographic statistics for the responding Participants
Table 2
Demographic Statistics for the Responding Participants
96 Male 2 Asian 18 Hispanic 93 Gen Y 68 Baby Boomers
232
Females
132 Black 173 White 166 Gen X 1 traditional
The study was administered to 365 working adults taking an online business course. A total of 328 surveys
were found acceptable to use in this study. The total acceptable sample consisted of 328 responses. The
demographics of the survey respondents were 96 males and 232 females. There were 2 Asian, 3 American
Indian, 132 Black, 18 Hispanic, and 173 White. There were 93 respondents who were Gen Y; 166 who
were Gen X; 68 Baby Boomers and 1 Traditional.
Discussion
In considering Hypothesis One which proposes there is no difference in desired or preferred leadership
styles among any of the different work groups of U.S. employees, a One-Way Analysis of Variance
(ANOVA) of all three generations was conducted. See Table 3. The results indicate a high F value with a P
I
www.irmbrjournal.com December 2013
International Review of Management and Business Research Vol. 2 Issue.4
R M B R

ISSN: 2306-9007 Cates, Cojanu & Pettine (2013)
1033
value of zero. This would indicate that the Null of Hypothesis One cannot be supported and that there is a
statistically significant difference between the management styles desired between the various generations.
Table 3
One-Way ANOVA : Leadership Styles for All Generations
In Table 5 a general regression analysis was performed to validate the findings in the ANOVA and the
negative T factor with a P of zero for Gen X and Gen Y confirmed the Null Hypothesis. This is supported
visually with the Plot of these statistical findings in Table 6. Notable was that while the regression analysis
did show that there was a statistical difference in the management style preferences between Gen X and the
Baby Boomers, they were closer than that of any other two together. Visually the Value Plot in Table 4
shows very clearly how different the three main generation of workers value different and distinct
leadership traits and characteristics.
Table 4
Individual Value Plot of Leadership Styles for all Generations
Gen YGen XBaby Boomers
5.0
4.5
4.0
3.5
3.0
2.5
Generation
Me
an
Individual Value Plot of Leadership Styles All Generations
I
www.irmbrjournal.com December 2013
International Review of Management and Business Research Vol. 2 Issue.4
R M B R

ISSN: 2306-9007 Cates, Cojanu & Pettine (2013)
1034
Table 5
General Regression Analysis: Mean vs. Generation
Table 6
One-Way Normal Analysis of Variance for Means
Gen YGen XBaby Boomers
4.3
4.2
4.1
4.0
3.9
3.8
3.7
Generation
Mean
3.9018
4.0172
3.9595
One-Way Normal ANOM for MeanAlpha = 0.05
Hypothesis Two proposes that there is no statistical difference in desired leadership styles between
Generation Y (Milennials) and Gen X’ers. In looking at the relationship between these two work groups
Generation Y indicates they prefer a boss who has passion for their work but also allows the employee but
who is also charismatic and inspires confidence. There is a very relationship that indicates these workers
admire a boss that is charismatic but also gives credit for employee performance. There is also strong
evidence which indicates leadership styles where leaders who have passion for their work but also give the
proper credit for performance are desired as leaders by Generation Y. Generation X indicates they prefer
leadership that has passion for their work but also includes the employee in the decision making process.
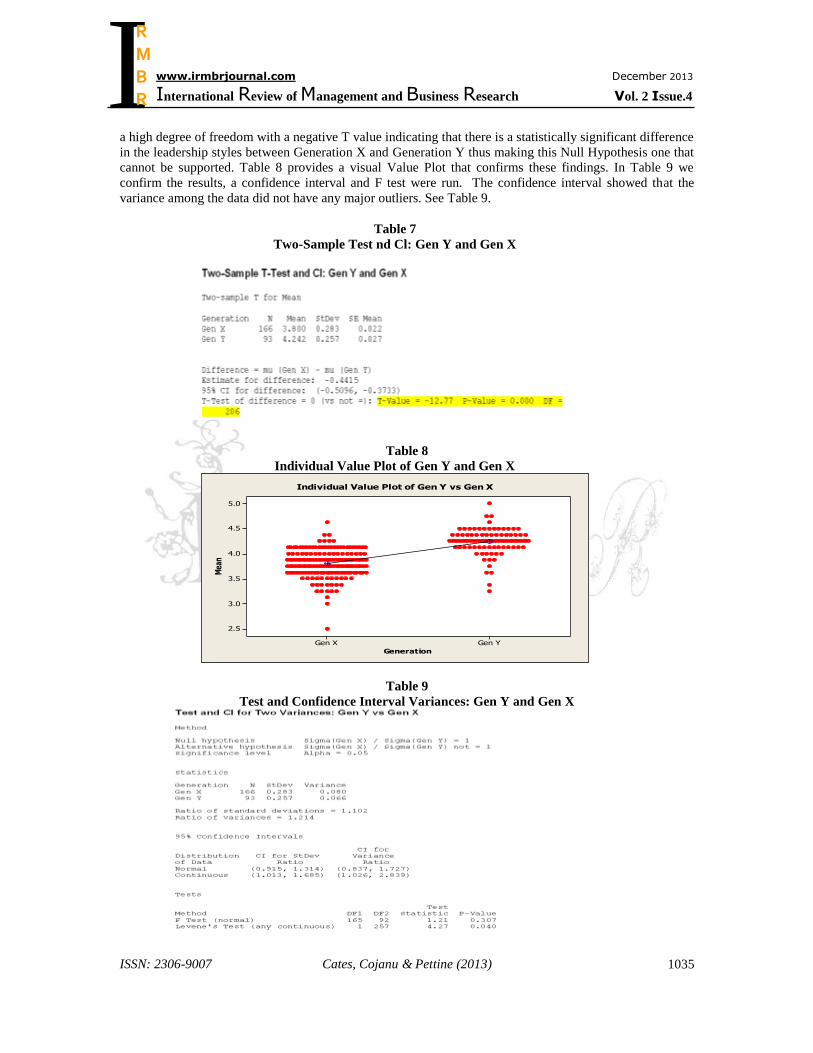
A Two Tail Sample T Test was run to determine if the two population means were equal to each other as
stated in the Null Hypothesis. In Table 7 we find the analysis indicates a t-value of -12.77 and a p-value of
0.00 with a Degrees of Freedom score of 206. Generation Y and Generation X shows a P value of zero and
I
www.irmbrjournal.com December 2013
International Review of Management and Business Research Vol. 2 Issue.4
R M B R
ISSN: 2306-9007 Cates, Cojanu & Pettine (2013)
1035
a high degree of freedom with a negative T value indicating that there is a statistically significant difference
in the leadership styles between Generation X and Generation Y thus making this Null Hypothesis one that
cannot be supported. Table 8 provides a visual Value Plot that confirms these findings. In Table 9 we
confirm the results, a confidence interval and F test were run. The confidence interval showed that the
variance among the data did not have any major outliers. See Table 9.
Table 7
Two-Sample Test nd Cl: Gen Y and Gen X
Table 8
Individual Value Plot of Gen Y and Gen X
Gen YGen X
5.0
4.5
4.0
3.5
3.0
2.5
Generation
Mea
n
Individual Value Plot of Gen Y vs Gen X
Table 9
Test and Confidence Interval Variances: Gen Y and Gen X
I
www.irmbrjournal.com December 2013
International Review of Management and Business Research Vol. 2 Issue.4
R M B R

ISSN: 2306-9007 Cates, Cojanu & Pettine (2013)
1036
Hypothesis Three proposes that there are no differences in leadership style preference between Generation
Y and Baby Boomers. The authors propose that the relationship of Generation Y and Leadership Style
indicates they prefer a boss who has passion for their work. The boss also allows the employee who is
charismatic and inspires confidence. It indicates these workers admire a boss that is charismatic but also
gives credit for employee performance which indicates leadership styles that leaders who have passion for
their work but also give the proper credit for performance are desired as leaders by Generation Y. Baby
Boomers that were surveyed preferred a leader who had passion for their work while allowing the
employee to be involved in the decision making process.
A Two Tail Sample T Test was run to determine if the two population means were equal to each other as
stated in the Null Hypothesis. In Table 9 we find the analysis indicates a t-value of -6.19 and a p-value of
0.00 with fairly significant degrees of freedom of 134. Generation Y and Baby Boomers shows a negative
t-value ; a P value of 0 and a moderate level of degree of freedom indicating that there is a statistically
significant difference in the leadership styles between Generation X and Generation Y thus making this
Null Hypothesis one that cannot be supported. See Table 10. In Table 11 it provides a visual Value Plot that
confirms these findings. In Table 12 we confirm the results, a confidence interval and F test were run. The
confidence interval showed that the variance among the data did not have any major outliers.
Table 10
Two Sample T Test and CI: Gen Y vs. Baby Boomers
Table 11
Individual Value Plot Gen Y vs. Baby Boomers
Gen YBaby Boomers
5.00
4.75
4.50
4.25
4.00
3.75
3.50
Generation
Me
an
Individual Value Plot of Gen Y vs Baby Boomer
I
www.irmbrjournal.com December 2013
International Review of Management and Business Research Vol. 2 Issue.4
R M B R

ISSN: 2306-9007 Cates, Cojanu & Pettine (2013)
1037
Hypothesis Four seeks to determine if there is any difference in desired leadership styles between
Generation X and Baby Boomers. We determined they prefer a boss who has passion for their work but
also allows the employee to contribute. They desire one who is also charismatic and inspires confidence.
These workers admire a boss that is charismatic but also gives credit for employee performance which
indicates leadership styles that leaders who have passion for their work but also give the proper credit for
performance are desired as leaders. In looking at the preferred leadership styles of the Baby Boomers
indicates these older workers do not prefer leaders who are micro managers. They are tolerant of all other
leadership styles which may come as a result of their long experiences of many different leadership styles
during their careers.
Table 12
Test and CI for Two Variances: Gen y vs. Baby Boomers
Table 13
Two Sample T-Test and CI: Generation X vs. Baby Boomers
Table 14
Individual Value Plot’ Gen X vs. Baby Boomers
Gen XBaby Boomers
5.0
4.5
4.0
3.5
3.0
Generation
Mea
n
Individual Value Plot of Gen X vs Baby Boomers
I
www.irmbrjournal.com December 2013
International Review of Management and Business Research Vol. 2 Issue.4
R M B R

ISSN: 2306-9007 Cates, Cojanu & Pettine (2013)
1038
Table 15
Test and CI: Gen X vs. Baby Boomers
Table 13 shows our statistical analysis where Generation X and Baby Boomers showed a P value of zero
and a high degree of freedom with a positive T value indicating that there is a statistically significant
difference in the leadership styles between Generation X and Baby Boomers. Therefore we cannot support
the fourth Null Hypothesis. This is confirmed visually in Table 14. Of all the comparison and statistics
comparing the different generations, it should be noted that Generation X and Baby Boomers did come the
closest in their management style preferences, while still statistically different. To confirm the results, a
confidence interval and F test were run. The confidence interval showed that the variance among the data
did not have any major outliers see Table 15.
Limitations of This Study
This research study has been conducted to examine the potential differences in preferred leadership styles
utilizing the different age groups of workers in U.S. organizations. The sample population is sufficient to
draw conclusions among all of these age groups with the exception of the Traditionalists where only 1
person reported. It should be noted however the random sample is heavily skewed towards young women
and this is partly due to the sampling technique of using working college students as a sample population. It
is supposed that due to the average demographic of the college population the sample would be older and
more diverse in gender. This proved not to be the case. It should be noted the respondents in this study
were employed in various jobs throughout the U.S. and demonstrated great demographic diversity. It is
suggested that further study be conducted using a variety of working adults including attracting a much
larger sample of workers older than 65 to insure representation of all age groups among the samples.
Implications for Management
One leadership style does not fit all. This research study clearly shows that leadership styles that are
preferred are different for each age class of working adult in the U.S. Managers need to be aware they
cannot have one management style and expect to get great results from all employees based on the results
of these findings. Management needs to consider the different age groups and adapt a management style
that is preferred by each age group to achieve maximum results in behavior, motivation, and performance
from their employees. Ignoring this will result in a disconnect with their employees and likely result in
dissatisfaction and high turnover from employees that cannot relate to their managers.
I
www.irmbrjournal.com December 2013
International Review of Management and Business Research Vol. 2 Issue.4
R M B R

ISSN: 2306-9007 Cates, Cojanu & Pettine (2013)
1039
Recommendations for Future Research
This study was conducted using working adults from diverse demographic and professional backgrounds.
One issue that became evident in this study when the sample was collected is the skewness in the
respondents. It is suggested further research be conducted with equal numbers of respondents based on age,
ethnic background and gender. This will allow for a reduction in variation of response due to a greater
proportion of one demographic group over another. One limitation that needs to be addressed is the lack of
Traditionalists in the sample. Having a representative sampling of these older workers would allow for
more rigorous examination of their preferred management style. It is suggested that future studies be
conducted in business environments where there is are employees of different age groups that can be
sampled in the same work environment. This will provided a greater opportunity to compare preferred
management styles under the same group of managers.
To determine the preferred leadership style of each working generation of American workers this study was
conducted by collecting data from working adults who attended a leading online university and were taking
graduate-level business courses. The results of this study conclude that each generation of workers has
different and distinct preferences when it comes to leadership styles. In fact, the further the age differences
the more pronounced the differences in styles preferred.
The importance of this study provides managers in all capacities with information that will allow them to
identify the generation of workers they lead and then to adapt a leadership style that is preferred by that
particular generation of worker. By doing so this will allow the employee to be motivated that will translate
into higher level of performance and better results for that leader and the organization.
Conclusion
The survey consisted of four generations, eight questions, with 328 samples taken from Traditionalists,
Baby Boomers, Generation X, and Generation Y. Due to the small sample size of Traditionalists, this data
was removed from the analysis. The correlation, regression, F test, ANOVA, and confidence interval
testing all showed that each of the three generations analyzed had statistically different management style
preferences thus making all four hypotheses null, rejecting them.
References Allen, W.R., Drevs, R.A., & Ruhe, J.A. (1999). Reasons why college educated women change
employment. Journal of Business and Psychology, 14 (1), 77-93. Armour, S. (2000, April 12).
Bennis, W.G., & Thomas, R.J. (2002). Geeks & geezers: How era, values, and defining moments shape
leaders. Boston: Harvard Business School Press.
Chester, E. (2002). Employing Generation Why? Lakewood, CO: Tucker House Books.
Conger, J.A. (1997). How generational shifts will transform organizational life. In F. Hesselbein, M.
Goldsmith, & R. Beckhard (Eds). The organization of the future. San Francisco: Jossey-Bass
Publishers.
Deal, J.J. (2007). Retiring the generation gap: How employees young and old can find common ground.
San Francisco, CA: John Wiley & Sons, Inc.
Dittmann, M. (2005). Generational differences at work. Monitor on Psychology, 36(6), p. 54.
I
www.irmbrjournal.com December 2013
International Review of Management and Business Research Vol. 2 Issue.4
R M B R

ISSN: 2306-9007 Cates, Cojanu & Pettine (2013)
1040
Goleman, D., Boyatzis, R., & McGee, A. (2004). Primal leadership: Learning to lead with emotional
intelligence. Boston, MA: Harvard Business School Press.
Gordinier, Jeff (2008). X saves the world. New York: Penguin Group.
Hammill, G. (2005). “Mixing and managing four generations of employees.” FDU Magazine Online.
Retrieved September 1, 2009, from www.fdu.edu/newspubs/magazine/05ws/generations.htm.
Kleinman, A.: Culture and Depression. New England Journal of Medicine: 351:10 September 2, 2004, pp.
951-953.
Knoop, R.; Organizational commitment and independence among Canadian managers, 1987, Industrial
Relations, 42.
Lindenberger, J., & Stoltz-Loike, M. (n.d.). Mentoring and Baby Boomers: Why mentor? Mentoring is a
strategic imperative. Retrieved from
http://humanresources.about.com/od/coachingmentoring/a/mentoring_boom.htm.
London, Paul A. (2005). The competition solution: The bipartisan secret behind American prosperity.
Washington, DC: AEI Press.
Marcie Pitt-Catsouphes and Christina Matz-Costa . (2009). Engaging the 21st century multigenerational
workforce: Findings from the Age & Generations Study.
http://agingandwork.bc.edu/documents/IB20_Engagement_2009-02-10.pdf.
Raines, C (1997). Generation X managing Generation X. Retrieved from
http://www.generationsatwork.com/articles/genx.htm.
Rau-Foster, M. (2000). It’s a whole new world: Is your management style up to date? Workplace Issues.
Retrieved from http://www.workplaceissues.com/ardiversity.htm.
Robbins, S.P (1998). Organization Theory: Structure, Design and Applications. New Jersey. Prentice-Hall
International Inc
Salkowitz, R. (2008). Generation blend. Hoboken, NJ: John Wiley & Sons, Inc.
Scheef, D., Thielfoldt, D. (2008). Engaging a changing workforce: Study of four generations. The
Learning Café and Career Systems International. Retrieved from
http://www.thelearningcafe.net/downloads/WhitePaper-EngagingChangingWorkforce.pdf.
Scheef, D., Thielfoldt, D. (2005). Engaging multiple generations among your workforce. The Learning
Café and Career Systems International. Retrieved from
http://www.thelearningcafe.net/_newsstand/articlesPage.php?Engaging-Multiple-Generations-
Among-Your-Workforce-6.
Scheef, D., Thielfoldt, D. (n.d.) What the generations want from their careers. Retrieved from
http://www.careersystemsintl.com/Word%20Files/What%20the%20Generations%20Want.doc.
Spector, P. E. (1997). Job satisfaction: Application, assessment, causes, and consequences. Thousand Oaks,
CA.: Sage
Sprague, C. (2008). The Silent Generation meets Generation Y: How to manage a four generation
workforce with panache. Talent Strategy, Human Capital Institute White Paper.
I
www.irmbrjournal.com December 2013
International Review of Management and Business Research Vol. 2 Issue.4
R M B R

ISSN: 2306-9007 Cates, Cojanu & Pettine (2013)
1041
Sujansky, J. G. (2009). Keeping the Millennials. Hoboken, NJ: John Wiley & Sons, Inc.
Taylor, P., & Keeter, S. (Eds.). (2010). Millenials: A portraying of Generation Next: Confident, connected,
open to change. Pew Research Center. Retrieved from
http://pewsocialtrends.org/assets/pdf/millennials-confident-connected-open-to-change.pdf.
Tulgan, B. (2009). Not everyone gets a trophy. San Francisco, CA: Jossey-Bass, Inc.
Wilkinson, A.D., & Wagner, R.M. (1993). Supervisory leadership styles and state vocational rehabilitation
counselor job satisfaction and productivity. Rehabilitation Counseling Bulletin, 37(1), 15 -24.
Yukl, G. (1998). Leadership in organizations (4th ed.). Upper Saddle River, NJ: Prentice Hall
Zemke, R., Raines, C., & Filipczak, B. (2000). Generations at work: Managing the clash of veterans,
boomers, Xers, and nexters in your workplace. New York: AMACOM.
Appendix I
Survey Questionnaire
Please read each of the following questions carefully. Please select the letter that most closely reflects your
actual response to that question. Please just highlight your response and then UNDERLINE it. Please be
honest with your responses. These responses will be held confidential and will not identify you in any way.
Thank you for responding to these questions. You will note your responses can be from Strongly Disagree
(SD), Disagree (D), Neutral (N), Agree (A), or Strongly Agree (SA). If you have no opinion, please select
the N for Neutral. Again, please just highlight your response and then UNDERLINE it.
Q1: I like a boss who watches my every move. SD D N A SA
Q2. I like a boss who is there when I need them but allows me freedom to perform my duties
independently. SD D N A SA
Q3. I prefer a boss who allows me to be involved in the decision making process on issues that affect me
directly. SD D N A SA
Q4. I prefer a boss who inspires confidence and is charismatic. SD D N A SA
Q5. I like a boss that has a passion for the work. SD D N A SA
Q6. I prefer a boss who gives credit where credit is due. SD D N A SA
Q7. I like a boss who feels that the company has a responsibility to society. SD D N A SA
Q8. I prefer a boss that expects his or her orders to be carried out immediately. SD D N A SA
Please select (underline) the age group that best represents you: Age 18-31 Age 32-46 Age 47-
65 Age 66+
Please select (underline) your gender: Female Male
Please select (underline) the race demographic group that best represents you: White/Caucasian
Black/African American American Indian Hawaiian/Pacific Islander Asian…..Hispanic
I
www.irmbrjournal.com December 2013
International Review of Management and Business Research Vol. 2 Issue.4
R M B R
Related Documents