Can wildfire serve as an ecohydrologic threshold-reversal mechanism on juniper-encroached shrublands C. Jason Williams, 1 * Frederick B. Pierson, 1 Osama Z. Al-Hamdan, 1,2 Patrick R. Kormos, 3 Stuart P. Hardegree 1 and Patrick E. Clark 1 1 Northwest Watershed Research Center, USDA Agricultural Research Service, Boise, ID 83712, USA 2 Department of Biological and Agricultural Engineering, University of Idaho, Moscow, ID 83844, USA 3 Department of Geosciences, Boise State University, Boise, ID 83725, USA ABSTRACT Woody plant encroachment on water-limited lands can induce a shift from biotic (plant)-controlled resource retention to abiotic (physical)-driven losses of critical soil resources. The biotic-to-abiotic shift occurs where encroachment propagates connectivity of runoff processes and amplified cross-scale erosion that, in-turn, promote ecohydrologic resilience of the post-encroachment community. We investigated these relationships for woodland-encroached sagebrush steppe in the Great Basin, USA, and evaluated wildfire as a mechanism to reverse the post-encroachment soil erosion feedback. We measured vegetation, soil properties, and runoff/ erosion from experimental plots on burned and unburned areas of a late-succession woodland 1 and 2 years post-fire. Our findings suggest that the biotic-to-abiotic shift and amplified cross-scale erosion occur where encroachment-induced bare ground exceeds 50–60% and bare gaps between plant bases frequently extend beyond 1 m. The trigger for amplified cross-scale erosion is formation of concentrated flow within the degraded intercanopy between trees. Burning in this study decreased ecohydrologic resilience of the late- succession woodland through herbaceous recruitment 2 years post-fire. Increased intercanopy herbaceous productivity decreased connectivity of bare ground, improved infiltration, and reduced erosion, but the study site remained vulnerable to runoff and erosion from high-intensity rainfall. We conclude that burning can reduce woodland ecohydrologic resilience and that woodland encroachment-induced structural and functional ecohydrologic attributes may persist during high-intensity storms for an undetermined period post-fire. We cannot conclude whether wildfire reverses the woodland-induced soil erosion feedback on sagebrush rangelands. However, our results suggest that wildfire may provide a restoration pathway for sagebrush steppe by reducing woodland ecohydrologic resilience over time. Published 2013. This article is a U.S. Government work and is in the public domain in the USA. KEY WORDS ecohydrologic resilience; infiltration; runoff; sagebrush steppe; soil erosion feedback; thresholds; western juniper; woodland encroachment Received 9 August 2012; Revised 17 December 2012; Accepted 18 December 2012 INTRODUCTION Woody plant transitions on water-limited lands often result in cross-scale ecohydrologic feedbacks that, in turn, elicit potentially irreversible landscape-scale degradation (Peters et al., 2004; Okin et al., 2006; Allen, 2007; Peters et al., 2007; Turnbull et al., 2008). These feedbacks are typically initiated by multiple exogenous forces (e.g., climate variability, land use, decreased fire frequency, and CO 2 fertilization), which alter plant community or biotic structure such that abiotic processes propagate long-term losses of critically important soil resources (Schlesinger et al., 1990; Davenport et al., 1998; Turnbull et al., 2012). The conversion of native grasslands (Bouteloua spp.) to shrublands [Larrea tridentata (DC.) Coville and Prosopis glandulosa Torr.] in the southwestern United States is a commonly cited example (Buffington and Herbel, 1965; Grover and Musick, 1990; Schlesinger et al., 1990; Bahre and Shelton, 1993; Archer et al., 1995; Van Auken, 2000, 2009). Shrub encroachment, once initiated, is sustained by high infiltration rates, enhanced soil water storage, and entrapment of nutrient rich soils underneath and/or adjacent to shrub canopies (Schlesinger et al., 1990; Parsons et al., 1992; Bhark and Small, 2003; Ravi et al., 2007; Okin et al., 2009; Turnbull et al., 2010a, 2010b; Field et al., 2012). Coarsening of the plant community structure with escalating shrub dominance enhances fine-scale (0–2m 2 ) runoff and erosion by rainsplash and sheetflow (splash- sheet) processes in interspaces between shrubs (Abrahams et al., 1995; Parsons et al., 1996a). Runoff generated in bare interspaces promotes concentrated flow at the patch scale (10–40 m 2 ) and amplifies downslope sediment transport (Luk et al., 1993; Parsons et al., 1996b; Wainwright et al., 2000; Turnbull et al., 2010a). Water and soil losses at the patch scale inhibit herbaceous productivity and propagate bare-ground connectivity (Bhark and Small, 2003). Wind and water erosion increase with increasing bare ground over broader scales, potential- ly irreversibly degrading a site beyond a resource conservation threshold (Whitford et al., 1995; Bestelmeyer et al., 2003; Chartier and Rostagno, 2006; Herrick et al., *Correspondence to: C. Jason Williams, Northwest Watershed Research Center, USDA Agricultural Research Service, 800 Park Blvd, Suite 105, Boise, ID 83712, USA. E-mail: [email protected] Mention of a proprietary product does not constitute endorsement by USDA and does not imply its approval to the exclusion of the other products that may also be suitable. USDA is an equal opportunity provider and employer. ECOHYDROLOGY Ecohydrol. (2013) Published online in Wiley Online Library (wileyonlinelibrary.com) DOI: 10.1002/eco.1364 Published 2013. This article is a U.S. Government work and is in the public domain in the USA.

Welcome message from author
This document is posted to help you gain knowledge. Please leave a comment to let me know what you think about it! Share it to your friends and learn new things together.
Transcript
ECOHYDROLOGYEcohydrol. (2013)Published online in Wiley Online Library(wileyonlinelibrary.com) DOI: 10.1002/eco.1364
Can wildfire serve as an ecohydrologic threshold-reversalmechanism on juniper-encroached shrublands
C. Jason Williams,1* Frederick B. Pierson,1 Osama Z. Al-Hamdan,1,2 Patrick R. Kormos,3
Stuart P. Hardegree1 and Patrick E. Clark11 Northwest Watershed Research Center, USDA Agricultural Research Service, Boise, ID 83712, USA
2 Department of Biological and Agricultural Engineering, University of Idaho, Moscow, ID 83844, USA3 Department of Geosciences, Boise State University, Boise, ID 83725, USA
*CCenBoE-mMeandalso
Pub
ABSTRACT
Woody plant encroachment on water-limited lands can induce a shift from biotic (plant)-controlled resource retention to abiotic(physical)-driven losses of critical soil resources. The biotic-to-abiotic shift occurs where encroachment propagates connectivity ofrunoff processes and amplified cross-scale erosion that, in-turn, promote ecohydrologic resilience of the post-encroachmentcommunity. We investigated these relationships for woodland-encroached sagebrush steppe in the Great Basin, USA, and evaluatedwildfire as a mechanism to reverse the post-encroachment soil erosion feedback. Wemeasured vegetation, soil properties, and runoff/erosion from experimental plots on burned and unburned areas of a late-succession woodland 1 and 2 years post-fire. Our findingssuggest that the biotic-to-abiotic shift and amplified cross-scale erosion occur where encroachment-induced bare ground exceeds50–60% and bare gaps between plant bases frequently extend beyond 1m. The trigger for amplified cross-scale erosion is formation ofconcentrated flowwithin the degraded intercanopy between trees. Burning in this study decreased ecohydrologic resilience of the late-succession woodland through herbaceous recruitment 2 years post-fire. Increased intercanopy herbaceous productivity decreasedconnectivity of bare ground, improved infiltration, and reduced erosion, but the study site remained vulnerable to runoff and erosionfrom high-intensity rainfall. We conclude that burning can reduce woodland ecohydrologic resilience and that woodlandencroachment-induced structural and functional ecohydrologic attributesmay persist during high-intensity storms for an undeterminedperiod post-fire. We cannot conclude whether wildfire reverses the woodland-induced soil erosion feedback on sagebrush rangelands.However, our results suggest that wildfire may provide a restoration pathway for sagebrush steppe by reducing woodlandecohydrologic resilience over time. Published 2013. This article is a U.S. Government work and is in the public domain in the USA.
KEY WORDS ecohydrologic resilience; infiltration; runoff; sagebrush steppe; soil erosion feedback; thresholds; western juniper;woodland encroachment
Received 9 August 2012; Revised 17 December 2012; Accepted 18 December 2012
INTRODUCTION
Woody plant transitions on water-limited lands often resultin cross-scale ecohydrologic feedbacks that, in turn, elicitpotentially irreversible landscape-scale degradation (Peterset al., 2004; Okin et al., 2006; Allen, 2007; Peters et al.,2007; Turnbull et al., 2008). These feedbacks are typicallyinitiated by multiple exogenous forces (e.g., climatevariability, land use, decreased fire frequency, and CO2
fertilization), which alter plant community or bioticstructure such that abiotic processes propagate long-termlosses of critically important soil resources (Schlesingeret al., 1990; Davenport et al., 1998; Turnbull et al., 2012).The conversion of native grasslands (Bouteloua spp.) toshrublands [Larrea tridentata (DC.) Coville and Prosopisglandulosa Torr.] in the southwestern United States is acommonly cited example (Buffington and Herbel, 1965;
orrespondence to: C. Jason Williams, Northwest Watershed Researchter, USDA Agricultural Research Service, 800 Park Blvd, Suite 105,ise, ID 83712, USA.ail: [email protected] of a proprietary product does not constitute endorsement by USDAdoes not imply its approval to the exclusion of the other products that maybe suitable. USDA is an equal opportunity provider and employer.
lished 2013. This article is a U.S. Government work and is in the public
Grover and Musick, 1990; Schlesinger et al., 1990; Bahreand Shelton, 1993; Archer et al., 1995; Van Auken, 2000,2009). Shrub encroachment, once initiated, is sustained byhigh infiltration rates, enhanced soil water storage, andentrapment of nutrient rich soils underneath and/or adjacentto shrub canopies (Schlesinger et al., 1990; Parsons et al.,1992; Bhark and Small, 2003; Ravi et al., 2007; Okinet al., 2009; Turnbull et al., 2010a, 2010b; Field et al.,2012). Coarsening of the plant community structure withescalating shrub dominance enhances fine-scale (0–2m2)runoff and erosion by rainsplash and sheetflow (splash-sheet) processes in interspaces between shrubs (Abrahamset al., 1995; Parsons et al., 1996a). Runoff generated inbare interspaces promotes concentrated flow at the patchscale (10–40m2) and amplifies downslope sedimenttransport (Luk et al., 1993; Parsons et al., 1996b;Wainwright et al., 2000; Turnbull et al., 2010a). Waterand soil losses at the patch scale inhibit herbaceousproductivity and propagate bare-ground connectivity(Bhark and Small, 2003). Wind and water erosion increasewith increasing bare ground over broader scales, potential-ly irreversibly degrading a site beyond a resourceconservation threshold (Whitford et al., 1995; Bestelmeyeret al., 2003; Chartier and Rostagno, 2006; Herrick et al.,
domain in the USA.

C. J. WILLIAMS et al.
2006; Turnbull et al., 2012). Similar cross-scale, biotic-regulating and abiotic-regulating ecohydrologic feedbackshave been described for woodlands in the southwesternUSA (Davenport et al., 1998; Wilcox et al., 2003) and forwater-limited plant communities in Africa (Bromley et al.,1997; Valentin et al., 1999), Australia (Dunkerley andBrown, 1995; Ludwig and Tongway, 1995; Dunkerley,2002; Ludwig et al., 2007), South America (Chartier andRostagno, 2006), and Spain (Cerdà, 1997; Bergkamp,1998; Cammeraat and Imeson, 1999; Bautista et al., 2007).Millions of hectares of sagebrush steppe (Artemisia spp.)
in the Great Basin, USA, have been degraded throughecohydrologic structure–function feedbacks followingencroachment by singleleaf pinyon pine (Pinus monophyllaTorr. & Frém) and juniper (Juniperus spp.) woodlands.Woodland encroachment into sagebrush steppe can bepartitioned into three phases (Figure 1): (i) Phase I – tree
Figure 1. Common physiognomy shifts in sagebrush steppe withadvancing woodland encroachment and increasing tree dominance (a),the associated degradation-induced shift in the dominate erosion processes(b), and the relative change in erosion magnitude (y-axis, trend changeindicated by red line) along the encroachment gradient (sagebrush steppeto Phase III woodland) because of respective degradation in site andsurface conditions (x-axis) that dictate infiltration and surface soil stability(c). Erosion from sagebrush steppe is generally low and occurs by isolatedrainsplash and sheetflow. Erosion increases with a transition throughPhase I to Phase II and occurs as a combination of rainsplash, sheetflow,and concentrated flow. Erosion increases exponentially along the Phase IIand Phase III encroachment gradient because of a shift to concentratedflow as the dominant erosion process. Rainsplash photograph (b) courtesyof United States Department of Agriculture, Natural Resources Conser-
vation Service. All other photographs were taken by the authors.
Published 2013. This article is a U.S. Government work and is in the publi
cover (<1- to 3-m height) expands, but shrubs andherbaceous species remain the dominant cover and controlon ecological processes; (ii) Phase II – tree cover increasesto 10–50%, shrub and herbaceous cover decline because ofresource competition, and trees begin influencing keyecological processes; and (iii) Phase III – tree coverstabilizes, is the dominant cover type (>75% shrubmortality), and exerts the primary control on ecologicalprocesses (Miller et al., 2000, 2005; Johnson and Miller,2006; Miller et al., 2008). Productive shrubs, herbaceousvegetation, and litter cover on well-vegetated and intactsagebrush sites intercept and store rainfall, promoteinfiltration, stabilize surface soils, and attenuate thedownslope movement of water and sediment (Blackburn,1975; Pierson et al., 1994). The decline in understorycanopy and ground cover post-encroachment (Burkhardtand Tisdale, 1969; Bates et al., 2000; Miller et al., 2000;Roberts and Jones, 2000; Bates et al., 2005) increaseswater availability for runoff, inhibits infiltration, increasessoil erodibility, and facilitates a shift from splash-sheet toconcentrated flow as the dominant erosion process (Figure 1;Pierson et al., 2007, 2010). The encroachment-inducedhydrologic and erosion process shift represents an ecohy-drologic threshold-crossing switch from biotic (plant)regulated resource conservation to abiotic (inherent soilproperties and runoff) controlled losses of soil resourcescritical for plant productivity in drylands (Schlesinger et al.,1990; Davenport et al., 1998; Wilcox et al., 2003; Belnapet al., 2005; Ludwig et al., 2005; Puigdefábregas, 2005;Turnbull et al., 2008, 2010b, 2012). This soil loss or erosionfeedback is common in the later succession stages (mid-Phase II and Phase III) of woodland encroachment, results inlong-term site degradation, and is generally consideredirreversible without intensive and expensive managementaction (Miller et al., 2005; Pierson et al., 2007; Briske et al.,2008; Petersen et al., 2009; Pierson et al., 2010).
Woodland encroachment into Great Basin sagebrushsteppe may represent a ‘transformative change’ (Wilcox,2010). Wilcox (2010) defined ‘transformative change’ as aprofound alteration to the Earth’s surface that fundamen-tally affects ecosystem processes. Recent syntheses byDavies et al. (2011) and Miller et al. (2011) reported thatpinyon and juniper woodlands now occupy more than18 million hectares in the IntermountainWest, USA, and thatapproximately 90% of that domain was sagebrush steppe pre-European settlement (>140 years ago). Woodland encroach-ment generally approaches Phase II within 20–40 years andPhase III within 70–120 years after initial tree establishmentdepending on site-specific productivity (Miller et al., 2005;Johnson and Miller, 2006). Miller et al. (2008) forecast themajority of Great Basin woodlands will approach Phase IIIover the next 40–50 years. This post-settlement woodlandencroachment trend suggests that much of historical GreatBasin sagebrush steppe may be approaching an ecohydrolo-gic or conservation threshold beyond which proliferation oflandscape-scale degradation through a soil erosion feedbackis likely (Schlesinger et al., 1990; Davenport et al., 1998;Turnbull et al., 2008; Petersen et al., 2009; Turnbull et al.,2010b, 2012). The threat of high-severity wildfires is also
c domain in the USA. Ecohydrol. (2013)
WILDFIRE AS AN ECOHYDROLOGIC THRESHOLD-REVERSAL MECHANISM
increasing across the woodland-encroached sagebrushdomain (Miller and Tausch, 2001; Keane et al., 2008;Romme et al., 2009). As woodlands approach Phase III, hightree canopy biomass promotes intense and severe wildfiresunder extreme fire weather conditions (Miller and Tausch,2001; Baker and Shinneman, 2004; Romme et al., 2009).Limited pre-fire seed sources and propagules of desiredunderstory species on Phase III woodlands inhibit post-fireshrub and herbaceous species recruitment and furtheradvance site degradation through long-term soil loss (Koniakand Everett, 1982; Miller et al., 2000; Bates et al., 2002;Miller et al., 2005). Phase I woodland or wooded shrublandsare also burning in intense high-severity fires because ofheavy woody fuel loading (Miller and Tausch, 2001; Rommeet al., 2009). High-severity burns that remove key nativeperennial species decrease sagebrush steppe resistance toweed invasions (Stewart and Hull, 1949; Melgoza et al.,1990; Knapp, 1996; Chambers et al., 2007; Condon et al.,2011) and amplify soil erosion (Pierson et al., 2011; Wilcoxet al., 2012). Post-fire invasion by the annual cheatgrass(Bromus tectorumL.) onwarmer and drier sites may establishan alien grass fire cycle with fire return intervals less than5 years (Knapp, 1996; Brooks et al., 2004; Miller et al.,2011). Long-term soil erosion and site degradation are likelyexacerbated by frequent re-burning (Pierson et al., 2011;Wilcox et al., 2012). Long-term soil loss from sagebrushsteppe is a paramount concern for ecosystem health in theGreat Basin (Miller et al., 2011) and has negative ramifica-tions on flora, sagebrush obligate fauna, and local economiesreliant on rangeland ecosystem goods and services (Connellyet al., 2000; Knick et al., 2003; Aldrich et al., 2005; Milleret al., 2005; Havstad et al., 2007; Davies et al., 2011).Former Great Basin shrublands converted to woodlands
represent an alternative ecosystem state in which somemechanism or trigger is required to ecohydrologicallyreverse (hysteresis effect) the soil erosion feedback(Scheffer et al., 2001; Scheffer and Carpenter, 2003;Suding et al., 2004; Turnbull et al., 2008, 2012). Thealternative state, woodland, is perpetuated by runoff, anderosion (abiotic) processes or ecohydrologic feedbacksthat, respectively, increase woodland and decrease sage-brush steppe ecohydrologic resilience (Figure 1; Briskeet al., 2006, 2008; Petersen et al., 2009). Briske et al.(2006, 2008) describe resilience as the degree of alterationnecessary to shift an ecosystem from one stable state ofreinforcing structure–function relationships to a new stablestate sustained by different structure–function relation-ships. We expand the term resilience here to ecohydrologicresilience given the dependence on vegetation structure andhydrologic function in our case. For sagebrush-woodlandconversions in the Great Basin, an ecohydrologic thresholdexists separating the two stable states. The sagebrush-to-woodland threshold is crossed where abiotic processespropagate cross-scale soil loss and no longer supportrecruitment of the resource attenuating biotic structurecharacteristic of sagebrush steppe (Pierson et al., 1994;Briske et al., 2008). This functional shift is thought tooccur along the succession gradient between Phase II andPhase III woodlands (Figure 1) after which understory
Published 2013. This article is a U.S. Government work and is in the public
cover declines below a structural threshold due to resourcecompetition with trees (Johnson and Miller, 2006; Milleret al., 2008). The likelihood of re-establishment of asagebrush steppe structural–functional state (reversal of theecohydrologic threshold) depends on the degree ofecohydrologic resilience attained by woodland phaseprogression and presence of residual plant species, seedpropagules, and soil properties associated with sagebrushsteppe (Gunderson, 2000; Scheffer and Carpenter, 2003;Suding et al., 2004; Briske et al., 2006; Petersen et al.,2009). The late-succession woodland state has inherentlyhigh ecohydrologic resilience with respect to the sagebrushsteppe state (Briske et al., 2008). Millions of hectares ofdiverse sagebrush steppe in the western USA remain at riskto displacement by woodland encroachment (Suring et al.,2005), and researchers, government agencies, and landmanagers are actively seeking identification of earlywarning signs for threshold exceedance and restorationpathways to reverse woodland encroachment resilience andtrajectories (Scheffer et al., 2001; Suding et al., 2004;Briske et al., 2005, 2006, 2008; McIver et al., 2010). Earlywarning signs of ecohydrologic thresholds for resource-degrading sagebrush-to-woodland conversions likely varysubstantially across the diverse domain in which pinyonand juniper species have encroached (Davenport et al.,1998; Miller et al., 2005, 2008; Romme et al., 2009) andare not well established (although see Pyke et al., 2002;Kachergis et al., 2011; Sheley et al., 2011). Restorationpathways are trajectories toward re-establishment of pre-threshold states triggered by disturbance or managementactions and are assessed through indicators of re-emergingstructure–functional attributes of the pre-threshold state(Briske et al., 2008). For many ecosystems, recovery froma degraded to a more desired ecological state exhibits agradual trajectory through intermediate re-enforcingstructure–function shifts, commonly referred to as hyster-esis (Scheffer et al., 2001; Scheffer and Carpenter, 2003;Suding et al., 2004; Briske et al., 2008).
The recent and projected upsurge in extensive, severewildfire across the Great Basin woodlands domain and theuse of prescribed fire for encroachment control summon thequestion of whether fire may act as an ecohydrologicthreshold-reversal or hysteresis mechanism to reducewoodland ecohydrologic resilience (Scheffer et al., 2001;Suding et al., 2004; Briske et al., 2008). Prescribed burningis commonly used in the Great Basin to control pinyon andjuniper establishment in the early stages of encroachment(Miller et al., 2005; Rau et al., 2008; McIver et al., 2010;Bates et al., 2011; Davies et al., 2011), but the efficacy ofwild and prescribed fire to reduce late-succession woodlandecohydrologic resilience has not been evaluated.Favourable recruitment of herbaceous cover necessary toenhance infiltration and protect surface soils has beendocumented following burning on woodland-encroachedand intact sagebrush steppe (Pierson et al., 2008a; Sheleyand Bates, 2008; Bates and Svejcar, 2009; Pierson et al.,2009; Bates et al., 2011), but post-fire vegetation andhydrologic responses likely vary across the diverseconditions in which encroachment woodlands exist. In this
domain in the USA. Ecohydrol. (2013)

C. J. WILLIAMS et al.
study, we evaluate fire as an ecohydrologic threshold-reversalmechanism to break the soil erosion feedback on a sagebrushsteppe rangeland in late Phase II to early Phase III juniperencroachment. Our focus is on the fundamental switchnecessary, a fire-induced structural shift in the plantcommunity and an ensuing functional shift in the dominantrunoff and erosion processes with post-fire vegetationrecovery. The switch represents a reversal of abiotic-controlledsoil erosion for the woodland state to biotic-controlled soilretention indicative of progression to the sagebrush steppestructural–functional state. We use a combination of vegeta-tion and soil measures, rainfall simulation, and concentratedflow experiments across multiple spatial scales on burned andunburned areas to address three primary research questions:(i) Are there key vegetation and/or soil structural indicatorsthat a former sagebrush community is approaching or hascrossed an ecohydrological threshold from biotic to abioticcontrols on soil erosion? (ii) Can fire decrease late-successionwoodland ecohydrologic resilience by increasing vegetationand ground cover within the first two growing seasons afterfire? and (iii) Is the soil erosion feedback reversible by burningin the later stages of woodland encroachment?
METHODS
Study area
Experiments were performed on burned and unburned areasof western juniper (J. occidentalis Hook.) encroachedsagebrush steppe at the Castlehead study site of the SagebrushSteppe Treatment Evaluation Project (SageSTEP, McIveret al., 2010). The SageSTEP study is aimed at evaluating theecological impacts of invasive plants, woodland encroach-ment, and sagebrush restoration treatments in theGreat Basin.The Castlehead study site (lat 42�2605000, 116�4603900 long) islocated on the Owyhee Plateau in southwestern Idaho, USA,approximately 200 km southwest of Boise, Idaho. A detaileddescription of the site topography, climate, soils, andvegetation is provided in Table I. Precipitation during thestudy period (July 2007–July 2009) was 90–100% of normalbased on data from meteorological stations at similarelevations and aspects in the nearby Reynolds CreekExperimental Watershed (NWRC, 2012). Mean annual soiltemperature and moisture regimes at Castlehead are frigid(<8 �C) and xeric (>305mm annual precipitation). Precipi-tation occurs primarily as snowfall during the winter withmost of the remaining falling in frontal rainfall events duringspring and autumn. Summers are hot and dry with occasionalhigh-intensity convective rainfall events. The site is vegetatedby a western juniper overstory and a degraded sagebrushsteppe understory (Table I). Western juniper encroachment ofsagebrush steppe in the area began around 1860 (Johnson andMiller, 2006; Miller et al., 2008). The Castlehead sitewas established in 2005 for the SageSTEP study, andfield reconnaissance for experiments was conducted insummer 2006. Portions of the site subsequently burned inthe 18 890-ha Tongue Complex wildfire in July of 2007. Livecanopy and surface litter cover were completely consumed inburned areas leaving a residual cover of ash and charred,
Published 2013. This article is a U.S. Government work and is in the publi
standing dead trees, and shrub skeletons. Burned andunburned experimental areas were selected immediatelypost-fire and were located within 300m of one another onthe same elevation, aspect, prevailing slope angle, andmapped soil type. Field reconnaissance prior to the fireobserved consistent vegetation characteristics across thestudy area with exception of greater tree density (Table I) inareas subsequently burned.
Experimental design
Experimental plots were established to characterize vegeta-tion and the ground surface over fine to hillslope scales and toquantify vegetation and soil effects on cross-scale runoff anderosion. Three 30m� 33m site characterization plots wererandomly located and sampled for vegetation and groundcover within burned and unburned areas 1 year (Year 1, June2008) and 2 years (Year 2, June 2009) following the TongueComplex Fire. Site characterization plots were used toestimate vegetation and ground cover at the hillslope-scaleand to determine the phase of western juniper encroachment.Small-plot (0�7m� 0�7m, 17�8% mean slope, Figure 2(a))rainfall simulation experiments were used to quantify fine-scale vegetation and soil effects on runoff and erosion fromsplash-sheet processes (Pierson et al., 2010). Small plots werestratified to occur either on juniper or shrub coppices (areasinfluenced by tree or shrub canopies), or in the interspacesbetween tree and shrub canopies. Stratification was intendedto partition microsite cover/soil differences and respectiverunoff and erosion contributions to patch-scale responses(Pierson et al., 2010). Small plots were randomly selected andinstalled for each microsite in burned and unburned areas inYear 1. All small plots were left in place for subsequentsampling in Year 2. The number of small plots sampled oneach microsite and treatment combination in Years 1 and 2 isshown in Table II. Large rainfall simulation plots (2mwide� 6�5m long, 16�8% mean slope, Figure 2(b)) wereinstalled in pairs and used to quantify vegetation and soileffects on runoff and erosion from splash-sheet andconcentrated flow processes occurring at the patch scale(Pierson et al., 2010). Large plots were randomly selected andinstalled within shrub-interspace zones (intercanopy areaoutside of tree canopy influence) between trees and withintree zones (areas underneath and immediately adjacent to treecanopies). Shrub-interspace zones contained, on average, 7%shrub coppice and 93% interspace area. Tree zones averaged81% tree coppice, 18% interspace, and 1% shrub coppicearea. Six large plots were installed and sampled in burned andunburned shrub-interspace and tree zones in Year 1. Largeplots were not sampled in Year 2. Concentrated flowexperiments (2m wide� 4�5m long, 17�0% mean slope,Figure 2(c)) were conducted on each large rainfall plotimmediately following rainfall simulations in Year 1 and asindependent (without large-plot simulations) experiments inYear 2. Concentrated flow experiments were used to evaluatethe effects of vegetation and surface soil conditions on erosionfrom concentrated overland flow or rills (Pierson et al., 2007,2010; Al-Hamdan et al., 2012a, 2012b, 2012c). Sixconcentrated flow plots were sampled on burned andunburned shrub-interspace and tree zones in Years 1 and 2.
c domain in the USA. Ecohydrol. (2013)
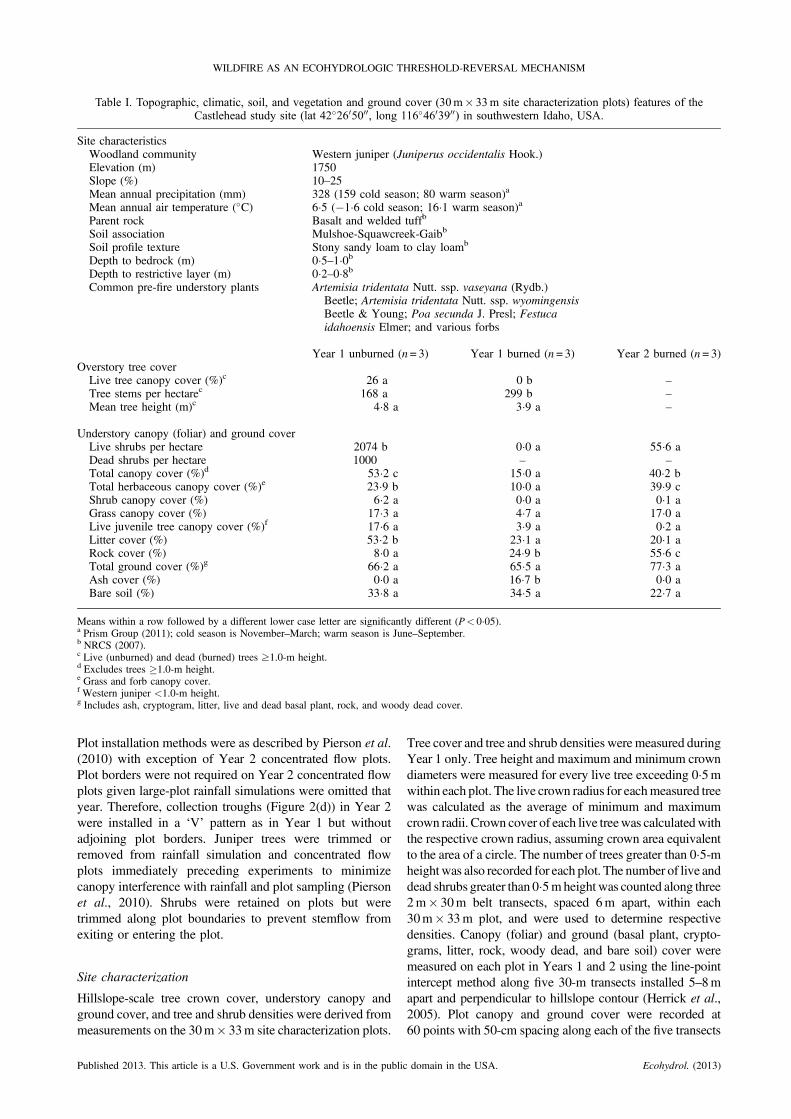
Table I. Topographic, climatic, soil, and vegetation and ground cover (30m� 33m site characterization plots) features of theCastlehead study site (lat 42�2605000, long 116�4603900) in southwestern Idaho, USA.
Site characteristicsWoodland community Western juniper (Juniperus occidentalis Hook.)Elevation (m) 1750Slope (%) 10–25Mean annual precipitation (mm) 328 (159 cold season; 80 warm season)a
Mean annual air temperature (�C) 6�5 (�1�6 cold season; 16�1 warm season)a
Parent rock Basalt and welded tuffb
Soil association Mulshoe-Squawcreek-Gaibb
Soil profile texture Stony sandy loam to clay loamb
Depth to bedrock (m) 0�5–1�0bDepth to restrictive layer (m) 0�2–0�8bCommon pre-fire understory plants Artemisia tridentata Nutt. ssp. vaseyana (Rydb.)
Beetle; Artemisia tridentata Nutt. ssp. wyomingensisBeetle & Young; Poa secunda J. Presl; Festucaidahoensis Elmer; and various forbs
Year 1 unburned (n= 3) Year 1 burned (n= 3) Year 2 burned (n= 3)Overstory tree cover
Live tree canopy cover (%)c 26 a 0 b –Tree stems per hectarec 168 a 299 b –Mean tree height (m)c 4�8 a 3�9 a –
Understory canopy (foliar) and ground coverLive shrubs per hectare 2074 b 0�0 a 55�6 aDead shrubs per hectare 1000 – –Total canopy cover (%)d 53�2 c 15�0 a 40�2 bTotal herbaceous canopy cover (%)e 23�9 b 10�0 a 39�9 cShrub canopy cover (%) 6�2 a 0�0 a 0�1 aGrass canopy cover (%) 17�3 a 4�7 a 17�0 aLive juvenile tree canopy cover (%)f 17�6 a 3�9 a 0�2 aLitter cover (%) 53�2 b 23�1 a 20�1 aRock cover (%) 8�0 a 24�9 b 55�6 cTotal ground cover (%)g 66�2 a 65�5 a 77�3 aAsh cover (%) 0�0 a 16�7 b 0�0 aBare soil (%) 33�8 a 34�5 a 22�7 a
Means within a row followed by a different lower case letter are significantly different (P< 0�05).a Prism Group (2011); cold season is November–March; warm season is June–September.b NRCS (2007).c Live (unburned) and dead (burned) trees ≥1.0-m height.d Excludes trees �1.0-m height.e Grass and forb canopy cover.f Western juniper <1.0-m height.g Includes ash, cryptogram, litter, live and dead basal plant, rock, and woody dead cover.
WILDFIRE AS AN ECOHYDROLOGIC THRESHOLD-REVERSAL MECHANISM
Plot installation methods were as described by Pierson et al.(2010) with exception of Year 2 concentrated flow plots.Plot borders were not required on Year 2 concentrated flowplots given large-plot rainfall simulations were omitted thatyear. Therefore, collection troughs (Figure 2(d)) in Year 2were installed in a ‘V’ pattern as in Year 1 but withoutadjoining plot borders. Juniper trees were trimmed orremoved from rainfall simulation and concentrated flowplots immediately preceding experiments to minimizecanopy interference with rainfall and plot sampling (Piersonet al., 2010). Shrubs were retained on plots but weretrimmed along plot boundaries to prevent stemflow fromexiting or entering the plot.
Site characterization
Hillslope-scale tree crown cover, understory canopy andground cover, and tree and shrub densities were derived frommeasurements on the 30m� 33m site characterization plots.
Published 2013. This article is a U.S. Government work and is in the public
Tree cover and tree and shrub densities weremeasured duringYear 1 only. Tree height and maximum and minimum crowndiameters were measured for every live tree exceeding 0�5mwithin each plot. The live crown radius for eachmeasured treewas calculated as the average of minimum and maximumcrown radii. Crown cover of each live treewas calculatedwiththe respective crown radius, assuming crown area equivalentto the area of a circle. The number of trees greater than 0�5-mheight was also recorded for each plot. The number of live anddead shrubs greater than 0�5mheight was counted along three2m� 30m belt transects, spaced 6m apart, within each30m� 33m plot, and were used to determine respectivedensities. Canopy (foliar) and ground (basal plant, crypto-grams, litter, rock, woody dead, and bare soil) cover weremeasured on each plot in Years 1 and 2 using the line-pointintercept method along five 30-m transects installed 5–8mapart and perpendicular to hillslope contour (Herrick et al.,2005). Plot canopy and ground cover were recorded at60 points with 50-cm spacing along each of the five transects
domain in the USA. Ecohydrol. (2013)
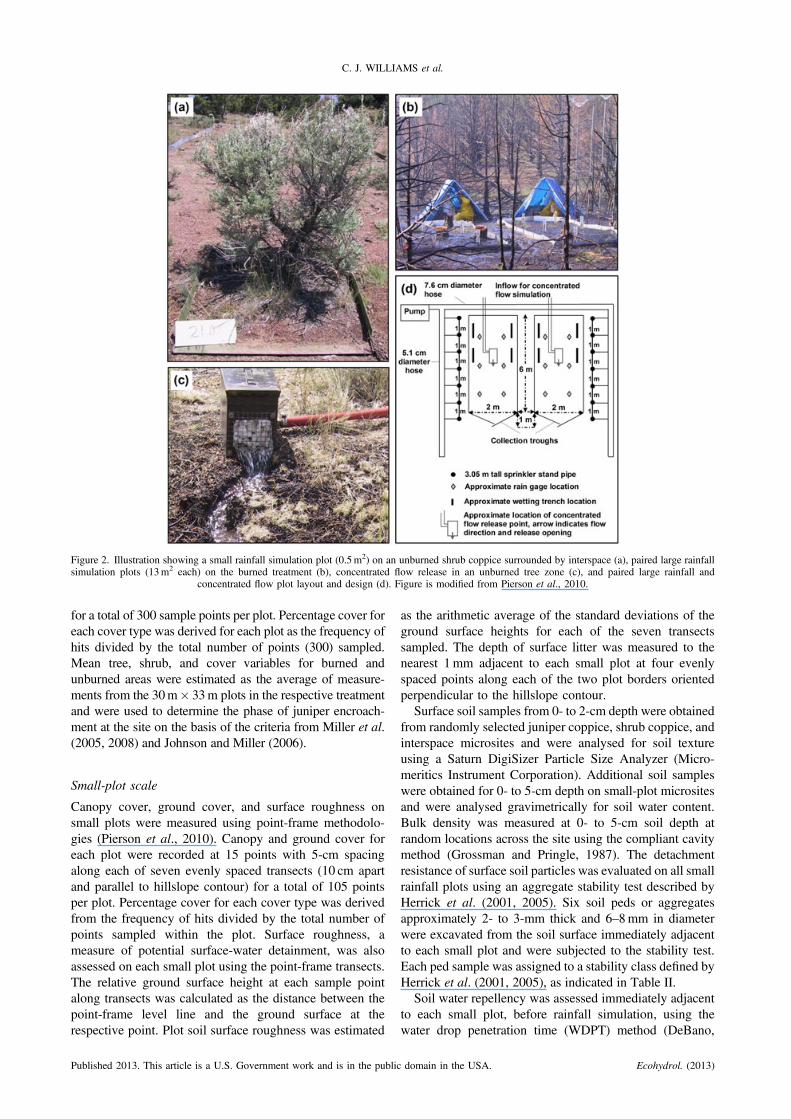
Figure 2. Illustration showing a small rainfall simulation plot (0.5m2) on an unburned shrub coppice surrounded by interspace (a), paired large rainfallsimulation plots (13m2 each) on the burned treatment (b), concentrated flow release in an unburned tree zone (c), and paired large rainfall and
concentrated flow plot layout and design (d). Figure is modified from Pierson et al., 2010.
C. J. WILLIAMS et al.
for a total of 300 sample points per plot. Percentage cover foreach cover type was derived for each plot as the frequency ofhits divided by the total number of points (300) sampled.Mean tree, shrub, and cover variables for burned andunburned areas were estimated as the average of measure-ments from the 30m� 33m plots in the respective treatmentand were used to determine the phase of juniper encroach-ment at the site on the basis of the criteria from Miller et al.(2005, 2008) and Johnson and Miller (2006).
Small-plot scale
Canopy cover, ground cover, and surface roughness onsmall plots were measured using point-frame methodolo-gies (Pierson et al., 2010). Canopy and ground cover foreach plot were recorded at 15 points with 5-cm spacingalong each of seven evenly spaced transects (10 cm apartand parallel to hillslope contour) for a total of 105 pointsper plot. Percentage cover for each cover type was derivedfrom the frequency of hits divided by the total number ofpoints sampled within the plot. Surface roughness, ameasure of potential surface-water detainment, was alsoassessed on each small plot using the point-frame transects.The relative ground surface height at each sample pointalong transects was calculated as the distance between thepoint-frame level line and the ground surface at therespective point. Plot soil surface roughness was estimated
Published 2013. This article is a U.S. Government work and is in the publi
as the arithmetic average of the standard deviations of theground surface heights for each of the seven transectssampled. The depth of surface litter was measured to thenearest 1mm adjacent to each small plot at four evenlyspaced points along each of the two plot borders orientedperpendicular to the hillslope contour.
Surface soil samples from 0- to 2-cm depth were obtainedfrom randomly selected juniper coppice, shrub coppice, andinterspace microsites and were analysed for soil textureusing a Saturn DigiSizer Particle Size Analyzer (Micro-meritics Instrument Corporation). Additional soil sampleswere obtained for 0- to 5-cm depth on small-plot micrositesand were analysed gravimetrically for soil water content.Bulk density was measured at 0- to 5-cm soil depth atrandom locations across the site using the compliant cavitymethod (Grossman and Pringle, 1987). The detachmentresistance of surface soil particles was evaluated on all smallrainfall plots using an aggregate stability test described byHerrick et al. (2001, 2005). Six soil peds or aggregatesapproximately 2- to 3-mm thick and 6–8mm in diameterwere excavated from the soil surface immediately adjacentto each small plot and were subjected to the stability test.Each ped sample was assigned to a stability class defined byHerrick et al. (2001, 2005), as indicated in Table II.
Soil water repellency was assessed immediately adjacentto each small plot, before rainfall simulation, using thewater drop penetration time (WDPT) method (DeBano,
c domain in the USA. Ecohydrol. (2013)
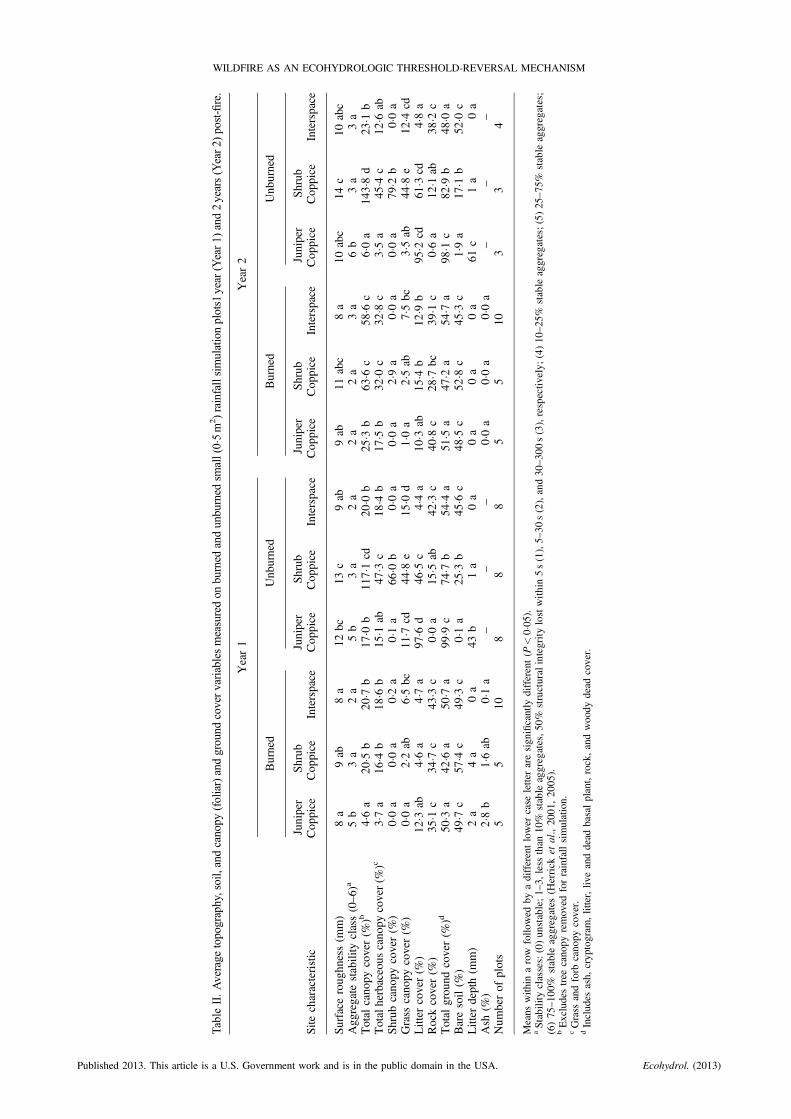
Table
II.Average
topography,soil,andcanopy
(foliar)andground
covervariablesmeasuredon
burned
andunburned
small(0�5
m2)rainfallsimulationplots1
year
(Year1)
and2years(Year2)
post-fire.
Site
characteristic
Year1
Year2
Burned
Unburned
Burned
Unburned
Juniper
Coppice
Shrub
Coppice
Interspace
Juniper
Coppice
Shrub
Coppice
Interspace
Juniper
Coppice
Shrub
Coppice
Interspace
Juniper
Coppice
Shrub
Coppice
Interspace
Surface
roughness(m
m)
8a
9ab
8a
12bc
13c
9ab
9ab
11abc
8a
10abc
14c
10abc
Aggregate
stability
class(0–6)a
5b
3a
2a
5b
3a
2a
2a
2a
3a
6b
3a
3a
Total
canopy
cover(%
)b4�6
a20�5
b20
�7b
17�0
b117�1
cd20
�0b
25�3
b63
�6c
58�6
c6�0
a143�8
d23
�1b
Totalherbaceous
canopy
cover(%
)c3�7
a16�4
b18
�6b
15�1
ab47
�3c
18�4
b17
�5b
32�0
c32
�8c
3�5a
45�4
c12
�6ab
Shrub
canopy
cover(%
)0�0
a0�0
a0�2
a0�1
a66
�0b
0�0a
0�0a
2�9a
0�0a
0�0a
79�2
b0�0
aGrass
canopy
cover(%
)0�0
a2�2
ab6�5
bc11�7
cd44
�8e
15�0
d1�0
a2�5
ab7�5
bc3�5
ab44�8
e12
�4cd
Litter
cover(%
)12�3
ab4�6
a4�7
a97
�6d
46�5
c4�4
a10
�3ab
15�4
b12
�9b
95�2
cd61�3
cd4�8
aRockcover(%
)35�1
c34�7
c43
�3c
0�0a
15�5
ab42�3
c40�8
c28
�7bc
39�1
c0�6
a12�1
ab38
�2c
Total
ground
cover(%
)d50
�3a
42�6
a50
�7a
99�9
c74
�7b
54�4
a51�5
a47
�2a
54�7
a98
�1c
82�9
b48
�0a
Baresoil(%
)49
�7c
57�4
c49
�3c
0�1a
25�3
b45�6
c48�5
c52
�8c
45�3
c1�9
a17�1
b52
�0c
Litter
depth(m
m)
2a
4a
0a
43b
1a
0a
0a
0a
0a
61c
1a
0a
Ash
(%)
2�8b
1�6ab
0�1a
––
–0�0
a0�0
a0�0
a–
––
Num
berof
plots
55
108
88
55
103
34
Means
with
inarow
follo
wed
byadifferentlower
case
letteraresignificantly
different(P
<0�0
5).
aStability
classes:(0)un
stable;1–
3,less
than
10%
stable
aggregates,5
0%structural
integritylostwithin5s(1),5–
30s(2),and30
–300
s(3),respectively;(4)10
–25%
stable
aggregates;(5)25
–75%
stable
aggregates;
(6)75
–100
%stable
aggregates
(Herrick
etal.,2001
,20
05).
bExcludestree
canopy
removed
forrainfallsimulation.
cGrass
andforb
canopy
cover.
dIncludes
ash,
cryptogram
,litter,liv
eanddead
basalplant,rock,andwoody
dead
cover.
WILDFIRE AS AN ECOHYDROLOGIC THRESHOLD-REVERSAL MECHANISM
Published 2013. This article is a U.S. Government work and is in the public domain in the USA. Ecohydrol. (2013)

C. J. WILLIAMS et al.
1981). Eight water drops (approximately 3-cm spacing)were applied to the mineral soil surface (ash and litterremoved) and the time required for infiltration of each dropwas recorded up to 300 s. Following this procedure, 1 cmof soil was excavated immediately underneath thepreviously sampled area, and the WDPT method wasrepeated for an additional eight drops. This process wasrepeated until a depth of 5 cm was reached. The meanWDPT at 0, 1, 2, 3, 4, and 5-cm soil depths for each plotwas recorded as the mean of the eight WDPT (s) samples atthe respective depth. The strength of water repellency ateach sampled depth was classified as ‘slight’ if WDPTranged from 5 to 60 s and ‘strong’ if WDPT ranged from60 to 300 s (Bisdom et al., 1993). Soils were consideredwettable where WDPT< 5 s.A Meyer and Harmon-type portable oscillating-arm
rainfall simulator, fitted with 80–100 Veejet nozzles, wasused to apply rainfall on each small plot. The simulatordesign, raindrop characteristics, and rainfall calibrationmethods are described by Meyer and Harmon (1979) andPierson et al. (2008a, 2009, 2010). Rainfall was applied toeach small plot at rates of 64mmh�1 under dry (dry run)and 102mmh�1 under wet (wet run) antecedent soilmoisture conditions. The rates were applied for 45min each,separated by a 30-min hiatus between the dry and wet runs.Mean rainfall appliedwas 47mm (n=59, se=0�1mm) for thedry run and 75mm (n= 59, se= 0�2mm) for the wet run.Rainfall application rates were selected to simulate runoff anderosion generating storm events typical of the study area. Thedry run intensity over 5, 10, and 15-min durations isequivalent to respective storm return intervals of 4, 8, and20 years, and the wet-run intensity over the same durations isequivalent to respective storm return intervals of 14, 33, and75 years (Hanson and Pierson, 2001).Hydrologic and erosion response variables were derived
for each small plot rainfall simulation based on timedrunoff samples. Timed samples from small plots werecollected at 1 to 3-min intervals throughout each 45-minsimulation. Runoff volume and sediment concentrationwere determined for each sample by weighing the samplebefore and after drying at 105 �C. A mean runoff rate(mmh�1) was calculated for each sample interval as thecumulative runoff divided by the interval time. Cumulativerunoff (mm) for 45min was calculated as the integration ofrunoff rates over the total time of runoff. Infiltration andsediment variables were calculated for plots that generatedrunoff. An average infiltration rate (mmh�1) for eachsample interval was derived as the difference betweenapplied rainfall and measured runoff divided by the sampleinterval duration. Cumulative sediment yield (gm�2) foreach 45-min simulation was derived as the integrated sumof sediment collected during runoff and was extrapolated toa unit area by dividing cumulative sediment by the plotarea. The sediment-to-runoff ratio (gm�2mm�1), a vari-able closely related to soil erodibility, was obtained bydividing cumulative sediment yield by cumulative runoff.Soil profile wetting patterns on small plots were
investigated in 50-cm long and 20-cm deep trenchesexcavated following dry-run rainfall simulations. A single
Published 2013. This article is a U.S. Government work and is in the publi
trench was excavated for investigation in an undisturbedarea immediately adjacent to each small plot. The percentwetted area of each exposed soil profile was measuredusing a 4-cm2 grid, where each grid area was determined tobe dry or wet on the basis of the dominant condition in thegrid area (Pierson et al., 2008b, 2010). The area wet to 6,10, and 20-cm depths for each 50-cm long trench wasrecorded as the percentage of wetted area from 0- to 6-cm,0- to 10-cm, and 0- to 20-cm depths.
Large-plot scale
Canopy cover, ground cover, and soil surface roughness onlarge rainfall simulation plots were estimated using line-pointintercept procedures modified from Herrick et al. (2005).Canopy and ground cover were recorded at 59 points spaced10 cm apart along each of 5 evenly spaced (40 cm apart,perpendicular to hillslope contour) transects 6m in length(295 total points). Percentage cover by cover type wasderived as described for site characterization line-point plots.The relative ground surface height along line-point transectswas measured as the distance between the ground surface anda survey transit level line over the respective sample point.Soil surface roughness was estimated as the average of thestandard deviations of the ground surface heights across thefive line-point transects sampled within each plot.
Canopy and basal plant cover gaps on large plots wereestimated using the gap-intercept method along the coverline-point transects (Herrick et al., 2005). The length ofspatial gaps between plant canopies and bases are indicatorsof potential runoff and erosion (Herrick et al., 2005; Pellantet al., 2005). Plant canopy and basal gaps exceeding 20 cmwere measured along each line-point transect, and thepercentages of canopy and basal gaps representing gapclasses 25–50 cm, 51–100, 101–200, and >200 cm weredetermined and averaged across the five transects todetermine the plot mean for each gap class. Average canopyand basal gap sizes for each plot were calculated as the meanof all respective gaps measured on the plot in excess 20 cm.
Paired large rainfall simulations were conducted using aColorado State University type rainfall simulator with14 stationary sprinklers elevated 3�05m above the groundsurface (Figure 2(b and d); Holland, 1969). The simulator-type and rainfall characteristics are described by Holland(1969) and Pierson et al. (2009, 2010). Rainfall rates andapplication sequences were consistent with those for smallplots. Total rainfall applied to each large plot was determinedfrom the average of six plastic depth gages in a uniform grid(Figure 2(d)). Mean rainfall applied was 47mm (n=144,se=2�5mm) for the dry run and 87mm (n=144, se=5�0mm)for the wet run. Timed runoff samples were collected andprocessed in the laboratory as described for small plots.Runoff from direct rainfall on the collection troughs (i.e.,trough catch, see Figure 2(d)) was determined by samplingcollection trough runoff before plot-generated runoffoccurred. Large-plot hydrologic and erosion response vari-ableswere derived consistent with small plot calculationswithexception of sample runoff deductions for trough catch. Foursoil profile wetting trenches were excavated on each large plot
c domain in the USA. Ecohydrol. (2013)
WILDFIRE AS AN ECOHYDROLOGIC THRESHOLD-REVERSAL MECHANISM
(locations shown on Figure 2(d)) immediately following wet-run simulations. The percent area wet to 6, 10, and 20-cmdepths for each large plot was recorded as the average ofthe respective values for the four excavated trenches.
Cross-scale runoff and erosion
Differences in runoff and erosion across small to large-plotscales were evaluated by comparing measured large rainfallplot runoff and erosion with area-weighted small rainfallplot data (Pierson et al., 1994). The proportions of shrubcoppice, interspace, and juniper coppice area on each largeplot were determined from the large-plot point-interceptcanopy and ground cover measurements. For unburnedshrub-interspace plots, percent shrub canopy cover wasused as an estimate of the shrub coppice proportional area;the remaining plot area was considered interspace. Forunburned tree zone plots, the difference in percent litter andpercent shrub canopy cover (litter cover%� shrub canopy%)was used to estimate proportional juniper coppice area, andpercent shrub cover was used to estimate proportionalshrub coppice area. The proportional interspace area inunburned tree zones was estimated as the remainingpercentage plot area after deducting, from 100%, theestimated shrub and tree coppice coverage. The pre-firerepresentative areas of interspace and shrub and junipercoppice could not be determined for burned large plots.Therefore, mean microsite area estimates from unburnedshrub-interspace and tree zones were used to estimate small-plot microsite coverage within burned shrub-interspace andtree zones, respectively. Total area and cover for each area-weighted large-plot were 13m2 and 100% cover. Cumulativerunoff and soil loss for each area-weighted large plot wereobtained by multiplying mean cumulative small-plot runoffand erosion values for the respective burned or unburnedmicrosites, by the estimated representative microsite propor-tional areas and summing the results for the entire plot.
Concentrated flow simulation
Concentration flow simulations were conducted within thelarge plots during Year 1. Consequently, Year 1 canopycover, ground cover, surface roughness, and canopy and basalgaps on concentrated flow plots were equivalent to the samemeasures on large plots. Cover and gap measures onconcentrated flow plots in Year 2 were obtained usinglarge-plot methods, but with shorter line-point transects. Nineline-point transects 4�6m in length (20 cm apart) weresampled on each concentrated flow plot in Year 2. Samplingwas conducted in 20-cm increments along each transect,yielding 24 sample points per transect and 216 points per plot.Computer-controlled flow regulators (Pierson et al.,
2008a, 2009, 2010) were used to apply concentrated flowrelease rates of 15, 30, and 45 Lmin�1 to each largerainfall/concentrated plot within 1–2 h after rainfall simu-lation in Year 1 and on each independent concentrated flowplot in Year 2. Concentrated flow plots in Year 2 were pre-wet for 30min with a gently misting sprinkler to wet-upsurface soils immediately prior to simulations. Pre-wettingdid not generate runoff. Year 2 concentrated plots were
Published 2013. This article is a U.S. Government work and is in the public
unconfined with respect to width given plot walls were notpresent. Each flow release rate was applied to each plot for12min from a single location, 4m upslope of the collectiontrough apex (Figure 2(c and 2d)). The release rate sequencewas consecutive from 15 to 45 Lmin�1. The water wasrouted through a metal box filled with Styrofoam pelletsand was released through a 10-cm wide mesh-screenedopening at the base of the box (Figure 2(c)).
Runoff at the plot outlet was collected at approximately2-min intervals for each 12-min simulation. The collectedsamples were processed in the laboratory for runoff andsediment as explained for small-plot rainfall simulations.Runoff and sediment yield variables for each release ratewere calculated for an 8-min period beginning at the timeof runoff initiation. The 8-min runoff and sedimentvariables were calculated as described for the 45-minrainfall simulations. In Year 2, the area eroded by thecumulative 15–45 Lmin�1 releases was measured on eachplot as the incised cross-sectional area of the dominant flowpath 3m downslope from the flow release point.
Data analysis
All statistical analyses were conducted using SASsoftware, version 9.1.3 (SAS Institute Inc., 2007).Hillslope-scale data collected from site characterizationplots were analysed in a one-way ANOVA with threetreatments levels: burned Year 1, burned Year 2, andunburned Year 1. Data collected at the small-plot scalewere analysed using a split-plot mixed model with repeatedmeasures. Compound symmetry covariance structure wasused for small plots given there were only two sample datesfor each treatment (Littell et al., 2006). The whole-plot(treatment) factor had two levels, burned and unburned, andthe sub-plot factor (microsite) had three levels, junipercoppice, shrub coppice, and interspace. Sample year (Year 1and Year 2) was the repeated measure. Large-plot data (Year1 only) andYear 2 cover data on concentrated flow plots wereanalysed using a split-plot mixed model with two treatmentlevels, burned and unburned, and twomicrosite levels, shrub-interspace zone and tree zone. Analyses of all concentratedflow data were conducted separately for each year given thatmethodologies differed between Years 1 and 2. Concentratedflow runoff and erosion were analysed using a repeatedmeasures mixed model with two treatment levels, burned andunburned, and two microsite levels, shrub-interspace zoneand tree zone. Flow release rate was designated as therepeated measure with three levels: 15, 30, and 45Lmin�1.Carryover effects of concentrated flow releases wereaccounted for by modelling the covariance structure with anautoregressive order one model (Littell et al., 2006).Treatment and microsite were considered fixed effects in allrespective analyses, and plot location was designated arandom effect. Prior to ANOVA, normality and homogeneitywere tested using the Shapiro–Wilk test and Levene’stest (SAS Institute Inc., 2007), and deviance from normalitywas addressed by data transformation. Where necessary,arcsine-square root transformations were used to normalizeproportion data (e.g., canopy cover and percent wet).
domain in the USA. Ecohydrol. (2013)
C. J. WILLIAMS et al.
Logarithmic transformations were used to normalize WDPT,cumulative sediment, sediment-to-runoff ratio, and sedimentconcentration data. Back-transformed results are reported.Mean separation was conducted using the LSMEANSprocedure with Tukey’s adjustment. Significant effects weredetermined at the P< 0�05 level.
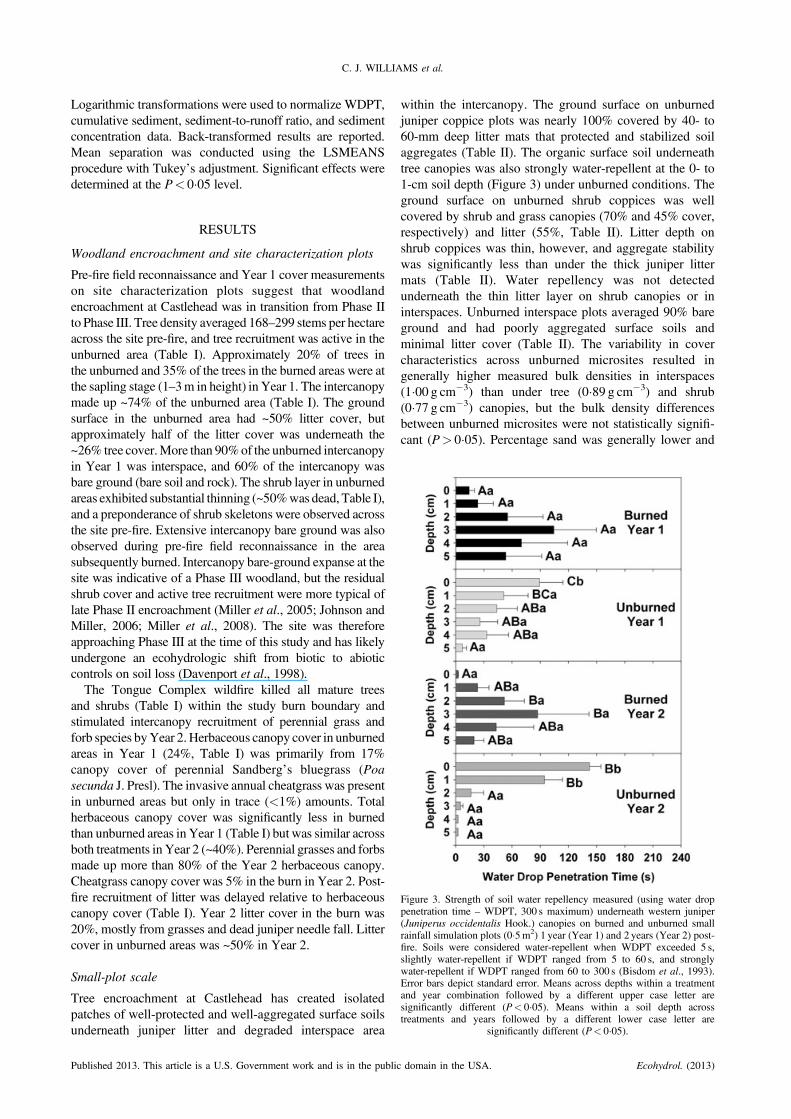
Figure 3. Strength of soil water repellency measured (using water droppenetration time – WDPT, 300 s maximum) underneath western juniper(Juniperus occidentalis Hook.) canopies on burned and unburned smallrainfall simulation plots (0�5m2) 1 year (Year 1) and 2 years (Year 2) post-fire. Soils were considered water-repellent when WDPT exceeded 5 s,slightly water-repellent if WDPT ranged from 5 to 60 s, and stronglywater-repellent if WDPT ranged from 60 to 300 s (Bisdom et al., 1993).Error bars depict standard error. Means across depths within a treatmentand year combination followed by a different upper case letter aresignificantly different (P< 0�05). Means within a soil depth acrosstreatments and years followed by a different lower case letter are
significantly different (P< 0�05).
RESULTS
Woodland encroachment and site characterization plots
Pre-fire field reconnaissance and Year 1 cover measurementson site characterization plots suggest that woodlandencroachment at Castlehead was in transition from Phase IIto Phase III. Tree density averaged 168–299 stems per hectareacross the site pre-fire, and tree recruitment was active in theunburned area (Table I). Approximately 20% of trees inthe unburned and 35% of the trees in the burned areas were atthe sapling stage (1–3m in height) in Year 1. The intercanopymade up ~74% of the unburned area (Table I). The groundsurface in the unburned area had ~50% litter cover, butapproximately half of the litter cover was underneath the~26% tree cover.More than 90%of the unburned intercanopyin Year 1 was interspace, and 60% of the intercanopy wasbare ground (bare soil and rock). The shrub layer in unburnedareas exhibited substantial thinning (~50%was dead, Table I),and a preponderance of shrub skeletons were observed acrossthe site pre-fire. Extensive intercanopy bare ground was alsoobserved during pre-fire field reconnaissance in the areasubsequently burned. Intercanopy bare-ground expanse at thesite was indicative of a Phase III woodland, but the residualshrub cover and active tree recruitment were more typical oflate Phase II encroachment (Miller et al., 2005; Johnson andMiller, 2006; Miller et al., 2008). The site was thereforeapproaching Phase III at the time of this study and has likelyundergone an ecohydrologic shift from biotic to abioticcontrols on soil loss (Davenport et al., 1998).The Tongue Complex wildfire killed all mature trees
and shrubs (Table I) within the study burn boundary andstimulated intercanopy recruitment of perennial grass andforb species byYear 2.Herbaceous canopy cover in unburnedareas in Year 1 (24%, Table I) was primarily from 17%canopy cover of perennial Sandberg’s bluegrass (Poasecunda J. Presl). The invasive annual cheatgrass was presentin unburned areas but only in trace (<1%) amounts. Totalherbaceous canopy cover was significantly less in burnedthan unburned areas in Year 1 (Table I) but was similar acrossboth treatments in Year 2 (~40%). Perennial grasses and forbsmade up more than 80% of the Year 2 herbaceous canopy.Cheatgrass canopy cover was 5% in the burn in Year 2. Post-fire recruitment of litter was delayed relative to herbaceouscanopy cover (Table I). Year 2 litter cover in the burn was20%, mostly from grasses and dead juniper needle fall. Littercover in unburned areas was ~50% in Year 2.
Small-plot scale
Tree encroachment at Castlehead has created isolatedpatches of well-protected and well-aggregated surface soilsunderneath juniper litter and degraded interspace area
Published 2013. This article is a U.S. Government work and is in the publi
within the intercanopy. The ground surface on unburnedjuniper coppice plots was nearly 100% covered by 40- to60-mm deep litter mats that protected and stabilized soilaggregates (Table II). The organic surface soil underneathtree canopies was also strongly water-repellent at the 0- to1-cm soil depth (Figure 3) under unburned conditions. Theground surface on unburned shrub coppices was wellcovered by shrub and grass canopies (70% and 45% cover,respectively) and litter (55%, Table II). Litter depth onshrub coppices was thin, however, and aggregate stabilitywas significantly less than under the thick juniper littermats (Table II). Water repellency was not detectedunderneath the thin litter layer on shrub canopies or ininterspaces. Unburned interspace plots averaged 90% bareground and had poorly aggregated surface soils andminimal litter cover (Table II). The variability in covercharacteristics across unburned microsites resulted ingenerally higher measured bulk densities in interspaces(1�00 g cm�3) than under tree (0�89 g cm�3) and shrub(0�77 g cm�3) canopies, but the bulk density differencesbetween unburned microsites were not statistically signifi-cant (P> 0�05). Percentage sand was generally lower and
c domain in the USA. Ecohydrol. (2013)
WILDFIRE AS AN ECOHYDROLOGIC THRESHOLD-REVERSAL MECHANISM
silts higher for unburned interspaces than coppice plots.Sand, silt, and clay (0- to 2-cm depth) averaged 46%, 49%,and 5% on unburned interspaces and 66%, 31%, and 3%on unburned juniper and shrub coppices. Gravimetric soilmoisture content was low (<12%) across all plots at thetime of sampling.Wildfire created uniform bare-ground conditions at the
small-plot scale that persisted until the second growingseason. Bare ground (bare soil, rock, and ash) was uniform(85–95%) across all burned microsites 1 year after the firebecause of fire consumption of shrub, grass, and litter cover(Table II). Two years post-fire, herbaceous canopy coverwas greater on burned than unburned interspaces andjuniper coppices and was similar across burned andunburned shrub coppices (Table II). The increases inherbaceous canopy from Year 1 to Year 2 were mostly inthe form of perennial forbs, although grass canopy coverhad returned to unburned levels on juniper canopies and inthe interspace. Shrub canopy cover remained nearly absentin the burn 2 years post-fire. Litter cover was fourfold andtenfold less on burned than unburned shrub and treecoppice plots in Year 2 but was threefold greater on burnedinterspaces relative to unburned plots (Table II).Fire effects on surface soils were most pronounced on
juniper plots. Burning induced a shift in the depth of themost water-repellent layer on juniper coppices (Figure 3).The strength of soil water repellency was highly variableon burned juniper plots but generally was strongest 3 cmbelow the soil surface post-fire. Fire removal of thick littermats underneath trees had no effect on measured aggregatestability until Year 2 (Table II). The absence of tree littercover in Year 2 resulted in similar aggregate stability classratings across all burned plots (Table II). Ground surfaceroughness was lower on burned than unburned tree and
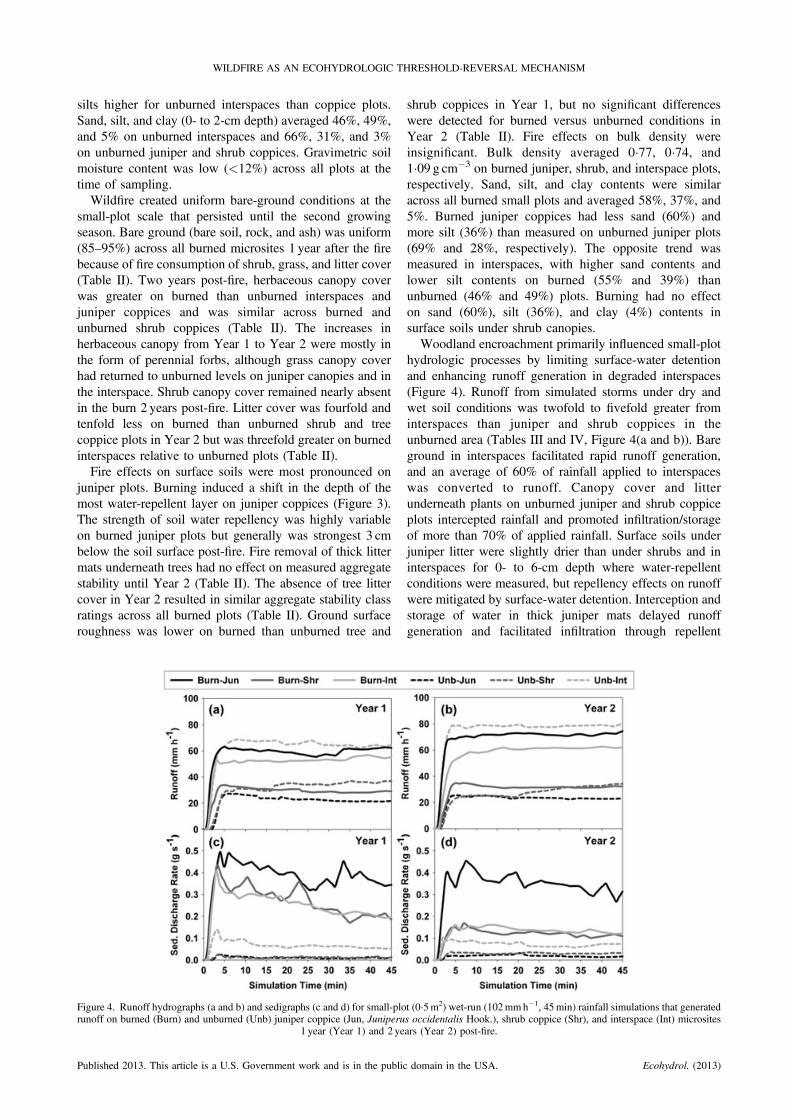
Figure 4. Runoff hydrographs (a and b) and sedigraphs (c and d) for small-plorunoff on burned (Burn) and unburned (Unb) juniper coppice (Jun, Juniperu
1 year (Year 1) and 2 ye
Published 2013. This article is a U.S. Government work and is in the public
shrub coppices in Year 1, but no significant differenceswere detected for burned versus unburned conditions inYear 2 (Table II). Fire effects on bulk density wereinsignificant. Bulk density averaged 0�77, 0�74, and1�09 g cm�3 on burned juniper, shrub, and interspace plots,respectively. Sand, silt, and clay contents were similaracross all burned small plots and averaged 58%, 37%, and5%. Burned juniper coppices had less sand (60%) andmore silt (36%) than measured on unburned juniper plots(69% and 28%, respectively). The opposite trend wasmeasured in interspaces, with higher sand contents andlower silt contents on burned (55% and 39%) thanunburned (46% and 49%) plots. Burning had no effecton sand (60%), silt (36%), and clay (4%) contents insurface soils under shrub canopies.
Woodland encroachment primarily influenced small-plothydrologic processes by limiting surface-water detentionand enhancing runoff generation in degraded interspaces(Figure 4). Runoff from simulated storms under dry andwet soil conditions was twofold to fivefold greater frominterspaces than juniper and shrub coppices in theunburned area (Tables III and IV, Figure 4(a and b)). Bareground in interspaces facilitated rapid runoff generation,and an average of 60% of rainfall applied to interspaceswas converted to runoff. Canopy cover and litterunderneath plants on unburned juniper and shrub coppiceplots intercepted rainfall and promoted infiltration/storageof more than 70% of applied rainfall. Surface soils underjuniper litter were slightly drier than under shrubs and ininterspaces for 0- to 6-cm depth where water-repellentconditions were measured, but repellency effects on runoffwere mitigated by surface-water detention. Interception andstorage of water in thick juniper mats delayed runoffgeneration and facilitated infiltration through repellent
t (0�5m2) wet-run (102mmh�1, 45min) rainfall simulations that generateds occidentalis Hook.), shrub coppice (Shr), and interspace (Int) micrositesars (Year 2) post-fire.
domain in the USA. Ecohydrol. (2013)

TableIII.Average
runoff,infiltration,
sediment,andwettin
gdepthresponse
variablesfordry-run(64mmh�
1,45
min)sm
all-plot
(0�5m
2)rainfallsimulations
onburned
andunburned
areas1year
(Year1)
and2years(Year2)
post-fire.
Year1
Year2
Rainfallsimulationvariable
Burned
Unburned
Burned
Unburned
Juniper
Coppice
Shrub
Coppice
Interspace
Juniper
Coppice
Shrub
Coppice
Interspace
Juniper
Coppice
Shrub
Coppice
Interspace
Juniper
Coppice
Shrub
Coppice
Interspace
Cum
ulativerunoff(m
m)
19cd
5ab
12bc
8ab
4a
20cd
22d
5ab
12bc
9ab
6ab
27d
Meaninfiltrationrate
(mmh�
1)a
31a
–42
b50
bc–
33a
33a
55c
46bc
51bc
–27
aCum
ulativesediment(gm
�2)a
86d
–43
bc5a
–16
ab62
cd14
a14
a3a
–19
abSedim
ent/runoff(gm
�2mm
�1)a
3�31b
–2�7
0b
0�79a
–0�7
1a
2�45b
1�66ab
1�00a
0�65a
–0�7
0a
Percent
wet
at0-
to6-cm
depth
52a
97c
100c
77b
93c
98c
89bc
99c
99c
93c
95c
100c
Percent
wet
at0-
to10-cm
depth
64a
87bc
98c
80b
87bc
96c
82bc
94c
98c
95c
91c
91c
Percent
wet
at0-
to20-cm
depth
72a
67a
81a
79a
73a
77a
74a
74a
85a
90a
80a
65a
Percent
ofplotswith
runoffb
8040
8088
2588
100
8090
100
67100
Num
berof
plots
55
108
88
55
103
34
Means
with
inarow
follo
wed
byadifferentlower
case
letteraresignificantly
different(P
<0�0
5).
aMeans
basedsolely
onplotsthat
generatedrunoff.
bNot
included
instatistical
analysis.
Table
IV.Average
runoff,infiltration,
andsedimentresponse
variablesforwet-run
(102
mmh�
1,45
min)sm
all-plot
(0�5m
2)rainfallsimulations
onburned
andunburned
areas1year
(Year1)
and
2years(Year2)
post-fire.
Year1
Year2
Burned
Unburned
Burned
Unburned
Rainfallsimulationvariable
Juniper
Coppice
Shrub
Coppice
Interspace
Juniper
Coppice
Shrub
Coppice
Interspace
Juniper
Coppice
Shrub
Coppice
Interspace
Juniper
Coppice
Shrub
Coppice
Interspace
Cum
ulativerunoff(m
m)
44c
17a
38bc
17a
15a
47c
52c
23ab
43c
17a
20a
57c
Meaninfiltrationrate
(mmh�
1)a
43a
72bc
50ab
77c
69bc
38a
34a
72bc
45a
77c
75bc
27a
Cum
ulativesediment(gm
�2)a
206b
143b
135b
6a
6a
36a
185b
64a
72a
10a
16a
39a
Sedim
ent/runoff(g
m�2mm
�1)a
3�97c
4�61c
2�97bc
0�36a
0�27a
0�71a
3�23bc
1�77ab
1�46a
0�42a
0�68a
0�69a
Percent
ofplotswith
runoffb
100
80100
100
63100
100
100
100
100
100
100
Num
berof
plots
55
107
88
55
103
33
Means
with
inarow
follo
wed
byadifferentlower
case
letteraresignificantly
different(P
<0�0
5).
aMeans
basedsolely
onplotsthat
generatedrunoff.
bNot
included
instatistical
analysis.
C. J. WILLIAMS et al.
Published 2013. This article is a U.S. Government work and is in the publi
c domain in the USA. Ecohydrol. (2013)
WILDFIRE AS AN ECOHYDROLOGIC THRESHOLD-REVERSAL MECHANISM
surface soils viamacropores or by-passflow, as evident by thewetting trench data (Table III; Meeuwig, 1971; Imeson et al.,1992; Dekker and Ritsema, 1996, 2000; Madsen et al., 2008;Pierson et al., 2008b; Doerr et al., 2009; Robinson et al.,2010; Shakesby, 2011). Sediment-to-runoff ratios from dryand wet-run simulations were similar and low for all unburnedplots (Tables III and IV).Wemeasured twofold to sixfoldmoreerosion from interspaces than coppices for dry and wet runs,but the sediment discharge rates (Figure 4(c and d)) were lowenough that the microsite differences were not significant(Tables III and IV).The effects of soil water repellency on runoff generation
were exacerbated by burning juniper coppices, but the firereduced dry-run runoff from interspacemicrosites (Tables IIIand IV). The removal of protective surface litter from water-repellent soils on juniper coppice plots inhibited infiltrationand amplified runoff (Figure 4(a and b)). Runoff wastwofold to threefold greater on burned than unburned junipercoppices 1 and 2 years post-fire (Tables III and IV). Thecombined effects of cover removal and strong waterrepellency are further evident by the drier soil conditionsover the 0- to 10-cm soil depth on burned juniper coppicesrelative to all other plots after dry run simulations in Year 1(Table III). The fire had no effect on runoff from shrubcoppices (Tables III and IV, Figure 4(a and b)). Burning ininterspaces increased infiltration of the lower intensity dryrun in Year 1, and dry-run runoff from burned interspaces inYear 2 was twofold less than from unburned interspaces(Table III). Differences in wet-run runoff on burned versusunburned interspaces were not significant. Therefore,burning improved infiltration in interspaces for lowerintensity storms, but burned and unburned interspacesremained similarly vulnerable to runoff from more extremeevents (Figure 4(a and b)).Erodibility of surface soils increased following burning
and remained elevated on juniper coppices plots throughYear2 (Figure 4(c and d)). Although measured aggregate stabilityremainedhighon burned juniper coppices inYear 1 (Table II),the amount of sediment per unit of runoff increased fourfoldand 11-fold on burned versus unburned juniper plots for dryand wet runs, respectively (Tables III and IV). Year 1 erosionfrom burned juniper plots was 15-fold to 35-fold greater thanfromunburned juniper coppices (Tables III and IV). Sedimentdischarge rates from wet-run simulations in Year 2 remainedelevated for burned conditions on juniper coppices and wereconsistent with Year 1 levels (Figure 4(c and d)). Cumulativeerosion on burned shrub and interspace microsites was notsignificantly different from unburned levels for the dry run.Erosion from Year 1 wet-run simulations was 25-fold andfourfold higher from burned than unburned shrub coppice andinterspace microsites, respectively (Table IV). Year 2 erosionfrom wet-run simulations on burned shrub and interspaceplots was significantly reduced from Year 1 levels andwas not significantly different than fromunburned conditions.The small-plot results suggest that juniper coppicesremained highly susceptible to erosion from convectivestorms 2 years post-fire and that fire-induced increasederosion on shrub and interspace plots significantly declinedwithin two growing seasons.
Published 2013. This article is a U.S. Government work and is in the public
Large-plot scale
Canopy and ground cover data measured at the large-plotscale in the unburned area confirm site characterization plotestimates of extensive, well-connected bare interspacewithin the intercanopy. Approximately 90% of the shrub-interspace zone was interspace, and more than 75% of theinterspace was bare soil and rock (Table V). Averagecanopy and basal gaps were approximately 100 and130 cm, respectively, on shrub-interspace plots, and abouthalf of the basal gaps in shrub-interspace zones exceeded200 cm (Table V). Canopy and basal gaps were generallysmaller for unburned tree than shrub-interspace zones. Theground surface within canopy and basal gaps on unburnedtree zones was well protected with 70% cover of litter andmore than 20% canopy cover by grasses and forbs(Table V). The variation in cover and surface topographyacross unburned tree and shrub-interspace zones did notproduce differences in measured surface roughness at thelarge-plot scale (Table V).
Burning increased bare-ground exposure across the site inYear 1, but high herbaceous productivity post-fire reducedspatial connectivity of the bare patcheswithin the intercanopy.One year post-fire, bare ground (bare soil, rock, and ash)averaged 75–90% across all burned plots. Fire removal oflitter resulted in fourfoldmore bare ground and 76 and 127 cmlonger average canopy and basal gaps in tree zones 1 yearpost-fire (Table V). Approximately 70% of Year 1 basal gapsin burned tree zones exceeded 200 cm. Post-fire herbaceousproductivity (mostly perennial forbs) within the intercanopyresulted in smaller canopy and basal gaps on burned thanunburned shrub-interspaces in Year 1 (Table V). Herbaceouscanopy cover was 20–30% across burned and unburned areasin Year 2 (Table V). However, more than 75% of Year 2herbaceous canopy within unburned shrub-interspace zoneswas on shrub coppices, whereas herbaceous canopy cover onburned shrub-interspaces in Year 2 was well distributed onshrub and interspace microsites (Table II). Approximately50% of basal and 30% of canopy gaps in unburned shrub-interspaces in Year 2 exceeded 50 cm; only 2% of canopy and20% of basal gaps exceeded 50 cm on Year 2 burned shrub-interspaces. The canopy cover and gap data indicate thatburning resulted in more uniform coverage of grasses andforbs within the intercanopy relative to unburned conditions.Extensive gaps of bare ground (>70 cm) between plant basesin burned tree zones persisted through Year 2, but these areascomprised much less (<30% of total area) of the studydomain than the intercanopy.
The effects of bare, degraded interspace on runoffgeneration and erosion at the large-plot scale wereaccentuated by the high-intensity wet-run simulation(Figure 5). Runoff and erosion from the dry-run simula-tions were generally low for unburned tree and shrub-interspace zones (Table VI). Nearly 100% of the rainfallapplied to tree zone plots during the dry run was eitherstored in thick litter mats or infiltrated into surface soils.Dry-run runoff and erosion from unburned interspaces(Table III) was buffered by shrub coppices and variabilityof surface conditions over the larger shrub-interspace scale.Runoff remained low for wet-run simulations in tree zones,
domain in the USA. Ecohydrol. (2013)

Table
V.Average
surfaceroughness,canopy
(foliar)andground
cover,andcovergaps
measuredon
burned
andunburned
large(13m
2)rainfallsimulationplots1year
post-fire
(Year1)
and
concentrated
flow
plots(9m
2)2yearspost-fire
(Year2).
Year1
Year2
Burned
Unburned
Burned
Unburned
Site
characteristic
TreeZone
Shrub-InterspaceZone
TreeZone
Shrub-InterspaceZone
TreeZone
Shrub-InterspaceZone
TreeZone
Shrub-InterspaceZone
Surface
roughness(m
m)
20�9
a17
�1a
23�4
a16�0
a14
�3a
15�8
ab21
�3b
19�1
abTotal
canopy
cover(%
)a14�5
a31
�9b
26�0
ab18�3
ab27
�0a
42�3
a31
�4a
39�1
aTotal
herbaceous
canopy
cover(%
)b14�0
ab31
�2c
22�5
bc10�6
a17
�7a
29�4
a21
�2a
20�9
aShrub
canopy
cover(%
)0�0
a0�1
a0�8
a6�9
b0�0
a0�1
a1�1
a10
�9b
Grass
canopy
cover(%
)1�5
a8�4
b21�1
c8�1
b0�9
a7�0
a16
�4b
19�1
bLitter
cover(%
)26�4
b9�4
a71�9
c5�9
a15
�7a
13�0
a70
�5b
20�8
aRockcover(%
)19�4
a44
�6b
11�1
a60�1
c29
�3b
34�1
b12
�2a
37�4
bTotal
ground
cover(%
)c74�7
b60
�8a
93�1
c71�6
ab45
�7a
50�3
a89
�4b
61�8
aBaresoil(%
)25�3
b39
�2c
6�9a
28�4
bc54
�3b
49�7
b10
�6a
38�2
bAsh
(%)
28�3
b4�2
a0�0
a0�0
a–
––
–Canopygaps
101–200cm
(%)d
12�9
ab7�9
a10�8
a23�3
b–
––
–Canopygaps
>200cm
(%)d
46�1
b1�2
a5�7
a34�7
b–
––
–Basal
gaps
101–20
0cm
(%)
15�8
a30
�0a
24�4
a22�5
a–
––
–Basal
gaps
>200cm
(%)
70�1
b11
�0a
11�7
a48�0
b–
––
–Average
canopy
gap(cm)d
118�5
b39
�7a
43�0
a97�8
b–
––
–Average
basalgap(cm)
206�8
c61
�4a
80�2
ab130�3
bc–
––
Num
berof
plots
66
66
66
66
Means
with
inarow
byyear
(Year1or
Year2)
follo
wed
byadifferentlower
case
letteraresignificantly
different(P
<0�0
5).
aExcludestree
canopy
removed
forrainfallsimulation.
bGrass
andforb
canopy
cover.
cIncludes
ash,
cryptogram
,litter,liv
eanddead
basalplant,rock,andwoody
dead
cover.
dCanopygaps
measuredaftertree
removal
forrainfallsimulation.
C. J. WILLIAMS et al.
Published 2013. This article is a U.S. Government work and is in the public domain in the USA. Ecohydrol. (2013)

Figure 5. Runoff hydrographs (a) and sedigraphs (b) for large-plot (13m2) wet-run (102mmh�1, 45min) rainfall simulations that generated runoff onburned (Burn, 1 year post-fire) and unburned (Unb) treatments in tree (Tree, Juniperus occidentalis Hook.) and shrub-interspace (Shr-Int) zones.
WILDFIRE AS AN ECOHYDROLOGIC THRESHOLD-REVERSAL MECHANISM
but half the wet-run rainfall applied in shrub-interspacezones exited the plots as runoff (Table VI). The wet-runintensity overwhelmed sources of surface-water detentionin shrub-interspace zones, and high runoff rates promotedconcentrated flow formation. The wet-run sedimentdischarge rate (Figure 5(b)) for shrub-interspaces was twoto four magnitudes higher than measured for unburnedinterspaces and shrub coppices at the small-plot scale(Figure 4(c and d)). We attribute the increased sedimentdischarge across spatial scales to an observed shift in thedominant erosion process from splash-sheet at the finescale to concentrated flow at the large-plot scale. Ourresults are consistent with other recent Great Basinwoodland studies by the authors and indicate that erosionfrom woodland-encroached sagebrush sites increasesexponentially where intercanopy bare ground exceeds50–60% (Figure 6, Pierson et al., 2010).Fire effects on runoff and erosion in Year 1 at the large-
plot scale were similar to those measured on small plotsand were significant for tree zones only. Runoff fromburned tree zones was fourfold to eightfold greater thanfrom unburned tree zones and was similar to runoffmeasured in the shrub-interspace zone (Table VI, Figure 5(a)). We attribute the high runoff rates from burned treezone plots to fire removal of ground cover on stronglywater-repellent soils (Figure 3). Only 60% of the soilprofile over 0- to 6-cm depth was wet within tree zonesfollowing the dry and wet-run simulations (Table VI). Soils0- to 6-cm deep in shrub-interspace zones and unburnedtree zones were 94% to 98% wet after the rainfallsimulations. The high runoff rates and surface soil exposurein burned tree zones resulted in 20-fold to 30-fold increasesin erosion relative to unburned tree zones (Table VI). Wet-run sediment discharge from burned tree zones was morethan two orders of magnitude higher than from unburnedtree zones (Figure 5(b)). Burned shrub-interspaces shed 10%and 50% of applied rainfall as runoff for the dry and wet-runsimulations, respectively, but these values were consistentwith unburned shrub-interspace plots (Table VI). Burninghad no significant effect on cumulative soil loss from shrub-interspace zones. We attribute the lack of significant fireeffects on wet-run simulations in shrub-interspace zonesto encroachment-induced degraded cover conditions, and
Published 2013. This article is a U.S. Government work and is in the public
high runoff and erosion rates within the unburnedintercanopy (e.g., Al-Hamdan et al., 2012c).
Cross-scale runoff and erosion
Runoff and erosion measured across fine (small plot) to patch(large plot) scales in Year 1 demonstrate the effects ofencroachment-induced and fire-induced shifts in the domin-ate erosion process. Contrasting results were obtained forrunoff versus erosion comparisons of small-plot area-weighted and measured large-plot hydrologic and erosionresponses (Figure 7). Area-weighting juniper coppice, shrubcoppice, and interspace wet-run runoff to the large-plot scaleproduced runoff estimates similar to values measured duringwet-run rainfall simulations on tree and shrub-interspacezones (Figure 7(a)). However, the same approach witherosion found soil loss increased with increasing plot scaleacross burned and unburned conditions (Figure 7(b)). Theincreased soil loss across spatial scales without increasedrunoff further suggests that concentrated flow was thedominant erosion process on shrub-interspace and burnedtree zones. Concentrated flow was observed duringrainfall simulations on most burned and unburnedshrub-interspace and burned tree zone plots. Concentratedflow is a more efficient transport mechanism for rain-splash detached sediment than sheetflow and has moreerosive energy for detachment of soil particles within theflow (Al-Hamdan et al., 2012a, 2012b).
Concentrated flow experiments
Ground cover differences across burned and unburnedconditions 1 year post-fire significantly affected runoffand erosion from simulated overland flow. The combined15–45 Lmin�1 flow releases generated threefold morerunoff and 15-fold more erosion from degraded unburnedshrub-interspace zones than from tree zones (Table VII).Litter cover in unburned tree zones captured and storedoverland flow, promoted infiltration, and protected theground surface from the erosive energy of runoff. Fireremoval of tree litter increased cumulative runoff, anderosion from 15–45 Lmin�1 releases twofold and tenfoldin Year 1 and resulted in similar concentrated flow runoffacross burned tree zones and all shrub-interspace plots
domain in the USA. Ecohydrol. (2013)
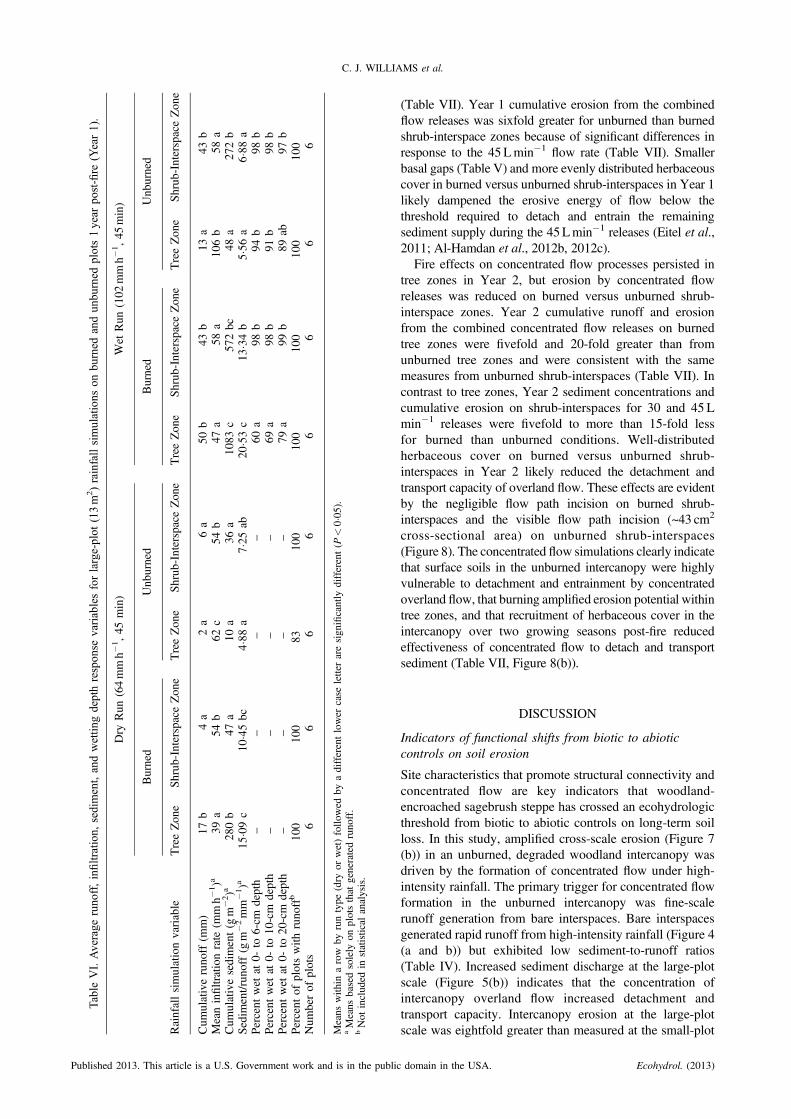
Table
VI.Average
runoff,infiltration,
sediment,andwettin
gdepthresponse
variablesforlarge-plot
(13m
2)rainfallsimulations
onburned
andunburned
plots1year
post-fire
(Year1).
Dry
Run
(64mmh�
1,45
min)
Wet
Run
(102
mmh�
1,45
min)
Burned
Unburned
Burned
Unburned
Rainfallsimulationvariable
TreeZone
Shrub-InterspaceZone
TreeZone
Shrub-InterspaceZone
TreeZone
Shrub-InterspaceZone
TreeZone
Shrub-InterspaceZone
Cum
ulativerunoff(m
m)
17b
4a
2a
6a
50b
43b
13a
43b
Meaninfiltrationrate
(mmh�
1)a
39a
54b
62c
54b
47a
58a
106b
58a
Cum
ulativesediment(gm
�2)a
280b
47a
10a
36a
1083
c572bc
48a
272b
Sedim
ent/runoff(gm
�2mm
�1)a
15�09
c10�45
bc4�8
8a
7�25ab
20�53
c13
�34b
5�56a
6�88a
Percent
wet
at0-
to6-cm
depth
––
––
60a
98b
94b
98b
Percent
wet
at0-
to10-cm
depth
––
––
69a
98b
91b
98b
Percent
wet
at0-
to20-cm
depth
––
––
79a
99b
89ab
97b
Percent
ofplotswith
runoffb
100
100
83100
100
100
100
100
Num
berof
plots
66
66
66
66
Means
with
inarow
byruntype
(dry
orwet)follo
wed
byadifferentlower
case
letteraresignificantly
different(P
<0�0
5).
aMeans
basedsolely
onplotsthat
generatedrunoff.
bNot
included
instatistical
analysis.
C. J. WILLIAMS et al.
Published 2013. This article is a U.S. Government work and is in the publi
(Table VII). Year 1 cumulative erosion from the combinedflow releases was sixfold greater for unburned than burnedshrub-interspace zones because of significant differences inresponse to the 45Lmin�1 flow rate (Table VII). Smallerbasal gaps (Table V) and more evenly distributed herbaceouscover in burned versus unburned shrub-interspaces in Year 1likely dampened the erosive energy of flow below thethreshold required to detach and entrain the remainingsediment supply during the 45Lmin�1 releases (Eitel et al.,2011; Al-Hamdan et al., 2012b, 2012c).
Fire effects on concentrated flow processes persisted intree zones in Year 2, but erosion by concentrated flowreleases was reduced on burned versus unburned shrub-interspace zones. Year 2 cumulative runoff and erosionfrom the combined concentrated flow releases on burnedtree zones were fivefold and 20-fold greater than fromunburned tree zones and were consistent with the samemeasures from unburned shrub-interspaces (Table VII). Incontrast to tree zones, Year 2 sediment concentrations andcumulative erosion on shrub-interspaces for 30 and 45 Lmin�1 releases were fivefold to more than 15-fold lessfor burned than unburned conditions. Well-distributedherbaceous cover on burned versus unburned shrub-interspaces in Year 2 likely reduced the detachment andtransport capacity of overland flow. These effects are evidentby the negligible flow path incision on burned shrub-interspaces and the visible flow path incision (~43 cm2
cross-sectional area) on unburned shrub-interspaces(Figure 8). The concentrated flow simulations clearly indicatethat surface soils in the unburned intercanopy were highlyvulnerable to detachment and entrainment by concentratedoverland flow, that burning amplified erosion potential withintree zones, and that recruitment of herbaceous cover in theintercanopy over two growing seasons post-fire reducedeffectiveness of concentrated flow to detach and transportsediment (Table VII, Figure 8(b)).
DISCUSSION
Indicators of functional shifts from biotic to abioticcontrols on soil erosion
Site characteristics that promote structural connectivity andconcentrated flow are key indicators that woodland-encroached sagebrush steppe has crossed an ecohydrologicthreshold from biotic to abiotic controls on long-term soilloss. In this study, amplified cross-scale erosion (Figure 7(b)) in an unburned, degraded woodland intercanopy wasdriven by the formation of concentrated flow under high-intensity rainfall. The primary trigger for concentrated flowformation in the unburned intercanopy was fine-scalerunoff generation from bare interspaces. Bare interspacesgenerated rapid runoff from high-intensity rainfall (Figure 4(a and b)) but exhibited low sediment-to-runoff ratios(Table IV). Increased sediment discharge at the large-plotscale (Figure 5(b)) indicates that the concentration ofintercanopy overland flow increased detachment andtransport capacity. Intercanopy erosion at the large-plotscale was eightfold greater than measured at the small-plot
c domain in the USA. Ecohydrol. (2013)
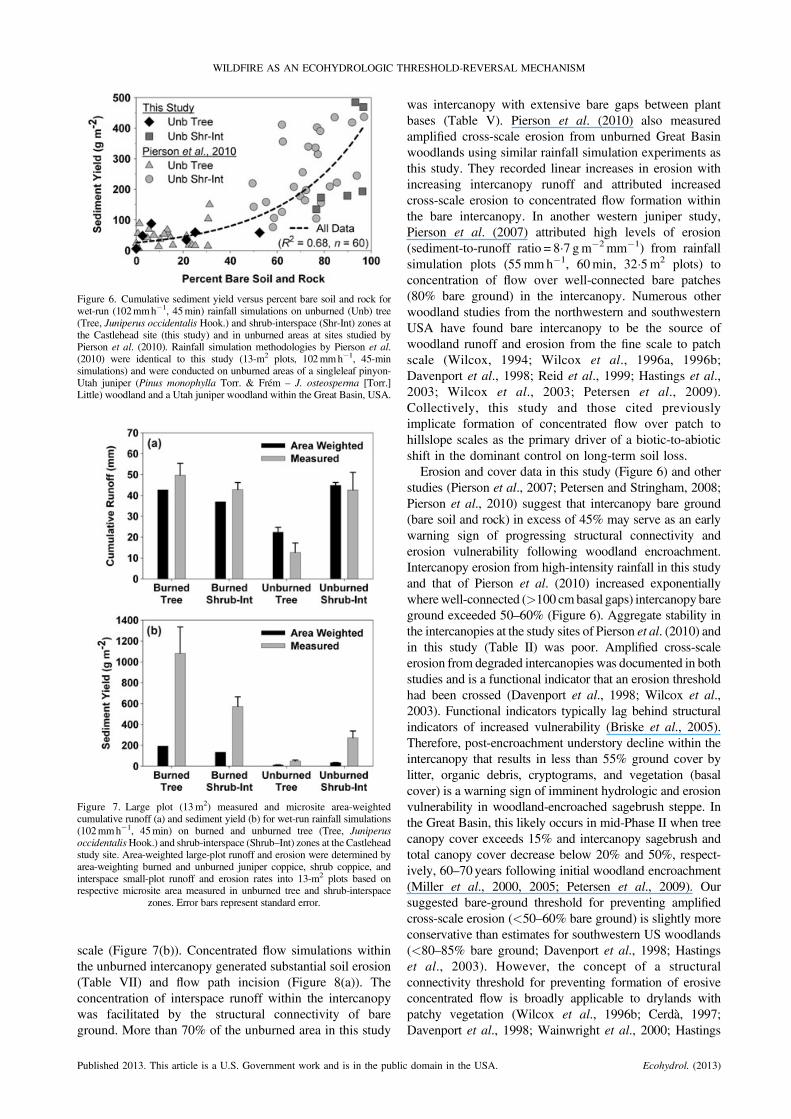
Figure 6. Cumulative sediment yield versus percent bare soil and rock forwet-run (102mmh�1, 45min) rainfall simulations on unburned (Unb) tree(Tree, Juniperus occidentalis Hook.) and shrub-interspace (Shr-Int) zones atthe Castlehead site (this study) and in unburned areas at sites studied byPierson et al. (2010). Rainfall simulation methodologies by Pierson et al.(2010) were identical to this study (13-m2 plots, 102mmh�1, 45-minsimulations) and were conducted on unburned areas of a singleleaf pinyon-Utah juniper (Pinus monophylla Torr. & Frém – J. osteosperma [Torr.]Little) woodland and a Utah juniper woodland within the Great Basin, USA.
Figure 7. Large plot (13m2) measured and microsite area-weightedcumulative runoff (a) and sediment yield (b) for wet-run rainfall simulations(102mmh�1, 45min) on burned and unburned tree (Tree, JuniperusoccidentalisHook.) and shrub-interspace (Shrub–Int) zones at the Castleheadstudy site. Area-weighted large-plot runoff and erosion were determined byarea-weighting burned and unburned juniper coppice, shrub coppice, andinterspace small-plot runoff and erosion rates into 13-m2 plots based onrespective microsite area measured in unburned tree and shrub-interspace
zones. Error bars represent standard error.
WILDFIRE AS AN ECOHYDROLOGIC THRESHOLD-REVERSAL MECHANISM
scale (Figure 7(b)). Concentrated flow simulations withinthe unburned intercanopy generated substantial soil erosion(Table VII) and flow path incision (Figure 8(a)). Theconcentration of interspace runoff within the intercanopywas facilitated by the structural connectivity of bareground. More than 70% of the unburned area in this study
Published 2013. This article is a U.S. Government work and is in the public
was intercanopy with extensive bare gaps between plantbases (Table V). Pierson et al. (2010) also measuredamplified cross-scale erosion from unburned Great Basinwoodlands using similar rainfall simulation experiments asthis study. They recorded linear increases in erosion withincreasing intercanopy runoff and attributed increasedcross-scale erosion to concentrated flow formation withinthe bare intercanopy. In another western juniper study,Pierson et al. (2007) attributed high levels of erosion(sediment-to-runoff ratio = 8�7 gm�2mm�1) from rainfallsimulation plots (55mmh�1, 60min, 32�5m2 plots) toconcentration of flow over well-connected bare patches(80% bare ground) in the intercanopy. Numerous otherwoodland studies from the northwestern and southwesternUSA have found bare intercanopy to be the source ofwoodland runoff and erosion from the fine scale to patchscale (Wilcox, 1994; Wilcox et al., 1996a, 1996b;Davenport et al., 1998; Reid et al., 1999; Hastings et al.,2003; Wilcox et al., 2003; Petersen et al., 2009).Collectively, this study and those cited previouslyimplicate formation of concentrated flow over patch tohillslope scales as the primary driver of a biotic-to-abioticshift in the dominant control on long-term soil loss.
Erosion and cover data in this study (Figure 6) and otherstudies (Pierson et al., 2007; Petersen and Stringham, 2008;Pierson et al., 2010) suggest that intercanopy bare ground(bare soil and rock) in excess of 45% may serve as an earlywarning sign of progressing structural connectivity anderosion vulnerability following woodland encroachment.Intercanopy erosion from high-intensity rainfall in this studyand that of Pierson et al. (2010) increased exponentiallywherewell-connected (>100 cmbasal gaps) intercanopy bareground exceeded 50–60% (Figure 6). Aggregate stability inthe intercanopies at the study sites of Pierson et al. (2010) andin this study (Table II) was poor. Amplified cross-scaleerosion from degraded intercanopies was documented in bothstudies and is a functional indicator that an erosion thresholdhad been crossed (Davenport et al., 1998; Wilcox et al.,2003). Functional indicators typically lag behind structuralindicators of increased vulnerability (Briske et al., 2005).Therefore, post-encroachment understory decline within theintercanopy that results in less than 55% ground cover bylitter, organic debris, cryptograms, and vegetation (basalcover) is a warning sign of imminent hydrologic and erosionvulnerability in woodland-encroached sagebrush steppe. Inthe Great Basin, this likely occurs in mid-Phase II when treecanopy cover exceeds 15% and intercanopy sagebrush andtotal canopy cover decrease below 20% and 50%, respect-ively, 60–70 years following initial woodland encroachment(Miller et al., 2000, 2005; Petersen et al., 2009). Oursuggested bare-ground threshold for preventing amplifiedcross-scale erosion (<50–60% bare ground) is slightly moreconservative than estimates for southwestern US woodlands(<80–85% bare ground; Davenport et al., 1998; Hastingset al., 2003). However, the concept of a structuralconnectivity threshold for preventing formation of erosiveconcentrated flow is broadly applicable to drylands withpatchy vegetation (Wilcox et al., 1996b; Cerdà, 1997;Davenport et al., 1998; Wainwright et al., 2000; Hastings
domain in the USA. Ecohydrol. (2013)

Table
VII.Runoffanderosionvariablesforconcentrated
flow
experimentson
burned
andunburned
tree
andshrub-interspace
zone
plots1year
(Year1)
and2years(Year2)
post-fire.
Year1
Year2
Burned
Unburned
Burned
Unburned
Variable
Release
rate
(Lmin
�1)
TreeZone
Shrub-Interspace
Zone
TreeZone
Shrub-Interspace
Zone
TreeZone
Shrub-Interspace
Zone
TreeZone
Shrub-Interspace
Zone
Cum
ulativerunoff(L)
1564
b44
b2a
62b
58b
30ab
0a
43ab
30196b
207b
56a
193b
167b
120b
11a
154b
45336b
323b
155a
322b
300b
269b
90a
306b
Average
runoffrate
(Lmin
�1)
158b
5b
0a
7b
7b
4ab
0a
5ab
3023
b24
b7a
23b
20b
14b
1a
18b
4540
b38
b18
a38
b35
b32
b11
a36
bCum
ulativesediment(g)
15381a
239a
a204a
1219
b24
ab
79a
305236
c941b
205ac
4772
bc1509
c145b
37ad
1062
c45
3875
b2218
b1084
a14597c
2427
b263a
185a
4453
bAverage
sedimentconc.(g
L�1)
155a
3a
a3a
19b
1a
b2a
3031
b5a
3ac
23a
8c
1a
1ab
d5bc
4513
bc7ab
5a
45c
8b
1a
2a
14b
Means
with
inarow
byyear
(Year1or
Year2)
follo
wed
byadifferentlower
case
letteraresignificantly
different(P
<0�0
5,means
basedon
5≤n≤6except
where
noted).
aOne
ofsixplotsgeneratedrunoff(n=1).
bZeroof
sixplotsgeneratedrunoff(n=0).
cFourof
sixplotsgeneratedrunoff(n=4).
dThree
ofsixplotsgeneratedrunoff(n=3).
C. J. WILLIAMS et al.
Published 2013. This article is a U.S. Government work and is in the public domain in the USA. Ecohydrol. (2013)
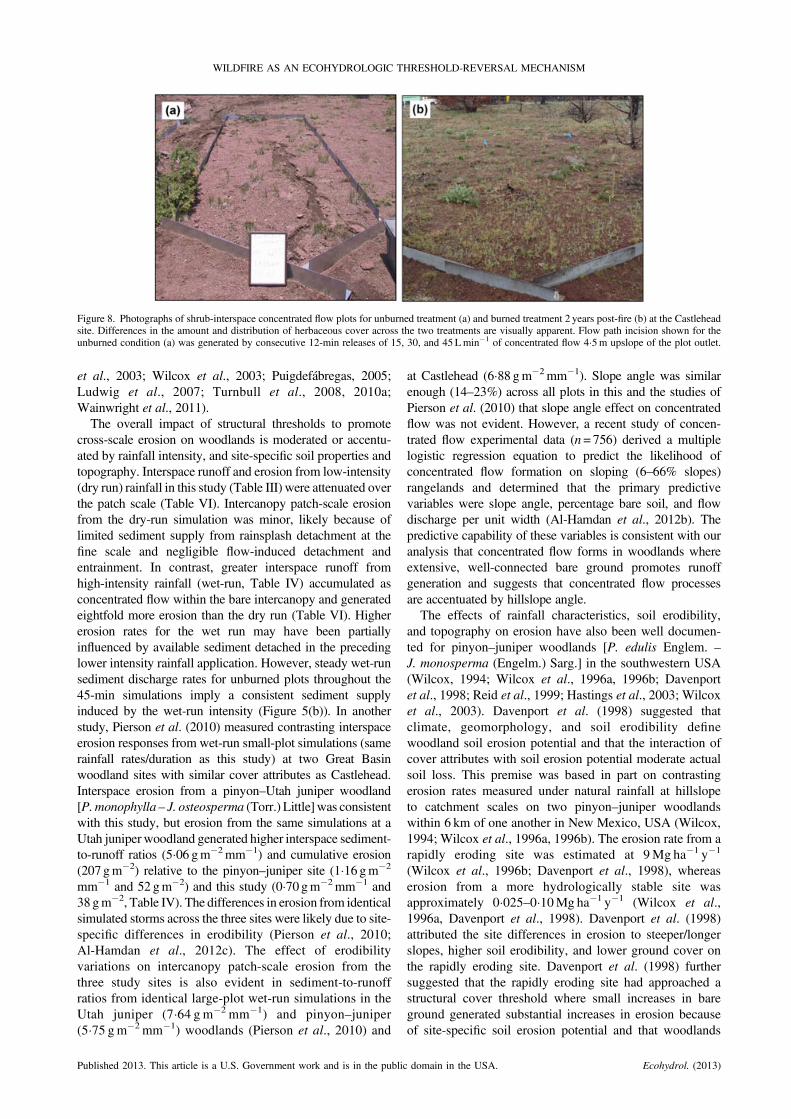
Figure 8. Photographs of shrub-interspace concentrated flow plots for unburned treatment (a) and burned treatment 2 years post-fire (b) at the Castleheadsite. Differences in the amount and distribution of herbaceous cover across the two treatments are visually apparent. Flow path incision shown for theunburned condition (a) was generated by consecutive 12-min releases of 15, 30, and 45Lmin�1 of concentrated flow 4�5m upslope of the plot outlet.
WILDFIRE AS AN ECOHYDROLOGIC THRESHOLD-REVERSAL MECHANISM
et al., 2003; Wilcox et al., 2003; Puigdefábregas, 2005;Ludwig et al., 2007; Turnbull et al., 2008, 2010a;Wainwright et al., 2011).The overall impact of structural thresholds to promote
cross-scale erosion on woodlands is moderated or accentu-ated by rainfall intensity, and site-specific soil properties andtopography. Interspace runoff and erosion from low-intensity(dry run) rainfall in this study (Table III) were attenuated overthe patch scale (Table VI). Intercanopy patch-scale erosionfrom the dry-run simulation was minor, likely because oflimited sediment supply from rainsplash detachment at thefine scale and negligible flow-induced detachment andentrainment. In contrast, greater interspace runoff fromhigh-intensity rainfall (wet-run, Table IV) accumulated asconcentrated flow within the bare intercanopy and generatedeightfold more erosion than the dry run (Table VI). Highererosion rates for the wet run may have been partiallyinfluenced by available sediment detached in the precedinglower intensity rainfall application. However, steady wet-runsediment discharge rates for unburned plots throughout the45-min simulations imply a consistent sediment supplyinduced by the wet-run intensity (Figure 5(b)). In anotherstudy, Pierson et al. (2010) measured contrasting interspaceerosion responses from wet-run small-plot simulations (samerainfall rates/duration as this study) at two Great Basinwoodland sites with similar cover attributes as Castlehead.Interspace erosion from a pinyon–Utah juniper woodland[P.monophylla – J. osteosperma (Torr.) Little] was consistentwith this study, but erosion from the same simulations at aUtah juniper woodland generated higher interspace sediment-to-runoff ratios (5�06 gm�2mm�1) and cumulative erosion(207 gm�2) relative to the pinyon–juniper site (1�16 gm�2
mm�1 and 52 gm�2) and this study (0�70 gm�2mm�1 and38 gm�2, Table IV). The differences in erosion from identicalsimulated storms across the three sites were likely due to site-specific differences in erodibility (Pierson et al., 2010;Al-Hamdan et al., 2012c). The effect of erodibilityvariations on intercanopy patch-scale erosion from thethree study sites is also evident in sediment-to-runoffratios from identical large-plot wet-run simulations in theUtah juniper (7�64 g m�2 mm�1) and pinyon–juniper(5�75 gm�2 mm�1) woodlands (Pierson et al., 2010) and
Published 2013. This article is a U.S. Government work and is in the public
at Castlehead (6�88 gm�2mm�1). Slope angle was similarenough (14–23%) across all plots in this and the studies ofPierson et al. (2010) that slope angle effect on concentratedflow was not evident. However, a recent study of concen-trated flow experimental data (n=756) derived a multiplelogistic regression equation to predict the likelihood ofconcentrated flow formation on sloping (6–66% slopes)rangelands and determined that the primary predictivevariables were slope angle, percentage bare soil, and flowdischarge per unit width (Al-Hamdan et al., 2012b). Thepredictive capability of these variables is consistent with ouranalysis that concentrated flow forms in woodlands whereextensive, well-connected bare ground promotes runoffgeneration and suggests that concentrated flow processesare accentuated by hillslope angle.
The effects of rainfall characteristics, soil erodibility,and topography on erosion have also been well documen-ted for pinyon–juniper woodlands [P. edulis Englem. –J. monosperma (Engelm.) Sarg.] in the southwestern USA(Wilcox, 1994; Wilcox et al., 1996a, 1996b; Davenportet al., 1998; Reid et al., 1999; Hastings et al., 2003; Wilcoxet al., 2003). Davenport et al. (1998) suggested thatclimate, geomorphology, and soil erodibility definewoodland soil erosion potential and that the interaction ofcover attributes with soil erosion potential moderate actualsoil loss. This premise was based in part on contrastingerosion rates measured under natural rainfall at hillslopeto catchment scales on two pinyon–juniper woodlandswithin 6 km of one another in New Mexico, USA (Wilcox,1994; Wilcox et al., 1996a, 1996b). The erosion rate from arapidly eroding site was estimated at 9Mg ha�1 y�1
(Wilcox et al., 1996b; Davenport et al., 1998), whereaserosion from a more hydrologically stable site wasapproximately 0�025–0�10Mg ha�1 y�1 (Wilcox et al.,1996a, Davenport et al., 1998). Davenport et al. (1998)attributed the site differences in erosion to steeper/longerslopes, higher soil erodibility, and lower ground cover onthe rapidly eroding site. Davenport et al. (1998) furthersuggested that the rapidly eroding site had approached astructural cover threshold where small increases in bareground generated substantial increases in erosion becauseof site-specific soil erosion potential and that woodlands
domain in the USA. Ecohydrol. (2013)
C. J. WILLIAMS et al.
with low soil erosion potential may accommodate subtlecover declines to some degree. Field studies of the sitesdescribed by Davenport et al. (1998) found that runoff anderosion from the stable and the rapidly eroding sites werehighest during high-intensity, convective storms (Wilcox,1994; Wilcox et al., 1996b). An additional study at themore stable woodland found that differences in runoff anderosion between intercanopy and canopy patches wereaccentuated by high-intensity convective storms and thatnearly all of the erosion from the site was delivered from barepatches in the intercanopy (Reid et al., 1999). Hastings et al.(2003) reported that the erosivity of rainfall was the bestsingle variable for predicting hillslope-scale measuredsediment yield from another rapidly eroding pinyon–juniperwoodland in New Mexico. Findings in this study areconsistent with studies discussed previously (Wilcox, 1994;Wilcox et al., 1996a, 1996b; Davenport et al., 1998; Reidet al., 1999; Hastings et al., 2003) in suggesting that structuralconnectivity interacts with rainfall intensity and soilerodibility to define storm erosion rates.
Fire as hysteresis mechanism to decrease woodlandecohydrologic resilience
First year hydrologic responses to severe burning of late-succession woodlands may initiate a hysteretic reduction(Scheffer et al., 2001; Scheffer and Carpenter, 2003;Suding et al., 2004; Briske et al., 2008; Turnbull et al.,2008, 2012) of woodland ecohydrologic resilience. Thestructural connectivity and functional (runoff and erosionprocesses) connectivity of intercanopy bare ground inGreat Basin Phase II to Phase III woodlands develop over aperiod of 70–80 years or more (Miller et al., 2005; Johnsonand Miller, 2006; Miller et al., 2008). The time required forreversal of Phase II to Phase III woodland structure–function to that of sagebrush steppe is generally unknown,but interim reduced runoff and erosion through understorycover recruitment may accentuate the reversal process(Bates et al., 2000, 2002, 2005; Miller et al., 2005; Piersonet al., 2007; Bates and Svejcar, 2009; Bates et al., 2009).This hysteresis effect or gradual reversal requires a trigger(i.e., tree removal) to reduce the competition between treesand understory cover and to invoke a positive feedbackswitch for reduction of woodland ecohydrologic resilience(Briske et al., 2006, 2008). Wildfire in this study causedtree removal and altered runoff and erosion processes. Thefirst year effect was an increase in runoff and erosion acrossuniform bare ground that was most evident in the water-repellent tree zone (Tables IV and VI; Figures 5 and 8).The dominant erosion process at the patch scale on burnedplots was concentrated flow. Simulated concentrated flowon burned plots produced similar runoff to the degradedshrub-interspace zones (Table VII). Erosion from concen-trated flow simulations was amplified in tree zones(Table VII) but was slightly lower for burned thanunburned shrub-interspaces because of forb cover recruit-ment (Table V). The Year 1 fire effects seem negative(tending to sustain site degradation) in the sense of waterand soil retention but may act to redistribute resources
Published 2013. This article is a U.S. Government work and is in the publi
across the site in lower intensity rainfall events. Ravi et al.(2007, 2009, 2010) found that burning of shrub-encroachedgrasslands in the southwestern USA enhanced winderosion processes from water-repellent soils on shrubcoppices and had only minor effects on interspace erosion.The enhanced erosion from shrub mounds redistributedaccumulated soil resources to interspaces. The fire-inducedresource transfers created a more homogeneous distributionof nutrients across the landscape, potentially initiatingreversal (positive feedback) of the shrub encroachmentprocess. Davies et al. (2009) found that burning of a GreatBasin sagebrush rangeland reduced resource heterogeneitybetween shrubs and interspaces but did not entirelyeliminate the resource island effect. In this study, junipercoppices and tree zones were hydrologically stablecomponents of the landscape pre-fire and generated veryminor soil loss (Figures 4 and 5). Fire-induced reversal ofthese attributes (Tables IV and VI) likely resulted in transferof water and nutrient-enriched soils (Blank et al., 1994,DeBano et al., 1998; Blank et al., 2003; Rau et al., 2007)throughout the intercanopy by splash-sheet processes inlow-intensity storms and may have contributed to post-fireintercanopy plant recruitment.
The hysteretic effect of burning on woodland ecohydro-logic resilience in this study is most evident in vegetation andhydrologic responses in the second year post-fire. Two yearspost-fire, herbaceous canopy cover in burned shrub-interspace zones was more uniform than in unburned shrub-interspace zones (Figure 8). The more uniform distributionwas due primarily to forb recruitment in burned interspaces(Table II). Bare ground remained greater than 80% in theburned intercanopy, but gaps between basal plant cover weresignificantly reduced (80% were <50 cm). Forb recruitmentin the second year post-fire improved interspace infiltration ofthe lower intensity dry-run rainfall simulation (Table III) andsignificantly reduced erosion (more than tenfold) fromconcentrated flow releases (Table VII). Incision of concen-trated flow on burned shrub-interspaces was negligible,whereas flow path incision on unburned shrub-interspaceplots exceeded 40 cm2. The more uniform basal plant coverby forbs on burned versus unburned shrub-interspaces mayhave reduced shear stress applied to the soil, thereby reducingflowpath incision and soil erosion (Al-Hamdan et al., 2012b).Improved interspace infiltration of the low-intensity stormand decreased erosion on concentrated flow plots suggest thatthe intercanopy hydrologic and erosion vulnerability werereduced at least for lower intensity (less than wet-runintensity) storms with limited concentrated flow. Tree zonesremained vulnerable to erosion from low and high-intensitystorms 2 years post-fire, but they represent<30% of the totalland area at Castlehead. The improvements in infiltration andsurface protection against erosion (relative to unburnedconditions) across the remaining 70% or more of the burnedarea suggest that fire reduced the ecohydrologic resilience ofwoodland encroachment at Castlehead. Studies from intactmountain big sagebrush sites indicate that the relativehydrologic and erosion recovery periods following burningof sites in soil moisture/temperature regimes like Castleheadare 1 and 2–3 years, respectively (Pierson et al., 2008a,
c domain in the USA. Ecohydrol. (2013)
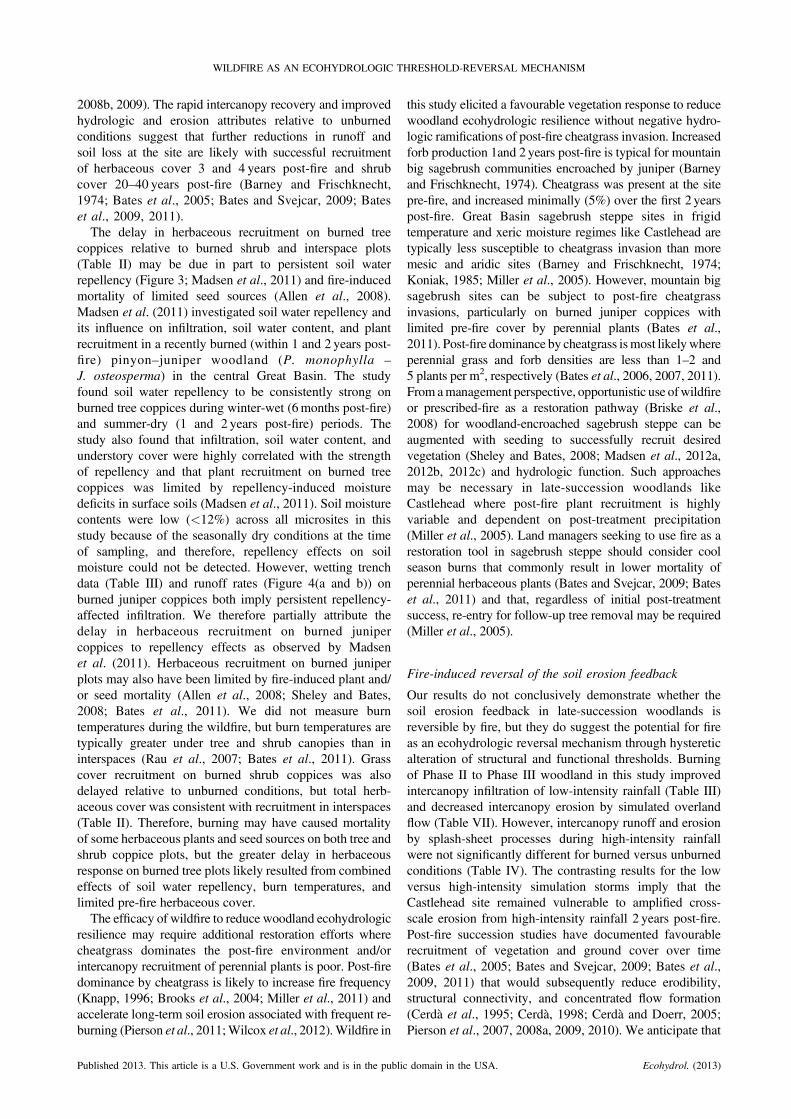
WILDFIRE AS AN ECOHYDROLOGIC THRESHOLD-REVERSAL MECHANISM
2008b, 2009). The rapid intercanopy recovery and improvedhydrologic and erosion attributes relative to unburnedconditions suggest that further reductions in runoff andsoil loss at the site are likely with successful recruitmentof herbaceous cover 3 and 4 years post-fire and shrubcover 20–40 years post-fire (Barney and Frischknecht,1974; Bates et al., 2005; Bates and Svejcar, 2009; Bateset al., 2009, 2011).The delay in herbaceous recruitment on burned tree
coppices relative to burned shrub and interspace plots(Table II) may be due in part to persistent soil waterrepellency (Figure 3; Madsen et al., 2011) and fire-inducedmortality of limited seed sources (Allen et al., 2008).Madsen et al. (2011) investigated soil water repellency andits influence on infiltration, soil water content, and plantrecruitment in a recently burned (within 1 and 2 years post-fire) pinyon–juniper woodland (P. monophylla –J. osteosperma) in the central Great Basin. The studyfound soil water repellency to be consistently strong onburned tree coppices during winter-wet (6months post-fire)and summer-dry (1 and 2 years post-fire) periods. Thestudy also found that infiltration, soil water content, andunderstory cover were highly correlated with the strengthof repellency and that plant recruitment on burned treecoppices was limited by repellency-induced moisturedeficits in surface soils (Madsen et al., 2011). Soil moisturecontents were low (<12%) across all microsites in thisstudy because of the seasonally dry conditions at the timeof sampling, and therefore, repellency effects on soilmoisture could not be detected. However, wetting trenchdata (Table III) and runoff rates (Figure 4(a and b)) onburned juniper coppices both imply persistent repellency-affected infiltration. We therefore partially attribute thedelay in herbaceous recruitment on burned junipercoppices to repellency effects as observed by Madsenet al. (2011). Herbaceous recruitment on burned juniperplots may also have been limited by fire-induced plant and/or seed mortality (Allen et al., 2008; Sheley and Bates,2008; Bates et al., 2011). We did not measure burntemperatures during the wildfire, but burn temperatures aretypically greater under tree and shrub canopies than ininterspaces (Rau et al., 2007; Bates et al., 2011). Grasscover recruitment on burned shrub coppices was alsodelayed relative to unburned conditions, but total herb-aceous cover was consistent with recruitment in interspaces(Table II). Therefore, burning may have caused mortalityof some herbaceous plants and seed sources on both tree andshrub coppice plots, but the greater delay in herbaceousresponse on burned tree plots likely resulted from combinedeffects of soil water repellency, burn temperatures, andlimited pre-fire herbaceous cover.The efficacy of wildfire to reduce woodland ecohydrologic
resilience may require additional restoration efforts wherecheatgrass dominates the post-fire environment and/orintercanopy recruitment of perennial plants is poor. Post-firedominance by cheatgrass is likely to increase fire frequency(Knapp, 1996; Brooks et al., 2004; Miller et al., 2011) andaccelerate long-term soil erosion associated with frequent re-burning (Pierson et al., 2011;Wilcox et al., 2012).Wildfire in
Published 2013. This article is a U.S. Government work and is in the public
this study elicited a favourable vegetation response to reducewoodland ecohydrologic resilience without negative hydro-logic ramifications of post-fire cheatgrass invasion. Increasedforb production 1and 2 years post-fire is typical for mountainbig sagebrush communities encroached by juniper (Barneyand Frischknecht, 1974). Cheatgrass was present at the sitepre-fire, and increased minimally (5%) over the first 2 yearspost-fire. Great Basin sagebrush steppe sites in frigidtemperature and xeric moisture regimes like Castlehead aretypically less susceptible to cheatgrass invasion than moremesic and aridic sites (Barney and Frischknecht, 1974;Koniak, 1985; Miller et al., 2005). However, mountain bigsagebrush sites can be subject to post-fire cheatgrassinvasions, particularly on burned juniper coppices withlimited pre-fire cover by perennial plants (Bates et al.,2011). Post-fire dominance by cheatgrass ismost likelywhereperennial grass and forb densities are less than 1–2 and5 plants per m2, respectively (Bates et al., 2006, 2007, 2011).From amanagement perspective, opportunistic use ofwildfireor prescribed-fire as a restoration pathway (Briske et al.,2008) for woodland-encroached sagebrush steppe can beaugmented with seeding to successfully recruit desiredvegetation (Sheley and Bates, 2008; Madsen et al., 2012a,2012b, 2012c) and hydrologic function. Such approachesmay be necessary in late-succession woodlands likeCastlehead where post-fire plant recruitment is highlyvariable and dependent on post-treatment precipitation(Miller et al., 2005). Land managers seeking to use fire as arestoration tool in sagebrush steppe should consider coolseason burns that commonly result in lower mortality ofperennial herbaceous plants (Bates and Svejcar, 2009; Bateset al., 2011) and that, regardless of initial post-treatmentsuccess, re-entry for follow-up tree removal may be required(Miller et al., 2005).
Fire-induced reversal of the soil erosion feedback
Our results do not conclusively demonstrate whether thesoil erosion feedback in late-succession woodlands isreversible by fire, but they do suggest the potential for fireas an ecohydrologic reversal mechanism through hystereticalteration of structural and functional thresholds. Burningof Phase II to Phase III woodland in this study improvedintercanopy infiltration of low-intensity rainfall (Table III)and decreased intercanopy erosion by simulated overlandflow (Table VII). However, intercanopy runoff and erosionby splash-sheet processes during high-intensity rainfallwere not significantly different for burned versus unburnedconditions (Table IV). The contrasting results for the lowversus high-intensity simulation storms imply that theCastlehead site remained vulnerable to amplified cross-scale erosion from high-intensity rainfall 2 years post-fire.Post-fire succession studies have documented favourablerecruitment of vegetation and ground cover over time(Bates et al., 2005; Bates and Svejcar, 2009; Bates et al.,2009, 2011) that would subsequently reduce erodibility,structural connectivity, and concentrated flow formation(Cerdà et al., 1995; Cerdà, 1998; Cerdà and Doerr, 2005;Pierson et al., 2007, 2008a, 2009, 2010). We anticipate that
domain in the USA. Ecohydrol. (2013)
C. J. WILLIAMS et al.
runoff and erosion at the Castlehead site will continue todecrease as the structural connectivity and functionalconnectivity that support abiotic-driven soil loss dissi-pate. Of course, variability in the recovery process isexpected because of short-term climate fluctuations.Furthermore, tree recruitment at the site continues, andthe risk for advancing tree cover and re-establishment ofwoodland structure and function is imminent withoutintervention or re-establishment of fire cycles that controlwoodland encroachment (Miller et al., 2005). Theultimate culmination in cover requirements to reversethe structural–functional thresholds for concentratedflow and amplified soil loss is indeterminate from ourshort-term study. Longer-term studies of woodlandvegetation and hydrologic responses to wildfire andprescribed fire are needed across the domain of woodlandencroachment to definitively address the potential forfire-induced reversal of the soil erosion feedback in late-succession woodlands.
SUMMARY AND CONCLUSIONS
Cross-scale vegetation, runoff, and erosion data collectedin this study reveal structural thresholds for functionalshifts in the dominant control on soil erosion fromwoodland-encroached sagebrush steppe in the Great Basin.We measured amplified cross-scale soil loss from high-intensity rainfall on a historic sagebrush steppe site in thelater stages of woodland succession. High rates of erosionacross spatial scales resulted from the concentration ofrunoff within well-connected bare areas in the degradedintercanopy. Our results are consistent with other GreatBasin woodland studies and suggest that 50–60% bareground and frequent basal gaps in excess of 1m within theintercanopy represent structural thresholds for concentratedflow formation and amplified cross-scale erosion. Thesethresholds are key indicators of a functional shift frombiotic (vegetation)-controlled resource conservation toabiotic-controlled losses of critical soil resources. ForGreat Basin woodlands, intercanopy ground cover declineto 55% serves as an early warning sign that a site isapproaching the biotic-to-abiotic shift and an ecohydrolo-gic threshold for long-term site degradation. Theseconditions likely occur in mid-Phase II when sagebrushcanopy cover declines below 20% and total canopy coverwithin the intercanopy is less than 50%.Our results suggest that wildfire has a hysteresis effect
on reversing the ecohydrologic resilience of woodlandencroachment into Great Basin sagebrush steppe. Wildfireincreased the short-term (1 year post-fire) hydrologic anderosion vulnerability of a late-succession woodland byremoving protective cover from water-repellent tree zones,but induced herbaceous recruitment during the secondpost-fire growing season. Herbaceous cover recruitment2 years post-fire improved infiltration of low-intensityrainfall in interspaces, reduced structural connectivity ofthe intercanopy, and decreased the erosive energy andsediment transport capacity of simulated concentrated flow.
Published 2013. This article is a U.S. Government work and is in the publi
The woodland, however, remained vulnerable to runoff anderosion from high-intensity rainfall throughout the study.Improved infiltration of low-intensity rainfall and thedecreased concentrated flow erosion 2 years post-firesuggest fire-induced recruitment of herbaceous coverexerted a positive functional feedback toward sagebrushsteppe ecohydrologic resilience, but the remaining vulner-ability to the high-intensity simulated storms implies thetransition to a sagebrush steppe structural–functionalecohydrologic state requires more time. We thereforeconclude that wildfire can reduce late-succession woodlandecohydrologic resilience through cover recruitment withintwo growing seasons, but residual hydrologic effects ofwoodland structural attributes may remain detectableduring high-intensity rainfall events for an undeterminedamount of time during site recovery. Our results do notconclusively indicate that fire can reverse the soil erosionfeedback in the later stages of woodland encroachment inthe Great Basin. The results suggest, however, that burningmay dampen the soil erosion feedback with the first 2 yearsfollowing burning.
ACKNOWLEDGEMENTS
This is Contribution Number 76 of the SagebrushTreatment Evaluation Project (SageSTEP), funded by theUS Joint Fire Science Program. The authors wish to thankJaime Calderon and Mathew Frisby for assistance with datacollection. We thank Ben Rau (Soil Scientist, USDAAgricultural Research Service) and the Desert ResearchInstitute, Reno, Nevada, for assistance with processing soilsamples. We thank Bruce Mackey (Statistician, USDAAgricultural Research Service) for assistance with compo-nents of the statistical analyses.
REFERENCES
Abrahams AD, Parsons AJ, Wainwright J. 1995. Effects of vegetationchange on interrill runoff and erosion, Walnut Gulch, southern Arizona.Geomorphology 13: 37–48.
Aldrich GA, Tanaka JA, Adams RM, Buckhouse JC. 2005. Economics ofwestern juniper control in central Oregon. Rangeland Ecology &Management 58: 542–552. DOI: 10.2111/04-164r2.1
Al-Hamdan OZ, Pierson FB, Nearing MA, Stone JJ, Williams CJ, MoffetCA, Kormos PR, Boll J, Weltz MA. 2012a. Characteristics ofconcentrated flow hydraulics for rangeland ecosystems: implicationsfor hydrologic modeling. Earth Surface Processes and Landforms37: 157–168. DOI: 10.1002/esp.2227
Al-Hamdan OZ, Pierson FB, Nearing MA, Stone JJ, Williams CJ, MoffetCA, Kormos PR, Boll J, Weltz MA. 2012b. Risk assessment of erosionfrom concentrated flow on rangelands using overland flow distributionand shear stress partitioning. Transactions of the American Society ofAgricultural and Biological Engineers in press.
Al-Hamdan OZ, Pierson FB, Nearing MA, Williams CJ, Stone JJ, KormosPR, Boll J, Weltz MA. 2012c. Concentrated flow erodibility forphysically based erosion models: temporal variability in disturbed andundisturbed rangelands. Water Resources Research 48: W07504.DOI: 10.1029/2011WR011464
Allen CD. 2007. Interactions across spatial scales among forest dieback, fire,and erosion in northernNewMexico landscapes.Ecosystems 10: 797–808.
Allen EA, Chambers JC, Nowak RS. 2008. Effects of a spring prescribedburn on the soil seed bank in sagebrush steppe exhibiting pinyon–juniper expansion. Western North American Naturalist 68: 265–277.
Archer S, Schimel DS, Holland EA. 1995. Mechanisms of shrublandexpansion: land use, climate or CO2? Climate Change 29: 91–99.
c domain in the USA. Ecohydrol. (2013)

WILDFIRE AS AN ECOHYDROLOGIC THRESHOLD-REVERSAL MECHANISM
Bahre CJ, Shelton ML. 1993. Historic vegetation change, mesquiteincreases, and climate in southeastern Arizona. Journal of Biogeography20: 489–504.
Baker WL, Shinneman DJ. 2004. Fire and restoration of piñon-juniperwoodlands in the western United States: a review. Forest Ecology andManagement 189: 1–21. DOI: 10.1016/j.foreco.2003.09.006
Barney MA, Frischknecht MA. 1974. Vegetation changes following fire inpinyon–juniper type of west-central Utah. Journal of Range Management27: 91–96.
Bates JD, Davies KW, Sharp RN. 2011. Shrub-steppe early successionfollowing juniper cutting and prescribed fire. Environmental Management47: 468–481.
Bates JD, Miller RF, Davies KW. 2006. Restoration of quaking aspenwoodlands invaded by western juniper. Rangeland Ecology &Management 59: 88–97.
Bates JD, Miller RF, Svejcar TS. 2000. Understory dynamics in cut anduncut western juniper woodlands. Journal for Rangeland Management53: 119–126.
Bates JD, Miller RF, Svejcar TS. 2005. Long-term successional trendsfollowing western juniper cutting. Rangeland Ecology & Management58: 533–541.
Bates JD, Miller RF, Svejcar T. 2007. Long-term vegetation dynamics ina cut western juniper woodland. Western North American Naturalist67: 549–561.
Bates JD, Rhodes EC, Davies KW, Sharp R. 2009. Postfire succession inbig sagebrush steppe with livestock grazing. Rangeland Ecology &Management 62: 98–110.
Bates JD, Svejcar TS. 2009. Herbaceous succession after burning of cutand uncut western juniper woodlands. Western North AmericaNaturalist 69: 9–25.
Bates JD, Svejcar TJ, Miller RF. 2002. Effects of juniper cutting onnitrogen mineralization. Journal of Arid Environments 51: 221–234.
Bautista S, Mayor ÁG, Bourakhouadar J, Bellot J. 2007. Plant spatialpattern predicts hillslope runoff and erosion in a semiarid Mediterraneanlandscape. Ecosystems 10: 987–998. DOI: 10.1007/s10021-007-9074-3
Belnap J, Welter JR, Grimm NB, Barger N, Ludwig JA. 2005. Linkagesbetween microbial and hydrologic processes in arid and semiaridwatersheds. Ecology 86: 298–307.
Bergkamp G. 1998. A hierarchical view of the interactions of runoff andinfiltration with vegetation and microtopography in semiarid shrub-lands. Catena 33: 201–220. DOI: 10.1016/s0341-8162(98)00092-7
Bestelmeyer BT, Brown JR, Havstad KM, Alexander R, Chavez G,Herrick JE. 2003. Development and use of state-and-transition modelsfor rangelands. Journal of Range Management 56: 114–126.
Bhark EW, Small EE. 2003. Association between plant canopies and thespatial patterns of infiltration in shrubland and grassland of theChihuahuan Desert, New Mexico. Ecosystems 6: 185–196.
Bisdom EBA, Dekker LW, Schoute JFT. 1993. Water repellency of sievefractions from sandy soils and relationships with organic material onsoil structure. Geoderma 56: 105–118.
Blackburn WH. 1975. Factors influencing infiltration and sedimentproduction of semiarid rangelands in Nevada. Water ResourcesResearch 11: 929–937.
Blank RR, Abraham L, Young JA. 1994. Soil heating, nitrogen, cheatgrass,and seedbed microsites. Journal of Range Management 47: 33–37.
Blank RR, Chambers JC, Zamudio D. 2003. Restoring riparian corridorswith fire: effects on soil and vegetation. Journal of Range Management56: 388–396.
Briske DD, Bestelmeyer BT, Stringham TK, Shaver PL. 2008. Recommen-dations for development of resilience-based state-and-transition models.Rangeland Ecology & Management 61: 359–367.
Briske DD, Fuhlendorf SD, Smeins FE. 2005. State-and-transition models,thresholds, and rangeland health: a synthesis of ecological concepts andperspectives. Rangeland Ecology & Management 58: 1–10.
Briske DD, Fuhlendorf SD, Smeins FE. 2006. A unified framework forassessment and application of ecological thresholds. RangelandEcology & Management 59: 225–236. DOI: 10.2111/05-115r.1
Bromley J, Brouwer J, Barker AP, Gaze SR, Valentin C. 1997. The role ofsurface water redistribution in an area of patterned vegetation in a semi-arid environment, south-west Niger. Journal of Hydrology 198: 1–29.DOI: 10.1016/s0022-1694(96)03322-7
Brooks ML, D’Antonio CM, Richardson DM, Grace JB, Keeley JE,DiTomaso JM, Hobbs RJ, Pellant M, Pyke D. 2004. Effects of invasivealien plants on fire regimes. BioScience 54: 677–688.
Buffington LC, Herbel CH. 1965. Vegetational changes on a semidesertgrassland range from 1858 to 1963. Ecological Monographs 35: 139–164.
Burkhardt JW, Tisdale EW. 1969. Nature and successional status of westernjuniper vegetation in Idaho. Journal of Range Management 22: 264–270.
Published 2013. This article is a U.S. Government work and is in the public
Cammeraat LH, Imeson AC. 1999. The evolution and significance of soil-vegetation patterns following land abandonment and fire in Spain.Catena 37: 107–127. DOI: 10.1016/s0341-8162(98)00072-1
Cerdà A. 1997. The effect of patchy distribution of Stipa tenacissima L. onrunoff and erosion. Journal of Arid Environments 36: 37–51. DOI:10.1006/jare.1995.0198
CerdàA. 1998. Changes in overland flow and infiltration after a rangeland firein a Mediterranean scrubland. Hydrological Processes 12: 1031–1042.
Cerdà A, Doerr SH. 2005. Influence of vegetation recovery on soilhydrology and erodibility following fire: an 11-year investigation.International Journal of Wildland Fire 14: 423–437.
Cerdà A, Imeson AC, Calvo A. 1995. Fire and aspect induced differenceson the erodibility and hydrology of soils at La Costera, Valencia,southeast Spain. Catena 24: 289–304.
Chambers JC, Roundy BA, Blank RR, Meyer SE, Whittaker A. 2007.What makes Great Basin sagebrush ecosystems invasible by Bromustectorum? Ecological Monographs 77: 117–145.
Chartier MP, Rostagno CM. 2006. Soil erosion thresholds and alternativestates in northeastern Patagonian rangelands. Rangeland Ecology &Management 59: 616–624. DOI: 10.2111/06-009r.1
Condon L, Weisberg PJ, Chambers JC. 2011. Abiotic and bioticinfluences on Bromus tectorum invasion and Artemisia tridentatarecovery after fire. International Journal of Wildland Fire 20: 597–604.DOI: 10.1071/wf09082
Connelly JW, Reese KP, Fischer RA, Wakkinen WL. 2000. Response of asage grouse breeding population to fire in southeastern Idaho. WildlifeSociety Bulletin 28: 90–96.
Davenport DW, Breshears DD, Wilcox BP, Allen CD. 1998. Viewpoint:sustainability of pinyon–juniper ecosystems – a unifying perspective ofsoil erosion thresholds. Journal of Range Management 51: 231–240.
Davies KW, Bates JD, James JJ. 2009. Microsite and herbaceousvegetation heterogeneity after burning Artemisia tridentata steppe.Oecologia 159: 597–606.
Davies KW, Boyd CS, Beck JL, Bates JD, Svejcar TJ, Gregg MA. 2011.Saving the sagebrush sea: an ecosystem conservation plan for bigsagebrush plant communities. Biological Conservation 144: 2573–2584.
DeBano LF. 1981. Water-Repellent Soils: A State of the Art. USDepartment of Agriculture, Forest Service, Rocky Mountain ResearchStation, PSW-GTR-46: Berkeley, CA.
DeBano LF, Neary DG, Ffolliott PF. 1998. Fire’s Effects on Ecosystems.John Wiley and Sons, Inc.: New York, NY.
Dekker LW, Ritsema CJ. 1996. Preferential flow paths in a water repellentclay soil with grass cover. Water Resources Research 32: 1239–1249.
Dekker LW, Ritsema CJ. 2000. Wetting patterns and moisture variabilityin water repellent Dutch soils. Journal of Hydrology 231-232: 148–164.
Doerr SH, Shakesby RA, MacDonald LH. 2009. Soil water repellency: akey factor in post-fire erosion. In Fire Effects on Soils and RestorationStrategies, Volume 5, Land Reconstruction and Management Series,Cerda A, Robichaud PR (eds). Science Publishers: Enfield, NH.
Dunkerley DL. 2002. Infiltration rates and soil moisture in a groved mulgacommunity near Alice Springs, arid central Australia: evidence forcomplex internal rainwater redistribution in a runoff-runon landscape.Journal of Arid Environments 51: 199–219.
Dunkerley DL, Brown KJ. 1995. Runoff and runon areas in a patternedchenopod shrubland, arid western New South Wales, Australia:characteristics and origin. Journal of Arid Environments 30: 41–55.
Eitel JU, Williams CJ, Vierling LA, Al-Hamdan OZ, Pierson FB, Jr. 2011.Suitability of terrestrial laser scanning for studying surface roughnesseffects on concentrated flow erosion processes in rangelands. Catena87: 398–407.
Field JP, Breshears DB, Whicker JJ, Zou CB. 2012. Sediment capture byvegetation patches: implications for desertification and increasedresource redistribution. Journal of Geophysical Research 117:G01022. DOI: 10.1029/2011JG001663
Grossman RB, Pringle FB. 1987. Describing soil surface properties-theirseasonal changes and implications for management in soil surveytechniques. Soil Science Society of America, Special Publication20: 57–75.
Grover HD, Musick HB. 1990. Shrubland encroachment in southern NewMexico, U.S.A.: an analysis of desertification processes in the Americansouthwest. Climatic Change 17: 305–330. DOI: 10.1007/bf00138373
Gunderson LH. 2000. Ecological resilience: in theory and practice. AnnualReview of Ecology and Systematics 31: 425–439.
Hanson CL, Pierson FB. 2001. Characteristics of extreme precipitationand associated streamflow in the Reynolds Creek ExperimentalWatershed, Idaho. In Proceedings of the 12th Symposium on GlobalClimate Change Variations, January 14–19, American MeteorologicalSociety: Albuquerque, NM; J2.13–J2.16.
domain in the USA. Ecohydrol. (2013)
C. J. WILLIAMS et al.
Hastings BK, Smith FM, Jacobs BF. 2003. Rapidly eroding piñon-juniperwoodlands in New Mexico: response to slash treatment. Journal ofEnvironmental Quality 32: 1290–1298.
Havstad KM, Peters DPC, Skaggs R, Brown J, Bestelmeyer B,Fredrickson E, Herrick J, Wright J. 2007. Ecological services toand from rangelands of the United States. Ecological Economics 64:261–268. DOI: 10.1016/j.ecolecon.2007.08.005
Herrick JE, Bestelmeyer BT, Archer S, Tugel AJ, Brown JR. 2006. Anintegrated framework for science-based arid land management. Journal ofArid Environments 65: 319–335. DOI: 10.1016/j.jaridenv.2005.09.003
Herrick JE, Van Zee JW, Havstad KM, Burkett LM, Whitford WG. 2001.Field soil aggregate stability kit for soil quality and rangeland healthevaluations. Catena 44: 27–35.
Herrick JE, Whitford WG, de Soyza AG, Van Zee JW, Havstad KM,Seybold CA, Walton M. 2005. Monitoring Manual for Grassland,Shrubland, and Savanna Ecosystems, Volume 1: Quick Start. USDepartment of Agriculture, Agricultural Research Service, JornadaExperimental Range, Las Cruces, NM.
Holland ME. 1969. Colorado State University experimental rainfall-runofffacility, design, and testing of rainfall system. Technical Report CER69-70 MEH, Colorado State University, Colorado State UniversityExperimental Station, Fort Collins, CO.
Imeson AC, Verstraten JM, Van Mulligen EJ, Sevink J. 1992. The effectsof fire and water repellency on infiltration and runoff underMediterranean type forest. Catena 19: 345–361.
Johnson DD, Miller RF. 2006. Structure and development of expandingwestern juniper woodlands as influenced by two topographic variables.Forest Ecology and Management 229: 7–15.
Kachergis E, Rocca ME, Fernandez-Gimenez ME. 2011. Indicators ofecosystem function identify alternate states in the sagebrush steppe.Ecological Applications 21: 2781–2792. DOI: 10.1890/10-2182.1
Keane RE, Agee JK, Fule P, Keeley JK, Key C, Kitchen SG, Miller R,Schulte LA. 2008. Ecological effects of large fires on US landscapes:benefit or catastrophe? International Journal ofWildlandFire 17: 696–712.
Knapp PA. 1996. Cheatgrass (Bromus tectorum L) dominance in the GreatBasin desert. History, persistence, and influences to human activities.Global Environmental Change 6: 37–52.
Knick ST, Dobkin DS, Rotenberry JT, Schroeder MA, Vander Haegen MW,VanRiper C, III. 2003. Teetering on the edge or too late? Conservation andresearch issues for avifauna of sagebrush habitats. Condor 105: 611–634.
Koniak S. 1985. Succession in pinyon-juniper woodlands following wildfirein the Great Basin. Western North American Naturalist 45: 556–566.
Koniak S, Everett RL. 1982. Seed reserves in soils of successional stagesof pinyon woodlands. American Midland Naturalist 108: 295–303.
Littell RC, Milliken GA, Stroup WW, Wolfinger RD, Schabenberger O.2006. SAS for Mixed Models. SAS Institute Inc.: Cary, NC.
Ludwig JA, Bartley R, Hawdon AA, Abbott BN, McJannet D. 2007. Patchconfiguration non-linearly affects sediment loss across scales in agrazed catchment in north-east Australia. Ecosystems 10: 839–845.DOI: 10.1007/s10021-007-9061-8
Ludwig JA, Tongway DJ. 1995. Spatial organisation of landscapes and itsfunction in semi-aridwoodlands, Australia.Landscape Ecology 10: 51–63.
Ludwig JA, Wilcox BP, Breshears DD, Tongway DJ, Imeson AC. 2005.Vegetation patches and runoff-erosion as interacting ecohydrologicalprocesses in semiarid landscapes. Ecology 86: 288–297.
Luk S-H, Abrahams AD, Parsons AJ. 1993. Sediment sources andsediment transport by rill flow and interrill flow on a semi-aridpiedmont slope, southern Arizona. Catena 20: 93–111.
Madsen MD, Chandler DG, Belnap J. 2008. Spatial gradients inecohydrologic properties within a pinyon-juniper ecosystem. Ecohy-drology 1: 349–360.
Madsen MD, Davies KW, Williams CJ, Svejcar TJ. 2012a. Agglomeratingseeds to enhance native seedling emergence and growth. Journal ofApplied Ecology 49: 431–438. DOI: 10.1111/j.1365-2664.2012.02118.x
MadsenMD,Kostka SJ, InouyeAL,ZvirzdinDL. 2012b. Postfiire restorationof soil hydrology and wildland vegetation using surfactant seed coatingtechnology. Rangeland Ecology & Management 65: 253–259.
Madsen MD, Petersen SL, Roundy BA, Hopkins BG, Taylor AG. 2012c.Comparison of postfire soil water repellency amelioration strategies onbluebunch wheatgrass and cheatgrass survival. Rangeland Ecology &Management 65: 182–188.
Madsen MD, Zvirzdin DL, Petersen SL, Hopkins BG, Roundy BA,Chandler DG. 2011. Soil water repellency within a burned piñon–juniper woodland: spatial distribution, severity, and ecohydrologicimplications. Soil Science Society of America Journal 75: 1543–1553.DOI: 10.2136/sssaj2010.0320
McIver JD, Brunson M, Bunting S, Chambers J, Devoe N, Doescher P,Grace J, Johnson D, Knick S, Miller R, Pellant M, Pierson F, Pyke D,
Published 2013. This article is a U.S. Government work and is in the publi
Rollins K, Roundy B, Schupp G, Tausch R, Turner D. 2010.SageSTEP: A Region-wide Experiment to Evaluate Effects of Fireand Fire Surrogate Treatments in the Sagebrush Biome. US Departmentof Agriculture, Forest Service, RMRS-GTR-237: Fort Collins, CO.
Meeuwig RO. 1971. Infiltration and Water Repellency in Granitic Soils.US Department of Agriculture, Forest Service, IFRES-INT-111:Ogden, UT.
Melgoza G, Nowak RS, Tausch RJ. 1990. Soil water exploitation afterfire: competition between Bromus tectorum (cheatgrass) and two nativespecies. Oecologia 83: 7–13. DOI: 10.1007/bf00324626
Meyer LD, Harmon WC. 1979. Multiple-intensity rainfall simulator forerosion research on row sideslopes. Transactions of the AmericanSociety of Agricultural Engineers 22: 100–103.
Miller RF, Bates JD, Svejcar TJ, Pierson FB, Eddleman LE. 2005.Biology, ecology, and management of western juniper (Juniperusoccidentalis). Technical Bulletin 152, Oregon State UniversityAgricultural Experiment Station, Corvalis, Oregon.
Miller RF, Knick ST, Pyke DA, Meinke CW, Hanser SE, Wisdom MJ,Hild AL. 2011. Characteristics of sagebrush habitats and limitations tolong-term conservation. In Greater Sage-grouse: Ecology and Conser-vation of a Landscape Species and Its Habitats. Studies in AvianBiology, Vol. 38, Knick ST, Connelly JW (eds). University ofCalifornia Press: Berkeley, CA; 145–184.
Miller RF, Svejcar TJ, Rose JA. 2000. Impacts of western juniper on plantcommunity composition and structure. Journal of Range Management53: 574–585.
Miller RF, Tausch RJ. 2001. The role of fire in pinyon and juniperwoodlands: a descriptive analysis. In Proceedings of the InvasiveSpecies Workshop: the Role of Fire in the Control and Spread ofInvasive Species, Fire Conference 2000: the First National Congress onFire Ecology, Prevention, and Management, Galley KEM, Wilson TP(eds). Miscellaneous Publication No. 11, Tall Timbers ResearchStation: Tallahassee, FL; 15–30.
Miller RF, Tausch RJ, McArthur ED, Johnson DD, Sanderson SC. 2008.Age Structure and Expansion of Piñon–Juniper Woodlands: A RegionalPerspective in the Intermountain West. US Department of Agriculture,Forest Service, RMRS-RP-69: Fort Collins, CO.
[NRCS] Natural Resources Conservation Service. 2007. Soil survey ofOwyhee County Area, Idaho. U.S. Government Printing Office:Washington D.C.
[NWRC] Northwest Watershed Research Center. 2012. Monthly meteoro-logical data for the Reynolds Creek Experimental Watershed (ReynoldsQuonset – #76 and Johnston Draw Headwaters – #124 sites). USDepartment of Agriculture, Agricultural Research Service, NorthwestWatershed Research Center, Boise, Idaho. Available at: ftp://ftp.nwrc.ars.usda.gov/publicdatabase/reynolds-creek/datafiles/precipitation/. Accessed1 June 2012.
Okin GS, D’Odorico P, Archer SR. 2009. Impact of feedbacks onChihuahuan Desert grasslands: transience and metastability. Journal ofGeophysical Research G: Biogeosciences 114: art no. G01004.
Okin GS, Gillette DA, Herrick JE. 2006. Multi-scale controls on andconsequences of aeolian processes in landscape change in arid andsemi-arid environments. Journal of Arid Environments 65: 253–275.
Parsons AJ, Abrahams AD, Simanton JR. 1992. Microtopography andsoil-surface materials on semi-arid piedmont hillslopes, southernArizona. Journal of Arid Environments 22: 107–115.
Parsons AJ, Abrahams AD, Wainwright J. 1996a. Responses of interrillrunoff and erosion rates to vegetation change in southern Arizona.Geomorphology 14: 311–317.
Parsons AJ, Wainwright J, Abrahams AD. 1996b. Runoff and erosion onsemi-arid hillslopes. In Advances in Hillslope Processes, Anderson MG,Brooks SM (eds). John Wiley & Sons: New York, NY; 1061–1078.
Pellant M, Shaver P, Pyke DA, Herrick JE. 2005. Interpreting indicators ofrangeland health, version 4, Technical Reference 1734-6. USDepartment of the Interior, Bureau of Land Management, NationalScience and Technology Center, Denver, CO.
Peters DPC, Bestelmeyer BT, Turner MG. 2007. Cross-scale interactionsand changing pattern-process relationships: consequences for systemdynamics. Ecosystems 10: 790–796.
Peters DPC, Pielke Sr RA, Bestelmeyer BT, Allen CD, Munson-McGee S,Havstad KM. 2004. Cross-scale interactions, nonlinearities, andforecasting catastrophic events. Proceedings of the National Academyof Sciences of the United States of America 101: 15130–15135.
Petersen SL, Stringham TK. 2008. Infiltration, runoff, and sediment yieldin response to western juniper encroachment in southeast Oregon.Rangeland Ecology & Management 61: 74–81.
Petersen SL, Stringham TK, Roundy BA. 2009. A process-basedapplication of state-and-transition models: a case study of western
c domain in the USA. Ecohydrol. (2013)

WILDFIRE AS AN ECOHYDROLOGIC THRESHOLD-REVERSAL MECHANISM
juniper (Juniperus occidentalis) encroachment. Rangeland Ecology &Management 62: 186–192.
Pierson FB, Bates JD, Svejcar TJ, Hardegree SP. 2007. Runoff anderosion after cutting western juniper. Rangeland Ecology & Management60: 285–292.
Pierson FB, Moffet CA, Williams CJ, Hardegree SP, Clark PE. 2009.Prescribed-fire effects on rill and interrill runoff and erosion in amountainous sagebrush landscape. Earth Surfaces Processes andLandforms 34: 193–203.
Pierson FB, Robichaud PR, Moffet CA, Spaeth KE, Hardegree SP, ClarkPE, Williams CJ. 2008a. Fire effects on rangeland hydrology anderosion in a steep sagebrush-dominated landscape. HydrologicalProcesses 22: 2916–2929.
Pierson FB, Robichaud PR, Moffet CA, Spaeth KE, Williams CJ,Hardegree SP, Clark PE. 2008b. Soil water repellency and infiltration incoarse-textured soils of burned and unburned sagebrush ecosystems.Catena 74: 98–108.
Pierson FB, Van Vactor SS, Blackburn WH, Wood JC. 1994. Incorporatingsmall scale spatial variability into predictions of hydrologic response onsagebrush rangelands. In Variability in Rangeland Water ErosionProcesses. Soil Science Society of America Special Publication 38. SoilScience Society of America: Madison, WI; 23–34.
Pierson FB, Williams CJ, Hardegree SP, Weltz MA, Stone JJ, Clark PE.2011. Fire, plant invasions, and erosion events on western rangelands.Rangeland Ecology & Management 64: 439–449.
Pierson FB, Williams CJ, Kormos PR, Hardegree SP, Clark PE, Rau BM.2010. Hydrologic vulnerability of sagebrush steppe following pinyon andjuniper encroachment. Rangeland Ecology & Management 63: 614–629.
PrismGroup. 2011. PrismClimateGroup,OregonStateUniversity. Availableat: http://www.prism.oregonstate.edu/. Accessed 9 September 2011.
Puigdefábregas J. 2005. The role of vegetation patterns in structuringrunoff and sediment fluxes in drylands. Earth Surface Processes andLandforms 30: 133–147.
Pyke DA, Herrick JE, Shaver P, Pellant M. 2002. Rangeland healthattributes and indicators for qualitative assessment. Journal of RangeManagement 55: 584–597.
Rau BM, Chambers JC, Blank RR, Johnson DW. 2008. Prescribed fire,soil, and plants: burn effects and interactions in the central Great Basin.Rangeland Ecology & Management 61: 169–181.
Rau BM, Blank RR, Chambers JC, Johnson DW. 2007. Prescribed fire ina Great Basin sagebrush ecosystem: dynamics of soil extractablenitrogen and phosphorus. Journal of Arid Environments 71: 362–375.DOI: 10.1016/j.jaridenv.2007.05.006
Ravi S, D’Odorico P, Huxman TE, Collins SL. 2010. Interactions betweensoil erosion processes and fires: implications for the dynamics offertility islands. Rangeland Ecology & Management 63: 267–274.
Ravi S, D’Odorico P, Okin GS. 2007. Hydrologic and aeolian controls onvegetation patterns in arid landscapes. Geophysical Research Letters34: L24S23. DOI: 10.1029/2007gl031023
Ravi S, D’Odorico P, Wang L, White CS, Okin GS, Macko SA, CollinsSL. 2009. Post-fire resource redistribution in desert grasslands:a possible negative feedback on land degradation. Ecosystems 12:434–444. DOI: 10.1007/s10021-009-9233-9
Reid KD, Wilcox BP, Breshears DD, MacDonald L. 1999. Runoff anderosion in a piñon–juniper woodland: influence of vegetation patches.Soil Science Society of America Journal 63: 1869–1879.
Roberts C, Jones JA. 2000. Soil patchiness in juniper-sagebrush-grasscommunities of central Oregon. Plant and Soil 223: 45–61.
Robinson DA, Lebron I, Ryel RJ, Jones SB. 2010. Soil water repellency: amethod of soil moisture sequestration in pinyon–juniper woodland. SoilScience Society of America Journal 74: 624–634. DOI: 10.2136/sssaj2009.0208
Romme WH, Allen CD, Bailey JD, Baker WL, Bestelmeyer BT, BrownPM, Eisenhart KS, Floyd ML, Huffman DW, Jacobs BF, Miller RF,Muldavin EH, Swetnam TW, Tausch RJ, Weisberg PJ. 2009. Historicaland modern disturbance regimes, stand structures, and landscapedynamics in piñon–juniper vegetation of the western United States.Rangeland Ecology & Management 62: 203–222.
SAS Institute Inc. 2007. SAS System Software, Release 9.2 Edition. SASInstitute Inc.: Cary, NC.
Scheffer M, Carpenter S, Foley JA, Folke C, Walker B. 2001. Catastrophicshifts in ecosystems. Nature 413: 591–596. DOI: 10.1038/35098000
Scheffer M, Carpenter SR. 2003. Catastrophic regime shifts inecosystems: linking theory to observation. Trends in Ecology &Evolution 18: 648–656. DOI: 10.1016/j.tree.2003.09.002
Published 2013. This article is a U.S. Government work and is in the public
Schlesinger WH, Reynolds JF, Cunningham GL, Huenneke LF, JarrellWM, Virginia RA, Whitford WG. 1990. Biological feedbacks in globaldesertification. Science 247: 1043–1048.
Shakesby RA. 2011. Post-wildfire soil erosion in the Mediterranean:review and future research directions.Earth-Science Reviews 105: 71–100.DOI: 10.1016/j.earscirev.2011.01.001
Sheley RL, Bates JD. 2008. Restoring western juniper-(Juniperusoccidentalis) infested rangeland after prescribed fire. Weed Science56: 469–476.
Sheley RL, James JJ, Vasquez EA, Svejcar TJ. 2011. Using rangeland healthassessment to inform successional management. Invasive Plant Scienceand Management 4: 356–366. DOI: 10.1614/ipsm-d-10-00087.1
Stewart G, Hull AC. 1949. Cheatgrass (Bromus tectorum L.) – an ecologicintruder in southern Idaho. Ecology 30: 58–74.
Suding KN, Gross KL, Houseman GR. 2004. Alternative states andpositive feedbacks in restoration ecology. Trends in Ecology &Evolution 19: 46–53. DOI: 10.1016/j.tree.2003.10.005
Suring LH, Wisdom MJ, Tausch RJ, Miller RF, Rowland MM, SchueckL, Meinke CW. 2005. Modeling threats to sagebrush and othershrubland communities. In Habitat Threats in the Sagebrush Ecosystem,Wisdom MJ, Rowland MM, Suring LH (eds). Alliance Communica-tions Group: Lawrence, KA; 114–149.
Turnbull L, Wainwright J, Brazier RE. 2008. A conceptual framework forunderstanding semi-arid land degradation: ecohydrological interactionsacross multiple-space and time scales. Ecohydrology 1: 23–34.
Turnbull L, Wainwright J, Brazier RE. 2010a. Changes in hydrology anderosion over a transition from grassland to shrubland. HydrologicalProcesses 24: 393–414.
Turnbull L, Wainwright J, Brazier RE, Bol R. 2010b. Biotic and abioticchanges in ecosystem structure over a shrub-encroachment gradient inthe southwestern USA. Ecosystems 13: 1239–1255.
Turnbull L, Wilcox BP, Belnap J, Ravi S, D’Odorico P, Childers D,Gwenzi W, Okin G, Wainwright J, Caylor KK, Sankey T. 2012.Understanding the role of ecohydrological feedbacks in ecosystem statechange in drylands. Ecohydrology 5: 174–183.
Valentin C, D’Herbès JM, Poesen J. 1999. Soil and water components ofbanded vegetation patterns. Catena 37: 1–24. DOI: 10.1016/s0341-8162(99)00053-3
Van Auken OW. 2000. Shrub invasions of North American semiaridgrasslands. Annual Review of Ecology and Systematics 31: 197–215.
Van Auken OW. 2009. Causes and consequences of woody plantencroachment into western North American grasslands. Journal ofEnvironmental Management 90: 2931–2942.
Wainwright J, Parsons AJ, Abrahams AD. 2000. Plot-scale studies ofvegetation, overland flow and erosion interactions: case studies fromArizona and New Mexico. Hydrological Processes 14: 2921–2943.
Wainwright J, Turnbull L, Ibrahim TG, Lexartza-Artza I, Thornton SF,Brazier RE. 2011. Linking environmental régimes, space and time:interpretations of structural and functional connectivity. Geomorphology126: 387–404.
Whitford WG, Martinez-Turanzas G, Martinez-Meza E. 1995. Persistenceof desertified ecosystems: explanations and implications. Environmen-tal Monitoring and Assessment 37: 319–332. DOI: 10.1007/bf00546898
Wilcox BP. 1994. Runoff and erosion in intercanopy zones of pinyon–juniper woodlands. Journal of Range Management 47: 285–295.
Wilcox BP. 2010. Transformative ecosystem change and ecohydrology:ushering in a new era for watershed management. Ecohydrology 3: 126–130. DOI: 10.1002/eco.104
Wilcox BP, Breshears DD, Allen CD. 2003. Ecohydrology of a resource-conserving semiarid woodland: effects of scale and disturbance.Ecological Monographs 73: 223–239.
Wilcox BP, Newman BD, Allen CD, Reid KD, Brandes D, Pitlick J,Davenport DW. 1996a. Runoff and erosion on the Pajarito Plateau:observations from the field. In Forty-Seventh Field Conference, TheJemez Mountain Region: NewMexico Geological Society. NewMexicoGeological Society: Albuquerque, New Mexico, USA; 433–439.
Wilcox BP, Pitlick J, Allen CD, Davenport DW. 1996b. Runoff anderosion from a rapidly eroding pinyon–juniper hillslope. In Advances inHillslope Processes, Anderson MG, Brooks SM (eds). John Wiley &Sons: New York, NY; 61–71.
Wilcox BP, Turnbull L, Young MH, Williams CJ, Ravi S, Seyfried MS,Bowling DR, Scott RL, Germino MJ, Caldwell TG, Wainwright J.2012. Invasion of shrublands by exotic grasses: ecohydrologicalconsequences in cold versus warm deserts. Ecohydrology 5: 160–173.
domain in the USA. Ecohydrol. (2013)
Related Documents