Can tilt tests provide correct insight regarding frictional behavior of sliding rock block under seismic excitation? Yo-Ming Hsieh a , Kuo-Chen Lee b , Fu-Shu Jeng b, ⁎, Tsan-Hwei Huang b a Department of Construction Engineering, National Taiwan University of Science and Technology, Taipei, Taiwan b Department of Civil Engineering, National Taiwan University, Taipei, Taiwan abstract article info Article history: Received 4 February 2010 Received in revised form 15 November 2010 Accepted 30 November 2010 Available online 15 December 2010 Keywords: Friction Seismic Earthquake Landslides Tilt test Shaking table test Earthquake induced dip-slope sliding or rock-block sliding is usually analyzed using friction angles or friction coefficients measured at the sliding interface. A tilt test is a convenient test for measuring the required friction angle. However, a tilt test is a test under static conditions, and the applicability of measured friction parameters to analyze slopes under dynamic excitation requires further discussion. This study conducts a static tilt test and a dynamic shaking table test to simulate block sliding with base excitation, compares differences in measured sliding thresholds, and discusses the cause of these differences. Tests on three different materials (aluminum, sandstone, and synthetic sandstone) show that friction coefficients measured by tilt tests are always larger than the ones derived by shaking table tests. Moreover, high frequency tests yield larger friction coefficients, suggesting the sliding threshold is non-constant under excitation. In addition, tests with varying normal stresses on the sliding block show that with increasing contact stresses, sliding thresholds decrease, implying that sliding threshold varies with normal stress. Instantaneous friction coefficients, μ i (t), during sliding are also studied in this work. It has been found that frictional behavior of synthetic sandstone deviates from the idealized Coulomb friction model. The instantaneous friction coefficient varies with relative displacement and relative velocity during sliding. Finally, reasons for differences between a static tilt test and a dynamic shaking table test are discussed. This study preliminarily identifies the limitations of the tilt test when applied to dynamic problems, and concludes that realistic sliding thresholds can only be obtained using dynamic tests such as shaking table tests. © 2010 Elsevier B.V. All rights reserved. 1. Introduction The friction angle at the sliding interface is a key parameter for analyzing earthquake-induced slope failures. One of the most damaging types of earthquake-induced landslide is slope-failure in dip slopes, which can cause massive damages and casualties, as seen in Tsaoling and Jiufengershan during Chi-Chi earthquake in 1999 (Kamai et al., 2000; Huang et al., 2002; Wang et al., 2003; Chang et al., 2005a). Both infinite-slope and finite-slope models are often used for analyzing safety factors in these problems, and influences of earthquakes are often considered through a pseudo-static method (Terzaghi, 1950; Chen et al., 2003; Jeng et al., 2004a) or a block- sliding method (Newmark, 1965; Wilson and Keefer, 1983; Jibson and Keefer, 1993; Kramer and Matthew, 1997; Wartman et al., 2000; Huang et al., 2001; Ling, 2001; Bray and Travasarou, 2007; Kokusho and Ishizawa, 2007; Chiang et al., 2009; Dong et al., 2009). All these methods use friction angle or friction coefficient at the sliding interface to deduce the sliding threshold. Friction angle or friction coefficient obtained from a tilt test is questionable when applied to dynamic problems. For slope stability analyses considering only the gravity effect, i.e. no base excitation or static loading condition, a tilt test is a convenient and reasonable test method for measuring friction coefficient or friction angle (Barton and Choubey, 1977). However, its applicability in Newmark analysis for determining sliding threshold requires further investigation. This study intends to identify quantitatively the difference between measured versus sliding thresholds for a block on a slope subjected to base excitation through small-scale laboratory experi- ments. It is often found that friction coefficients obtained using back- analyses on large-scale earthquake-induced rockslides on dip slopes tend to be smaller than the ones obtained using laboratory tests such as direct shear test, cyclic shear test or tilt test (Hencher, 1980; Barbero et al., 1996; Shou and Wang, 2003; Jafari et al., 2004; Chang et al., 2005b). Besides the difference in the scale (large versus small scale), the deviation in loading conditions (dynamic versus static loading) may also play a role in the difference between back- caculated analysis and laboratory measurements of friction angles. This will be investigated in this work. Furthermore, the applicability of tilt test measured friction coefficients in determining the sliding threshold of earthquake- Engineering Geology 122 (2011) 84–92 ⁎ Corresponding author. Tel./fax: +886 2 2364 5734. E-mail address: [email protected] (F.-S. Jeng). 0013-7952/$ – see front matter © 2010 Elsevier B.V. All rights reserved. doi:10.1016/j.enggeo.2010.11.008 Contents lists available at ScienceDirect Engineering Geology journal homepage: www.elsevier.com/locate/enggeo

Welcome message from author
This document is posted to help you gain knowledge. Please leave a comment to let me know what you think about it! Share it to your friends and learn new things together.
Transcript
Engineering Geology 122 (2011) 84–92
Contents lists available at ScienceDirect
Engineering Geology
j ourna l homepage: www.e lsev ie r.com/ locate /enggeo
Can tilt tests provide correct insight regarding frictional behavior of sliding rockblock under seismic excitation?
Yo-Ming Hsieh a, Kuo-Chen Lee b, Fu-Shu Jeng b,⁎, Tsan-Hwei Huang b
a Department of Construction Engineering, National Taiwan University of Science and Technology, Taipei, Taiwanb Department of Civil Engineering, National Taiwan University, Taipei, Taiwan
⁎ Corresponding author. Tel./fax: +886 2 2364 5734.E-mail address: [email protected] (F.-S. Jeng).
0013-7952/$ – see front matter © 2010 Elsevier B.V. Adoi:10.1016/j.enggeo.2010.11.008
a b s t r a c t
a r t i c l e i n f oArticle history:Received 4 February 2010Received in revised form 15 November 2010Accepted 30 November 2010Available online 15 December 2010
Keywords:FrictionSeismicEarthquakeLandslidesTilt testShaking table test
Earthquake induced dip-slope sliding or rock-block sliding is usually analyzed using friction angles or frictioncoefficients measured at the sliding interface. A tilt test is a convenient test for measuring the required frictionangle. However, a tilt test is a test under static conditions, and the applicability of measured frictionparameters to analyze slopes under dynamic excitation requires further discussion.This study conducts a static tilt test and a dynamic shaking table test to simulate block sliding with baseexcitation, compares differences in measured sliding thresholds, and discusses the cause of these differences.Tests on three different materials (aluminum, sandstone, and synthetic sandstone) show that frictioncoefficients measured by tilt tests are always larger than the ones derived by shaking table tests. Moreover,high frequency tests yield larger friction coefficients, suggesting the sliding threshold is non-constant underexcitation. In addition, tests with varying normal stresses on the sliding block show that with increasingcontact stresses, sliding thresholds decrease, implying that sliding threshold varies with normal stress.Instantaneous friction coefficients, μi(t), during sliding are also studied in this work. It has been found thatfrictional behavior of synthetic sandstone deviates from the idealized Coulomb friction model. Theinstantaneous friction coefficient varies with relative displacement and relative velocity during sliding.Finally, reasons for differences between a static tilt test and a dynamic shaking table test are discussed. Thisstudy preliminarily identifies the limitations of the tilt test when applied to dynamic problems, and concludesthat realistic sliding thresholds can only be obtained using dynamic tests such as shaking table tests.
ll rights reserved.
© 2010 Elsevier B.V. All rights reserved.
1. Introduction
The friction angle at the sliding interface is a key parameter foranalyzing earthquake-induced slope failures. One of the mostdamaging types of earthquake-induced landslide is slope-failure indip slopes, which can cause massive damages and casualties, as seenin Tsaoling and Jiufengershan during Chi-Chi earthquake in 1999(Kamai et al., 2000; Huang et al., 2002;Wang et al., 2003; Chang et al.,2005a). Both infinite-slope and finite-slope models are often usedfor analyzing safety factors in these problems, and influences ofearthquakes are often considered through a pseudo-static method(Terzaghi, 1950; Chen et al., 2003; Jeng et al., 2004a) or a block-slidingmethod (Newmark, 1965;Wilson and Keefer, 1983; Jibson andKeefer, 1993; Kramer and Matthew, 1997; Wartman et al., 2000;Huang et al., 2001; Ling, 2001; Bray and Travasarou, 2007; Kokushoand Ishizawa, 2007; Chiang et al., 2009; Dong et al., 2009). All thesemethods use friction angle or friction coefficient at the slidinginterface to deduce the sliding threshold.
Friction angle or friction coefficient obtained from a tilt test isquestionable when applied to dynamic problems. For slope stabilityanalyses considering only the gravity effect, i.e. no base excitation orstatic loading condition, a tilt test is a convenient and reasonable testmethod for measuring friction coefficient or friction angle (Barton andChoubey, 1977). However, its applicability in Newmark analysis fordetermining sliding threshold requires further investigation.
This study intends to identify quantitatively the differencebetween measured versus sliding thresholds for a block on a slopesubjected to base excitation through small-scale laboratory experi-ments. It is often found that friction coefficients obtained using back-analyses on large-scale earthquake-induced rockslides on dip slopestend to be smaller than the ones obtained using laboratory tests suchas direct shear test, cyclic shear test or tilt test (Hencher, 1980;Barbero et al., 1996; Shou and Wang, 2003; Jafari et al., 2004; Changet al., 2005b). Besides the difference in the scale (large versus smallscale), the deviation in loading conditions (dynamic versus staticloading) may also play a role in the difference between back-caculated analysis and laboratory measurements of friction angles.This will be investigated in this work.
Furthermore, the applicability of tilt test measured frictioncoefficients in determining the sliding threshold of earthquake-
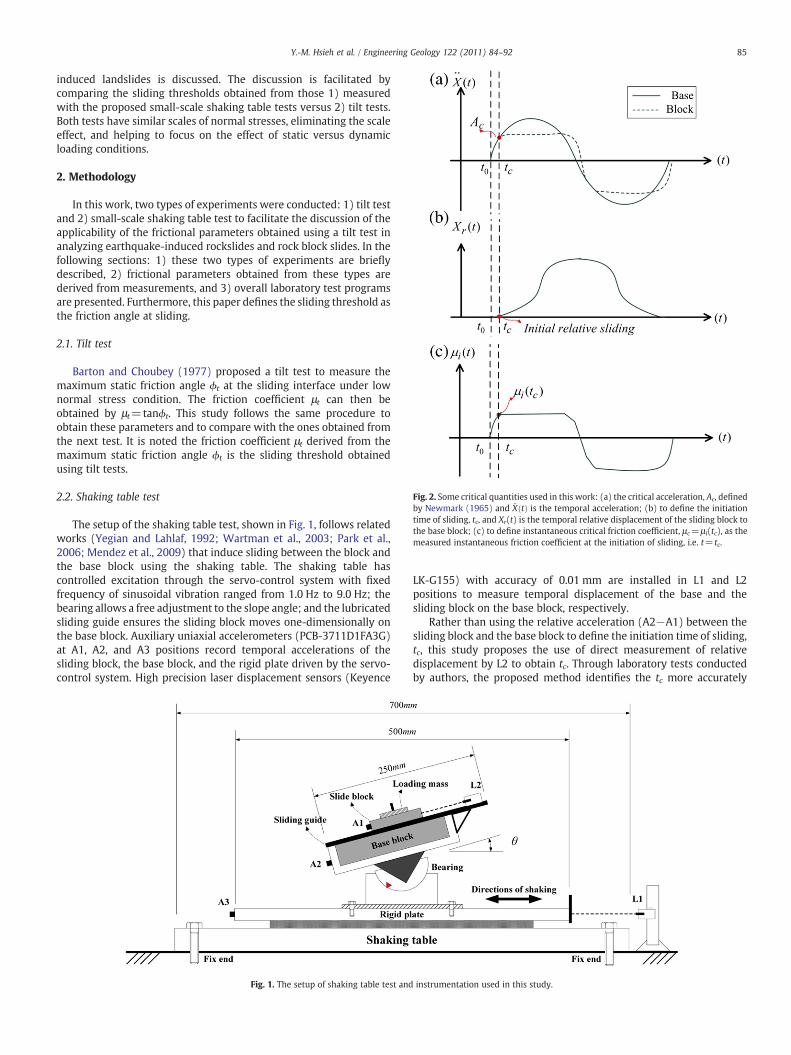
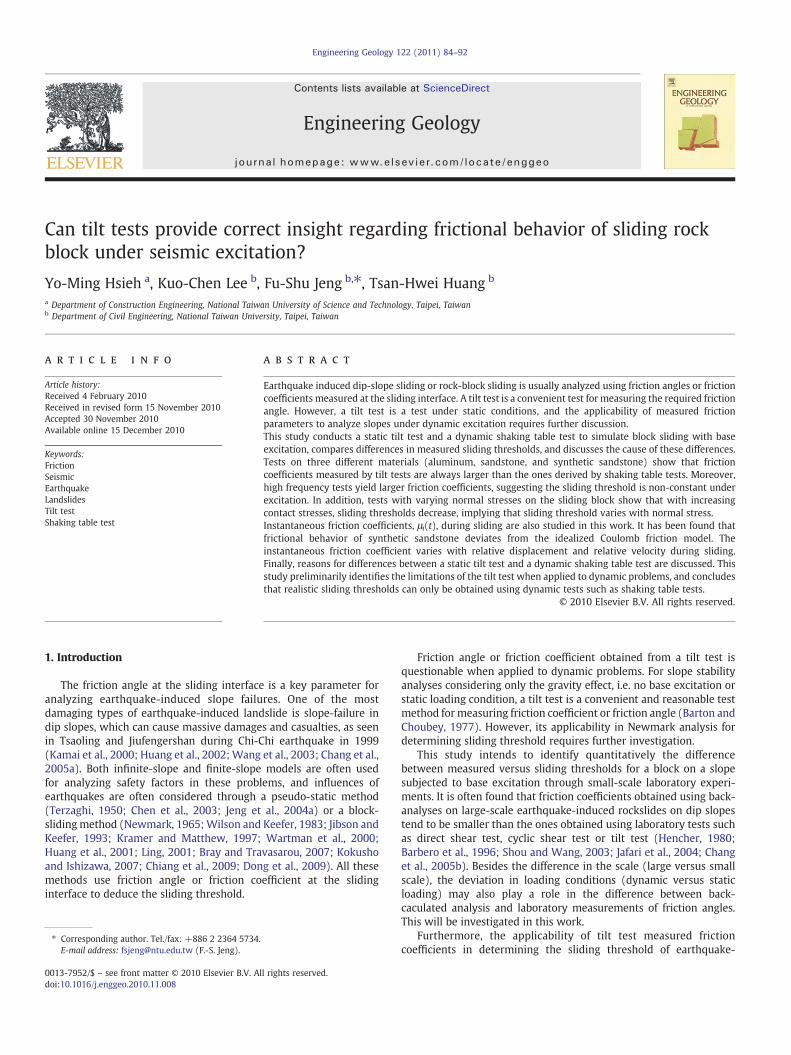
Fig. 2. Some critical quantities used in this work: (a) the critical acceleration, Ac, definedby Newmark (1965) and X tð Þ is the temporal acceleration; (b) to define the initiationtime of sliding, tc, and Xr(t) is the temporal relative displacement of the sliding block tothe base block; (c) to define instantaneous critical friction coefficient, μc=μ i(tc), as themeasured instantaneous friction coefficient at the initiation of sliding, i.e. t= tc.
85Y.-M. Hsieh et al. / Engineering Geology 122 (2011) 84–92
induced landslides is discussed. The discussion is facilitated bycomparing the sliding thresholds obtained from those 1) measuredwith the proposed small-scale shaking table tests versus 2) tilt tests.Both tests have similar scales of normal stresses, eliminating the scaleeffect, and helping to focus on the effect of static versus dynamicloading conditions.
2. Methodology
In this work, two types of experiments were conducted: 1) tilt testand 2) small-scale shaking table test to facilitate the discussion of theapplicability of the frictional parameters obtained using a tilt test inanalyzing earthquake-induced rockslides and rock block slides. In thefollowing sections: 1) these two types of experiments are brieflydescribed, 2) frictional parameters obtained from these types arederived from measurements, and 3) overall laboratory test programsare presented. Furthermore, this paper defines the sliding threshold asthe friction angle at sliding.
2.1. Tilt test
Barton and Choubey (1977) proposed a tilt test to measure themaximum static friction angle ϕt at the sliding interface under lownormal stress condition. The friction coefficient μt can then beobtained by μt=tanϕt. This study follows the same procedure toobtain these parameters and to compare with the ones obtained fromthe next test. It is noted the friction coefficient μt derived from themaximum static friction angle ϕt is the sliding threshold obtainedusing tilt tests.
2.2. Shaking table test
The setup of the shaking table test, shown in Fig. 1, follows relatedworks (Yegian and Lahlaf, 1992; Wartman et al., 2003; Park et al.,2006; Mendez et al., 2009) that induce sliding between the block andthe base block using the shaking table. The shaking table hascontrolled excitation through the servo-control system with fixedfrequency of sinusoidal vibration ranged from 1.0 Hz to 9.0 Hz; thebearing allows a free adjustment to the slope angle; and the lubricatedsliding guide ensures the sliding block moves one-dimensionally onthe base block. Auxiliary uniaxial accelerometers (PCB-3711D1FA3G)at A1, A2, and A3 positions record temporal accelerations of thesliding block, the base block, and the rigid plate driven by the servo-control system. High precision laser displacement sensors (Keyence
Fig. 1. The setup of shaking table test and
LK-G155) with accuracy of 0.01 mm are installed in L1 and L2positions to measure temporal displacement of the base and thesliding block on the base block, respectively.
Rather than using the relative acceleration (A2−A1) between thesliding block and the base block to define the initiation time of sliding,tc, this study proposes the use of direct measurement of relativedisplacement by L2 to obtain tc. Through laboratory tests conductedby authors, the proposed method identifies the tc more accurately
instrumentation used in this study.
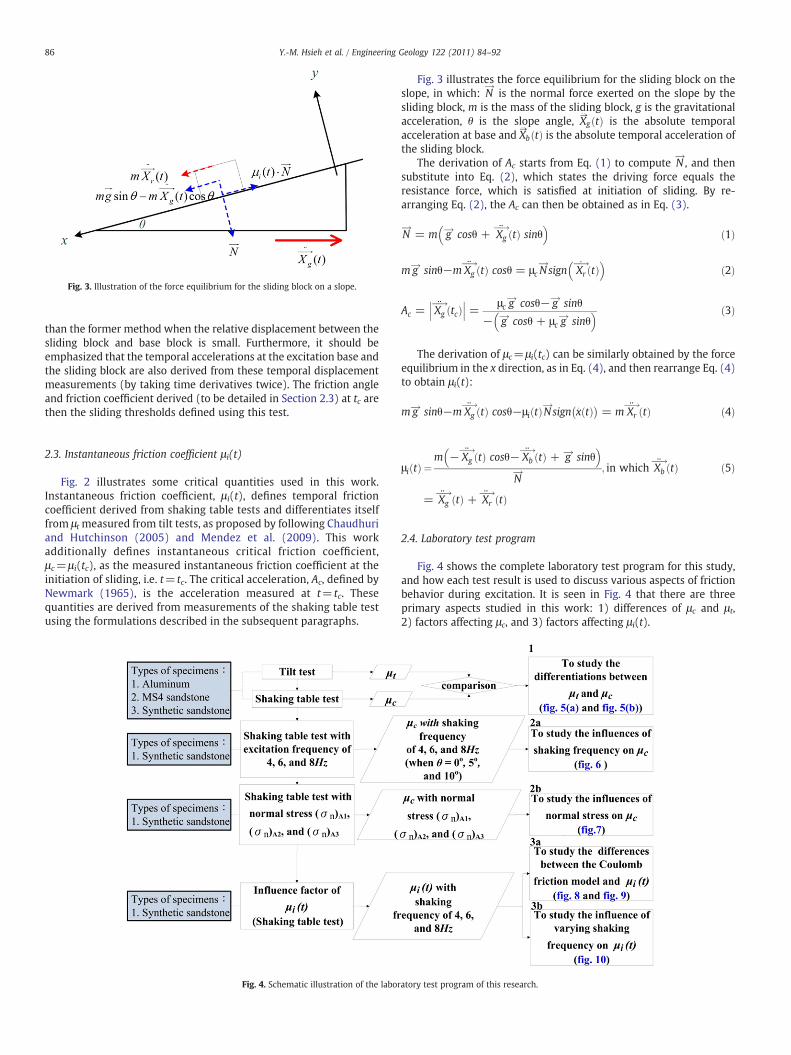
Fig. 3. Illustration of the force equilibrium for the sliding block on a slope.
86 Y.-M. Hsieh et al. / Engineering Geology 122 (2011) 84–92
than the former method when the relative displacement between thesliding block and base block is small. Furthermore, it should beemphasized that the temporal accelerations at the excitation base andthe sliding block are also derived from these temporal displacementmeasurements (by taking time derivatives twice). The friction angleand friction coefficient derived (to be detailed in Section 2.3) at tc arethen the sliding thresholds defined using this test.
2.3. Instantaneous friction coefficient μi(t)
Fig. 2 illustrates some critical quantities used in this work.Instantaneous friction coefficient, μ i(t), defines temporal frictioncoefficient derived from shaking table tests and differentiates itselffrom μt measured from tilt tests, as proposed by following Chaudhuriand Hutchinson (2005) and Mendez et al. (2009). This workadditionally defines instantaneous critical friction coefficient,μc=μ i(tc), as the measured instantaneous friction coefficient at theinitiation of sliding, i.e. t= tc. The critical acceleration, Ac, defined byNewmark (1965), is the acceleration measured at t= tc. Thesequantities are derived from measurements of the shaking table testusing the formulations described in the subsequent paragraphs.
Fig. 4. Schematic illustration of the labor
Fig. 3 illustrates the force equilibrium for the sliding block on theslope, in which: N
!is the normal force exerted on the slope by the
sliding block, m is the mass of the sliding block, g is the gravitationalacceleration, θ is the slope angle, Xg
→⋅⋅tð Þ is the absolute temporal
acceleration at base and Xb→⋅⋅
tð Þ is the absolute temporal acceleration ofthe sliding block.
The derivation of Ac starts from Eq. (1) to compute N!, and then
substitute into Eq. (2), which states the driving force equals theresistance force, which is satisfied at initiation of sliding. By re-arranging Eq. (2), the Ac can then be obtained as in Eq. (3).
N!
= m g! cosθ + Xg�!
tð Þ sinθ� �
ð1Þ
m g! sinθ−m Xg�!
tð Þ cosθ = μc N!sign Xr
�!:tð Þ
� �ð2Þ
Ac = Xg�!
tcð Þ���
��� = μc g! cosθ− g! sinθ
− g! cosθ + μc g! sinθ
� � ð3Þ
The derivation of μc=μi(tc) can be similarly obtained by the forceequilibrium in the x direction, as in Eq. (4), and then rearrange Eq. (4)to obtain μi(t):
m g! sinθ−m Xg�!
tð Þ cosθ−μi tð ÞN!sign x:tð Þ� �
= m Xr�!
tð Þ ð4Þ
μi tð Þ ¼m − Xg
�!tð Þ cosθ− Xb
�!tð Þ + g! sinθ
� �
N! ; in which Xb
�!tð Þ
= Xg�!
tð Þ + Xr�!
tð Þ
ð5Þ
2.4. Laboratory test program
Fig. 4 shows the complete laboratory test program for this study,and how each test result is used to discuss various aspects of frictionbehavior during excitation. It is seen in Fig. 4 that there are threeprimary aspects studied in this work: 1) differences of μc and μt,2) factors affecting μc, and 3) factors affecting μi(t).
atory test program of this research.
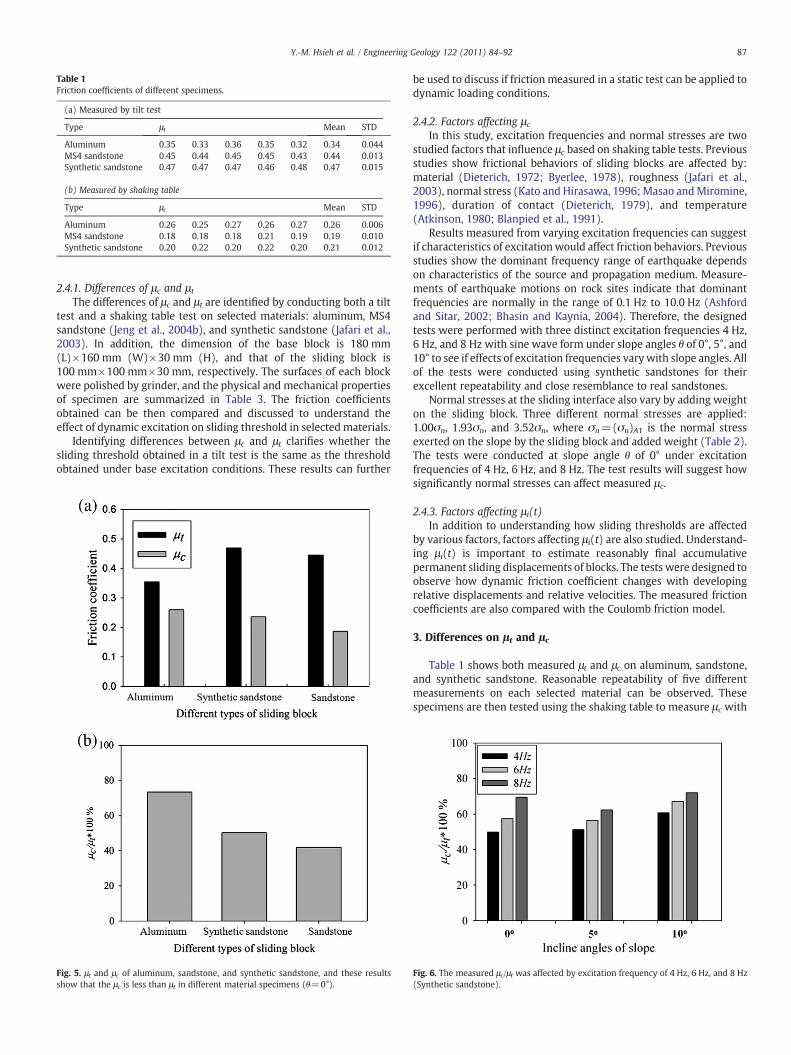
Table 1Friction coefficients of different specimens.
(a) Measured by tilt test
Type μt Mean STD
Aluminum 0.35 0.33 0.36 0.35 0.32 0.34 0.044MS4 sandstone 0.45 0.44 0.45 0.45 0.43 0.44 0.013Synthetic sandstone 0.47 0.47 0.47 0.46 0.48 0.47 0.015
(b) Measured by shaking table
Type μc Mean STD
Aluminum 0.26 0.25 0.27 0.26 0.27 0.26 0.006MS4 sandstone 0.18 0.18 0.18 0.21 0.19 0.19 0.010Synthetic sandstone 0.20 0.22 0.20 0.22 0.20 0.21 0.012
87Y.-M. Hsieh et al. / Engineering Geology 122 (2011) 84–92
2.4.1. Differences of μc and μtThe differences of μc and μt are identified by conducting both a tilt
test and a shaking table test on selected materials: aluminum, MS4sandstone (Jeng et al., 2004b), and synthetic sandstone (Jafari et al.,2003). In addition, the dimension of the base block is 180 mm(L)×160 mm (W)×30 mm (H), and that of the sliding block is100 mm×100 mm×30 mm, respectively. The surfaces of each blockwere polished by grinder, and the physical and mechanical propertiesof specimen are summarized in Table 3. The friction coefficientsobtained can be then compared and discussed to understand theeffect of dynamic excitation on sliding threshold in selected materials.
Identifying differences between μc and μt clarifies whether thesliding threshold obtained in a tilt test is the same as the thresholdobtained under base excitation conditions. These results can further
Fig. 5. μt and μc of aluminum, sandstone, and synthetic sandstone, and these resultsshow that the μc is less than μt in different material specimens (θ=0°).
be used to discuss if friction measured in a static test can be applied todynamic loading conditions.
2.4.2. Factors affecting μcIn this study, excitation frequencies and normal stresses are two
studied factors that influence μc based on shaking table tests. Previousstudies show frictional behaviors of sliding blocks are affected by:material (Dieterich, 1972; Byerlee, 1978), roughness (Jafari et al.,2003), normal stress (Kato and Hirasawa, 1996; Masao andMiromine,1996), duration of contact (Dieterich, 1979), and temperature(Atkinson, 1980; Blanpied et al., 1991).
Results measured from varying excitation frequencies can suggestif characteristics of excitationwould affect friction behaviors. Previousstudies show the dominant frequency range of earthquake dependson characteristics of the source and propagation medium. Measure-ments of earthquake motions on rock sites indicate that dominantfrequencies are normally in the range of 0.1 Hz to 10.0 Hz (Ashfordand Sitar, 2002; Bhasin and Kaynia, 2004). Therefore, the designedtests were performed with three distinct excitation frequencies 4 Hz,6 Hz, and 8 Hz with sine wave form under slope angles θ of 0°, 5°, and10° to see if effects of excitation frequencies varywith slope angles. Allof the tests were conducted using synthetic sandstones for theirexcellent repeatability and close resemblance to real sandstones.
Normal stresses at the sliding interface also vary by adding weighton the sliding block. Three different normal stresses are applied:1.00σn, 1.93σn, and 3.52σn, where σn=(σn)A1 is the normal stressexerted on the slope by the sliding block and added weight (Table 2).The tests were conducted at slope angle θ of 0° under excitationfrequencies of 4 Hz, 6 Hz, and 8 Hz. The test results will suggest howsignificantly normal stresses can affect measured μc.
2.4.3. Factors affecting μi(t)In addition to understanding how sliding thresholds are affected
by various factors, factors affecting μi(t) are also studied. Understand-ing μi(t) is important to estimate reasonably final accumulativepermanent sliding displacements of blocks. The tests were designed toobserve how dynamic friction coefficient changes with developingrelative displacements and relative velocities. The measured frictioncoefficients are also compared with the Coulomb friction model.
3. Differences on μt and μc
Table 1 shows both measured μt and μc on aluminum, sandstone,and synthetic sandstone. Reasonable repeatability of five differentmeasurements on each selected material can be observed. Thesespecimens are then tested using the shaking table to measure μc with
Fig. 6. The measured μc/μt was affected by excitation frequency of 4 Hz, 6 Hz, and 8 Hz(Synthetic sandstone).
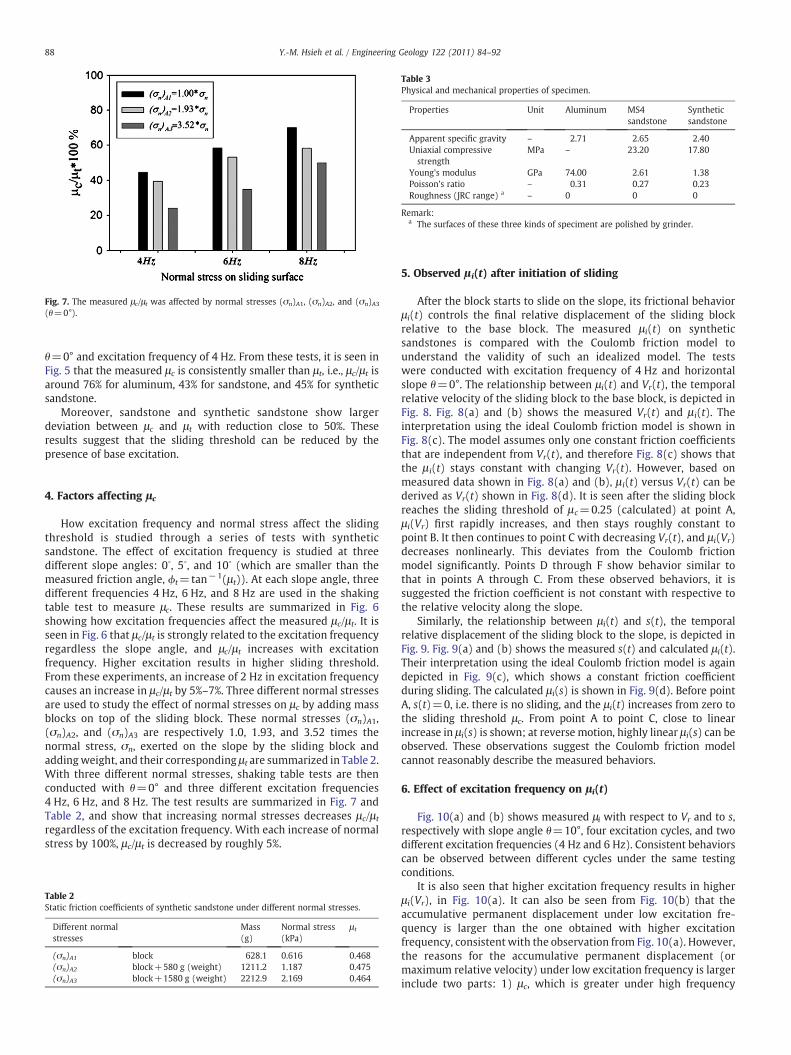
Fig. 7. The measured μc/μt was affected by normal stresses (σn)A1, (σn)A2, and (σn)A3(θ=0°).
Table 3Physical and mechanical properties of specimen.
Properties Unit Aluminum MS4sandstone
Syntheticsandstone
Apparent specific gravity – 2.71 2.65 2.40Uniaxial compressivestrength
MPa – 23.20 17.80
Young's modulus GPa 74.00 2.61 1.38Poisson's ratio – 0.31 0.27 0.23Roughness (JRC range) a – 0 0 0
Remark:a The surfaces of these three kinds of speciment are polished by grinder.
88 Y.-M. Hsieh et al. / Engineering Geology 122 (2011) 84–92
θ=0° and excitation frequency of 4 Hz. From these tests, it is seen inFig. 5 that the measured μc is consistently smaller than μt, i.e., μc/μt isaround 76% for aluminum, 43% for sandstone, and 45% for syntheticsandstone.
Moreover, sandstone and synthetic sandstone show largerdeviation between μc and μt with reduction close to 50%. Theseresults suggest that the sliding threshold can be reduced by thepresence of base excitation.
4. Factors affecting μc
How excitation frequency and normal stress affect the slidingthreshold is studied through a series of tests with syntheticsandstone. The effect of excitation frequency is studied at threedifferent slope angles: 0∘, 5∘, and 10∘ (which are smaller than themeasured friction angle, ϕt=tan−1(μt)). At each slope angle, threedifferent frequencies 4 Hz, 6 Hz, and 8 Hz are used in the shakingtable test to measure μc. These results are summarized in Fig. 6showing how excitation frequencies affect the measured μc/μt. It isseen in Fig. 6 that μc/μt is strongly related to the excitation frequencyregardless the slope angle, and μc/μt increases with excitationfrequency. Higher excitation results in higher sliding threshold.From these experiments, an increase of 2 Hz in excitation frequencycauses an increase in μc/μt by 5%–7%. Three different normal stressesare used to study the effect of normal stresses on μc by adding massblocks on top of the sliding block. These normal stresses (σn)A1,(σn)A2, and (σn)A3 are respectively 1.0, 1.93, and 3.52 times thenormal stress, σn, exerted on the slope by the sliding block andaddingweight, and their corresponding μt are summarized in Table 2.With three different normal stresses, shaking table tests are thenconducted with θ=0° and three different excitation frequencies4 Hz, 6 Hz, and 8 Hz. The test results are summarized in Fig. 7 andTable 2, and show that increasing normal stresses decreases μc/μtregardless of the excitation frequency. With each increase of normalstress by 100%, μc/μt is decreased by roughly 5%.
Table 2Static friction coefficients of synthetic sandstone under different normal stresses.
Different normalstresses
Mass(g)
Normal stress(kPa)
μt
(σn)A1 block 628.1 0.616 0.468(σn)A2 block+580 g (weight) 1211.2 1.187 0.475(σn)A3 block+1580 g (weight) 2212.9 2.169 0.464
5. Observed μi(t) after initiation of sliding
After the block starts to slide on the slope, its frictional behaviorμi(t) controls the final relative displacement of the sliding blockrelative to the base block. The measured μ i(t) on syntheticsandstones is compared with the Coulomb friction model tounderstand the validity of such an idealized model. The testswere conducted with excitation frequency of 4 Hz and horizontalslope θ=0°. The relationship between μi(t) and Vr(t), the temporalrelative velocity of the sliding block to the base block, is depicted inFig. 8. Fig. 8(a) and (b) shows the measured Vr(t) and μ i(t). Theinterpretation using the ideal Coulomb friction model is shown inFig. 8(c). The model assumes only one constant friction coefficientsthat are independent from Vr(t), and therefore Fig. 8(c) shows thatthe μ i(t) stays constant with changing Vr(t). However, based onmeasured data shown in Fig. 8(a) and (b), μ i(t) versus Vr(t) can bederived as Vr(t) shown in Fig. 8(d). It is seen after the sliding blockreaches the sliding threshold of μ c=0.25 (calculated) at point A,μ i(Vr) first rapidly increases, and then stays roughly constant topoint B. It then continues to point C with decreasing Vr(t), and μ i(Vr)decreases nonlinearly. This deviates from the Coulomb frictionmodel significantly. Points D through F show behavior similar tothat in points A through C. From these observed behaviors, it issuggested the friction coefficient is not constant with respective tothe relative velocity along the slope.
Similarly, the relationship between μi(t) and s(t), the temporalrelative displacement of the sliding block to the slope, is depicted inFig. 9. Fig. 9(a) and (b) shows the measured s(t) and calculated μi(t).Their interpretation using the ideal Coulomb friction model is againdepicted in Fig. 9(c), which shows a constant friction coefficientduring sliding. The calculated μ i(s) is shown in Fig. 9(d). Before pointA, s(t)=0, i.e. there is no sliding, and the μ i(t) increases from zero tothe sliding threshold μc. From point A to point C, close to linearincrease in μi(s) is shown; at reverse motion, highly linear μ i(s) can beobserved. These observations suggest the Coulomb friction modelcannot reasonably describe the measured behaviors.
6. Effect of excitation frequency on μi(t)
Fig. 10(a) and (b) shows measured μi with respect to Vr and to s,respectively with slope angle θ=10°, four excitation cycles, and twodifferent excitation frequencies (4 Hz and 6 Hz). Consistent behaviorscan be observed between different cycles under the same testingconditions.
It is also seen that higher excitation frequency results in higherμ i(Vr), in Fig. 10(a). It can also be seen from Fig. 10(b) that theaccumulative permanent displacement under low excitation fre-quency is larger than the one obtained with higher excitationfrequency, consistent with the observation from Fig. 10(a). However,the reasons for the accumulative permanent displacement (ormaximum relative velocity) under low excitation frequency is largerinclude two parts: 1) μc, which is greater under high frequency
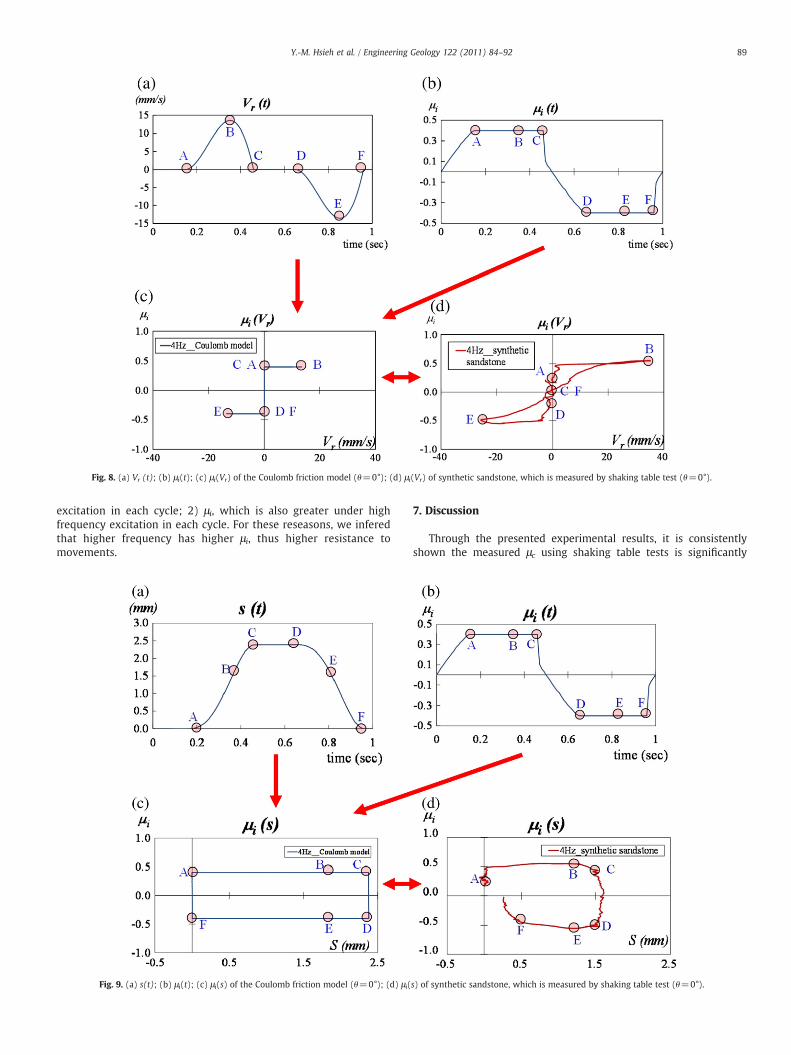
Fig. 8. (a) Vr (t); (b) μi(t); (c) μi(Vr) of the Coulomb friction model (θ=0°); (d) μi(Vr) of synthetic sandstone, which is measured by shaking table test (θ=0°).
89Y.-M. Hsieh et al. / Engineering Geology 122 (2011) 84–92
excitation in each cycle; 2) μi, which is also greater under highfrequency excitation in each cycle. For these reseasons, we inferedthat higher frequency has higher μi, thus higher resistance tomovements.
Fig. 9. (a) s(t); (b) μi(t); (c) μi(s) of the Coulomb friction model (θ=0°); (d) μi(
7. Discussion
Through the presented experimental results, it is consistentlyshown the measured μc using shaking table tests is significantly
s) of synthetic sandstone, which is measured by shaking table test (θ=0°).
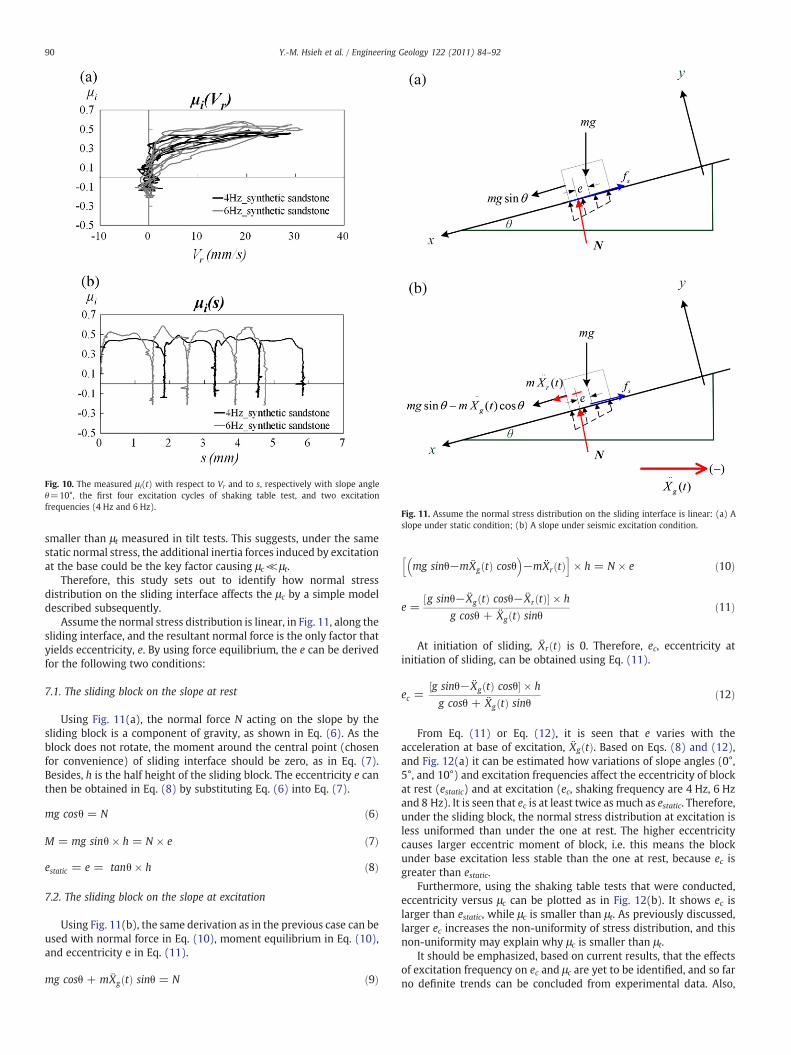
Fig. 10. The measured μ i(t) with respect to Vr and to s, respectively with slope angleθ=10°, the first four excitation cycles of shaking table test, and two excitationfrequencies (4 Hz and 6 Hz).
Fig. 11. Assume the normal stress distribution on the sliding interface is linear: (a) Aslope under static condition; (b) A slope under seismic excitation condition.
90 Y.-M. Hsieh et al. / Engineering Geology 122 (2011) 84–92
smaller than μt measured in tilt tests. This suggests, under the samestatic normal stress, the additional inertia forces induced by excitationat the base could be the key factor causing μc≪μt.
Therefore, this study sets out to identify how normal stressdistribution on the sliding interface affects the μc by a simple modeldescribed subsequently.
Assume the normal stress distribution is linear, in Fig. 11, along thesliding interface, and the resultant normal force is the only factor thatyields eccentricity, e. By using force equilibrium, the e can be derivedfor the following two conditions:
7.1. The sliding block on the slope at rest
Using Fig. 11(a), the normal force N acting on the slope by thesliding block is a component of gravity, as shown in Eq. (6). As theblock does not rotate, the moment around the central point (chosenfor convenience) of sliding interface should be zero, as in Eq. (7).Besides, h is the half height of the sliding block. The eccentricity e canthen be obtained in Eq. (8) by substituting Eq. (6) into Eq. (7).
mg cosθ = N ð6Þ
M = mg sinθ × h = N × e ð7Þ
estatic = e = tanθ × h ð8Þ
7.2. The sliding block on the slope at excitation
Using Fig. 11(b), the same derivation as in the previous case can beused with normal force in Eq. (10), moment equilibrium in Eq. (10),and eccentricity e in Eq. (11).
mg cosθ + m Xg tð Þ sinθ = N ð9Þ
mg sinθ−m Xg tð Þ cosθ� �
−m Xr tð Þh i
× h = N × e ð10Þ
e =½g sinθ− Xg tð Þ cosθ− Xr tð Þ� × h
g cosθ + Xg tð Þ sinθ ð11Þ
At initiation of sliding, Xr tð Þ is 0. Therefore, ec, eccentricity atinitiation of sliding, can be obtained using Eq. (11).
ec =½g sinθ− Xg tð Þ cosθ� × h
g cosθ + Xg tð Þ sinθ ð12Þ
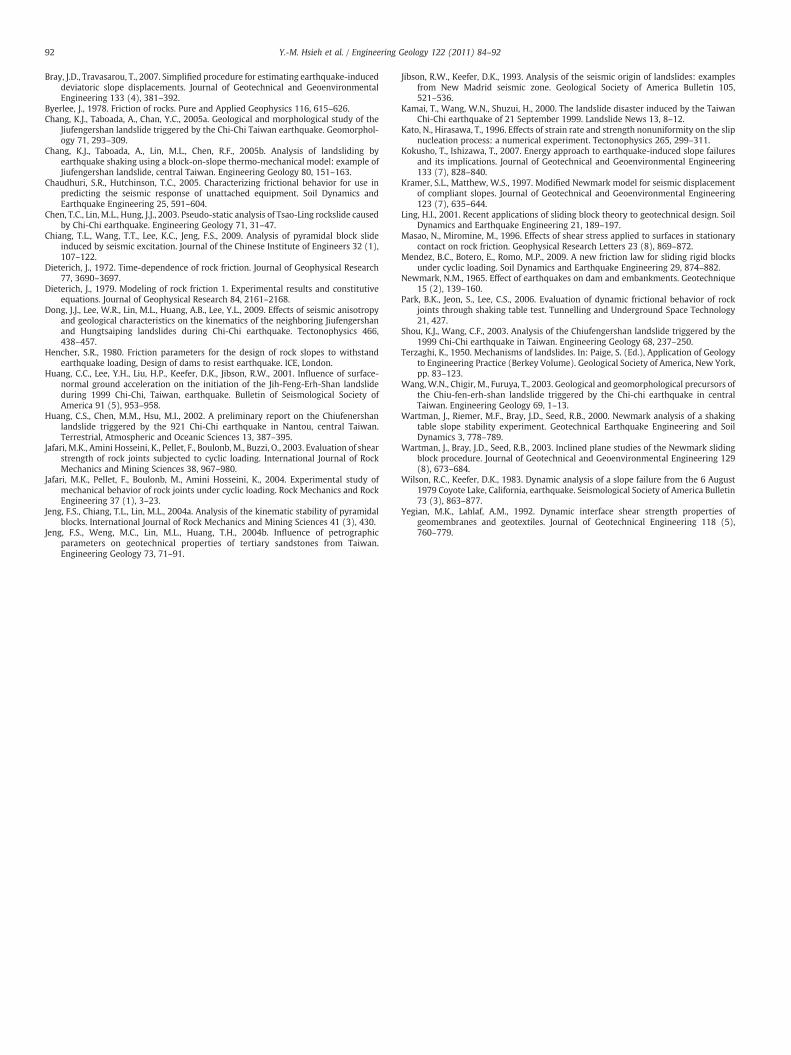
From Eq. (11) or Eq. (12), it is seen that e varies with theacceleration at base of excitation, Xg tð Þ. Based on Eqs. (8) and (12),and Fig. 12(a) it can be estimated how variations of slope angles (0°,5°, and 10°) and excitation frequencies affect the eccentricity of blockat rest (estatic) and at excitation (ec, shaking frequency are 4 Hz, 6 Hzand 8 Hz). It is seen that ec is at least twice as much as estatic. Therefore,under the sliding block, the normal stress distribution at excitation isless uniformed than under the one at rest. The higher eccentricitycauses larger eccentric moment of block, i.e. this means the blockunder base excitation less stable than the one at rest, because ec isgreater than estatic.
Furthermore, using the shaking table tests that were conducted,eccentricity versus μc can be plotted as in Fig. 12(b). It shows ec islarger than estatic, while μc is smaller than μt. As previously discussed,larger ec increases the non-uniformity of stress distribution, and thisnon-uniformity may explain why μc is smaller than μt.
It should be emphasized, based on current results, that the effectsof excitation frequency on ec and μc are yet to be identified, and so farno definite trends can be concluded from experimental data. Also,
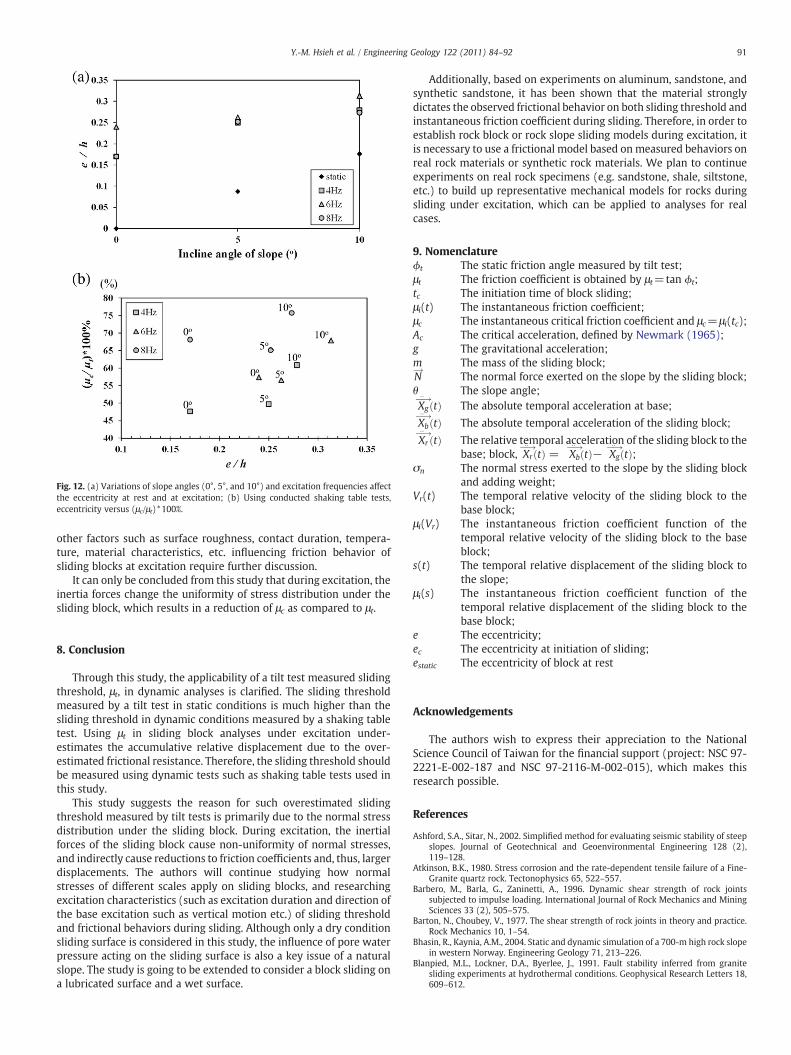
Fig. 12. (a) Variations of slope angles (0°, 5°, and 10°) and excitation frequencies affectthe eccentricity at rest and at excitation; (b) Using conducted shaking table tests,eccentricity versus (μc/μt)*100%.
91Y.-M. Hsieh et al. / Engineering Geology 122 (2011) 84–92
other factors such as surface roughness, contact duration, tempera-ture, material characteristics, etc. influencing friction behavior ofsliding blocks at excitation require further discussion.
It can only be concluded from this study that during excitation, theinertia forces change the uniformity of stress distribution under thesliding block, which results in a reduction of μc as compared to μt.
8. Conclusion
Through this study, the applicability of a tilt test measured slidingthreshold, μt, in dynamic analyses is clarified. The sliding thresholdmeasured by a tilt test in static conditions is much higher than thesliding threshold in dynamic conditions measured by a shaking tabletest. Using μt in sliding block analyses under excitation under-estimates the accumulative relative displacement due to the over-estimated frictional resistance. Therefore, the sliding threshold shouldbe measured using dynamic tests such as shaking table tests used inthis study.
This study suggests the reason for such overestimated slidingthreshold measured by tilt tests is primarily due to the normal stressdistribution under the sliding block. During excitation, the inertialforces of the sliding block cause non-uniformity of normal stresses,and indirectly cause reductions to friction coefficients and, thus, largerdisplacements. The authors will continue studying how normalstresses of different scales apply on sliding blocks, and researchingexcitation characteristics (such as excitation duration and direction ofthe base excitation such as vertical motion etc.) of sliding thresholdand frictional behaviors during sliding. Although only a dry conditionsliding surface is considered in this study, the influence of pore waterpressure acting on the sliding surface is also a key issue of a naturalslope. The study is going to be extended to consider a block sliding ona lubricated surface and a wet surface.
Additionally, based on experiments on aluminum, sandstone, andsynthetic sandstone, it has been shown that the material stronglydictates the observed frictional behavior on both sliding threshold andinstantaneous friction coefficient during sliding. Therefore, in order toestablish rock block or rock slope sliding models during excitation, itis necessary to use a frictional model based onmeasured behaviors onreal rock materials or synthetic rock materials. We plan to continueexperiments on real rock specimens (e.g. sandstone, shale, siltstone,etc.) to build up representative mechanical models for rocks duringsliding under excitation, which can be applied to analyses for realcases.
9. Nomenclature
ϕt The static friction angle measured by tilt test;μt The friction coefficient is obtained by μt=tan ϕt;tc The initiation time of block sliding;μi(t) The instantaneous friction coefficient;μc The instantaneous critical friction coefficient and μc=μi(tc);Ac The critical acceleration, defined by Newmark (1965);g The gravitational acceleration;m The mass of the sliding block;N!The normal force exerted on the slope by the sliding block;θ The slope angle;Xg�!::
tð Þ The absolute temporal acceleration at base;
Xb�!::
tð Þ The absolute temporal acceleration of the sliding block;
Xr�!::
tð Þ The relative temporal acceleration of the sliding block to thebase; block, Xr
�!::tð Þ = Xb
�!::tð Þ− Xg
�!::tð Þ;
σn The normal stress exerted to the slope by the sliding blockand adding weight;
Vr(t) The temporal relative velocity of the sliding block to thebase block;
μi(Vr) The instantaneous friction coefficient function of thetemporal relative velocity of the sliding block to the baseblock;
s(t) The temporal relative displacement of the sliding block tothe slope;
μi(s) The instantaneous friction coefficient function of thetemporal relative displacement of the sliding block to thebase block;
e The eccentricity;ec The eccentricity at initiation of sliding;estatic The eccentricity of block at rest
Acknowledgements
The authors wish to express their appreciation to the NationalScience Council of Taiwan for the financial support (project: NSC 97-2221-E-002-187 and NSC 97-2116-M-002-015), which makes thisresearch possible.
References
Ashford, S.A., Sitar, N., 2002. Simplified method for evaluating seismic stability of steepslopes. Journal of Geotechnical and Geoenvironmental Engineering 128 (2),119–128.
Atkinson, B.K., 1980. Stress corrosion and the rate-dependent tensile failure of a Fine-Granite quartz rock. Tectonophysics 65, 522–557.
Barbero, M., Barla, G., Zaninetti, A., 1996. Dynamic shear strength of rock jointssubjected to impulse loading. International Journal of Rock Mechanics and MiningSciences 33 (2), 505–575.
Barton, N., Choubey, V., 1977. The shear strength of rock joints in theory and practice.Rock Mechanics 10, 1–54.
Bhasin, R., Kaynia, A.M., 2004. Static and dynamic simulation of a 700-m high rock slopein western Norway. Engineering Geology 71, 213–226.
Blanpied, M.L., Lockner, D.A., Byerlee, J., 1991. Fault stability inferred from granitesliding experiments at hydrothermal conditions. Geophysical Research Letters 18,609–612.
92 Y.-M. Hsieh et al. / Engineering Geology 122 (2011) 84–92
Bray, J.D., Travasarou, T., 2007. Simplified procedure for estimating earthquake-induceddeviatoric slope displacements. Journal of Geotechnical and GeoenvironmentalEngineering 133 (4), 381–392.
Byerlee, J., 1978. Friction of rocks. Pure and Applied Geophysics 116, 615–626.Chang, K.J., Taboada, A., Chan, Y.C., 2005a. Geological and morphological study of the
Jiufengershan landslide triggered by the Chi-Chi Taiwan earthquake. Geomorphol-ogy 71, 293–309.
Chang, K.J., Taboada, A., Lin, M.L., Chen, R.F., 2005b. Analysis of landsliding byearthquake shaking using a block-on-slope thermo-mechanical model: example ofJiufengershan landslide, central Taiwan. Engineering Geology 80, 151–163.
Chaudhuri, S.R., Hutchinson, T.C., 2005. Characterizing frictional behavior for use inpredicting the seismic response of unattached equipment. Soil Dynamics andEarthquake Engineering 25, 591–604.
Chen, T.C., Lin, M.L., Hung, J.J., 2003. Pseudo-static analysis of Tsao-Ling rockslide causedby Chi-Chi earthquake. Engineering Geology 71, 31–47.
Chiang, T.L., Wang, T.T., Lee, K.C., Jeng, F.S., 2009. Analysis of pyramidal block slideinduced by seismic excitation. Journal of the Chinese Institute of Engineers 32 (1),107–122.
Dieterich, J., 1972. Time-dependence of rock friction. Journal of Geophysical Research77, 3690–3697.
Dieterich, J., 1979. Modeling of rock friction 1. Experimental results and constitutiveequations. Journal of Geophysical Research 84, 2161–2168.
Dong, J.J., Lee, W.R., Lin, M.L., Huang, A.B., Lee, Y.L., 2009. Effects of seismic anisotropyand geological characteristics on the kinematics of the neighboring Jiufengershanand Hungtsaiping landslides during Chi-Chi earthquake. Tectonophysics 466,438–457.
Hencher, S.R., 1980. Friction parameters for the design of rock slopes to withstandearthquake loading, Design of dams to resist earthquake. ICE, London.
Huang, C.C., Lee, Y.H., Liu, H.P., Keefer, D.K., Jibson, R.W., 2001. Influence of surface-normal ground acceleration on the initiation of the Jih-Feng-Erh-Shan landslideduring 1999 Chi-Chi, Taiwan, earthquake. Bulletin of Seismological Society ofAmerica 91 (5), 953–958.
Huang, C.S., Chen, M.M., Hsu, M.I., 2002. A preliminary report on the Chiufenershanlandslide triggered by the 921 Chi-Chi earthquake in Nantou, central Taiwan.Terrestrial, Atmospheric and Oceanic Sciences 13, 387–395.
Jafari, M.K., Amini Hosseini, K., Pellet, F., Boulonb, M., Buzzi, O., 2003. Evaluation of shearstrength of rock joints subjected to cyclic loading. International Journal of RockMechanics and Mining Sciences 38, 967–980.
Jafari, M.K., Pellet, F., Boulonb, M., Amini Hosseini, K., 2004. Experimental study ofmechanical behavior of rock joints under cyclic loading. Rock Mechanics and RockEngineering 37 (1), 3–23.
Jeng, F.S., Chiang, T.L., Lin, M.L., 2004a. Analysis of the kinematic stability of pyramidalblocks. International Journal of Rock Mechanics and Mining Sciences 41 (3), 430.
Jeng, F.S., Weng, M.C., Lin, M.L., Huang, T.H., 2004b. Influence of petrographicparameters on geotechnical properties of tertiary sandstones from Taiwan.Engineering Geology 73, 71–91.
Jibson, R.W., Keefer, D.K., 1993. Analysis of the seismic origin of landslides: examplesfrom New Madrid seismic zone. Geological Society of America Bulletin 105,521–536.
Kamai, T., Wang, W.N., Shuzui, H., 2000. The landslide disaster induced by the TaiwanChi-Chi earthquake of 21 September 1999. Landslide News 13, 8–12.
Kato, N., Hirasawa, T., 1996. Effects of strain rate and strength nonuniformity on the slipnucleation process: a numerical experiment. Tectonophysics 265, 299–311.
Kokusho, T., Ishizawa, T., 2007. Energy approach to earthquake-induced slope failuresand its implications. Journal of Geotechnical and Geoenvironmental Engineering133 (7), 828–840.
Kramer, S.L., Matthew, W.S., 1997. Modified Newmark model for seismic displacementof compliant slopes. Journal of Geotechnical and Geoenvironmental Engineering123 (7), 635–644.
Ling, H.I., 2001. Recent applications of sliding block theory to geotechnical design. SoilDynamics and Earthquake Engineering 21, 189–197.
Masao, N., Miromine, M., 1996. Effects of shear stress applied to surfaces in stationarycontact on rock friction. Geophysical Research Letters 23 (8), 869–872.
Mendez, B.C., Botero, E., Romo, M.P., 2009. A new friction law for sliding rigid blocksunder cyclic loading. Soil Dynamics and Earthquake Engineering 29, 874–882.
Newmark, N.M., 1965. Effect of earthquakes on dam and embankments. Geotechnique15 (2), 139–160.
Park, B.K., Jeon, S., Lee, C.S., 2006. Evaluation of dynamic frictional behavior of rockjoints through shaking table test. Tunnelling and Underground Space Technology21, 427.
Shou, K.J., Wang, C.F., 2003. Analysis of the Chiufengershan landslide triggered by the1999 Chi-Chi earthquake in Taiwan. Engineering Geology 68, 237–250.
Terzaghi, K., 1950. Mechanisms of landslides. In: Paige, S. (Ed.), Application of Geologyto Engineering Practice (Berkey Volume). Geological Society of America, New York,pp. 83–123.
Wang,W.N., Chigir, M., Furuya, T., 2003. Geological and geomorphological precursors ofthe Chiu-fen-erh-shan landslide triggered by the Chi-chi earthquake in centralTaiwan. Engineering Geology 69, 1–13.
Wartman, J., Riemer, M.F., Bray, J.D., Seed, R.B., 2000. Newmark analysis of a shakingtable slope stability experiment. Geotechnical Earthquake Engineering and SoilDynamics 3, 778–789.
Wartman, J., Bray, J.D., Seed, R.B., 2003. Inclined plane studies of the Newmark slidingblock procedure. Journal of Geotechnical and Geoenvironmental Engineering 129(8), 673–684.
Wilson, R.C., Keefer, D.K., 1983. Dynamic analysis of a slope failure from the 6 August1979 Coyote Lake, California, earthquake. Seismological Society of America Bulletin73 (3), 863–877.
Yegian, M.K., Lahlaf, A.M., 1992. Dynamic interface shear strength properties ofgeomembranes and geotextiles. Journal of Geotechnical Engineering 118 (5),760–779.
Related Documents