We would like to thank George Baker, Adam Brandenburger, Peter Cappelli, Robert Gibbons, Jerry Green, William Greene, Paul Healy, Casey Ichniowski, David Levine, Will Mitchell, Nitin Nohria, Paul Oyer, Mikolaj Piskorski, Joel Podolny, and Ezra Zuckerman, as well as participants in seminars at Columbia Business School, Econometric Society 2004 North American Winter conference, Harvard Business School, Harvard University Applied Statistic series, London Business School, Ohio State University, Stanford Business School, the University of Pennsylvania, and the University of Washington. We appreciate William Greene’s help with estimating the recently developed ordered probit fixed-effects models. We are grateful to professionals at CS First Boston, Deutsche Bank, Goldman Sachs, Institutional Investor, J. P. Morgan, Lehman Brothers, Merrill Lynch, Morgan Stanley, Salomon Smith Barney, and Sanford C. Bernstein for interviews and comments on previous drafts. We also wish to thank Kathleen Ryan and James Schorr for research assistance. We gratefully acknowledge the Division of Research at the Harvard Business School for financial support for this study. 1 Can They Take It With Them? The Portability of Star Knowledge Workers’ Performance Forthcoming Management Science Boris Groysberg, Linda-Eling Lee, and Ashish Nanda October, 2007 Abstract This paper examines the portability of star security analysts’ performance. Star analysts who switched employers experienced an immediate decline in performance that persisted for at least five years. This decline was most pronounced among star analysts who moved to firms with lesser capabilities and those who moved solo, without other team members. Star analysts who moved between two firms with equivalent capabilities also exhibited a drop in performance, but only for two years. Those who switched to firms with better capabilities and those who moved with other team members exhibited no significant decline in short-term or long-term performance. These findings suggest that firm-specific skills and firms’ capabilities both play important roles in star analysts’ performance. In addition, we find that firms that hire star analysts from competitors with better capabilities suffered more extreme negative stock-market reactions than those that hire from comparable or lesser firms. These findings suggest that hiring stars may be perceived as value-destroying and may not improve a firm’s competitive advantage. JEL Classification J24, J44

Welcome message from author
This document is posted to help you gain knowledge. Please leave a comment to let me know what you think about it! Share it to your friends and learn new things together.
Transcript
We would like to thank George Baker, Adam Brandenburger, Peter Cappelli, Robert Gibbons, Jerry Green, William Greene, Paul Healy, Casey Ichniowski, David Levine, Will Mitchell, Nitin Nohria, Paul Oyer, Mikolaj Piskorski, Joel Podolny, and Ezra Zuckerman, as well as participants in seminars at Columbia Business School, Econometric Society 2004 North American Winter conference, Harvard Business School, Harvard University Applied Statistic series, London Business School, Ohio State University, Stanford Business School, the University of Pennsylvania, and the University of Washington. We appreciate William Greene’s help with estimating the recently developed ordered probit fixed-effects models. We are grateful to professionals at CS First Boston, Deutsche Bank, Goldman Sachs, Institutional Investor, J. P. Morgan, Lehman Brothers, Merrill Lynch, Morgan Stanley, Salomon Smith Barney, and Sanford C. Bernstein for interviews and comments on previous drafts. We also wish to thank Kathleen Ryan and James Schorr for research assistance. We gratefully acknowledge the Division of Research at the Harvard Business School for financial support for this study. 1
Can They Take It With Them? The Portability of Star Knowledge Workers’ Performance
Forthcoming Management Science
Boris Groysberg, Linda-Eling Lee, and Ashish Nanda
October, 2007
Abstract
This paper examines the portability of star security analysts’ performance. Star analysts who switched employers
experienced an immediate decline in performance that persisted for at least five years. This decline was most
pronounced among star analysts who moved to firms with lesser capabilities and those who moved solo, without
other team members. Star analysts who moved between two firms with equivalent capabilities also exhibited a drop
in performance, but only for two years. Those who switched to firms with better capabilities and those who moved
with other team members exhibited no significant decline in short-term or long-term performance. These findings
suggest that firm-specific skills and firms’ capabilities both play important roles in star analysts’ performance. In
addition, we find that firms that hire star analysts from competitors with better capabilities suffered more extreme
negative stock-market reactions than those that hire from comparable or lesser firms. These findings suggest that
hiring stars may be perceived as value-destroying and may not improve a firm’s competitive advantage.
JEL Classification J24, J44
2
A Nobel Prize-winning scientist may be a unique resource, but unless he has firm-specific ties, his perfect mobility makes him an unlikely source of sustainable advantage. Managers should ask themselves if his productivity has to do, in part, with the specific team of researchers of which he is a part. Does it depend on his relationship with talented managers who are exceptionally adept at managing creativity? Does it depend on the spirit of the workers or the unique culture of the firm? (Margaret A. Peteraf, 1993, p. 187)
As the labor market shifts toward information- and knowledge-based work, organizations are increasingly
preoccupied with the quality of their workers as a source of competitive advantage (Pfeffer, 1994, 1998). Top
performers—referred to in this paper as stars—are regarded as disproportionately productive and valuable, and
organizations view it as imperative to attract and retain such talent (e.g. Ernst and Vitt, 2000; Hunter, Schmidt, and
Judiesch, 1990; Narin and Breitzman, 1995). Though stars may be extraordinarily productive, they cannot constitute
a sustained competitive advantage if their skills are mobile and transferable across firms.
According to Barney (1991), a firm enjoys a competitive advantage only if its strategic resources are
valuable, rare, difficult to imitate, and lacking in substitutes. Peteraf (1993) specifies four conditions that underlie
competitive advantage: resource heterogeneity, ex-post limits to competition, ex-ante limits to competition, and
imperfect resource mobility. With regard to resource mobility, Peteraf (1993) notes that even a superstar like a Nobel
Prize-winning scientist cannot represent a competitive advantage for an organization unless firm-specific factors
contribute to his or her performance (1993). Hence the resource-based view of the firm has emphasized the tacit
knowledge embedded in organizational structures and relationships among workers (Cohen and Levinthal, 1990;
Kogut and Zander, 1996; Nahapiet and Ghoshal, 1998) rather than capabilities that reside in individual star workers.
Research on knowledge management, meanwhile, has shown that the mobility of individual workers, particularly
high-performing knowledge workers like engineers, is an important means of transferring, dispersing, or buying
knowledge assets (Song, Almeida, and Wu, 2003; Kim 1997; Zander and Kogut, 1995). The extent to which a star’s
performance is transferable across organizations remains a key strategic concern in knowledge-based industries.
In knowledge-intensive industries like finance, accounting, law, and technology, companies and workers
often share the assumption that stars and their talent are highly portable—that is, that they can apply their skills just
as well for one employer as for another. The business media promote this assumption with reports on stars who
defect to competing firms and presumably take their innovative ideas with them (e.g., see Sessa, 1999). Stars’ ability

3
to transfer their value to a new firm is viewed as particularly pronounced in industries in which clients’ loyalties flow to
the individuals who provide a service rather than the firm that employs those individuals (Greenwood, Hinings, and
Brown, 1990). Furious bidding for star performers (Lazear, 1986) also promotes the perception that stars are
essentially free agents, not unlike star athletes whose ability can be bought by the highest bidder.
Human-capital theory distinguishes between general human capital, which is applicable to many
organizational contexts, and firm-specific human capital, which is valuable only to a specific organization (Becker,
1962). The firm-specificity of workers’ skills is the degree to which the human capital they acquired at a particular firm
is idiosyncratic and therefore useless at other firms. Investment in general training raises workers’ productivity in a
manner equally valuable to all comparable employers, whereas firm-specific training increases the value of workers’
marginal products at only one firm. Firm-specific human capital includes familiarity with unique routines and
procedures, tacit knowledge embedded in interpersonal relationships and corporate culture, skills specific to internal
networks (team production), and the content of in-house training programs and on-the-job experience peculiar to the
firm. As Mailath and Postlewaite (1990, pp. 369-370) put it, a firm is “a network of people, each with an
understanding about how information and goods move within the firm. They know whom to contact about particular
problems that may arise and they know the strengths and weaknesses of their co-workers.”
The perception that star knowledge workers can take their talent with them to competing firms assumes that
their performance draws entirely on general human capital. This paper will address the question of when star
knowledge workers can in fact take their performance with them to competing firms. We will argue that the human
capital of star performers has a firm-specific component that cannot be easily transferred across firms. We will
consider how much one component of firm-specific human capital—the knowledge embedded in relationships with
colleagues—may contribute to the portability of a star’s performance. And we will address whether hiring stars
constitutes a value-creating or value-destroying proposition for firms.
We tested our hypotheses on star performers in the security-analyst market. Because an analyst’s core
activities, clients, and geographic location typically remain unchanged after changing employers, analysts and the
firms that employ them share a conviction that their performance is highly portable. As research executive Fred
Fraenkel put it, "Analysts are one of the most mobile Wall Street professions because their expertise is portable. I
4
mean, you’ve got it when you’re here and you’ve got it when you’re there. The client base doesn't change. You need
your Rolodex and your files, and you’re in business.”
We have compiled a unique data set that captures the performance and turnover of 799 equity analysts and
254 fixed-income analysts across 78 firms over a period of nine years. This longitudinal data allows us to capture
both short- and long-term changes in performance. The quality of our data presents a unique opportunity to advance
empirical knowledge on human capital and drivers of performance. Previous empirical investigations of portability of
performance have been hobbled by incomplete data on the workers in a given firm, job, or industry; performance that
is difficult to observe given the nature or structure of the jobs in question; and a low incidence of turnover (Chapman
and Southwick, 1991). Thus it has been impossible to disentangle the effects on worker productivity of human capital
and other factors (Garen, 1988). Measuring the performance of knowledge workers has proven particularly difficult
(e.g. Ernst and Vitt, 2000). What little performance data were available relied on self-reports or were limited to a
single firm, preventing cross-firm comparisons (Barrett and O'Connell, 2001). The external rankings we use in this
study provide a clear and public distinction between outstanding and ordinary performers, and the availability of rich
data at the demographic, departmental, firm-specific, sectoral, and macroeconomic levels makes it feasible to control
for all these variables together. Furthermore, few other studies have employed longitudinal data on individual
performance, which is crucial to disentangle individual and organizational contributions to performance.
Star Performers
Two factors distinguish star performers from average or merely competent performers. First, star performers are
disproportionately more productive. Studies of research-and-development scientists and academic researchers have
found that a few individuals are many times more productive than their colleagues (e.g., Cole and Cole, 1973; Ernst,
Leptein, and Vitt, 2000; Narin and Breitzman, 1995). In knowledge work, the ability and experience of top performers
are assets that cannot be compensated for by larger number of poorer performers, or by non-human assets (Narin,
1993; Rosen, 1981).
Second, stars are more visible in their labor markets than more ordinary performers. Any industry will have
many high-performing individuals, but the handful of superstars at the top will receive disproportionate attention from
competitors and clients (and, in some industries, the media), making their performance public and observable.
5
Consequently, as Lazear (1986) noted, star workers are more mobile: the visibility of their high performance may
prompt rival organizations to try to woo them away. Greater opportunities for mobility in turn increase star performers’
bargaining power. The mobility of stars has been studied extensively in the motion-picture industry (e.g., Ravid 1999)
and in baseball (e.g., Cymrot and Dunlevy, 1987; Krautmann and Oppenheimer, 1994; MacDonald and Reynolds,
1994). Workers in both industries suddenly found themselves free to offer their talents to the highest bidder when the
studio system collapsed in motion pictures and when free agency replaced the reserve clause in baseball. Ravid
(1999) argues that star artists, such as Oscar winners, are free agents who can quickly adjust their fees to reflect
their market value, thus capturing most of their expected value added; as a consequence, hiring stars does not
increase return on investment.
These two factors—extraordinary productivity and greater visibility—pose a dilemma for organizations intent
on attracting and retaining star performers. Given the strategic importance of excellent individual performance, it is a
crucial question for managers and star performers alike whether and how such performance can be transferred
across organizational contexts. If the contribution of context to extraordinary performance is overlooked, stars may
switch firms in the mistaken belief that they can “take it with them,” only to find their performance declining in a new
setting. And firms may hire stars whose performance, divorced from its previous context, fails to meet expectations.
General and Firm-Specific Human Capital
General human capital consists of non-firm-specific skills that are acquired through via education and on-the-job
general training (Rees, 1973; Rosen, 1981). Williamson (1986, p. 120) asserts that there are individuals, such as
artists, researchers, and administrators, whose “unique skills are rarely of a transaction-specific kind. On the
contrary, most of these individuals could move to another organization without significant productivity loss.”
In knowledge work, star performance has traditionally been attributed to general human capital, or the skills,
characteristics, and competencies of the individual performer (see Felin & Hesterly, forthcoming, for an explication of
this view). Drucker argues, for example, that “knowledge workers, unlike manual workers in manufacturing, own the
means of production: they carry that knowledge in their heads and can therefore take it with them” (1998, p. ix).
Frequently cited examples of such knowledge workers include management consultants (Maister, 1993), attorneys
(Henning, 1993; Kordana, 1995), and security analysts (Mikhail et al., 1997).
6
Individuals and firms in these knowledge-intensive markets tend to share this position and to discount the
notion that organizational context contributes to star performance. Asked to explain how a security analyst becomes
a star, for example, a veteran of Wall Street answered, “This is a little like asking what it was that made Rembrandt or
Van Gogh great artists. If there’s an answer, it’s probably that the greats in any profession are driven by an inner fire,
and are gifted with a special spark” (Lurie, 1967).
As Simonton (1999) pointed out, “[T]he notion that some people are born with more talent than others is
firmly ingrained in everyday psychology.” Researchers have also found that people raised in individualistic Western
cultures are more likely than participants in collectivist Asian cultures to attribute success to innate factors like
intelligence, creativity, or talent, and are more susceptible to “self-enhancement bias” (Kitayama et al., 1997). These
cultural biases reinforce the perception that knowledge workers, even more than other kinds of workers, can
justifiably attribute their performance to their own individual talents.
Despite the characterization of star knowledge workers as free agents, such individuals rarely work as
independent contractors. They develop and exercise their skills in specific organizational contexts. Though some
research has shown that both individual and organization-specific factors are likely to contribute to individual
performance (Pfeffer, 1994), few studies of knowledge workers have attempted to disentangle their effects on star
performance. Some recent studies, however, point to an influential role for firm-specific human capital in knowledge-
based work. Baks’s (2003) economic model of mutual-fund managers’ direct contribution suggests that the fund is
more important than the manager as a determinant of performance. (Baks estimates the individual manager’s
contribution to fund performance at 10–50 percent.) Huckman and Pisano’s (2006) study of cardiac surgeons—who
in essence work as freelancers—demonstrates that the quality of a surgeon’s performance at a given hospital
improves as his or her experience at that hospital increases. This effect does not carry over, however, to other
hospitals at which the surgeon practices. Given the extreme invariability of surgeons’ work—a triple bypass is a triple
bypass, no matter where the operating table is located—this study provides evidence that firm-specific human capital
can account for variability in what would appear to be highly transferable skills. Interestingly enough, Huckman and
Pisano note that the surgeons themselves did not perceive a difference in their performance from one hospital to
another, an observation consistent with the notion that individuals tend to attribute their own performance to their
7
innate talent and skills that are relatively stable traits.
Research on organizational knowledge has demonstrated that a group of colleagues who may appear to be
merely an aggregation of high-performing individuals actually relies on intangible knowledge embedded in the shared
experience of working together (Berman, Down, and Hill, 2002). Learning is often built internally through experience
within an organization (Cohen and Levinthal, 1990). This kind of complex social knowledge, or tacit knowledge, which
can constitute a competitive advantage for an organization (e.g., Nelson and Winter, 1982; Barney, 1991; Lippman
and Rumelt 1982), is by nature uncodifiable. Nor can individuals easily transport this kind of critical knowledge, which
may underlie star-quality performance, because it is embedded in a specific organizational context.
If at least some of the knowledge that contributes to individual performance is firm-specific, we would expect
performance to suffer when stars move to a new firm.
H1: Stars suffer a performance decline when they move to new firms.
Firm Capabilities
A performance decline after changing employers could occur not because of the loss of firm-specific human capital
but because the new firm offers lower-quality support. That is, the new firm’s systems and practices could affect
individual performance (Eccles and Crane, 1988). Research has shown, for example, that complementary innovative
work practices (practices that reinforce each other) can lead to higher productivity, independent of the quality of
individual management (Ichniowski, Shaw, and Prennushi, 1997). The literature on high-performance work practices
has also demonstrated a link between human-resource practices and higher performance (e.g. Huselid, 1995).
Furthermore, such organizational practices as promotion criteria, the system of resource allocation (Henderson and
Cockburn, 1994), and managerial practices (Castanias and Helfat, 1991; Kaplan, Murray, and Henderson, 2003) can
all have an effect on productivity. In workplaces that pursue scientific research, studies have shown that
departmental context has a powerful effect on individual productivity over and above the selection effect whereby
higher-prestige institutions recruit better scientists (Allison and Long, 1990; Long and McGinnis, 1981).
A firm’s status may also affect a worker’s productivity. Zuckerman and Merton (1971) drew a distinction
between performance (current) and eminence (cumulative, and often persistent after performance has flagged).
Affiliation with a prestigious institution can provide a worker greater external credibility and greater access to
8
resources that can contribute to performance (Allison and Long, 1990).
To confidently attribute any performance decline to the loss of firm-specific human capital, we would have to
restrict our focus to moves between firms with comparable capabilities.
H2: Stars suffer a performance decline when they move to firms with equivalent capabilities.
Colleague Relationships
Knowledge work is often organized by project teams, requiring close collaboration between individuals (e.g. Henning,
1993; Kordana, 1995; Maister, 1993). Thus in many cases a key component of the firm-specific knowledge that stars
lose when they move to a new firm is knowledge arising from close collaboration with colleagues (Becker, 1976).
Proximity and frequent interaction with colleagues facilitates the transfer of tacit knowledge, a circumstance difficult to
replicate with new colleagues. Weick and Roberts (1993) demonstrated that a “collective mind” develops among
colleagues who work in teams that require seamless integration of their knowledge and skills. Evidence from baseball
suggests that players are aware of the importance of such team-specific knowledge. Players in positions requiring
greater coordination with team members are less likely to be traded or to move to another team than players whose
positions are relatively independent (Glenn, McGarrity, and Weller, 2001). Evidence from basketball also supports
the importance of team-specific experience in performance (Berman, Down, and Hill, 2002).
Research on social networks offers further support to the thesis that internal relationships are a central
component of the firm-specific capital that stars lose when they move to a new firm. Individuals often rely on
colleagues with different but related areas of expertise for information they would not otherwise encounter (Galbraith,
1977; March and Simon, 1958; Clark and Fujimoto, 1991). Access to such diverse and novel information can help
star performers maintain an edge in formulating innovative ideas (e.g. Burt, 1987). Studies also suggest that
outstanding performers tend to develop and maintain networks of colleagues who contribute to their advancement
(Ibarra, 1995; Burt, 1987).
The frequency with which workers move in teams suggests that at least some individuals are aware of the
value embedded in these relationships. Lawyers, doctors, consultants, and security analysts often leave with a team
of colleagues to join a competitor (e.g. McGregor, 2006; Weisman, 2006). The term lift outs has been coined by the
business press to characterize this phenomenon, observed in industries as diverse as medicine, advertising,
9
software development, and apparel manufacture (Groysberg and Abrahams, 2006; Weisman, 2006; McGregor,
2006). A team move obviates the need for a star to get acquainted with new colleagues or to establish shared
objectives, mutual accountability, or group norms—needs that can detract from performance. Hence stars who move
with a team of colleagues are likely to retain a goodly portion of the firm-specific human capital they enjoyed at their
previous employer.
H3: Stars who move with a team of colleagues suffer less severe performance decline than those who move
solo.
Firm Value
Whether or not a star’s performance will be portable is important when assessing a potential hire as a value-creating
proposition for the firm. It is certainly possible that a star could generate value for the new firm despite a
performance decline. Stars could generate positive externalities, for example, such as boosting the performance of
existing employees or giving the firm access to more profitable clients. Research from the film industry also suggests
that firms hire stars as a way to signal their quality: Ravid (1999) hypothesized that a studio signals the seriousness
and quality of a project by hiring a star.
But firms could lose value-creating opportunities if stars manage to capture their economic rent. Ravid’s
study showed that movie stars did in fact recoup their rents; as a result, though movies with stars attracted more
revenue than those without stars, they were not more profitable because stars are highly paid. Similar results were
found in baseball, where experienced free-agent players recoup their marginal revenue products (MacDonald and
Reynolds, 1994).
A firm that succeeds in hiring a star can be viewed as the highest bidder in the labor market. As research in
diverse fields has shown, such “winners” may experience a winner’s curse and overpay for workers. Spencer (1974)
noted that when all firms in a market are uncertain about a worker’s ability, the individual will be offered a wage equal
to his or her expected ability. In most cases, though, a star’s firm of origin has private information about his or her
ability, based on performance history, that other firms lack (Acemoglu and Pischke, 1998). When the firm that
possesses an informational advantage fails to make a counter-offer to keep the employee from leaving, the hiring
firm is likely to suffer a winner’s curse. The hiring firm is also likely to have made an offer that exceeds the value that
10
the new employee will generate. In such cases, hiring a star is value-destroying. In baseball, for example, Cassing
and Douglas (1980) concluded that the owners of major-league teams consistently overpay for free-agent
acquisitions. The gap between a star’s pay and the value he or she will generate for the hiring firm is likely to be even
greater if the value that the star generated for the prior firm depended in part on firm-specific resources.
Research on corporate takeovers also suggests that the acquisition of new capabilities, technology, or talent
does not always generate value. One explanation for the consistent finding of zero or negative return in research on
mergers and acquisitions (see Sirower, 1997 for a review of literature) is that firms tend to overpay for their targets
(Bradley, Desai and Kim, 1988). Roll (1986) argued that overpayment occurs because acquiring firms' managers are
prompted by hubris to systematically overestimate their own ability to run new units and create takeover gains.
Research on the post-integration process suggests that complex issues of strategic and organizational fit and timing
increase the difficulty of extracting value from an acquisition (e.g., Zollo and Singh, 2004; Haspeslagh and Jemison,
1991. Similarly, hiring stars and fully extracting their value is likely to be a difficult proposition.
H4: Hiring a star destroys value for the hiring firm.
Research Approach
We tested our hypotheses by looking at the job histories and performance records of star Wall Street security
analysts. To test whether research analysts possess firm-specific human capital, we examined whether changing
employers has an effect on their short-term and long-term performance. Determining whether a given individual’s
performance changes when he or she changes firms is problematic, in that we cannot control for what would have
happened to an individual’s performance had he or she stayed put. Our data, however, capture the performance of
many “stayers” at the originating firms. Hence, we can compare a mover’s performance to that of a comparable
individual who chose to stay at the same firm (i.e. control group). This approach has been used in research on labor
migration to address a similar empirical problem (e.g., Friedberg, 2000; Nakosteen and Zimmer, 1980; Robinson and
Tomes, 1982).
If performance is primarily driven by firm-specific skills, a decline in performance can be expected when an
individual changes jobs because it takes time to develop skills specific to the new firm (Hypothesis 1).
Yet, changes in performance may reflect either the loss of firm-specific human capital or the new employer’s different
11
capabilities. Only when the original and destination firms possess equal capabilities can we assert that a decline in
performance confirms the contribution of firm-specific skills to productivity (Hypothesis 2). In a similar fashion, we
also tested whether moving with colleagues affects subsequent performance by comparing the performance of
stayers and movers to firms with equal capabilities (Hypothesis 3).
Furthermore, workers do not move at random. Changing employers is endogenous if the decision to do so
correlates with unobservables that affect performance. Prior studies have demonstrated the importance of accounting
for self-selection in estimating returns to migration (e.g. Nakosteen and Zimmer, 1980; Robinson and Tomes, 1982).
Therefore our econometric methodology takes into account the self-selection process by which workers become
movers or stayers, permitting consistent estimates of the performance of both groups (see online supplement for
methods and analyses).
Finally, the best way to determine whether the acquisition or loss of a high-performing worker is value-
reducing or value-enhancing for a firm would be to calculate a profit-and-loss statement for each worker. The
unavailability of detailed compensation data makes this method unfeasible. In its stead we use the event study
methodology to determine how the stock market treats the share price of an investment bank in reaction to news of
its unforeseen loss or acquisition of a star analyst. Stock-market movement is a well-established proxy for the value
created or lost for a given firm in reaction to a specific event. This measure has been successfully used in research in
accounting (Dyckman, Philbrick, and Stephan, 1984), finance (Asquith and Mullins, 1986), law (Mitchell and Netter,
1994), and strategic management (Brindisi, 1985). It has also been used to measure the effects on firm value of
announced changes in top management (Warner, Watts, and Wruck, 1988). We used stock-price movement to
assess whether acquiring firms gain or lose value when they hire a star analyst (Hypothesis 4).
The Security Analyst Market
Security analysts are employed by investment banks to analyze companies in a particular industry, such as
telecommunications, pharmaceuticals, or food and beverages. Analysts produce earnings forecasts, buy and sell
recommendations, detailed reports on individual companies, and other analyses of interest to investors.
The primary recipients of the information that analysts produce are money-management firms (also known
as institutional investors), including pension funds and mutual funds, which invest their clients’ money by purchasing
12
stocks, bonds, and other investment products for their clients' portfolios. Wall Street distinguishes between
investment banks and money-management firms by referring to investment banks as “the sell side” of the investment
process, and money-management firms as “the buy side.” (The buy side also employs analysts, whose research is
far less specialized; buy-side analysts thus rely heavily on sell-side research.) Our study focuses exclusively on sell-
side equity and fixed-income analysts, who work at investment banks.
Investment banks make money in three principal ways: merger-and-acquisition advisory services,
underwriting (raising funds for companies by issuing stocks or bonds), and trading of securities for institutional
clients. The ultimate purpose of research at an investment bank is to help generate business from trading securities
for institutional clients (Cowen et al., 2006). Security analysts write in-depth reports on the companies they cover and
issue recommendations as to whether investors should buy or sell the companies’ securities and bonds, or hold on to
stocks and bonds already in their portfolios. On average, an analyst writes 53.1 company-specific research reports
(two pages or longer) annually on 13.6 companies that they cover. It is not unusual for analysts to have more than
800 institutional clients who receive their reports and seek their advice.
An analyst’s compensation and visibility in the industry both depend on his or her ranking in an annual
survey conducted since 1972 by the trade journal Institutional Investor (II). Every year the magazine asks sell-side
analysts’ clients (portfolio managers and analysts at buy-side money-management firms, mutual funds, and pension
funds) to rate analysts on their effectiveness. Those ranked highest are celebrated in the magazine as members of
Institutional Investor’s All-America Research Team.1 The II survey reaches a large proportion of the investment
community. In October 1996, for example, II ranked analysts in each of 80 industry sectors and investment
specialties, based on ratings from roughly 1,300 individual respondents whose firms represented approximately 68
percent of the 300 largest institutional investors in the United States. These institutions include state pension funds,
which invest enormous pools of money, along with other investment-management institutions like Fidelity
Investments, Putnam Investments, and Wellington Management Company.
In each industry sector, the four analysts with the highest aggregate ratings are ranked first, second, third,
and runner-up. (More than four analysts may be ranked if there is a tie.) In 1996, less than 3 percent of all U.S. 1 We use the terms ranked analysts and star analysts interchangeably to refer to sell-side analysts ranked by Institutional Investor.
13
analysts were ranked. The II survey constitutes a core component of the internal performance evaluation for security
analysts at every investment bank. The II survey enables securities firms to determine how their most important
clients rate the service of their analysts (Siconolfi, 1992). Prior research has provided direct empirical evidence on
the relationship between rankings and forecast accuracy (e.g., Brown and Chen, 1991). Within the firm, being ranked
by II wins an analyst enhanced credibility, greater power, and substantially higher compensation (Dorfman, 1991). At
the major investment banks, top analysts could easily earn from $2 million to $5 million per year during the period of
our study (Laderman, 1998). In the larger financial world, II ranking brings heightened visibility and prestige.
Newspaper and TV reporters frequently seek out star analysts’ opinions on companies and stocks in their sectors.
There are many advantages to testing our hypotheses in the security analysts’ market. The II rankings
provide clear, observable, industry-accepted performance measures that are comparable across firms on a yearly
basis. Because star analysts enjoy high visibility in the financial industry, it is possible to compile thorough data on
each analyst’s performance and career history. The skills of security analysts are perceived in the labor market as
highly portable: the star power of top-performing analysts is attributed to individual ability that transcends
organizational support (Howard, 1967; Lurie, 1967; Institutional Investor, 1991). And even after moving to a new firm,
analysts continue to run the same financial models, follow the same sectors and companies, and maintain the same
client lists. (Institutional investors do not have exclusive relationships with particular investment banks; they receive
research reports from more than a dozen banks at the same time). For all these reasons, this market represents a
near-ideal sample against which to test our hypothesis that star performance is based in part on non-transferable,
firm-specific human capital.
Data
From the annual All-America Team issues of Institutional Investor published between 1988 and 1996, we collected
the following information for equity analysts (ranked in October) and fixed-income analysts (ranked in August): name;
industry specialty/sector; type (equity or fixed income); rank; year of the ranking; and company affiliation. The nine-
year period of the study produced a total of 4,200 analyst-year combinations (3,514 in equity and 686 in fixed
income). If each analyst were counted only once, the list would include 799 equity analysts and 254 fixed-income
analysts. Ranked analysts were employed by 78 investment banks; the 24 firms employing the most number of
14
ranked analysts accounted for 4,036 ranked analyst-year combinations (96 percent). To collect information on
analysts’ tenure with their current employers and total industry experience, we searched databases maintained by
Lexis-Nexis, the National Association of Securities Dealers, and Dow Jones News. Data on analysts’ tenure at their
firms were available for 3,639 analyst-year combinations (87 percent), and information on analysts’ experience was
collected for 3,653 analyst-year combinations (87 percent).
We accounted for every ranked analyst who left or joined an investment bank within one year of being
ranked during the period 1988–1996. Each of these incidents is identified as an “analyst-year move” in this paper.
Analysts’ affiliations in the year subsequent to being ranked, and the specific dates of their moves, were identified
using the databases of Nelson’s Directory of Investment Research, Lexis-Nexis, and Dow Jones News Service. We
identified 546 analyst-year moves: 500 were from one firm to another, and 46 were promotions or transfers to non-
research positions within the same investment bank. Of the 500 analyst-year moves from one firm, 134 were exits
from research altogether.2 The remaining 366 moves (made by 316 individual analysts) were switches to
competitors’ research departments. The average annual turnover of analysts in this sample was 11.9 percent.
News announcements on the hiring of ranked analysts indicated that ranked analysts occasionally moved in
teams, a phenomenon referred to by investment bankers as “block trading in people” or lift outs. Of the 366 analyst-
moves, 100 involved such colleagues as other ranked analysts, junior analysts, institutional salespeople, and traders.
Variables
Dependent Variable
The dependent variable in this study is the analyst’s performance, operationalized as rank in the Institutional Investor
All-America Research Team poll, Rankt+1. Each year the magazine’s editor sends a letter asking institutional
investors to rank the analysts who "have been most helpful to you and your institution in researching U.S. equities
over the past twelve months." Voters are asked to evaluate analysts using six criteria: earnings estimates, servicing
initiatives, accessibility and responsiveness, stock selection, industry knowledge, and written reports. The
respondents award a single overall numerical score to each analyst in each industry sector. Votes are cumulated 2 One hundred thirty-four analysts left sell-side research: 69 joined buy-side firms; 30 founded new companies; 20 retired; 8 took non-research positions in the securities industry; 5 joined a company that they had covered as analysts; one died in a car accident; and one died of a heart attack.
15
using weights based on the size of the voting institution. The identities of the respondents and their institutions are
kept confidential. A very small percentage of analysts achieve rankings in multiple sectors. Some, but not all, stars in
a given year continue to be ranked in subsequent years. In each sector, there are five levels of the dependent
variable (categorical and ordinal): the first, second, third, and runner-up ranks and unranked.
Independent Variables
Switching firms. We test whether the analyst’s movement across firms has an effect on his or her
Institutional Investor ranking. The independent variable of interest is the analyst’s mobility. The Analyst move variable
is 1 if a ranked analyst switched to another sell-side research department and 0 if a ranked analyst did not move
during the year.
Firm capability. For each of the 366 job changes, we determine whether the destination firm had lesser,
equivalent, or better capabilities relative to the originating firm by using the bulge-bracket distinction. Bulge-bracket
investment banks are those responsible for the bulk of securities underwritten in the United States; historically, the
six bulge firms are CS First Boston, Goldman Sachs, Lehman Brothers, Merrill Lynch, Morgan Stanley, and Salomon
Brothers. These banks and their employees enjoy a competitive edge due to the firms’ exceptional capabilities:
economies of scale in marketing, sales, and technology; a broad product base; wide distribution network for its
services, including analysts’ research products; and specialized units (investment banking, sales, trading, and
research) capable of solving complicated customer problems (Eccles and Crane, 1988).
We assign the job changes of ranked analysts to three groups: better firm capability, equal firm capability,
and lesser firm capability. The Firm capability direction categorical variable takes the value “no move” if a ranked
analyst does not move during the year, “moving to a weaker firm” if the move is from a bulge to a non-bulge firm,
“moving to a better firm” if the move is from a non-bulge to a bulge firm, and “moving to a comparable firm” if the
move is from bulge to bulge or non-bulge to non-bulge.
Team movement. We also test the effects of moving with a team of colleagues. Such a team can consist of
colleagues of several types. One is other security analysts who cover complementary sectors (such as the food-and-
beverage sector and the gaming-and-lodging sector), and who can benefit mutually from information sharing and
collaboration. Jacob, Lys, and Neale (1999) find that as the percentage of analysts at a firm who follow similar
16
industries increases, any given analyst’s forecast accuracy improves.
Analysts may also develop team rapport with colleagues in other departments, such as institutional
salespeople and traders who cover the same sectors. The institutional sales force is a particularly significant
contributor to analysts’ successes, as already discussed. Traders, too, affect analysts’ performance by keeping them
informed about developments on the trading floor. Analysts and traders also discuss clients’ plans to buy, sell, or
hold, information that can help analysts in their short-term action research. Traders also make calls to clients, and
can help disseminate analysts’ ideas. Over time, ranked analysts are apt to develop relationships with institutional
salespeople and traders that benefit their performance. If the performance of a ranked analyst is to some extent
reliant on relationships with in-house colleagues, switching firms is likely to be less damaging to performance if some
of these colleagues make the same move.
The Coworker move categorical variable takes the value of “no move” if a ranked analyst does not move in
a given year, “moving solo” if the analyst switches to another sell-side research department solo, and “moving in
teams” if he or she makes such a move with other professionals (junior and senior research analysts, institutional
salespeople, or traders who specialize in the same sector).
Control Variables
The variables included in the model are operationalized into four categories: individual, firm, sector, and macro-
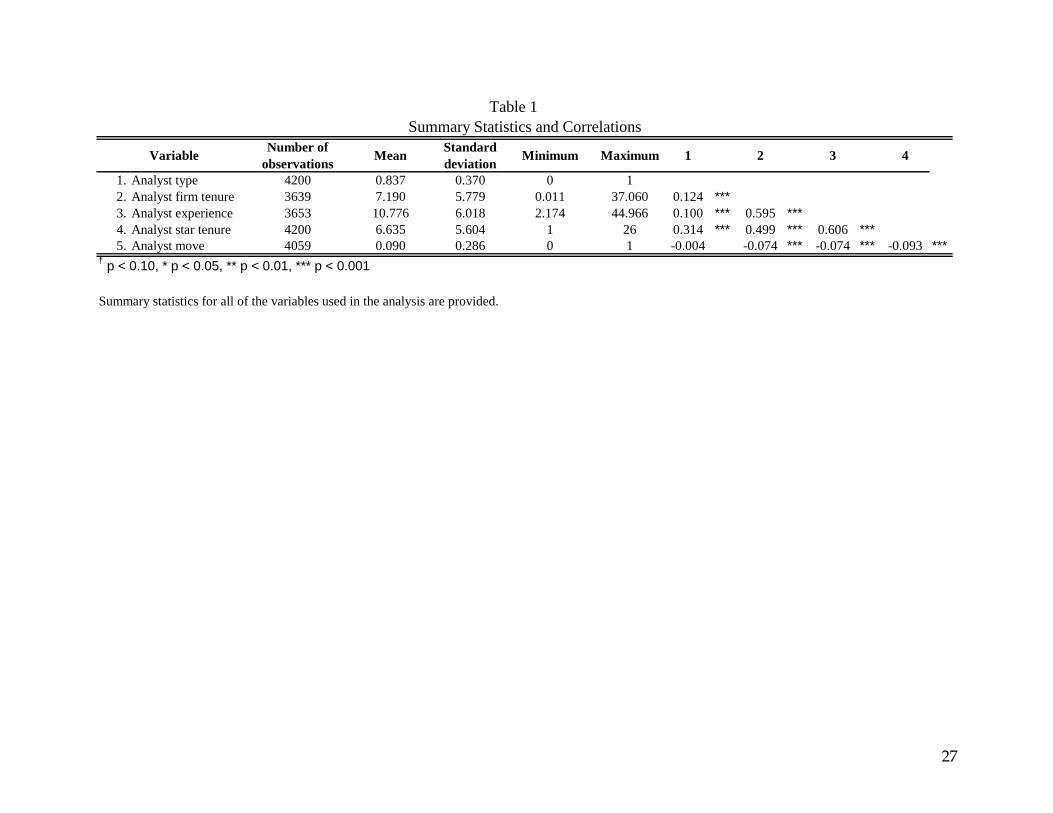
economic. Table 1 lists the specific individual-level variables, their univariate statistics, and their correlations.
Individual analyst variables. Firm tenure and overall experience are important variables to control for
when analyzing performance (Becker, 1962; Topel, 1991). Analyst firm tenure is the number of years an analyst has
worked at the firm at the end of each year. Analyst experience is the number of years an analyst has worked as an
analyst at the end of each year. We also control for Analyst type, because equity and fixed-income analysts pursue
different activities and have different customer bases.
Analysts’ prior performance has an effect on their future performance (Sinha et al., 1997). Some analysts
are able to repeat their outstanding performance and rank again in subsequent years. Others are not. To control for
prior performance, we collected information on the number of years a ranked analyst had been ranked as of the end
of the year and created the Analyst star tenure variable. Finally, the Analyst rank dummy t = 0, which represents an
17
analyst’s rank in the year t = 0, controls for rank-specific effects on analysts’ rankings.
Firm variables. We use Firm dummy to control for effects specific to firms, since research points to
differences in forecasting performance across banks (Jacob, Lys and Neale, 1999; Sinha, Brown and Das, 1997).
Sector variables. The Sector dummy variable controls for effects specific to the sectors that analysts cover.
Sector membership is considered an important variable in evaluation of an analyst’s performance (Jacob, Lys and
Neale, 1999; Sinha, Brown and Das, 1997). We identified sectors using the Nelson’s Investment Research Database.
Macroeconomic variables. To control for intertemporal changes, we use the Year dummy variable.
Model Specifications
The Ordered Probit Model
We used an ordered probit model because the dependent variable, analysts’ Institutional Investor rankings, is
categorical and ordinal in nature (Greene, 2000). The model is estimated using panel data on ranked analysts for the
nine-year period 1988–1996. Heterogeneity across individual analysts is modeled using the robust clustered
estimators of variance -- Huber/White or sandwich estimator (Huber, 1967; White, 1982; Greene, 2000) -- because it
produces “correct” standard errors (in the measurement sense). In comparison to the conventional estimator of
variance, which requires independence not only across individual analysts but also across observations for a given
analyst, the robust clustered estimate of variance requires only that the observations be independent across the
individual-ranked analysts (clusters). We utilize the Firm capability direction and Coworker move variables when we
examine whether ranked analysts’ performance is affected by (1) whether they move to a firm with better, equal, or
lesser capabilities, and (2) whether they move in teams or solo.
Event Study Data Set and Methodology
We use the event study methodology to determine whether and how the stock market reacts to the unexpected news
of the departure or hiring of a star analyst. The dates on which analyst departures or hirings are first announced were
chosen as the event dates. We conduct a short window study of daily excess returns over the event period of -1 to +1
days (the actual announcement date plus the days prior to and after the announcement date). The data set consists
of 269 observations for ranked analysts leaving publicly quoted firms and 228 observations of analysts joining such
firms. Subsidiaries of larger diversified firms that generated less than 50 percent of those companies’ revenues were
18
then excluded. The reduced data set consists of 188 observations for analysts leaving and 156 observations for
analysts joining investment banks. The data set was then checked for confounding announcements in the event
period. Following Brown and Warner (1980), the event window was examined for the following confounding effects:
restructuring/divestiture, dividend/earnings announcements, buy/hold/sell recommendations by investment banks,
joint venture, acquisitions, new products, litigation/labor unrest, major executive changes, forecasted changes in
earnings or sales, layoffs, debt or equity related events, and contract awards. Sixty-four observations for analysts
leaving and 47 data points for analysts joining firms were deleted for confounded effects. Furthermore, 13
observations on the leaving side and 8 observations on the joining side were excluded because they overlapped in
time and involved identical companies. The final data set consists of 111 exit announcements and 101 hiring
announcements. Stock-returns data were provided by the Center for Research in Security Prices (CRSP) at the
University of Chicago.
Empirical Tests and Results
In this section we first determine whether, controlling for individual, firm, sector, and intertemporal variables, ranked
analysts’ movement across firms affects their performance (Rankt+1, Rankt+2, Rankt+3, Rankt+4, and Rankt+5). Next we
examine whether ranked analysts’ performance is affected by whether they (1) move to a firm with better, equal, or
lesser capabilities, and (2) move solo or in teams. This section concludes with our findings on stock-market reactions
to announcements of movements into and out of firms by ranked analysts.
Switching Firms and Ranked Analysts’ Performance
The portability of ranked analysts’ performance is examined by focusing on the sign and the significance level of the
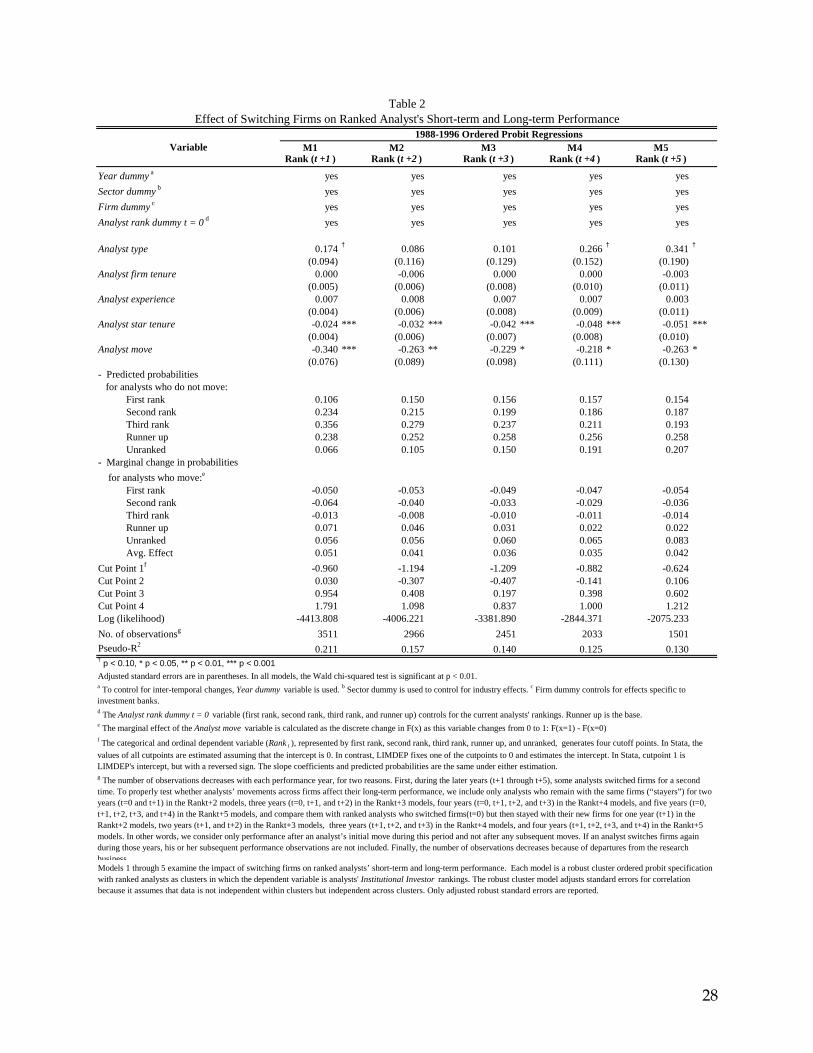
Analyst move variable. In models M1 through M5 (see Table 2) we examine the effects of switching firms on analysts’
performance, controlling for analyst-specific (Analyst type, Analyst firm tenure, Analyst experience, Analyst star
tenure, Analyst rank dummy t = 0), firm-specific (Firm dummy), sector-specific (Sector dummy), and intertemporal
(Year dummy) characteristics. Coefficients in these models are similar. Consequently, unless otherwise noted, the
following comments apply to all models.
In model M1, the Analyst move coefficient is negative and significant (p < 0.01), suggesting that ranked
analysts’ short-term performance declines after switching jobs. (See Appendix A and online supplement, for analysis
19
relating to endogeneity.) The findings from models M2 through M5 suggest that movement across firms has a
significant negative effect on ranked analysts’ long-term performance. The Analyst move coefficient is negative and
significant (p < 0.01) in model M2 (Rankt+2), (p < 0.05) in model M3 (Rankt+3), (p < 0.05) in model M4 (Rankt+4), and (p
< 0.05) in model M5 (Rankt+5). Even after five years at a new firm, ranked analysts who switched employers
underperform ranked analysts who stayed put. Thus, Hypothesis 1 is supported.
As previously noted, a coefficient in the ordered probit model provides cannot be easily interpreted. Not only
is the effect of a given regressor nonlinear in the ordered probit model, but its influence also varies on each rank
probability. Examining change in the outcome probabilities is a useful way to summarize the effects of the
independent variable. Table 2 reports measures of discrete change for the Analyst move variable. For example, for a
ranked analyst who does not move, the probability of being ranked first in year t+1 is 0.106. If a ranked analyst
changes employers, the predicted probability of being ranked first in year t+1 declines to 0.056 (= 0.106-0.050).
The findings from models M1, M4, and M5 also suggest that being an equity analyst, relative to a fixed
income analyst, has a weakly positive impact on performance (p < 0.10). Interestingly, in all five models, the effect of
Analyst star tenure is significant and negative (p < 0.01), suggesting that the longer analyst has remained ranked, the
prospects of higher rankings are diminished.3
Firm Capabilities and Ranked Analysts’ Short-Term and Long-Term Performance
This section examines whether the capabilities of firms to which analysts move (better, comparable, or weaker) have
an effect on their performance (Rankt+1, Rankt+2, Rankt+3, Rankt+4, and Rankt+5). Coefficients for the control variables
(Analyst type, Analyst firm tenure, Analyst experience, Analyst star tenure, Analyst performance, Firm dummy, Sector
dummy, Year dummy) are similar to coefficients in models M1 through M5. Therefore Table 3 only reports the
coefficients for the different categories of firm capabilities.
The portability of ranked analysts’ performance is examined by focusing on the sign and the significance
3 The Analyst star tenure coefficient is also affected by top-rated analysts’ inability to move up in rankings. Furthermore, using the Analyst new star variable, we examine whether being ranked for the first time affects performance. Analyst new star takes the value of 1 if an analyst has been ranked for the first time in a given year, and 0 otherwise. Newly ranked analysts might be on their way up or might merely have gotten lucky and are thus expected to lose ranking the next year. The Analyst new star coefficient is positive and insignificant. Finally, in order to reject alternative explanations for our results, we test whether there are significant interactions between Analyst move and Analyst firm tenure, Analyst experience, Analyst star tenure, Analyst performance and Analyst new star. None of the interactions are found to be significant.
20
level of the Firm capability direction variable. The findings suggest that star analysts who move between two
comparable firms (firms of equivalent capabilities) also exhibit a drop in performance but only for two years. Since the
origin and destination firms have similar capabilities, differences in firm capability cannot account for this drop in
performance. This finding provides evidence that the loss of firm-specific skills accounts for the diminished
performance of analysts who move between firms of comparable capabilities. During the first two years after
switching firms those analysts are able to acquire new firm-specific skills, and their performance in the third, fourth,
and fifth years is not statistically different from the performance of ranked analysts who stay put. Thus, Hypothesis 2
is supported for short-term performance.
Our findings suggest that performance decline is most pronounced among star analysts who move to firms
with weaker capabilities. Relative to comparable analysts who stay put, these analysts underperform for five years.
Stars who switch to firms with better capabilities exhibit no significant decline in short- or long-term performance. For
this category of analysts, the loss of firm-specific skills associated with decline in performance might have been
mitigated by their new employers’ valuable capabilities. Even after five years at a new firm, however, analysts who
switched to better firms are unable to outperform analysts who did not move. Star analysts who moved to firms with
worse capabilities appeared to experience the worst outcome among analysts who moved. If an analyst switches to a
firm with better capabilities, for instance, the probability of achieving the first rank in year t+1 is 0.083 (=0.106-0.023),
compared with a probability of 0.058 (=0.106-0.048) for an analyst who moves to a firm with worse capabilities.4
Team Movement and Ranked Analysts’ Short-Term and Long-Term Performance
Next we examine whether moving to a new firm solo or with a team has an effect on analyst performance (Rankt+1,
Rankt+2, Rankt+3, Rankt+4, and Rankt+5). Ranked analysts who move solo show an immediate decline in performance
that persists for at least five years (see Table 3). Switching firms has no significant effect, by contrast, on the
performance of ranked analysts who move with teammates. This finding suggests the value of skills embedded in
4 We also examined whether the effect of comparable moves differ between moves between bulge firms and moves between non-bulge firms, i.e. how better, comparable bulge, comparable non-bulge, or weaker affect performance (Rankt+1, Rankt+2, Rankt+3, Rankt+4, and Rankt+5). We find that star analysts who move between two comparable non-bulge firms exhibit a drop in performance for three years. Stars who switched between comparable bulge firms also exhibit a drop in performance but only for one year. Within the moving to comparable category (both bulge and non-bulge), most of the moves are between non-bulge bracket firms (78%). 22% of moves between comparable firms are moves between bulge firms.

21
colleague or team relationships. For instance, the probability of achieving the first rank in year t+1 is only 0.053 (=
0.106-0.061) for analysts who changed firms solo, but 0.100 (= 0.106-0.006) for those who switched employers with
teammates, suggesting the contribution of team-specific skills to an analyst’s performance. Thus, H3 is supported.5
Figure 1 provides graphical interpretation of these results for all independent variables (Analyst move, Firm
capability direction, Coworker move) for two individual years (t+1 and t+5).
Stock-Market Reaction to Announcements of Movement by Ranked Analysts
Table 4 presents stock-market reactions to announcements of moves by ranked analysts. The direction of cumulative
stock-market reactions is intriguing. The event itself evokes a significant negative stock-market reaction for the hiring
firm, suggesting that, in aggregate, the stock market views such a hire as value-reducing. Hiring firms experience
significant negative abnormal return (-0.74 percent) during the event period. The negative stock-market reaction for
the hiring firm is consistent with corporate-takeover studies suggesting that acquirers tend to suffer negative stock-
market reactions during the announcement period (Haspeslagh and Jemison, 1991).
On average, the size of the stock-market reaction to such a hiring announcement is a loss of about $24
million for the acquiring firm. Thus the negative stock-market reaction far exceeds the analyst’s entire compensation.
During the period of this study, even the highest reported salaries received by ranked analysts did not exceed $3
million per year for more than six years. If discounted, this amounts to just half of the stock-market reaction.
The magnitude of the abnormal returns depends on the type of move. Announcements of a ranked analyst’s
move to a firm with inferior capabilities evoke a strong and statistically significant negative stock-market reaction (-
1.67 percent). Announcements of moves between firms with equivalent capabilities are associated with a -0.63
percent return. Announcements of moves to firms with better capabilities elicit a smaller negative return (-0.26
percent). Clearly, the stock-price impact of hiring announcements by lesser firms is more severe than that of
comparable announcements by firms with equivalent or better capabilities (p < 0.05). Investors may believe that
inferior firms have to pay a high premium to entice a star analyst from a superior firm. Investors might also be
anticipating a drop in performance on the part of analysts who move to a firm with worse capabilities.
5 In our analysis, we are not measuring how many colleagues moved. We only measure whether any colleagues moved. We did use the linear data in our analysis, which did not meaningful affect the results.
22
Finally, abnormal returns are subdivided into two categories: (1) entries of individual analysts, or solo
entries, and (2) entries by analysts with other employees, or team entries. News of the hiring of an individual analyst
is greeted with significant negative abnormal returns (-0.62 percent), as is news of the hiring of an analyst with a
team (-0.99). Attracting a star along with his or her team appears to destroy more value, as measured by share price,
than hiring an individual star.
Discussion
Our results indicate that hiring stars is advantageous neither to stars themselves, in terms of their performance, nor
to hiring companies in terms of their market value. The performance of an outstanding worker is not owned by the
worker alone; it is a property of the worker/firm combination, and encompasses firm-specific human capital
embedded in colleague relationships and firm capabilities.
Star analysts who change employers suffer a decline in performance compared to that of analysts who stay
put, thus providing evidence of the importance of firm-specific human capital. Our findings support research on the
socialization of newcomers into organizations showing that such transitions are more disruptive and challenging than
anticipated. Newcomers often find that their expectations don't fit their actual experiences (Hill, 1992) and that their
status shifts from insider to outsider. Organizational socialization, or "learning the ropes," is an integral part of the
joining-up process (Van Maanen and Schein, 1979). Veteran employees, resentful of a newly hired star’s high
compensation and favored status, may withhold crucial information that is needed to succeed (Harding, 1998). A
star's performance would decline if long-tenured employees withheld cooperation in this way. Previous research has
shown that newcomers suffer a drastic decline in performance, especially if their success depends on the
contributions of others, as they cope with adjusting to an unfamiliar organizational setting (Louis, 1980).
Mobile analysts can preserve their performance to some extent under two conditions: when they move to a
firm with better capabilities and when they take firm-specific human capital with them in the form of existing colleague
relationships. The relative quality of the two firms affects a star’s post-move performance. This result supports
research that emphasizes the contribution of organizational context to individual performance (e.g., Allison and Long,
1990). Though our data do not pinpoint the specific components of firm capability that help mitigate performance
decline, research in various domains suggests that factors like a superior human-resource system (e.g., Huselid,

23
1995), superior intellectual capital embedded in existing social systems (e.g., Nahapiet and Ghoshal, 1998), and
high-quality colleagues (e.g., Groysberg and Lee, forthcoming) all play a role in supporting individual performance.
Our study provides strong evidence that colleague relationships constitute an important component of firm-
specific human capital. Previous research has pointed out that social relationships at work are important for
mentorship, advice, advancement, friendship, and satisfaction. Our study suggests, further, that these relationships
contribute directly to outstanding performance and are not readily replicated in a new organizational setting. The tacit
knowledge embedded in these relationships constitutes a valuable resource both for firms and for the stars whose
performance depends on it. This finding supports the resource-based view of the firm that tacit knowledge embedded
in relationships can constitute a competitive advantage, but it also points out that competitors can access some of
that knowledge by luring away an entire team of valuable workers. Research on knowledge and learning has shown
that the mobility of workers is one means whereby knowledge is disseminated or transferred. Our study highlights the
flip side of that process: mobility, especially on the part of teams of knowledge workers, is also a means to lose
strategic knowledge assets.
Our findings indicate that equity research is highly interdependent work, reliant on collaboration among
teams of co-workers. Researchers have long emphasized the importance of teamwork (e.g., Hackman, 1990) and of
the knowledge embedded in social ties (e.g., Burt, 1987), but our study suggests further that some workers
themselves might be aware of the importance of specific colleagues. The increasing prevalence of team moves may
thus have important implications not only for firms but also for researchers on turnover and mobility (Groysberg and
Abrahams, 2006). If both the nature of work and patterns of mobility are increasingly team-based, teams might
become increasingly relevant as a unit of analysis in research. To our knowledge, no previous research has
investigated the consequences of moving in teams. Our study provides evidence that movement in teams may
exhibit very different dynamics than the solo mobility that researchers are accustomed to studying.
We encountered significant evidence that hiring stars is, from a stock-market perspective, a value-
destroying move. Three factors might account for the size of the stock-market reaction. First, investors might believe
that hiring firms suffer a winner’s curse and overpay stars relative to their future performance. Second, hiring a star
analyst might alert investors that a firm is unable to develop its own analysts and may even be planning an expensive
24
hiring spree. Finally, investors might anticipate the cost to the firm of integrating a newly hired star, including conflicts
and other negative effects on existing analysts leading to decline in their performance.
The literature on corporate acquisitions can shed light on the problems of bringing in stars. In both cases,
organizations are looking to acquire strategic, knowledge-based resources. Acquiring a new company can prove
problematic because of internal boundaries and defenses against accepting new capabilities (Song, Almeida & Wu,
2003). Puranam, Singh, and Zollo (2003), examining the integration of acquired companies in the technology sector,
point out that a goal and strategy of acquisitions are often at odds: the pursuit of short-term wins calls for giving the
newly acquired company maximum independence, while long-term productivity requires building the kind of
organizational linkages that take time and may be disruptive in the short term. Building on their earlier work,
Puranam, Singh, and Zollo (2006) suggest that loss of autonomy during exploitation stage of innovation process is
better than during exploration phase. Other literature suggests that acquisitions often have a depressing effect on
productivity (Ernst and Vitt, 2000), and nearly all the research on the subject suggests that integration is a slow
process best accomplished in phases (Chaudhuri and Tabrizi, 1999), implying high cost in both time and effort.
Limitations and Future Research
Our results are based on a sample of star analysts and may not be generalizable to other knowledge workers or to
star employees in other professions. Much of the prior work on tacit knowledge and firm- or team-specific human
capital has been performed in settings in which work is primarily or partially physical in nature, such as sports (e.g.,
Berman, Down and Hill, 2002; Glenn, McGarrity and Weller, 2001) and surgery (Huckman and Pisano, 2006). The
operation of tacit knowledge in groups may differ in purely intellectual work, such as that performed by security
analysts: it may not be as “tacit” as work that is partly physical. Our findings need to be replicated in other settings to
determine their generalizability.
Disentangling the effects of firm status and firm capability on performance would also be a valuable addition
to the literature. As noted by Zuckerman and Merton (1971), reputation and performance are different phenomena,
though closely correlated. It would also be helpful for future work to determine the specific components of firm
capabilities that affect individual performance. This study has determined that colleague relationships constitute an
important firm-specific resource, but it does not delve into the structure or the content of such ties, which no doubt
25
determines their contribution to the performance of a focal individual. Which types of relationship are crucial to
maintain, and to take to a new organizational setting, are important questions to pursue. Both for individuals
contemplating a move and for firms intent on preserving firm-specific knowledge capabilities, the ability to distinguish
and prioritize colleague ties has important performance and strategic consequences.
Implications
This paper has normative implications for managers of firms looking to acquire stars. The “outside brain-collecting”
strategies practiced by some firms might create less value than they anticipate because some newly hired stars will
be less productive in their new environments. Few hiring firms’ managers recognize that analysts’ performance is not
portable. Firms seeking to hire a top performer cannot accurately value the likely return on their investment on the
strength of that individual’s record elsewhere. Yet many firms in professional business services continue to bid away
top talent from rival firms on the assumption that the new hire can and will easily replicate his or her top performance
in a new organizational context.
This paper’s findings should also matter to star analysts and other high-performing employees, who may
discount the firm-specificity of their skills and the likely impact on their performance of switching firms. A short-term
increase in compensation should be weighed against expected future performance losses. Our interviews revealed,
however, that star analysts systematically undervalue the role of their firm-specific skills and their firms’ capabilities.
Meanwhile, firms eager to retain their stars would do well to promote awareness of the firm’s contribution to
its stars’ success. In support of Peteraf’s (1993) observation, such firms might also want to promote talented workers’
dependence on the organization by offering opportunities to develop firm-specific skills and by making strategic
investments in firm capabilities. Even if a star eventually leaves, the rival organization that hired him or her away
might not recoup its investment and might even suffer a winner’s curse.
Finally, our study contributes to an important debate in the regulatory arena. In the money-management
industry, the question of who “owns” fund performance has become a contentious issue. The U.S. Securities and
Exchange Commission generally supports the idea that star fund managers have the right to tout their fund-
management performance at a different firm when raising new funds for their own firms. By contrast, neither the
National Association of Security Dealers nor the Association for Investment Management and Research recognizes

26
performance portability. These associations argue that even a portfolio manager who operated as the sole manager
of a given fund benefited from exchanging investment-strategy ideas with other members of the firm. These
organizations do not allow portfolio managers to include their prior records accrued at other firms when advertising
their “past returns” at their new firms. Though our study shows that a star’s past performance is a good indicator of
future performance, it suggests support for the latter view that stars do not entirely own their past performance.
27
1. Analyst type 4200 0.837 0.370 0 12. Analyst firm tenure 3639 7.190 5.779 0.011 37.060 0.124 ***3. Analyst experience 3653 10.776 6.018 2.174 44.966 0.100 *** 0.595 ***4. Analyst star tenure 4200 6.635 5.604 1 26 0.314 *** 0.499 *** 0.606 ***5. Analyst move 4059 0.090 0.286 0 1 -0.004 -0.074 *** -0.074 *** -0.093 ***
† p < 0.10, * p < 0.05, ** p < 0.01, *** p < 0.001
Summary statistics for all of the variables used in the analysis are provided.
Table 1
1 2 3 4Number of observations Mean Standard
deviation Minimum
Summary Statistics and Correlations
MaximumVariable
28
M1 M2 M3 M4 M5Rank (t +1 ) Rank (t +2 ) Rank (t +3 ) Rank (t +4 ) Rank (t +5 )
Year dummy a yes yes yes yes yesSector dummy b yes yes yes yes yesFirm dummy c yes yes yes yes yesAnalyst rank dummy t = 0 d yes yes yes yes yes
Analyst type 0.174 † 0.086 0.101 0.266 † 0.341 †
(0.094) (0.116) (0.129) (0.152) (0.190)Analyst firm tenure 0.000 -0.006 0.000 0.000 -0.003
(0.005) (0.006) (0.008) (0.010) (0.011)Analyst experience 0.007 0.008 0.007 0.007 0.003
(0.004) (0.006) (0.008) (0.009) (0.011)Analyst star tenure -0.024 *** -0.032 *** -0.042 *** -0.048 *** -0.051 ***
(0.004) (0.006) (0.007) (0.008) (0.010)Analyst move -0.340 *** -0.263 ** -0.229 * -0.218 * -0.263 *
(0.076) (0.089) (0.098) (0.111) (0.130)- Predicted probabilities for analysts who do not move: First rank 0.106 0.150 0.156 0.157 0.154 Second rank 0.234 0.215 0.199 0.186 0.187 Third rank 0.356 0.279 0.237 0.211 0.193 Runner up 0.238 0.252 0.258 0.256 0.258 Unranked 0.066 0.105 0.150 0.191 0.207- Marginal change in probabilities for analysts who move:e
First rank -0.050 -0.053 -0.049 -0.047 -0.054 Second rank -0.064 -0.040 -0.033 -0.029 -0.036 Third rank -0.013 -0.008 -0.010 -0.011 -0.014 Runner up 0.071 0.046 0.031 0.022 0.022 Unranked 0.056 0.056 0.060 0.065 0.083 Avg. Effect 0.051 0.041 0.036 0.035 0.042Cut Point 1f -0.960 -1.194 -1.209 -0.882 -0.624Cut Point 2 0.030 -0.307 -0.407 -0.141 0.106Cut Point 3 0.954 0.408 0.197 0.398 0.602Cut Point 4 1.791 1.098 0.837 1.000 1.212Log (likelihood) -4413.808 -4006.221 -3381.890 -2844.371 -2075.233No. of observationsg 3511 2966 2451 2033 1501Pseudo-R2 0.211 0.157 0.140 0.125 0.130† p < 0.10, * p < 0.05, ** p < 0.01, *** p < 0.001Adjusted standard errors are in parentheses. In all models, the Wald chi-squared test is significant at p < 0.01.
e The marginal effect of the Analyst move variable is calculated as the discrete change in F(x) as this variable changes from 0 to 1: F(x=1) - F(x=0) f The categorical and ordinal dependent variable (Rank t ), represented by first rank, second rank, third rank, runner up, and unranked, generates four cutoff points. In Stata, the values of all cutpoints are estimated assuming that the intercept is 0. In contrast, LIMDEP fixes one of the cutpoints to 0 and estimates the intercept. In Stata, cutpoint 1 is LIMDEP's intercept, but with a reversed sign. The slope coefficients and predicted probabilities are the same under either estimation.
Models 1 through 5 examine the impact of switching firms on ranked analysts’ short-term and long-term performance. Each model is a robust cluster ordered probit specification with ranked analysts as clusters in which the dependent variable is analysts' Institutional Investor rankings. The robust cluster model adjusts standard errors for correlation because it assumes that data is not independent within clusters but independent across clusters. Only adjusted robust standard errors are reported.
g The number of observations decreases with each performance year, for two reasons. First, during the later years (t+1 through t+5), some analysts switched firms for a second time. To properly test whether analysts’ movements across firms affect their long-term performance, we include only analysts who remain with the same firms (“stayers”) for two years (t=0 and t+1) in the Rankt+2 models, three years (t=0, t+1, and t+2) in the Rankt+3 models, four years (t=0, t+1, t+2, and t+3) in the Rankt+4 models, and five years (t=0, t+1, t+2, t+3, and t+4) in the Rankt+5 models, and compare them with ranked analysts who switched firms(t=0) but then stayed with their new firms for one year (t+1) in the Rankt+2 models, two years (t+1, and t+2) in the Rankt+3 models, three years (t+1, t+2, and t+3) in the Rankt+4 models, and four years (t+1, t+2, t+3, and t+4) in the Rankt+5 models. In other words, we consider only performance after an analyst’s initial move during this period and not after any subsequent moves. If an analyst switches firms again during those years, his or her subsequent performance observations are not included. Finally, the number of observations decreases because of departures from the research business.
d The Analyst rank dummy t = 0 variable (first rank, second rank, third rank, and runner up) controls for the current analysts' rankings. Runner up is the base.
a To control for inter-temporal changes, Year dummy variable is used. b Sector dummy is used to control for industry effects. c Firm dummy controls for effects specific to investment banks.
Table 2Effect of Switching Firms on Ranked Analyst's Short-term and Long-term Performance
Variable1988-1996 Ordered Probit Regressions
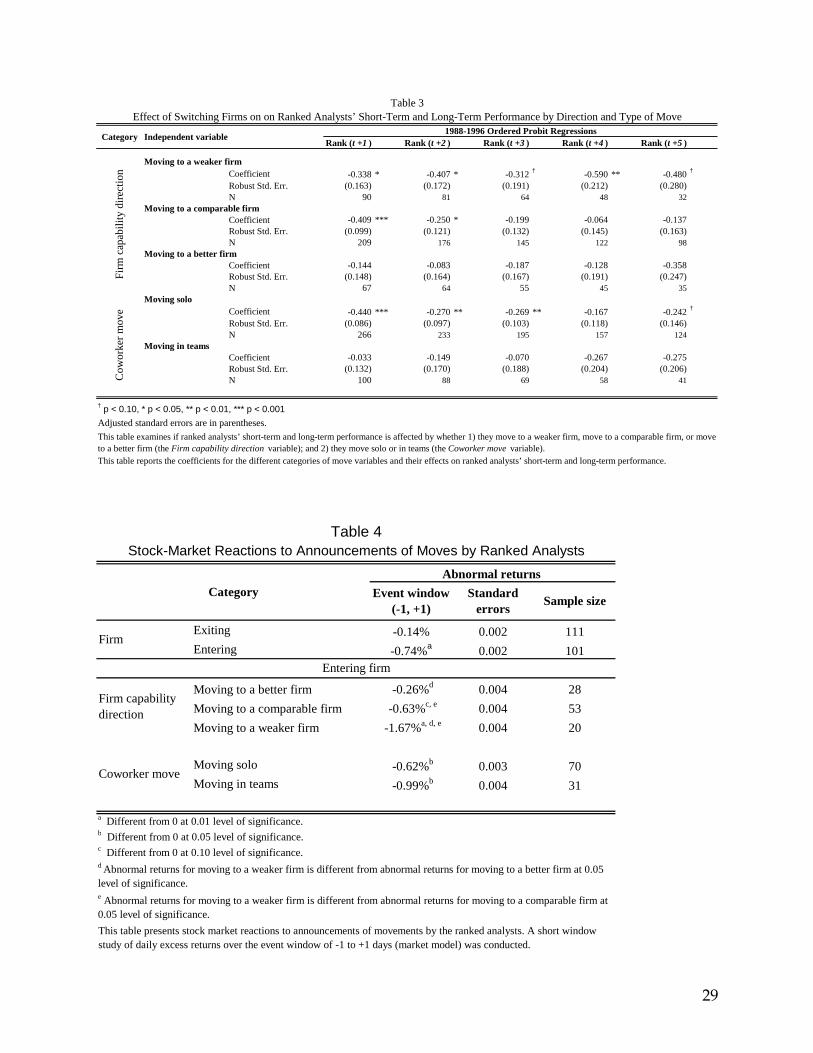
29
Rank (t +1 ) Rank (t +2 ) Rank (t +3 ) Rank (t +4 ) Rank (t +5 )
Moving to a weaker firmCoefficient -0.338 * -0.407 * -0.312 † -0.590 ** -0.480 †
Robust Std. Err. (0.163) (0.172) (0.191) (0.212) (0.280)N 90 81 64 48 32
Moving to a comparable firmCoefficient -0.409 *** -0.250 * -0.199 -0.064 -0.137Robust Std. Err. (0.099) (0.121) (0.132) (0.145) (0.163)N 209 176 145 122 98
Moving to a better firmCoefficient -0.144 -0.083 -0.187 -0.128 -0.358Robust Std. Err. (0.148) (0.164) (0.167) (0.191) (0.247)N 67 64 55 45 35
Moving soloCoefficient -0.440 *** -0.270 ** -0.269 ** -0.167 -0.242 †
Robust Std. Err. (0.086) (0.097) (0.103) (0.118) (0.146)N 266 233 195 157 124
Moving in teamsCoefficient -0.033 -0.149 -0.070 -0.267 -0.275Robust Std. Err. (0.132) (0.170) (0.188) (0.204) (0.206)N 100 88 69 58 41
† p < 0.10, * p < 0.05, ** p < 0.01, *** p < 0.001Adjusted standard errors are in parentheses.
This table reports the coefficients for the different categories of move variables and their effects on ranked analysts’ short-term and long-term performance.
Firm
cap
abili
ty d
irect
ion
Cow
orke
r mov
e
This table examines if ranked analysts’ short-term and long-term performance is affected by whether 1) they move to a weaker firm, move to a comparable firm, or move to a better firm (the Firm capability direction variable); and 2) they move solo or in teams (the Coworker move variable).
Table 3Effect of Switching Firms on on Ranked Analysts’ Short-Term and Long-Term Performance by Direction and Type of Move
Category Independent variable 1988-1996 Ordered Probit Regressions
Exiting -0.14% 0.002 111Entering -0.74%a 0.002 101
Moving to a better firm -0.26%d 0.004 28Moving to a comparable firm -0.63%c, e 0.004 53Moving to a weaker firm -1.67%a, d, e 0.004 20
Moving solo -0.62%b 0.003 70Moving in teams -0.99%b 0.004 31
a Different from 0 at 0.01 level of significance.b Different from 0 at 0.05 level of significance.c Different from 0 at 0.10 level of significance.
e Abnormal returns for moving to a weaker firm is different from abnormal returns for moving to a comparable firm at 0.05 level of significance.This table presents stock market reactions to announcements of movements by the ranked analysts. A short window study of daily excess returns over the event window of -1 to +1 days (market model) was conducted.
Stock-Market Reactions to Announcements of Moves by Ranked Analysts
CategoryAbnormal returns
Standard errors Sample size
Firm capability direction
Coworker move
d Abnormal returns for moving to a weaker firm is different from abnormal returns for moving to a better firm at 0.05 level of significance.
Table 4
Event window (-1, +1)
Firm
Entering firm
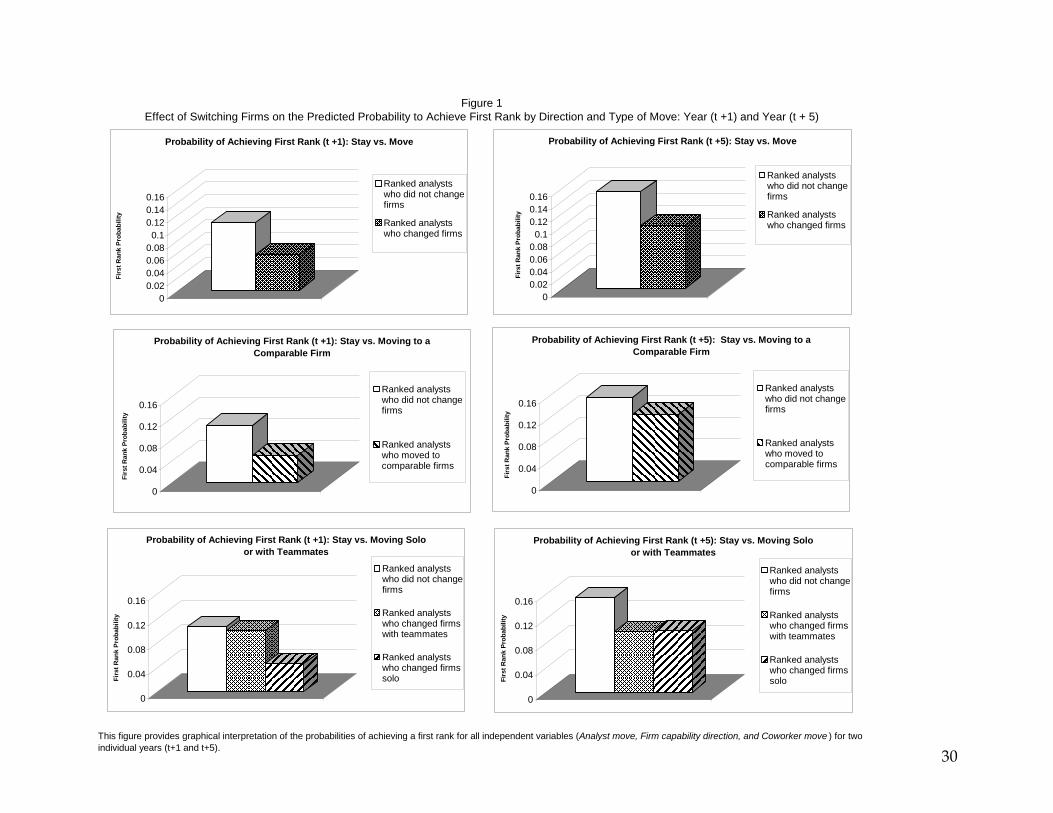
30
Figure 1Effect of Switching Firms on the Predicted Probability to Achieve First Rank by Direction and Type of Move: Year (t +1) and Year (t + 5)
This figure provides graphical interpretation of the probabilities of achieving a first rank for all independent variables (Analyst move, Firm capability direction, and Coworker move ) for two individual years (t+1 and t+5).
00.020.040.060.080.1
0.120.140.16
Firs
t Ran
k Pr
obab
ility
Probability of Achieving First Rank (t +1): Stay vs. Move
Ranked analystswho did not changefirms
Ranked analystswho changed firms
0
0.04
0.08
0.12
0.16
Firs
t Ran
k Pr
obab
ility
Probability of Achieving First Rank (t +1): Stay vs. Moving Solo or with Teammates
Ranked analystswho did not changefirms
Ranked analystswho changed firmswith teammates
Ranked analystswho changed firmssolo
00.020.040.060.080.1
0.120.140.16
Firs
t Ran
k Pr
obab
ility
Probability of Achieving First Rank (t +5): Stay vs. Move
Ranked analystswho did not changefirms
Ranked analystswho changed firms
0
0.04
0.08
0.12
0.16
Firs
t Ran
k Pr
obab
ility
Probability of Achieving First Rank (t +5): Stay vs. Moving to a Comparable Firm
Ranked analystswho did not changefirms
Ranked analystswho moved tocomparable firms
0
0.04
0.08
0.12
0.16
Firs
t Ran
k Pr
obab
ility
Probability of Achieving First Rank (t +5): Stay vs. Moving Solo or with Teammates
Ranked analystswho did not changefirms
Ranked analystswho changed firmswith teammates
Ranked analystswho changed firmssolo
0
0.04
0.08
0.12
0.16
Firs
t Ran
k Pr
obab
ility
Probability of Achieving First Rank (t +1): Stay vs. Moving to a Comparable Firm
Ranked analystswho did not changefirms
Ranked analystswho moved tocomparable firms
31
References Acemoglu D., Pischke J.-S. 1998. Why Do Firms Train? Theory and Evidence. The Quarterly Journal of Economics
113(1) 79-119. Allison P. D., Long J. S. 1990. Departmental Effects on Scientific Productivity. American Sociological Review 55(4)
469-478. Asquith P., Mullins D. 1986. Equity Issues and Offering Dilution. Journal of Financial Economics 15(1/2) 61-89. Baks K. P. 2003. On the performance of mutual fund managers. Emory University, Unpublished paper. Barney J. 1991. Firm Resources and Sustained Competitive Advantage. Journal of Management 17(1) 99-120. Barrett A., O'Connell P. J. 2001. Does training generally work? The returns to in-company training. Industrial and
Labor Relations Review 54(3) 647-662. Becker G. S. 1962. Investment in Human Capital: A Theoretical Analysis. The Journal of Political Economy 70(5) 9-
49. Becker G. S. 1976. The economic approach to human behavior. University of Chicago Press, Chicago. Berman S. L., Down J., Hill C. W. L. 2002. Tacit Knowledge as a Source of Competitive Advantage in the National
Basketball Association. Academy of Management Journal 45(1) 13-31. Bradley M., Desai A., Kim E. H. 1988. Synergistic gains from corporate acquisitions and their division between the
stockholders of target and acquiring firms. Journal of Financial Economics 21(1) 3-40. Brindisi L. J. 1985. Shareholder Value and Executive Compensation. Planning Review 13(5) 14-17. Brown L., Chen D. 1991. How good is the All-America Research Team in forecast earnings? Journal of Business
Forecasting 9 14-18. Brown S. J., Warner J. B. 1980. Measuring Security Price Performance. Journal of Financial Economics 8(3) 205-
258. Burt R. S. 1987. Social Contagion and Innovation: Cohesion Versus Structural Equivalence. The American Journal of
Sociology 92(6) 1287-1335. Cassing J., Douglas R. W. 1980. Implications of the Auction Mechanism in Baseball's Free Agent Draft. Southern
Economic Journal 47(1) 110-121. Castanias R., Helfat C. 1991. Managerial Resources and Rents Journal of Management 17(1) 155-171. Chapman K., Southwick L. 1991. Testing the Matching Hypothesis: The Case of Major League Baseball. American
Economic Review 89(5) 1352-1360. Chaudhuri S., Tabrizi B. 1999. Capturing the Real Value in High-Tech Acquisitions. Harvard Business Review 77(5)
123-130. Clark K. B., Fujimoto T. 1991. Product development performance: Strategy, organization, and management in the
world auto industry. Harvard Business School Press, Boston, MA. Cohen W. M., Levinthal D. A. 1990. Absorptive Capacity: A New Perspective on Learning and Innovation.
Administrative Science Quarterly 35(1) 128-152. Cole J. R., Cole S. 1973. Social stratification in science. University of Chicago Press, Chicago. Cowen A.P., Groysberg B., Healy P. 2006. Which Types of Analyst Firms Are More Optimistic? Journal of Accounting
and Economics 41(1-2) 119-146. Cymrot D. J., Dunlevy J. A. 1987. Are Free Agents Perspicacious Peregrinators? The Review of Economics and
Statistics 69(1) 50-58.
32
Dorfman J. 1991. Analysts devote more time to selling as firms keep scorecard on performance. Wall Street Journal October 29 1.
Drucker P. F. 1998. On the Profession of Management. Harvard Business School Press, Cambridge, Mass. Drucker P. F. 1999. Management Challenges for the 21st Century. Harper Business, New York. Dyckman T., Philbrick D., Stephan J. 1984. A Comparison of Event Study Methodologies Using Daily Stock Returns:
A Simulation Approach. Journal of Accounting Research 22(Supplement) 1-30. Eccles R. G., Crane D. B. 1988. Doing deals: Investment banks at work. Harvard Business School Press, Boston,
Mass. Ernst H., Leptien C., Vitt J. 2000. Inventors are not alike: The distribution of patenting output among industrial R & D
personnel. IEEE Transactions on Engineering Management 47(2) 184-199. Ernst H., Vitt J. 2000. The influence of corporate acquisitions on the behaviour of key inventors. R and D
Management 30(2) 105-120. Felin T., Hesterly W. S. forthcoming. The Knowledge-Based View, Heterogeneity, and New Value Creation:
Philosophical Considerations on the Locus of Knowledge. Academy of Management Review. Friedberg R. M. 2000. You Can´t Take It With You? Immigrant Assimilation and the Portability of Human Capital.
Journal of Labor Economics 18(2) 221-251. Galbraith J. R. 1977. Organization design. Addison-Wesley, Reading, Mass. Garen J. E. (Ed.). 1988. Empirical Studies of the Job Matching Hypothesis. JAI Press, Greenwich. Glenn A., McGarrity J. P., Weller J. 2001. Firm-specific human capital, job matching, and turnover: Evidence from
major league baseball, 1900-1992. Economic Inquiry 39(1) 86-93. Greene W. H. 2000. Econometric analysis (4th ed.). Prentice Hall, Upper Saddle River, N.J. Greenwood R., Hinings C. R., Brown J. 1990. "P2-Form" Strategic Management: Corporate Practices in Professional
Partnerships. The Academy of Management Journal 33(4) 725-755. Groysberg B., Abrahams, R. 2006. Lift Outs: How to Acquire a High-Functioning Team. Harvard Business Review 84
(12) 133-140. Groysberg B., Lee L.-E. forthcoming. The Effects of Colleague Quality on Top Performance: The Case of Security
Analysts. Journal of Organizational Behavior
Hackman J. R. 1990. Groups that work (and those that don't): Creating conditions for effective teamwork (1st ed.). Jossey-Bass, San Francisco.
Harding F. 1998. Creating rainmakers: The manager’s guide to training professionals to attract new clients. Adams Media Corporation, Holbrook, Mass.
Haspeslagh P., Jemison D. 1991. Managing Acquisitions. Free Press, New York. Heckman J. J. 1979. Sample Selection Bias as a Specification Error. Econometrica 47(1) 153-161. Henderson R., Cockburn I. 1994. Measuring Competence? Exploring Firm Effects in Pharmaceutical Research.
Strategic Management Journal 15(Special Issue: Competitive Organizational Behavior) 63-84. Henning J. F. 1993. Maximizing Law Firm Profitability: Hiring, Training and Developing Productive Lawyers. Law
Journal Seminars-Press, New York. Hill L. A. 1992. Becoming a Manager: Mastery of a New Identity. Harvard Business School Press, Cambridge, Mass. Howard G. G. 1967. What Makes a Good Analyst? Well... Institutional Investor May 10-15.
33
Huber P. J. 1967. The behavior of maximum likelihood estimates under non-standard conditions, Proceedings of the Fifth Berkeley Symposium on Mathematical Statistics and Probability, Vol. 1 221-233.
Huckman R. S., Pisano G. P. 2006. The Firm Specificity of Individual Performance: Evidence from Cardiac Surgery. Management Science 52(4) 473-488.
Hunter J. E., Schmidt F. L., Judiesch M. K. 1990. Individual differences in output variability as a function of job complexity. Journal of Applied Psychology 75(1) 28-42.
Huselid M. A. 1995. The impact of human resource management practices on turnover, productivity, and corporate financial performance. Academy of Management Journal 38(3) 635-672.
Ibarra H. 1995. Race, Opportunity, and Diversity of Social Circles in Managerial Networks. The Academy of Management Journal 38(3) 673-703.
Ichniowski C., Shaw K., Prennushi G. 1997. The Effects of Human Resource Management Practices on Productivity: A Study of Steel Finishing Lines. The American Economic Review 87(3) 291-313.
Institutional Investor. 1991. The 1991 All-America Fixed Income Research Team. Institutional Investor October 81-87.
Jacob J., Lys T. Z., Neale M. A. 1999. Expertise in forecasting performance of security analysts. Journal of Accounting and Economics 28(1) 51-82.
Kaplan S., Murray F., Henderson R. 2003. Discontinuities and senior management: assessing the role of recognition in pharmaceutical firm response to biotechnology. Industrial and Corporate Change 12(2) 203-233.
Kim L. S. 1997. The dynamics of Samsung's technological learning in semiconductors. California Management Review 39 86-100.
Kitayama S., Markus H. R., Matsumoto H., Norasakkunkit V. 1997. Individual and collective processes in the construction of the self: Self-enhancement in the United States and self-criticism in Japan. Journal of Personality and Social Psychology 72(6) 1245-1267.
Kogut B., Zander U. 1996. What firms do? Coordination, identity, and learning. Organization Science 7 502-518. Kordana K. A. 1995. Law Firms and Associate Careers: Tournament Theory Versus the Production-imperative
Model. The Yale Law Journal 104(7) 1907-1934. Krautmann A. C., Oppenheimer M. 1994. Free Agency and the Allocation of Labor in Major League Baseball.
Managerial & Decision Economics 15(5) 459-469. Laderman J. M. 1998. Who Can You Trust? Wall Street's Spin Game. Business Week October 5 148-156. Lazear E. P. 1986. Raids and offer matching. Research in Labor Economics 8(A) 141-165. Lippman S. A., Rumelt R. P. 1982. Uncertain Imitability: An Analysis of Interfirm Differences in Efficiency under
Competition. The Bell Journal of Economics 13(2) 418-438. Long J. S., McGinnis R. 1981. Organizational Context and Scientific Productivity. American Sociological Review
46(4) 422-442. Louis M. R. 1980. Surprise and Sense Making: What Newcomers Experience in Entering Unfamiliar Organizational
Settings. Administrative Science Quarterly 25(2) 226-251. Lurie S. B. 1967. What makes a good analyst? Institutional Investor July 33, 42, 44. MacDonald D. N., Reynolds M. O. 1994. Are Baseball Players Paid their Marginal Products? Managerial & Decision
Economics 15(5) 443-457. Maddala G. S. 1983. Limited-dependent and qualitative variables in econometrics. Cambridge University Press,
Cambridge.
34
Mailath G. J., Postlewaite A. 1990. Working Versus Firms: Bargaining Over a Firm's Value. Review of Economic Studies 57(191) 369-380.
Maister D. H. 1993. Managing the Professional Service Firm. The Free Press, New York. March J. G., Simon H. A. 1958. Organizations. Wiley, New York. McGregor J. 2006. I can’t believe they took the whole team. Business Week December 18. Mikhail M. B., Walther B. R., Willis R. H. 1997. Do Security Analysts Improve Their Performance with Experience?
Journal of Accounting Research 35(Supplement) 131-157. Mitchell M. L., Netter J. M. 1994. The role of financial economics in securities fraud cases: applications at the
Securities and Exchange Commission. 49(n2) 545-590. Nahapiet J., Ghoshal S. 1998. Social Capital, Intellectual Capital, and the Organizational Advantage. Academy of
Management Review 23(2) 242-266. Nakosteen R. A., Zimmer M. 1980. Migration and Income: The Question of Self-Selection. Southern Economic
Journal 46(3) 840-851. Narin F. 1993. Technology indicators and corporate strategy. Review of Business 14(3) 19-23. Narin F., Breitzman A. 1995. Inventive productivity. Research Policy 24(4) 507-519. Nelson R., Winter S. 1982. An Evolutional Theory of Economic Change Harvard University Press, Cambridge, MA. Nelson’s Directory of Investment Research. 1988-1998. Nelson Information, Port Chester, NY. Peteraf M. A. 1993. The Cornerstones of Competitive Advantage: A Resource-Based View. Strategic Management
Journal 14(3) 179-191. Pfeffer J. 1994. Competitive advantage through people: Unleashing the power of the work force. Harvard Business
School Press, Boston, Mass. Pfeffer J. 1998. The human equation: Building profits by putting people first. Harvard Business School Press, Boston,
Mass. Puranam P., Singh H., Zollo M. 2003. A Bird in the Hand or Two in the Bush?: Integration Trade-offs in Technology-
grafting Acquisitions. European Management Journal 21(2) 179-184. Puranam P., Singh H., Zollo M. 2006. Organizing for Innovation: Managing the Coordination-Autonomy Dilemma in
Technology Acquisitions. Academy of Management Journal 49(2) 263-280. Ravid S. A. 1999. Information, Blockbusters, and Stars: A Study of the Film Industry. The Journal of Business 72(4)
463-492. Rees A. 1973. The Economics of Work and Pay. Harper and Row, New York. Robinson C., Tomes N. 1982. Self-Selection and Interprovincial Migration in Canada. The Canadian Journal of
Economics 15(3) 474-502. Roll R. 1986. The Hubris Hypothesis of Corporate Takeovers. The Journal of Business 59(2) 197-216. Rosen S. 1981. The Economics of Superstars. The American Economic Review 71(5) 845-858. Sessa D. 1999. All-Star Analysts 1999 Survey: Early Mornings, Late Nights Mark an Analyst’s Days. The Wall Street
Journal June 29 R13. Siconolfi M. 1992. Shearson Research Analysts Finish First on 'All-America Team' for Third Year. Wall Street Journal
October 13 C18. Simonton D. K. 1999. Talent and Its Development: An Emergenic and Epigenetic Model. Psychological Review
35
106(3) 435-457. Sinha P., Brown L. D., Das S. 1997. A re-examination of financial analysts' differential earnings forecast accuracy.
Contemporary Accounting Research 14(1) 1-42. Sirower M. 1997. The Synergy Trap: How Companies lose the Acquisition Game. The Free Press, New York. Song J., Almeida P., Wu G. 2003. Learning-by-Hiring: When Is Mobility More Likely to Facilitate Interfirm Knowledge
Transfer? Management Science 49(4) 351-365. Spence M. A. 1974. Market signaling: Informational transfer in hiring and related screening processes. Harvard
University Press, Cambridge. Topel R. 1991. Specific Capital, Mobility, and Wages: Wages Rise with Job Seniority. The Journal of Political
Economy 99(1) 145-176. Van Maanen J., Schein E. H. 1979. Toward of Theory of Organizational Socialization. In BM Staw (Ed.), Research in
Organizational Behavior, Vol. 1: 209-264. Warner J. B., Watts R. L., Wruck K. H. 1988. Stock prices and top management changes. Journal of Financial
Economics 20(1) 461-492. Weick K. E., Roberts K. H. 1993. Collective Mind in Organizations: Heedful Interrelating on Flight Decks.
Administrative Science Quarterly 38(3) 357-381. Weisman R. 2006. The business of lift outs. The Boston Globe November 19 B1. Weisman R. 2006. Once taboo, hiring away teams is getting popular. The Boston Globe November 19 D1. White, H. 1982. Maximum likelihood estimation of misspecified models. Econometrica 50(1) 1-25. Williamson O. E. (Ed.). 1986. Transaction-Cost Economics: The Governance of Contractual Relations. Jossey-Bass
Publishers, California. Zander U., Kogut B. 1995. Knowledge and the speed of the transfer and imitation of organizational capabilities.
Organization Science 6 76-92. Zollo M., Singh H. 2004. Deliberate Learning in Corporate Acquisitions: Post-acquisition Strategies and Integration
Capability in U.S. Bank Mergers. Strategic Management Journal 25(13) 1233-1256. Zuckerman H., Merton R. K. 1971. Patterns of evaluation in science: Institutionalisation, structure and functions of the
referee system. Minerva 9(1) 66-100.
36
Appendix
We estimated several alternative econometric models to 1) assess robustness of our results and 2) control
for the endogeneity of the decision to change firms (Greene, 2000). All estimates show that the study’s
results are robust. Overall, we find that the significance levels of the coefficients and the relative
magnitude of the estimates from these models are similar to those from the ordered probit with robust
cluster estimation.
First, with William Greene’s help, the ordered probit fixed-effects model was estimated for this paper
At the time of this study, no released statistical program allowed this estimation. However, William
Greene recently completed implementing the ordered probit fixed-effects model (the new version of
LIMDEP has this estimation). We use the ordered probit fixed-effects model to control for all unobserved
analysts’ heterogeneity which might affect analysts’ decision to switch jobs. The significance levels of the
coefficients and the relative magnitude of the estimates from the ordered probit fixed-effects model are
similar to those from the ordered probit robust cluster estimations.
Next, we estimate models using linear regression techniques because there is no statistical program that
allows controlling for the endogeneity of the decision to change firms by estimating the treatment
effects/switching ordered probit model. In fact, in both Stata and LIMDEP, the second stage estimation
has to be an ordinary regression. In this particular case, however, the significance levels of the
coefficients of the independent variables are expected to be similar between the linear regression model
and the ordered probit model because the distances between the threshold of the ordered probit models are
nearly identical and almost equal to 1 (model M1 in Table 2), meaning the ordinal categories are equally
spaced. Thus, the implicit assumption of the linear regression is satisfied. Simultaneously, we model the
analyst’s decision to change firms as a function of the individual, firm, sector and macro-economic
variables that are found to affect turnover. When the model is estimated using linear random-effects
specification, the coefficient on the Analyst move variable is similar to the coefficient in the ordered
probit model. In addition, we examine whether it is necessary to use an instrumental variable in the
evaluation of performance differences between ranked analysts who change firms and ranked analysts
37
who do not switch employers by using the linear robust cluster model. To test the endogeneity of the
Analyst move variable, we utilize an augmented regression test (a Durbin-Wu-Hausman test). The
residuals of the Analyst move variable are included as a function of all exogenous variables, in the original
performance regression. We find that the coefficient on the Analyst move residual variable is not
significantly different from zero. Thus, the large p-value on the Durbin-Wu-Hausman endogeneity test
(0.129) indicates that a set of estimates obtained by least squares is consistent. The null hypothesis of no
endogeneity cannot be rejected. Furthermore, we control for the endogeneity of the self-selection of
analysts who move to competing firms using Heckman’s (1979) two-stage estimation technique. We find
that the coefficient on the Analyst move variable is similar to the coefficient from the ordered probit
robust cluster estimation.
Finally, to account for the possible endogeneity bias, we fit the treatment effects model with two-
equation maximum likelihood estimation (Maddala, 1983; p. 117-122). We find that the chi-square test of
independence of the two equations suggests that the null hypothesis that the two error terms are
uncorrelated cannot be rejected, meaning that the two equations can be run separately. Thus, in our
subsequent analysis we focus solely on the estimation of analysts’ performance using the one-stage
ordered probit model. Based on the above test, ordered probit regressions with robust cluster estimate of
variance are used throughout this paper.
Please see online supplement.
References
Greene W. H. 2000. Econometric analysis (4th ed.). Prentice Hall, Upper Saddle River, N.J.
Heckman J. J. 1979. Sample Selection Bias as a Specification Error. Econometrica 47(1) 153-161.
Maddala G. S. 1983. Limited-dependent and qualitative variables in econometrics. Cambridge University
Press, Cambridge.
Related Documents