nutrients Article Can Parenting Practices Explain the Differences in Beverage Intake According to Socio-Economic Status: The Toybox-Study An-Sofie Pinket 1, *, Marieke De Craemer 2 , Ilse De Bourdeaudhuij 2 , Benedicte Deforche 1,3 , Greet Cardon 2 , Odysseas Androutsos 4 , Berthold Koletzko 5 , Luis A. Moreno 6 , Piotr Socha 7 , Violeta Iotova 8 , Yannis Manios 4 and Wendy Van Lippevelde 1 1 Department of Public Health, Ghent University, Ghent 9000, Belgium; [email protected] (B.D.); [email protected] (W.V.L.) 2 Department of Movement and Sports Sciences, Ghent University, Ghent 9000, Belgium; [email protected] (M.D.C.); [email protected] (I.D.B.); [email protected] (G.C.) 3 Department of Human Biometry and Biomechanics, Vrije Universiteit Brussel, Brussels 1000, Belgium 4 Department of Nutrition and Dietetics, School of Health Science and Education, Harokopio University, Athens 17671, Greece; [email protected] (O.A.); [email protected] (Y.M.) 5 Ludwig-Maximilians-University of Munich, Dr. von Hauner Children’s Hospital, München 80337, Germany; [email protected] 6 GENUD Research Group, University of Zaragoza, Zaragoza 50009, Spain; [email protected] 7 The Children’s Memorial Health Institute, Warsaw 04-730, Poland; [email protected] 8 Department of Pediatrics, Medical University of Varna, Varna 9002, Bulgaria; [email protected] * Correspondence: Ansofi[email protected]; Tel.: +32-9-332-83-63 Received: 1 July 2016; Accepted: 19 September 2016; Published: 23 September 2016 Abstract: Previous research indicated that preschoolers of lower socioeconomic status (SES) consume less healthy beverages than high SES preschoolers. The purpose of this study is to investigate the mediating role of parenting practices in the relationship between SES and plain water, soft drink and prepacked fruit juice (FJ) consumption in European preschoolers. Parents/caregivers of 3.5 to 5.5 years old (n = 6776) recruited through kindergartens in six European countries within the ToyBox-study completed questionnaires on socio-demographics, parenting practices and a food frequency questionnaire. Availability of sugared beverages and plain water, permissiveness towards sugared beverages and lack of self-efficacy showed a mediating effect on SES-differences in all three beverages. Rewarding with sugared beverages significantly mediated SES-differences for both plain water and prepacked FJ. Encouragement to drink plain water and awareness significantly mediated SES-differences for, respectively, plain water and prepacked FJ consumption. Avoiding negative modelling did not mediate any associations. Overall, lower SES preschoolers were more likely to be confronted with lower levels of favourable and higher levels of unfavourable parenting practices, which may lead to higher sugared beverage and lower plain water consumption. The current study highlights the importance of parenting practices in explaining the relation between SES and both healthy and unhealthy beverage consumption. Keywords: socio-economic status inequalities; beverage choices; educational level; preschoolers; parents; water; soft drinks; prepacked fruit juice; parenting practices 1. Introduction A recent European study in preschoolers showed that only about half of water intake from beverages was derived from plain water (both tap and bottled water without any additives) and nearly a quarter of total water intake from beverages from sweetened beverages (such as soft Nutrients 2016, 8, 591; doi:10.3390/nu8100591 www.mdpi.com/journal/nutrients

Welcome message from author
This document is posted to help you gain knowledge. Please leave a comment to let me know what you think about it! Share it to your friends and learn new things together.
Transcript
nutrients
Article
Can Parenting Practices Explain the Differences inBeverage Intake According to Socio-Economic Status:The Toybox-Study
An-Sofie Pinket 1,*, Marieke De Craemer 2, Ilse De Bourdeaudhuij 2, Benedicte Deforche 1,3,Greet Cardon 2, Odysseas Androutsos 4, Berthold Koletzko 5, Luis A. Moreno 6, Piotr Socha 7,Violeta Iotova 8, Yannis Manios 4 and Wendy Van Lippevelde 1
1 Department of Public Health, Ghent University, Ghent 9000, Belgium; [email protected] (B.D.);[email protected] (W.V.L.)
2 Department of Movement and Sports Sciences, Ghent University, Ghent 9000, Belgium;[email protected] (M.D.C.); [email protected] (I.D.B.);[email protected] (G.C.)
3 Department of Human Biometry and Biomechanics, Vrije Universiteit Brussel, Brussels 1000, Belgium4 Department of Nutrition and Dietetics, School of Health Science and Education, Harokopio University,
Athens 17671, Greece; [email protected] (O.A.); [email protected] (Y.M.)5 Ludwig-Maximilians-University of Munich, Dr. von Hauner Children’s Hospital, München 80337, Germany;
[email protected] GENUD Research Group, University of Zaragoza, Zaragoza 50009, Spain; [email protected] The Children’s Memorial Health Institute, Warsaw 04-730, Poland; [email protected] Department of Pediatrics, Medical University of Varna, Varna 9002, Bulgaria; [email protected]* Correspondence: [email protected]; Tel.: +32-9-332-83-63
Received: 1 July 2016; Accepted: 19 September 2016; Published: 23 September 2016
Abstract: Previous research indicated that preschoolers of lower socioeconomic status (SES) consumeless healthy beverages than high SES preschoolers. The purpose of this study is to investigate themediating role of parenting practices in the relationship between SES and plain water, soft drinkand prepacked fruit juice (FJ) consumption in European preschoolers. Parents/caregivers of 3.5 to5.5 years old (n = 6776) recruited through kindergartens in six European countries within theToyBox-study completed questionnaires on socio-demographics, parenting practices and a foodfrequency questionnaire. Availability of sugared beverages and plain water, permissivenesstowards sugared beverages and lack of self-efficacy showed a mediating effect on SES-differences inall three beverages. Rewarding with sugared beverages significantly mediated SES-differencesfor both plain water and prepacked FJ. Encouragement to drink plain water and awarenesssignificantly mediated SES-differences for, respectively, plain water and prepacked FJ consumption.Avoiding negative modelling did not mediate any associations. Overall, lower SES preschoolerswere more likely to be confronted with lower levels of favourable and higher levels of unfavourableparenting practices, which may lead to higher sugared beverage and lower plain water consumption.The current study highlights the importance of parenting practices in explaining the relation betweenSES and both healthy and unhealthy beverage consumption.
Keywords: socio-economic status inequalities; beverage choices; educational level; preschoolers;parents; water; soft drinks; prepacked fruit juice; parenting practices
1. Introduction
A recent European study in preschoolers showed that only about half of water intake frombeverages was derived from plain water (both tap and bottled water without any additives) andnearly a quarter of total water intake from beverages from sweetened beverages (such as soft
Nutrients 2016, 8, 591; doi:10.3390/nu8100591 www.mdpi.com/journal/nutrients
Nutrients 2016, 8, 591 2 of 19
drinks and especially prepacked fruit juice) [1]. The excessive intake of added sugars throughthese sweetened beverages can lead to an energy imbalance (i.e., energy intake that exceeds energyexpenditure) and thus to overweight [2,3]. The importance of healthy choices already starts early inlife since dietary habits are being formed at a young age and track into adolescence and adult life [4].Therefore, developing healthy habits should already start in the first years of life.
Given the young age of preschool children, parents play a fundamental role in developing a homeenvironment that stimulates healthy eating habits among their children through general parenting style(authoritative, authoritarian, permissive or neglectful) and parenting practices (such as availabilityand accessibility, role-modelling and rewarding) related to eating behaviours [5,6]. General parentingstyles has been defined as a set of attitudes and beliefs that create an emotional climate anddetermines behavioural expression between parent and child. In contrast to general parenting styles,parenting practices are behaviour-specific acts of parenting which may differ across children withina family depending on children’s age, gender, eating and activity behaviour and weight status,and which are situation-specific [7].
Earlier studies found a significant influence of parenting practices on soft drink intake [8–13]. It isexpected that, also in the consumption of other beverages, parenting practices play an important rolebut research in preschoolers on this topic is currently missing.
Previous research found that the home environment in lower socioeconomic status (SES) familiesis less supportive for a healthy lifestyle [14,15]. A study on beverage consumption in Europeanpreschool children found differences in beverage intake by socioeconomic status. Preschoolers of lowerSES drank more sugared beverages and less plain water than their high SES peers [1]. De Coen et al.(2012) found similar SES-differences in soft drink consumption in Flemish preschoolers and revealedthat this difference was mediated by parenting practices [9]. Similar mediation effects are expected forplain water and prepacked fruit juice consumption in other European countries, but cross-Europeanresearch is currently missing. In order to limit the widening of health inequalities, it is importantto specifically focus on reaching and changing the low SES households through health promotioninitiatives. As such, investigating the mediating role of parenting practices on SES-differences inbeverages choices is highly important. Therefore, the aim of the present study was to explore themediating role of parenting practices in explaining differences in preschoolers’ plain water, soft drinkand prepacked fruit juice consumption by socioeconomic status. Data were collected in the context ofthe ToyBox-study (Multifactorial evidence-based approach using behavioural models in understandingand promoting fun, healthy food, play and policy for the prevention of obesity in early childhood) insix European countries [16].
2. Materials and Methods
2.1. Study Background
The ToyBox-study is an EU-funded large-scale study of preschoolers (3.5–5.5 years old) andtheir families from six European countries (Belgium, Bulgaria, Germany, Greece, Poland, and Spain).It aimed to develop and evaluate a kindergarten-based, family-involved intervention to preventoverweight and obesity in preschool children [16]. For the present study, the baseline-data from theToyBox-study were used.
The ToyBox-study was approved by Ethical Committees in all six European countries, in linewith national regulations (i.e., the Ethical Committee of Ghent University Hospital (Belgium),Committee for the Ethics of the Scientific Studies (KENI) at the Medical University of Varna (Bulgaria),Ethikkommission der Ludwig-Maximilians-Universität München (Germany), the Ethics Committee ofHarokopio University of Athens (Greece), Ethical Committee of Children’s Memorial Health Institute(Poland), and CEICA (Comité Ético de Investigación Clínica de Aragón (Spain)).
Nutrients 2016, 8, 591 3 of 19
2.2. Participants
Preschool children between 3.5 and 5.5 years old were recruited from six European countries.These children and their families were recruited at kindergartens, daycare centres or preschool settings,depending on the country regulations and legislation. In order to avoid confusion for the reader,all these settings will be referred to as “kindergartens” in this paper. Kindergartens were recruitedfrom different socio-demographic backgrounds within each of the provinces (West- and East-Flandersin Belgium, Varna in Bulgaria, Bavaria in Germany, Attica in Greece, Warsaw and surroundings inPoland, and Zaragoza in Spain).
A minimum sample of 800 children and their families and 20 kindergartens per country, resultingin a total sample of 4800 children and their families and 120 kindergartens, was initially targeted.However, in order to account for an estimated dropout rate of about 30%, a minimum total number ofabout 6500 children and their families were aimed to be recruited in the six participating countries [17].Data collection occurred between May and June 2012. Parents/caregivers were asked for writtenconsent for the participation of their child and themselves in the study. Only preschoolers whoseparents/caregivers gave their consent were included in the study. Detailed sampling methods havebeen described elsewhere [17].
2.3. Measures
2.3.1. Core Questionnaire
Parents/caregivers were asked to complete a core questionnaire, consisting of questions onsocio-demographics and child and parent/caregiver behaviour (such as parenting practices).
Socio-Demographic Variables
Gender and date of birth were reported by one of the parents/caregivers of the child.Children’s age was computed based on the date of birth and the date when the questionnairewas completed. All questionnaires are available on the ToyBox-website (www.toybox-study.eu)and in the second ToyBox supplement issue [18]. Education of the parents/caregivers was alsoreported in the core questionnaire. The education level of the mother was used as an SES indicator.Educational level has been identified as an important indicator for SES and maternal education is oftenseen as more influencing for the child than education of the father given that mothers are often theprimary caregiver [9,19,20]. The education level was dichotomized into lower (14 or fewer years ofeducation) and high (more than 14 years of education) SES, similar to the SES measure used in thelarge-scale European ENERGY-study, which distinguishes families with a mother who has completedmedium or higher education, college or university training from other families [21].
Parenting Practices
Seventeen statements regarding plain water, soft drinks and prepacked fruit juice consumptionof their preschool child were presented, of which twelve statements, focusing on parenting practices,were used in the current study. The development of the questions included in the parental questionnairewas based on questionnaires previously used in large European studies of which construct validity ofthe items on multiple energy balance-related behaviours, their potential determinants, and parentingpractices has been shown to be good [22]. In addition, in the study of González-Gil et al. (2014),a moderate to good test-retest reliability (ICC ranged from 0.409 to 0.693) for all questions on parentingpractices used in this study was found [23].
Parents/caregivers were asked to indicate what was most appropriate for them, choosing fromfive Likert-type answer categories (strongly disagree, disagree, neither agree nor disagree, agree andstrongly agree). An exploratory factor analysis of principal components was executed to investigatethe possibility to form subscales based on the twelve parental items regarding plain water, soft drinksand prepacked fruit juice consumption of their preschool child. However, given the differences in
Nutrients 2016, 8, 591 4 of 19
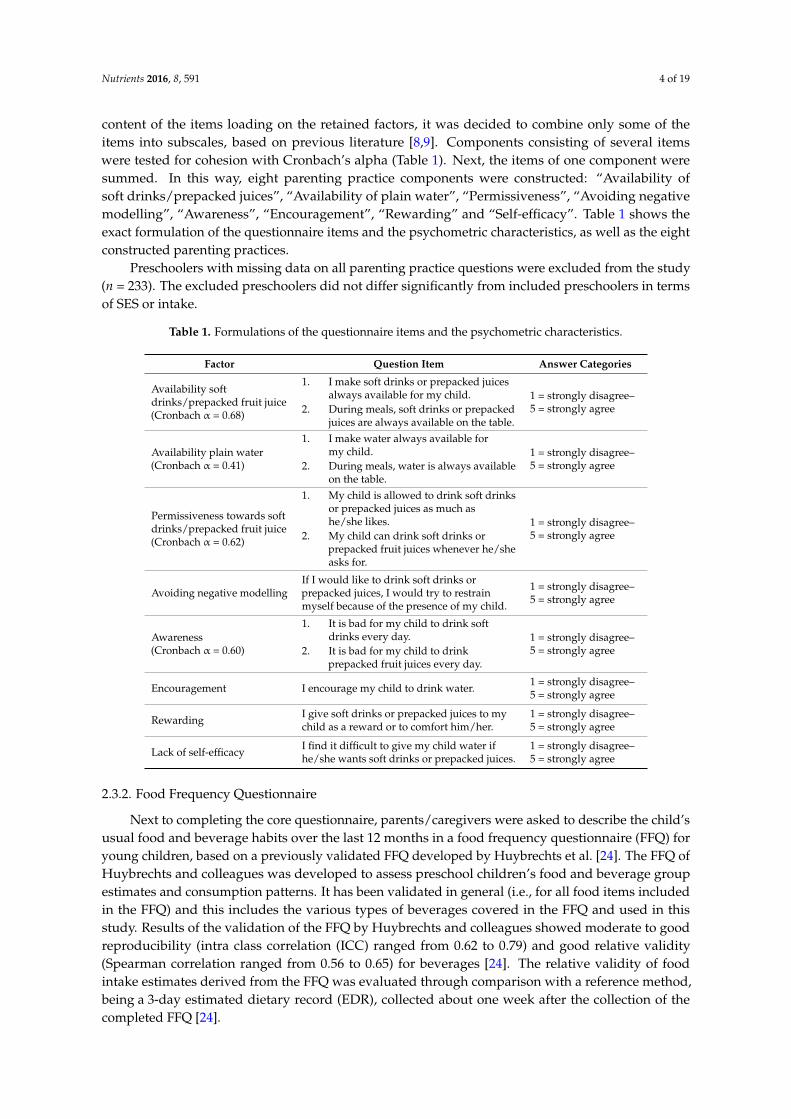
content of the items loading on the retained factors, it was decided to combine only some of theitems into subscales, based on previous literature [8,9]. Components consisting of several itemswere tested for cohesion with Cronbach’s alpha (Table 1). Next, the items of one component weresummed. In this way, eight parenting practice components were constructed: “Availability ofsoft drinks/prepacked juices”, “Availability of plain water”, “Permissiveness”, “Avoiding negativemodelling”, “Awareness”, “Encouragement”, “Rewarding” and “Self-efficacy”. Table 1 shows theexact formulation of the questionnaire items and the psychometric characteristics, as well as the eightconstructed parenting practices.
Preschoolers with missing data on all parenting practice questions were excluded from the study(n = 233). The excluded preschoolers did not differ significantly from included preschoolers in termsof SES or intake.
Table 1. Formulations of the questionnaire items and the psychometric characteristics.
Factor Question Item Answer Categories
Availability softdrinks/prepacked fruit juice(Cronbach α = 0.68)
1. I make soft drinks or prepacked juicesalways available for my child.
2. During meals, soft drinks or prepackedjuices are always available on the table.
1 = strongly disagree–5 = strongly agree
Availability plain water(Cronbach α = 0.41)
1. I make water always available formy child.
2. During meals, water is always availableon the table.
1 = strongly disagree–5 = strongly agree
Permissiveness towards softdrinks/prepacked fruit juice(Cronbach α = 0.62)
1. My child is allowed to drink soft drinksor prepacked juices as much ashe/she likes.
2. My child can drink soft drinks orprepacked fruit juices whenever he/sheasks for.
1 = strongly disagree–5 = strongly agree
Avoiding negative modellingIf I would like to drink soft drinks orprepacked juices, I would try to restrainmyself because of the presence of my child.
1 = strongly disagree–5 = strongly agree
Awareness(Cronbach α = 0.60)
1. It is bad for my child to drink softdrinks every day.
2. It is bad for my child to drinkprepacked fruit juices every day.
1 = strongly disagree–5 = strongly agree
Encouragement I encourage my child to drink water. 1 = strongly disagree–5 = strongly agree
Rewarding I give soft drinks or prepacked juices to mychild as a reward or to comfort him/her.
1 = strongly disagree–5 = strongly agree
Lack of self-efficacy I find it difficult to give my child water ifhe/she wants soft drinks or prepacked juices.
1 = strongly disagree–5 = strongly agree
2.3.2. Food Frequency Questionnaire
Next to completing the core questionnaire, parents/caregivers were asked to describe the child’susual food and beverage habits over the last 12 months in a food frequency questionnaire (FFQ) foryoung children, based on a previously validated FFQ developed by Huybrechts et al. [24]. The FFQ ofHuybrechts and colleagues was developed to assess preschool children’s food and beverage groupestimates and consumption patterns. It has been validated in general (i.e., for all food items includedin the FFQ) and this includes the various types of beverages covered in the FFQ and used in thisstudy. Results of the validation of the FFQ by Huybrechts and colleagues showed moderate to goodreproducibility (intra class correlation (ICC) ranged from 0.62 to 0.79) and good relative validity(Spearman correlation ranged from 0.56 to 0.65) for beverages [24]. The relative validity of foodintake estimates derived from the FFQ was evaluated through comparison with a reference method,being a 3-day estimated dietary record (EDR), collected about one week after the collection of thecompleted FFQ [24].
Nutrients 2016, 8, 591 5 of 19
The selected beverages used in this study were plain water (both tap and bottled water), soft drinksand other fruit juice (pre-packed/bottled fruit juice). For each of these beverages, the frequency ofconsumption was asked. Response categories were: “never or less than once per month”, “1–3 daysper month”, “1 day per week”, “2–4 days per week”, “5–6 days per week” and “every day”.Next, the average consumption per day was asked. The response categories were “100 mL orless”, “100–200 mL”, “200–300 mL”, “300–400 mL”, “400–500 mL”, “500–600 mL”, “600–700 mL”,“700–800 mL”, “800–900 mL”, “900–1000 mL” and “1000 mL or more”. From these data, the averageamount of the different beverages in millilitres per day was calculated by multiplication of number ofdays per week and intake per day in millilitres divided by 7.
Preschool children who had a valid measurement (i.e., fitting the answering categories fromwhich parents/caregivers could choose) for frequency and portion size for at least one beverage wereincluded. This means that preschoolers who had no valid data (both on frequency and portion size) onall three beverages were excluded from the study (n = 51).
2.4. Statistical Analyses
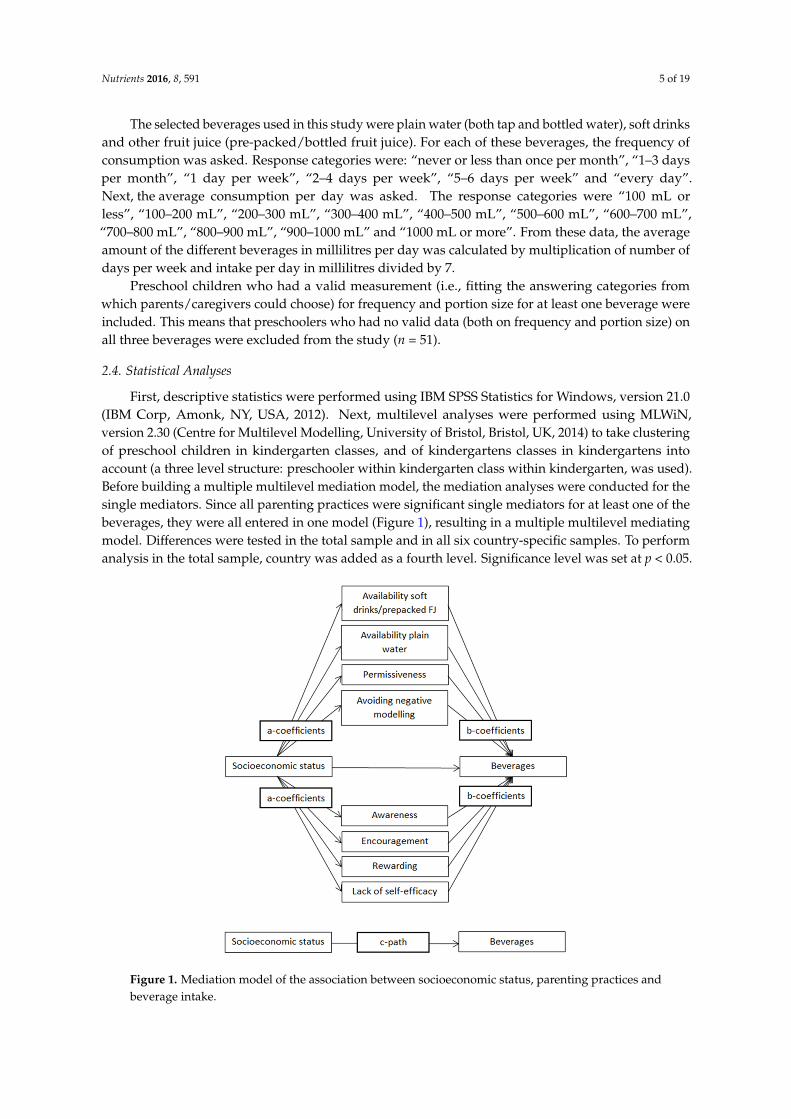
First, descriptive statistics were performed using IBM SPSS Statistics for Windows, version 21.0(IBM Corp, Amonk, NY, USA, 2012). Next, multilevel analyses were performed using MLWiN,version 2.30 (Centre for Multilevel Modelling, University of Bristol, Bristol, UK, 2014) to take clusteringof preschool children in kindergarten classes, and of kindergartens classes in kindergartens intoaccount (a three level structure: preschooler within kindergarten class within kindergarten, was used).Before building a multiple multilevel mediation model, the mediation analyses were conducted for thesingle mediators. Since all parenting practices were significant single mediators for at least one of thebeverages, they were all entered in one model (Figure 1), resulting in a multiple multilevel mediatingmodel. Differences were tested in the total sample and in all six country-specific samples. To performanalysis in the total sample, country was added as a fourth level. Significance level was set at p < 0.05.
Nutrients 2016, 8, 591 5 of 21
per month”, “1 day per week”, “2–4 days per week”, “5–6 days per week” and “every day”. Next,
the average consumption per day was asked. The response categories were “100 mL or less”, “100–
200 mL”, “200–300 mL”, “300–400 mL”, “400–500 mL”, “500–600 mL”, “600–700 mL”, “700–800 mL”,
“800–900 mL”, “900–1000 mL” and “1000 mL or more”. From these data, the average amount of the
different beverages in millilitres per day was calculated by multiplication of number of days per week
and intake per day in millilitres divided by 7.
Preschool children who had a valid measurement (i.e., fitting the answering categories from
which parents/caregivers could choose) for frequency and portion size for at least one beverage were
included. This means that preschoolers who had no valid data (both on frequency and portion size)
on all three beverages were excluded from the study (n = 51).
2.4. Statistical Analyses
First, descriptive statistics were performed using IBM SPSS Statistics for Windows, version 21.0
(IBM Corp, Amonk, NY, USA, 2012). Next, multilevel analyses were performed using MLWiN,
version 2.30 (Centre for Multilevel Modelling, University of Bristol, Bristol, UK, 2014) to take
clustering of preschool children in kindergarten classes, and of kindergartens classes in kindergartens
into account (a three level structure: preschooler within kindergarten class within kindergarten, was
used). Before building a multiple multilevel mediation model, the mediation analyses were
conducted for the single mediators. Since all parenting practices were significant single mediators for
at least one of the beverages, they were all entered in one model (Figure 1), resulting in a multiple
multilevel mediating model. Differences were tested in the total sample and in all six country‐specific
samples. To perform analysis in the total sample, country was added as a fourth level. Significance
level was set at p < 0.05.
Figure 1. Mediation model of the association between socioeconomic status, parenting practices and
beverage intake.
The mediating role of parenting practices on the association between SES and beverage intake
was tested using the product‐of‐coefficient test of MacKinnon [25]. This test consists of different
stages: (1) the action theory test which estimates the association between SES and the potential
Figure 1. Mediation model of the association between socioeconomic status, parenting practices andbeverage intake.
Nutrients 2016, 8, 591 6 of 19
The mediating role of parenting practices on the association between SES and beverage intakewas tested using the product-of-coefficient test of MacKinnon [25]. This test consists of differentstages: (1) the action theory test which estimates the association between SES and the potentialmediators (a-coefficients); (2) conceptual theory test which estimate the association between thepotential mediators and beverage intakes (b-coefficients) controlling for the independent variable(i.e., SES); (3) the calculation of the product of the two coefficients (ab), representing the mediatingeffect; and (4) the calculation of dividing ab by its standard error (SE) to assess the statistical significanceof the mediating role. To calculate the SE, the Sobel test for multiple mediation was used. According toMacKinnon, a significant total association (c-path) is not necessary for mediation to occur [25].The existence of mediation in the absence of a total association might be due to unmeasured variablesthat suppress the association between SES and fruit juice intake.
The analysis was adjusted for age and gender of the preschool child. Three multiple mediatingmodels were conducted, one for each beverage intake (plain water, soft drinks and prepacked fruitjuice). Significance level was set at p < 0.05.
3. Results
3.1. Population Characteristics
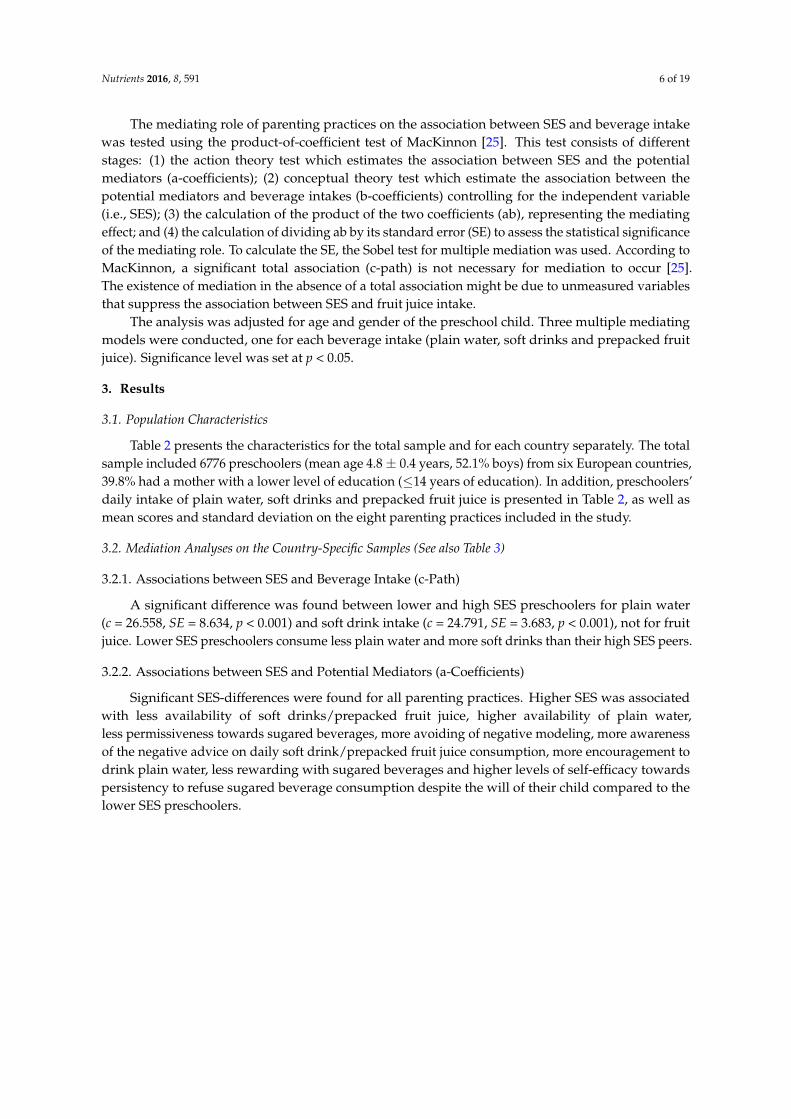
Table 2 presents the characteristics for the total sample and for each country separately. The totalsample included 6776 preschoolers (mean age 4.8 ± 0.4 years, 52.1% boys) from six European countries,39.8% had a mother with a lower level of education (≤14 years of education). In addition, preschoolers’daily intake of plain water, soft drinks and prepacked fruit juice is presented in Table 2, as well asmean scores and standard deviation on the eight parenting practices included in the study.
3.2. Mediation Analyses on the Country-Specific Samples (See also Table 3)
3.2.1. Associations between SES and Beverage Intake (c-Path)
A significant difference was found between lower and high SES preschoolers for plain water(c = 26.558, SE = 8.634, p < 0.001) and soft drink intake (c = 24.791, SE = 3.683, p < 0.001), not for fruitjuice. Lower SES preschoolers consume less plain water and more soft drinks than their high SES peers.
3.2.2. Associations between SES and Potential Mediators (a-Coefficients)
Significant SES-differences were found for all parenting practices. Higher SES was associatedwith less availability of soft drinks/prepacked fruit juice, higher availability of plain water,less permissiveness towards sugared beverages, more avoiding of negative modeling, more awarenessof the negative advice on daily soft drink/prepacked fruit juice consumption, more encouragement todrink plain water, less rewarding with sugared beverages and higher levels of self-efficacy towardspersistency to refuse sugared beverage consumption despite the will of their child compared to thelower SES preschoolers.
Nutrients 2016, 8, 591 7 of 19
Table 2. Characteristics of participants of the total sample and each country separately.
Total Belgium Bulgaria Germany Greece Poland Spain
N 6776 917 752 1139 1733 1384 851
Age 4.8 ± 0.4 4.4 ± 0.5 4.9 ± 0.3 4.5 ± 0.5 4.9 ± 0.3 4.9 ± 0.3 4.9 ± 0.3
Gender (% male) 52.1% 52.2% 50.5% 51.9% 50.8% 53.0% 54.8%
SES *, % lower SES (=≤14 years of education) 39.8% 34.4% 40.8% 51.6% 51.3% 21.0% 36.1%
Ethnicity (One or both parents are not born inthe country of residence) 16% 12.4% 3.5% 29.9% 24.4% 3.7% 15.6%
Plain water intake (mL/day) 546 414 658 490 629 394 739
Soft drink intake (mL/day) 56 61 35 42 13 155 14
Prepacked FJ intake (mL/day) 104 93 99 103 70 174 75
Availability soft drinks/prepacked FJ [1–10] 3.8 ± 1.8 3.9 ± 1.9 4.0 ± 1.9 3.9 ± 1.9 3.4 ± 1.4 4.2 ± 1.8 3.5 ± 1.5
Availability plain water [1–10] 8.9 ± 1.4 9.1 ± 1.3 8.4 ± 1.5 9.0 ± 1.3 9.1 ± 1.1 8.2 ± 1.6 9.5 ± 1.0
Permissiveness [1–10] 3.9 ± 1.7 4.1 ± 1.6 4.2 ± 1.9 3.7 ± 1.8 3.4 ± 1.2 4.1 ± 1.8 4.0 ± 1.6
Avoiding negative modelling [1–5] 3.5 ± 1.1 3.2 ± 1.1 3.3 ± 1.2 3.8 ± 1.1 4.0 ± 1.0 3.2 ± 1.1 3.3 ± 1.1
Awareness [1–10] 8.1 ± 1.9 8.1 ± 1.7 7.7 ± 2.2 8.1 ± 1.8 8.5 ± 1.7 8.0 ± 1.8 7.8 ± 1.9
Encouragement [1–5] 4.5 ± 0.7 4.5 ± 0.6 4.5 ± 0.8 4.4 ± 0.8 4.5 ± 0.7 4.5 ± 0.8 4.6 ± 0.7
Rewarding [1–5] 1.6 ± 0.8 1.6 ± 0.8 1.7 ± 0.9 1.5 ± 0.8 1.5 ± 0.8 1.8 ± 0.9 1.5 ± 0.8
Lack of self-efficacy [1–5] 2.3 ± 1.2 2.0 ± 1.0 2.1 ± 1.1 2.5 ± 1.2 1.9 ± 1.0 3.1 ± 1.2 1.8 ± 1.0
* Years of school education mother.
Nutrients 2016, 8, 591 8 of 19
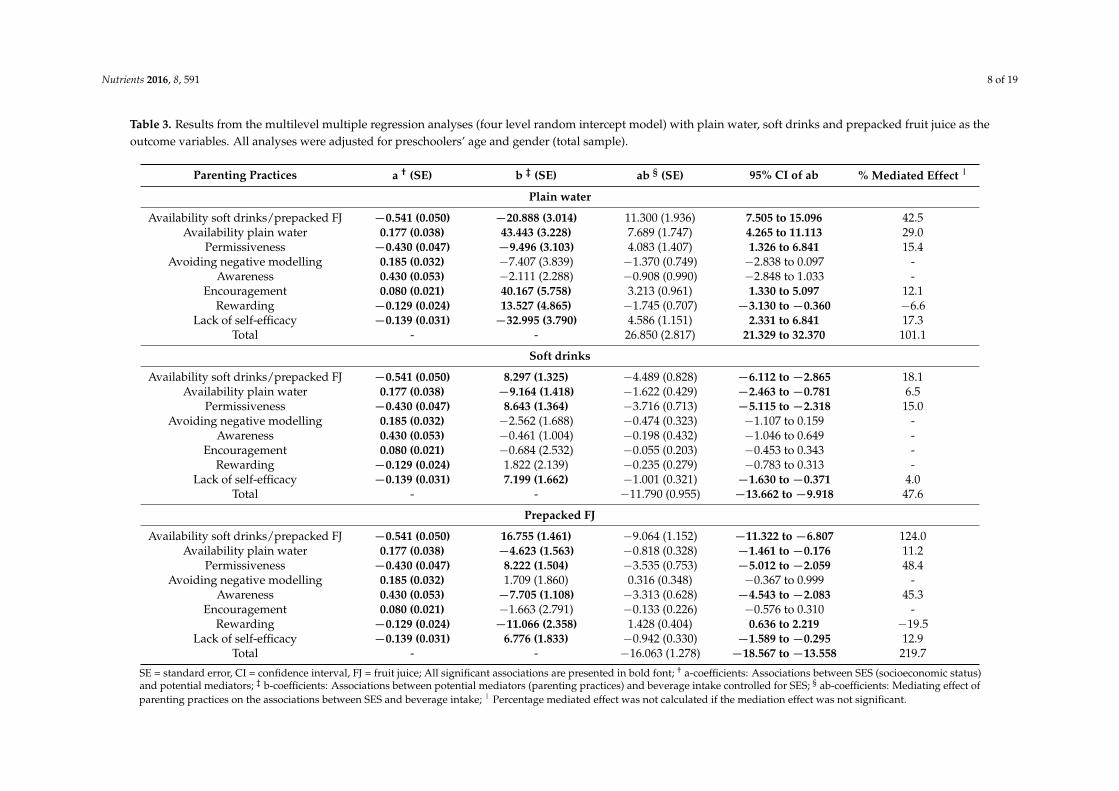
Table 3. Results from the multilevel multiple regression analyses (four level random intercept model) with plain water, soft drinks and prepacked fruit juice as theoutcome variables. All analyses were adjusted for preschoolers’ age and gender (total sample).
Parenting Practices a † (SE) b ‡ (SE) ab § (SE) 95% CI of ab % Mediated Effect |
Plain water
Availability soft drinks/prepacked FJ −0.541 (0.050) −20.888 (3.014) 11.300 (1.936) 7.505 to 15.096 42.5Availability plain water 0.177 (0.038) 43.443 (3.228) 7.689 (1.747) 4.265 to 11.113 29.0
Permissiveness −0.430 (0.047) −9.496 (3.103) 4.083 (1.407) 1.326 to 6.841 15.4Avoiding negative modelling 0.185 (0.032) −7.407 (3.839) −1.370 (0.749) −2.838 to 0.097 -
Awareness 0.430 (0.053) −2.111 (2.288) −0.908 (0.990) −2.848 to 1.033 -Encouragement 0.080 (0.021) 40.167 (5.758) 3.213 (0.961) 1.330 to 5.097 12.1
Rewarding −0.129 (0.024) 13.527 (4.865) −1.745 (0.707) −3.130 to −0.360 −6.6Lack of self-efficacy −0.139 (0.031) −32.995 (3.790) 4.586 (1.151) 2.331 to 6.841 17.3
Total - - 26.850 (2.817) 21.329 to 32.370 101.1
Soft drinks
Availability soft drinks/prepacked FJ −0.541 (0.050) 8.297 (1.325) −4.489 (0.828) −6.112 to −2.865 18.1Availability plain water 0.177 (0.038) −9.164 (1.418) −1.622 (0.429) −2.463 to −0.781 6.5
Permissiveness −0.430 (0.047) 8.643 (1.364) −3.716 (0.713) −5.115 to −2.318 15.0Avoiding negative modelling 0.185 (0.032) −2.562 (1.688) −0.474 (0.323) −1.107 to 0.159 -
Awareness 0.430 (0.053) −0.461 (1.004) −0.198 (0.432) −1.046 to 0.649 -Encouragement 0.080 (0.021) −0.684 (2.532) −0.055 (0.203) −0.453 to 0.343 -
Rewarding −0.129 (0.024) 1.822 (2.139) −0.235 (0.279) −0.783 to 0.313 -Lack of self-efficacy −0.139 (0.031) 7.199 (1.662) −1.001 (0.321) −1.630 to −0.371 4.0
Total - - −11.790 (0.955) −13.662 to −9.918 47.6
Prepacked FJ
Availability soft drinks/prepacked FJ −0.541 (0.050) 16.755 (1.461) −9.064 (1.152) −11.322 to −6.807 124.0Availability plain water 0.177 (0.038) −4.623 (1.563) −0.818 (0.328) −1.461 to −0.176 11.2
Permissiveness −0.430 (0.047) 8.222 (1.504) −3.535 (0.753) −5.012 to −2.059 48.4Avoiding negative modelling 0.185 (0.032) 1.709 (1.860) 0.316 (0.348) −0.367 to 0.999 -
Awareness 0.430 (0.053) −7.705 (1.108) −3.313 (0.628) −4.543 to −2.083 45.3Encouragement 0.080 (0.021) −1.663 (2.791) −0.133 (0.226) −0.576 to 0.310 -
Rewarding −0.129 (0.024) −11.066 (2.358) 1.428 (0.404) 0.636 to 2.219 −19.5Lack of self-efficacy −0.139 (0.031) 6.776 (1.833) −0.942 (0.330) −1.589 to −0.295 12.9
Total - - −16.063 (1.278) −18.567 to −13.558 219.7
SE = standard error, CI = confidence interval, FJ = fruit juice; All significant associations are presented in bold font; † a-coefficients: Associations between SES (socioeconomic status)and potential mediators; ‡ b-coefficients: Associations between potential mediators (parenting practices) and beverage intake controlled for SES; § ab-coefficients: Mediating effect ofparenting practices on the associations between SES and beverage intake; | Percentage mediated effect was not calculated if the mediation effect was not significant.
Nutrients 2016, 8, 591 9 of 19
3.2.3. Associations between Potential Mediators and Beverage Intake Controlled forSES (b-Coefficients)
Plain Water
All parenting practices, except for avoiding negative modelling and awareness of the negativeadvice on daily soft drink/prepacked fruit juice consumption, were significantly and independentlyassociated with plain water consumption. Higher availability of plain water, more encouragement todrink plain water and more rewarding with sugared beverages was associated with higher plain waterconsumption, while higher availability of sugared beverages, more permissiveness toward sugaredbeverages and a lack of self-efficacy towards persistency to refuse sugared beverage consumptiondespite the will of their child was associated with lower plain water intake.
Soft Drinks
Avoiding negative modelling, awareness of the negative advice on daily soft drink/prepackedfruit juice consumption, encouragement to drink plain water and rewarding with sugared beverageswere significantly and independently associated with soft drink consumption. Higher availability ofsugared beverages, more permissiveness towards sugared beverages and a lack of self-efficacy towardspersistency to refuse sugared beverage consumption despite the will of their child were associatedwith higher soft drink intake, while a higher availability of plain water was associated with lowerintakes of soft drinks.
Prepacked Fruit Juice
All parenting practices, except for avoiding negative modelling and encouragement to drink plainwater, were significantly associated with prepacked fruit juice consumption. Higher availability ofsugared beverages, more permissiveness towards sugared beverages and a lack of self-efficacy towardspersistency to refuse sugared beverage consumption despite the will of their child was associated witha higher consumption of prepacked fruit juices, while higher availability of plain water, less awarenessof the negative advice on daily soft drink/prepacked fruit juice consumption and more rewardingwith sugared beverages was associated with lower intakes of prepacked fruit juice.
3.2.4. Mediating Effect of Parenting Practices on the Associations between SES and BeverageIntake (ab-Coefficients)
Availability of soft drinks/prepacked fruit juice, availability of plain water, permissivenesstowards sugared beverages and lack of self-efficacy towards persistency to refuse sugared beverageconsumption despite the will of their child showed a mediating effect on the relation between SESand plain water (proportion mediated, respectively: 42.5%, 29.0%, 15.4% and 17.3%), soft drinks(proportion mediated, respectively: 18.1%, 6.5%, 15.0% and 4.0%) and prepacked fruit juiceconsumption (non-significant association between SES and prepacked fruit juice, so proportionmediation not shown). Rewarding with sugared beverages significantly mediated (i.e., suppressed)the association between SES and both plain water and prepacked fruit juice consumption for −6.6%and −19.5% respectively. Encouragement to drink plain water showed a mediating effect on therelation between SES and plain water consumption (12.1%). Awareness of the negative advice ondaily soft drink/prepacked fruit juice consumption significantly mediated the association between SESand prepacked fruit juice consumption for 45.3%. Avoiding negative modelling did not significantlymediate any associations, as the conceptual theory was not significant.
Nutrients 2016, 8, 591 10 of 19
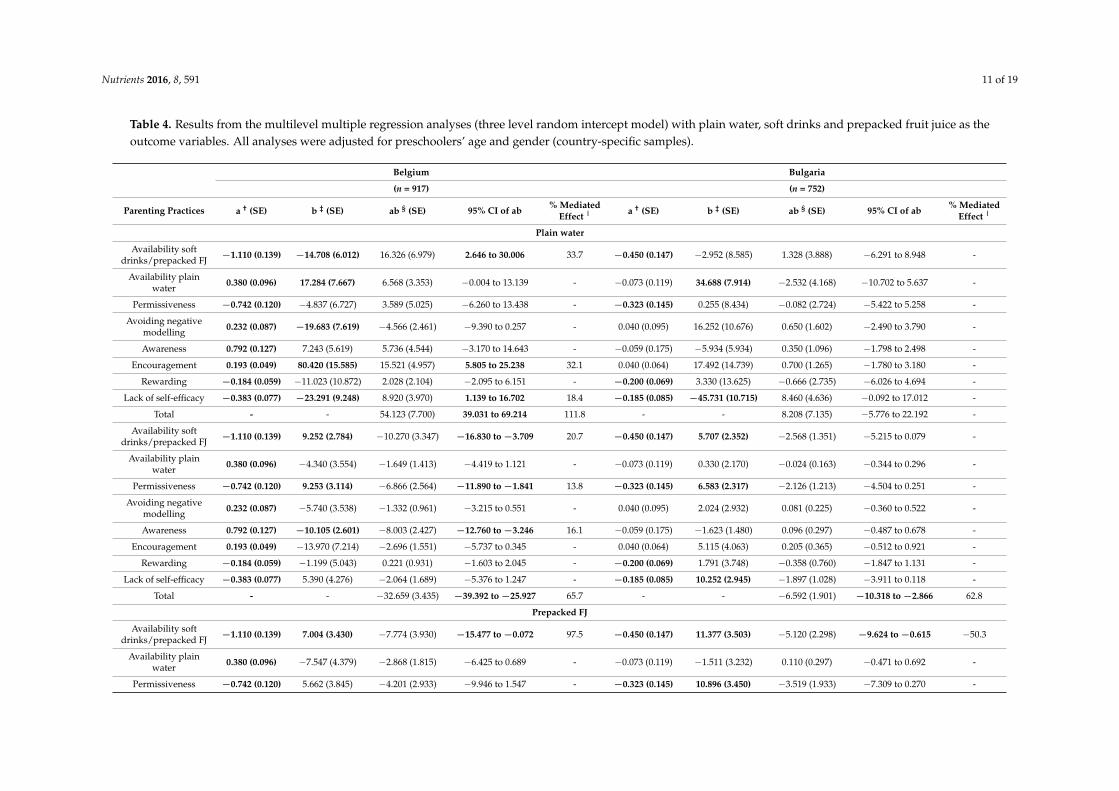
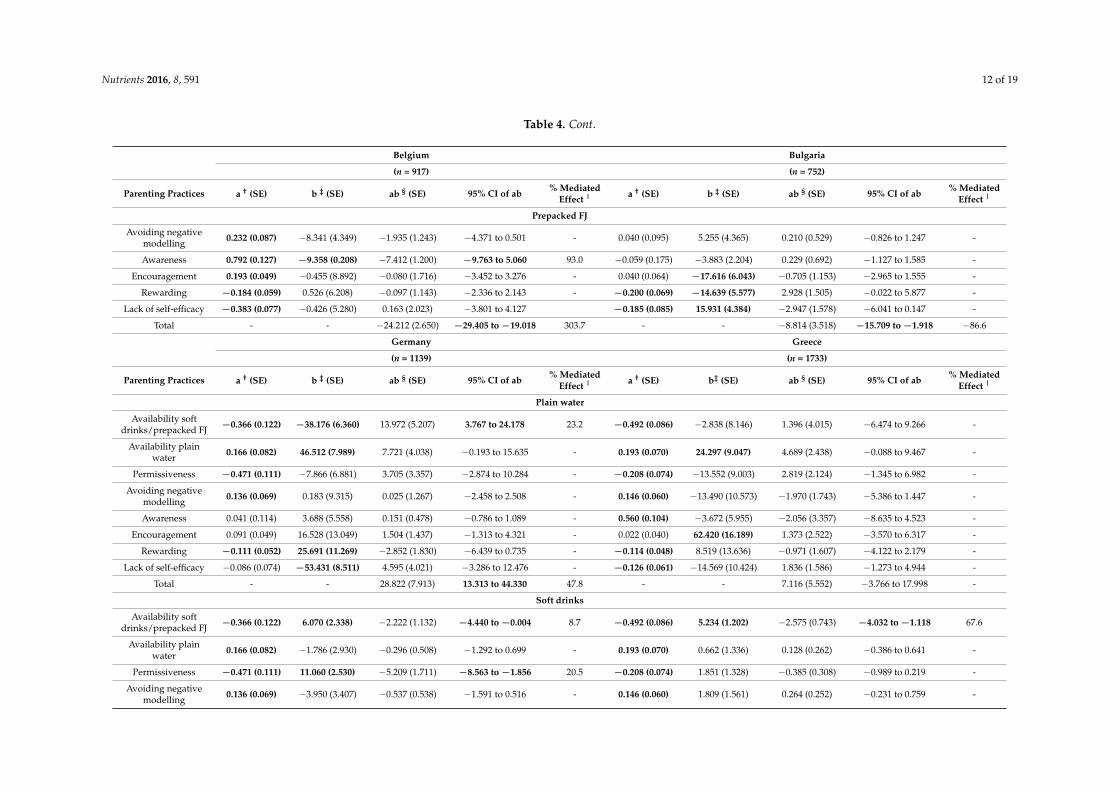
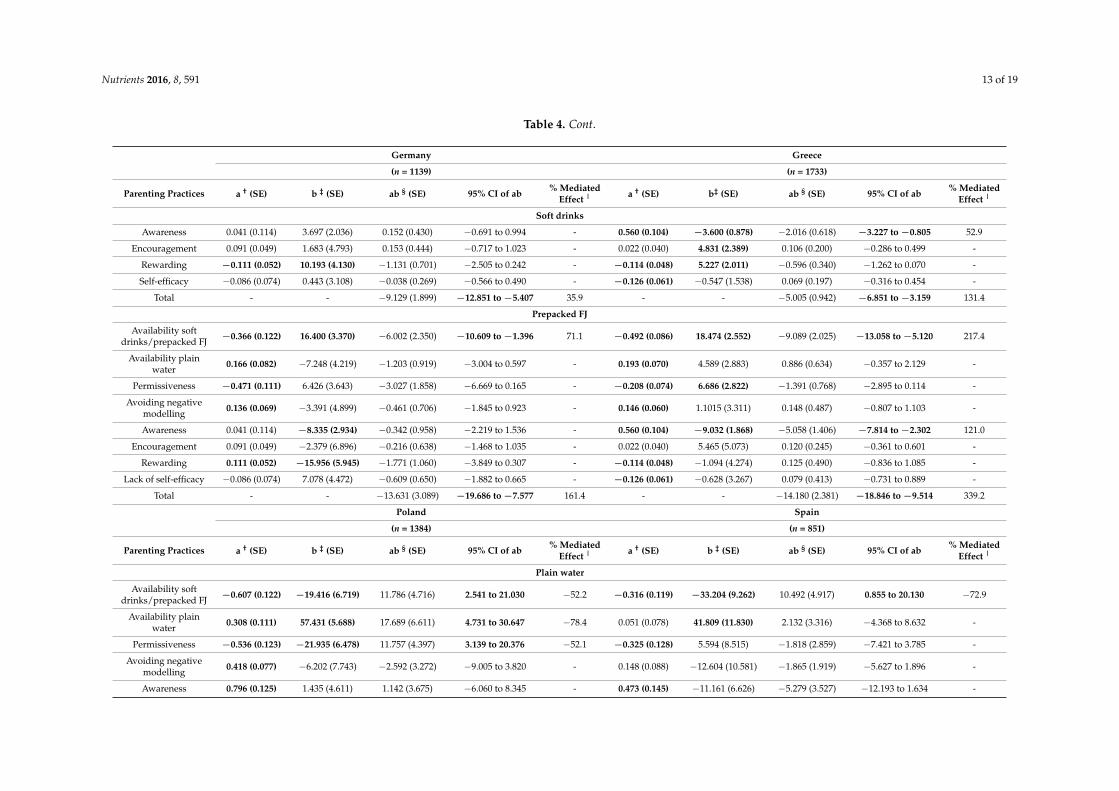
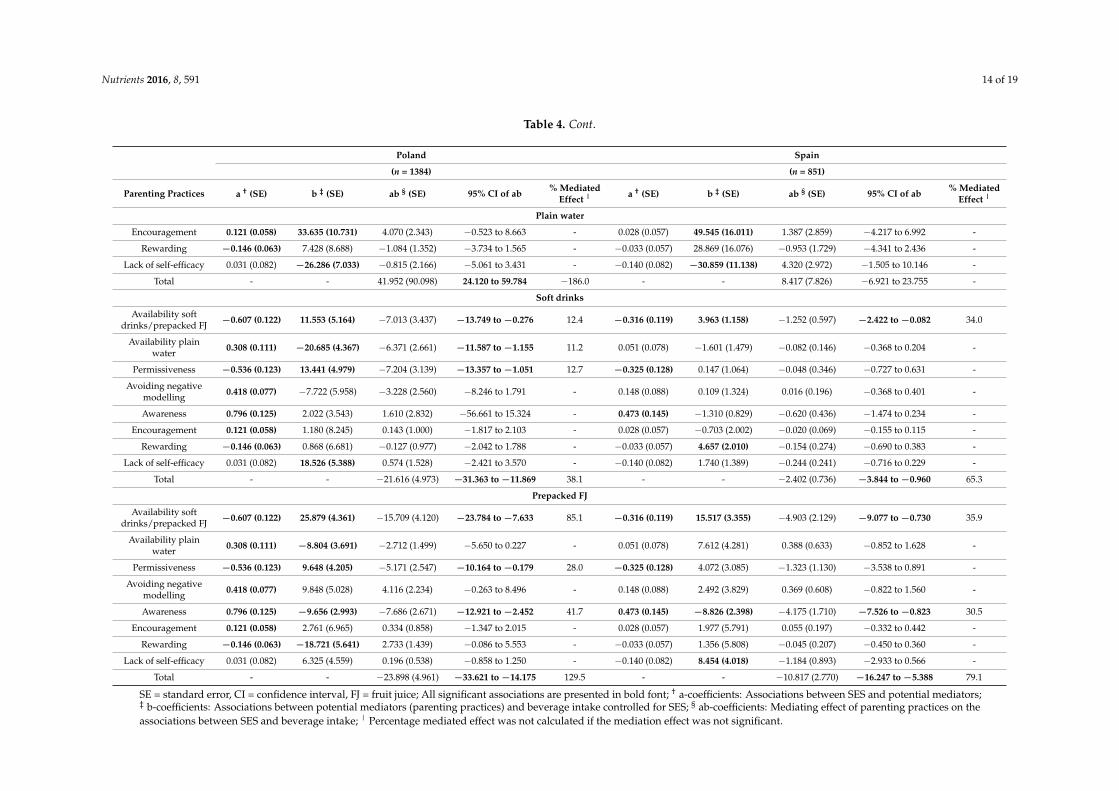
3.3. Mediation Analyses on the Country-Specific Samples (See also Table 4, the Most Important Results AreDiscussed Below)
3.3.1. Associations between SES and Beverage Intake (c-Path)
For Belgium and Germany, significant associations for plain water and soft drinks with SES werefound. For the Greek and Polish sample, respectively, associations with SES were found only for plainwater and soft drinks. For Bulgaria and Spain, no significant associations between SES and beverageintake were found.
3.3.2. Associations between SES and Potential Mediators (a-Coefficients)
In the Belgian sample, SES-differences were found for all eight parenting practices. In Bulgarianpreschoolers, SES differences were found for availability of soft drinks/prepacked fruit juice,permissiveness towards sugared beverages, rewarding with sugared beverages and lack of self-efficacytowards persistency to refuse sugared beverage consumption despite the will of their child. In theGerman sample, the a-path was significant for availability of both soft drinks/prepacked fruit juice andplain water, permissiveness towards sugared beverages, avoiding negative modelling and rewardingwith sugared beverages. In Greek preschoolers, SES-differences were found for all parenting practices,except for encouragement to drink plain water. In the Polish sample, the a-path was significant forall parenting practices, except for lack of self-efficacy towards persistency to refuse sugared beverageconsumption despite the will of their child. In Spanish preschool children, only for availability ofsoft drinks/prepacked fruit juice, permissiveness towards sugared beverages and awareness of thenegative advice on daily soft drink/prepacked fruit juice consumption SES-differences were found.More details can be found in Table 4.
3.3.3. Associations between Potential Mediators and Beverage Intake (b-Coefficients)
The b-path differed in all six countries. Results can be found in Table 4.
3.3.4. Mediating Effect of Parenting Practices on the Associations between SES and BeverageIntake (ab-Coefficients)
Availability of soft drinks/prepacked fruit juice was a significant mediator of the relationshipbetween SES and intakes of (almost) all beverages in all six countries. Awareness of the negativeadvice on daily soft drink/prepacked fruit juice consumption mediated the relation between SES andsoft drink intake in all countries, except for Bulgaria and Greece. Permissiveness towards sugaredbeverages was a significant mediator of the relation between SES and soft drink consumption inBelgian, German and Polish preschoolers. Other mediated effects in the country-specific samples canbe found in Table 4.
Nutrients 2016, 8, 591 11 of 19
Table 4. Results from the multilevel multiple regression analyses (three level random intercept model) with plain water, soft drinks and prepacked fruit juice as theoutcome variables. All analyses were adjusted for preschoolers’ age and gender (country-specific samples).
Belgium Bulgaria
(n = 917) (n = 752)
Parenting Practices a † (SE) b ‡ (SE) ab § (SE) 95% CI of ab % MediatedEffect | a † (SE) b ‡ (SE) ab § (SE) 95% CI of ab % Mediated
Effect |
Plain water
Availability softdrinks/prepacked FJ −1.110 (0.139) −14.708 (6.012) 16.326 (6.979) 2.646 to 30.006 33.7 −0.450 (0.147) −2.952 (8.585) 1.328 (3.888) −6.291 to 8.948 -
Availability plainwater 0.380 (0.096) 17.284 (7.667) 6.568 (3.353) −0.004 to 13.139 - −0.073 (0.119) 34.688 (7.914) −2.532 (4.168) −10.702 to 5.637 -
Permissiveness −0.742 (0.120) −4.837 (6.727) 3.589 (5.025) −6.260 to 13.438 - −0.323 (0.145) 0.255 (8.434) −0.082 (2.724) −5.422 to 5.258 -
Avoiding negativemodelling 0.232 (0.087) −19.683 (7.619) −4.566 (2.461) −9.390 to 0.257 - 0.040 (0.095) 16.252 (10.676) 0.650 (1.602) −2.490 to 3.790 -
Awareness 0.792 (0.127) 7.243 (5.619) 5.736 (4.544) −3.170 to 14.643 - −0.059 (0.175) −5.934 (5.934) 0.350 (1.096) −1.798 to 2.498 -
Encouragement 0.193 (0.049) 80.420 (15.585) 15.521 (4.957) 5.805 to 25.238 32.1 0.040 (0.064) 17.492 (14.739) 0.700 (1.265) −1.780 to 3.180 -
Rewarding −0.184 (0.059) −11.023 (10.872) 2.028 (2.104) −2.095 to 6.151 - −0.200 (0.069) 3.330 (13.625) −0.666 (2.735) −6.026 to 4.694 -
Lack of self-efficacy −0.383 (0.077) −23.291 (9.248) 8.920 (3.970) 1.139 to 16.702 18.4 −0.185 (0.085) −45.731 (10.715) 8.460 (4.636) −0.092 to 17.012 -
Total - - 54.123 (7.700) 39.031 to 69.214 111.8 - - 8.208 (7.135) −5.776 to 22.192 -
Availability softdrinks/prepacked FJ −1.110 (0.139) 9.252 (2.784) −10.270 (3.347) −16.830 to −3.709 20.7 −0.450 (0.147) 5.707 (2.352) −2.568 (1.351) −5.215 to 0.079 -
Availability plainwater 0.380 (0.096) −4.340 (3.554) −1.649 (1.413) −4.419 to 1.121 - −0.073 (0.119) 0.330 (2.170) −0.024 (0.163) −0.344 to 0.296 -
Permissiveness −0.742 (0.120) 9.253 (3.114) −6.866 (2.564) −11.890 to −1.841 13.8 −0.323 (0.145) 6.583 (2.317) −2.126 (1.213) −4.504 to 0.251 -
Avoiding negativemodelling 0.232 (0.087) −5.740 (3.538) −1.332 (0.961) −3.215 to 0.551 - 0.040 (0.095) 2.024 (2.932) 0.081 (0.225) −0.360 to 0.522 -
Awareness 0.792 (0.127) −10.105 (2.601) −8.003 (2.427) −12.760 to −3.246 16.1 −0.059 (0.175) −1.623 (1.480) 0.096 (0.297) −0.487 to 0.678 -
Encouragement 0.193 (0.049) −13.970 (7.214) −2.696 (1.551) −5.737 to 0.345 - 0.040 (0.064) 5.115 (4.063) 0.205 (0.365) −0.512 to 0.921 -
Rewarding −0.184 (0.059) −1.199 (5.043) 0.221 (0.931) −1.603 to 2.045 - −0.200 (0.069) 1.791 (3.748) −0.358 (0.760) −1.847 to 1.131 -
Lack of self-efficacy −0.383 (0.077) 5.390 (4.276) −2.064 (1.689) −5.376 to 1.247 - −0.185 (0.085) 10.252 (2.945) −1.897 (1.028) −3.911 to 0.118 -
Total - - −32.659 (3.435) −39.392 to −25.927 65.7 - - −6.592 (1.901) −10.318 to −2.866 62.8
Prepacked FJ
Availability softdrinks/prepacked FJ −1.110 (0.139) 7.004 (3.430) −7.774 (3.930) −15.477 to −0.072 97.5 −0.450 (0.147) 11.377 (3.503) −5.120 (2.298) −9.624 to −0.615 −50.3
Availability plainwater 0.380 (0.096) −7.547 (4.379) −2.868 (1.815) −6.425 to 0.689 - −0.073 (0.119) −1.511 (3.232) 0.110 (0.297) −0.471 to 0.692 -
Permissiveness −0.742 (0.120) 5.662 (3.845) −4.201 (2.933) −9.946 to 1.547 - −0.323 (0.145) 10.896 (3.450) −3.519 (1.933) −7.309 to 0.270 -
Nutrients 2016, 8, 591 12 of 19
Table 4. Cont.
Belgium Bulgaria
(n = 917) (n = 752)
Parenting Practices a † (SE) b ‡ (SE) ab § (SE) 95% CI of ab % MediatedEffect | a † (SE) b ‡ (SE) ab § (SE) 95% CI of ab % Mediated
Effect |
Prepacked FJ
Avoiding negativemodelling 0.232 (0.087) −8.341 (4.349) −1.935 (1.243) −4.371 to 0.501 - 0.040 (0.095) 5.255 (4.365) 0.210 (0.529) −0.826 to 1.247 -
Awareness 0.792 (0.127) −9.358 (0.208) −7.412 (1.200) −9.763 to 5.060 93.0 −0.059 (0.175) −3.883 (2.204) 0.229 (0.692) −1.127 to 1.585 -
Encouragement 0.193 (0.049) −0.455 (8.892) −0.080 (1.716) −3.452 to 3.276 - 0.040 (0.064) −17.616 (6.043) −0.705 (1.153) −2.965 to 1.555 -
Rewarding −0.184 (0.059) 0.526 (6.208) −0.097 (1.143) −2.336 to 2.143 - −0.200 (0.069) −14.639 (5.577) 2.928 (1.505) −0.022 to 5.877 -
Lack of self-efficacy −0.383 (0.077) −0.426 (5.280) 0.163 (2.023) −3.801 to 4.127 −0.185 (0.085) 15.931 (4.384) −2.947 (1.578) −6.041 to 0.147 -
Total - - −24.212 (2.650) −29.405 to −19.018 303.7 - - −8.814 (3.518) −15.709 to −1.918 −86.6
Germany Greece
(n = 1139) (n = 1733)
Parenting Practices a † (SE) b ‡ (SE) ab § (SE) 95% CI of ab % MediatedEffect | a † (SE) b‡ (SE) ab § (SE) 95% CI of ab % Mediated
Effect |
Plain water
Availability softdrinks/prepacked FJ −0.366 (0.122) −38.176 (6.360) 13.972 (5.207) 3.767 to 24.178 23.2 −0.492 (0.086) −2.838 (8.146) 1.396 (4.015) −6.474 to 9.266 -
Availability plainwater 0.166 (0.082) 46.512 (7.989) 7.721 (4.038) −0.193 to 15.635 - 0.193 (0.070) 24.297 (9.047) 4.689 (2.438) −0.088 to 9.467 -
Permissiveness −0.471 (0.111) −7.866 (6.881) 3.705 (3.357) −2.874 to 10.284 - −0.208 (0.074) −13.552 (9.003) 2.819 (2.124) −1.345 to 6.982 -
Avoiding negativemodelling 0.136 (0.069) 0.183 (9.315) 0.025 (1.267) −2.458 to 2.508 - 0.146 (0.060) −13.490 (10.573) −1.970 (1.743) −5.386 to 1.447 -
Awareness 0.041 (0.114) 3.688 (5.558) 0.151 (0.478) −0.786 to 1.089 - 0.560 (0.104) −3.672 (5.955) −2.056 (3.357) −8.635 to 4.523 -
Encouragement 0.091 (0.049) 16.528 (13.049) 1.504 (1.437) −1.313 to 4.321 - 0.022 (0.040) 62.420 (16.189) 1.373 (2.522) −3.570 to 6.317 -
Rewarding −0.111 (0.052) 25.691 (11.269) −2.852 (1.830) −6.439 to 0.735 - −0.114 (0.048) 8.519 (13.636) −0.971 (1.607) −4.122 to 2.179 -
Lack of self-efficacy −0.086 (0.074) −53.431 (8.511) 4.595 (4.021) −3.286 to 12.476 - −0.126 (0.061) −14.569 (10.424) 1.836 (1.586) −1.273 to 4.944 -
Total - - 28.822 (7.913) 13.313 to 44.330 47.8 - - 7.116 (5.552) −3.766 to 17.998 -
Soft drinks
Availability softdrinks/prepacked FJ −0.366 (0.122) 6.070 (2.338) −2.222 (1.132) −4.440 to −0.004 8.7 −0.492 (0.086) 5.234 (1.202) −2.575 (0.743) −4.032 to −1.118 67.6
Availability plainwater 0.166 (0.082) −1.786 (2.930) −0.296 (0.508) −1.292 to 0.699 - 0.193 (0.070) 0.662 (1.336) 0.128 (0.262) −0.386 to 0.641 -
Permissiveness −0.471 (0.111) 11.060 (2.530) −5.209 (1.711) −8.563 to −1.856 20.5 −0.208 (0.074) 1.851 (1.328) −0.385 (0.308) −0.989 to 0.219 -
Avoiding negativemodelling 0.136 (0.069) −3.950 (3.407) −0.537 (0.538) −1.591 to 0.516 - 0.146 (0.060) 1.809 (1.561) 0.264 (0.252) −0.231 to 0.759 -
Nutrients 2016, 8, 591 13 of 19
Table 4. Cont.
Germany Greece
(n = 1139) (n = 1733)
Parenting Practices a † (SE) b ‡ (SE) ab § (SE) 95% CI of ab % MediatedEffect | a † (SE) b‡ (SE) ab § (SE) 95% CI of ab % Mediated
Effect |
Soft drinks
Awareness 0.041 (0.114) 3.697 (2.036) 0.152 (0.430) −0.691 to 0.994 - 0.560 (0.104) −3.600 (0.878) −2.016 (0.618) −3.227 to −0.805 52.9
Encouragement 0.091 (0.049) 1.683 (4.793) 0.153 (0.444) −0.717 to 1.023 - 0.022 (0.040) 4.831 (2.389) 0.106 (0.200) −0.286 to 0.499 -
Rewarding −0.111 (0.052) 10.193 (4.130) −1.131 (0.701) −2.505 to 0.242 - −0.114 (0.048) 5.227 (2.011) −0.596 (0.340) −1.262 to 0.070 -
Self-efficacy −0.086 (0.074) 0.443 (3.108) −0.038 (0.269) −0.566 to 0.490 - −0.126 (0.061) −0.547 (1.538) 0.069 (0.197) −0.316 to 0.454 -
Total - - −9.129 (1.899) −12.851 to −5.407 35.9 - - −5.005 (0.942) −6.851 to −3.159 131.4
Prepacked FJ
Availability softdrinks/prepacked FJ −0.366 (0.122) 16.400 (3.370) −6.002 (2.350) −10.609 to −1.396 71.1 −0.492 (0.086) 18.474 (2.552) −9.089 (2.025) −13.058 to −5.120 217.4
Availability plainwater 0.166 (0.082) −7.248 (4.219) −1.203 (0.919) −3.004 to 0.597 - 0.193 (0.070) 4.589 (2.883) 0.886 (0.634) −0.357 to 2.129 -
Permissiveness −0.471 (0.111) 6.426 (3.643) −3.027 (1.858) −6.669 to 0.165 - −0.208 (0.074) 6.686 (2.822) −1.391 (0.768) −2.895 to 0.114 -
Avoiding negativemodelling 0.136 (0.069) −3.391 (4.899) −0.461 (0.706) −1.845 to 0.923 - 0.146 (0.060) 1.1015 (3.311) 0.148 (0.487) −0.807 to 1.103 -
Awareness 0.041 (0.114) −8.335 (2.934) −0.342 (0.958) −2.219 to 1.536 - 0.560 (0.104) −9.032 (1.868) −5.058 (1.406) −7.814 to −2.302 121.0
Encouragement 0.091 (0.049) −2.379 (6.896) −0.216 (0.638) −1.468 to 1.035 - 0.022 (0.040) 5.465 (5.073) 0.120 (0.245) −0.361 to 0.601 -
Rewarding 0.111 (0.052) −15.956 (5.945) −1.771 (1.060) −3.849 to 0.307 - −0.114 (0.048) −1.094 (4.274) 0.125 (0.490) −0.836 to 1.085 -
Lack of self-efficacy −0.086 (0.074) 7.078 (4.472) −0.609 (0.650) −1.882 to 0.665 - −0.126 (0.061) −0.628 (3.267) 0.079 (0.413) −0.731 to 0.889 -
Total - - −13.631 (3.089) −19.686 to −7.577 161.4 - - −14.180 (2.381) −18.846 to −9.514 339.2
Poland Spain
(n = 1384) (n = 851)
Parenting Practices a † (SE) b ‡ (SE) ab § (SE) 95% CI of ab % MediatedEffect | a † (SE) b ‡ (SE) ab § (SE) 95% CI of ab % Mediated
Effect |
Plain water
Availability softdrinks/prepacked FJ −0.607 (0.122) −19.416 (6.719) 11.786 (4.716) 2.541 to 21.030 −52.2 −0.316 (0.119) −33.204 (9.262) 10.492 (4.917) 0.855 to 20.130 −72.9
Availability plainwater 0.308 (0.111) 57.431 (5.688) 17.689 (6.611) 4.731 to 30.647 −78.4 0.051 (0.078) 41.809 (11.830) 2.132 (3.316) −4.368 to 8.632 -
Permissiveness −0.536 (0.123) −21.935 (6.478) 11.757 (4.397) 3.139 to 20.376 −52.1 −0.325 (0.128) 5.594 (8.515) −1.818 (2.859) −7.421 to 3.785 -
Avoiding negativemodelling 0.418 (0.077) −6.202 (7.743) −2.592 (3.272) −9.005 to 3.820 - 0.148 (0.088) −12.604 (10.581) −1.865 (1.919) −5.627 to 1.896 -
Awareness 0.796 (0.125) 1.435 (4.611) 1.142 (3.675) −6.060 to 8.345 - 0.473 (0.145) −11.161 (6.626) −5.279 (3.527) −12.193 to 1.634 -
Nutrients 2016, 8, 591 14 of 19
Table 4. Cont.
Poland Spain
(n = 1384) (n = 851)
Parenting Practices a † (SE) b ‡ (SE) ab § (SE) 95% CI of ab % MediatedEffect | a † (SE) b ‡ (SE) ab § (SE) 95% CI of ab % Mediated
Effect |
Plain water
Encouragement 0.121 (0.058) 33.635 (10.731) 4.070 (2.343) −0.523 to 8.663 - 0.028 (0.057) 49.545 (16.011) 1.387 (2.859) −4.217 to 6.992 -
Rewarding −0.146 (0.063) 7.428 (8.688) −1.084 (1.352) −3.734 to 1.565 - −0.033 (0.057) 28.869 (16.076) −0.953 (1.729) −4.341 to 2.436 -
Lack of self-efficacy 0.031 (0.082) −26.286 (7.033) −0.815 (2.166) −5.061 to 3.431 - −0.140 (0.082) −30.859 (11.138) 4.320 (2.972) −1.505 to 10.146 -
Total - - 41.952 (90.098) 24.120 to 59.784 −186.0 - - 8.417 (7.826) −6.921 to 23.755 -
Soft drinks
Availability softdrinks/prepacked FJ −0.607 (0.122) 11.553 (5.164) −7.013 (3.437) −13.749 to −0.276 12.4 −0.316 (0.119) 3.963 (1.158) −1.252 (0.597) −2.422 to −0.082 34.0
Availability plainwater 0.308 (0.111) −20.685 (4.367) −6.371 (2.661) −11.587 to −1.155 11.2 0.051 (0.078) −1.601 (1.479) −0.082 (0.146) −0.368 to 0.204 -
Permissiveness −0.536 (0.123) 13.441 (4.979) −7.204 (3.139) −13.357 to −1.051 12.7 −0.325 (0.128) 0.147 (1.064) −0.048 (0.346) −0.727 to 0.631 -
Avoiding negativemodelling 0.418 (0.077) −7.722 (5.958) −3.228 (2.560) −8.246 to 1.791 - 0.148 (0.088) 0.109 (1.324) 0.016 (0.196) −0.368 to 0.401 -
Awareness 0.796 (0.125) 2.022 (3.543) 1.610 (2.832) −56.661 to 15.324 - 0.473 (0.145) −1.310 (0.829) −0.620 (0.436) −1.474 to 0.234 -
Encouragement 0.121 (0.058) 1.180 (8.245) 0.143 (1.000) −1.817 to 2.103 - 0.028 (0.057) −0.703 (2.002) −0.020 (0.069) −0.155 to 0.115 -
Rewarding −0.146 (0.063) 0.868 (6.681) −0.127 (0.977) −2.042 to 1.788 - −0.033 (0.057) 4.657 (2.010) −0.154 (0.274) −0.690 to 0.383 -
Lack of self-efficacy 0.031 (0.082) 18.526 (5.388) 0.574 (1.528) −2.421 to 3.570 - −0.140 (0.082) 1.740 (1.389) −0.244 (0.241) −0.716 to 0.229 -
Total - - −21.616 (4.973) −31.363 to −11.869 38.1 - - −2.402 (0.736) −3.844 to −0.960 65.3
Prepacked FJ
Availability softdrinks/prepacked FJ −0.607 (0.122) 25.879 (4.361) −15.709 (4.120) −23.784 to −7.633 85.1 −0.316 (0.119) 15.517 (3.355) −4.903 (2.129) −9.077 to −0.730 35.9
Availability plainwater 0.308 (0.111) −8.804 (3.691) −2.712 (1.499) −5.650 to 0.227 - 0.051 (0.078) 7.612 (4.281) 0.388 (0.633) −0.852 to 1.628 -
Permissiveness −0.536 (0.123) 9.648 (4.205) −5.171 (2.547) −10.164 to −0.179 28.0 −0.325 (0.128) 4.072 (3.085) −1.323 (1.130) −3.538 to 0.891 -
Avoiding negativemodelling 0.418 (0.077) 9.848 (5.028) 4.116 (2.234) −0.263 to 8.496 - 0.148 (0.088) 2.492 (3.829) 0.369 (0.608) −0.822 to 1.560 -
Awareness 0.796 (0.125) −9.656 (2.993) −7.686 (2.671) −12.921 to −2.452 41.7 0.473 (0.145) −8.826 (2.398) −4.175 (1.710) −7.526 to −0.823 30.5
Encouragement 0.121 (0.058) 2.761 (6.965) 0.334 (0.858) −1.347 to 2.015 - 0.028 (0.057) 1.977 (5.791) 0.055 (0.197) −0.332 to 0.442 -
Rewarding −0.146 (0.063) −18.721 (5.641) 2.733 (1.439) −0.086 to 5.553 - −0.033 (0.057) 1.356 (5.808) −0.045 (0.207) −0.450 to 0.360 -
Lack of self-efficacy 0.031 (0.082) 6.325 (4.559) 0.196 (0.538) −0.858 to 1.250 - −0.140 (0.082) 8.454 (4.018) −1.184 (0.893) −2.933 to 0.566 -
Total - - −23.898 (4.961) −33.621 to −14.175 129.5 - - −10.817 (2.770) −16.247 to −5.388 79.1
SE = standard error, CI = confidence interval, FJ = fruit juice; All significant associations are presented in bold font; † a-coefficients: Associations between SES and potential mediators;‡ b-coefficients: Associations between potential mediators (parenting practices) and beverage intake controlled for SES; § ab-coefficients: Mediating effect of parenting practices on theassociations between SES and beverage intake; | Percentage mediated effect was not calculated if the mediation effect was not significant.
Nutrients 2016, 8, 591 15 of 19
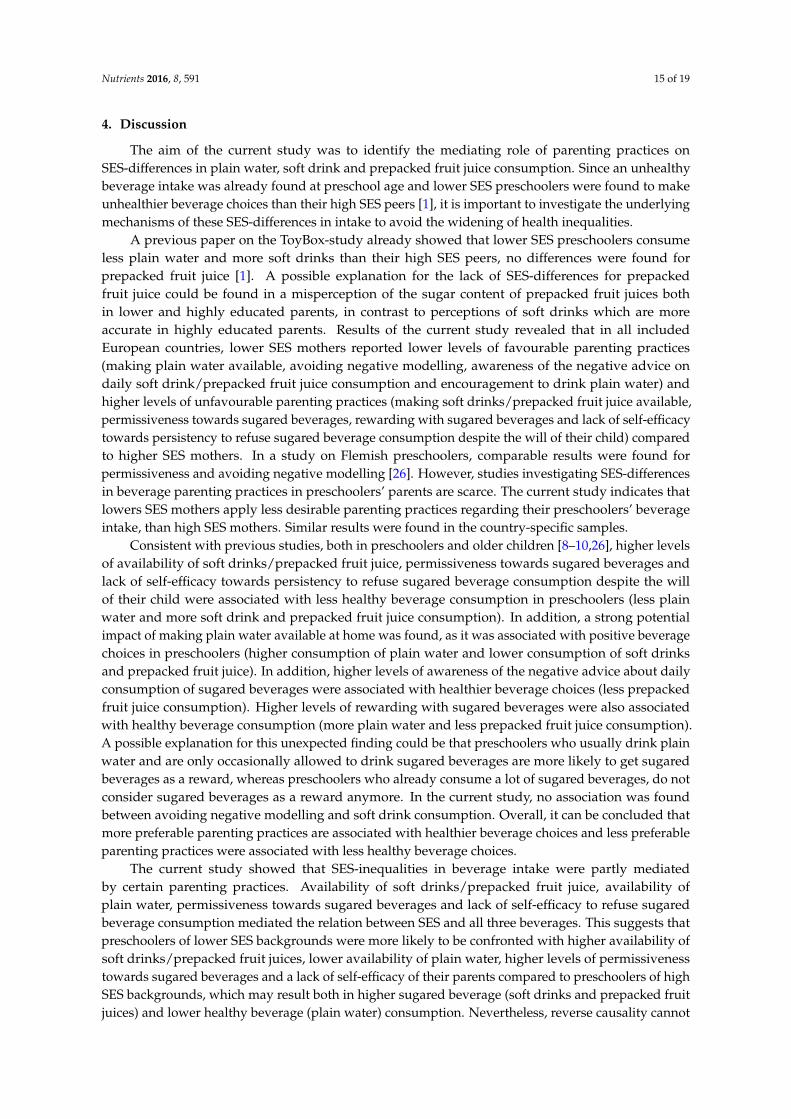
4. Discussion
The aim of the current study was to identify the mediating role of parenting practices onSES-differences in plain water, soft drink and prepacked fruit juice consumption. Since an unhealthybeverage intake was already found at preschool age and lower SES preschoolers were found to makeunhealthier beverage choices than their high SES peers [1], it is important to investigate the underlyingmechanisms of these SES-differences in intake to avoid the widening of health inequalities.
A previous paper on the ToyBox-study already showed that lower SES preschoolers consumeless plain water and more soft drinks than their high SES peers, no differences were found forprepacked fruit juice [1]. A possible explanation for the lack of SES-differences for prepackedfruit juice could be found in a misperception of the sugar content of prepacked fruit juices bothin lower and highly educated parents, in contrast to perceptions of soft drinks which are moreaccurate in highly educated parents. Results of the current study revealed that in all includedEuropean countries, lower SES mothers reported lower levels of favourable parenting practices(making plain water available, avoiding negative modelling, awareness of the negative advice ondaily soft drink/prepacked fruit juice consumption and encouragement to drink plain water) andhigher levels of unfavourable parenting practices (making soft drinks/prepacked fruit juice available,permissiveness towards sugared beverages, rewarding with sugared beverages and lack of self-efficacytowards persistency to refuse sugared beverage consumption despite the will of their child) comparedto higher SES mothers. In a study on Flemish preschoolers, comparable results were found forpermissiveness and avoiding negative modelling [26]. However, studies investigating SES-differencesin beverage parenting practices in preschoolers’ parents are scarce. The current study indicates thatlowers SES mothers apply less desirable parenting practices regarding their preschoolers’ beverageintake, than high SES mothers. Similar results were found in the country-specific samples.
Consistent with previous studies, both in preschoolers and older children [8–10,26], higher levelsof availability of soft drinks/prepacked fruit juice, permissiveness towards sugared beverages andlack of self-efficacy towards persistency to refuse sugared beverage consumption despite the willof their child were associated with less healthy beverage consumption in preschoolers (less plainwater and more soft drink and prepacked fruit juice consumption). In addition, a strong potentialimpact of making plain water available at home was found, as it was associated with positive beveragechoices in preschoolers (higher consumption of plain water and lower consumption of soft drinksand prepacked fruit juice). In addition, higher levels of awareness of the negative advice about dailyconsumption of sugared beverages were associated with healthier beverage choices (less prepackedfruit juice consumption). Higher levels of rewarding with sugared beverages were also associatedwith healthy beverage consumption (more plain water and less prepacked fruit juice consumption).A possible explanation for this unexpected finding could be that preschoolers who usually drink plainwater and are only occasionally allowed to drink sugared beverages are more likely to get sugaredbeverages as a reward, whereas preschoolers who already consume a lot of sugared beverages, do notconsider sugared beverages as a reward anymore. In the current study, no association was foundbetween avoiding negative modelling and soft drink consumption. Overall, it can be concluded thatmore preferable parenting practices are associated with healthier beverage choices and less preferableparenting practices were associated with less healthy beverage choices.
The current study showed that SES-inequalities in beverage intake were partly mediatedby certain parenting practices. Availability of soft drinks/prepacked fruit juice, availability ofplain water, permissiveness towards sugared beverages and lack of self-efficacy to refuse sugaredbeverage consumption mediated the relation between SES and all three beverages. This suggests thatpreschoolers of lower SES backgrounds were more likely to be confronted with higher availability ofsoft drinks/prepacked fruit juices, lower availability of plain water, higher levels of permissivenesstowards sugared beverages and a lack of self-efficacy of their parents compared to preschoolers of highSES backgrounds, which may result both in higher sugared beverage (soft drinks and prepacked fruitjuices) and lower healthy beverage (plain water) consumption. Nevertheless, reverse causality cannot
Nutrients 2016, 8, 591 16 of 19
be ruled out due to the cross-sectional nature of the study. Avoiding negative modelling was theonly non-significant mediator in all three beverages, suggesting that this parenting practice plays noimportant role in explaining SES-differences in preschoolers’ beverage intake. In addition, in the studyon soft drinks in Flemish preschoolers of De Coen and colleagues (2012) [9], availability of soft drinksand permissiveness towards sugared beverages were found as important mediators, while avoidingnegative modelling was also found as a non-significant mediator in the relation between SES andsoft drinks. Awareness of the negative advice on daily soft drink/prepacked fruit juice consumptiononly mediated SES-inequalities in prepacked fruit juice consumption, not in plain water and softdrink consumption. This could suggest that lower SES preschoolers were more likely to have parentswho are not aware of the recommendation to limit sugared beverage intake, only resulting in higherconsumption of prepacked fruit juice consumption. A possible explanation could be found in thefact that awareness about plain water and soft drink consumption is higher than awareness aboutprepacked fruit juice consumption, resulting in a lower impact of awareness on SES-differences inplain water and soft drink consumption compared to prepacked fruit juice consumption. Parents arealready aware of the importance of consuming plain water and avoiding soft drink intake in a healthydiet, but are not aware of the high sugar level in prepacked fruit juice [8]. Furthermore, encouragementto drink plain water was only a significant mediator explaining differences in plain water consumption.This suggests that lower SES preschoolers were less likely to be encouraged to drink plain water bytheir mothers than high SES preschoolers, which may result in lower plain water consumption in lowerSES preschoolers, not higher sugared beverage intake. Rewarding with sugared beverages mediatedthe relation between SES and plain water and prepacked fruit juice consumption, but not soft drinkintake. To limit the widening of health inequalities, availability at home seems to be most importantparenting practice to work on, both in healthy and unhealthy beverages, followed by increasingself-efficacy to be persistent in refusing sugared beverage consumption and decreasing permissivenesstowards sugared beverages. In addition, in older children (Dutch 11 years old), availability of softdrinks was found as an important mediator in the relation between maternal education and soft drinksconsumption [27]. Although SES as such cannot be altered, parenting practices can be modified. It iscrucial for lower SES parents to master the parenting practices that are found to be important to tackleSES-inequalities in preschoolers’ beverage intake, more specifically availability of both healthy andunhealthy beverages, permissiveness and lack of self-efficacy for all three beverages, rewarding forplain water and prepacked fruit juice, encouragement for plain water and awareness for prepackedfruit juice. Thus, targeting the home environment in lower SES households should already start atyoung age in order to prevent health inequalities at later age.
Mixed results were found in the country-specific samples. Nevertheless, availability of softdrinks/prepacked fruit juice was found to be the most univocal mediator of the association betweenSES and beverage intake, which underlines the importance of advocating limiting the availability ofsugared beverages, especially at lower SES parents’ homes in order to tackle inequalities in beverageintake by SES across Europe. Similar results were found in a study among 10 to 12 years oldof eight European countries, where availability was also found as the most persistent parentingpractice after stratification to explain the relation between SES inequalities and soft drink/prepackedfruit juice consumption [26]. In addition, the HBSC study, a large-scale study investigating timetrends and correlates of soft drinks in twenty-four European countries, found that the availabilityof soft drinks is steadily and significantly increasing especially in lower SES households [28].Consequently, decreasing the availability of unhealthy drinks in all European households with a focuson lower SES families is essential. Since literature on parental practices as a possible mediator inthe association between SES and beverage intake in preschoolers is scarce, future studies shouldinvestigate the mediating role of parenting practices in the relationship between SES and both healthyand unhealthy beverages in preschoolers in more detail, for instance by including more parentingpractices and more beverages (such as plain and sugared milk) and by using longitudinal data.
Nutrients 2016, 8, 591 17 of 19
In addition, future intervention studies should study the effect of changing parenting practices onbeverage intake in preschool children.
Limitations of the current study should be acknowledged. The data are self-reported whichmay result in social desirability. However, this was partially covered by ensuring anonymity.The cross-sectional nature of the design does not permit the examination of causality of theinvestigated relationships. We acknowledge that the ToyBox-sample is not a fully representativeEuropean sample, due to sampling in specific regions in each country. Samples included preschoolersof low, medium and high SES backgrounds and in each kindergarten (almost) complete classeswere included. The samples can give a fair approximation of the average situation in each country.The procedure of sampling in specific regions has also been used in several other European studies suchas HELENA and ENERGY [29,30]. Rewarding was operationalized in a single-item question asking forboth instrumental and emotional feeding. However, instrumental and emotional feeding are not alwaysrelated. It would be interesting to study this parenting practice in more detail by looking into differencesbetween using food in between meals to regulate a child’s emotions (emotional feeding) and usingfood as a reward or withholding food as a punishment (instrumental feeding) [31]. Awareness andlack of self-efficacy may be regarded as precursors of parenting practices instead of actual parentalbehaviours. Future research should study these factors as potential precursors of the actual behaviour,which can lead to interesting findings.
A major strength of this study is the large sample of preschoolers from six European countriesand the standardized data collection protocol across the different countries. In addition, to ourknowledge, this is the first study that examined the mediating role of eight different parenting practicesexplaining differences in both European preschoolers’ healthy and unhealthy beverage consumptionby socioeconomic status.
5. Conclusions
The current study highlighted the importance of parenting practices, especially availability ofhealthy and unhealthy beverages at home, permissiveness towards sugared beverages and lackof self-efficacy to refuse sugared beverage consumption, in explaining the relation between SESand consumption of both healthy and unhealthy beverages. Teaching low SES parents to makehealthy beverages available at home, to decrease the availability of sugared beverages at home,to set rules regarding sugared beverages consumption at home and to increase their self-efficacy tomaintain these rules might lower the gap in healthy beverage consumption of preschoolers of differentSES backgrounds.
Acknowledgments: The ToyBox-study is funded by the Seventh Framework Programme (CORDIS FP7) ofthe European Commission under grant agreement No. 245200. The content of this article reflects only theauthors’ views and the European Community is not liable for any use that may be made of the informationcontained therein. The ToyBox-study group consists of: Co-ordinator: Yannis Manios; Steering Committee:Yannis Manios, Berthold Koletzko, Ilse De Bourdeaudhuij, Mai Chin A Paw, Luis Moreno, Carolyn Summerbell,Tim Lobstein, Lieven Annemans, Goof Buijs; External Advisors: John Reilly, Boyd Swinburn, Dianne Ward;Harokopio University (Greece): Yannis Manios, Odysseas Androutsos, Eva Grammatikaki, Christina Katsarou,Eftychia Apostolidou, Eirini Efstathopoulou, Paraskevi-Eirini Siatitska, Angeliki Giannopoulou, Effie Argyri,Konstantina Maragkopoulou, Athanasios Douligeris; Ludwig Maximilians Universitaet Muenchen (Germany):Berthold Koletzko, Kristin Duvinage, Sabine Ibrügger, Angelika Strauß, Birgit Herbert, Julia Birnbaum,Annette Payr, Christine Geyer; Ghent University (Belgium): Department of Movement and Sports Sciences:Ilse De Bourdeaudhuij, Greet Cardon, Marieke De Craemer, Ellen De Decker and Department of PublicHealth: Lieven Annemans, Stefaan De Henauw, Lea Maes, Carine Vereecken, Jo Van Assche, Lore Pil;VU University Medical Center EMGO Institute for Health and Care Research (The Netherlands): EMGOInstitute for Health and Care Research: Mai Chin A Paw, Saskia te Velde; University of Zaragoza(Spain): Luis Moreno, Theodora Mouratidou, Juan Fernandez, Maribel Mesana, Pilar De Miguel-Etayo,Esther González, Luis Gracia-Marco, Beatriz Oves; Oslo and Akershus University College of Applied Sciences(Norway): Agneta Yngve, Susanna Kugelberg, Christel Lynch, Annhild Mosdøl; University of Durham(UK): Carolyn Summerbell, Helen Moore, Wayne Douthwaite, Catherine Nixon; State Institute of EarlyChildhood Research (Germany): Susanne Kreichauf, Andreas Wildgruber; Children’s Memorial HealthInstitute (Poland): Piotr Socha, Zbigniew Kulaga, Kamila Zych, Magdalena Gózdz, Beata Gurzkowska,Katarzyna Szott; Medical University of Varna (Bulgaria): Violeta Iotova, Mina Lateva, Natalya Usheva,
Nutrients 2016, 8, 591 18 of 19
Sonya Galcheva, Vanya Marinova, Zhaneta Radkova, Nevyana Feschieva; International Association for theStudy of Obesity (UK): Tim Lobstein, Andrea Aikenhead; National Institute for Health Promotion and DiseasePrevention (The Netherlands): Goof Buijs, Annemiek Dorgelo, Aviva Nethe, Jan Jansen; AOK-Verlag (Germany):Otto Gmeiner, Jutta Retterath, Julia Wildeis, Axel Günthersberger; Roehampton University (UK): Leigh Gibson;University of Luxembourg (Luxembourg): Claus Voegele.
Author Contributions: All authors, except for B.D., W.V.L. and A.P., participated in the ToyBox-study and in thestudy design. All authors read, critically reviewed the manuscript and approved the final manuscript. A.P. wrotethe manuscript.
Conflicts of Interest: The authors declare no conflict of interest.
References
1. Pinket, A.S.; De Craemer, M.; Maes, L.; De Bourdeaudhuij, I.; Cardon, G.; Androutsos, O.; Koletzko, B.;Moreno, L.; Socha, P.; Iotova, V.; et al. Water intake and beverage consumption of preschoolers fromsix European countries and associations with socio-economic status: The ToyBox-study. Public Health Nutr.2015, 18, 1–11.
2. DeBoer, M.D.; Scharf, R.J.; Demmer, R.T. Sugar-sweetened beverages and weight gain in 2- to 5-year-oldchildren. Pediatrics 2013, 132, 413–420. [CrossRef] [PubMed]
3. De Ruyter, J.C.; Olthof, M.R.; Seidell, J.C.; Katan, M.B. A trial of sugar-free or sugar-sweetened beveragesand body weight in children. N. Engl. J. Med. 2012, 367, 1397–1406. [CrossRef] [PubMed]
4. Craigie, A.M.; Lake, A.A.; Kelly, S.A.; Adamson, A.J.; Mathers, J.C. Tracking of obesity-related behavioursfrom childhood to adulthood: A systematic review. Maturitas 2011, 70, 266–284. [CrossRef] [PubMed]
5. Ventura, A.K.; Birch, L.L. Does parenting affect children’s eating and weight status? Int. J. Behav. Nutr.Phys. Act. 2008, 5, 15. [CrossRef] [PubMed]
6. Maccoby, E.D.; Martin, J.A. Socialization in the context of the family: Parent-child interaction. In Socialization,Personality and Social Development; Mussen, P.H., Hetherington, E.M., Eds.; Wiley: New York, NY, USA, 1983;Volume 4.
7. Darling, N.; Steinberg, L. Parenting style as context: An integrative model. Psychol. Bull. 1993, 113, 487–496.[CrossRef]
8. Van Lippevelde, W.; te Velde, S.J.; Verloigne, M.; De Bourdeaudhuij, I.; Manios, Y.; Bere, E.; Jan, N.;Fernández-Alvira, J.M.; Chinapaw, M.J.; Bringolf-Isler, B.; et al. Associations between home- and family-related factors and fruit juice and soft drink intake among 10- to 12-year old children. The ENERGY project.Appetite 2013, 61, 59–65. [CrossRef] [PubMed]
9. De Coen, V.; Vansteelandt, S.; Maes, L.; Huybrechts, I.; De Bourdeaudhuij, I.; Vereecken, C. Parentalsocioeconomic status and soft drink consumption of the child. The mediating proportion of parentingpractices. Appetite 2012, 59, 76–80. [CrossRef] [PubMed]
10. Grimm, G.C.; Harnack, L.; Story, M. Factors associated with soft drink consumption in school-aged children.J. Am. Diet. Assoc. 2004, 104, 1244–1249. [CrossRef] [PubMed]
11. Park, S.; Li, R.; Birch, L. Mothers’ child-feeding practices are associated with children’s sugar-sweetenedbeverage intake. J. Nutr. 2015, 145, 806–812. [CrossRef] [PubMed]
12. Van der Horst, K.; Kremers, S.; Ferreira, I.; Singh, A.; Oenema, A.; Brug, J. Perceived parenting style andpractices and the consumption of sugar-sweetened beverages by adolescents. Health Educ. Res. 2007,22, 295–304. [CrossRef] [PubMed]
13. Van Grieken, A.; Renders, C.M.; van de Gaar, V.M.; Hirasing, R.A.; Raat, H. Associations between the homeenvironment and children’s sweet beverage consumption at 2-year follow-up: The ‘Be active, eat right’ study.Pediatr. Obes. 2015, 10, 126–133. [CrossRef] [PubMed]
14. Summerbell, C.D.; Walters, E.; Edmunds, L.; Kelly, S.; Brown, T.; Campbell, K.J. Interventions for preventingobesity in children. Cochrane Database Syst. Rev. 2005, CD001871. [CrossRef]
15. MacFarlane, A.; Crawford, D.; Ball, K.; Savige, G.; Worsley, A. Adolescent home food environment andsocio-economic position. Asia Pac. J. Clin. Nutr. 2007, 16, 748–756. [PubMed]
16. Manios, Y.; Grammatikaki, E.; Androutsos, O.; Chinapaw, M.J.; Gibson, E.L.; Buijs, G.; Iotova, V.; Socha, P.;Annemans, L.; Wildgruber, A.; et al. A systematic approach for the development of a kindergarten-basedintervention for the prevention of obesity in preschool age children: The ToyBox-study. Obes. Rev. 2012,13, 3–12. [CrossRef] [PubMed]
Nutrients 2016, 8, 591 19 of 19
17. Manios, Y.; Androutsos, O.; Katsarou, C.; Iotova, V.; Socha, P.; Geyer, C.; Moreno, L.; Koletzko, B.;De Bourdeaudhuij, I. Designing and implementing a kindergarten-based, family-involved intervention toprevent obesity in early childhood: The ToyBox-study. Obes. Rev. 2014, 15, 5–13. [CrossRef] [PubMed]
18. Mouratidou, T.; Miguel, M.L.; Androutsos, O.; Manios, Y.; De Bourdeaudhuij, I.; Cardon, G.; Kulaga, Z.;Socha, P.; Galcheva, S.; Iotova, V.; et al. Tools, harmonization and standardization procedures of the impactand outcome evaluation indices obtained during a kindergarten-based, family-involved intervention toprevent obesity in early childhood: The ToyBox-study. Obes. Rev. 2014, 15, 53–60. [CrossRef] [PubMed]
19. Williams, S.K.; Kelly, F.D. Relationships among involvement, attachment, and behavioral problems inadolescence: Examining father’s influence. J. Early Adolesc. 2005, 25, 168–196.
20. De Coen, V.; De Bourdeaudhuij, I.; Verbestel, V.; Maes, L.; Vereecken, C. Risk factors for childhood overweight:A 30-month longitudinal study of 3- to 6-year-old children. Public Health Nutr. 2014, 17, 1993–2000. [CrossRef][PubMed]
21. Brug, J.; van Stralen, M.M.; te Velde, S.J.; Chinapaw, M.J.; De Bourdeaudhuij, I.; Lien, N.; Bere, E.; Maskini, V.;Singh, A.S.; Maes, L.; et al. Differences in weight status and energy-balance related behaviors amongschoolchildren across Europe: The ENERGY-project. PLoS ONE 2012, 7, e34742.
22. Singh, A.S.; Chinapaw, M.J.; Uijtdewilligen, L.; Vik, F.N.; van Lippevelde, W.; Fernández-Alvira, J.M.Test-retest reliability and construct validity of the ENERGY-parent questionnaire on parenting practices,energy balance-related behaviours and their potential behavioural determinants: The ENERGY-project.BMC Res. Notes 2012, 5, 434. [PubMed]
23. González-Gil, E.M.; Mouratidou, T.; Cardon, G.; Androutsos, O.; De Bourdeaudhuij, I.; Gózdz, M.; Usheva, N.;Birnbaum, J.; Manios, Y.; Moreno, L.A.; et al. Reliability of primary caregivers reports on lifestyle behavioursof European pre-school children: The ToyBox-study. Obes. Rev. 2014, 15, 61–66. [CrossRef] [PubMed]
24. Huybrechts, I.; De Backer, G.; De Bacquer, D.; Maes, L.; De Henauw, S. Relative validity and reproducibilityof a food-frequency questionnaire for estimating food intakes among Flemish preschoolers. Int. J. Environ.Res. Public Health 2009, 6, 382–399. [CrossRef] [PubMed]
25. MacKinnon, D.P. Introduction to Statistical Mediation Analysis; Erlbaum: New York, NY, USA, 2008.26. Vereecken, C.A.; Keukelier, E.; Maes, L. Influence of mother’s educational level on food parenting practices
and food habits of young children. Appetite 2009, 43, 93–103. [CrossRef] [PubMed]27. Van Ansem, W.J.C.; Van Lenthe, F.J.; Schrijvers, C.T.M.; Rodenburg, G.; van de Mheen, D. Socio-economic
inequalities in children’s snack consumption and sugar-sweetened beverage consumption: The contributionof home environmental factors. Br. J. Nutr. 2014, 112, 467–476. [CrossRef] [PubMed]
28. Naska, A.; Bountziouka, V.; Trichopoulou, A. Soft drinks: Time trends and correlates in twenty-four Europeancountries. A cross-national study using the DAFNE (Data Food Networking) databank. Public Health Nutr.2010, 13, 1346–1355. [CrossRef] [PubMed]
29. Moreno, L.A.; De Henauw, S.; González-Gross, M.; Kersting, M.; Molnár, D.; Gottrand, F.; Barrios, L.;Sjöström, M.; Manios, Y.; Gilbert, C.C.; et al. Design and implementation of the Healthy Lifestyle in Europeby Nutrition in Adolescence Cross-Sectional Study. Int. J. Obes. 2008, 32, 5–11. [CrossRef] [PubMed]
30. Van Stralen, M.M.; te Velde, S.J.; Singh, A.S.; De Bourdeaudhuij, I.; Martens, M.K.; van der Sluis, M.;Manios, Y.; Grammatikaki, E.; Chinapaw, M.J.M.; Maes, L.; et al. European Energy balance Research toprevent excessive weight Gain among Youth (ENERGY) project: Design and methodology of the ENERGYcross-sectional survey. BMC Public Health 2011, 11, 65. [CrossRef] [PubMed]
31. Raaijmakers, L.G.; Gevers, D.W.; Teuscher, D.; Kremers, S.P.; van Assema, P. Emotional and instrumentalfeeding practices of Dutch mothers regarding foods eaten between main meals. BMC Public Health 2014,14, 171. [CrossRef] [PubMed]
© 2016 by the authors; licensee MDPI, Basel, Switzerland. This article is an open accessarticle distributed under the terms and conditions of the Creative Commons Attribution(CC-BY) license (http://creativecommons.org/licenses/by/4.0/).
Related Documents