1 Can Educational Voucher Programs Pay for Themselves? By ERIC BETTINGER, MICHAEL KREMER, MAURICE KUGLER, CARLOS MEDINA, CHRISTIAN POSSO AND JUAN E. SAAVEDRA* August 15, 2017 In the 1990s Colombia awarded private secondary school scholarships to socially disadvantaged students via lotteries. Using administrative data up to twenty years after the scholarship lottery, we document that lottery winners are less likely to repeat grades, more likely to graduate from secondary school on time or ever, and more likely to start and complete tertiary education. Tertiary education impacts are strongest among students who initially applied to attend vocational secondary schools. Scholarships reduce teen fertility although there is no significant effect on overall fertility at age 30. Social security data suggests that twenty years after the scholarship lottery, average annual formal earnings for lottery winners near age 33 are 8 percent greater than those for losers. Formal-sector earnings effects are entirely driven by vocational school applicants, among whom lottery winners earn 17 percent more than losers. Lottery winners, particularly those who applied to vocational schools have greater access to formal consumer credit, better credit scores, and are more likely to have taken out car loans, a sign of entry to the middle class. The expected net present value of increased net tax receipts due to the program likely exceeds its fiscal cost, implying that the program was welfare improving unless net externalities were large and negative. _____________________ * Bettinger: Stanford Graduate School of Education, 522 CERAS, 520 Galvez Mall, Stanford, CA 94305 (e-mail: [email protected]); Kremer: Harvard University Department of Economics, Littauer Center, Cambridge MA 02138 (email: [email protected]); Kugler: Impaq International, 10420 Little Patuxent Parkway, Suite 300, Columbia, MD 21044 (email: [email protected]); Medina and Posso: Banco de la República de Colombia, Calle 50 # 50-21, Medellín, Colombia (email: [email protected], [email protected]); Saavedra: University of Southern California, Dornsife Center for Economic and Social Research 12015 Waterfront Drive, Playa Vista CA 90094 (email: [email protected]). We are grateful to Colombia’s Ministry of Social Protection, particularly Dolly E. Ovalle, Edgar Mariño, Esperanza Gutiérrez and Luz Emilse Rincón, the Ministry of Education, the Department of National Planning, and the Instituto Colombiano para la Evaluación de la Educación Superior (ICFES) for generously providing access to data. We thank Luis Omar Herrera and Arlen Guarín for excellent research assistance. We thank Rossa O’Keefe and seminar participants at BREAD, World Bank, Harvard, MIT, Chicago Michigan, Aarhus, UCLA, LSE, Universidad de los Andes in Colombia, RAND Corporation, UC Irvine, LACEA, Society for Research on Educational Effectiveness, University of Arkansas, University of Texas, Austin, University of Michigan, NBER Economics of Education, the 3rd Economics PhD Alumni Conference, the 11th World Congress of the Econometric Society, Banco de la República in Bogotá and Cartagena, for helpful comments and suggestions. Saavedra acknowledges financial support from the National Institutes of Health RCMAR Grant P30AG043073), Universidad de los Andes and the World Bank. The views expressed in this document are solely those of the authors and do not reflect the views of Banco de la República de Colombia or its Board of Directors.

Welcome message from author
This document is posted to help you gain knowledge. Please leave a comment to let me know what you think about it! Share it to your friends and learn new things together.
Transcript
1
Can Educational Voucher Programs Pay for Themselves?
By ERIC BETTINGER, MICHAEL KREMER, MAURICE KUGLER, CARLOS MEDINA,
CHRISTIAN POSSO AND JUAN E. SAAVEDRA*
August 15, 2017
In the 1990s Colombia awarded private secondary school scholarships to socially disadvantaged students via
lotteries. Using administrative data up to twenty years after the scholarship lottery, we document that lottery
winners are less likely to repeat grades, more likely to graduate from secondary school on time or ever, and more
likely to start and complete tertiary education. Tertiary education impacts are strongest among students who
initially applied to attend vocational secondary schools. Scholarships reduce teen fertility although there is no
significant effect on overall fertility at age 30. Social security data suggests that twenty years after the scholarship
lottery, average annual formal earnings for lottery winners near age 33 are 8 percent greater than those for
losers. Formal-sector earnings effects are entirely driven by vocational school applicants, among whom lottery
winners earn 17 percent more than losers. Lottery winners, particularly those who applied to vocational schools
have greater access to formal consumer credit, better credit scores, and are more likely to have taken out car
loans, a sign of entry to the middle class. The expected net present value of increased net tax receipts due to the
program likely exceeds its fiscal cost, implying that the program was welfare improving unless net externalities
were large and negative.
_____________________
* Bettinger: Stanford Graduate School of Education, 522 CERAS, 520 Galvez Mall, Stanford, CA 94305 (e-mail:
[email protected]); Kremer: Harvard University Department of Economics, Littauer Center, Cambridge
MA 02138 (email: [email protected]); Kugler: Impaq International, 10420 Little Patuxent Parkway, Suite
300, Columbia, MD 21044 (email: [email protected]); Medina and Posso: Banco de la República de
Colombia, Calle 50 # 50-21, Medellín, Colombia (email: [email protected], [email protected]);
Saavedra: University of Southern California, Dornsife Center for Economic and Social Research 12015 Waterfront
Drive, Playa Vista CA 90094 (email: [email protected]). We are grateful to Colombia’s Ministry of Social
Protection, particularly Dolly E. Ovalle, Edgar Mariño, Esperanza Gutiérrez and Luz Emilse Rincón, the Ministry
of Education, the Department of National Planning, and the Instituto Colombiano para la Evaluación de la
Educación Superior (ICFES) for generously providing access to data. We thank Luis Omar Herrera and Arlen
Guarín for excellent research assistance. We thank Rossa O’Keefe and seminar participants at BREAD, World
Bank, Harvard, MIT, Chicago Michigan, Aarhus, UCLA, LSE, Universidad de los Andes in Colombia, RAND
Corporation, UC Irvine, LACEA, Society for Research on Educational Effectiveness, University of Arkansas,
University of Texas, Austin, University of Michigan, NBER Economics of Education, the 3rd Economics PhD
Alumni Conference, the 11th World Congress of the Econometric Society, Banco de la República in Bogotá and
Cartagena, for helpful comments and suggestions. Saavedra acknowledges financial support from the National
Institutes of Health RCMAR Grant P30AG043073), Universidad de los Andes and the World Bank. The views
expressed in this document are solely those of the authors and do not reflect the views of Banco de la República
de Colombia or its Board of Directors.
2
1. Introduction
In many low-income countries access to primary education is becoming close to
universal. As more students transition into secondary schooling, there is increasing pressure to
expand capacity. Expanding public secondary schooling is expensive, however, and in many
countries there has been considerable private sector growth. Some question how much of the
new cohorts of primary school graduates from disadvantaged background are equipped for
secondary education, and there is renewed interest in the potential for vocational education.
In this paper we present evidence from Colombia’s experience in the 1990s to suggest
that at least in that context the private sector was used to expand access to secondary education
for disadvantaged populations at low or possibly negative fiscal cost to taxpayers. Participants
greatly increased their chance of transitioning to the middle class, as defined by increased
tertiary education, greater formal sector earnings, a higher fraction of formal earners above a
middle-class earnings threshold, and a higher likelihood of having taken out a car loan. Our
evidence indicates that access to private vocational education may have played a key role.
During the 1990s, Colombia’s PACES program provided more than 125,000
scholarships to allow disadvantaged students to attend private schools. The program’s goal was
to expand capacity to accommodate large numbers of public elementary-school students for
whom public secondary-school slots were limited.
In order to estimate the fiscal impact, we first need to assess the impact of the program
on beneficiaries and on taxpayers. To do so, we take advantage of a lottery used to allocate
scholarships, as well as a unique dataset compiled from five different sources of Colombian
administrative data, to document the impact of receiving these scholarships on educational,
family formation, and labor market outcomes up to 20 years after initial scholarship award,
when applicants were near age 33. We then use these data to estimate the fiscal impact of the
program. As in Bettinger, Kremer and Saavedra (2010), we pay close attention to impacts
among the subpopulation of vocational school applicants.
In terms of impacts on beneficiaries, we find that lottery winners are more likely to have
graduated from secondary school on schedule and more likely to have ever graduated from
secondary school. They are also more likely to have attended tertiary education at some point.
Scholarship impacts at the tertiary level are entirely driven by applicants who prior to the lottery
had applied to attend vocational secondary schools. In this “vocational lottery applicants”

3
subpopulation, lottery winners are also more likely to complete tertiary education. There is also
some heterogeneity by gender, as the secondary school increased women’s enrollment primarily
in five-year universities and men’s enrollment in two-year vocational institutions.
Winning the lottery did not increase the probability of working in the formal sector or
the number of formal-sector days worked per year, so there is no evidence that people moved
from the informal to the formal sector. However, point estimates of the scholarship’s impact on
total formal sector earnings at around age 33 suggest that lottery winners have 8 percent greater
formal sector earnings than scholarship lottery losers (p-value = 0.06). Impacts among
vocational applicants entirely drive scholarship effects on formal earnings: vocational lottery
winners have 17 percent greater formal sector earnings than vocational lottery losers. This is
not completely surprising given that prior work (Bettinger, Kremer, Saavedra 2010) finds that
short-run educational impacts were much larger among vocational lottery winners than the
impacts among non-vocational lottery winners. An accounting exercise suggests that about 40
percent of the scholarship’s impact on total formal sector earnings can be attributed to additional
completed schooling among scholarship winners, with the remaining roughly 60 percent due to
increased earnings conditional on years of completed schooling.
Effects seem concentrated in the upper quantiles of the earnings distribution, and we see
no effect on eligibility for welfare benefits. At the top of the earnings distribution, scholarship
winners are working in formal jobs XXXX. The probability of living in a neighborhood
classified in one of Colombia’s lower two strata falls, but the difference is not statistically
significant. Since data on informal income is only available through a census of residents of
these neighborhoods, we can only bound and not estimate differences in informal income, but
accounting for informal income seems unlikely to change the overall picture.
Winning a scholarship also increases access to formal consumer credit, better credit
ratings and a greater likelihood of obtaining a car loan, which is a good proxy for car ownership
in Colombia. Similar to results on formal earnings, impacts among vocational applicants
entirely drive scholarship effects on consumer credit.
We estimate tight bounds for the effect of winning a scholarship on teen fertility that
indicate that winning the lottery reduces the incidence of teen childbearing, particularly among
applicants to academic secondary schools. Bounds for the effect on total fertility are precisely
estimated and consistent with the scholarship having no effect on total fertility as of age 30.

4
This result is consistent with the notion that the teen fertility effect we observe is mostly an
“incarceration” or “delay” effect rather than an opportunity-cost effect.
After demonstrating the long-term impacts of the Colombian program, we turn our
attention to measuring its fiscal and welfare impact. Welfare can be decomposed into three
components: the impact on lottery winners, the impact on taxpayers, and any externality
impacts. Although winners may have spent more resources on schooling or increased effort, it
is possible to construct a lower bound on net benefits to lottery winners based on revealed
preference, in which we assume winners incurred psychic costs from going to private schools
and working harder that fully offset wage gains. Under this very conservative approach, we still
find that winners benefited from the program. The impact on taxpayers is low, and likely
negative, because the net present value of extra tax revenue generated by the program exceeds
the cost.1 This implies that taxpayers were made better off by the program since it more than
paid for itself by increasing future tax revenue. These effects are concentrated among applicants
to vocational schools. For the program to have been negative from a welfare point of view, net
externalities on non-participants would have to be negative and greater than the sum of the
fiscal benefits to taxpayers and the benefits to participants.2
We note that several design features might have contributed to reducing the program’s
fiscal cost. These included limiting scholarship value to about two-thirds of costs at the typical
private participating school, while allowing families to top up scholarships with private funds;
conditioning scholarship renewal on passing each grade (which holds down the costs of grade
repetition); and limiting eligibility to residents of poor neighborhoods who had attended public
primary schools (which avoids subsidizing students who would have paid for private secondary
school out of pocket in the absence of the program).
The concentration of long-term effects among vocational school applicants helps shed
light on potential channels although it is difficult to make definitive statements. In this
subpopulation winners attend schools with peers who are less desirable on observables, casting
doubt on the notion that peer quality is the only mechanism driving observed scholarship
1 The 90% confidence interval is bounded away from zero. 2 The program could potentially have created positive externalities from human capital and reduced teen fertility,
or negative externalities if gains for program winners reflect assignment to more favorable peers or signaling
benefits in the labor market. In earlier work, a subset of the authors of this paper argues against the view that
effects are entirely due to changes in peer assignment (Bettinger, Kremer and Saavedra 2010).

5
effects. One hypothesis is that improved labor market and credit outcomes of vocational
scholarship winners are the result of increased tertiary education completion, although the
implied return to a year of schooling in the sample is too large for this to be the only mechanism
at work. A related hypothesis is that private vocational education is more responsive to labor
market and advanced training opportunities than is public education such that returns stem from
a combination of additional education and improved labor market matching. We find some
empirical support for this hypothesis. Among vocational school applicants, effects are
particularly strong and precisely estimated for applicants to schools with a commercial focus,
even though we cannot reject equality of effects across applicants to different vocational
curricula.
A complementary hypothesis relates to the fact that it was administratively difficult to
retain the scholarship if a student switched schools. For this reason, applicants who applied to
vocational private schools were more likely than losers to stay in vocational schools. This
“stickiness” in application rules might have locked-in students in private vocational schools
despite that fact that ex-ante parents might have preferred an academic path.
Our results should be interpreted as suggesting that, at least in the context of 1990s
Bogotá, a suitably designed system of offering students from poor neighborhoods partial
scholarships for private schools helped some students transition to the middle class at a low,
and likely negative net fiscal cost. Identifying the impact of the PACES scholarship program
“as implemented” is of considerable interest given the program’s scale, and that many of its
features are not uncommon among private school scholarship programs.
This paper contributes to several strands of the literature including research on the
impacts of private-school voucher programs, 3 the long-term consequences of educational
interventions, 4 the economic returns to interventions that target socially disadvantaged
3 For example, Helen Ladd 2002; Angrist, Bettinger and Kremer 2006; Hsieh and Urquiola 2006; Wolf, Gutmann,
Puma, Kisida, Rizzo, Eissa and Carr 2010; Barrow and Rouse, 2008; Muralidharan and Sundararaman 2013. 4 For example, Kemple 2004; Chetty, Friedman, Hilger, Saez, Schanzenbach and Yagan 2011; Deming, Hastings,
Kane and Staiger 2011; Dynarski, Hyman and Schanzenbach, 2011; Cowen, Fleming, Witte, Wolf and Kisida
2012.

6
children,5 the effects of education on fertility,6 and recent developments in public finance
employing reduced form causal estimates of labor-market behavioral responses to policy to
measure welfare changes.7
The remainder of the paper is organized as follows. Section 2 provides a conceptual
framework for the welfare analysis and presents relevant background information on the
PACES program. Section 3 describes the sources of administrative data and the empirical
strategy for analyzing long-run outcomes. Sections 4 and 5 discuss long-run educational and
labor market outcomes. Section 6 discusses access to consumer credit. Section 7 discusses
fertility. Section 8 analyzes fiscal and welfare outcomes. Section 9 concludes.
2. Background
2.1 Welfare Analysis Framework
Before providing some background on Colombia and the PACES program, we start by
outlining a framework for understanding the fiscal and welfare impacts of the PACES program.
The welfare impact of the PACES program is the sum of impacts on students who received
scholarships (Bs), on taxpayers (Bt), and on others (Bo).
Total Welfare = Bs+ Bt + Bo
We separately estimate impacts on participants (Bs) and taxpayers (Bt), allowing us to
determine how large would negative externalities (Bo) need to be in order to change welfare
conclusions.
For participants, welfare impacts (Bs) can be measured in two different ways. First, we
can measure the net present value of extra school expenditures, foregone earnings and future
earnings for scholarship winners. Second, we can also use a revealed-preference methodology
to estimate lower bounds on the welfare impact. Specifically, although winners may have spent
5 Some argue that interventions that target socially disadvantaged children have highest returns early in the life
cycle, during key child-development windows (Cunha, Heckman, Lochner and Masterov 2006; Heckman and
Masterov 2007; Heckman 2008). A stronger claim is that interventions in the teen years are doomed to have small
impacts. Our findings demonstrate that secondary schooling interventions that target disadvantaged children have
the potential to increase earnings and promote social mobility. 6 In developing countries, in particular several, studies find a strong causal relationship between educational
subsidies and teen fertility (e.g. Breireova and Duflo 2004; Cortés, Gallego and Maldonado 2010; Duflo, Dupas
and Kremer 2012). In our setting, such effect is the result of people staying in school longer rather than an increase
in the opportunity cost of time as a result of additional human capital. 7 See, for example, Hendren 2013 and Baird, Hicks, Kremer and Miguel 2013.
7
more resources on schooling or increased effort, it is possible to construct a lower bound on net
benefits to participants since payments to infra-marginal applicants who would have gone to
private school in the absence of the program constitute a pure transfer.
For taxpayers, the welfare impact (Bt) is the net present value of future tax revenues that
the program generates minus the fiscal cost of the program and of any additional expenditure it
induced for example on tertiary education. The key outcome to estimate the program’s impact
on taxpayers is the additional contribution of participants to government revenue through
increased payroll taxes, which are only levied on formal sector employment, and which we
observe for the universe of applicants through administrative social security records.
Besides the impacts on participants and taxpayers, there may be other externalities (Bo),
which may influence welfare calculations. We do not attempt to quantify these externalities
directly. Instead, we calculate how large the negative externalities would have to be to offset
the positive impacts we find elsewhere.
To provide context as we outline these costs and benefits, we start by describing the
educational context in Colombia at the time of the inception of PACES.
2.2 Colombia’s educational context
The Colombian education system comprises three levels: elementary school (grades 1-
5), secondary (grades 6-11) and tertiary education. Children typically begin elementary school
at age 6 or 7 and transition into secondary at around age 12 or 13. Students are legally required
to attend school through grade 9 even though the entire secondary school cycle includes two
additional grades. Students who complete secondary school on time typically do so by age 18.
Students who wish to continue on to tertiary education can enroll in either vocational
colleges or universities. In 2012, the gross tertiary enrollment rate for Colombia was 45 percent
(World Development Indicators 2014). Vocational programs typically last two or three years
depending on whether they have a technical or technological focus. University programs —
more prestigious, expensive and selective— last typically four or five years. Seventy-five
percent of tertiary education students in Colombia attend a university and 25 percent attend a
vocational college. Public universities are more prestigious and selective. With the exception
of a few elite private universities, private tertiary education institutions serve those who do not
obtain admission into public universities.
8
Although we study a large-scale national private secondary school scholarship program,
we use data from Bogotá —Colombia’s capital city. Colombian municipalities including
Bogotá are responsible for the administration of public education, funded by transfers from the
national government levied through income and value-added taxes (Barrera-Osorio et al. 2011).
Nationally, 37 percent of the student population attended a private school when the PACES
scholarship program was in place; in Bogotá, however, 58 percent of students did so (Angrist
et al. 2002).
Curricula of vocational and academic secondary schools are the same for lower
secondary grades (grades 6 through 9). For grades 10 and 11, the last two grades of secondary
school, students either enroll in a vocational or academic program. Academic schools focus
instruction in the fields of science, humanities or the arts and traditionally prepare students for
university education. Vocational schools share core subjects with academic schools. However,
in the last two grades of secondary school they have a stronger focus on preparing students for
admission into vocational colleges or for participation in the labor market, through specialized
curricula such in commercial, industrial, agrarian or pedagogical domains.
Within the category of vocational schools, public schools are more likely to teach
industrial as opposed to commercial subjects. Among public vocational schools, 25 percent
have an industrial curriculum and 62 percent have a commercial curriculum, whereas among
private vocational schools only 4 percent have an industrial curriculum and 92 percent have a
commercial focus (Bettinger, Kremer and Saavedra 2010). At the time, the mix of subjects
taught by private vocational schools was better suited than that of public vocational schools to
labor market requirements (Saavedra and Medina 2014).
Students attending grade 11 take the ICFES exam, and ICFES scores are the primary
admission criteria in Colombia’s tertiary education institutions. While it is not a binding
graduation requirement, most schools enforce test taking and, in practice, over 95 percent of
students take the test (ICFES 2013). Thus, we interpret taking the ICFES exam as a proxy for
secondary school completion.
In order to facilitate targeted subsidies in public services, Colombia divides its
population into six strata based on residential location. The poorest two strata —the target
population of the PACES scholarship program— represent roughly 55 percent of Colombia’s

9
population (49 percent in Bogotá). About 12 percent of students in strata 1 and 2 neighborhoods
attend private schools in Bogotá (Encuesta Nacional de Calidad de Vida 2010).8
2.2 The PACES scholarship program
The PACES scholarship program was introduced in 1992 as a way of improving
secondary school enrollment rates among disadvantaged students. Available slots in public
secondary schools were limited when the program began in 1992. The program aimed at
tapping the excess capacity in private schools by providing scholarships for private secondary
schooling among strata 1 and 2 applicants from public elementary schools (King, Laura
Rawlings, Gutierrez, Pardo, and Torres 1997).
Participating private schools served lower-income students and charged lower tuition
fees than other private schools that chose not to participate. Teacher-pupil ratios were
comparable between all public and participating private schools (King et al. 1997). While
initially the scholarship covered most tuition fees, the government did not increase its monetary
value to keep pace with inflation, and by 1998 the scholarship only covered about 56 percent
of the tuition of the average participating school. Families made up for the difference (Angrist
et al. 2002).
In order to receive an award, students needed to have applied and been accepted to a
participating private school. Local governments awarded scholarships by lottery if demand
exceeded scholarship availability. Students were between 12 and 13 years of age at the time of
application. Renewal of the award through the end of students’ secondary schooling was
supposed to be contingent upon passing grades, but the extent to which this conditionality was
enforced is unclear (Calderón 1996; Ribero and Tenjo 1997).
The design of the PACES program and the Colombian context included several features
that likely reduce its fiscal cost. First, scholarships cost less than per pupil expenditure in public
schools.
Second, scholarships could be augmented with household funds. To the extent that the
program "crowded in" household funds for education, increasing winners' human capital and
future taxable earnings, the government budget constraint improves. Allowing “top-ups” also
8 About 90 percent of public schools in Bogotá are secular and 10 percent have a religious affiliation. Of the 10
percent of religiously affiliated public schools, 73 percent are Catholic. Among private schools, 46 percent are
secular and 54 percent have a religious affiliation. Of those private schools with a religious affiliation, 54 percent
are Catholic.
10
avoids creating incentives for some families to trade down from higher cost private schools to
private schools with fees at or below the value of the scholarship, which may have reduced
human capital accumulation and future taxable income.
Third, as is fairly standard in many scholarship programs, program rules made retention
in the program conditional on satisfactory grade completion. Indeed, we find that on-time
secondary graduation increased and grade retention fell as a result of the scholarship offers. To
the extent that reduced repetition led to fewer years of schooling taking place in public schools,
public expenditure in education fell.
Fourth, scholarships were targeted to the poor, reducing the extent to which the simply
subsidized students who would have gone to private school anyway. (This poverty targeting
will also of course make a distributional-weighted public finance calculation more favorable.)
Students could apply to either academic or vocational private schools. Vocational
private schools were overrepresented among participating private schools.
Applicants to vocational schools tend to differ systematically from other applicants;
they tend to come from families where the parents are less educated, they are also more likely
to be living in the poorest of Colombian neighborhoods, and they typically applied to schools
whose students attained lower than average scores on college entrance examinations (Bettinger,
Kremer and Saavedra 2010).
After gaining acceptance to a participating school, students then submitted scholarship
applications. Because it was administratively difficult to retain the scholarship if one switched
schools, there was considerable stickiness in schools attended by scholarship winners. Less than
20 percent of students that transferred after the first year were able to retain their scholarship.
Thus, among applicants who applied to vocational private schools, scholarship lottery winners
were more likely to stay in vocational schools whereas applicants who did not win a scholarship
were more likely to attend academic schools (for details, see Table 3 of Bettinger, Kremer,
Saavedra 2010). This “stickiness” in program application rules might have locked-in students
in private vocational schools despite that fact that ex-ante parents might have preferred an
academic path.
Among applicants to vocational schools, relative to losers, scholarship winners attended
schools where students were 33 percent more likely to drop out before completing secondary
school and were 25 percent less likely to attend college. Despite not having observably more
11
desirable peers, among those who applied to vocational schools, scholarship lottery winners
had significantly better educational outcomes than losers, including a 25 percent increase in the
likelihood of graduating from high school and a one-third of a standard deviation increase in
college entrance examination scores (Bettinger, Kremer, Saavedra 2010). The authors argue
that the findings of better outcomes despite worse observable peers, casts doubt on the idea that
scholarships improved outcomes for winners solely by matching them to better peers. Instead,
they argue that effects are likely driven by private sector vocational schools’ better ability to
match labor market needs.
3. Data and Empirical Strategy
In this section, we describe the various sources of administrative data we employ for
our analyses (section 3.1) and the empirical strategy (section 3.2).
3.1 Data
We limit our analysis to individuals who applied in 1994 to enter, by lottery, a private
school in sixth grade in Bogotá in 1995. This lottery and its records are the most complete and
accurate of any of the annual voucher lotteries conducted in Colombia between 1992 and 1997
(Angrist, Bettinger, Kremer 2006). We refer the reader to the reference for additional details.
Covariates available from the PACES application are age, gender, whether the applicant
had a phone at the time of application and the school applied to. Bettinger, Kremer and Saavedra
(2010) matched 93 percent of applicant school names in the Bogota 1995 lottery to school types
(vocational or academic) using data from the ICFES secondary graduation database, which we
describe below. We are able to match 93 percent of applicants from the 1995 scholarship lottery
to information on the school type to which they applied (academic or vocational). In the 1995
scholarship lottery, 43 percent of students applied to a private vocational secondary school,
with no difference by lottery status (Panel A, Table 1).9
Application covariates are balanced across lottery winners and losers in the full sample
and separately by type of school applied to, with the exception of age (Panel A, Table 1). At
application, lottery winners in the full sample are 0.086 years younger than losers, for whom
average age is 12.74 years. The age difference between winners and losers is more pronounced
9 In 1995, only 16 percent of secondary school graduates attended vocational schools, which underscores the
overrepresentation of vocational schools among private schools participating in the program.
12
among vocational school applicants, where winners are 0.14 years younger than losers (column
6, Table 1).10 All results we present control for age, gender and having a phone. As we
document later, results are robust to alternative age specifications as well as to excluding
application controls.
Among academic school applicants, 50 percent of students are male. Among vocational
school applicants 45 percent of students are male. There are no differences in gender by lottery
status either in the full sample or in the lotteries that are conditional on the type of school to
which students applied.
We use the Bogotá 1995 lottery data and five additional administrative data sources.
We used students’ names, dates of birth and adult identification numbers from the national
registrar to complete the matches with the five administrative datasets. In the scholarship
applicant list, all applicants reported their full names (typically two first names, two last names)
and 97.2 percent of them reported a valid youth identification number which contains their date
of birth embedded in the first six digits. The remaining four digits in the youth identification
number include an algorithm for determining the validity of a youth identification number, and
there is no difference by lottery status in the probability of having a valid youth identifier in the
full sample or separately by type of school applied to (Panel B, Table 1).
Tracking long-run outcomes in some datasets —particularly social security records—
relies on having students’ adult identification numbers which citizens obtain when they turn 18
years old. We obtained valid adult identification numbers for 97.1 percent of applicants, with
no difference in the likelihood of having an adult identification number by win-loss status
among all applicants or separately by gender (Panel B, Table 1).11
Colombia has comprehensive individual-level administrative data on secondary and
tertiary education, female fertility, labor market, and credit market outcomes. The breadth and
depth of the national data provide a unique opportunity to track PACES applicants across a
variety of long-run outcomes with little to no attrition in the data. In particular, we use:
1. The ICFES secondary school graduation/tertiary education entry exam database.
We update and improve the prior match conducted by Angrist et al. (2006) in two ways: i) by
10 Angrist, Bettinger, Bloom, King, and Kremer (2002) discuss this imbalance in applicant age in greater detail. 11 Youth and adult identification numbers were linked using administrative data from Colombia’s national
registrar’s office and the Department of National Planning.

13
matching on students’ youth identification numbers, adult identification numbers, and names,
(Angrist et al. 2006 did not have students’ adult identification numbers), and ii) by matching
students to the population of test takers through 2007 —7 years after students would have
graduated with no grade repetition —whereas Angrist et al. (2006) was only able to match
students through 2001.
2. The tertiary education database. We use data from Colombia’s Education Ministry’s
Sistema de Prevención y Análisis de la Deserción en Instituciones de Educación Superior
(SPADIES) to track scholarship applicants through collegiate pathways, including enrollment
and completion. The tertiary education database is an individual-level panel dataset that tracks
close to 95 percent of tertiary education students from their first year to their degree receipt
beginning in 1998. We obtained data until the first semester of 2012. The tertiary education
database is similar to the National Student Clearinghouse in the U.S. It includes information
on the timing and institution of students’ tertiary attendance. We also observe characteristics
of the institution including whether it is a university or a vocational college and whether the
institution was public or private. We construct outcomes characterizing students’ trajectories
throughout college (enrollment periods, continuation status and graduation).
3. Colombia’s Social Protection Ministry’s Sistema Integral de Información de la
Protección Social (SISPRO) provides information on formal sector earnings and tax
payments.12 SISPRO is an individual-level panel dataset that is updated monthly, and that
contains information on contributions to government social programs for health, employment,
and retirement. For the purposes of this study we focus on the work module, which contains
information on whether individuals have worked in the formal sector, the number of days of
formal sector employment, monthly earnings, and social security contributions. We focus on
outcomes from 2008 to 2014 —between eight and 14 years after on-time secondary school
completion of scholarship applicants in the Bogotá 1995 sample—since SISPRO only began to
cover the universe of formal sector workers in 2008. On average, scholarship applicants would
have been around 33 years old at the end of this period.
12 The SISPRO database only includes people who worked for employers that register their workers or self-
employed workers who register themselves. In Colombia and in Bogotá, respectively 50 percent and 55 percent of
employment is formally registered (Secretaría de Desarrollo Económico de Bogotá 2012).
14
4. Colombia’s financial comptroller’s (Superintendencia Financiera) is a formal credit
census. We focus on outcomes from 2004 to 2014, ten to 20 years after the lottery and four to
14 years after on-time secondary school completion of scholarship applicants in the Bogotá
1995 sample. These quarterly data contain formal credit information for more than 250 million
consumer credit transactions, including credit cards and car loans. We focus on two extensive
margin outcomes: access to credit card and to car loans, which we define as appearing in the
credit data for these loan types. We also analyze credit risk, as measured by interest rates
charged on loans.
5. The SISBEN Census. We use data from the SISBEN household census of 2010.
Unlike the other administrative datasets we use that have national coverage, the SISBEN census
only has partial coverage in that the government only surveys residents from households
classified in the two lowest socioeconomic strata. For this reason, SISBEN 2010 covers only
57 percent of households in all of Colombia and 39 percent of households in Bogotá. The
government uses a proxy means score based on the SISBEN questionnaire to determine
eligibility for all government subsidy programs.13 Since being surveyed and scored by the
SISBEN formula is a requirement for government subsidy eligibility, the outcome of eligibility
for various government programs is well defined for the entire population of scholarship
applicants because those who do not appear in the census are not eligible. However, we are
interested in two additional outcomes from the SISBEN survey, namely, teen fertility and self-
reported earnings. Since these outcomes are not defined for the full scholarship applicant
sample, we analyze them using a bounding approach described in the next section.
We estimate scholarship impacts on the probability of receiving Familias en Acción
conditional cash transfers and on the probability of being eligible to receive benefits from the
13 Receipt of several government subsidies is determined by whether households have SISBEN scores below
predetermined cutoff points that vary by subsidy. These subsidies include: early childhood care (primera infancia),
health care (régimen subsidiado en salud), tertiary education loan subsidies (crédito access), conditional cash
transfers (familias en acción) and elderly care (protección social al adulto mayor) subsidies. For the healthcare
subsidy the only eligibility criterion is SISBEN scores. Eligibility for the remaining subsidies requires additional
demographic conditions such as having age-appropriate children (early childhood care and conditional cash
transfers), being admitted or attending tertiary education (tertiary education loan subsidies) or living with an
elderly relative (elderly care). We observe eligibility for these subsidies but not actual subsidy receipt. We define
Familias en Acción receipt as whether applicants’ SISBEN score is at or below the eligibility cutoff and whether
they have children between 0 and 17 years of age. Take up of subsidized health care is nearly one hundred percent
among eligible families so for subsidized health care eligibility and receipt is almost identical.
15
other three largest government subsidy programs available for urban households: the two tiers
of subsidized health care and early childhood care.14
On the whole, we are able to match close to 95 percent of applicants to at least one of
the five administrative datasets we use to track long-run outcomes.
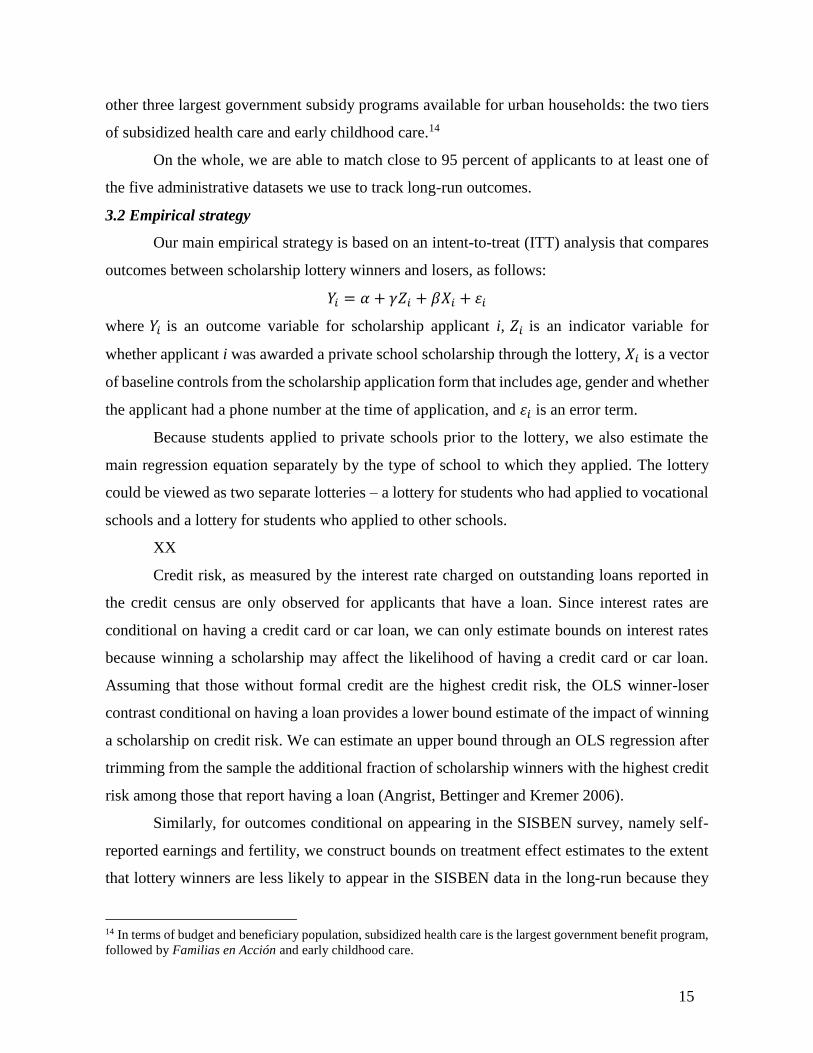
3.2 Empirical strategy
Our main empirical strategy is based on an intent-to-treat (ITT) analysis that compares
outcomes between scholarship lottery winners and losers, as follows:
𝑌𝑖 = 𝛼 + 𝛾𝑍𝑖 + 𝛽𝑋𝑖 + 𝜀𝑖
where 𝑌𝑖 is an outcome variable for scholarship applicant i, 𝑍𝑖 is an indicator variable for
whether applicant i was awarded a private school scholarship through the lottery, 𝑋𝑖 is a vector
of baseline controls from the scholarship application form that includes age, gender and whether
the applicant had a phone number at the time of application, and 𝜀𝑖 is an error term.
Because students applied to private schools prior to the lottery, we also estimate the
main regression equation separately by the type of school to which they applied. The lottery
could be viewed as two separate lotteries – a lottery for students who had applied to vocational
schools and a lottery for students who applied to other schools.
XX
Credit risk, as measured by the interest rate charged on outstanding loans reported in
the credit census are only observed for applicants that have a loan. Since interest rates are
conditional on having a credit card or car loan, we can only estimate bounds on interest rates
because winning a scholarship may affect the likelihood of having a credit card or car loan.
Assuming that those without formal credit are the highest credit risk, the OLS winner-loser
contrast conditional on having a loan provides a lower bound estimate of the impact of winning
a scholarship on credit risk. We can estimate an upper bound through an OLS regression after
trimming from the sample the additional fraction of scholarship winners with the highest credit
risk among those that report having a loan (Angrist, Bettinger and Kremer 2006).
Similarly, for outcomes conditional on appearing in the SISBEN survey, namely self-
reported earnings and fertility, we construct bounds on treatment effect estimates to the extent
that lottery winners are less likely to appear in the SISBEN data in the long-run because they
14 In terms of budget and beneficiary population, subsidized health care is the largest government benefit program,
followed by Familias en Acción and early childhood care.

16
moved to better neighborhoods, the SISBEN data will contain a higher fraction of applicant
lottery losers than of lottery winners. Assuming that the additional proportion of winners who
moved out of the low-income SISBEN neighborhoods due to receiving the scholarship had
better outcomes (i.e. higher earnings, lower likelihood of bearing children as teenagers) than
those who remained in neighborhoods covered by SISBEN the raw difference between SISBEN
outcomes among winners and losers will be a lower bound on the voucher effect. We can
estimate an upper bound by trimming the corresponding proportion among losers (Angrist,
Bettinger, Kremer 2006).
4. Scholarship Impacts on Long Run Educational Outcomes
4.1 Secondary education completion outcomes
In this subsection, we examine secondary school outcomes and in the next we examine
tertiary education outcomes. We concentrate on on-time secondary school completion and the
likelihood of ever completing secondary school.15 Scholarship lottery winners are 17 percent
(7.6 percentage points) more likely to complete secondary school on time relative to losers’ on-
schedule completion rate of 45.2 percent (Panel A of Table 2).16 Point estimates of scholarship
effects are slightly larger (both in percent and percentage point terms) among applicants to
vocational schools, but differences are not statistically significant.
Scholarship lottery winners are 10 percent (5.4 percentage points) more likely to
complete secondary school within six years after on-schedule completion relative to a base rate
of 56.5 percent. During the six years following on-schedule completion, the difference between
the proportion of scholarship lottery winners and losers who have completed secondary school
declines with each year.17
15 We define on-schedule secondary school completion as having taken the tertiary education entry test no later
than six years after applying for the scholarship, that is to say by 2001. 16 With our updated matching strategy including adult identification numbers, we obtain substantially higher match
rates than Angrist et al. (2006). Impact estimates in percentage points are similar. 17
Three years after the lottery, scholarship lottery winners were less likely than lottery losers to repeat grades in
secondary (Angrist et al. 2002). To analyze secondary school graduation, Angrist et al (2006) completed the match
focusing on students’ probable date of on-time graduation. With the benefit of more data, we observe that many
lottery losers eventually complete secondary school, but it is taking them up to six years longer to do so.
17
4.2 Tertiary education outcomes
Table 2 reports scholarship impacts on tertiary education outcomes. Effects on tertiary
education outcomes are particularly strong among students who applied to vocational schools.
In this population, the base rate of ever enrollment in tertiary education is 19 percent and this
increases by 7 percentage points (37 percent) among scholarship lottery winners. The
scholarship impact difference across academic and vocational applicants in the probability of
ever enrolling in tertiary education is statistically significant (Column 7, Table 2).18 This ever-
enrollment effect takes place both in vocational colleges and in universities. Within this
group, the effects are particularly driven by males for whom there is a 10 percentage point
gain in ever enrollment in tertiary education on the base of approximately 16 percent (Table
A1).
Among vocational school applicants there is also evidence of gains in tertiary graduation
rates and in total years of tertiary education. 19 Vocational scholarship winners are 2.4
percentage points more likely to graduate from tertiary education from a base rate of 4.9 percent
among vocational scholarship losers. In this population, winners complete 0.19 additional years
of tertiary education, which corresponds to a 45 percent increase relative to the base rate of 0.42
years among losers.20 For tertiary graduation and additional years of tertiary education, the
scholarship impact difference across academic and vocational applicants is statistically
significant (Column 7, Table 2).
Among applicants to academic secondary schools, there is no evidence of an increase
in ever enrolling. There is evidence, however, that among academic school applicants,
scholarship winners were more likely to be enrolled as of 2012—our last year of tertiary
education data—by approximately 3 percentage points on a base of 3 percent. However, this
is also true to a lesser extent among vocational applicants and we cannot reject equality across
academic and vocational samples (Column 7, Panel B, Table 2).
18 Within this group the effects are particularly driven by males for whom there is a 10 percentage-point gain in
ever enrollment in tertiary education on the base of approximately 16 percent (see Table A1). 19 We define tertiary graduation and tertiary years of schooling to be zero for those who never enroll. This way,
these outcomes are well defined for the entire sample. 20 Many vocational schools have agreements with universities and vocational institutes so that students can take
college credits in their last year of secondary school, potentially easing the transition into tertiary for low-income
students.

18
5. Scholarship Impacts on Labor Market Outcomes
In this section, we first show that winning the lottery did not affect the intensive or
extensive margin of formal sector labor participation (subsection 5.1), but that it nonetheless
increased formal labor market earnings, and payroll taxes, with this effect concentrated among
those applying to vocational schools. The effects on formal earnings and payroll taxes are
concentrated at the top 40 percent of the distribution (subsection 5.2). We find no effects at the
bottom of the distribution on eligibility for government subsidies (subsection 5.3). We then
decompose formal earnings impacts into the portion accounted for by increased schooling and
the portion accounted for by additional earnings conditional on schooling (subsection 5.4).
Since data on informal income is only available through a census of residents of these
neighborhoods, we can only bound and not estimate differences in informal income, but
accounting for informal income does not change the overall picture (subsection 5.5).
5.1 Formal-sector participation and intensity
SISPRO data contains monthly earnings for all formal sector workers (i.e. those who
pay payroll taxes) between 2008 and 2014.
One limitation of this analysis is the fact that, in the full sample, lottery winners are
about two percentage points more likely to be enrolled in tertiary education in 2012—our last
year of tertiary education data, which overlaps with the period of formal sector earnings data.
This may limit their current earnings while increasing their future earnings. Thus current
differences in formal sector earnings between winners and losers may understate future earnings
differences. We explore this implication below in subsection 5.2.
There is no evidence that winning the lottery makes people more likely to work in the
formal sector or to work more hours in the formal sector. Among scholarship lottery losers, we
match 80 percent to the SISPRO government records of those paying payroll taxes, implying
that 80 percent of losers ever show up in formal sector employment between 2008 and 2014.
Point estimates suggest that lottery winners are 1 percent (0.8 percentage points) more likely to
ever appear in formal employment records during this period. However, this difference is not
statistically significant (Top Row, Table 3). Match rate correlates do not systematically differ
between winners and losers in the full applicant sample or separately by vocational/academic
school application status (Table A2).

19
We define formal sector intensity as the average number of months spent annually in
formal sector employment. Both scholarship winners and losers spend about 5.5 months per
year in formal sector employment. There are no statistically significant differences in formal
sector employment intensity in the full sample, separately by vocational/academic school status
or by gender (Table 3).
5.2 Formal-sector earnings
Formal sector earnings are the main source of government revenue in our welfare
calculations because only formal sector workers pay payroll taxes, which are a fixed proportion
of formal earnings. Current annual formal earnings for scholarship lottery losers are, on
average, $2,470 (including zeros).21 Scholarship lottery winners earn an additional $196 in
formal annual earnings, an 8 percent increase (Panel A of Table 3). The p-value on this
difference is 0.06.
Current annual formal earnings for scholarship lottery losers who applied to vocational
schools are, on average, $ 2,568 (including zeros). Scholarship lottery winners from applicants
to vocational schools earn an additional $427 in formal annual earnings, a 17 percent increase
(column 6, Table 3). The scholarship impact difference across academic and vocational
applicants for annual formal earnings has a p-value of 0.08 (Panel A, Column 7, Table 3). The
effects among vocational school applicants are particularly strong for men. Male lottery losers
earn $2,743 while winners earn $535.3 more per year, a 20 percent increase. For males, the
scholarship impact difference across academic and vocational applicants for annual formal
earnings has a p-value of 0.07 (Panel C, Column 7, Table 3). These results are robust to
alternative age specifications as well as to excluding application controls (Table A3).
Another way of capturing the long-term labor market effect of winning scholarship is
by measuring the proportion of scholarship applicants with formal earnings above the middle-
class threshold, which in Colombia is PPP$10/day (PPP$3,600/year, Angulo et al. 2013). Near
age 33, 44 percent of scholarship lottery losers have annual formal earnings at or above the
21 We compute annual formal sector earnings by adding inflation-adjusted monthly formal sector earnings during
the period covered by our formal employment data (July 2008 to December 2014 or 78 months) including zeroes
for months without reported formal sector earnings and dividing by the 6.5 years of coverage to get an annual
average (Table 6). Since 19 percent of applicants never appear on formal employment records during this
period, total formal earnings for them are zero. We report results based on formal earnings reported in health
payroll accounts. Results are very similar if we use instead earnings from the pension payroll account.

20
middle-class threshold. Scholarship lottery winners are 3.7 percentage points (8.4 percent) more
likely than losers to have earnings at or above the middle-class threshold. (Panel A of Table 3).
There are no differences in the scholarship impact across academic and vocational applicants
(Panel A, Column 7, Table 3).
One plausible hypothesis for the concentration of tertiary education and formal earnings
results among vocational applicants is that private vocational education is more responsive to
labor market and advanced training opportunities than is public education. We find some
empirical support for this hypothesis. Among vocational school applicants, effects are
particularly strong and precisely estimated for applicants to schools with a commercial focus,
even though we do not sufficient power to identify differences across different vocational
curricula (Table A4). Since formal-sector days are fairly similar between lottery winners and
losers, the higher earnings seem to reflect greater earnings per formal-sector day, rather than
more hours, contrary to a model in which education is used as a signaling device to ration formal
sector jobs, but consistent with a human capital model.22
Power is limited to look at effects by quantile, but quantile regression results suggest
that the effects of the scholarship on total formal sector earnings at age 33 are strongest at the
top of the distribution for vocational school applicants. We see no gains at the top for applicants
to academic schools, possibly because they are more likely to currently be enrolled in university
(Figure 1).
In terms of formal job characteristics, while there are no differences between winners
and losers in firm size, scholarship winners, are more likely to work in growing firms (as
measured by new jobs) and firms that pay higher wages (Table A5).
We documented earlier that lottery winners are two to three percentage points more
likely to be enrolled in tertiary education during the formal earnings period we analyze. This
may limit winners’ current earnings while increasing their future earnings. To bound what the
future earnings difference is likely to be between winners and losers once the former complete
tertiary education, we can assume that in the absence of a scholarship, earnings of applicants
who attend and complete tertiary education are at the top of the earnings distribution. Under
this assumption, we can bound the estimate for the effect of winning a scholarship on future
22 This result differs from recent evidence from Ghana in which authors find that scholarships for vocational
secondary schooling increased labor force participation of lottery winners (Duflo, Dupas and Kremer 2017).

21
earnings by trimming the top two to three percent of formal earners in the scholarship loser
group. Table A6 shows results for this bounding approach.
An upper bound estimate on scholarship lottery winners’ future earnings is $490, a 23
percent increase (Column 2, Panel A, Table A6). Among academic applicants the bound on
the scholarship effect on future winner earnings is $396, a 19 percent increase (Column 4, Panel
A, Table A6). Among vocational applicants the bound on the scholarship effect on future
winner earnings is $702, a 31 percent increase (Column 6, Panel A, Table A6).
Under different assumptions we can estimate a more conservative upper bound to lottery
winners’ if future earnings of lottery winners still enrolled in tertiary education would be equal
to the current average earnings of lottery losers who ever attended but are no longer attending
tertiary education. In this alternative bounding approach, an upper bound estimate of winners’
future earnings is $206, an 8 percent increase statistically significant at the 5 percent level
(Column 2, Panel A, Table A7). Among vocational applicants the bound on the scholarship
effect on future winner earnings is $442.4, a 17 percent increase (Column 6, Panel A, Table
A7). Alternatively, among vocational applicants the upper bound under this bounding approach
could be as low as $368, a 14 percent increase, and still be statistically significant
To summarize, we find scholarship lottery winners have formal earnings twenty years
after initial scholarship award that are 8 percent greater than those of losers, with the difference
significant at the 6 percent level. Among applicants to vocational schools, winners’ formal
earnings twenty years later are 17 percent greater than those of losers, a difference that is
statistically significant at the 5 percent level. After accounting for the additional proportion of
lottery winners currently in tertiary education, we estimate that winning a scholarship may
increase future earnings and payroll taxes by up to 23 percent in the full sample and by up to
30 percent among vocational applicants. Given that there are no effects on the extensive or
intensive margin of formal sector employment, these earnings impacts suggest that—through
their effects on various educational outcomes—scholarships may have raised productivity.
Since we observe no change in formal sector hours, there is no particular reason to believe that
increased formal sector earnings are due to a substitution of time away from the informal sector.
Unfortunately, we do not have data on informal earnings in the full sample, and the data we
have is on an endogenously selected subsample allowing us to create only bounds and not point
estimates for the impact on earnings within a subpopulation.
22
5.3 Decomposition of formal earnings impacts
Scholarship winners accumulate more schooling and have greater earnings than
scholarship losers. In this subsection we decompose the effect on formal earnings into an
earnings differential attributed solely to additional years of schooling among scholarship
winners and an earnings differential due to other factors conditional on years of schooling. To
do so, we combine three estimates: i) The scholarship impact on completed years of schooling;
ii) the scholarship impact on average annual formal sector earnings; and iii) the Mincerian
return to an additional year of schooling among scholarship losers, controlling for
characteristics from the application form.23
Scholarship winners complete 0.13 additional years of schooling and have annual
formal earnings that are $196 greater than those of losers (Column 2, Table 4). We estimate
the Mincerian return to a year of schooling in the sample of scholarship losers by running an
OLS regression in which the dependent variable is average annual formal earnings and the
independent regressors are years of schooling, age, gender and having a phone at the time of
application. We estimate this OLS regression equation among all lottery losers and separately
for academic and vocational lottery losers. From this regression we obtain that, among all
scholarship losers, an additional year of schooling is associated with $642.8 greater earnings.
The earnings differential attributed solely to additional years of schooling among scholarship
winners is thus 0.13*$642.8=$83.6. The portion of the earnings increase due to winning a
scholarship that is solely accounted for by additional schooling among scholarship winners is
thus ($83.6/$196)*100=42.6%. The remaining 57.4% is due to other factors conditional on
years of schooling. XX ADD DISCUSSION MENTION HIGH MINCERIAN RETURN
HYPOTHESIS OF BETTER MATCHING?
In the sample of academic school applicants, 77 percent of the scholarship impact on
total earnings is attributed to increased schooling and 23 percent is due to other factors
conditional on years of schooling (Column 4, Table 4). Among vocational school applicants,
47 percent of the scholarship impact on total earnings is attributed to increased schooling and
53 percent is attributed to other factors conditional on years of schooling (Column 6, Table 4).
5.4 Eligibility for government subsidies
23 Using lottery status as an instrument for years of schooling is inappropriate because winning the lottery might
have also enabled winners to trade-up to better schools, invalidating the exclusion restriction.
23
In the full sample of applicants, by type of school, or by gender, winning the scholarship
does not affect government welfare receipt of Familias en Acción, subsidized health care
programs or eligibility for early childhood care (Table A8). Since winning a scholarship did
not affect the probability of receiving government transfers, there are no additional welfare
costs to the government from increased welfare receipt.
5.5 Self-reported earnings in SISBEN data
The SISBEN survey covers low-SES neighborhoods and includes about 52 percent of
the scholarship applicant population fifteen years after initial scholarship award (Table 5)
SISBEN 2010 earnings are a cross-section of self-reported earnings for 2010.
Lottery winners are 5 percent (2.8 percentage points) less likely to ever appear in
SISBEN data, indicating that they are less likely to reside in poor neighborhoods fifteen years
after initial scholarship receipt. This difference is statistically significant at the 10% level
(column 1, Table 5). To the extent that the approximately 5 percent of winners who moved out
of the low-income SISBEN neighborhoods due to receiving the scholarship had better outcomes
than those who remained in neighborhoods covered by SISBEN the win-loss contrast will be a
lower bound on the scholarship effect. As explained in the methods section, we can estimate an
upper bound by trimming the top 5 percent of earners among losers.
Table 6 reports bounds on the scholarship effect on self-reported total annual earnings
from the SISBEN census of the poor. Over two thirds of SISBEN respondents report not paying
payroll taxes, which implies that for them these total earnings are likely informal earnings. The
upper bound is $366 on a base of $ 2,000, and statistically significant. The lower bound impact
on annual self-reported total earnings is statistically insignificant. Together with the fact that
we see no formal labor supply response as a result of winning a scholarship suggests that
increased formal earnings are not merely the result of substitution from informal into formal
employment among scholarship winners.
6. Scholarship Impacts on Formal Consumer Credit Access
In this section, we show that winning the lottery affects long-term access to formal credit
through credit cards and car loans. Scholarship winners also have lower credit risk as measured
by interest rates on loans. It also reduces both the risk and the cost of these types of credits.
In the full sample, fifty-six percent of scholarship losers have had a credit card at any
point between 10 and 20 years after the lottery, which is the timespan covered by the credit
24
census data (Panel A, Column 1, Table 7). Scholarship winners are 3.8 percentage points more
likely to have a credit card, a seven percent increase (Panel A, Column 2, Table 7).
This effect is driven by vocational applicants, among whom winning a scholarship
increases credit card access by 5.4 percent, or close to 10 percent from a base of 56 percent
(Panel A, Columns 5 and 6, Table 7). Within vocational applicants, scholarship impacts on
credit card access are strongest among males (Panel C, Column 6, Table 7).
Winning a scholarship does not increase car loan access in the full sample (Panel A,
Column 2, Table 7). However, among vocational applicants, winning a scholarship increases
car loan access by 2.1 percentage points, a 55-percent difference from a base of 3.8 percent that
is significant at the 10 percent level (Panel A, Column 6, Table 7). Within vocational applicants,
male lottery winners are 5.1 percentage point more likely to have access to a car loan, a 142-
percent increase from a base of 3.6 percent (Panel C, Column 6, Table 7). The pattern of results
on formal credit access mimics that on formal sector earnings, with the strongest scholarship
impacts among vocational school applicants, and within the vocational subpopulation, among
males. Since the majority of people in Colombia use loans to buy a car (Fasecolda 2014),
greater access to car loans suggests greater car ownership. This may enhance productive
opportunities, for instance, enabling winners to access a greater number of jobs in the city or
serving as an input in production.
[[Increased access to credit is likely not a direct effect of the scholarship but rather a
consequence of improved educational and labor market opportunities that result from winning
a scholarship. In a regression (not shown) of having a credit card or car loan line on secondary
school graduation, tertiary enrollment, access to formal employment, formal earnings,
appearance in the SISBEN dataset, age, gender, having a phone at baseline and an indicator for
winning a scholarship, the coefficient on winning a scholarship is not statistically significant.
What does the worst?]
Scholarship winners also have lower credit risk, according to bound estimates on the
interest rate paid on loans. Estimates of these bounds are negative in the full sample and in the
sample of vocational applicants, particularly male applicants, suggesting that in these
subpopulations, scholarship winners have lower credit risk (Table A9). A lower credit risk may
25
propitiate a virtuous cycle by improving employment opportunities in the future (e.g.
Herkenhoff et al., 2016).
7. Scholarship Impacts on Teen Fertility
Fertility outcomes are only observed for applicants who show up in the SISBEN 2010
data. Scholarship lottery winners have a lower likelihood of appearing in SISBEN 2010 data.
As explained in the methods section, estimated effects on teen fertility conditional on SISBEN
appearance will be a lower bound on the true effect on teen fertility as long as lottery winners
who moved out of low-SES neighborhoods covered by SISBEN as a consequence of winning
the scholarship have a lower chance of being teenage parents than scholarship lottery winners
who remained in neighborhoods covered by SISBEN. Under this assumption, we can compute
upper bound estimates on fertility by trimming the top 5 percent of earners among losers. We
report these bounds in Table 8.
Bounds on fertility effects of winning a scholarship are tight. Scholarship winners are
between 18 and 19 percent (between 4.3 and 4.7 percentage points) less likely to have a child
during their teenage years relative to the lottery losers’ (untrimmed) mean of 23.4 percent.
Among females, winning a scholarship reduces teen motherhood by between 17 and 19 percent
(between 6.5 and 7.4 percentage points) relative to a base of 37.7 percent. The incidence of
teen fatherhood is low in Colombia in part because women typically have partners that are
older. Hence, for males we examine whether they have children with teen partners. Male lottery
winners are between 32 and 34 percent (between 5.1 and 5.6 percentage points) less likely to
have a spouse or partner who had a child as a teenager relative to a base rate of 16.1 percent
(Panel A, Table 8.)
These effects are concentrated among applicants to academic schools. Column 4 of
Table 8 shows the results for academic applicants while column 6 shows the results for
vocational schools.
The reduction in teen fertility could be the result of an “incarceration” or “delay” effect
by which winners stay in school longer and do not want to risk losing the scholarship, or it
could be an opportunity cost effect by which additional human capital increases wages, making
time valuable. If “delay” is the driving mechanism, we might not observe scholarship impacts
on total fertility because there may be catch up fertility once schooling is completed. In
26
contrast, if the driving mechanism is opportunity cost, we should observe an effect on total
fertility.
We find no evidence that winning a scholarship changed total fertility since both lower
and upper bound estimates on the effect of winning a scholarship on total fertility include zero
at the time of SISBEN 2010, in which applicants are about twenty-eight years old, the average
scholarship lottery loser has one child. Lower and upper bound estimates on winning a
scholarship on total fertility are close to each other and insignificant, although fairly precisely
estimated. This pattern of results is consistent with the “delay” hypothesis by which winning a
scholarship keeps a student in school longer without necessarily affecting her opportunity cost
of time. One caveat is that impacts on total fertility may show up later in the potential
childbearing years, so fertility gaps may appear later.
8. Welfare Impacts
In this section we quantify the program’s welfare impacts. Welfare impacts are the sum
of: i) impacts on scholarship recipients (subsection 8.1) ii) impacts on taxpayers (subsection
8.2), and iii) externality impacts on others. We are not able to identify externality impacts on
others; in subsection 8.3, however, we estimate how large net negative externalities would need
to be to imply that the program is not welfare improving to society.24 We quantify welfare
impacts in the full sample of applicants and separately by applicants to academic and vocational
schools and compute bootstrap confidence intervals for costs and benefits.
8.1 Benefits to scholarship recipients
As explained in Section 2.1, welfare impacts on scholarship recipients can be measured
in two different ways. First, we can measure the net present value of extra school expenditures,
foregone earnings and future earnings for scholarship winners. Second, we can also use a
revealed-preference methodology to estimate lower bounds on the welfare impact. Specifically,
although winners may have spent more resources on schooling or increased effort, it is possible
24 The discount rate we use is 3.6 percent, which is average interest rate on new external government debt
commitments for Colombia between 2002 and 2012 (World Development Indicators database). In all calculations
that follow we estimate amounts per scholarship winner, separately for males and females, which assumes that the
counterfactual situation is no scholarship program. Throughout the analysis, for each source of cost and revenue,
we compute the NPVs converting into United States dollars (if not already) using the year-specific exchange rate
(Dec. 31 of that year) between US dollars and Colombian pesos from the Colombian Central Bank, deflating
nominal costs back to real value in base year (1995) using the US-CPI change between base year and incurrence
of costs (or revenue), taking the present value of the cost and revenue stream. We express the NPV in US dollars
for the year of analysis (2013) using US-CPI change between the analysis and the base year.

27
to construct a lower bound on net benefits to participants since payments to infra-marginal
applicants who would have gone to private school in the absence of the program constitute a
pure transfer. Here we focus solely on the more conservative revealed-preference approach.
Recipients benefited as public school costs exceeded scholarship costs and over 85 percent of
recipients would have attended private school anyway (89.7 percent of females and 85.7 percent
of males). This implies that gains to infra-marginal recipients were about $249 per scholarship
winner.25 Hence, even if there were no increase in tax revenue to the government, the program
would transfer to beneficiaries about 70 percent of what it cost taxpayers, even if one counted
only benefits to infra-marginal recipients, thus implicitly treating any benefits of educational
and economic gains to beneficiaries as fully offset by effort costs and financial costs to
beneficiaries.
8.2 Costs and benefits to taxpayers
We calculate five cost sources for the government: scholarship costs net of savings from
reduced expenditure on public education, cost-savings from reduced secondary school grade
repetition, increased tertiary education costs, benefit costs, and foregone tax revenues due to
reduced work time among scholarship winners to the extent that they spend more time in
school.26 27
25 The gain for infra-marginal recipients = (fraction of infra-marginal recipients)*(impact on scholarship
amount)*(sum of year-by-year utilization rate). The fraction of lottery losers who attend private school in 6th grade
is 0.897 among females and 0.857 among males. The impact on scholarship amount is $93.2 (from Angrist et al.
2002 Table 8, column 3 updated to 2013 dollars). We observe the fraction of winners in private school using the
scholarship for grades 6th and 8th only. The 7th grade fraction is the linear combination of the 6th and 8th grade rates.
For females the fraction of winners in private school using the scholarship is 0.953 (6th), 0.736 (7th) and 0.519 (8th).
For males it is 0.933 (6th), 0.698 (7th) and 0.463 (8th). After 8th grade, we have no data on scholarship usage. We
know that 32 percent of the overall lottery loser sample finished 11th grade in private school. We assume a constant
deterioration from 8th grade to 11th grade in the fraction of losers attending private school. This implies a 40
percent reduction in the fraction attending private school, and we assume that deterioration in scholarship usage
among winners follows a similar 40 percent decline from the 8th grade level. Under these assumptions, scholarship
usage rates for females are 0.415 (9th), 0.310 (10th) and 0.206 (11th). For males the scholarship usage rates are
0.374 (9th), 0.284 (10th) and 0.195 (11th). 26 Based on US evidence, an additional and sizeable source of cost savings to the government is reduced teen
fertility (Saul Hoffman 2006). Estimates for Colombia on the monetary costs of teen fertility are only available for
society as a whole and already include foregone earnings as a cost (Arturo José Parada-Baños 2005). It is not clear
what fraction of these costs accrues to the government. We do not, therefore, account for cost-savings from
reduced teen fertility and as such, these fiscal impact estimates err on the side of being conservative. 27 After the passing of Law 100 of 1993, the pension system created two regimes: average premium (Regimen de
Prima Media) and individual savings with solidarity (Regimen de Ahorro Individual con Solidaridad). In the
average premium regime, employee and employer-side contributions go to a common pool of resources and
pension benefits are obtained as a function of age, formal sector earnings and time in formal sector employment.
There is no minimum pension amount in this regime. The individual savings regime is akin to individual retirement
28
8.2.a. Costs associated with secondary school of attendance
To estimate the first cost source to the government, namely, costs associated with
secondary school attendance, we note that there are two competing impacts of the scholarship
on public expenditures. First, for students who would have attended private school in the
absence of the program, the scholarship increases public expenditure. For example, a
substantial proportion (87.7 percent) of lottery losers attended private school in sixth grade.
While the government did not have to pay for the fees of the lottery losers, it did have to pay
for the scholarship value for students who won the lottery. Among these students, the average
annual expenditure increase was $214 ($214 = scholarship value * percentage of lottery losers
attending private school = $244 * .877). Note that the proportion of applicants who attended
private school among lottery losers quickly deteriorated (53.9 percent by 8th grade).
We make two other adjustments to these estimates. Among lottery winners, not all
private school attendees continued to use the scholarship. Even in the first year, 6 percent of
private school attendees who had been offered the scholarship had discontinued using it. By
8th grade, 33 percent of lottery winners who were attending private school were not using the
scholarship. 28 The second adjustment involves our assumptions about scholarship usage
between 8th and 11th grade. After 8th grade, we have no data on scholarship usage. From prior
data, we know that 54 percent of lottery losers were attending private school in 8th grade
(Angrist et al. 2002 Table 3) and that 32 percent of them finished 11th grade in private school
(Is this from Angrist et al. 2006 Table 2, other source?). We assume a constant (linear)
deterioration from 8th grade to 11th grade in the fraction of losers attending private school. This
implies a 40 percent relative reduction in the fraction attending private school, and we assume
that deterioration in scholarship usage among winners follows a similar 40 percent decline from
the 8th grade level.
We can compute the six-year increase in expenditure by taking the annual value of the
PACES scholarships ($244) and multiplying it by the proportion of students who would have
used the scholarship in grades 6 to 11 in the absence of the program (with these proportions
computed in the aforementioned way). When we integrate over the usage patterns, we estimate
accounts in the US in which accounts belong to the individual and pension benefits do not depend on age or other
parameters; they only depend on the principal and interest earned. In neither case, therefore, are there government
subsidies to retirees. 28 These students may have repeated grades, transferred schools, or voluntary given up the scholarship.

29
that public expenditure increased by $473 among all applicants ($472 for academic school
applicants and $474 for vocational school applicants) as a result of the awarding of private
school scholarships to students who intended to attend private schools regardless of the
scholarship program (Row 3 of Table 9).
The scholarship, however, induced some public school attendees to attend private
school. The scholarship’s value ($244) was considerably lower than the annual cost of public
school ($449). We assume that the marginal cost of public education equals the average cost
(since this was a period of expanding school enrollment), and thus, for each student who moved
from public to private school, the government saved $205 per year.29 To figure out the net
impact on overall costs, we multiply this cost savings by the proportion of students who
attended private schools as a result of the scholarship.30 When aggregated across the six years
after the scholarship, we compute that the scholarships reduced public expenditure by $175
among all applicants as a result of the shift of students from public to private schools (Row 4).
8.2.b. Other government costs
We compute four other costs to the government. These include reduced expenditure as
a result of fewer grade repetitions, increased tertiary education costs as a result of increased
attendance, changes in welfare program expenditures, and foregone tax revenue for students
who remain longer in school.
We defer a detailed explanation of the cost savings from reduced grade repetition among
scholarship winners to Appendix B. In short, we assume that i) only public school repetitions
cost the government money, ii) among applicants who finish on-schedule, there is no repetition;
iii) among applicants who finish with delays, the delays are all a consequence of grade repetition
and iv) among those who never finish secondary school, all dropouts happened in the transition
from grade 8 to grade 9, so that total repetitions for this group are as reported Angrist et al.
(2002) who measure applicants’ academic trajectories until grade 8. Under these assumptions,
29 Angrist et al. (2002, p. 1537) reports the annual cost of public school to be $350 and the average scholarship
value to be $190, both in 1998 dollars. We calculate that in 2013 prices, these figures correspond to $449 and 244,
respectively. 30 We obtain these impacts on private school attendance for grades 6th through 8th from Table 4, column 2 (for
males) and column 4 (for females). After 8th grade, we assume a constant change from the observed 8th grade
effect to the eventual effect at graduation.
30
the cost savings from reduced grade repetition are $4 (Row 5).31 The other three costs that we
estimate take place after secondary school. Hence, we can combine the cost savings associated
with repetition to our prior estimates to get the total secondary education costs. This total
expenditure over the six-years of remaining school includes the costs for students who would
have attended private schools in the absence of the program (Row 3), the net of savings from
reduced expenditure on public education for students induced to transfer from public to private
schools (Row 4), and cost savings from reduced grade repetition (Row 5). The overall total
increase in secondary school costs per lottery winner is thus $293 (Row 6).
There are two sources of tertiary education costs to the government: additional public
tertiary education costs and tertiary education loan subsidies.32 Additional public tertiary
education costs are estimated as annual per-pupil expenditures in public tertiary education
multiplied by both the scholarship impact on years of tertiary education and the fraction of
lottery winners attending a public tertiary institution (Row 7). Additional tertiary education
loan subsidies are estimated as annual per-pupil tertiary education loan subsidy amounts
multiplied by the scholarship impact on number of years of tertiary education (Row 8). Tertiary
education costs (public education plus loan subsidies) are thus $15 (-$12 for academic school
applicants and $55 for vocational school applicants, Row 9).
The program did not affect the probability of receiving government transfers, as
explained in Section 5. Therefore, additional welfare costs to the government are close to zero
($0.1 for academic school applicants, -$2.33 for vocational school applicants, Row 10). To the
extent that winners spent more time in school, the government may have foregone certain tax
revenue while they were in school. Based on Table 7, we assume that there is no difference in
informal sector earnings between scholarship winners and losers. Foregone VAT tax revenue,
therefore, equals formal annual formal sector earnings of scholarship lottery losers’ times the
31 We derive cost-savings estimates from data on public school costs, which we obtain for 1998 from Angrist et
al. (2002, see footnote 29). We discount these to base year by using the US-CPI change between base year and
incurrence of costs year (which we assume is 1998 in this case as we do not observe public school costs for any
other year). We then express these costs in US dollars for the year of analysis (2013) using US-CPI change between
the analysis and the base year. 32 Annual tertiary education subsidy data is based on the ACCES loan program and come from ICETEX (2014).
For low-income students (based on SISBEN and strata) who applied for a loan prior to 2011, the government
subsidizes 25 percent of the loan amount which, on average, amounts to $708/year at the exchange rate used for
year of analysis (see notes to Table 9 for details).
31
scholarship impact on years of education times the average VAT rate of 13.3 percent,33 which
equals $28 (Row 11).34
Foregone payroll taxes are annual payroll taxes for scholarship lottery losers’ times the
scholarship impact on additional years of education. Not all foregone payroll taxes, however,
represent a net government transfer because a large fraction of these goes back to the worker,
for instance, through the pension benefits formula. We estimate that at the margin forty percent
of payroll taxes represents a net transfer to the government. 35 Foregone net government
transfers from payroll taxes are $24 (Row 12). Total foregone revenue is the sum of foregone
VAT taxes and the net transfer from foregone payroll taxes, which totals $52 ($51 for academic
school applicants and $54 for vocational school applicants, Row 13).
Total expected scholarship costs are the sum of secondary education costs (6), additional
tertiary costs (9), welfare costs (10) and foregone revenue (Row 13). Total expected scholarship
costs are $360 ($333 for academic school applicants and $401 for vocational school applicants,
Row 14). As a robustness check to these calculations, if instead of using the base discount rate
of 3 percent we use a higher discount rate of 6 percent, scholarship costs to the government are
$319 ($300 for academic school applicants and $348 for vocational school applicants, Row 14).
33Jaramillo and Tovar (2008) Table 3 reports average VAT rates for five consumption groups: Transportation and
Communications (15.19%), Food (8.01%), Culture and Entertainment (13.97%), Housing (14.66%) and Other
(15.94%) We use data from Colombia’s Encuesta de Ingresos y Gastos from 2006/2007 to estimate the distribution
of consumption across these groups in the two lowest deciles of the consumption distribution, which are 7.4% for
Transportation and Communication, 25.6% for Food, 1.5% for Culture and Entertainment, 39.5% for Housing and
25.9% for Other. The average VAT tax rate of 13.3% is a weighted average of the VAT rates across the different
consumption groups, with the weights given by the share of consumption among the two lowest deciles in each
category. 34The current difference in formal sector earnings and payroll taxes between scholarship winners and losers already
accounts for foregone earnings due to any additional time in school between 2008 and 2012, which is the period
that our formal sector earnings data covers. Evidence from Table 2 indicates that scholarship winners, however,
already spent additional time in school prior to 2008, particularly finishing secondary school. Since we do not
observe earnings that far back, the assumption that foregone earnings then are similar to those now is fairly
conservative. 35 Ten percent of payroll taxes are earmarked to finance Colombia’s national job training agency (SENA) and the
national institute for family welfare (ICBF) and therefore represent a net transfer to the government. Thirty percent
of total payroll taxes are for health care services and also constitute a net government transfer because the
mandatory health plan, known as POS, provides services that do not depend on the amount paid in the system so
additional health payroll taxes among winners relax the government budget constraint. We conservatively assume
that the pension scheme involves no redistribution.

32
8.2.c Government revenue
There are two sources of future additional government revenue: additional revenue from
VAT taxes and additional government revenue from payroll taxes. This assumes that all formal
sector earnings are spent on goods with VAT levied and that no informal sector earnings are.
We use annual formal sector earnings (from Table 4). We project earnings for losers and
winners over a 35-year work horizon allowing for a 3.02 annual growth rate.36 The NPV of
additional earnings is the difference between the NPV of earnings for winners and the NPV of
earnings for losers. Multiplying the difference by the 13.3 percent VAT tax rate we get
additional VAT tax revenue, which is $1,098 ($151 for academic school applicants and $2,417
for vocational school applicants, Row 16).
Government revenue from payroll taxes is proportional to formal earnings. Relative to
losers, scholarship lottery winners pay $55.1, which at the losers’ mean of $696/year on payroll
taxes represents an increase of 8 percent (p-value 0.07, Panel A, Column 3, Table A3).
Among applicants to vocational schools, scholarship winners pay, on average, $125
more per year, which at the losers’ mean of $724 represents an increase of 17 percent. Among
applicants to academic schools, winners pay, on average, $3.9 more per year, a difference that
is not statistically significant relative to the academic losers’ mean of $694. The scholarship
impact difference across academic and vocational applicants for annual payroll taxes paid has
a p-value of 0.07 (Panel B, Column 3, Table A3).
We project annual payroll taxes for losers and winners over a 35-year work horizon
allowing for a 3.02 annual growth rate. The NPV of additional payroll taxes is the difference
between the NPV of payroll taxes for winners and the NPV of payroll taxes for losers. Expected
additional government revenue from payroll taxes is this difference multiplied by 40 percent
tax rate, since, as noted, at the margin forty percent of payroll taxes represents a net transfer to
the government. This comes to $929 ($45 for academic school applicants and $2,135 for
vocational school applicants, Row 17). Total expected additional government revenue is
$2,027 ($196 for academic school applicants and $4,551 for vocational school applicants, Row
18). The scholarship impacts on formal sector earnings among the vocational school applicant
sub-population entirely drive the positive expected additional government revenue, which we
36 The rate of 3.02 percent is the average annual growth in GDP per capita in Colombia between 2002 and 2012
(World Development Indicators database).
33
can reject to be zero in the full sample and among vocational school applicants with 95 percent
confidence.
As noted earlier, effects on formal self-reported earnings are consistent with estimates
from administrative data. Effects on informal self-reported earnings are likely zero or positive,
but even if they were negative, they would not have a major effect on these calculations, since
payroll taxes are not collected on informal earnings.
The point estimate of the net fiscal cost to taxpayers is -$1,667 ($136 for academic
school applicants and -$4,151 for vocational school applicants, Row 21). The upper bound of
the 95 percent confidence interval on the net fiscal cost per scholarship recipient is $304 ($2,913
for academic school applicants and -$372 for vocational school applicants) indicating that
expected net fiscal costs to taxpayers are likely to be negative in the full sample, with a small
probability that they are small and positive. Among vocational school applicants, the cost to
taxpayers is strongly negative.37
Note that net fiscal costs are negative even if one assumes that any increase in formal
sector earnings is offset by reduced informal earnings, so there are no gains in VAT revenue.
Expected net costs for taxpayers are negative and equal to -$569 due solely to increased payroll
tax receipt ($287 for academic school applicants, -$1,734 for vocational school applicants, Row
14 minus Row 20).38 These gains are solely based on the tax revenue and ignore additional cost
savings associated with teen-age pregnancy.
8.3 Externality impacts on others
While we can measure impacts on taxpayers and scholarship recipients, we are not able
to identify potential externality impacts on others, and to the extent that such effects exist, they
should be part of any welfare calculation. The calculation above implies that as long as any
externalities are either positive, or negative but less than $1,916 per lottery winner (Row 23,
Table 10), we can say with a high degree of confidence that the program is welfare improving
since the lower bound of 95 percent confidence interval is -$54.9 (the 90 percent confidence
37 The conclusion that the expected cost to taxpayers is negative seems reasonably robust to changes in the
assumptions. Expected net fiscal costs to taxpayers are also negative using a higher discount rate of 6 percent and
equal to -$1,223.73 (Row 15 minus Row 19). 38 Net fiscal costs are also negative for both females and males if we assume a discount rate of 6 percent instead
of the 3.66 percent rate assumed in the text. Net fiscal costs using the 6 percent discount rate are -$235.38 for
females and -$335.35 for males.
34
interval—not shown—is bounded away from zero). For vocational school applicants, we can
say with 95 percent confidence that the program is welfare enhancing as long as externalities
are either positive or negative but less than $4,400 per recipient. Although the mean estimate
net benefit for academic school applicants is positive, it is small and has wide confidence bands
(Row 23, Table 10).
The program is, thus, welfare-increasing unless it generates large negative externalities.
This seems unlikely since reduced teen fertility and the opening up of an avenue for social
mobility may generate positive externalities. There is little evidence for potential negative
externalities, for example, through labor market signaling or job rationing. Bettinger et al (2010)
suggests effects are not driven by improved peer quality for scholarship winners, which could
have been interpreted as generating a reduction in peer quality for non-participants. The net
negative externalities would have to be fairly large relative to program costs and to winners’
earnings gains—particularly among applicants to vocational schools—to change the
conclusions.
9. Conclusion
We present evidence on the long run educational, labor market, welfare, access to credit,
family and fiscal impacts of Colombia’s PACES scholarship program, one of the largest private
school scholarship programs in the world. As such, it is the first paper that explores the impact
of private school scholarships on long-run labor market outcomes and, ultimately, the
government’s budget constraint. We are able to take advantage of a setting in which: a) there
is exogenous variation in private school access due to random assignment of PACES
scholarships when demand exceeded availability; b) administrative data provides credible
evidence of impacts; c) we are examining an “as is” implementation of a large-scale government
program; and d) program rules enable us to examine program effects in a subpopulation of
scholarship applicants to vocational schools, amongst whom effects are unlikely to be primarily
the result of student re-sorting.
Winning a scholarship for private secondary schooling increases on-time secondary
school completion by 17 percent and ever completion by 10 percent (base rates are 45 percent
and 56.5 percent respectively). It increases tertiary education access by 13 percent and current
enrollment or graduation rates by 64 and 12 percent respectively (base rates are 19, 4 and 5
percent respectively). As a result, scholarship lottery winners accumulate 0.006 additional years

35
of tertiary education. Tertiary education effects are overwhelmingly concentrated in the
population of vocational school applicants.
Winning a scholarship increases the estimated amount that applicants pay in future
payroll taxes and earnings by 8 percent. Among vocational school applicants, winning a
scholarship increases earnings by 17 percent and payroll taxes by 16 percent. Higher earnings
likely reflect more than just a quantity of schooling effect, as the hypothesis that the effect was
due solely to increases in the quantity of schooling would imply implausibly large rates of return
to an additional year of education, particularly among vocational applicants.
A scholarship also increases access to formal consumer credit, in particular to card and
vehicle credit, both in the intensive and extensive margins, and it also leads to better credit
records and low credit costs. Effects on formal credit are mostly explained by winner applicants
to vocational schools, and in particular, to male applicants to vocational schools. This result
reinforces that on formal earnings on this same population.
Winning a scholarship reduces females’ teen fertility by at least 17 percent or 6.5
percentage points (base rate is 38 percent) while not affecting overall fertility.
With a single experiment, it is impossible to fully disentangle the channels of program
impact. However, gains at the tertiary education level and the labor market, particularly among
the sub-population of vocational school applicants, suggest that the impact of the program on
secondary completion was not simply due to schools gaming of the system by lowering the
standards for grade progression. Instead, our results suggest that private vocational education
may improve long-term outcomes by helping students to more effectively transition from
secondary school into advanced training and the labor force.
The scholarship program combined elements of a private school scholarship program
with elements of a merit scholarship program insofar as renewal of the scholarship was
conditional on grade progression. However, as noted, it is not clear how strongly the later
requirement was enforced in practice. If the effects of the program were solely due to its merit
scholarship component, then one would expect the strongest impacts to occur among those who
are near the boundary of failing grades. In fact, it seems that many of the strongest impacts are
at the top of the distribution, such as on tertiary enrolment—which only 19 percent of lottery
losers ever accomplish—and on tertiary graduation—which only 5 percent of losers
accomplish. Effects on formal sector earnings are also relevant at the top of the distribution.
36
Moreover, we do not observe any effects on the fraction of applicants who are eligible to receive
government subsidies. The main place we see an effect that might be at the bottom of the
distribution is on teen fertility.
Our results paint a more favorable picture of private school scholarships relative to
many of the results coming out of the US school choice literature. One possible explanation is
program design, as PACES allowed households to augment scholarship amounts, potentially
helping some students who would have attended private schools to trade up to better private
schools. Another explanation is contextual differences. Since the program only partially
covered costs, it attracted students whose families were willing to pay something for private
school and the treatment effect of moving from public to private education in the subpopulation
of those willing to pay for private education may be greater than in the population at large.
Our fiscal calculations suggest that the net fiscal cost of the program is negative due to
the indirect effect of scholarship receipt on government expenditure and revenue. Some
features of the program design minimized the fiscal cost of the program. First, scholarships
covered only part of the cost of private school and applicants had to cover the rest of the costs.
Indeed, the scholarships crowded-in educational expenses as households invested more total
resources in education (Angrist et al 2002). The conditioning of scholarship renewal created
incentives that reduced grade repetition (Angrist et al 2002). The scholarship program was
targeted to the poor and the poor typically don’t obtain admission to public universities. The
increased tertiary education induced by the scholarship was mainly at the expense of households
themselves rather than the Colombian treasury. Additional financial (as opposed to time)
investments by households in education generate positive fiscal externalities if the additional
human capital of scholarship lottery winners increases long-run earnings. Moreover, there is
no offsetting reduction on short-run labor supply (and hence short-run tax collection).39 The
fiscal estimates do not consider the potential welfare improving expenditures and investment
that could arise from the better access to formal credit markets generated by winning the
scholarship.
39 By contrast, other educational subsidy programs such as state merit aid programs in the US that pay for additional
years of school and keep students in school longer (see for example Dynarski 2000; Kane 2003) will have offsetting
effects. They reduce short-run tax revenue by delaying labor market entry and increase long-run revenue by
boosting later earnings, with the overall impact on the NPV of tax revenue unclear.

37
The Colombian government has a number of transfer programs designed to support
people at the bottom of the income distribution, such as Familias en Acción. One natural
question is whether it costs more or less to redistribute to strata 1 and 2 households through the
PACES private school scholarship program than through alternative means. It seems reasonable
to assume that the social cost of transferring one dollar per household through conditional cash
transfers is more than one dollar because such programs may distort labor supply or the
economic activity among those taxed to pay for the program and among beneficiaries who may
seek to remain eligible. The evidence presented here suggests that it likely costs substantially
less than a dollar to transfer one dollar in net present value to children born in strata one and
two households through private scholarships.
The results on vocational school applicants suggest that, at least in the Colombian
context, private vocational schools are a potentially promising and cost-effective educational
alternative to improve educational attainment, employability and school-to-work transitions.
Colombian private vocational schools, if anything, complement tertiary education investments
and the needs of the formal labor market (see also Kugler, Kugler, Saavedra and Herrera 2015,
and Attanasio, Guarín, Medina and Meghir 2017). (Of course one cannot draw the policy
conclusion that a program limited to vocational schools would have effects similar to that we
estimate for the effect of PACES on applicants to vocational schools since such a program
might well have induced very different types of students to apply to vocational schools). Bear
in mind though, that results found for vocational applicant are not necessarily transferable to
academic applicants since the lottery took place after the choice of the type of school had been
made.
The external validity of our results to other Colombian cities, or other cities in other
countries of the region, would heavily rely on the variation of the quality of public and private
education. Guarín, Medina and Posso (2017) show there are large variations in the quality of
public and private education across Colombian cities, based on which one could expect that
besides Bogotá, our results are likely to hold in cities like Medellín and Cartagena, but less
likely to hold in others like Bucaramanga, Tunja or Pasto, which have much higher quality
public schools.

38
References
Angulo, Roberto, Alejandro Gaviria, and Liliana Morales. 2013. “La decada ganada: Evolución
de la clase media y las condiciones de vida en Colombia 2002-2011.” Documento CEDE
2013-50, Universidad de los Andes, Bogotá, Colombia.
Angrist, Joshua, Eric Bettinger, Eric Bloom, Michael Kremer, and Elizabeth King. 2002.
“Vouchers for private schooling in Colombia: Evidence from a randomized natural
experiment.” American Economic Review 92 (5): 1535-1558.
Angrist, Joshua, Eric Bettinger, and Michael Kremer. 2006. “Long-term educational
consequences of secondary school vouchers: evidence from administrative records in
Colombia.” American Economic Review 96 (3): 847-862.
Attanasio, Orazio, Arlen Guarín, Carlos Medina and Costas Meghir. 2017. “Vocational
Training for Disadvantaged Youth in Colombia: A Long-Term Follow-Up.” American
Economic Journal: Applied Economics, 9(2): 131-143.
Baird, Sarah, Joan Hamory Hicks, Michael Kremer and Edward Miguel. 2013. “Worms at
work: Public finance implications of a child health investment” unpublished manuscript,
Harvard University.
Barrera-Osorio, Felipe, Marianne Bertrand, Leigh Linden and Francisco Perez-Calle. 2011.
“Improving the design of conditional transfer programs: Evidence from a randomized
education experiment in Colombia.” American Economic Journal: Applied Economics
3(2): 167-195.
Barrow, Lissa and Cecilia Elena Rouse. 2008. “School Vouchers: Recent Findings and
Unanswered Questions.” Economic Perspectives, Federal Reserve Bank of Chicago.
Bettinger, Eric, Michael Kremer, and Juan E. Saavedra. 2010. “Are Educational Vouchers Only
Redistributive?” The Economic Journal 120(546): F204-F228.
Breierova, Lucia and Esther Duflo. 2004. “The impact of education on fertility and child
mortality: Do fathers really matter less than mothers?” National Bureau of Economic
Research Working Paper 10513.
Calderón, Alberto. 1996 “Voucher programs for secondary schools: The Colombian
experience.” World Bank Human Capital Development Working Paper 66.
Chetty, Raj, John N. Friedman, Nathaniel Hilger, Emmanuel Saez, Diane Schanzenbach, and
Danny Yagan. 2011. “How Does Your Kindergarten Classroom Affect Your Earnings?
Evidence from Project STAR.” Quarterly Journal of Economics 126 (4): 1593-1660. Cortés, Darwin, Juan Miguel Gallego, and Darío Maldonado. 2010. “On the Design of
Education Conditional Cash Transfer Programs and Non-Education Outcomes: The

39
Case of Teen Pregnancy.” Working Paper 100, Economics Department Universidad del
Rosario, Bogotá. Cowen, Joshua, David Fleming, John Witte, Patrick Wolf, and Brian Kisida. 2012. “Student
Attainment and the Milwaukee Parental Choice Program: Final follow-up Analysis.”
SCDP Milwaukee Evaluation Report # 30.
Cunha, Flavio, James J. Heckman, Lance Lochner and Dimitriy Masterov. 2006. “Interpreting
the evidence on life cycle skill formation,” in Handbook of Economics of Education
edited by Eric A. Hanushek and Finis Welch. Amsterdam: North Holland.
Deming, David, Justine Hastings, Thomas Kane, and Doug Staiger. Forthcoming. “School
Choice, School Quality and Postsecondary Attainment.” American Economic Review.
Dynarski, Susan. 2000. “Hope for whom? Financial aid for the middle class and its impact on
college attendance.” National Tax Journal 53(3): 629-661.
Dynarski, Susan, Joshua Hyman, and Diane Schanzenbach. 2011. “Experimental Evidence on
the Effects of Childhood Investments on Postsecondary Attainment and Degree
Completion.” Mimeo University of Michigan.
Duflo, Esther, Pascaline Dupas and Michael Kremer. 2015. “Education, HIV and early fertility:
Experimental evidence from Kenya.” American Economic Review, American
Economic Association, vol. 105(9), pages 2757-97, September.
Duflo, Esther, Pascaline Dupas and Michael Kremer. 2017. “The impact of free secondary
education: Experimental evidence from Ghana,” mimeo Stanford University.
Encuesta Nacional de Calidad de Vida. 2010. Data source available at:
http://190.25.231.249/metadatos/index.php/catalog. Retrieved on March 25, 2014.
Epple, Dennis and Richard Romano. 1998. “Competition between private and public schools,
vouchers and peer-group effects.” American Economic Review 88(1): 33-62.
Fasecolda (2014) “Análisis técnico y económico del ramo de automóviles”
Guarín, Arlen, Carlos Medina and Christian Posso (2017) “Calidad y Cobertura de la Educación
Pública y Privada en Colombia, y sus Costos Ocultos” Borradores de Economía No.
1006, August.
Gutiérrez, Catalina, Olga Lucía Acosta and Eduardo Alfonso. 2013. “Financiación del sistema
de salud: retos y perspectivas.” Notas de Política 13 (April), Bogotá: Universidad de
los Andes.
40
Hainmueller, Jens. 2012. Entropy Balancing for Causal Effects: A Multivariate Reweighting
Method to Produce Balanced Samples in Observational Studies." Political Analysis,
20(1): 25-46.
Heckman, James. 2008. "Schools, Skills, and Synapses." Economic Inquiry 46 (3): 289-324.
Heckman, James and Dimitriy Masterov. 2007. "The Productivity Argument for Investing in
Young Children." Review of Agricultural Economics 29 (3): 446-493.
Hendren, Nathaniel. 2013. “The Policy Elasticity.” Unpublished manuscript, Harvard
University.
Herkenhoff, Kyle, Gordon Phillips and Ethan Cohen-Cole (2016) “The Impact of Consumer
Credit Access on Employment, Earnings and Entrepreneurship” NBER WP No. 22846,
November.
Hoffman, Saul. 2006. “By the numbers: The Public Costs of Teen Childbearing.” Washington
D.C.: The National Campaign to Prevent Teen Pregnancy.
Hoxby, Caroline. 2003. “School choice and school competition: evidence from the United
States.” Swedish Economic Policy Review, 10: 9–65.
Hsieh, Chang-Tai and Miguel Urquiola. 2006. “The Effects of Generalized School Choice on
Achievement and Stratification: Evidence from Chile’s School Voucher Program.”
Journal of Public Economics 90: 1477-1503.
ICETEX. 2014. Subsidio y sostenimiento, http://www.icetex.gov.co/dnnpro5/es-
co/cr%C3%A9ditoeducativo/estudiost%C3%A9cnicostecnol%C3%B3gicosyuniversit
arios/largoplazoacces.aspx. Retrieved October 17, 2014.
ICFES. 2013. Personal email communication. May 6 of 2013.
Jack, W., Michael Kremer, Joost de Laat and Tavneet Suri (2016) “Borrowing Requirements,
Credit Access, and Adverse Selection: Evidence from Kenya” NBER WP No. 22686,
September.
Jaramillo, Christian and Jorge Tovar. 2008. “El impacto de impuesto al valor agregado sobre el
gasto en Colombia. Lecturas de Economía 68 (enero-junio): 67-93.
Kane, Thomas. 2003. “A quasi-experimental estimate of the impact of financial aid on college-
going.” NBER working paper # 9703. Cambridge: National Bureau of Economic
Research.
Kugler, Adriana, Maurice Kugler, Juan E. Saavedra and Luis O. Herrera. 2015. “Long term
direct and spillover effects of job training: Experimental evidence from Colombia.”
NBER working paper # 21607. Cambridge: National Bureau of Economic Research.

41
Kemple, James J. 2004. Career Academies: Impacts on labor market outcomes and educational
attainment. New York: Manpower Demonstration Research Corporation.
King Elizabeth, Laura Rawlings, Marybell Gutierrez M, Carlos Pardo, and Carlos Torres. 1997.
“Colombia’s Targeted Education Voucher Program: Features, Coverage, and
Participation.” Impact Evaluation of Education Reforms Working Paper 3,
Development Economics Research Group, World Bank.
Kremer, Michael, Edward Miguel and Rebecca Thornton. 2009. “Incentives to learn.” Review
of Economics and Statistics 91(3): 437-456.
Ladd, Helen. 2002. “School vouchers: A critical review.” Journal of Economic Perspectives,
16(4): 3-24.
MacLeod, W. Bentley and Miguel Urquiola. 2013. “Competition and educational productivity:
Incentives writ large” in Education Policy in Developing Countries, edited by Paul
Glewwe, Chicago: University of Chicago Press.
Ministerio de Educación Nacional. 2010. “Resumen de estadísticas de las universidades
públicas 2003-2010.” Sistema Nacional de Información sobre la Educación Superior.
Ministerio de Educación Nacional. 2014a. Estadísticas sectoriales educación básica y media.
http://menweb.mineducacion.gov.co/seguimiento/estadisticas/principal.php?seccion=2
&consulta_detalle=et&id_categoria=2&nivel=2&et=&consulta=mat_sector, retrieved
on February 20, 2014.
Ministerio de Educación Nacional. 2014b. Estadísticas sectoriales educación básica y media.
http://menweb.mineducacion.gov.co/seguimiento/estadisticas/principal.php?seccion=9
&id_categoria=2&consulta=coberturan_nivel&nivel=9&dpto=&et=&mun=&ins=&se
de=&consulta_detalle=et, retrieved on February 20, 2014.
Muralidharan, Karthik and Venkatesh Sundararaman. 2013. “The aggregate effect of school
choice: Evidence from a two-stage experiment in India.” Unpublished manuscript,
University of California, San Diego.
Parada-Baños, Arturo José. 2005. “El embarazo adolescente le cuesta al país.” UN Periódico
http://historico.unperiodico.unal.edu.co/Ediciones/72/05.htm, retrieved March 1, 2014.
Ribero, Rocio and Jorge Tenjo. 1997. “Evaluación del programa de becas PACES.”
Unpublished manuscript, Universidad de los Andes, Bogotá, Colombia.
Saavedra, Juan E. and Carlos Medina. 2014. “Formación para el Trabajo en Colombia”, in
Armando Montenegro and Marcela Meléndez (eds.) Equidad y Movilidad Social:
Diagnósticos y Propuestas para la Transformación de la Sociedad Colombiana Bogota:
Universidad de los Andes.
42
Sánchez, Fabio and Jairo Núñez. 1995. “Por qué los niños pobres no van a la escuela?
(Determinantes de la asistencia escolar en Colombia).” Archivos de Macroeconomía #
39. Departmento Nacional de Planeación, República de Colombia.
Secretaría de Desarrollo Económico de Bogotá. 2012. “Disminuye la informalidad laboral en
Bogotá durante el segundo trimestre de 2012.” DESR # 73, August.
United Nations. 2000. World marriage patterns.
http://www.un.org/esa/population/publications/worldmarriage/worldmarriagepatterns2
000.pdf, retrieved February 23, 2014.
Urquiola, Miguel. 2005. “Does School Choice Lead to Sorting? Evidence from Tiebout
Variation.” American Economic Review 95 (4): 1310-1326.
Wolf, Patrick, Babette Gutmann, Michael Puma, Brian Kisida, Lou Rizzo, Nada Eissa, and
Matthew Carr. 2010. “Evaluation of the D.C. Opportunity Scholarship Program: Final
Evaluation Report.” U.S. Department of Education, Institute of Education Science,
NCEE 2000-4023.
World Bank. 2003. “Tertiary Education in Colombia: Paving the Way for Reform.” World Bank
Country Study # 26289. Washington D.C.: The World Bank.

43
Table 1. Descriptive statistics of the Bogotá 1995 PACES scholarship applicant cohort 1
All Academic Applicants Vocational Applicants
Loser's
Mean
Won
Scholarship
Won
Scholarship,
Valid School
Type Info
Loser's
Mean
Won
Scholarship
Loser's
Mean
Won
Scholarship
(1) (2) (3) (4) (5) (7) (8)
A. Data from PACES
Application
Has Phone 0.882 0.009 0.009 0.869 0.013 0.899 0.003
(0.011) (0.011) (0.015) (0.016)
Age at time of application 12.74 -0.086 -0.086 12.78 -0.033 12.63 -0.144
(1.327) (0.045)* (0.046)* (1.333) (0.062) (1.287) (0.068)**
Male 0.49 0.011 0.018 0.504 0.008 0.457 0.033
(0.017) (0.017) (0.023) (0.026)
Applied to Vocational School 0.433 0.017 0.017
(0.017) (0.017)
B. National Identification Data
Valid youth identification
number 0.967 0.001 0.002 0.959 0.013 0.976 -0.011
(0.006) (0.006) (0.009) (0.009)
Valid adult identification
number 0.978 -0.003 -0.004 0.979 -0.008 0.979 0.001
(0.005) (0.005) (0.007) (0.007)
N 1519 3661 3413 803 1901 613 1512
Notes: Table reports OLS scholarship lottery loser’s means and estimated effects of winning a scholarship. Numbers in parentheses are standard deviations in 2 columns of means and standard errors in columns of estimated scholarship effects. Results in Panel A are the same as those in Angrist et al. (2006) for having a 3 phone, age at the time of application and gender, and as those in Bettinger et al. (2010) for having applied to a vocational school.4
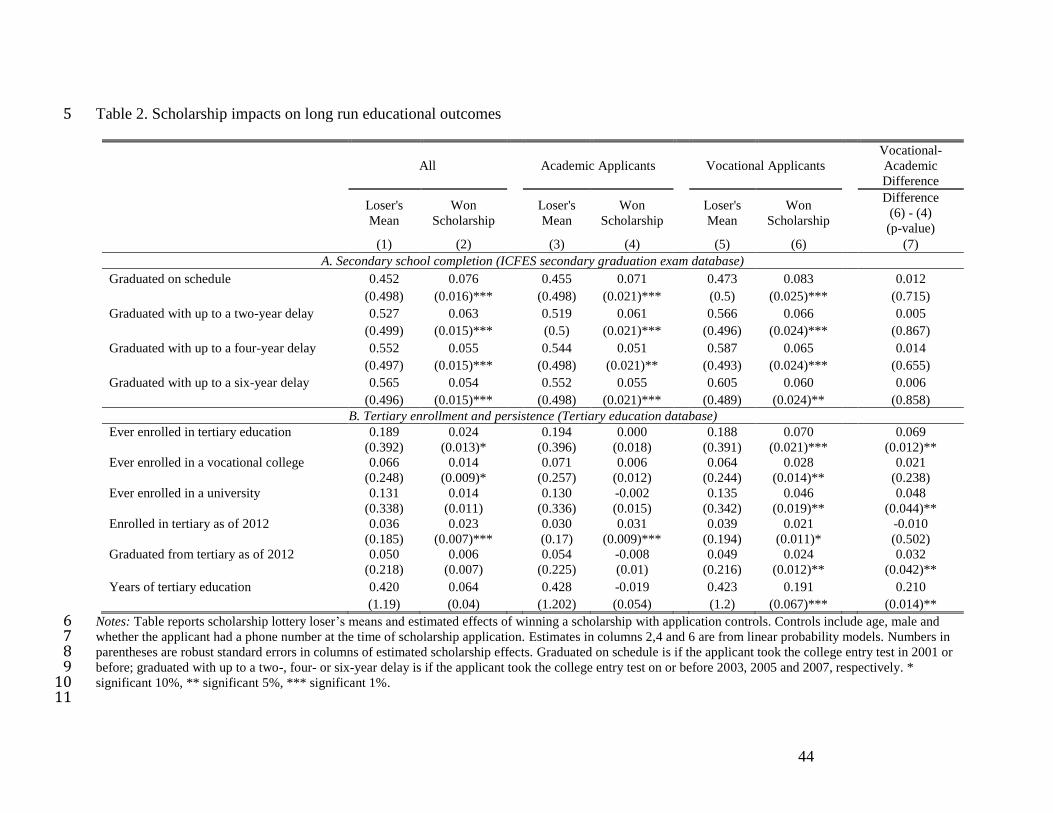
44
Table 2. Scholarship impacts on long run educational outcomes 5
All Academic Applicants Vocational Applicants
Vocational-
Academic
Difference
Loser's
Mean
Won
Scholarship
Loser's
Mean
Won
Scholarship
Loser's
Mean
Won
Scholarship
Difference
(6) - (4)
(p-value)
(1) (2) (3) (4) (5) (6) (7)
A. Secondary school completion (ICFES secondary graduation exam database)
Graduated on schedule 0.452 0.076 0.455 0.071 0.473 0.083 0.012
(0.498) (0.016)*** (0.498) (0.021)*** (0.5) (0.025)*** (0.715)
Graduated with up to a two-year delay 0.527 0.063 0.519 0.061 0.566 0.066 0.005
(0.499) (0.015)*** (0.5) (0.021)*** (0.496) (0.024)*** (0.867)
Graduated with up to a four-year delay 0.552 0.055 0.544 0.051 0.587 0.065 0.014
(0.497) (0.015)*** (0.498) (0.021)** (0.493) (0.024)*** (0.655)
Graduated with up to a six-year delay 0.565 0.054 0.552 0.055 0.605 0.060 0.006
(0.496) (0.015)*** (0.498) (0.021)*** (0.489) (0.024)** (0.858)
B. Tertiary enrollment and persistence (Tertiary education database)
Ever enrolled in tertiary education 0.189 0.024 0.194 0.000 0.188 0.070 0.069
(0.392) (0.013)* (0.396) (0.018) (0.391) (0.021)*** (0.012)**
Ever enrolled in a vocational college 0.066 0.014 0.071 0.006 0.064 0.028 0.021
(0.248) (0.009)* (0.257) (0.012) (0.244) (0.014)** (0.238)
Ever enrolled in a university 0.131 0.014 0.130 -0.002 0.135 0.046 0.048
(0.338) (0.011) (0.336) (0.015) (0.342) (0.019)** (0.044)**
Enrolled in tertiary as of 2012 0.036 0.023 0.030 0.031 0.039 0.021 -0.010
(0.185) (0.007)*** (0.17) (0.009)*** (0.194) (0.011)* (0.502)
Graduated from tertiary as of 2012 0.050 0.006 0.054 -0.008 0.049 0.024 0.032
(0.218) (0.007) (0.225) (0.01) (0.216) (0.012)** (0.042)**
Years of tertiary education 0.420 0.064 0.428 -0.019 0.423 0.191 0.210
(1.19) (0.04) (1.202) (0.054) (1.2) (0.067)*** (0.014)**
Notes: Table reports scholarship lottery loser’s means and estimated effects of winning a scholarship with application controls. Controls include age, male and 6 whether the applicant had a phone number at the time of scholarship application. Estimates in columns 2,4 and 6 are from linear probability models. Numbers in 7 parentheses are robust standard errors in columns of estimated scholarship effects. Graduated on schedule is if the applicant took the college entry test in 2001 or 8 before; graduated with up to a two-, four- or six-year delay is if the applicant took the college entry test on or before 2003, 2005 and 2007, respectively. * 9 significant 10%, ** significant 5%, *** significant 1%. 10 11
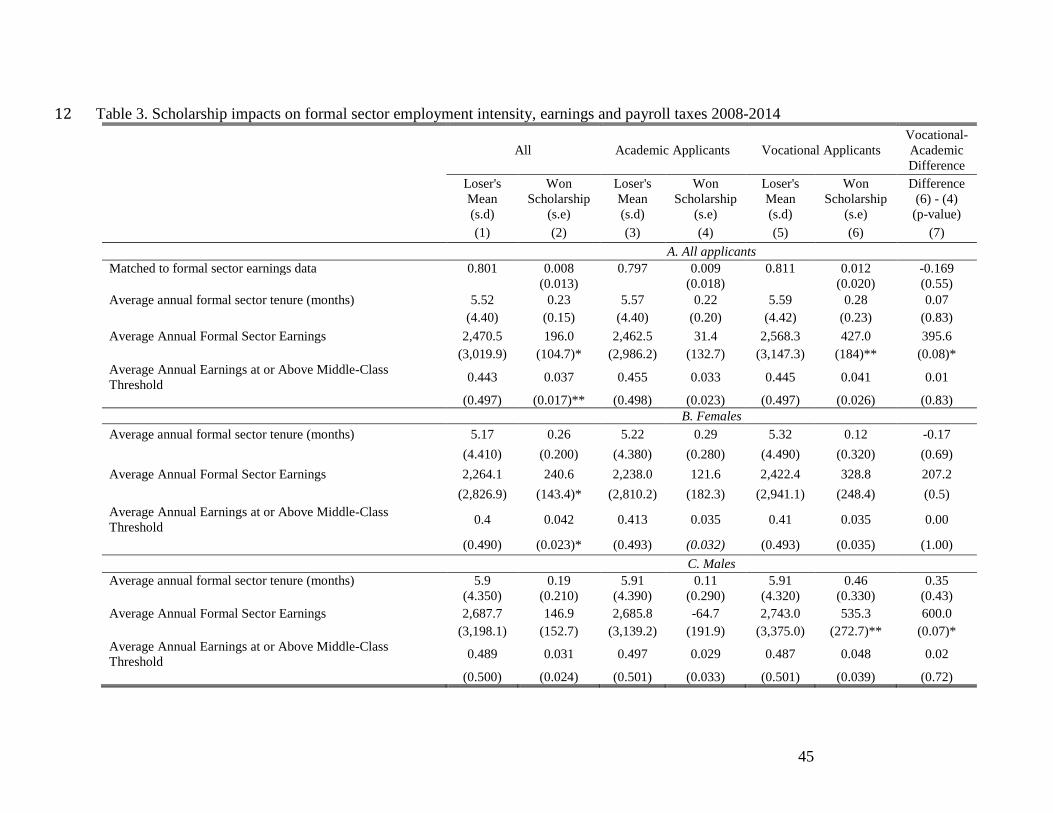
45
Table 3. Scholarship impacts on formal sector employment intensity, earnings and payroll taxes 2008-2014 12
All Academic Applicants Vocational Applicants
Vocational-
Academic
Difference
Loser's
Mean
(s.d)
Won
Scholarship
(s.e)
Loser's
Mean
(s.d)
Won
Scholarship
(s.e)
Loser's
Mean
(s.d)
Won
Scholarship
(s.e)
Difference
(6) - (4)
(p-value)
(1) (2) (3) (4) (5) (6) (7)
A. All applicants
Matched to formal sector earnings data 0.801 0.008 0.797 0.009 0.811 0.012 -0.169
(0.013) (0.018) (0.020) (0.55)
Average annual formal sector tenure (months) 5.52 0.23 5.57 0.22 5.59 0.28 0.07
(4.40) (0.15) (4.40) (0.20) (4.42) (0.23) (0.83)
Average Annual Formal Sector Earnings 2,470.5 196.0 2,462.5 31.4 2,568.3 427.0 395.6
(3,019.9) (104.7)* (2,986.2) (132.7) (3,147.3) (184)** (0.08)*
Average Annual Earnings at or Above Middle-Class
Threshold 0.443 0.037 0.455 0.033 0.445 0.041 0.01
(0.497) (0.017)** (0.498) (0.023) (0.497) (0.026) (0.83)
B. Females
Average annual formal sector tenure (months) 5.17 0.26 5.22 0.29 5.32 0.12 -0.17
(4.410) (0.200) (4.380) (0.280) (4.490) (0.320) (0.69)
Average Annual Formal Sector Earnings 2,264.1 240.6 2,238.0 121.6 2,422.4 328.8 207.2
(2,826.9) (143.4)* (2,810.2) (182.3) (2,941.1) (248.4) (0.5)
Average Annual Earnings at or Above Middle-Class
Threshold 0.4 0.042 0.413 0.035 0.41 0.035 0.00
(0.490) (0.023)* (0.493) (0.032) (0.493) (0.035) (1.00)
C. Males
Average annual formal sector tenure (months) 5.9 0.19 5.91 0.11 5.91 0.46 0.35
(4.350) (0.210) (4.390) (0.290) (4.320) (0.330) (0.43)
Average Annual Formal Sector Earnings 2,687.7 146.9 2,685.8 -64.7 2,743.0 535.3 600.0
(3,198.1) (152.7) (3,139.2) (191.9) (3,375.0) (272.7)** (0.07)*
Average Annual Earnings at or Above Middle-Class
Threshold 0.489 0.031 0.497 0.029 0.487 0.048 0.02
(0.500) (0.024) (0.501) (0.033) (0.501) (0.039) (0.72)

46
Notes: Annual average earnings are for the period July 2008 to December 2014. Monetary values are expressed in 2013 USD. Numbers in parentheses are 13 standard deviations in columns of means and standard errors in columns of estimated scholarship effects. Controls include age, male and whether the applicant 14 had a phone number at the time of scholarship application. Formal sector earnings estimates use the health payroll account. Middle-class earnings threshold is 15 PPP $3,600/year (Angulo et al. 2013). Formal sector earnings data begins in July 2008 and end in December 2014 and is restricted to applicants with valid adult 16 identification number that have complete application controls. In Panel A the sample of all applicant has 3574 observations, the sample of academic school 17 applicants has 1852 observations and the sample of vocational school applicants has 1481 observations. In Panel B, the full female sample has 1807 18 observations; the sample of academic school female applicants has 912 observations and the sample of vocational school female applicants has 779 observations. 19 In Panel C, the full male sample has 1767 observations; the sample of academic school male applicants has 940 observations and the sample of vocational school 20 male applicants has 702 observations.* significant 10%, ** significant 5% *** significant 1%. 21 22 23 24 25 26 27 28 29

47
Table 4. Decomposition of formal earnings impacts 30
All Vocational Applicants Academic Applicants
Loser's
Mean
(s.d)
Won
Scholarship
(s.e)
Loser's
Mean
(s.d)
Won
Scholarship
(s.e)
Loser's
Mean
(s.d)
Won
Scholarship
(s.e)
(1) (2) (3) (4) (5) (6)
1. Scholarship impact on completed years of
schooling (A) 10.42 0.13 10.43 0.04 10.49 0.27
(1.61) (0.05)** (1.64) (0.07) (1.61) (0.08)***
2. Scholarship impact on Average Annual
Formal Sector Earnings 2008-2014 (B) 2,470.5 196.0 2,462.5 31.4 2,568.3 427.0
(3019.9) (104.7)* (2986.2) (132.7) (3147.3) (184)**
3. Mincerian return to a year of schooling in
sample of scholarship losers (C) 642.8 608.4 740.8 (80.3)*** (108.6)*** (128.1)*** 4. Earnings differential attributed solely to
additional years of schooling among scholarship
winners (A*C) $83.6 $24.3 $200.0
5. Percent of annual formal sector earnings
scholarship impact due to increased years of
schooling among winners (A*C)/B 42.6% 77.4% 46.8%
6. Percent of annual formal sector earnings
scholarship impact due to other factors
conditional on years of schooling (1- [A*C]/B) 57.4% 22.6% 53.2%
Notes: Table reports a decomposition of earnings impacts into portion due to additional completed years of schooling among scholarship winners and a portion 31 due to other factors conditional on years of schooling. Sample is all Bogotá 1995 lottery applicants with complete application covariate data (see Table 1). The 32 first row reports the effect on completed years of schooling. The second row reproduces the result on average annual formal earnings from Table 4. The third row 33 reports a coefficient of completed years of schooling from an OLS regression in the sample of lottery losers in which the dependent variable is average annual 34 formal earnings in 2008-2014 controlling for PACES application covariates. * significant 10%, ** significant 5%. *** significant 1%. 35 36 37
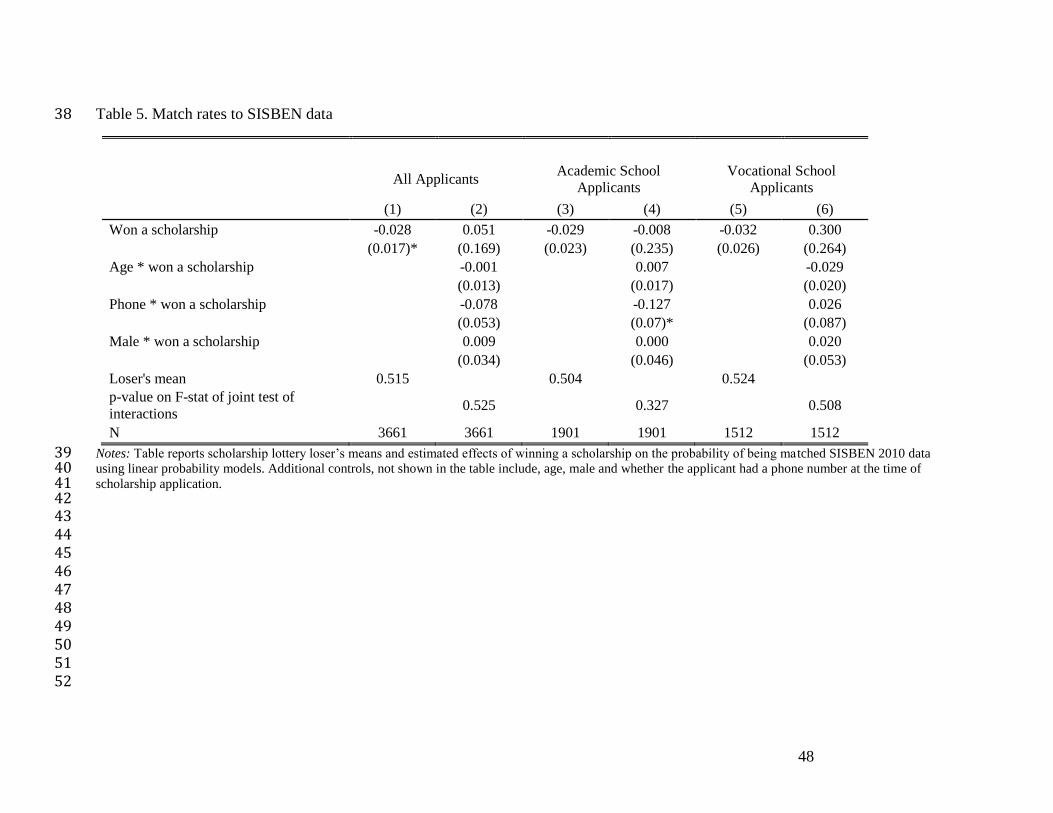
48
Table 5. Match rates to SISBEN data 38
All Applicants Academic School
Applicants
Vocational School
Applicants
(1) (2) (3) (4) (5) (6)
Won a scholarship -0.028 0.051 -0.029 -0.008 -0.032 0.300
(0.017)* (0.169) (0.023) (0.235) (0.026) (0.264)
Age * won a scholarship -0.001 0.007 -0.029
(0.013) (0.017) (0.020)
Phone * won a scholarship -0.078 -0.127 0.026
(0.053) (0.07)* (0.087)
Male * won a scholarship 0.009 0.000 0.020
(0.034) (0.046) (0.053)
Loser's mean 0.515 0.504 0.524
p-value on F-stat of joint test of
interactions 0.525 0.327 0.508
N 3661 3661 1901 1901 1512 1512
Notes: Table reports scholarship lottery loser’s means and estimated effects of winning a scholarship on the probability of being matched SISBEN 2010 data 39 using linear probability models. Additional controls, not shown in the table include, age, male and whether the applicant had a phone number at the time of 40 scholarship application. 41 42 43 44 45 46 47 48 49 50 51 52

49
Table 6. Bounds on total self-reported annual earnings’ scholarship impacts 53 All Academic Applicants Vocational Applicants
Loser's
Mean
Won
Scholarship
Loser's
Mean
Won
Scholarship
Loser's
Mean
Won
Scholarship
(1) (2) (3) (4) (5) (6)
A. All applicants
Lower bound 2,517.9 -139.6 2,699.6 -311.6 2,359.6 14.2
(218.4) (399.1) (165.5)
Upper bound 2,000.2 365.8 2,041.0 331.8 2,064.9 315.8
(80.1)*** (113.5)*** (125.4)**
B. Females
Lower bound 1,944.1 0.5 1,894.0 31.6 2,082.1 -71.9
(138.6) (166.6) (251.6)
Upper bound 1,696.3 247.7 1,702.9 223.5 1,736.6 283.6
(112.7)** (158.9) (175.2)
C. Males
Lower bound 3,198.5 -311.7 3,567.6 -765.8 2,749.0 154.4
(446.3) (845.0) (183.1)
Upper bound 2,439.6 440.5 2,461.0 366.7 2,581.7 324.5
(111.8)*** (158.1)** (175.8)*
Notes: Table reports scholarship lottery loser’s means and bounds of the effects of winning a scholarship on total self-reported annual earnings expressed in 2013 54 USD. Lower bound earnings are obtained from an OLS regression of SISBEN self-reported earnings, with missing values for those not in the SISBEN census. 55 Upper bound earnings from an OLS regression in which SISBEN earnings from the top 5 percent of scholarship winners are trimmed from the sample. Controls 56 include age, male and whether the applicant had a phone number at the time of scholarship application. Robust standard errors in parentheses. * significant 10%, 57 ** significant 5%. 58 59 60

50
Table 7. Scholarship impacts on formal credit access 61
All Academic Applicants Vocational
Applicants
Vocational-
Academic
Loser's
Mean
(s.d)
Won
Scholarship
(s.e)
Loser's
Mean
(s.d)
Won
Scholarship
(s.e)
Loser's
Mean
(s.d)
Won
Scholarship
(s.e)
Difference
(6) - (4)
(p-value)
(1) (2) (3) (4) (5) (6) (7)
A. All applicants
Has Credit Card 0.564 0.038 0.568 0.034 0.560 0.054 0.020
(0.016)** (0.023) (0.025)** (0.034)
Has Car Loan 0.041 0.006 0.042 -0.003 0.038 0.021 0.024
(0.007) (0.009) (0.011)* (0.014)*
B. Females
Has Credit Card 0.542 0.030 0.543 0.042 0.550 0.023 -0.018
(0.023) (0.032) (0.035) (0.048)
Has Car Loan 0.037 -0.001 0.035 0.005 0.039 -0.006 -0.011
(0.009) (0.013) (0.014) (0.019)
C. Males
Has Credit Card 0.586 0.045 0.593 0.026 0.571 0.087 0.062
(0.023)* (0.032) (0.037)** (0.048)
Has Car Loan 0.044 0.013 0.049 -0.010 0.036 0.051 0.061
(0.010) (0.013) (0.018)*** (0.022)***
Notes: Table reports scholarship lottery loser’s means and estimated effects of winning a scholarship on access to formal consumer credit (credit cards and car 62 loans). Numbers in parentheses are standard deviations in columns of means and standard errors in columns of estimated scholarship effects. Controls include 63 age, male and whether the applicant had a phone number at the time of scholarship application. Credit data is collected quarterly and it begins in the first quarter 64 of 2004 and end in the last quarter of 2014 and is restricted to applicants with valid adult identification number that have complete application controls. In Panel 65 A the sample of all applicant has 3661 observations, the sample of academic school applicants has 1901 observations and the sample of vocational school 66 applicants has 1512 observations. In Panel B, the full female sample has 1845 observations; the sample of academic school female applicants has 933 67 observations and the sample of vocational school female applicants has 792 observations. In Panel C, the full male sample has 1816 observations; the sample of 68 academic school male applicants has 968 observations and the sample of vocational school male applicants has 720 observations.* significant 10%, ** significant 69 5%, *** significant 1%. 70 71

51
Table 8. Bounds on scholarship effects on fertility 72
All Academic Applicants Vocational Applicants
Vocational-
Academic
Difference
Loser's
Mean
(s.d)
Won
Scholarship
(s.e)
Loser's
Mean
(s.d)
Won
Scholarship
(s.e)
Loser's
Mean
(s.d)
Won
Scholarship
(s.e)
Difference
(6) - (4)
(p-value)
(1) (2) (3) (4) (5) (6) (7)
A. All applicants
Had any child as a teen
LB 0.234 -0.043 0.240 -0.064 0.224 -0.023 0.041
(0.424) (0.018)** (0.427) (0.025)** (0.418) (0.029) (0.286)
UB 0.242 -0.047 0.249 -0.070 0.228 -0.025 0.045
(0.429) (0.019)** (0.433) (0.026)*** (0.421) (0.030) (0.252)
Spouse/partner had a child as a teen
LB 0.106 -0.030 0.111 -0.034 0.087 -0.019 0.015
(0.308) (0.014)** (0.315) (0.020)* (0.283) (0.020) (0.589)
UB 0.108 -0.032 0.113 -0.036 0.093 -0.025 0.011
(0.310) (0.014)** (0.317) (0.020)* (0.291) (0.021) (0.697)
Total number of children
LB 1.061 -0.040 1.047 -0.016 1.006 0.013 0.029
(1.034) (0.045) (1.022) (0.063) (0.981) (0.067) (0.751)
UB 1.082 -0.049 1.064 -0.022 1.033 -0.003 0.019
(1.045) (0.046) (1.026) (0.064) (0.991) (0.069) (0.842)
B. Females
Had any child as a teen
LB 0.377 -0.065 0.402 -0.105 0.337 -0.035 0.071
(0.485) (0.031)** (0.492) (0.045)** (0.474) (0.047) (0.273)
UB 0.387 -0.074 0.418 -0.121 0.337 -0.034 0.087
(0.488) (0.032)** (0.495) (0.046)*** (0.474) (0.047) (0.183)
Spouse/partner had a child as a teen
LB 0.056 -0.011 0.055 -0.007 0.043 -0.010 -0.003
(0.231) (0.015) (0.229) (0.021) (0.204) (0.020) (0.923)
UB 0.059 -0.014 0.058 -0.010 0.046 -0.012 -0.002
(0.236) (0.015) (0.235) (0.022) (0.209) (0.020) (0.940)

52
Total number of children
LB 1.355 -0.023 1.367 0.019 1.250 0.021 0.002
(1.031) (0.065) (1.021) (0.092) (0.993) (0.095) (0.990)
UB 1.399 -0.061 1.413 -0.024 1.280 0.001 0.025
(1.026) (0.065) (1.015) (0.093) (0.992) (0.097) (0.851)
C. Males
Had any child as a teen
LB 0.078 -0.020 0.083 -0.022 0.073 -0.007 0.015
(0.268) (0.018) (0.276) (0.024) (0.261) (0.028) (0.682)
UB 0.081 -0.024 0.087 -0.026 0.075 -0.008 0.017
(0.274) (0.018) (0.282) (0.025) (0.264) (0.028) (0.643)
Spouse/partner had a child as a teen
LB 0.161 -0.051 0.165 -0.058 0.146 -0.031 0.028
(0.368) (0.024)** (0.372) (0.033)* (0.354) (0.038) (0.581)
UB 0.166 -0.056 0.173 -0.066 0.149 -0.034 0.032
(0.372) (0.024)** (0.380) (0.034)** (0.358) (0.039) (0.531)
Total number of children
LB 0.740 -0.061 0.738 -0.033 0.679 0.003 0.037
(0.939) (0.062) (0.926) (0.086) (0.865) (0.092) (0.770)
UB 0.742 -0.060 0.750 -0.041 0.687 -0.002 0.040
(0.947) (0.063) (0.941) (0.088) (0.871) (0.093) (0.756)
Notes: Table reports scholarship lottery loser’s means and estimated bounds on the effects of winning a scholarship fertility outcomes based on SISBEN 2010 73 data. Lower bound (LB) earnings are obtained from an OLS regression of SISBEN self-reported earnings, with missing values for those not in the SISBEN 74 census. Upper bound (UB) earnings from an OLS regression in which SISBEN earnings from the top 5 percent of scholarship losers are trimmed from the 75 sample. Numbers in parentheses are robust standard errors with the exception of total number of children in columns 1, 3 and 5, which are standard deviations of 76 the loser’s mean. Controls include age, male and whether the applicant had a phone number at the time of scholarship application. * significant 10%, ** 77 significant 5%. 78 79
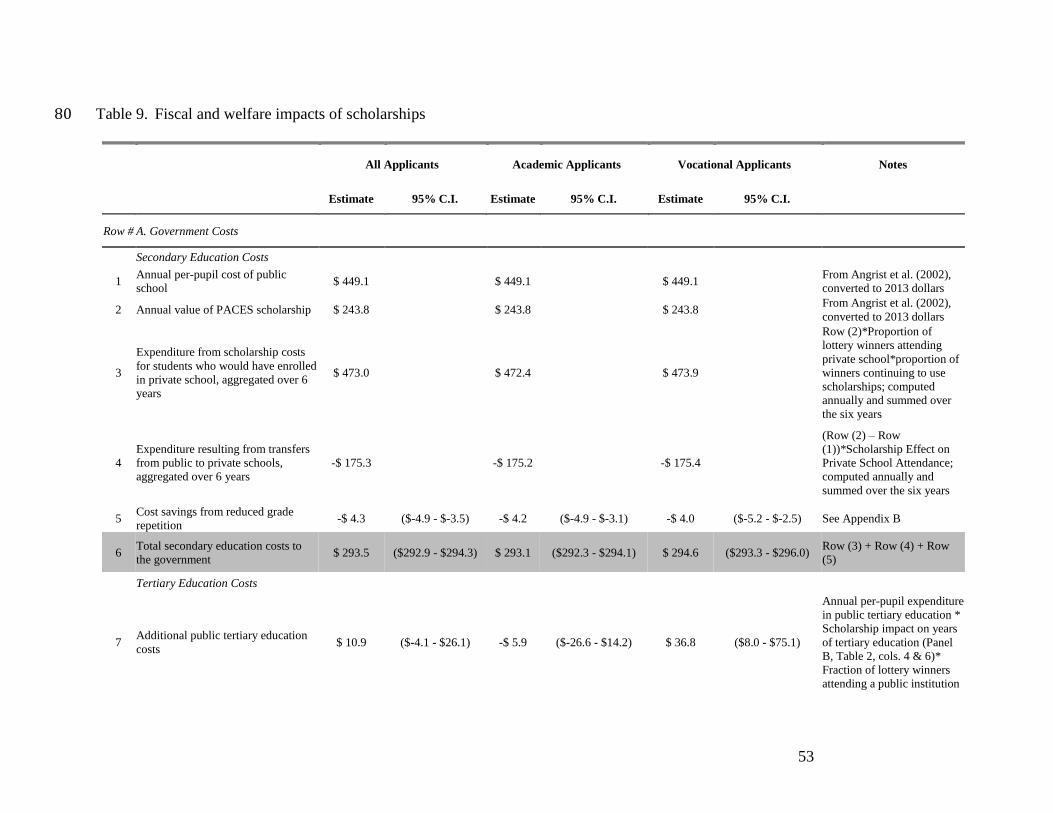
53
Table 9. Fiscal and welfare impacts of scholarships 80
All Applicants Academic Applicants Vocational Applicants Notes
Estimate 95% C.I. Estimate 95% C.I. Estimate 95% C.I.
Row # A. Government Costs
Secondary Education Costs
1 Annual per-pupil cost of public
school $ 449.1 $ 449.1 $ 449.1
From Angrist et al. (2002),
converted to 2013 dollars
2 Annual value of PACES scholarship $ 243.8 $ 243.8 $ 243.8 From Angrist et al. (2002),
converted to 2013 dollars
3
Expenditure from scholarship costs
for students who would have enrolled
in private school, aggregated over 6
years
$ 473.0 $ 472.4 $ 473.9
Row (2)*Proportion of
lottery winners attending
private school*proportion of
winners continuing to use
scholarships; computed
annually and summed over
the six years
4
Expenditure resulting from transfers
from public to private schools,
aggregated over 6 years
-$ 175.3 -$ 175.2 -$ 175.4
(Row (2) – Row
(1))*Scholarship Effect on
Private School Attendance;
computed annually and
summed over the six years
5 Cost savings from reduced grade
repetition -$ 4.3 ($-4.9 - $-3.5) -$ 4.2 ($-4.9 - $-3.1) -$ 4.0 ($-5.2 - $-2.5) See Appendix B
6 Total secondary education costs to
the government $ 293.5 ($292.9 - $294.3) $ 293.1 ($292.3 - $294.1) $ 294.6 ($293.3 - $296.0)
Row (3) + Row (4) + Row
(5)
Tertiary Education Costs
7 Additional public tertiary education
costs $ 10.9 ($-4.1 - $26.1) -$ 5.9 ($-26.6 - $14.2) $ 36.8 ($8.0 - $75.1)
Annual per-pupil expenditure
in public tertiary education *
Scholarship impact on years
of tertiary education (Panel
B, Table 2, cols. 4 & 6)*
Fraction of lottery winners
attending a public institution

54
(Panel B, Table 2, col. 1 +
col. 3)
8 Additional tertiary education loan
subsidies $ 4.3 ($-7.1 - $15.4) -$ 5.8 ($-19.7 - $7.6) $ 17.9 ($-2.9 - $37.7)
Annual per-pupil tertiary
education subsidy *
Scholarship impact on
number of years of subsidy
receipt (Panel B of Table 2,
cols. 4 & 6)
9 Additional tertiary education costs
(public education + loan subsidies) $ 15.2 ($-6.7 - $36.6) -$ 11.7 ($-38.1 - $15.3) $ 54.7 ($14.4 - $98.3) Row (7) + Row (8)
Welfare Receipt Costs
10 Additional CCT receipt costs -$ 0.4 ($-4.4 - $3.5) $ 0.1 ($-4.8 - $5.0) -$ 2.3 ($-8.1 - $3.3)
Annual CCT subsidy amount
(see notes below) *
Scholarship impact on CCT
receipt (Table 6, cols. 4 & 6)
Foregone Revenue
11 Foregone tax revenue from VAT tax $ 27.9 ($26.2 - $29.6) $ 27.8 ($25.6 - $30.2) $ 29.1 ($26.3 - $31.9)
Formal annual earnings of
losers* Scholarship impact
on years of education *VAT
tax of 13.3%
12 Foregone net government transfers
through payroll taxes $ 23.7 ($22.1 - $25.1) $ 23.6 ($21.6 - $25.8) $ 24.6 ($22.3 - $27.1)
Annual payroll taxes of
losers* Scholarship impact
on years of education *0.4
13 Total foregone revenue $ 51.6 ($48.3 - $54.7) $ 51.4 ($47.2 - $56.0) $ 53.7 ($48.6 - $58.9) Row (11) + Row (12)
14 Expected scholarship costs to
government $ 359.8 ($338.3 - $381.8) $ 332.9 ($308.1 - $359.1) $ 400.6 ($361.4 - $445.2)
Row (6) + Row (9) + Row
(10) + Row (13)
15 Expected scholarship costs to
government, 6% discount rate $ 319.4 ($304.4 - $334.6) $ 300.5 ($282.9 - $318.7) $ 348.1 ($320.9 - $379.9)
Same calculations as above
using 6% discount rate
B. Government Revenue
16 Additional VAT tax revenue $ 1,098.0 ($41.2 - $2,254.2) $ 151.5 ($-1,310.5 - $1,576.8) $ 2,416.8 ($432.0 - $4,498.2)
Additional earnings of
scholarship winners (see
notes below) * VAT tax of
13.3%
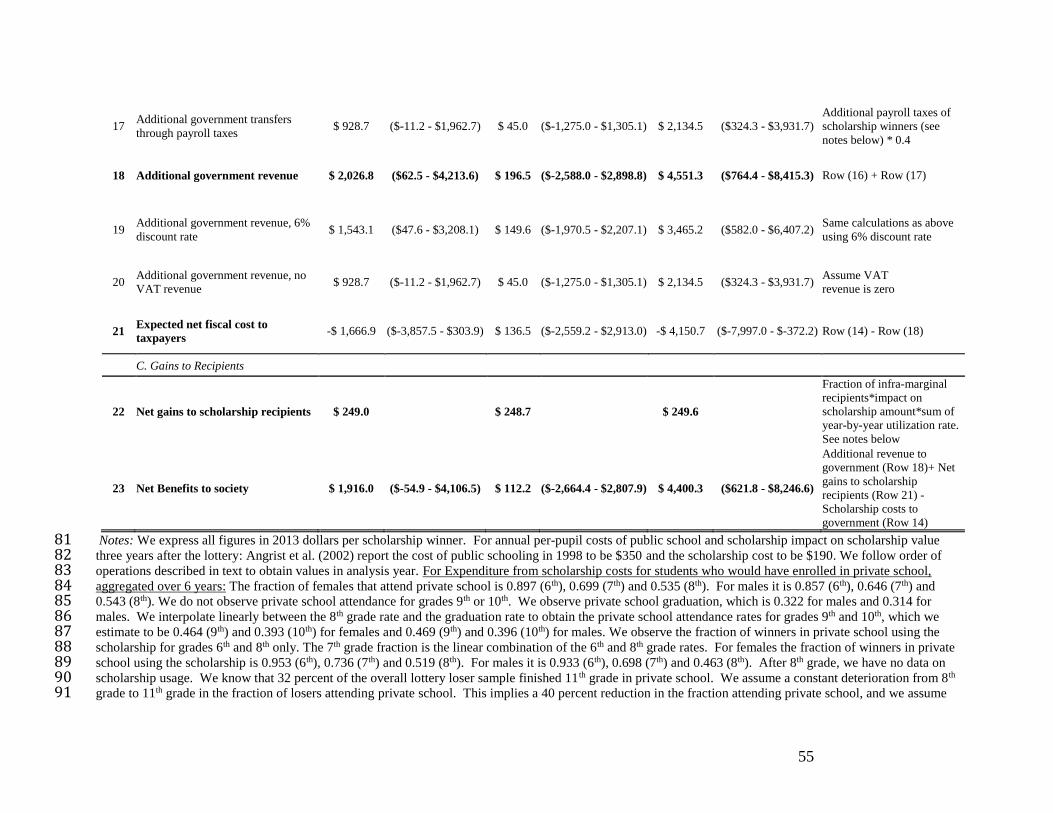
55
17 Additional government transfers
through payroll taxes $ 928.7 ($-11.2 - $1,962.7) $ 45.0 ($-1,275.0 - $1,305.1) $ 2,134.5 ($324.3 - $3,931.7)
Additional payroll taxes of
scholarship winners (see
notes below) * 0.4
18 Additional government revenue $ 2,026.8 ($62.5 - $4,213.6) $ 196.5 ($-2,588.0 - $2,898.8) $ 4,551.3 ($764.4 - $8,415.3) Row (16) + Row (17)
19 Additional government revenue, 6%
discount rate $ 1,543.1 ($47.6 - $3,208.1) $ 149.6 ($-1,970.5 - $2,207.1) $ 3,465.2 ($582.0 - $6,407.2)
Same calculations as above
using 6% discount rate
20 Additional government revenue, no
VAT revenue $ 928.7 ($-11.2 - $1,962.7) $ 45.0 ($-1,275.0 - $1,305.1) $ 2,134.5 ($324.3 - $3,931.7)
Assume VAT
revenue is zero
21 Expected net fiscal cost to
taxpayers -$ 1,666.9 ($-3,857.5 - $303.9) $ 136.5 ($-2,559.2 - $2,913.0) -$ 4,150.7 ($-7,997.0 - $-372.2) Row (14) - Row (18)
C. Gains to Recipients
22 Net gains to scholarship recipients $ 249.0
$ 248.7
$ 249.6
Fraction of infra-marginal
recipients*impact on
scholarship amount*sum of
year-by-year utilization rate.
See notes below
23 Net Benefits to society $ 1,916.0 ($-54.9 - $4,106.5) $ 112.2 ($-2,664.4 - $2,807.9) $ 4,400.3 ($621.8 - $8,246.6)
Additional revenue to
government (Row 18)+ Net
gains to scholarship
recipients (Row 21) -
Scholarship costs to
government (Row 14)
Notes: We express all figures in 2013 dollars per scholarship winner. For annual per-pupil costs of public school and scholarship impact on scholarship value 81 three years after the lottery: Angrist et al. (2002) report the cost of public schooling in 1998 to be $350 and the scholarship cost to be $190. We follow order of 82 operations described in text to obtain values in analysis year. For Expenditure from scholarship costs for students who would have enrolled in private school, 83 aggregated over 6 years: The fraction of females that attend private school is 0.897 (6th), 0.699 (7th) and 0.535 (8th). For males it is 0.857 (6th), 0.646 (7th) and 84 0.543 (8th). We do not observe private school attendance for grades 9th or 10th. We observe private school graduation, which is 0.322 for males and 0.314 for 85 males. We interpolate linearly between the 8th grade rate and the graduation rate to obtain the private school attendance rates for grades 9th and 10th, which we 86 estimate to be 0.464 (9th) and 0.393 (10th) for females and 0.469 (9th) and 0.396 (10th) for males. We observe the fraction of winners in private school using the 87 scholarship for grades 6th and 8th only. The 7th grade fraction is the linear combination of the 6th and 8th grade rates. For females the fraction of winners in private 88 school using the scholarship is 0.953 (6th), 0.736 (7th) and 0.519 (8th). For males it is 0.933 (6th), 0.698 (7th) and 0.463 (8th). After 8th grade, we have no data on 89 scholarship usage. We know that 32 percent of the overall lottery loser sample finished 11th grade in private school. We assume a constant deterioration from 8th 90 grade to 11th grade in the fraction of losers attending private school. This implies a 40 percent reduction in the fraction attending private school, and we assume 91
56
that deterioration in scholarship usage among winners follows a similar 40 percent decline from the 8 th grade level. Under these assumptions, scholarship usage 92 rates for females are 0.415 (9th), 0.310 (10th) and 0.206 (11th). For males the scholarship usage rates are 0.374 (9th), 0.284 (10th) and 0.195 (11th). For cost-93 savings from reduced grade repetition: See Appendix B. For tertiary costs: Average per-pupil government expenditure in tertiary education is COP 3,280,000 in 94 2010 (Ministry of Education 2010). We use the exchange rate of COP 1913.98/USD (Dec 31, 2010) to convert to nominal USD and follow order of operations 95 described in text to obtain NPV in USD of analysis year. Tertiary education subsidies are COP 682.432 per semester in COP of 2013 (ICETEX 2014). We use 96 the exchange rate of COP 1926.83/USD (Dec 31, 2013) to convert to nominal USD and follow order of operations described in text to obtain NPV in USD of 97 analysis year. Costs of welfare receipt: To obtain annual cost we assume one child, which is the mean number of children of scholarship applicants at age 28 (see 98 Table 7). We assume child is between zero and seven years of age in 2013, so can receive health transfer but no education transfer. We assume applicant resides 99 in Bogotá so monthly health subsidy amount is that for Group 1 municipalities, COP 61,200/month (see: 100 http://www.dps.gov.co/Ingreso_Social/FamiliasenAccion.aspx, retrieved October 28, 2014). We obtain annual CCT transfer amount by multiplying by 12. We 101 follow order of operations above to obtain NPV in USD of analysis year. We only assume one year of costs since there is no difference by scholarship status in 102 total fertility, indicating simply a difference in the probability of having age-appropriate children. Therefore, CCT cost is annual cost * impact on receipt. 103 Foregone earnings: We estimate annual foregone revenue from average annual formal sector earnings of scholarship losers in Panel A of Table 5, columns 3 and 104 5. We follow order of operations above to obtain NPV in USD of analysis year. Earnings: Annual earnings are projected annual earnings from Panel A, Table 5.. 105 We project earnings for losers and winners over a 35-year horizon allowing for a 3.02% annual growth in earnings per annum, which is the average annual 106 growth in GDP per capita in Colombia between 2002 and 2012, obtained from the World Development Indicators database). US-CPI for years after 2013 is that 107 for 2013. We then follow remaining order of operation to obtain NPV of earnings for winners and losers. Payroll taxes: Annual payroll taxes are from Panel A, 108 Table 5. We follow the same procedure as for earnings to obtain the NPV of payroll taxes in analysis year. Benefits to recipients: The fraction of infra-marginal 109 recipients is the fraction of lottery losers who attend private school in 6th grade, 0.897 among females and 0.857 among males. The impact on scholarship amount 110 is $93.2 (from Angrist et al. 2002 Table 8, column 3 updated to 2013 dollars). For utilization rates see notes above for expenditure from scholarship costs for 111 students who would have enrolled in private school, aggregated over 6 years. We obtain 95% confidence intervals for each calculation using the bootstrap. 112 113 114 115 116 117 118 119 120 121 122
123 124 125 126 127
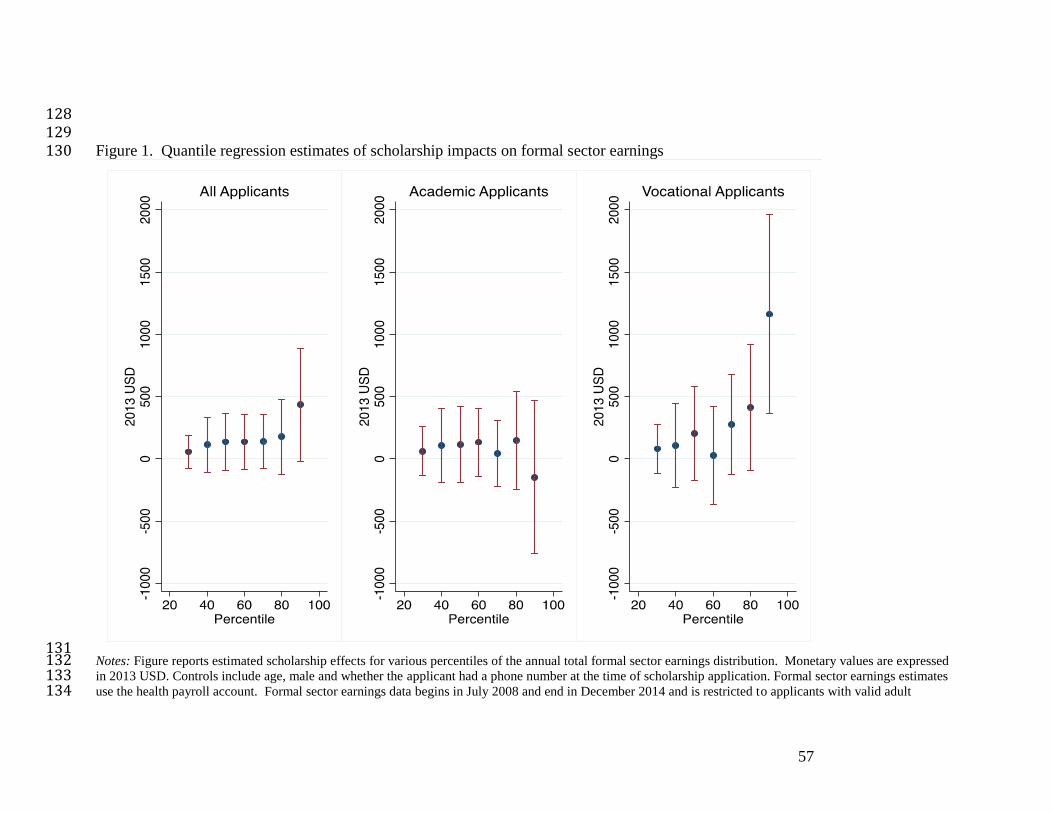
57
128 129 Figure 1. Quantile regression estimates of scholarship impacts on formal sector earnings 130
131 Notes: Figure reports estimated scholarship effects for various percentiles of the annual total formal sector earnings distribution. Monetary values are expressed 132 in 2013 USD. Controls include age, male and whether the applicant had a phone number at the time of scholarship application. Formal sector earnings estimates 133 use the health payroll account. Formal sector earnings data begins in July 2008 and end in December 2014 and is restricted to applicants with valid adult 134

58
identification number that have complete application controls. The sample of all applicants has 3574 observations, the sample of academic school applicants has 135 1852 observations and the sample of vocational school applicants has 1481 observations. 136
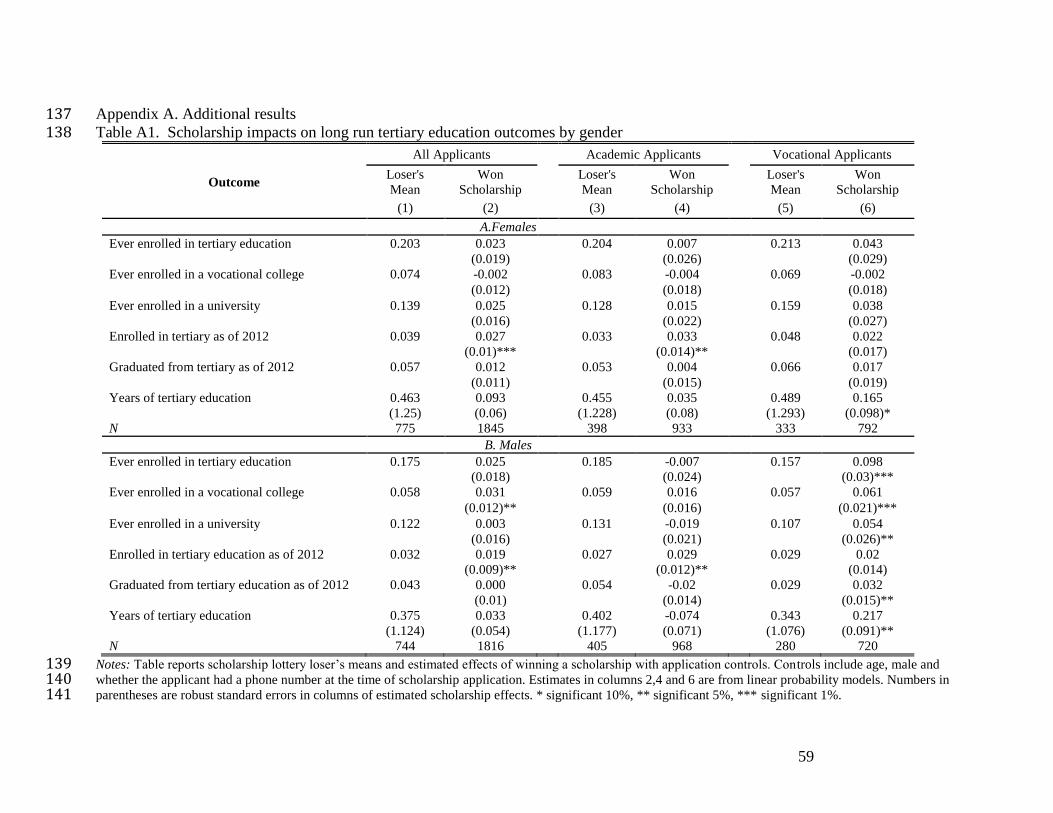
59
Appendix A. Additional results 137 Table A1. Scholarship impacts on long run tertiary education outcomes by gender 138
All Applicants Academic Applicants Vocational Applicants
Outcome Loser's
Mean
Won
Scholarship Loser's
Mean
Won
Scholarship
Loser's
Mean
Won
Scholarship
(1) (2) (3) (4) (5) (6)
A.Females
Ever enrolled in tertiary education 0.203 0.023 0.204 0.007 0.213 0.043
(0.019) (0.026) (0.029)
Ever enrolled in a vocational college 0.074 -0.002 0.083 -0.004 0.069 -0.002
(0.012) (0.018) (0.018)
Ever enrolled in a university 0.139 0.025 0.128 0.015 0.159 0.038
(0.016) (0.022) (0.027)
Enrolled in tertiary as of 2012 0.039 0.027 0.033 0.033 0.048 0.022
(0.01)*** (0.014)** (0.017)
Graduated from tertiary as of 2012 0.057 0.012 0.053 0.004 0.066 0.017
(0.011) (0.015) (0.019)
Years of tertiary education 0.463 0.093 0.455 0.035 0.489 0.165
(1.25) (0.06) (1.228) (0.08) (1.293) (0.098)*
N 775 1845 398 933 333 792
B. Males
Ever enrolled in tertiary education 0.175 0.025 0.185 -0.007 0.157 0.098
(0.018) (0.024) (0.03)***
Ever enrolled in a vocational college 0.058 0.031 0.059 0.016 0.057 0.061
(0.012)** (0.016) (0.021)***
Ever enrolled in a university 0.122 0.003 0.131 -0.019 0.107 0.054
(0.016) (0.021) (0.026)**
Enrolled in tertiary education as of 2012 0.032 0.019 0.027 0.029 0.029 0.02
(0.009)** (0.012)** (0.014)
Graduated from tertiary education as of 2012 0.043 0.000 0.054 -0.02 0.029 0.032
(0.01) (0.014) (0.015)**
Years of tertiary education 0.375 0.033 0.402 -0.074 0.343 0.217
(1.124) (0.054) (1.177) (0.071) (1.076) (0.091)**
N 744 1816 405 968 280 720
Notes: Table reports scholarship lottery loser’s means and estimated effects of winning a scholarship with application controls. Controls include age, male and 139 whether the applicant had a phone number at the time of scholarship application. Estimates in columns 2,4 and 6 are from linear probability models. Numbers in 140 parentheses are robust standard errors in columns of estimated scholarship effects. * significant 10%, ** significant 5%, *** significant 1%. 141
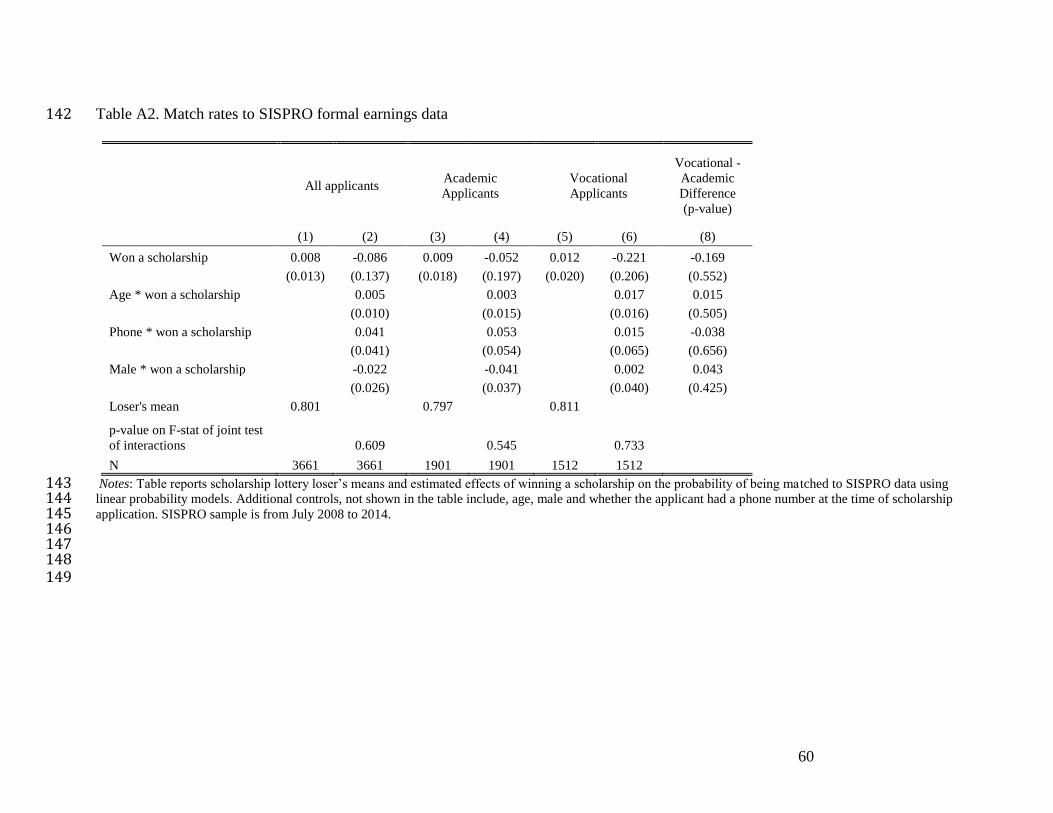
60
Table A2. Match rates to SISPRO formal earnings data 142
All applicants Academic
Applicants
Vocational
Applicants
Vocational -
Academic
Difference
(p-value)
(1) (2) (3) (4) (5) (6) (8)
Won a scholarship 0.008 -0.086 0.009 -0.052 0.012 -0.221 -0.169
(0.013) (0.137) (0.018) (0.197) (0.020) (0.206) (0.552)
Age * won a scholarship 0.005 0.003 0.017 0.015
(0.010) (0.015) (0.016) (0.505)
Phone * won a scholarship 0.041 0.053 0.015 -0.038
(0.041) (0.054) (0.065) (0.656)
Male * won a scholarship -0.022 -0.041 0.002 0.043
(0.026) (0.037) (0.040) (0.425)
Loser's mean 0.801 0.797 0.811
p-value on F-stat of joint test
of interactions 0.609 0.545 0.733
N 3661 3661 1901 1901 1512 1512
Notes: Table reports scholarship lottery loser’s means and estimated effects of winning a scholarship on the probability of being matched to SISPRO data using 143 linear probability models. Additional controls, not shown in the table include, age, male and whether the applicant had a phone number at the time of scholarship 144 application. SISPRO sample is from July 2008 to 2014. 145 146 147 148
149
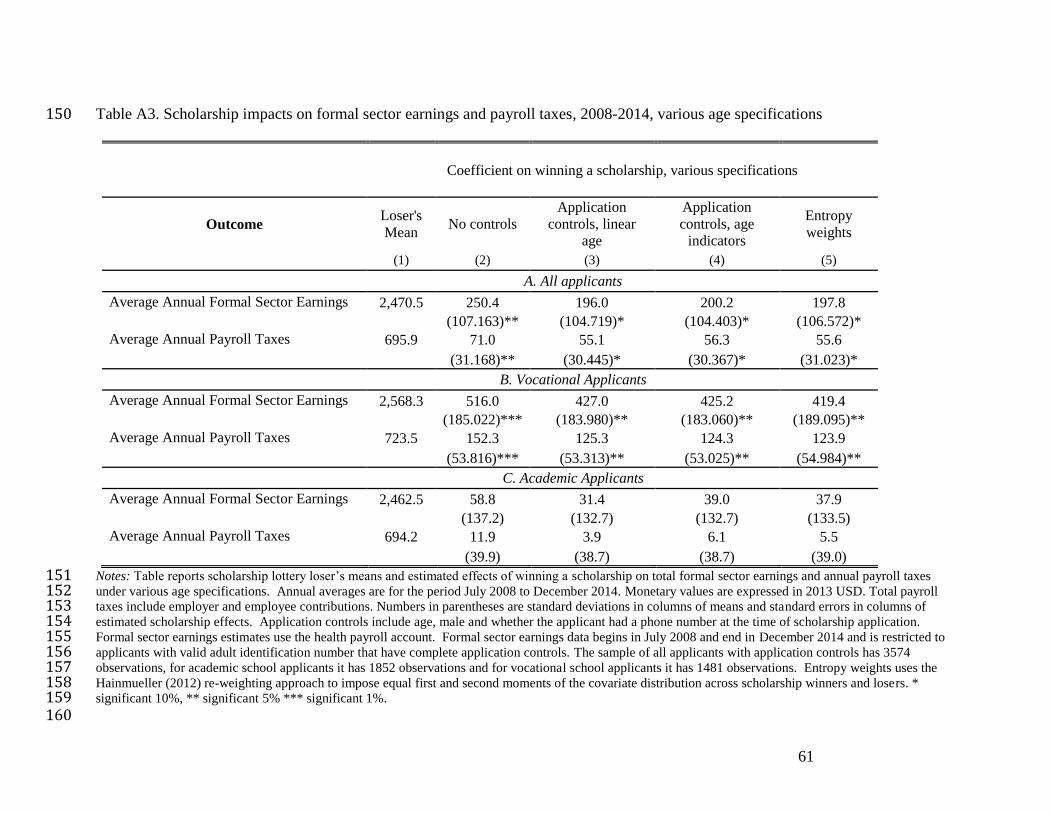
61
Table A3. Scholarship impacts on formal sector earnings and payroll taxes, 2008-2014, various age specifications 150
Coefficient on winning a scholarship, various specifications
Outcome Loser's
Mean No controls
Application
controls, linear
age
Application
controls, age
indicators
Entropy
weights
(1) (2) (3) (4) (5)
A. All applicants
Average Annual Formal Sector Earnings 2,470.5 250.4 196.0 200.2 197.8
(107.163)** (104.719)* (104.403)* (106.572)*
Average Annual Payroll Taxes 695.9 71.0 55.1 56.3 55.6
(31.168)** (30.445)* (30.367)* (31.023)*
B. Vocational Applicants
Average Annual Formal Sector Earnings 2,568.3 516.0 427.0 425.2 419.4
(185.022)*** (183.980)** (183.060)** (189.095)**
Average Annual Payroll Taxes 723.5 152.3 125.3 124.3 123.9
(53.816)*** (53.313)** (53.025)** (54.984)**
C. Academic Applicants
Average Annual Formal Sector Earnings 2,462.5 58.8 31.4 39.0 37.9
(137.2) (132.7) (132.7) (133.5)
Average Annual Payroll Taxes 694.2 11.9 3.9 6.1 5.5
(39.9) (38.7) (38.7) (39.0)
Notes: Table reports scholarship lottery loser’s means and estimated effects of winning a scholarship on total formal sector earnings and annual payroll taxes 151 under various age specifications. Annual averages are for the period July 2008 to December 2014. Monetary values are expressed in 2013 USD. Total payroll 152 taxes include employer and employee contributions. Numbers in parentheses are standard deviations in columns of means and standard errors in columns of 153 estimated scholarship effects. Application controls include age, male and whether the applicant had a phone number at the time of scholarship application. 154 Formal sector earnings estimates use the health payroll account. Formal sector earnings data begins in July 2008 and end in December 2014 and is restricted to 155 applicants with valid adult identification number that have complete application controls. The sample of all applicants with application controls has 3574 156 observations, for academic school applicants it has 1852 observations and for vocational school applicants it has 1481 observations. Entropy weights uses the 157 Hainmueller (2012) re-weighting approach to impose equal first and second moments of the covariate distribution across scholarship winners and losers. * 158 significant 10%, ** significant 5% *** significant 1%. 159
160

62
Table A4. Scholarship impacts on formal annual earnings for applicants to vocational schools of various curricula 161
Vocational Applicants Applicants to Commercial
Curriculum
Applicants to Other
Curricula
Loser's
Mean
(s.d)
Won
Scholarship
(s.e)
Loser's
Mean
(s.d)
Won
Scholarship
(s.e)
Loser's
Mean
(s.d)
Won
Scholarship
(s.e)
(1) (2) (3) (4) (5) (6)
A. All applicants
Average Annual Formal Sector Earnings 2,568.3 427.0 2,252.5 554.2 2,789.2 341.7
(3147.3) (184)** (2686.7) (254.2)** (3419.4) (260.2)
Average Annual Payroll Taxes 723.5 125.3 640.1 158.2 781.8 103.0
(908.4) (53.3)** (775.3) (73.8)** (987.9) (75.5)
N 600 1481 247 637 353 844
B. Females
Average Annual Formal Sector Earnings 2,422.4 328.8 2,501.7 136.0 2,365.3 491.2
(2941.1) (248.4) (3034.7) (360.6) (2878.3) (346.9)
Average Annual Payroll Taxes 665.1 93.3 701.2 26.3 639.1 148.3
(833.4) (70.7) (874.3) (102.5) (803.9) (99.1)
N 327 779 137 354 190 425
C. Males
Average Annual Formal Sector Earnings 2,743.0 535.3 1,942.2 1,119.1 3,283.5 151.0
(3375) (272.7)** (2150.6) (348)*** (3909.4) (384.4)
Average Annual Payroll Taxes 793.3 160.8 563.9 333.9 948.2 47.1
(987.9) (80.5)** (626.3) (103.8)*** (1146.6) (113.3)
N 273 702 110 283 163 419
Notes: Table reports scholarship lottery loser’s means and estimated effects of winning a scholarship on formal sector earnings and payroll taxes in USD of 2013 162 among applicants to vocational schools of various curricula. Columns 1 and 2 replicate results for vocational applicants from Table 4 in the main text. Columns 163 3 and 4 show results for applicants to vocational schools with a commercial curriculum. Columns 5 and 6 show results for applicants to schools with other 164 curricula, which includes industrial, agricultural, pedagogical and those without curriculum information. Controls include age, male and whether the applicant 165 had a phone number at the time of scholarship application. Formal sector earnings estimates use the health payroll account. Formal sector earnings sample is 166 restricted to begin in July 2008 and is restricted to applicants with valid adult identification number (3926) that have complete application controls (3903).* 167 significant 10%, ** significant 5%. 168

63
Table A5. Scholarship impacts on formal employment characteristics 169
All Academic Applicants Vocational Applicants
Vocational -
Academic
Difference
Loser's
Mean
(s.d)
Won
Scholarship
(s.e)
Loser's
Mean
(s.d)
Won
Scholarship
(s.e)
Loser's
Mean
(s.d)
Won
Scholarship
(s.e)
Difference (6) -
(4) (p-value)
(1) (2) (3) (4) (5) (6) (7)
All applicants
Firm size (mean number of workers) 2,001.6 77.6 2078.5 -39.4 1943.8 261.3 300.8
(138.4) (193.0) (221.0) (0.30)
Firm's mean number of new jobs 69.0 22.0 70.7 20.1 67.8 28.6 8.5
(9.8)** (12.3) (18.3) (0.70)
Firm's mean number of job terminations 31.9 2.6 31.5 3.6 32.1 2.8 -0.8
(3.4) (4.7) (5.3) (0.91)
Firm productivity (mean monthly earnings) 512.9 9.4 528.6 -28.5 507.8 53.5 82.1
(18.4) (30.7) (20.9) (0.03)**
Percent of firm's employees earning less than
1.05 times minimum wage 42.2 -1.9 42.3 -1.0 41.1 -3.1 -2.1
(1.2) (1.6) (1.8)* (0.38)
Percent of firm's employees earning between
1.05 and 3 times minimum wage 45.8 0.8 45.6 1.2 46.3 0.7 -0.5
(1.0) (1.4) (1.5) (0.81)
Percent of firm's employees earning 3 and 5
times minimum wage 5.9 0.6 6.0 0.1 6.1 1.2 1.1
(0.28)** (0.4) (0.5)*** (0.06)*
Percent of firm's employees earning 5 and 10
times minimum wage 3.7 0.5 3.7 0.1 3.9 0.9 0.8
(0.25)* (0.3) (0.4)** (0.13)
Percent of firm's employees earning more than
10 times minimum wage 1.2 0.3 1.2 0.2 1.3 0.5 0.4
(0.13)*** (0.2) (0.2)** (0.20)
Notes: Table reports scholarship lottery loser’s means and estimated effects of winning a scholarship on formal firm characteristics. Averages are for the period 170 July 2008 to December 2014. Monetary values are expressed in 2013 USD. Controls include age, male and whether the applicant had a phone number at the time 171 of scholarship application. Formal sector earnings data begins in July 2008 and end in December 2014 and is restricted to applicants with valid adult 172 identification number that have complete application controls. The sample of all applicants has 3574 observations, the sample of academic school applicants has 173 1852 observations and the sample of vocational school applicants has 1481 observations. * significant 10%, ** significant 5% *** significant 1%. 174

64
Table A6. Upper bound estimates (trimming) of the scholarship impact on future formal earnings 175
All Academic Applicants Vocational Applicants
Vocational-
Academic
Difference
Loser's
Mean
(s.d)
Won
Scholarship
(s.e)
Loser's
Mean
(s.d)
Won
Scholarship
(s.e)
Loser's
Mean
(s.d)
Won
Scholarship
(s.e)
Difference
(6) - (4)
(p-value)
(1) (2) (3) (4) (5) (6) (7)
A. All applicants
Percent of top-earning scholarship losers trimmed from
sample 2.4 % 3.3% 2.2%
Average Annual Formal Sector Earnings 2,172.7 490.2 2,086.6 395.9 2,297.5 701.5 305.7
(2239) (91.2)*** (2082.4) (110.9)*** (2423.7) (164.4)*** (0.12)
B. Females
Percent of top-earning scholarship losers trimmed from
sample 2.8% 3.3% 2.2%
Average Annual Formal Sector Earnings 2,009.6 490.1 1,877.1 475.4 2,198.2 552.1 76.6
(2191.3) (128.8)*** (1921.6) (151.6)*** (2428.6) (231.7)** (0.78)
C. Males
Percent of top-earning scholarship losers trimmed from
sample 2.0% 3.3% 2.1%
Average Annual Formal Sector Earnings 2,383.4 449.7 2,314.3 291.4 2,418.4 864.2 572.8
(2346.1) (130.2)*** (2241.5) (161.7)* (2422.7) (231.7)*** (0.04)**
Notes: Table reports scholarship lottery loser’s means and estimated effects of winning a scholarship on average annual, annual total formal sector earnings and 176 annual payroll taxes after trimming the stated percent of top-earnings scholarship losers from each sample. Annual averages are for the period July 2008 to 177 December 2014. Monetary values are expressed in 2013 USD. Total payroll taxes include employer and employee contributions. Numbers in parentheses are 178 standard deviations in columns of means and standard errors in columns of estimated scholarship effects. Controls include age, male and whether the applicant 179 had a phone number at the time of scholarship application. Formal sector earnings estimates use the health payroll account. Formal sector earnings data begins in 180 July 2008 and end in December 2014 and is restricted to applicants with valid adult identification number that have complete application controls.* significant 181 10%, ** significant 5% *** significant 1%. 182 183 184
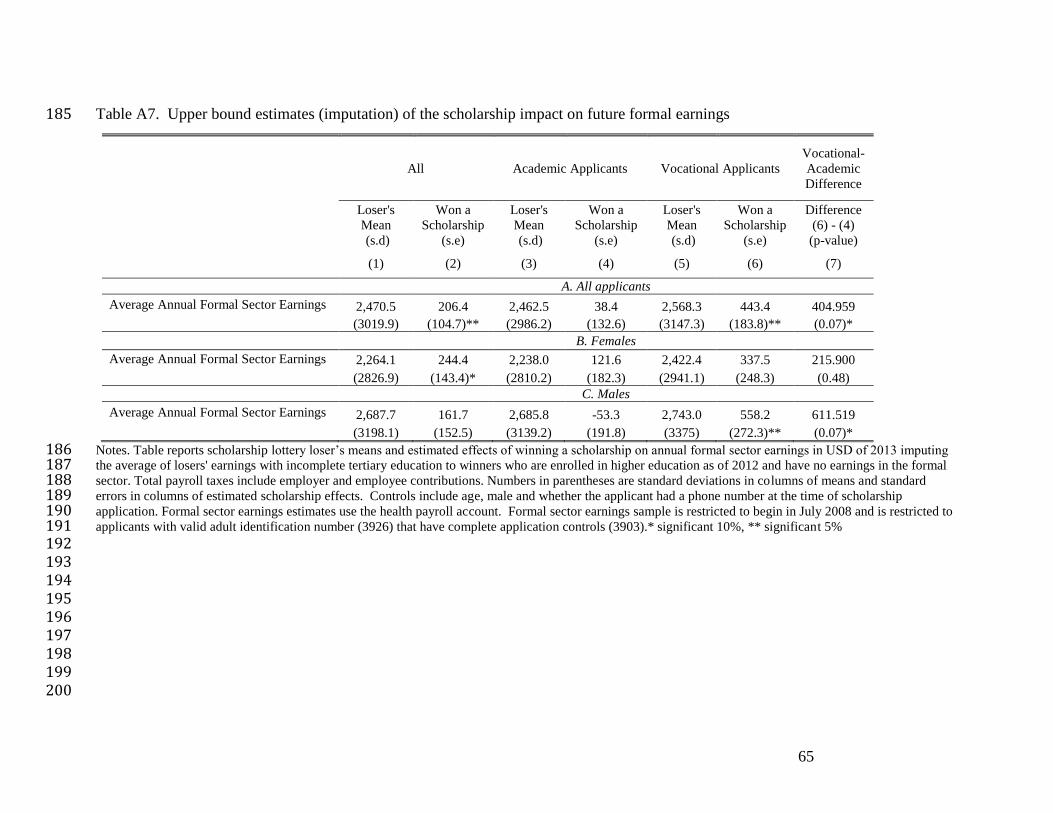
65
Table A7. Upper bound estimates (imputation) of the scholarship impact on future formal earnings 185
All Academic Applicants Vocational Applicants
Vocational-
Academic
Difference
Loser's
Mean
(s.d)
Won a
Scholarship
(s.e)
Loser's
Mean
(s.d)
Won a
Scholarship
(s.e)
Loser's
Mean
(s.d)
Won a
Scholarship
(s.e)
Difference
(6) - (4)
(p-value)
(1) (2) (3) (4) (5) (6) (7)
A. All applicants
Average Annual Formal Sector Earnings 2,470.5 206.4 2,462.5 38.4 2,568.3 443.4 404.959
(3019.9) (104.7)** (2986.2) (132.6) (3147.3) (183.8)** (0.07)*
B. Females
Average Annual Formal Sector Earnings 2,264.1 244.4 2,238.0 121.6 2,422.4 337.5 215.900
(2826.9) (143.4)* (2810.2) (182.3) (2941.1) (248.3) (0.48)
C. Males
Average Annual Formal Sector Earnings 2,687.7 161.7 2,685.8 -53.3 2,743.0 558.2 611.519
(3198.1) (152.5) (3139.2) (191.8) (3375) (272.3)** (0.07)*
Notes. Table reports scholarship lottery loser’s means and estimated effects of winning a scholarship on annual formal sector earnings in USD of 2013 imputing 186 the average of losers' earnings with incomplete tertiary education to winners who are enrolled in higher education as of 2012 and have no earnings in the formal 187 sector. Total payroll taxes include employer and employee contributions. Numbers in parentheses are standard deviations in columns of means and standard 188 errors in columns of estimated scholarship effects. Controls include age, male and whether the applicant had a phone number at the time of scholarship 189 application. Formal sector earnings estimates use the health payroll account. Formal sector earnings sample is restricted to begin in July 2008 and is restricted to 190 applicants with valid adult identification number (3926) that have complete application controls (3903).* significant 10%, ** significant 5% 191 192 193 194 195 196 197 198 199 200

66
Table A8. Scholarship impacts on government subsidy receipt 201 All Academic Applicants Vocational Applicants
Loser's
Mean
Won
Scholarship
(s.e)
Loser's
Mean
Won
Scholarship
(s.e)
Loser's
Mean
Won
Scholarship
(s.e)
(1) (2) (3) (4) (5) (6)
Familias En Acción CCT program 0.074 -0.003 0.072 0.001 0.073 -0.008
(0.009) (0.012) (0.013)
Subsidized Health Care Level 1 0.196 -0.012 0.196 -0.024 0.188 -0.003
(0.013) (0.018) (0.02)
Subsidized Health Care Level 2 0.243 0.000 0.24 -0.008 0.228 0.014
(0.014) (0.02) (0.022)
Early childhood care (ICBF) 0.27 -0.004 0.265 -0.006 0.258 0.004
(0.015) (0.02) (0.023)
Notes: Table reports scholarship lottery loser’s means and estimated effects of winning a scholarship with application controls. Controls include age, male and 202 whether the applicant had a phone number at the time of scholarship application. Estimates in columns 2,4 and 6 are from linear probability models. Numbers in 203 parentheses are robust standard errors in columns of estimated scholarship effects. Receipt of Familias en Acción CCT program is based on having SISBEN 2010 204 scores below the eligibility cutoff and children under the age of 18. Receipt of subsidized health care levels 1 and 2, and early childhood care is based on having 205 SISBEN 2010 scores below the eligibility cutoff. Applicants who are not in SISBEN 2010 cannot receive these subsidies so for them receipt is zero. 206 207 208 209 210 211 212 213 214 215 216 217 218 219
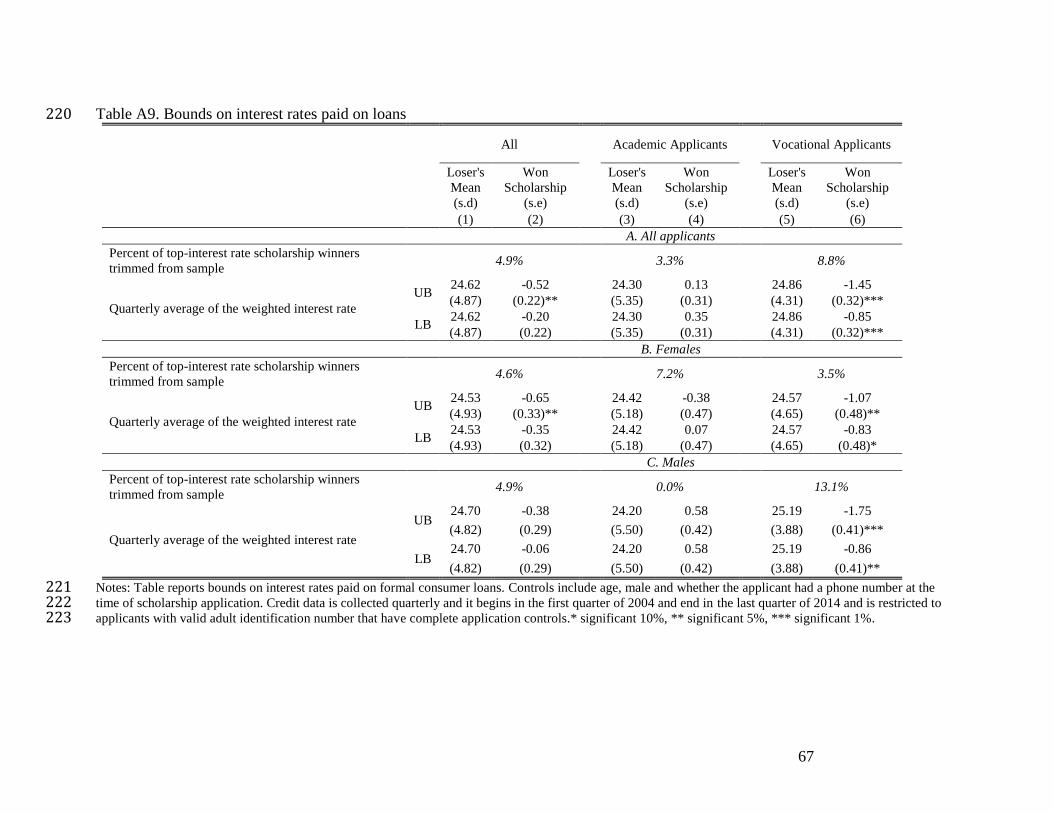
67
Table A9. Bounds on interest rates paid on loans 220
All Academic Applicants Vocational Applicants
Loser's
Mean
(s.d)
Won
Scholarship
(s.e)
Loser's
Mean
(s.d)
Won
Scholarship
(s.e)
Loser's
Mean
(s.d)
Won
Scholarship
(s.e)
(1) (2) (3) (4) (5) (6)
A. All applicants
Percent of top-interest rate scholarship winners
trimmed from sample 4.9% 3.3% 8.8%
Quarterly average of the weighted interest rate
UB 24.62 -0.52 24.30 0.13 24.86 -1.45
(4.87) (0.22)** (5.35) (0.31) (4.31) (0.32)***
LB 24.62 -0.20 24.30 0.35 24.86 -0.85
(4.87) (0.22) (5.35) (0.31) (4.31) (0.32)***
B. Females
Percent of top-interest rate scholarship winners
trimmed from sample 4.6% 7.2% 3.5%
Quarterly average of the weighted interest rate
UB 24.53 -0.65 24.42 -0.38 24.57 -1.07
(4.93) (0.33)** (5.18) (0.47) (4.65) (0.48)**
LB 24.53 -0.35 24.42 0.07 24.57 -0.83
(4.93) (0.32) (5.18) (0.47) (4.65) (0.48)*
C. Males
Percent of top-interest rate scholarship winners
trimmed from sample 4.9% 0.0% 13.1%
Quarterly average of the weighted interest rate
UB 24.70 -0.38 24.20 0.58 25.19 -1.75
(4.82) (0.29) (5.50) (0.42) (3.88) (0.41)***
LB 24.70 -0.06 24.20 0.58 25.19 -0.86
(4.82) (0.29) (5.50) (0.42) (3.88) (0.41)**
Notes: Table reports bounds on interest rates paid on formal consumer loans. Controls include age, male and whether the applicant had a phone number at the 221 time of scholarship application. Credit data is collected quarterly and it begins in the first quarter of 2004 and end in the last quarter of 2014 and is restricted to 222 applicants with valid adult identification number that have complete application controls.* significant 10%, ** significant 5%, *** significant 1%.223
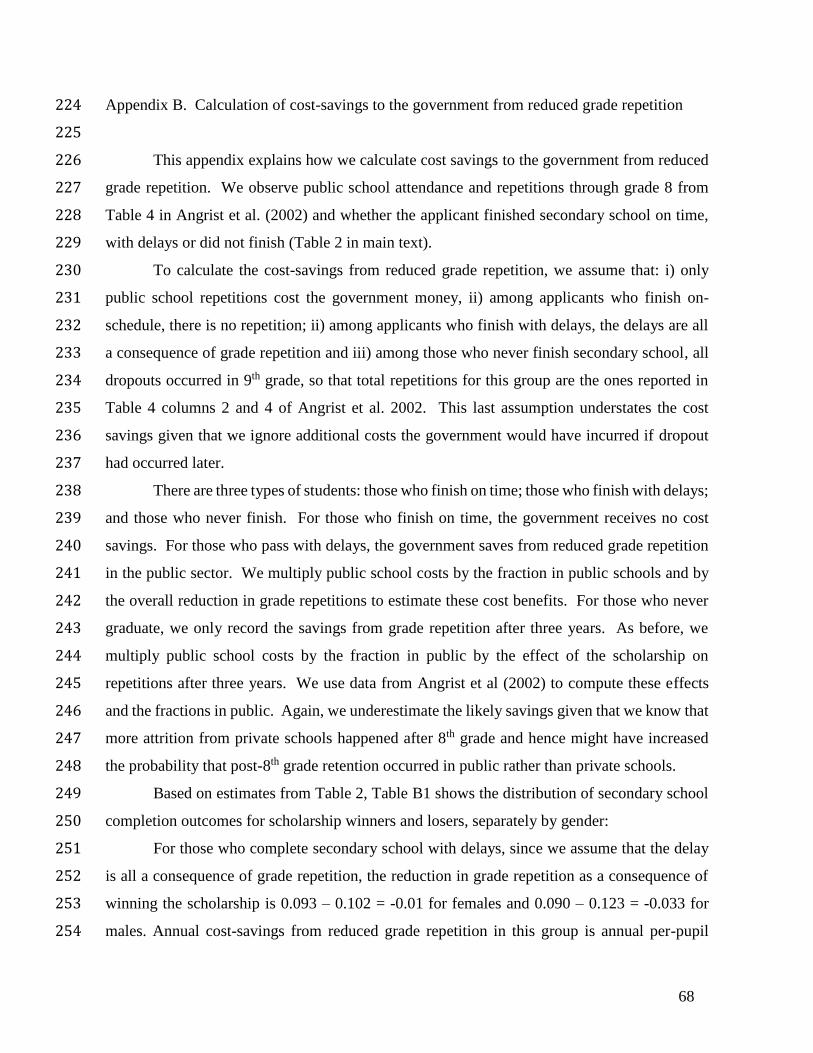
68
Appendix B. Calculation of cost-savings to the government from reduced grade repetition 224
225
This appendix explains how we calculate cost savings to the government from reduced 226
grade repetition. We observe public school attendance and repetitions through grade 8 from 227
Table 4 in Angrist et al. (2002) and whether the applicant finished secondary school on time, 228
with delays or did not finish (Table 2 in main text). 229
To calculate the cost-savings from reduced grade repetition, we assume that: i) only 230
public school repetitions cost the government money, ii) among applicants who finish on-231
schedule, there is no repetition; ii) among applicants who finish with delays, the delays are all 232
a consequence of grade repetition and iii) among those who never finish secondary school, all 233
dropouts occurred in 9th grade, so that total repetitions for this group are the ones reported in 234
Table 4 columns 2 and 4 of Angrist et al. 2002. This last assumption understates the cost 235
savings given that we ignore additional costs the government would have incurred if dropout 236
had occurred later. 237
There are three types of students: those who finish on time; those who finish with delays; 238
and those who never finish. For those who finish on time, the government receives no cost 239
savings. For those who pass with delays, the government saves from reduced grade repetition 240
in the public sector. We multiply public school costs by the fraction in public schools and by 241
the overall reduction in grade repetitions to estimate these cost benefits. For those who never 242
graduate, we only record the savings from grade repetition after three years. As before, we 243
multiply public school costs by the fraction in public by the effect of the scholarship on 244
repetitions after three years. We use data from Angrist et al (2002) to compute these effects 245
and the fractions in public. Again, we underestimate the likely savings given that we know that 246
more attrition from private schools happened after 8th grade and hence might have increased 247
the probability that post-8th grade retention occurred in public rather than private schools. 248
Based on estimates from Table 2, Table B1 shows the distribution of secondary school 249
completion outcomes for scholarship winners and losers, separately by gender: 250
For those who complete secondary school with delays, since we assume that the delay 251
is all a consequence of grade repetition, the reduction in grade repetition as a consequence of 252
winning the scholarship is 0.093 – 0.102 = -0.01 for females and 0.090 – 0.123 = -0.033 for 253
males. Annual cost-savings from reduced grade repetition in this group is annual per-pupil 254
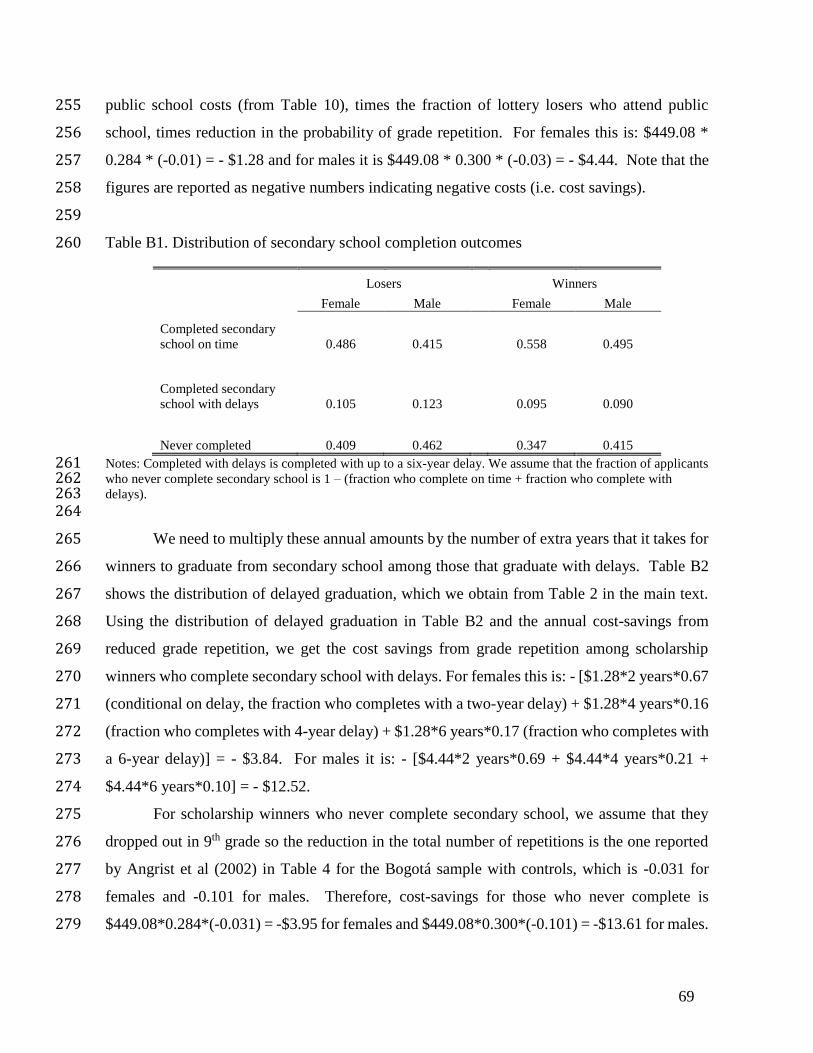
69
public school costs (from Table 10), times the fraction of lottery losers who attend public 255
school, times reduction in the probability of grade repetition. For females this is: $449.08 * 256
0.284 * (-0.01) = - $1.28 and for males it is $449.08 * 0.300 * (-0.03) = - $4.44. Note that the 257
figures are reported as negative numbers indicating negative costs (i.e. cost savings). 258
259
Table B1. Distribution of secondary school completion outcomes 260
Losers Winners
Female Male Female Male
Completed secondary
school on time 0.486 0.415 0.558 0.495
Completed secondary
school with delays 0.105 0.123 0.095 0.090
Never completed 0.409 0.462 0.347 0.415
Notes: Completed with delays is completed with up to a six-year delay. We assume that the fraction of applicants 261 who never complete secondary school is 1 – (fraction who complete on time + fraction who complete with 262 delays). 263 264
We need to multiply these annual amounts by the number of extra years that it takes for 265
winners to graduate from secondary school among those that graduate with delays. Table B2 266
shows the distribution of delayed graduation, which we obtain from Table 2 in the main text. 267
Using the distribution of delayed graduation in Table B2 and the annual cost-savings from 268
reduced grade repetition, we get the cost savings from grade repetition among scholarship 269
winners who complete secondary school with delays. For females this is: - [$1.28*2 years*0.67 270
(conditional on delay, the fraction who completes with a two-year delay) + $1.28*4 years*0.16 271
(fraction who completes with 4-year delay) + $1.28*6 years*0.17 (fraction who completes with 272
a 6-year delay)] = - $3.84. For males it is: - [$4.44*2 years*0.69 + $4.44*4 years*0.21 + 273
$4.44*6 years*0.10] = - $12.52. 274
For scholarship winners who never complete secondary school, we assume that they 275
dropped out in 9th grade so the reduction in the total number of repetitions is the one reported 276
by Angrist et al (2002) in Table 4 for the Bogotá sample with controls, which is -0.031 for 277
females and -0.101 for males. Therefore, cost-savings for those who never complete is 278
$449.08*0.284*(-0.031) = -$3.95 for females and $449.08*0.300*(-0.101) = -$13.61 for males. 279

70
Total cost-savings from reduced grade repetition among scholarship winners is the 280
weighted sum of the cost-savings among those who complete secondary school with delays and 281
those who never complete. The weights are given by the fraction of scholarship winners who 282
complete secondary school with delays and who never complete, from Table B1. For females, 283
we have that total cost-savings are [-$3.84* 0.095 - $3.95*0.347] = -$1.76. For males, total 284
cost-savings from reduced grade repetition are [-$12.52*0.090 -$13.61*0.415] = -$6.78. 285
286
Table B2. Distribution of delayed secondary school completion for scholarship winners 287
Females Males
Percentage
points Percent
Percentage
points Percent
Fraction of winners who
complete secondary
school with delays 0.095 100% 0.090 100%
Fraction who complete
with up to a two-year
delay
(0.555+0.067)-
0.558 = 0.064 67%
(0.499+0.058)-
0.495 =
0.062 69%
Fraction who complete
with a 2- to 4-year delay
(0.574+0.063)-
0.622 = 0.015 16%
(0.530+0.046)-
0.557 =
0.019 21%
Fraction who complete
with a 4- to 6-year delay
(0.095-0.064-
0.015) =
0.016 17%
(0.093-0.066-
0.017) =
0.009 10%
Notes: The first row is from Table B1. The remaining rows are from Table 2 in the main text. 288
Related Documents

![POS 프로그램 시작 - POSBANKword.posbank.co.kr/Resources/POPsRetail-POS-PBUM-S001E(Rev00… · Check Voucher [Checking voucher screen] 1. Select Check Voucher. 2. Check the Voucher](https://static.cupdf.com/doc/110x72/5eae5638ce39362e99362a99/pos-eoeee-oe-rev00-check-voucher-checking-voucher-screen-1-select.jpg)