Can central banks crowd out investment? The importance of reserve data in the relationship between foreign exchange reserves and investment in Asia. Authored by Cory Baird (51-158225) Advised by Rudolfs Bems University of Tokyo Graduate School of Public Policy International Program Master’s Candidate Sep. 2015-Sep. 2017

Welcome message from author
This document is posted to help you gain knowledge. Please leave a comment to let me know what you think about it! Share it to your friends and learn new things together.
Transcript

Can central banks crowd out investment?
The importance of reserve data in the
relationship between foreign exchange reserves
and investment in Asia.
Authored by Cory Baird (51-158225)
Advised by Rudolfs Bems
University of Tokyo Graduate School of Public Policy
International Program Master’s Candidate Sep. 2015-Sep. 2017

Thesis Abstract (Outline)
Reinhart, Reinhart, and Tashiro (2016) have suggested that a negative
relationship exists between reserve accumulation and investment in part because the
central bank can crowd out investment through issuance of central bank bills. Using a
different econometric model, but the same measure of reserves and investment as these
authors, my initial findings support their research. However, the proxy for reserve
changes contains valuation effects, which is problematic given that an increase in
reserves through this channel would not be sterilized, thus the potential mechanism for
crowding out is not triggered. If the goal of research is to capture the effects of a policy
decision, then a separate measure of reserves from the balance of payments data appears
to be a better proxy. When using this measure, I find that there is no significant
relationship that exists between accumulation and investment. My initial results and
methodology contribute to existing reserve literature by bringing to light the strong
influence valuation effects has within the reserve stock measurement, and how the
subsequent differences between the BOP and reserves measures can drive drastically
different research results.

1
Table of Contents
Introduction: Pg. 1
Literature Review: Pg. 2
Drivers of reserve growth Pg. 3
Benefits of reserves Pg. 5
Costs associated with reserve accumulation Pg. 5
Reserves and domestic investment Pg. 6
The reserve crowding out mechanism Pg. 6
Sterilization of reserves Pg. 8
Descriptive review of investment and foreign reserves Pg. 8
Methodology: Pg. 10
Dependent variables and the econometric model Pg. 10
List of controls Pg. 11
Sample and time series Pg. 11
Empirical Findings: Pg. 12
Valuation effects and actively managed reserves Pg. 15
A more appropriate measure of reserves (BOP Reserves) Pg. 18
Predicted value models Pg. 19
Robustness checks Pg. 20
Evaluating the baseline model’s valuation effects Pg. 21
Discussion: Pg. 24
Conclusion: Pg. 26
References: Pg. 29
Appendix: Pg. 33
Data Pg. 33
Reserve Variables Pg. 34
Descriptive Statistics Pg. 35
Correlation Table Pg. 35
Regression Appendix Pg. 36

1
Introduction:
Central bank holdings of foreign exchange reserves have increased rapidly over the past
two decades, especially in many Asian nations. There has been no shortage of explanations as to
why countries have accumulated high levels of reserves, with some observers citing mercantile
(competitive) reasons while others have claimed that the answer lies in precautionary motives.
While the benefits to maintaining large reserves are clear to policymakers and academic
economists alike (ensuring liquidity, smoothing foreign exchange volatility, preventing
speculation), the potential negative macroeconomic externalities are less well understood. On the
20th anniversary of the crisis, it is important to weigh these costs and benefits, and to question
whether foreign reserves have had a quantifiable negative impact on the Asian countries that
have seen exponential growth in their reserve holdings. While fiscal and quasi fiscal costs have
been considered, less ink has been spilled in trying to evaluate the impact of reserves on the
domestic economy.
The goal of this paper is to evaluate one macroeconomic aspect of reserve accumulation,
which is the potential relationship between reserve accumulation and domestic investment.
Reinhart, Reinhart, and Tashiro (2016), suggest that reserves are negatively related to investment
through the possibility that the central bank can crowd out investment when it issues central bank
bills. Research has shown that sterilization is usually offset by private capital flows; however,
Bayoumi et al (2015) find that when capital accounts are closed this process is inhibited.
Theoretically this may be the mechanism where crowding out occurs, as less funding is available
for investment based on the inability of sterilization to be offset by private capital flows. In the
case that increasing reserve accumulation and low level of investment have a significant
relationship it may be prudent for policymakers, especially in developing countries where
investment is needed, to consider ways to either encourage investment or curtail reserve
accumulation.
My hypothesis, that reserves and investment are negatively related, was evaluated by
utilizing panel data employing OLS and fixed effects methods with various controls. The
baseline sample included four countries in the Asian region, Indonesia, Malaysia, the Philippines,
and Thailand from the 1990 to 2014 time period. In a second sample, I also added Hong Kong,
Japan, Korea, India, and Singapore, in order to cover a larger range of countries at different

2
stages of development. For the dependent variable, I utilized gross capital formation scaled to
GDP, and for the independent variable of interest I utilized two separate measures of foreign
exchange reserves. In the first model, similar to Reinhart, Reinhart, and Tashiro (2016), I utilized
the first difference of stock reserves (FD Reserves). However, as this measure contains valuation
effects I also used balance of payments reserve data (BOP Reserves) as an alternate measure.
The baseline model results indicate that FD Reserves are significant and negative at the
99% confidence level. The finding that FD Reserves and investment are negatively related
remains robust when using the four countries fixed effects specification, or the expanded nine
country sample with OLS and fixed effect specifications. However, the BOP Reserves variable,
which is a more accurate proxy for policy induced reserve changes, does not have a significant
relationship with investment over GDP. After further analysis, it appears that valuation effects
are the driver behind the significance between FD Reserves and investment. Given this fact and
the lack of significance between BOP Reserves and investment, my hypothesis is not confirmed.
Despite the potential for valuation effects to exacerbate differences and drive divergent results,
as my research shows, after a review of current literature it is clear that many scholars
completely ignore or fail to mention the valuation effects contained in FD Reserves.
The first section of the paper will give background on the current literature surrounding
motives and will review the potential efficacy of reserves accumulation. In addition, the potential
mechanism for central bank sterilization to crowd out investment will be discussed. Section two
will explain the methodology of the paper and introduce the econometric models employed.
Section three will go over the empirical findings of the baseline model, robustness checks, and a
discussion about BOP Reserves valuation effects. Finally, section four will discuss the
implications of the research, followed by a brief conclusion.
1. Literature Review:
Before evaluating the potential macroeconomic side effects of reserve accumulation, it is
important to consider whether policymakers have accumulated too few or too many reserve. Yet,
this judgement in and of itself is a divisive issue; what some countries see as “hoarding” of
reserves, others deem as necessary to maintain stability in financial markets and the capital
account. While there are a variety of traditional measures to gauge reserve adequacy (Box 1),
there is no consensus on appropriate level of foreign exchange reserves or which measure is most

3
accurate. Of these traditional measures, Garcia and Soto (2004) find that reserves as a ratio of
short term debt may be the best measure of reserve adequacy. In their research, short term debt is
a key factor in explaining the occurrence of an economic crisis, after controlling for other
variables.
Box 1: Source: IMF 2011
Traditional
Metrics to Reserve
Ratio
Explanation Suggested
Level
Import Cover Time period imports can be sustained if all inflows stop. 2-6 months
Short Term Debt Time period short term debt can be paid, also known as
“Greenspan-Guidotti” Rule.
12 months
Broad Money Represents M2 level in the economy, appropriate level
unclear.
20 Percent
In going beyond the traditional metrics, many economists have also attempted to measure
appropriate reserve levels by employing various econometric methods. Garcia and Soto (2004) in
their model conclude that Asian reserve levels were appropriate post Asian financial crisis; while
on the other hand, Jeanne and Ranciere (2006) conclude that Asian countries hold reserves in
excess of what is needed for insurance reasons.
Drivers of reserve growth
A great deal of academic literature has attempted to tackle the question as to why
countries in Asia have greatly increased their holdings of foreign exchange reserves over the past
two decades, with a wide variety explanations cited, ranging from mercantile (competitive)
reasons to precautionary motives.
Tsangarides et al. (2012) claim that following the Asian financial crisis, collapses of
exchange rates in many countries demonstrated the benefits of undervalued currencies, and that
starting from the early 2000s deliberate currency undervaluation became an important
determinant of reserve accumulation. Pointes and Rajan (2011) also find that Asian countries

4
have a “fear of floating in reverse”, in other words policymakers intervene when their currency is
appreciating but not necessarily when it decreases. In regards to the efficacy of these reserve
interventions, Adler and Tovar (2014) find that regardless of motivation, accumulation helps
negate currency appreciation.
In direct contradiction to the mercantilist motivation theory, Calvo et al (2012) do not
find evidence that policymakers have utilized reserves to boost economic competitiveness.
Instead, they claim that optimal reserves are determined by the probability of a sudden stop in
capital. Aizenman and Lee (2005) also find that from 1980-2000 trade openness and exposure to
financial crises are statistically and economically more important than undervaluation of
currency in determining reserve accumulation. Obstfeld Shambaugh and Taylor (2010) reach
similar conclusions, finding that reserve growth can be accounted for by financial stability, the
size of domestic financial liabilities convertible to foreign currencies, financial openness, and the
ability to access foreign currency through debt markets. Within those who view mercantile or
competitive motivations as the most important factor in driving reserve accumulation, some
authors are clearer in identifying mercantile motives as a factor in driving persistent current
account imbalances between developing and developed countries prior to the 2008 crisis
(Gagnon 2013).
Taking a more nuanced approach, Delatte and Fouquau (2012) recognize both mercantile
and precautionary motives as having role in motivating authorities to accumulate reserves, but
identify the former, in the form of management of exchange rates, as the largest driver of reserve
rapid reserve accumulation in the 2000s. Paladino and Cifarelli (2007) also highlight the
influence of both motives and find that in the short run reserves are accumulated to avoid a loss
of economic competitiveness, but in the long run precautionary concerns contribute more to
accumulation of reserves.
Within this debate is the issue of whether reserve accumulation is made by policy
decisions or through other non-policy related phenomenon. Alfaro and Kanczuk (2009) using a
theoretical stochastic dynamic equilibrium model find that reserve accumulation is best
explained by political economy motivations. On the other hand, other research points out that
economic growth, capital account openness, trade openness and exchange rate volatility drive the
accumulation of reserves (Shrestha & Wansi 2014).

5
Benefits of reserves
In regards to the utility of reserves, research tends to suggest that they play a positive role
in preventing crisis. Bussiere et al. (2014) found that countries that held more reserves as a
percentage of short term debt were less negatively impacted in the 2008 financial crisis. This
finding is supported by Frankel and Saravelos (2012) who suggest that if foreign reserves are
scaled to GDP then increasing foreign reserve ratios makes it less likely that a country would fall
into an economic crisis after 2008.
In terms of the capital account, Alberola et al. (2012) find that in high reserve countries,
domestic capital outflows were significantly lower during financial distress than those with lower
level of reserves. Concerning economic output, Llaudes et al. (2010) find a positive relationship
between larger foreign exchange reserves and output after 2008. Working with multiple proxies
for reserve intervention, Dominguez et al. (2012) also find that active purchases or sales of
reserves during the financial crisis in 2008 is positively correlated with GDP growth in the post-
crisis. On the other hand, Blanchard et al. (2010) working with a smaller sample, find that
reserves do not serve as a buffer during times of crisis.
Ghosh and Qureshi (2016) in a probit model further find that a larger stock of reserves is
associated with lower likelihood of a currency crisis. In addition, they note that reserves most
likely act as an effective buffer through signaling and maintaining market confidence, rather than
through actual intervention. This is again confirmed by Aizenman and Hutchison (2010) who
find that many countries with high levels of reserves let their currencies depreciate during the
financial crisis in 2008, rather than sell their stockpiles of reserves. In other words, countries may
wish to forgo sales in the “fear of losing reserves”.
Costs associated with reserve accumulation
Other scholars have tried to measure the potential economic distortions or costs related to
excess foreign exchange holdings. Rodrik (2006) found income loss associated with holding
“excessive” reserve assets to be on average around 1 percent of GDP. This is mainly due to the
fact that reserve holdings are often placed in low yielding conservative investments, sometimes
with returns lower than the inflation rate. In addition to previously mentioned fiscal costs,
Alberola and Serena (2007) find that there are also quasi fiscal costs, such as conflict of interest
between fiscal authorities and central banks. This can occur when sterilization instruments are

6
government paper or when the central bank paper competes with government bonds. Sterilization
can also impact domestic financial stability and restructuring, which could lead to divergent
policy goals between monetary and fiscal authorities.
While it is more controversial, some authors have claimed larger distortionary effects
associated with reserve accumulation. Mohanty and Turner (2006) through their research claim
that reserve holdings are not only excessive, but that in certain cases it may lead to financial
instability. Garcia and Soto (2004) also claim that large reserves stocks may create moral hazard
problems that could weaken the overall financial system.
Reserves and domestic investment
Until recently, research related to my research question--on the connection between
domestic investment levels and reserve holdings--has been scarce. Fukuda and Kon (2010) in a
previous paper measured the macroeconomic effects of reserves on exports, consumption and
investment. The findings suggest that increased reserves reduce investment in the short run, but
may help increase investment in the long run.
Cook and Yetman (2012) utilizing bank level data, find evidence that excessive levels of
reserves may have negative effects on bank lending and investment. The authors also suggest
that low levels of domestic investment, caused in part by the reserve accumulation channel,
could also be one contributor to global current and capital account imbalances.
Reinhart and Tashiro (2013) in more recent literature suggest that reserves may crowd
out investment due to the transfer of domestic savings abroad. More specifically the crowding
out occurs when the central bank competes with domestic borrowers in the loanable funds
market. Reinhart, Reinhart, and Tashiro (2016) in subsequent and related research also utilize a
VAR model to quantify the connection between reserves and investment. The results suggest that
a one standard deviation upward shock to reserves is associated with a statistically significant
decrease in investment over a three-year period. They also find that knowing the history of
investment is not a useful predictor of reserve accumulation.
The reserve crowding out mechanism
In the traditional definition of “crowding out” the central government issues more debt
which competes for loanable funds. According to Reinhart, Reinhart, and Tashiro (2016), the

7
central bank can also crowd out investment through the issuance of central bank bills, which are
issued to the market in order to draw out liquidity. The concept that reserve accumulation
transfers domestic money abroad is far from controversial; this is simply a mechanism of the
balance of payments (Identity 1). Where NCO is net capital outflows, CA is capital account
surplus and RA is change in reserves. Any value of RA smaller than zero suggests accumulation.
In the case that reserves change they will be offset by flows in either NCO or CA.
Identity 1: NCO+CA+RA=0
This “offset”, when private capital flows in while reserves flow out, can occur for a
number of reasons. For example, private investors may be enticed to send money to a country
that accumulates reserves in order to arbitrage the potential interest rate changes induced by
reserve sterilization. In the case where a country accepts a higher level of inflation rather than
conduct sterilization, arbitrage opportunities would continue to exist in the form of longer term
currency valuation changes, and thus could still be offset by private capital.
If reserve accumulation is truly offset by capital inflows than it would not be expected
that reserves would crowd out investment or change the equilibrium of loanable funds market.
However, a country which inhibits the potential return of private capital, could be one potential
scenario where crowding out could occur (see diagram below). Bayoumi et al (2015) in an
empirical study find that when capital accounts are open, reserve outflows are offset by private
inflows. The caveat is that this offset occurs only partially when countries have more capital
controls. While this does not prove crowding out, theoretically this may be the mechanism where
less domestic funds for investment are available based on the inability of sterilization to be offset
by private capital flows.
8
Sterilization of reserves
It is important to briefly review exactly how a central bank can carry out sterilization
policies. If a central bank purchases foreign exchange reserves, when equity capital is unchanged
and demand for reserves remains constant, in order to prevent inflation, the central bank must
issue domestic monetary liabilities. The central bank can achieve this by selling domestic assets
or issuing its own securities. The latter can be specifically achieved using market (sterilization
securities, direct borrowing from banks, repo transactions, or foreign exchange swaps) or non-
market based means such as controls on bank lending, transfers of government assets from the
commercial banking sector to the central bank, or changing reserve requirements (Mehrotra
2012).
Research has indeed shown that for many Asian countries reserve accumulation was
effectively sterilized in the 2000s (Filardo and Grenville 2012). More specifically, Aizenman and
Glick (2009) find increasing utilization of sterilization by China, Thailand, Malaysia and India
through the 2000s. Specifically for the case of China, Ouyuang et al (2008) find that 90% of
reserve accumulation was sterilized between 1999 and 2005. Overall the above research suggests
that countries in Asia have a high propensity to sterilize reserves. If sterilization does in fact
crowd out investment, then Asian countries who have utilized this policy would potentially bear
out the relationship between increased reserves and lower rates of investment.
Chinese sterilization policy is an interesting case study due the massive scale it has been
conducted on and the plethora of research that has probed its effects. The country has carried out
sterilization mainly through raising the commercial bank reserve ratio, implementing 21 such
increases between 2002 and 2008. The central bank has also issued large quantities of central
bank bills to commercial banks, further sopping up liquidity in the banking system. Sterilization
is thought to be less costly in the case of China, as the central bank can force banks to purchase

9
central bank bills. For commercial banks these forced purchases are accompanied by
opportunity costs because the PBOC pays a rate on sterilization bills below what banks could
earn by lending to the private market. It is due to financial repression (control of bank lending
rates and interest rates) that the PBOC does not have to pay a higher rate for the central bank
bills, further reducing the cost of accumulation and subsequent sterilization (Lardy 2008).
Descriptive review of investment and foreign reserves
It will be further informative to quickly refer to the pattern of investment and reserve
accumulation for a select group of Asian countries over the 1990 to 2014 period. In terms of
reserve levels as measured against GDP (Table 1), what stands out is that Singapore and Hong
Kong, by a large margin, have the highest level of reserves. They are able to finance these high
levels of reserves in part because of large current account surpluses and the necessity to defend
their currency regimes. Being financial centers and small city states also differs these countries
from the rest of the sample, and it is clear that they are both qualitative and quantitative outliers.
While the reserve levels of China are also quite high (37% as of 2014), the country is not an
extreme outlier compared to Thailand (38%), the Philippines (27%), and Malaysia (34%). This
fact runs contrary to the often-reported media narrative portraying Chinese reserves as excessive,
and it brings up a broader point that reserve levels should be understood not just through the
headline numbers, but also in the context of other measures such economic size. The overarching
takeaway from looking at the sample is that while reserve accumulation differs by country, in
every instance reserves are higher in 2014 than prior to the financial crisis.
On the other hand, gross capital formation as a percentage of GDP (Table 2) has fallen in
almost every country since 1990. It could be argued that investment was unsustainable prior to
the crisis, and that levels have simply returned to equilibrium. However, the decrease in
investment took place across a broad spectrum of countries. Thailand, the Philippines and
Malaysia, now exhibit similar levels of investment to more economically advanced countries
such as Singapore and Japan. This is despite the fact that we would expect less developed nations
to have a higher need for fixed investment. Another important point is that China is an outlier
among my sample, with investment representing almost half of all economic activity after the
great recession.

10
2. Methodology:
Dependent variables and the econometric model
In order to explore the relationship between foreign reserve accumulation and investment
I will use panel data employing both OLS and fixed effects specifications. The dependent
variable of interest across all models will be gross capital formation in local currency units
scaled to GDP in local currency units (henceforth referred to as Investment), which bounds the
variable between 0 and 100. Gross capital formation is defined as fixed asset investment,
including changes in inventories. For the baseline model Investment will be first differenced to
create flow data. For the independent variable of interest, I utilized the log first difference of
reserves stock including gold (henceforth FD Reserves) which is the same variable as Reinhart,
Reinhart and Tashiro (2016). My hypothesis is that that FD Reserves will be negatively related to
investment through central bank crowding out via sterilization or sterilization-like policies.
OLS Model:
Table 1: Reserves/GDP % 1990 1995 2000 2005 2010 2014
China 9.554 10.930 14.180 36.370 47.761 37.206
Hong Kong 32.050 38.315 62.656 73.075 117.541 112.804
India 1.726 6.237 8.615 16.522 18.139 15.986
Indonesia 8.156 7.375 17.787 12.149 12.742 12.562
Japan 28.297 35.348 7.399 17.809 19.229 26.000
Korea 5.238 5.865 17.138 23.443 26.692 25.709
Malaysia 24.211 27.844 30.548 49.088 41.773 34.300
Philippines 4.595 10.498 18.604 17.924 31.227 27.956
Singapore 76.870 78.298 84.610 92.657 97.817 85.388
Thailand 16.707 21.821 25.845 27.507 50.459 38.871
Sample Average 20.740 24.253 28.738 36.654 46.338 41.678
Table 2: Gross Capital Formation/GDP % 1990 1995 2000 2005 2010 2014
China 34.734 39.685 34.430 41.391 47.612 47.008
Hong Kong 27.171 34.291 27.582 22.357 23.890 23.844
India 24.909 26.053 24.115 34.280 40.668 34.184
Indonesia 36.148 31.928 22.246 25.081 32.880 34.568
Japan 32.487 29.883 27.307 24.749 21.297 23.883
Korea 34.750 34.824 32.942 32.163 32.023 29.277
Malaysia 32.360 43.640 26.867 22.396 23.386 25.017
Philippines 24.151 22.451 18.368 21.550 20.541 20.527
Singapore 35.640 33.841 34.899 21.367 27.870 28.926
Thailand 41.354 42.863 22.283 30.421 25.370 24.073
Sample Average 32.370 33.946 27.104 27.576 29.554 29.131

11
Where in the above expressions I denotes gross capital investment, Y denotes GDP
measured in USD and FD Reserves represents stock of reserves including gold. The calculation
utilized to convert FD Reserves into a log first difference is listed in the data appendix under the
Reserve Variables Formula 1.
List of Controls
The controls will consist of GDP per capita measured in USD (proxy for economic
development), working age population (proxy for demographics), growth of broad money (proxy
for domestic economic conditions), and a crisis dummy for the years 1998, 1999. All of the
previously mentioned variables were retrieved from the World Bank’s WDI database.
The controls will also include monetary independence, which is a de jure measurement
from the Chinn-Ito “trilemma indexes” (Aizenman, Chinn, Ito 2010). This is included as the
degree of monetary independence of a country can greatly impact the central bank’s response to
the domestic business cycle. In the case of lower levels of monetary independence, investment
levels may be lower due to the fact that monetary policy does not have the complete freedom to
respond to economic downturns.
Sample and time series
I will focus my sample first on four countries in the Asian region, Indonesia, Malaysia,
the Philippines, and Thailand. The time series will include the 1990 to 2014 period, as prior to
1990 reserve accumulation was just a small fraction of the economy. The rational in picking my
sample and time series is straightforward. Between these countries and over this time period, we
see both sterilization (large amounts of accumulation) and capital controls present, both
conditions which I posit are the potential mechanisms to crowd out investment. If reserves do in
fact crowd out investment, then we would expect at a minimum to be able to see these effects in
the countries with the highest levels of reserves. In countries with low levels of reserves and
thus little to no amounts of sterilization, according to my logic the potential for crowding out is
not expected be present.
The reason to include mainly countries with some degree of capital controls is that
reserve sterilization in an environment with no capital controls can be offset by private capital
inflows. In the case of this offset, we would not expect increased reserves to be related to

12
decreased investment. Another motivation to initially sample only Indonesia, Malaysia, the
Philippines, and Thailand is that they are at similar stages of development, share close
geographic proximity to one another, and were all greatly affected by a financial shock around
1997.
Limiting the sample to only these four countries raises the chance that results will be
biased on the basis of self-selection. As such, a second sample will further include Hong Kong,
Japan, Korea, India, and Singapore. Although the samples do not include non-Asian countries,
the second sample covers a range of countries in various stages of development, which will
provide a sufficient robustness check for the original four country sample.
I will also briefly discuss the various reasons why China is left out of the initial samples.
China in general presents challenges for economic studies using a panel of Asian countries.
Conducting macroeconomic research about Asia without including China could be lacking an
essential piece of the puzzle. On the other hand, at the risk of sounding cliché, particularly in
regards to investment and reserves, China has unique characteristics setting it apart from other
countries. The first unique aspect is that Chinese gross capital formation (at times almost 50% of
GDP) is far higher than other countries, not only in our sample but also across history and time.
More than being an outlier in terms of investment levels, the process in which investment
decisions are made is also different from those economies in my sample. This is due to the fact
that Chinese investment is most likely driven by many non-market forces. An example of this is
deposit controls (in effect until 2015) and lending rates controls (in effect until 2013), which
were only recently relaxed and abolished.1 An even larger factor for non-market forces at play in
investment is that SOEs and other quasi government entities make investment decisions not only
on returns but also at the behest of government plans or initiatives. Although it is unclear, some
estimates put the public share of fixed investment as high as 60 percent as of 2016 (Scissors
2016).
3. Empirical Findings:
For the baseline model the initial regression results (Regression Table 1) suggest that
there is a significant negative relationship between investment and reserves. These findings are
consistent with the Reinhart, Reinhart, and Tashiro’s findings (2016), and this should not be
1Bloomberg News. “China Takes ‘Riskiest’ Step by Ending Deposit-Rate Controls” October 23, 2015.

13
surprising given that the FD Reserves and Investment variables are the exact same data
employed in their research.
In Regression Table 1 the difference between the OLS and FE models is that the fixed
effects model clusters standard errors across countries while the OLS model does not. The
significance of the variable of interest does not change between the two models. The findings
also hold when running the regressions without controls and a varying degree of controls
(Regression Appendix, Table 1).
With regards to the economic significance, a 1% increase in the reserves to GDP ratio is
related to a 0.0609 decrease in the investment to GDP. Considering the average year to year
reserve change is 3.5%, in any given year we would expect the average increase of reserves to be
significantly associated to a 0.21 decrease in the investment over GDP ratio. While the economic
effect is not large, as investment is a potential avenue to increase productivity over the long term,
there could be a larger economic impact than the headline number suggests. Regardless,
sacrificing only millions of dollars of investment would seem to be worth the cost, if as the
literature suggests reserves act as a buffer against multi-billion-dollar financial meltdowns.
Regression Table 1: Baseline Model
1990-20144Countries Baseline:OLS Baseline:FE
DependentVariable: ΔInvestment/GDP ΔInvestment/GDP
FDReserves -6.099*** -6.099***
(1.772) (0.845)
AsianFinancialCrisis -6.693*** -6.693**
(1.766) (1.524)
GDPPerCapita -0.000191 -0.000191
(0.000205) (0.000105)
AgeDependencyRatio -0.100 -0.100
(0.396) (0.101)
BroadMoneyGrowth -0.0289 -0.0289*
(0.0210) (0.0107)
MonetaryIndependence 3.757** 3.757*
(1.731) (1.310)
_cons 0.695 0.695
(2.763) (0.984)
N 100 100
R-sq 0.3662 0.4228
*p<0.10**p<0.05***p<0.010
CountryFixedEffects Yes Yes
TimeFixedEffects No No

14
With regards to the controls, the Asian Financial Crisis Dummy (1998 & 1999) has an
expected negative coefficient, which is consistent with the notion that investment contracted
sharply in the years following the Asian Financial Crisis. Monetary Independence was also
significant and negative, which could be explained by the fact that countries with higher levels of
central bank independence have higher rates of investment, as they may be able to more freely
counter economic downturns. Despite the presence of domestic economic crisis and conditions
that call for lower interest rates, sometimes central banks are forced to raise interest rates to
prevent capital outflows further exacerbating poor domestic economic conditions. Broad money
growth is significant and negative which is surprising as you would expect higher levels of
investment to be associated to boom periods when the money supply is also growing. When the
baseline regression utilizes the expanded 9 country sample, the significance of Monetary
Independence disappears although the dummy variable and the FD Reserves remain the same
(Regression Appendix, Table 2).
While these results appear to confirm the hypothesis that reserves crowd out investment,
the reserve measurement we used in the baseline model are an imperfect proxy for reserve
accumulation. As discussed earlier, central bank crowding out is most likely to occur through the
issuance of central bank bills, but it is important to note that in most cases these bills are issued
only in the event that authorities actually make a policy decision to accumulate reserves. Thus, it
is of utmost importance to utilize a proxy for reserves that captures changes based on policy
decisions rather than other non-policy related factors.
Valuation effects and actively managed reserves
In the baseline regressions other than purchases and sales of reserves, the variable FD
Reserves also includes valuation effects. Since reserves are almost always measured in USD,
valuation effects arise when the value non-USD denominated change against the dollar. If the
goal of research is to capture the effects of a policy decision, then balance of payments reserve
data appears to be a better proxy. This measure, henceforth referred to as BOP Reserves, does
not capture valuation effects.
If both BOP Reserves and FD Reserves data is available, quantifying the valuation effects
contained with FD Reserves is straightforward. One must simply subtract BOP Reserves from
FD Reserves. In this we are essentially removing the policy decision from FD Reserves and the

15
remaining difference is the valuation effects. In theory, if there were no valuation effects or if all
reserves were held in USD then the first difference of stock reserves should be equal to BOP
Reserves. However, this is almost never the case, and by studying the absolute difference
between FD and BOP one can see the larger the country’s reserves the higher the year over year
valuation changes (Graph 1). This is consistent with the logic that as reserves grow, even a small
change in valuation effects will represent a larger and larger year over year change.
Graph 1: WDI Data
Comparing year over year changes in both BOP Reserves changes and valuation effects,
we can breakdown the components of yearly FD Reserves changes and see which portion is
decided by policy and which portion is decided by non-policy related valuation effects. In recent
years, especially amongst the countries of my sample (Indonesia, Malaysia, Philippines,
Thailand), valuation changes have been both volatile and large; in fact some yearly valuation
changes are larger than year over year BOP Reserves changes (Graph 2). If valuation effects
represent a large portion of the year of year changes in reserves then it could potentially lead to
spurious results if researchers attempt to measure only a policy decision.
Graph 2: WDI Data

16
Despite the flaws of the FD Reserve measure, BOP Reserves are far from a perfect proxy
for active reserve purchases or sales because the measure also captures earned interest on
reserves. In a country with a large stock of reserves, it is conceivable that earned interest could
represent a large portion of yearly BOP Reserve changes. Again, similar to valuation effects,
passive interest income could mask policy related reserve purchases or sales.
Research has attempted to remove the earned interest effects from the BOP Reserves
measure in order to isolate only purchases or sales of reserves by policy makers (Dominguez et
al. 2012). This is achieved by simulating interest earnings of each country based on IMF SDDS
data, which provides a breakdown of foreign exchange reserves held in securities and deposits.
Countries do not release the currency breakdown within the security or deposit data, but the IMF
does provide aggregate currency holdings on a world, advanced, and developing market level
(COFER Data). Using the COFER data, returns can then be calculated for the portion of each
respective currency using the return on ten year bonds (securities return proxy) and three month
interbank loans (deposits return proxy). Unfortunately, this measure remains imperfect because
we do not know specifically how security or deposits holdings are actually invested, nor do we
know the currency holdings of a single country’s reserves.
For my sample, I was unable to utilize this method to run regressions, as many of the
countries have only recently subscribed to SDDS data standards, and this severely limits the

17
number of observations. Although, I was able to simulate earned interest for three countries in
my sample, Thailand, Malaysia, and the Philippines which have data from the year 2000 (Graph
2). The dotted line in the graph is the change in reserves based on a policy decision, that is to say,
change in reserves without the effects of either valuation or earned interest. The red line is
simply the BOP Reserves variable (which includes a policy decision and interest rate income),
and the difference in the two data points is earned interest. It is quite clear from the graph that
prior to the great financial crisis, earned interest could drive a difference between net purchases
or net sales year over year. In recent years the difference between the two measures is
converging, in other words interest income is shrinking. This is most likely due to the recent
slump in returns on safe haven assets and bonds across the world.
Graph 2: IMF SDDS data
Given that FD Reserves and BOP Reserves both contain non-policy related changes, we
would expect both the valuation effects and earned interest in time period T to influence policy
maker’s decision in T+N. In other words, policymakers may come to decisions regarding
purchases or sales of reserves based on either valuation or earned interest effects. This feedback
mechanism makes it difficult to untangle which of these variables would most accurately reflect
a policy decision.
Sterilization data is another potentially more straightforward method to examine the
effects of central bank crowding. This measure could test whether sterilization is the central bank
crowding out channel, whereby liquidity is drawn out of the economy and investment negatively

18
affected. However, sterilization data is not widely used in research due to the fact it comes in
many forms, including for the purpose of sterilizing capital flows, and the data is less publicly
available.
After a closer look at the valuation effects for my sample, while BOP Reserve data is
imperfect it is still the best option to capture reserve changes based on sales or purchases. Further,
comparing regression results between the FD Reserves and BOP Reserves will demonstrate
whether valuation effects have the potential to drive divergent results. If in fact the results are not
consistent, it would further call into question the decision to use FD Reserves as a proxy for a
central bank policy decision.
A more appropriate measure of reserves (BOP Reserves)
After running the baseline regression using the alternate BOP Reserves we find vastly
different results. There is now no significant relationship between reserves and investment, and
further the coefficient on the reserves variable is around 10 times smaller than the baseline
regression (Regression Table 2).
Regression Table 2:
The lack of significance between reserves and investment persists across the 9 country
sample in addition to the models with no controls and varying degrees of controls (Regression
1990-20144Countries AlternateReserves:OLS AlternateReserves:FE
DependentVariable: ΔInvestment/GDP ΔInvestment/GDP
BOPReserves -0.674 -0.674
(1.223) (1.591)
AsianFinancialCrisis -8.296*** -8.296**
(2.152) (1.883)
GDPPerCapita -0.000107 -0.000107*
(0.000202) (0.0000422)
AgeDependencyRatio -0.197 -0.197**
(0.400) (0.0349)
BroadMoneyGrowth -0.0530** -0.0530
(0.0264) (0.0262)
MonetaryIndependence 3.036* 3.036**
(1.743) (0.882)
_cons 1.803 1.803**
(2.825) (0.323)
N 100 100
R-sq 0.2937 0.3567
CountryFixedEffects Yes Yes
TimeFixedEffects No No
Standarderrorsinparentheses *p<0.10**p<0.05***p<0.010

19
Appendix, Tables 3 & 4). The differences in the two models can be visualized in the following
predicted value models.
Predicted value models
Graph 3:
Graphs 3 and 4 are predicted value plots derived from Baseline Model and Alternate
Model. Each graph utilizes a four-country average of actual observed changes in investment
(blue), predicted investment based on the overall model (maroon), predicted investment based
on the reserve residuals (green), and predicted values based on the remaining controls. Graph 3
shows strong correlation between the predicted model residuals using FD Reserves and actual
investment, this can be seen in the correlation between the green and blue lines. On the other
hand, Graph 4 demonstrates a weak relationship between actual investment and the predicted
model using BOP Reserves, in other words the green and blue lines are nonresponsive to one
another’s movement. Most importantly the residual plots show us what we see in the regression
results, BOP and Reserve data yield drastically different results.
The graphs and models are similar in that there is a weak relationship between the
controls and observed investment. Further, despite my inclusion of a crisis variable, each graph
illustrates the failure of my model to properly control for the Asian Financial Crisis.
Graph 4:

20
Robustness checks
I also conducted a variety of other robustness checks to explore the persistence of the
significance of FD Reserves and insignificance of BOP Reserves. The first test inquired as to
whether the relationship between reserves and investment changes over time. The most logical
point to split the series is around the financial crisis of 2008, as the behavior of accumulation
shifted post-crisis, with less reserve accumulation occurring. The two separate time samples I
utilized were the periods prior to (1990-2008) and post (2010-2014) the Great Financial Crisis.
For both the FD Reserves and BOP Reserves, the results indicate that the relationship between
reserves and investment has changed over time. The period prior to the financial crisis indicates
the same results as the full sample regression, a negative and highly significant relationship
between FD Reserves and investment and a lack of significance between BOP Reserves and
investment (Regression Appendix, Table 5). While in the post financial crisis environment
(Regression Appendix, Table 6), the FD Reserves and BOP Reserves are insignificant and
positive. In the instance that crowding out effects exists, we would at minimum expect a
significant negative relationship between BOP Reserves and Investment to be present in the pre-
crisis sample, a time that many view as the most egregious accumulation period. Yet, we do not
see any significance.

21
For another robustness check, I added China to the sample (not shown), and again the
significance of the reserve variables and controls remained unchanged from other models. My
assumption was that Chinese reserves and investment would lessen or remove the significance of
FD Reserves because the variables are highly and positively correlated, but this was not the case.
My final robustness check involved time fixed effects. When employing this method for
both the OLS and Fixed Effects models, the significance of FD Reserves disappears (Regression
Appendix, Table 7). On the other hand, when including the time fixed effects with the expanded
9 country sample the negative and significant result of FD Reserve remains (Regression
Appendix, Table 8). In both cases the BOP Reserves remains insignificant.
The four-country sample countries in particular experienced accumulation more or less
simultaneously, and while removing such time trends may help control for spurious correlation,
due to the small country sample, it may indiscriminately remove the effects of reserve
accumulation on investment. The obvious reason for simultaneous accumulation in all four
countries is that they were all hit by a financial shock in 1997, which changed their
macroeconomic management. In a larger country sample, in which there is more diversification
across countries, then we wouldn’t expect the time trends to completely remove the significance
of results. This is in fact what the results demonstrate, with a significant finding on FD Reserves
in the diverse nine country sample and insignificant findings on the four-country sample.
Throughout the robustness checks, the puzzle remains as to why FD Reserves are
significant but BOP Reserves are not. The consistent insignificant relationship between BOP
Reserves and Investment supplements evidence that valuation effects are potentially driving the
negative significance in the FD Reserves variable.
Evaluating the baseline model’s valuation effects
In my initial results, the largest question is why such a stark difference exists between the
baseline regression and alternative regression, with the former’s FD Reserve indicating high
significance at the 99% confidence, and the latter’s BOP Reserves indicating no significance. My
initial expectation is that if anything valuation effects drive a positive relationship between
reserves and investment, as an increase in reserve value could contribute to a larger reserve
buffer. This buffer could be related to higher rates of investment because of its role in preventing
economic shocks.

22
It may be enlightening to visually study the valuation effects in the regressions, in other
words the exact difference between FD Reserves and BOP Reserves. This is carried out by
subtracting ΔBOP/GDP from ΔFD/GDP, which will produce Δvaluation/GDP variable. When
valuation effects are plotted against the dependent variable (investment over GDP), a clear
negative relationship exists (Graph 5). These valuation effects scaled to GDP could be the driver
behind the significant and negative relationship between FD Reserves and Investment in our
baseline regression results. An important distinction to make here is that valuation effects can
take place both in the numerator and denominator. In fact, we would expect that the valuation
effects taking place on GDP measured in USD would be far greater considering that it is a much
larger gross measure than the non-USD denominated reserves of the numerator. However, if
GDP valuation effects were the only driver behind the negative relationship between reserves
and investment then we would expect the BOP model to have been significant as well. In either
case the lack of significance of BOP and potential for the FD Reserves to be skewed by valuation
does not confirm my hypothesis that reserve accumulation is negatively related to investment.
Graph 5:
The most ideal way to further investigate how valuation effects interact with investment
is to decompose the FD reserves variable used in the regressions. FD Reserves is made up of
three parts which are BOP Reserves, valuation effects and GDP. The decomposition calculation

23
can be found in the appendix (Reserve Variables Formula 3). If the decomposition is done
correctly the left side “Decomposition” of Regression Table 3, will a decomposed version of the
“Baseline OLS” on the right side.
Regression Table 3:
The most important take away is that BOP Reserves is not significantly related to
investment and it is in fact positive. Thus, there is more evidence that accumulation of reserves
does not appear to be negatively and significantly related to investment. The results of the
decomposition also indicate as expected that both GDP and valuation effects are significantly
related to investment. The positive relationship between GDP and investment is expected given
that investment tends to increase in economic booms (Dell’Ariccia, Giovanni, et al. 2012).
Another lesson from the decomposition is that the negative and significant relationship
between FD Reserves and investment in the baseline regressions appears to be driven by
valuation effects. If that is the case, it indicates that the first baseline OLS regression was not
demonstrating crowding out effects of reserve accumulation but instead it was capturing some
other phenomenon in the relationship between investment and valuation effects. This could be
manifested in many ways. One example is that valuation effects could be closely related to dollar
appreciation or depreciation, which would potentially affect domestic investment levels. There
are many more potential connections between investment and valuation effects, but the important
1990-20149Countries Decomposition BaselineOLS
DependentVariable: ΔInvestment/GDP ΔInvestment/GDP
FDReserves -9.425***
(2.672)
LogChangeGDP 16.77***
(3.991)
LogChangeBOP 2.565
(36.47)
LogChangeValuationEffects -5.036*
(2.918)
_cons -0.984** 0.158
(0.487) (0.346)
N 100 100
adj.R-sq 0.3191 0.1911
CountryFixedEffects Yes Yes
TimeFixedEffects No No
Standarderrorsinparentheses *p<0.10**p<0.05***p<0.010

24
point is that the baseline model’s significance is not driven by reserve changes, but instead by
other factors not expected to be related to sterilization policies that crowd out investment.
4. Discussion:
Initially my baseline results appeared to confirm my hypothesis that reserve accumulation
is negatively related to investment. However, when using BOP Reserves, which is an alternate
measure of reserve that does not include valuation effects, the relationship between reserves and
investment appears to be insignificant. For both FD Reserves and BOP Reserves, the results
remain consistent across a wide range of robustness checks.
Through both qualitative and quantitative reasoning it appears that the baseline model’s
reserve measure (FD Reserves) is most likely significant due to valuation changes contained
within the variable. While actual purchases of foreign currencies by a central bank are often
sterilized, an increase of reserves through passive effects like valuation changes would not be
followed by any direct policy action. As such valuation effects are not expected to crowd out
investment.
My research calls into question the findings of Reinhart, Reinhart, & Tashiro (2016) for a
number of reasons. First, the authors appear to utilize an inappropriate measure for reserves
given that the theoretical underpinnings behind their model state that, “In the narrower
conventional definition of crowding out, the government issues more debt: in the more
encompassing definition, the government need not as the central bank- either by selling its
holdings of government debt or by selling its own sterilization bonds- does so” (Reinhart,
Reinhart, & Tashiro 2016). In other words, in order to confirm their theory, it is essential to
utilize a reserve measure that serves as a proxy for reserve sterilization or sterilization-like
policies. BOP Reserves appears to be a more appropriate measure for their research, but despite
this they utilize FD Reserves. My initial baseline results are exactly the same as their overall
findings, which could indicate that their results (similar to mine) may be driven by valuation
effects rather than a policy decision that they were seeking to measure. The reason our results are
comparable is that despite the fact there are differences in our models (their time series begins in
1973 and employs a VAR model), the variables used for reserves and investment are exactly the
same. In addition my nine-country expanded sample is as their sample.

25
Unfortunately, Reinhart, Reinhart and Tashiro are not alone. Despite the potential for
valuation effects to greatly influence reserves levels, a large portion of academic research
(including articles published in prestigious economic journals) often utilizes reserves stock rather
than BOP. In some cases, it is ambiguous as to which measure is employed despite the large
difference between the two. I do not mean to suggest this is done for nefarious reasons or to
massage the results, most likely the choice to utilize reserves stock is arrived at because BOP
data is less widely available. Nonetheless, it is worrisome that more attention isn’t given to the
stark difference between balance of payment reserve data and stock reserve data.
In research attempting to explain motives for reserve accumulation, the inclusion of
valuation effects is not expected to have distortionary effects. Any changes in valuation would
cause policy makers to adjust their behavior to meet their original reserve targets. In addition,
valuation changes wouldn’t be expected to change the policy maker’s original motives over the
long run. However, in order to properly study whether increased reserves serve as buffer against
macroeconomic shocks such as currency crisis, economic contraction, or current and capital
account deterioration, it is important for researchers to consider the potential for valuation
changes to be related to these same macroeconomic variables, and to investigate whether
valuation changes are driving the results.
Overall these results based on my econometric model and decomposition analysis suggest
that there is no significant negative relationship between policy related reserve changes (BOP
Reserves) and investment, rejecting my initial hypothesis that accumulating reserves crowds out
investment. The relationship between BOP Reserves and investment could be insignificant on
behalf of buffer effects, where countries with large reserves are better able to withstand
economic shock. One manifestation of this resilience could in higher levels of investment.
Another potential channel to drive insignificance of the negative relationship between reserve
and investment is that reserve accumulation may lead to increased exports through
undervaluation of the domestic currency. This undervaluation would be expected to contribute to
a stronger positive relationship between investment and reserves.
While a negative and significant finding for BOP would have confirmed my hypothesis,
the measure is still imperfect in part because it contains earned interest. Thus, in future research,
for countries that have SDDS data it would be ideal to remove earned interest, as I did previously
with the example calculation (Graph 2) for three countries in my sample, Thailand, Malaysia,

26
Philippines. Also, it may be prudent to think of other appropriate controls, as my original model
was not the most efficient predictor of actual investment. One significant control could be a
pegged currency or the degree of exchange rate flexibility. Moving forward, I would also like to
study the interaction between reserve accumulation and the openness of a country’s capital
account. In doing so, I could test my initial logic that crowding out occurs in countries that do
not allow for private capital to offset reserve accumulation.
From my initial model, it is impossible to draw conclusions about the casual relationship
between reserves and investment as I do not control for the possibility of endogeneity. The
endogeneity in my models could be manifested in a number of ways. For example, the
motivation to increase reserves may occur during uncertain economic times or in a recession,
causing investment to be lower regardless of reserve accumulation. In order to support my initial
research, finding an instrumental variable will be pivotal in further exploring the robustness of
my findings. I will also consider using a GMM model to control for endogeneity.
It is important to also state that even in the case where a negative relationship exists
between reserves and investment, this is not necessarily problematic considering there is no
agreed upon optimal level of investment. In fact, it is not necessarily an ominous sign that
investment levels are low; if for example the domestic market had poor marginal capital
productivity then it would be ideal to fund more productive investments abroad.
5. Conclusion:
The large expansion of foreign exchange reserves was one notable development in the
post Asian financial crisis world. While most academics and policymakers in Asia have touted
the economic benefits of reserves, the costs have remained less visible. The goal of this paper
was to consider one such cost, the potential negative relationship between reserves and domestic
investment.
The initial regression results I obtained appeared to confirm my hypothesis that reserves
are negatively related to investment, but after closer examination it seems that valuation effects
are most likely driving the results. In order to cross check whether valuation effects may be
behind the significance, I utilized a more accurate proxy for reserve changes that does not
include valuation effects (BOP Reserves). The results do not indicate a significant negative

27
relationship between reserves and investment, thus failing to confirm my initial hypothesis and
the findings of Reinhart, Reinhart & Tashiro (2016).
My initial results and methodology contribute to existing reserve literature by bringing to
light the strong influence that valuation effects have within the reserve stock measurement, and
how subsequent differences between the BOP and stock reserves measures can drive drastically
different research results. Unfortunately, through my review of current literature, not only do
scholars completely ignore or fail to mention the valuation effects contained in reserve stock,
many fail to make clear which data they employing. If researchers wish to measure the impact of
policy induced reserve changes, it is clear that BOP Reserve is the more appropriate data set and
it should be used whenever available. In addition, in the case that SDDS data is available, the
process created by Dominguez (2012) should be employed to isolate the earned interest from the
BOP data.

28
References:
● Adler, Gustavo, and Camilo E. Tovar (2014). "Foreign exchange interventions and their
impact on exchange rate levels." Monetaria, Centro de Estudios Monetarios
Latinoamericanos 2.1: 1-48.
● Aizenman, Joshua, and Jaewoo Lee (2005). "International reserves: precautionary versus
mercantilist views, theory and evidence." Open Economies Review18.2: 191-214.
● Aizenman, Joshua, Menzie D. Chinn, and Hiro Ito (2010). "The Emerging Global
Financial Architecture: Tracing and Evaluating the New Patterns of the Trilemma's
Configurations." Journal of International Money and Finance, Vol. 29, No. 4, p. 615–641
● Aizenman, Joshua, and Michael M. Hutchison (2012). "Exchange market pressure and
absorption by international reserves: Emerging markets and fear of reserve loss during
the 2008–2009 crisis." Journal of International Money and Finance 31.5: 1076-1091.
● Aizenman, Joshua, and Nancy Marion (2003). "The high demand for international
reserves in the Far East: What is going on?" Journal of the Japanese and international
Economies 17.3: 370-400.
● Aizenman, Joshua, and Reuven Glick (2009). "Sterilization, monetary policy, and global
financial integration." Review of International Economics 17.4: 777-801.
● Alberola, Enrique, Aitor Erce, and José María Serena (2012). "International reserves and
gross capital flows-dynamics during financial stress."
● Alberola, Enrique, and José María Serena (2007). "Global financial integration, monetary
policy and reserve accumulation: Assessing the limits in emerging economies." Banco de
España Research Paper No. WP-0706
● Alfaro, Laura, Sebnem Kalemli-Ozcan, and Vadym Volosovych (2011). “Sovereigns,
upstream capital flows, and global imbalances.” No. w17396. National Bureau of
Economic Research.
Alfaro, Laura, and Fabio Kanczuk (2009). "Optimal reserve management and sovereign
debt." Journal of International Economics 77.1: 23-36.
● Anne‐Laure Delatte & Julien Fouquau (2012). "What Drove the Massive Hoarding of
International Reserves in Emerging Economies? A Time‐varying Approach," Review of
International Economics, Wiley Blackwell, vol. 20(1), pages 164-176, 02.

29
● Bayoumi, Tamim, Joseph Gagnon, and Christian Saborowski (2015). "Official financial
flows, capital mobility, and global imbalances." Journal of International Money and
Finance 52: 146-174.
● Blanchard, Olivier J., Mitali Das, and Hamid Faruqee (2010). "The initial impact of the
crisis on emerging market countries." Brookings papers on economic activity 2010, no. 1:
263-307.
● Borio, Claudio EV, and Piti Disyatat (2011). "Global imbalances and the financial crisis:
Link or no link?"
● Bussiere, Matthieu, Gong Cheng, Menzie Chinn, and Noemie Lisack (2013). “Capital
Controls and Foreign Reserve Accumulation: Substitutes or Complements in the Global
Financial Crisis?”
Brugger, Florian (2015). Asias Reserve Accumulation: “Part of a New Paradigm”, Asian
Economic and Financial Review, 6, issue 8, p. 457-476
● Cheung, Yin-Wong, and Rajeswari Sengupta (2011). "Accumulation of reserves and
keeping up with the Joneses: The case of LATAM economies." International Review of
Economics & Finance 20.1: 19-31.
● Cook, David E., and James Yetman (2012). "Expanding central bank balance sheets in
emerging Asia: a compendium of risks and some evidence." BIS Paper 66d.
● Dell’Ariccia, Giovanni, Deniz Igan, Luc Laeven, and Hui Tong (2012). "Policies for
Macrofinancial Stability: Dealing with Credit Booms and Busts."
● Dominguez, Kathryn ME, Yuko Hashimoto, and Takatoshi Ito (2012). "International
reserves and the global financial crisis." Journal of International Economics 88.2 : 388-
406.
● Filardo, Andrew J., and Stephen Grenville (2012). "Central bank balance sheets and
foreign exchange rate regimes: understanding the nexus in Asia."
● Frankel, Jeffrey, and George Saravelos (2012). ‘Can leading indicators assess country
vulnerability? Evidence from the 2008-09 global financial crisis.’ Journal of International
Economics 87(2), 216–231
● Fukuda, Shin-ichi, and Yoshifumi Kon (2012). "5. Macroeconomic impacts of foreign
exchange reserve accumulation: theory and international evidence." Monetary and
Currency Policy Management in Asia 1500 : 120.

30
● Gagnon, Joseph (2013). "The elephant hiding in the room: currency intervention and
trade imbalances. "Peterson Institute For International Economics”
● Garcia, Pablo and Claudio Soto. (2004). “Large Hoardings of International Reserves:
Are They Worth It?” Working Papers Central Bank of Chile 299, Central Bank of Chile.
● Ghosh, Atish and Mahvash Qureshi (2016). “Capital Inflow Surges and Consequences”
ADBI Working Paper Series. No. 585 July.
● He, D., Chu, C., Shu, C., Wong, A. (2005). Monetary management in Mainland China in
the face of large capital inflows. Hong Kong Monetary Authority Research Memorandum
07/2005, Hong Kong, China.
● International Monetary Fund (2011). “Assessing Reserve Adequacy.”
● International Monetary Fund (2016). “Understanding the Slowdown In Capital Flows to
Emerging Markets.” WEO 2016.
● Jeanne, Olivier, and Romain Ranciere (2011) “The optimal level of international reserves
for emerging market countries: A new formula and some applications.” Economic
Journal 121(555), 905–930
● Lardy, Nicholas. "Financial repression in China." (2008). Peterson Institute for
International Economics Working Paper No. PB08-8
● Lee, Mr Il Houng, Mr Murtaza H. Syed, and Mr Liu Xueyan (2012). “Is China Over-
Investing and Does it Matter?” No. 12-277. International Monetary Fund.
● Llaudes, Ricardo, Ferhan Salman, and Mali Chivakul (2010). “The impact of the great
recession on emerging markets.” IMF Working Papers 10/237, International Monetary
Fun
● Mehrotra, Aaron N. (2012). “On the Use of Sterilisation Bonds in Emerging Asia” BIS
Paper No. 66f.
● Mohanty, Madhusudan and Philip Turner (2006). “Foreign Exchange Reserve
Accumulation in Emerging Markets: What are the Domestic Implications?”, BIS
Quarterly Review, September 1, Bank for International Settlements (BIS).
● Obstfeld, Maurice, Jay C. Shambaugh, and Alan M. Taylor (2010). "Financial stability,
the trilemma, and international reserves." American Economic Journal: Macroeconomics
2.2: 57-94.

31
● Ouyang, Alice Y., Ramkishen S. Rajan, and Tom Willett (2008). "Managing the
monetary consequences of reserve accumulation in emerging Asia." Global Economic
Review 37.2 : 171-199.
● Paladino, Giulio Cifarelli-Giovanna (2007). "The Buffer Stock Model Redux? An
Analysis of the Dynamics of Foreign Reserve Accumulation." Pontines, Victor, and
Ramkishen S. Rajan (2011). "Foreign exchange market intervention and reserve
accumulation in emerging Asia: Is there evidence of fear of appreciation?." Economics
Letters 111.3 : 252-255.
● Reinhart, Carmen, and Takeshi Tashiro (2013). "Crowding Out Redefined: The Role of
Reserve Accumulation." NBER Working Paper w19652
● Reinhart, Carmen, Reinhart, Vincent and Takeshi Tashiro (2016). “Does Reserve
accumulation crowd out investment?” Journal of International Money and Finance 63:
89-111
● Rodrik, Dani, (2006). “The Social Cost of Foreign Exchange Reserves,” International
Economic Journal, Vol. 20, No. 3, 253-266.
● Scissors, Derek (2016). “China’s SOE sector is bigger than some would have us think”
American Enterprise Institute.
● Shrestha, Min B., and Theresia A. Wansi (2014). "Drivers Of Reserves Accumulation In
The South East Asian Countries." South East Asian Central Banks (SEACEN) Research
and Training Centre Working Papers.
● Steiner, Andreas (2010). “Central banks' dilemma: Reserve accumulation, inflation and
financial instability.” No. 84. Working Paper, Institute of Empirical Economic Research,
University of Osnabrück.
● Tsangarides, Charalambos G., Atish R. Ghosh, and Jonathan David Ostry (2012).
"Shifting motives: Explaining the buildup in official reserves in emerging markets since
the 1980s."

32
Appendix:
Data
All the data was acquired from the World Bank’s World Development Indicator database excluding
Monetary Independence which was acquired from the Chinn-Ito Index (Aizenman, Chinn, Ito 2010).
Gross Capital Formation: Gross capital formation is always scaled to GDP in the above models, making
the variable bounded between 1 and 100.
Gross capital formation (formerly gross domestic investment) consists of outlays on additions to the fixed
assets of the economy plus net changes in the level of inventories. Fixed assets include land
improvements (fences, ditches, drains, and so on); plant, machinery, and equipment purchases; and the
construction of roads, railways, and the like, including schools, offices, hospitals, private residential
dwellings, and commercial and industrial buildings. Inventories are stocks of goods held by firms to meet
temporary or unexpected fluctuations in production or sales
BOP Reserves: Reserves and related items is the net change in a country's holdings of international
reserves resulting from transactions on the current, capital, and financial accounts. Reserve assets are
those external assets that are readily available to and controlled by monetary authorities for meeting
balance of payments financing needs, and include holdings of monetary gold, special drawing rights
(SDRs), reserve position in the International Monetary Fund (IMF), and other reserve assets.
Stock Reserves: Total reserves comprise holdings of monetary gold, special drawing rights, reserves of
IMF members held by the IMF, and holdings of foreign exchange under the control of monetary
authorities. The gold component of these reserves is valued at year-end (December 31) London prices.
Data are in current U.S. dollars.
Asian Financial Crisis: Takes value of 1 on the years 1998, 1999 and 0 if otherwise.
GDP Per Capita: Current year GDP Per capita in USD
Age Dependency Ratio: Percentage of the population working age (64 and younger) divided by total
population. Dependency ratios capture variations in the proportions of children, elderly people, and
working-age people in the population that imply the dependency burden that the working-age population
bears in relation to children and the elderly.
Broad Money Growth: The year over year growth in sum of currency outside banks; demand deposits
other than those of the central government; the time, savings, and foreign currency deposits of resident
sectors other than the central government; bank and traveler’s checks; and other securities such as
certificates of deposit and commercial paper.
33
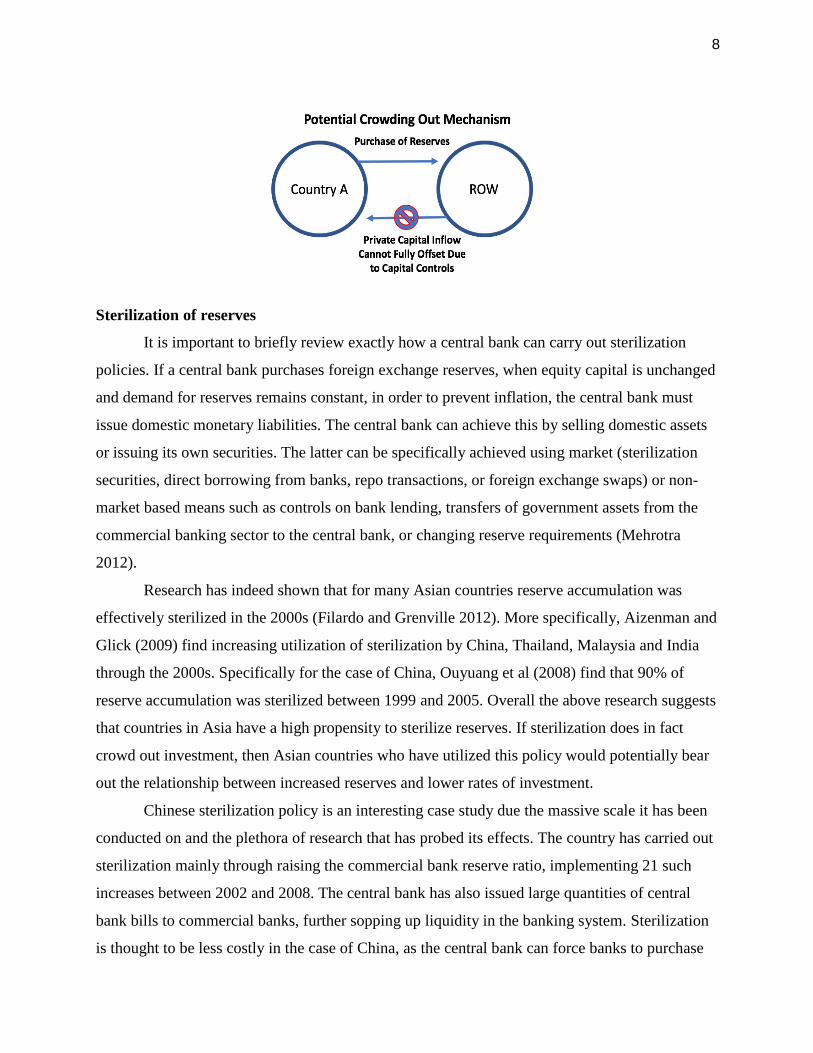
Monetary Independence Index: Available online and updated data through 2014, the indexes are
derived from Aizenman, Chinn, Ito (2010) . The extent of monetary independence is measured as the
reciprocal of the annual correlation between the monthly interest rates of the home country and the base
country.
The index for the extent of monetary independence is defined as:
where i refers to home countries and j to the base country. By construction, the maximum value is 1, and
the minimum value is 0. Higher values of the index mean more monetary policy independence
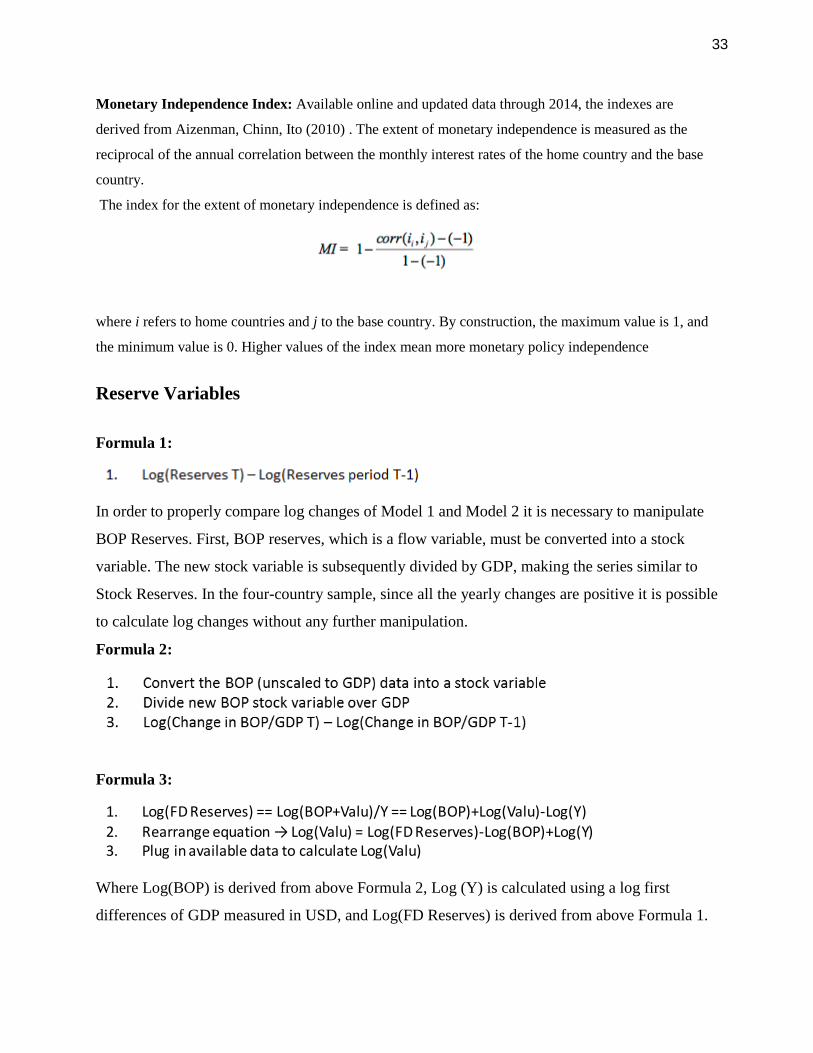
Reserve Variables
Formula 1:
In order to properly compare log changes of Model 1 and Model 2 it is necessary to manipulate
BOP Reserves. First, BOP reserves, which is a flow variable, must be converted into a stock
variable. The new stock variable is subsequently divided by GDP, making the series similar to
Stock Reserves. In the four-country sample, since all the yearly changes are positive it is possible
to calculate log changes without any further manipulation.
Formula 2:
Formula 3:
Where Log(BOP) is derived from above Formula 2, Log (Y) is calculated using a log first
differences of GDP measured in USD, and Log(FD Reserves) is derived from above Formula 1.
1. Log(FDReserves)==Log(BOP+Valu)/Y==Log(BOP)+Log(Valu)-Log(Y)2. Rearrangeequation→Log(Valu)=Log(FDReserves)-Log(BOP)+Log(Y)3. PluginavailabledatatocalculateLog(Valu)

34
Descriptive Statistics (4 Countries Sample):
Correlation Table (4 Countries):
BOP Reserves FD Reserves Stock Reserves I/GDP (1-100) Δ I/GDP Crisis GDPPC Age Dep Broad Money Monetary
BOP Reserves 1
FD Reserves 0.2696 1
I/GDP (1-100) 0.0935 -0.1583 -0.1938 1
Δ I/GDP 0.1944 -0.4675 -0.0791 0.2592 1
Asian Financial -0.3534 0.1937 0.0176 -0.107 -0.3794 1
GDPPC -0.0603 -0.064 -0.3764 0.1657 0.0884 -0.0018 1
Age Dep -0.1332 -0.0769 0.4268 -0.0027 -0.0123 0.0096 -0.0046 1
Broad Money -0.0219 0.2543 -0.3071 0.1694 -0.1457 0.047 0.0295 -0.2245 1
Monetary 0.1918 0.1714 -0.1043 0.0839 0.0782 -0.0416 0.2196 -0.1036 0.0696 1

35
Regression Appendix
Table 1: Baseline Model Staggered Regressions
Table 2: Baseline Model, 9 Countries Sample
1990-20144Countries 1BaselineOLS 2BaselineOLS 3BaselineOLS 4BaselineOLS 5BaselineOLS 6BaselineOLS
DependentVariable:ΔInvestment/GDP
FDReserves -9.358*** -5.765*** -5.850*** -5.364*** -5.883*** -6.099***
(2.686) (1.711) (1.714) (1.797) (1.823) (1.772)
AsianFinancialCrisis -6.413*** -6.522*** -6.646*** -6.594*** -6.693***
(1.797) (1.791) (1.769) (1.737) (1.766)
AgeDependencyRatio -0.220 -0.279 -0.279 -0.100
(0.308) (0.306) (0.297) (0.396)
BroadMoneyGrowth -0.0289 -0.0299 -0.0289
(0.0235) (0.0215) (0.0210)
MonetaryIndependence 3.540** 3.757**
(1.767) (1.731)
GDPPerCapita -0.000191
(0.000205)
_cons 0.189 0.620 2.202 3.173 1.695 0.614
(0.728) (0.629) (2.323) (2.321) (2.348) (2.757)
N 100 100 100 100 100 100
adj.R-sq 0.1895 0.3552 0.3525 0.3525 0.3692 0.3662
CountryFixedEffects Yes Yes Yes Yes Yes Yes
TimeFixedEffects No No No No No No
Standarderrorsinparentheses *p<0.10**p<0.05***p<0.010
1990-20149Countries Baseline:OLS Baseline:FE
DependentVariable: ΔInvestment/GDP ΔInvestment/GDP
FDReserves -5.249*** -5.249***
(1.373) (0.753)
AsianFinancialCrisis -3.673*** -3.673**
(1.298) (1.359)
GDPPerCapita 0.0000235 0.0000235
(0.0000422) (0.0000289)
AgeDependencyRatio -0.129 -0.129
(0.0867) (0.0717)
BroadMoneyGrowth -0.00915 -0.00915
(0.0212) (0.0121)
MonetaryIndependence 1.020 1.020
(1.320) (1.440)
_cons 1.228 1.228
(0.913) (0.698)
N 208 208
R-sq 0.1872 0.2384
CountryFixedEffects Yes Yes
TimeFixedEffects No No
Standarderrorsinparentheses *p<0.10**p<0.05***p<0.010

36
Table 3: Alternative Model, 9 Country Sample
Table 4: Alternate Model Staggered Regressions
Table 5: Pre-Crisis Regression (OLS 4 Country Sample)
1990-20149Countries AlternateReserves:OLS AlternateReserves:FE
DependentVariable: ΔInvestment/GDP ΔInvestment/GDP
BOPReserves -0.0641 -0.0641
(1.448) (1.428)
AsianFinancialCrisis -4.889*** -4.889**
(1.560) (1.627)
GDPPerCapita 0.0000382 0.0000382
(0.0000427) (0.0000239)
AgeDependencyRatio -0.142 -0.142
(0.0944) (0.0830)
BroadMoneyGrowth -0.0264 -0.0264
(0.0259) (0.0236)
MonetaryIndependence 1.010 1.010
(1.370) (1.251)
_cons 1.264 1.264
(1.024) (0.921)
N 208 208
R-sq 0.1073 0.1636
CountryFixedEffects Yes Yes
TimeFixedEffects No No
Standarderrorsinparentheses *p<0.10**p<0.05***p<0.010
1990-20144Countries 1AltOLS 2AltOLS 3AltOLS 4AltOLS 5AltOLS 6AltOLS
DependentVariable:ΔInvestment/GDP
BOPReserves -0.702 -0.253 -0.318 -0.249 -0.576 -0.674
(1.363) (1.144) (1.180) (1.188) (1.238) (1.223)
AsianFinancialCrisis -8.079*** -8.179*** -8.156*** -8.211*** -8.296***
(2.236) (2.246) (2.146) (2.129) (2.152)
AgeDependencyRatio -0.174 -0.284 -0.295 -0.197
(0.307) (0.315) (0.309) (0.400)
BroadMoneyGrowth -0.0510* -0.0532** -0.0530**
(0.0264) (0.0261) (0.0264)
MonetaryIndependence 2.885 3.036*
(1.766) (1.743)
GDPPerCapita -0.000107
(0.000202)
_cons 0.0615 0.653 1.911 3.659 2.592 2.013
(0.925) (0.679) (2.339) (2.433) (2.443) (2.835)
N 100 100 100 100 100 100
adj.R-sq -0.0361 0.2821 0.2770 0.2927 0.3002 0.2937
CountryFixedEffects Yes Yes Yes Yes Yes Yes
TimeFixedEffects No No No No No No
Standarderrorsinparentheses*p<0.10**p<0.05***p<0.010

37
Table 6: Post-Crisis Regression (OLS 4 Country Sample)
Table 7: Time Fixed Effects (OLS 4 Country Sample)
PreGFC(1990-2008)4Countries Baseline:OLS AlternateReserves:OLS
DependentVariable: ΔInvestment/GDP ΔInvestment/GDP
FDReserves -6.152***
(1.973)
BOPReserves -0.608
(1.337)
StockReserves
AsianFinancialCrisis -8.525*** -6.908***
(2.198) (1.793)
GDPPerCapita -0.000492 -0.000697*
(0.000340) (0.000374)
AgeDependencyRatio 0.274 0.547
(0.573) (0.592)
BroadMoneyGrowth -0.0597** -0.0296
(0.0278) (0.0231)
MonetaryIndependence 3.526 4.313*
(2.571) (2.528)
_cons -0.698 -2.932
(4.512) (4.642)
N 76 76
R-sq 0.3342 0.4091
CountryFixedEffects Yes Yes
TimeFixedEffects No No
Standarderrorsinparentheses *p<0.10**p<0.05***p<0.010
PostGFC(2010-2014)4Countries Baseline:OLS AlternateReserves:OLS
DependentVariable: ΔInvestment/GDP ΔInvestment/GDP
FDReserves 2.810
(5.834)
BOPReserves 0.364
(4.489)
GDPPerCapita -0.00169* -0.00164*
(0.000801) (0.000891)
AgeDependencyRatio -3.312** -3.197**
(1.115) (1.286)
BroadMoneyGrowth 0.0546 0.0592
(0.0713) (0.0804)
MonetaryIndependence -3.307 -3.845*
(2.063) (1.949)
_cons 40.74*** 39.74***
(7.525) (8.875)
N 20 20
R-sq 0.4506 0.4654
CountryFixedEffects Yes Yes
TimeFixedEffects No No
Standarderrorsinparentheses *p<0.10**p<0.05***p<0.010

38
Table 8: Time Fixed Effects (OLS 9 Country Sample)
1990-20144Countries Baseline:OLS AlternateReserves:OLS
DependentVariable: ΔInvestment/GDP ΔInvestment/GDP
FDReserves -2.942
(3.067)
BOPReserves -0.708
(1.454)
StockReserves
GDPPerCapita -0.0000278 -0.0000537
(0.000359) (0.000346)
AgeDependencyRatio -0.0463 -0.0692
(0.373) (0.380)
BroadMoneyGrowth -0.0233 -0.0110
(0.0271) (0.0227)
MonetaryIndependence 0.889 1.206
(2.520) (2.615)
_cons 4.039 3.537
(3.257) (3.319)
N 100 100
R-sq 0.3717 0.3807
CountryFixedEffects Yes Yes
TimeFixedEffects Yes Yes
Standarderrorsinparentheses *p<0.10**p<0.05***p<0.010
1990-20149Countries Baseline:OLS AlternateReserves:OLS
DependentVariable: ΔInvestment/GDP ΔInvestment/GDP
FDReserves -3.000*
(1.568)
BOPReserves -0.322
(0.664)
StockReserves
GDPPerCapita 0.0000457 0.0000405
(0.0000436) (0.0000434)
AgeDependencyRatio -0.0671 -0.0681
(0.120) (0.112)
BroadMoneyGrowth -0.0130 -0.00284
(0.0219) (0.0192)
MonetaryIndependence 0.140 0.520
(1.887) (1.865)
_cons 3.767** 2.739
(1.819) (1.734)
N 202 208
adj.R-sq 0.2036 0.2485
CountryFixedEffects Yes Yes
TimeFixedEffects Yes Yes
Standarderrorsinparentheses *p<0.10**p<0.05***p<0.010
Related Documents