RESEARCH ARTICLE Open Access Can cardiac computed tomography predict cardiovascular events in asymptomatic type-2 diabetics?: results of a long term follow-up Ana Faustino 1* , Rui Providência 1 , Paula Mota 1 , Sérgio Barra 1 , Joana Silva 1 , Andreia Fernandes 1 , Rui Catarino 2 , Susana Basso 2 , Marco Costa 1 and António Leitão-Marques 1 Abstract Background: Doubts remain about atherosclerotic disease and risk stratification of asymptomatic type-2 diabetic patients (T2DP). This study aims to evaluate the usefulness of calcium score (CS) and coronary computed tomography (CT) angiography (CTA) to predict fatal and non fatal cardiovascular events (CVEV) in T2DP. Methods: Eighty-five consecutive T2DP undergoing CT (Phillips Brilliance, 16-slice) with CS and CTA were prospectively enrolled in a transversal case-control study. Patients were followed for 48 months (range 18 - 68) to assess CVEV: cardiovascular death, acute coronary syndrome, revascularisation and stroke. Potential predictors of CVEV were identified. Predictive models based on clinical features, CTA and CS were created and compared. Results: Performing CT impacted T2DP treatment. Cardiovascular risk was lowered during follow-up but metabolic control remained suboptimal. CVEV occurred in 11.8% T2DP (3.1%/year). CS ≥86.6 was predictor of CVEV over time, with a high negative predictive value, an 80% sensitivity and 74.7% specificity. Although its prognostic value was not independent of the presence/absence of obstructive CAD, adding CS and CTA data to clinical parameters improved the prediction of CVEV: the combined model had the highest AUC (0.888, 95%CI 0.789-0.987, p < 0.001) for the prediction of the study endpoints. Conclusions: CS showed great value in T2DP risk stratification and its prognostic value was further enhanced by CTA data. Information provided by CT may help predict CVEV in T2DP and potentially improve their outcome. Keywords: Cardiac computed tomography, Coronary artery calcium, Coronary CT angiography, Cardiovascular risk, Type-2 diabetes, Coronary artery disease Background Coronary artery disease (CAD) is a leading cause of mor- bidity and mortality in patients with diabetes mellitus [1,2]. Diabetics have more prevalent, extensive and cal- cified coronary atherosclerosis than non-diabetics, with an accelerated progression and higher prevalence of multi- vessel disease [3-5]. Type-2 diabetics have also a higher prevalence (26-36%) of silent atherosclerotic lesions and asymptomatic ischemia, making the diagnosis of CAD easier to miss and allowing the disease to progress to an advanced stage before becoming clinically evident [5-10]. Diabetes has been considered a CAD risk equivalent and secondary prevention strategies with antiplatelet therapy and statins have been previously recommended [5,6,11]. However, the Guidelines of the European Society of Cardi- ology on cardiovascular disease prevention (2012) no longer recommend antiplatelet therapy with aspirin for diabetics without clinical evidence of atherosclerotic disease, due to higher risk of bleeding [12]. There is a wide variation in the risk of cardiovascular events among asymptom- atic diabetic patients: while some individuals without coronary plaques are at relative low risk, deriving no benefit from an aggressive therapy, others are high risk individuals who may benefit from more intensive risk modification or even revascularisation [5,12]. Timely detection of silent CAD at an early stage of progression * Correspondence: [email protected] 1 Cardiology Department, Coimbra’s Hospital and University Centre – General Hospital, Coimbra, Portugal Full list of author information is available at the end of the article © 2014 Faustino et al.; licensee BioMed Central Ltd. This is an open access article distributed under the terms of the Creative Commons Attribution License (http://creativecommons.org/licenses/by/2.0), which permits unrestricted use, distribution, and reproduction in any medium, provided the original work is properly cited. Faustino et al. BMC Cardiovascular Disorders 2014, 14:2 http://www.biomedcentral.com/1471-2261/14/2

Welcome message from author
This document is posted to help you gain knowledge. Please leave a comment to let me know what you think about it! Share it to your friends and learn new things together.
Transcript
Faustino et al. BMC Cardiovascular Disorders 2014, 14:2http://www.biomedcentral.com/1471-2261/14/2
RESEARCH ARTICLE Open Access
Can cardiac computed tomography predictcardiovascular events in asymptomatic type-2diabetics?: results of a long term follow-upAna Faustino1*, Rui Providência1, Paula Mota1, Sérgio Barra1, Joana Silva1, Andreia Fernandes1, Rui Catarino2,Susana Basso2, Marco Costa1 and António Leitão-Marques1
Abstract
Background: Doubts remain about atherosclerotic disease and risk stratification of asymptomatic type-2 diabeticpatients (T2DP). This study aims to evaluate the usefulness of calcium score (CS) and coronary computed tomography(CT) angiography (CTA) to predict fatal and non fatal cardiovascular events (CVEV) in T2DP.
Methods: Eighty-five consecutive T2DP undergoing CT (Phillips Brilliance, 16-slice) with CS and CTA were prospectivelyenrolled in a transversal case-control study. Patients were followed for 48 months (range 18 - 68) to assess CVEV:cardiovascular death, acute coronary syndrome, revascularisation and stroke. Potential predictors of CVEV wereidentified. Predictive models based on clinical features, CTA and CS were created and compared.
Results: Performing CT impacted T2DP treatment. Cardiovascular risk was lowered during follow-up but metaboliccontrol remained suboptimal. CVEV occurred in 11.8% T2DP (3.1%/year). CS ≥86.6 was predictor of CVEV over time,with a high negative predictive value, an 80% sensitivity and 74.7% specificity. Although its prognostic value wasnot independent of the presence/absence of obstructive CAD, adding CS and CTA data to clinical parameters improvedthe prediction of CVEV: the combined model had the highest AUC (0.888, 95%CI 0.789-0.987, p < 0.001) for the predictionof the study endpoints.
Conclusions: CS showed great value in T2DP risk stratification and its prognostic value was further enhanced by CTAdata. Information provided by CT may help predict CVEV in T2DP and potentially improve their outcome.
Keywords: Cardiac computed tomography, Coronary artery calcium, Coronary CT angiography, Cardiovascular risk,Type-2 diabetes, Coronary artery disease
BackgroundCoronary artery disease (CAD) is a leading cause of mor-bidity and mortality in patients with diabetes mellitus[1,2]. Diabetics have more prevalent, extensive and cal-cified coronary atherosclerosis than non-diabetics, with anaccelerated progression and higher prevalence of multi-vessel disease [3-5]. Type-2 diabetics have also a higherprevalence (26-36%) of silent atherosclerotic lesions andasymptomatic ischemia, making the diagnosis of CADeasier to miss and allowing the disease to progress to anadvanced stage before becoming clinically evident [5-10].
* Correspondence: [email protected] Department, Coimbra’s Hospital and University Centre – GeneralHospital, Coimbra, PortugalFull list of author information is available at the end of the article
© 2014 Faustino et al.; licensee BioMed CentraCommons Attribution License (http://creativecreproduction in any medium, provided the or
Diabetes has been considered a CAD risk equivalent andsecondary prevention strategies with antiplatelet therapyand statins have been previously recommended [5,6,11].However, the Guidelines of the European Society of Cardi-ology on cardiovascular disease prevention (2012) no longerrecommend antiplatelet therapy with aspirin for diabeticswithout clinical evidence of atherosclerotic disease, dueto higher risk of bleeding [12]. There is a wide variationin the risk of cardiovascular events among asymptom-atic diabetic patients: while some individuals withoutcoronary plaques are at relative low risk, deriving nobenefit from an aggressive therapy, others are high riskindividuals who may benefit from more intensive riskmodification or even revascularisation [5,12]. Timelydetection of silent CAD at an early stage of progression
l Ltd. This is an open access article distributed under the terms of the Creativeommons.org/licenses/by/2.0), which permits unrestricted use, distribution, andiginal work is properly cited.
Faustino et al. BMC Cardiovascular Disorders 2014, 14:2 Page 2 of 10http://www.biomedcentral.com/1471-2261/14/2
may improve risk stratification of these patients andlead to tailored treatment.Cardiac computed tomography (CT) has been used to
detect CAD at an early stage [6]. Coronary artery calciumscore (CS) is a marker of atherosclerosis used to predictthe likelihood of significant CAD and myocardial ischae-mia, with low radiation exposure and no need of contrastagent. However, it can miss non-calcified CAD [5,13].Coronary CT angiography (CTA) allows noninvasive
visualization of the coronary lumen and wall, detectingboth calcified and non-calcified plaque components. It re-quires contrast agent and exposes patients to higher radi-ation than CS.Previous studies have failed to prove the usefulness of
CTA or functional tests in screening asymptomatic dia-betics [5,7,8,14]. No study to date has demonstrated add-itional value of CS and CTA when associated to clinicalvariables and classic risk scores, such as Framingham.This study aims to assess the additional benefit of CS and
CTA, when added to clinical risk stratification schemes, topredict fatal and non fatal cardiovascular events in asymp-tomatic type-2 diabetics.
MethodsStudy designCase-control study enrolling asymptomatic diabetic pa-tients referred for CT from our outpatient clinic. CS andCTA were performed. Clinical and laboratory data werecollected from electronic registries concerning bothICD-10 diagnostics and outpatient clinic follow-up. Thisstudy was approved by our Institution´s Cardiology De-partment Supervisor and Ethics Committee. All patientsprovided informed consent before undergoing CT andauthorized the use of follow-up information.
Patients and eligibility criteriaA total of 85 consecutive type-2 diabetic patients, withouthistory of chest pain or dyspnoea were referred from ourhospital’s diabetes outpatient clinic for cardiovascular riskassessment by CT between March 1, 2006, and April 30,2009. Patients over 18 years old were included in thestudy. Diabetes was diagnosed according to the AmericanDiabetes Association criteria [15] and patients wereon standard anti-diabetic therapy (diet, tablets and/or in-sulin). Exclusion criteria were any evidence of stroke, ca-rotid disease or peripheral artery disease, other knowncardiac diseases, contraindication to iodine-based contrastagents, glomerular filtration rate (GFR) <30mL/min, preg-nancy, inability to sustain a 15-second breath-hold, car-diac arrhythmias or uninterpretable CTA.
Initial data collectionPatients were evaluated during an outpatient visit beforeundergoing CT. Demographics, clinical data, duration of
diabetes, neuropathy, retinopathy, nephropathy, cardio-vascular risk factors (hypertension, dyslipidemia, smoking,family history of premature CAD), metabolic syndrome(defined according to ATPIII [16]), body weight, height,waist circumference and blood pressure were evaluated.Laboratorial tests included total cholesterol, triglycerides,high density lipoprotein cholesterol, low density lipopro-tein cholesterol, hemoglobin A1c, serum creatinine, C-reactive protein and microalbuminuria. Body mass index,GFR (MDRD formula) and Framingham risk score [17]were calculated. Hypertension and dyslipidemia were de-fined by a self-reported history or use of specific therapy.
CT data acquisitionAll examinations were performed with a 16-slice CT scan-ner (Brilliance 16; Philips Medical Systems©, Eindhoven,the Netherlands). A prospective scan without contrast en-hancement was performed to measure CS (sequential scanwith 8 × 3mm collimation, tube current 55mAs at 120kV,3mm width), followed by 16-slice contrast-enhanced spiralscan of the heart performed with ECG gating and retro-spective post processing. CTA parameters: 16 × 0.75mmcollimation, 400ms gantry rotation, pitch of 0.298, tubevoltage at 120kV, maximum current of 600—800 mAs de-pending on patient size, half-scan reconstruction modeand imaging craniocaudal direction. All patients received5mg of sublingual isosorbide dinitrate 5 minutes beforeCTA acquisition. Patients with a heart rate >65bpm re-ceived 50-200mg of oral metoprolol. A bolus of iodinatedcontrast agent (370mOsm) was intravenously injected (4-5.5 ml/s). A region of interest was placed in the descend-ing thoracic aorta and image acquisition was automaticallyinitiated using bolus tracking (selected threshold: 110Hounsfield units [HU]). Images were reconstructed in fivephases of the cardiac cycle (0, 37.5, 62.5, 75 and 87.5% ofthe R-R interval) to minimize motion artifacts. The aver-age radiation dose was 14mSv.
CT Image interpretationCT image evaluation was performed on a separate 3Dworkstation (Brilliance workstation, Philips Medical Sys-tems, Eindhoven, the Netherlands) by two experiencedreviewers. CS was measured using the automatic calciumdetection algorithm of the workstation, according toAgatston method, with a calcium threshold of 130 HU.CTA were analysed by assessment of axial slices, multi-planar reformations (along the vessel axis and cross-sectional images), and the three thin-slab maximumintensity projections. The coronary artery tree was di-vided into proximal, medial and distal, according to clas-sic angiographic definition. Plaques were classified asobstructive or non-obstructive using a 50% threshold ofluminal narrowing. The presence of obstructive coronaryartery disease (CAD: > 50% lumen narrowing) in one
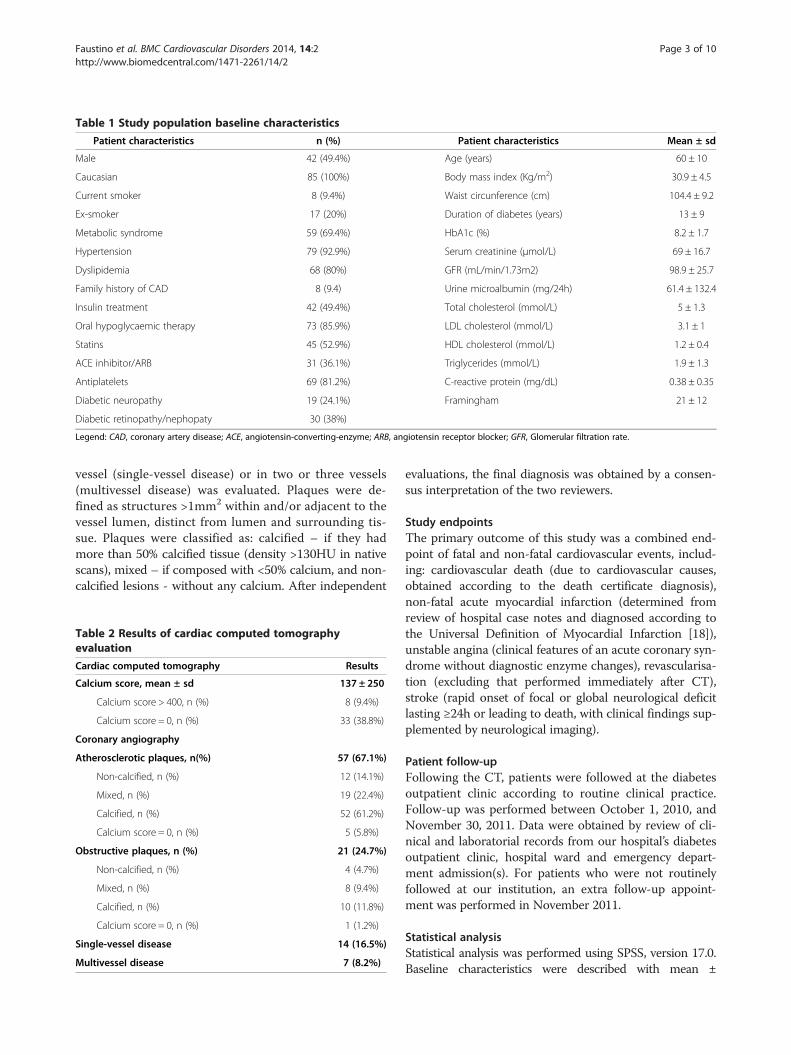
Table 1 Study population baseline characteristics
Patient characteristics n (%) Patient characteristics Mean ± sd
Male 42 (49.4%) Age (years) 60 ± 10
Caucasian 85 (100%) Body mass index (Kg/m2) 30.9 ± 4.5
Current smoker 8 (9.4%) Waist circunference (cm) 104.4 ± 9.2
Ex-smoker 17 (20%) Duration of diabetes (years) 13 ± 9
Metabolic syndrome 59 (69.4%) HbA1c (%) 8.2 ± 1.7
Hypertension 79 (92.9%) Serum creatinine (μmol/L) 69 ± 16.7
Dyslipidemia 68 (80%) GFR (mL/min/1.73m2) 98.9 ± 25.7
Family history of CAD 8 (9.4) Urine microalbumin (mg/24h) 61.4 ± 132.4
Insulin treatment 42 (49.4%) Total cholesterol (mmol/L) 5 ± 1.3
Oral hypoglycaemic therapy 73 (85.9%) LDL cholesterol (mmol/L) 3.1 ± 1
Statins 45 (52.9%) HDL cholesterol (mmol/L) 1.2 ± 0.4
ACE inhibitor/ARB 31 (36.1%) Triglycerides (mmol/L) 1.9 ± 1.3
Antiplatelets 69 (81.2%) C-reactive protein (mg/dL) 0.38 ± 0.35
Diabetic neuropathy 19 (24.1%) Framingham 21 ± 12
Diabetic retinopathy/nephopaty 30 (38%)
Legend: CAD, coronary artery disease; ACE, angiotensin-converting-enzyme; ARB, angiotensin receptor blocker; GFR, Glomerular filtration rate.
Faustino et al. BMC Cardiovascular Disorders 2014, 14:2 Page 3 of 10http://www.biomedcentral.com/1471-2261/14/2
vessel (single-vessel disease) or in two or three vessels(multivessel disease) was evaluated. Plaques were de-fined as structures >1mm2 within and/or adjacent to thevessel lumen, distinct from lumen and surrounding tis-sue. Plaques were classified as: calcified – if they hadmore than 50% calcified tissue (density >130HU in nativescans), mixed – if composed with <50% calcium, and non-calcified lesions - without any calcium. After independent
Table 2 Results of cardiac computed tomographyevaluation
Cardiac computed tomography Results
Calcium score, mean ± sd 137 ± 250
Calcium score > 400, n (%) 8 (9.4%)
Calcium score = 0, n (%) 33 (38.8%)
Coronary angiography
Atherosclerotic plaques, n(%) 57 (67.1%)
Non-calcified, n (%) 12 (14.1%)
Mixed, n (%) 19 (22.4%)
Calcified, n (%) 52 (61.2%)
Calcium score = 0, n (%) 5 (5.8%)
Obstructive plaques, n (%) 21 (24.7%)
Non-calcified, n (%) 4 (4.7%)
Mixed, n (%) 8 (9.4%)
Calcified, n (%) 10 (11.8%)
Calcium score = 0, n (%) 1 (1.2%)
Single-vessel disease 14 (16.5%)
Multivessel disease 7 (8.2%)
evaluations, the final diagnosis was obtained by a consen-sus interpretation of the two reviewers.
Study endpointsThe primary outcome of this study was a combined end-point of fatal and non-fatal cardiovascular events, includ-ing: cardiovascular death (due to cardiovascular causes,obtained according to the death certificate diagnosis),non-fatal acute myocardial infarction (determined fromreview of hospital case notes and diagnosed according tothe Universal Definition of Myocardial Infarction [18]),unstable angina (clinical features of an acute coronary syn-drome without diagnostic enzyme changes), revascularisa-tion (excluding that performed immediately after CT),stroke (rapid onset of focal or global neurological deficitlasting ≥24h or leading to death, with clinical findings sup-plemented by neurological imaging).
Patient follow-upFollowing the CT, patients were followed at the diabetesoutpatient clinic according to routine clinical practice.Follow-up was performed between October 1, 2010, andNovember 30, 2011. Data were obtained by review of cli-nical and laboratorial records from our hospital’s diabetesoutpatient clinic, hospital ward and emergency depart-ment admission(s). For patients who were not routinelyfollowed at our institution, an extra follow-up appoint-ment was performed in November 2011.
Statistical analysisStatistical analysis was performed using SPSS, version 17.0.Baseline characteristics were described with mean ±
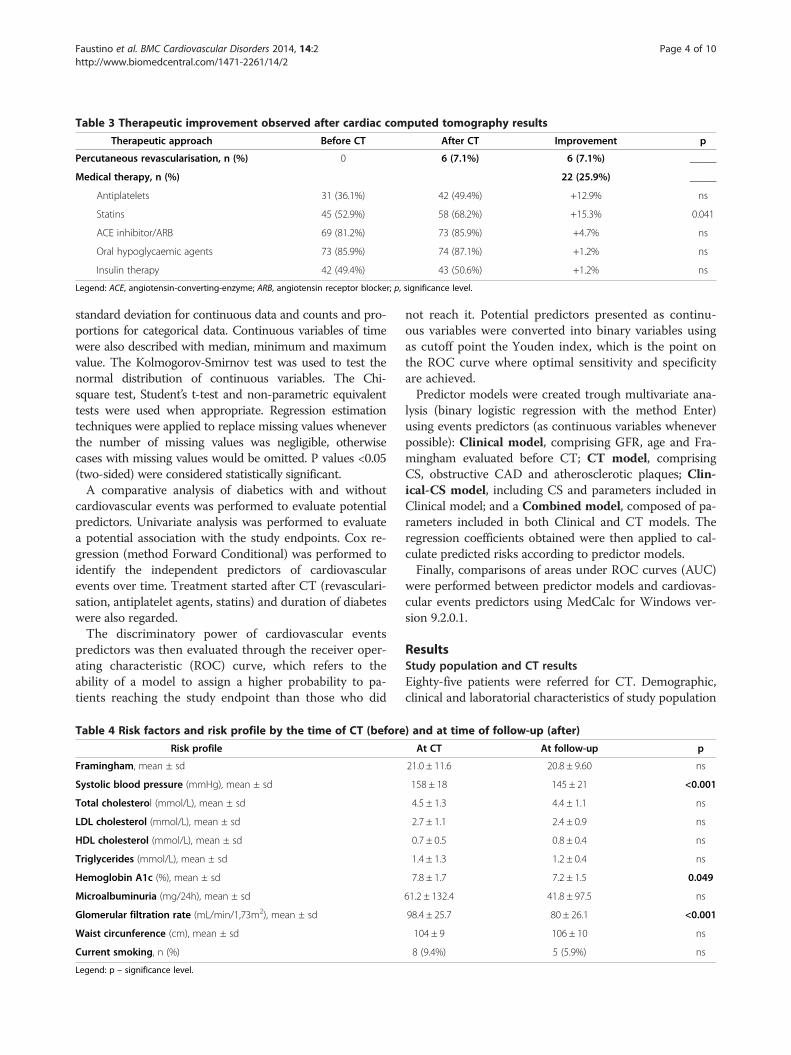
Table 3 Therapeutic improvement observed after cardiac computed tomography results
Therapeutic approach Before CT After CT Improvement p
Percutaneous revascularisation, n (%) 0 6 (7.1%) 6 (7.1%) _____
Medical therapy, n (%) 22 (25.9%) _____
Antiplatelets 31 (36.1%) 42 (49.4%) +12.9% ns
Statins 45 (52.9%) 58 (68.2%) +15.3% 0.041
ACE inhibitor/ARB 69 (81.2%) 73 (85.9%) +4.7% ns
Oral hypoglycaemic agents 73 (85.9%) 74 (87.1%) +1.2% ns
Insulin therapy 42 (49.4%) 43 (50.6%) +1.2% ns
Legend: ACE, angiotensin-converting-enzyme; ARB, angiotensin receptor blocker; p, significance level.
Faustino et al. BMC Cardiovascular Disorders 2014, 14:2 Page 4 of 10http://www.biomedcentral.com/1471-2261/14/2
standard deviation for continuous data and counts and pro-portions for categorical data. Continuous variables of timewere also described with median, minimum and maximumvalue. The Kolmogorov-Smirnov test was used to test thenormal distribution of continuous variables. The Chi-square test, Student’s t-test and non-parametric equivalenttests were used when appropriate. Regression estimationtechniques were applied to replace missing values wheneverthe number of missing values was negligible, otherwisecases with missing values would be omitted. P values <0.05(two-sided) were considered statistically significant.A comparative analysis of diabetics with and without
cardiovascular events was performed to evaluate potentialpredictors. Univariate analysis was performed to evaluatea potential association with the study endpoints. Cox re-gression (method Forward Conditional) was performed toidentify the independent predictors of cardiovascularevents over time. Treatment started after CT (revasculari-sation, antiplatelet agents, statins) and duration of diabeteswere also regarded.The discriminatory power of cardiovascular events
predictors was then evaluated through the receiver oper-ating characteristic (ROC) curve, which refers to theability of a model to assign a higher probability to pa-tients reaching the study endpoint than those who did
Table 4 Risk factors and risk profile by the time of CT (before
Risk profile
Framingham, mean ± sd
Systolic blood pressure (mmHg), mean ± sd
Total cholesterol (mmol/L), mean ± sd
LDL cholesterol (mmol/L), mean ± sd
HDL cholesterol (mmol/L), mean ± sd
Triglycerides (mmol/L), mean ± sd
Hemoglobin A1c (%), mean ± sd
Microalbuminuria (mg/24h), mean ± sd
Glomerular filtration rate (mL/min/1,73m2), mean ± sd
Waist circunference (cm), mean ± sd
Current smoking, n (%)
Legend: p – significance level.
not reach it. Potential predictors presented as continu-ous variables were converted into binary variables usingas cutoff point the Youden index, which is the point onthe ROC curve where optimal sensitivity and specificityare achieved.Predictor models were created trough multivariate ana-
lysis (binary logistic regression with the method Enter)using events predictors (as continuous variables wheneverpossible): Clinical model, comprising GFR, age and Fra-mingham evaluated before CT; CT model, comprisingCS, obstructive CAD and atherosclerotic plaques; Clin-ical-CS model, including CS and parameters included inClinical model; and a Combined model, composed of pa-rameters included in both Clinical and CT models. Theregression coefficients obtained were then applied to cal-culate predicted risks according to predictor models.Finally, comparisons of areas under ROC curves (AUC)
were performed between predictor models and cardiovas-cular events predictors using MedCalc for Windows ver-sion 9.2.0.1.
ResultsStudy population and CT resultsEighty-five patients were referred for CT. Demographic,clinical and laboratorial characteristics of study population
) and at time of follow-up (after)
At CT At follow-up p
21.0 ± 11.6 20.8 ± 9.60 ns
158 ± 18 145 ± 21 <0.001
4.5 ± 1.3 4.4 ± 1.1 ns
2.7 ± 1.1 2.4 ± 0.9 ns
0.7 ± 0.5 0.8 ± 0.4 ns
1.4 ± 1.3 1.2 ± 0.4 ns
7.8 ± 1.7 7.2 ± 1.5 0.049
61.2 ± 132.4 41.8 ± 97.5 ns
98.4 ± 25.7 80 ± 26.1 <0.001
104 ± 9 106 ± 10 ns
8 (9.4%) 5 (5.9%) ns
Table 5 Events occurred during follow-up
Follow-up: 45 ± 13 months n (%)
Cardiovascular events (CVEV) 10 (11.8%)
Type of CVEV
Acute coronary syndrome 1 (1.2%)
Stroke 7 (8.2%)
Cardiovascular death 2 (2.4%)
All-cause mortality, n (%) 3 (3.5%)
Cardiovascular death 2 (2.4%)
Non-cardiovascular death 1 (1.2%)
CVEV and CS = 0, n (%) 0 (0%)
CVEV and CS < 400, (%) 7 (8.2%)
CVEV and CS ≥ 400, n (%) 3 (3.5%)
Table 6 Cardiovascular risk factors, markers of diabetes severwith (CVEV = 1) and without (CVEV = 0) cardiovascular events
Univariate analysis
Hypertension, CT (%)
Hypercholesterolemia, CT (%)
Increased waist circunference, CT (%)
Metabolic syndrome, CT (%)
Duration of diabetes, CT (years, mean ± sd)
Diabetic neuropathy, CT (%)
Diabetic retinopathy/nephropathy, CT (%)
Hemoglobin A1c, CT (%, mean ± sd)
Microalbuminuria, CT (mg/24h, mean ± sd)
Serum C-reactive protein, CT (mg/dL, mean ± sd)
Percutaneous revascularization, CT (%)
Antiplatelets, CT (%)
Statins, CT (%)
ACE inhibitor/ARB, CT (%)
Oral hypoglycaemic therapy, CT (%)
Insulin therapy, CT (%)
Hemoglobin A1c, Fup (%, mean ± sd)
Microalbuminuria, Fup (mg/24h, mean ± sd)
Serum C-reactive protein, Fup (mg/24h, mean ± sd)
Antiplatelets, Fup (%)
Statins, Fup (%)
ACE inhibitor/ARB, Fup (%)
Oral hypoglycaemic therapy, Fup (%)
Insulin therapy, Fup (%)
Duration of follow-up (months, mean ± sd)
Legend: CT – evaluated when computed tomography was performed; for therapeufollow-up; p- significance level; ACE - angiotensin-converting-enzyme; ARB - angiote
Faustino et al. BMC Cardiovascular Disorders 2014, 14:2 Page 5 of 10http://www.biomedcentral.com/1471-2261/14/2
are summarized in Table 1. At study beginning, the me-dian duration of diabetes after diagnosis was 10 years(range 1 - 38 years).In our population the median CS was 34 (range 0 -
1293), and a CS > 400 was seen in 9% of the patients.The absence of coronary calcification (CS = 0) was notedin 39% of the patients (Table 2).By CTA, coronary atherosclerotic plaques were found in
67.1% patients and were obstructive in 23.8%. Five patients(5.8%) with a CS of zero had non-calcified plaques, ofwhich one (1.2%) was obstructive (Table 2). Coronary athe-rosclerosis was completely absent in 32.9% of patients.
Follow-up: impact of CT results on treatment andcardiovascular risk profileSubsequent to CT results, 7.1% of patients underwentpercutaneous revascularisation. Medical therapy was opti-mised in 25.9% patients: 4.7% started ACE inhibitors/ARB´s, 12.9% were put on antiplatelet therapy, and 15.3%
ity, therapeutics and duration of follow-up for patients
CVEV = 1 CVEV = 0 p
100 92 ns
80 70.3 ns
87.5 84.1 ns
70 69.3 ns
16 ± 8 13 ± 9 ns
44.4 21.4 ns
33.3 38.6 ns
7.6 ± 1.3 8.3 ± 1.8 ns
171.9 ± 291.4 45.1 ± 122.6 ns
0.4 ± 0.2 0.4 ± 0.4 ns
20 5.3 ns
70 46.7 ns
80 66.7 ns
100 84 ns
80 88 ns
60 49.3 ns
7.7 ± 1.5 7.6 ± 1.6 ns
39.3 ± 46.8 39.9 ± 118.4 ns
0.7 ± 0.4 0.5 ± 0.4 ns
66.7 45.8 ns
55.6 56.2 ns
77.8 79.2 ns
83.9 86.3 ns
66.7 53.4 ns
45.7 ± 15.6 45.2 ± 13.0 ns
tics, it includes changes performed following CT; Fup – evaluated at time ofnsin receptor blocker.
Table 7 Predictors of cardiovascular events by univariate analysis
Predictors of CVEV: univariate analysis OR 95% CI p
Age >66 years 8.604 1.996 - 37.086 0.001
GFR <99.2 mL/min/1.73m2 9.750 1.176 - 80.829 0.012
Framingham >22 4.667 1.111 – 19.602 0.025
Calcium score >86,6 11.789 2.299 – 60.445 <0.001
Atherosclerotic plaques 1.210 1.076 – 1.367 0.018
Calcium score ≥400 6.000 1.177- 30.581 0.018
Obstructive coronary artery disease 6.000 1.501 – 23.991 0.018
Multivessel disease (stenosis) ———— ———— ns
Female gender 0.207 0.041-1.042 0.039
Odds ratio (OR) and 95% confidence intervals (CI) and the significance level (p) are shown.Legend: GFR - Glomerular Filtration Rate.Presented parameters are related to initial assessment and data obtained by Computed tomography.
Faustino et al. BMC Cardiovascular Disorders 2014, 14:2 Page 6 of 10http://www.biomedcentral.com/1471-2261/14/2
were initiated on statins, which was a significant change(p = 0.041). Treatment with an antiplatelet agent, a statinor percutaneous revascularisation was started in 17.6% ofpatients following CT, which was also a significant change(p = 0.013), and none of these treatments were discontin-ued. Antidiabetic therapy was intensified in 2.4% of pa-tients (Table 3). Information regarding the cardiovascularrisk profile by the time of CT and at time of follow-up isgiven in Table 4.
Follow-up: study endpointsA median clinical follow-up of 48 months (range 18 - 68)was performed. During this period, 10 cardiovascular events(11.8%) were reported: one unstable angina (1.2%), sevenstrokes (8.2%) and two cardiovascular deaths (2.4%) – Table 5.No events were observed in patients with zero CS (0% vs.19.2%, p = 0.007) or without atherosclerotic plaques (0%vs. 17.5%, p = 0.018), both presenting a negative predictivevalue of 100%. Seven events (in 9.1% of patients) occurredin patients with CS < 400, and three (8.2%) were reportedin patients with CS ≥ 400 (Table 5).Length of follow-up was not different between patients
with and without cardiovascular events (Table 6).On univariate analysis, none of the cardiovascular risk
factors, markers of diabetes severity or therapeutics pre-sented in Table 6 were predictors of cardiovascular events.In this analysis, predictors of events were age >66 years
Table 8 Predictors of cardiovascular events by Cox regression
Predictors of CVEV: Cox regression
Age —
Glomerular filtration rate
Absence of obstructive coronary artery disease
Calcium score —
Atherosclerotic plaques —
Presented parameters are related to initial assessment and data obtained by Compsignificance level (p) are shown.
old, GFR <99.2mL/min/1.73m2 and Framingham >22when CT was performed, CS > 86.6, atherosclerotic pla-ques and obstructive CAD on CT, with the primary end-point occurring in 28.6% patients with vs. 6.3% withoutobstructive CAD. Treatment with antiplatelet agents, sta-tins and/or revascularisation did not achieve statistical sig-nificance. Multivessel disease was not associated with theprimary endpoint (Table 7). The cutoff points for age, CS,GFR and Framingham were determined by Youden índexon ROC curve analysis. The best threshold of CS to iden-tify cardiovascular events was 86.6, with 80% sensitivity(vs. 20% for CS ≤ 86.6, p < 0.001) and 74.7% specificity.All the predictors of cardiovascular events on univa-
riate analysis were included on a Cox regression analysis.GFR (HR 0.953, 95%CI: 0.920-0.988, p = 0.009) andabsence of obstructive CAD (HR 0,110, 95% CI: 0.027-0.451, p = 0.002) were independently associated with car-diovascular events over time, behaving as protectors(Table 8). CS > 86.6 was an independent predictor of car-diovascular events over time when considered separatelyfrom obstructive CAD (OR 10.725, 95%CI: 2.255-51.018,p = 0.003). Hazard function for primary endpoint alongtime according to CS higher than 86.6 (vs. ≤86.6) andobstructive CAD is presented in Figure 1.Different prediction models were created based on
clinical and CT predictors of cardiovascular events.ROC curve analysis for the isolated parameters and
analysis
OR 95% CI p
——— ———— ns
0.953 0.920 – 0.988 0.009
0.110 0.027 – 0.451 0.002
——— ———— ns
——— ———— ns
uted Tomography. Hazard ratio (HR) and 95% confidence intervals (CI) and the
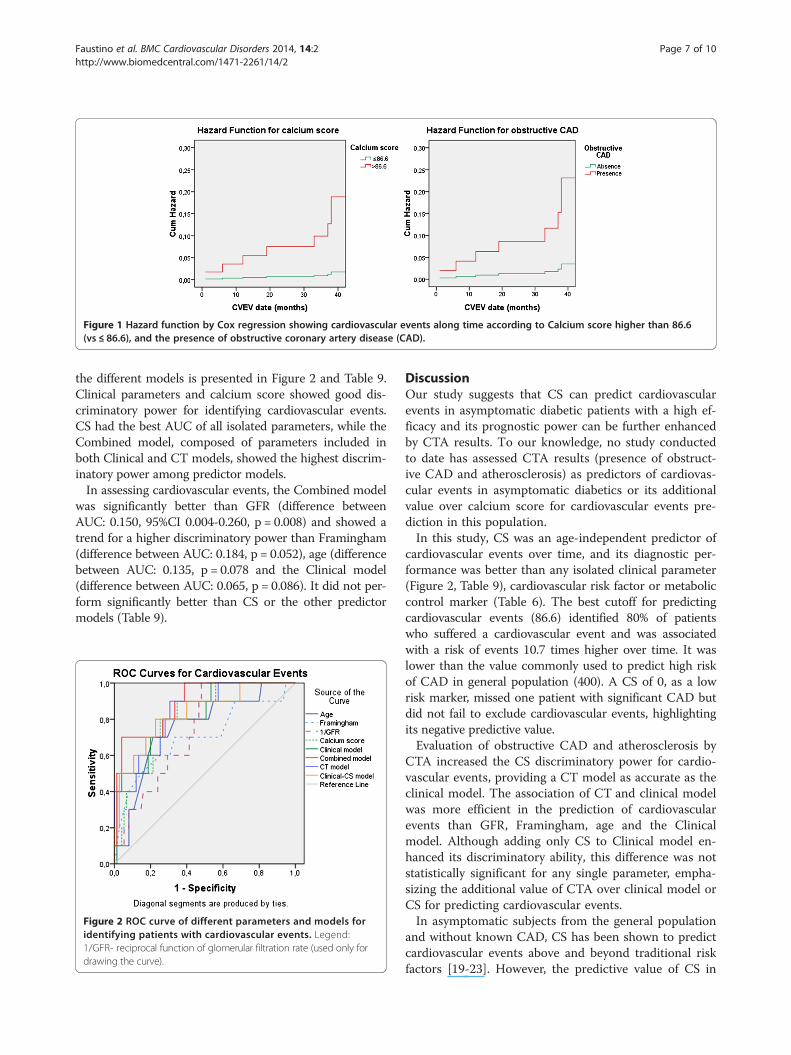
Figure 1 Hazard function by Cox regression showing cardiovascular events along time according to Calcium score higher than 86.6(vs ≤ 86.6), and the presence of obstructive coronary artery disease (CAD).
Faustino et al. BMC Cardiovascular Disorders 2014, 14:2 Page 7 of 10http://www.biomedcentral.com/1471-2261/14/2
the different models is presented in Figure 2 and Table 9.Clinical parameters and calcium score showed good dis-criminatory power for identifying cardiovascular events.CS had the best AUC of all isolated parameters, while theCombined model, composed of parameters included inboth Clinical and CT models, showed the highest discrim-inatory power among predictor models.In assessing cardiovascular events, the Combined model
was significantly better than GFR (difference betweenAUC: 0.150, 95%CI 0.004-0.260, p = 0.008) and showed atrend for a higher discriminatory power than Framingham(difference between AUC: 0.184, p = 0.052), age (differencebetween AUC: 0.135, p = 0.078 and the Clinical model(difference between AUC: 0.065, p = 0.086). It did not per-form significantly better than CS or the other predictormodels (Table 9).
Figure 2 ROC curve of different parameters and models foridentifying patients with cardiovascular events. Legend:1/GFR- reciprocal function of glomerular filtration rate (used only fordrawing the curve).
DiscussionOur study suggests that CS can predict cardiovascularevents in asymptomatic diabetic patients with a high ef-ficacy and its prognostic power can be further enhancedby CTA results. To our knowledge, no study conductedto date has assessed CTA results (presence of obstruct-ive CAD and atherosclerosis) as predictors of cardiovas-cular events in asymptomatic diabetics or its additionalvalue over calcium score for cardiovascular events pre-diction in this population.In this study, CS was an age-independent predictor of
cardiovascular events over time, and its diagnostic per-formance was better than any isolated clinical parameter(Figure 2, Table 9), cardiovascular risk factor or metaboliccontrol marker (Table 6). The best cutoff for predictingcardiovascular events (86.6) identified 80% of patientswho suffered a cardiovascular event and was associatedwith a risk of events 10.7 times higher over time. It waslower than the value commonly used to predict high riskof CAD in general population (400). A CS of 0, as a lowrisk marker, missed one patient with significant CAD butdid not fail to exclude cardiovascular events, highlightingits negative predictive value.Evaluation of obstructive CAD and atherosclerosis by
CTA increased the CS discriminatory power for cardio-vascular events, providing a CT model as accurate as theclinical model. The association of CT and clinical modelwas more efficient in the prediction of cardiovascularevents than GFR, Framingham, age and the Clinicalmodel. Although adding only CS to Clinical model en-hanced its discriminatory ability, this difference was notstatistically significant for any single parameter, empha-sizing the additional value of CTA over clinical model orCS for predicting cardiovascular events.In asymptomatic subjects from the general population
and without known CAD, CS has been shown to predictcardiovascular events above and beyond traditional riskfactors [19-23]. However, the predictive value of CS in
Table 9 Receiver operating characteristic (ROC) curve evaluation for CVEV prediction
Prediction of CVEV: ROC analysis AUC 95% CI p
Framingham 0.704 0.506 – 0.902 0.037
Glomerular filtration rate 0.262 0.132 – 0.392 0.015
Age 0.753 0.596 – 0.911 0.010
Calcium score 0.808 0.690 – 0.926 0.002
Clinical model 0.823 0.692 – 0.953 0.001
Clinical-CS model 0.832 0.692 – 0.972 0.001
CT model 0.833 0.711 – 0.955 0.001
Combined model 0.888 0.789 – 0.987 <0.001
ROC comparisons - Combined model vs: AUC (difference) 95% CI p
Glomerular filtration rate 0.150 0.004-0.260 0.008
Framingham 0.184 −0.002-0.370 0.052
Age 0.135 −0.015-0.284 0.078
Calcium score 0.080 −0.022-0.182 0.123
Clinical model 0.065 −0.009-0.140 0.086
Clinical-CS model 0.056 −0.023-0.135 0.164
CT model 0.055 −0.025-0.135 0.180
Legend: Predictor models: CT model - composed by calcium score, obstructive Coronary Artery Disease and atherosclerotic plaques; Clinical model – composed byclinical parameters evaluated before Computed Tomography: Glomerular Filtration Rate, age, Framingham; Clinical-CS model – composed by clinical parametersand calcium score; Combined model – composed by parameters included in both clinical and CT models.Areas under ROC curves (AUC), 95% confidence intervals (CI) and the significance level (p) are presented.Results presented in this table are related to curves showed in Figure 2.
Faustino et al. BMC Cardiovascular Disorders 2014, 14:2 Page 8 of 10http://www.biomedcentral.com/1471-2261/14/2
asymptomatic diabetics is not so well documented. In alarge observational study including diabetic and non-diabetic participants, CS predicted all cause mortality indiabetics and added to the predictive power of the Fra-mingham score, while diabetics with undetectable CShad a mortality rate similar to that of non-diabetic individ-uals [24]. In another study, CS was superior to establishedrisk factors in identifying silent myocardial ischaemia byperfusion scintigraphy in type-2 diabetics [25]. The PRE-DICT Study (Coronary calcium measurement improvesprediction of cardiovascular events in asymptomaticpatients with type 2 diabetes) [13] also documented CSas a powerful predictor of cardiovascular events in asymp-tomatic type-2 diabetics that can enhance prediction pro-vided by established risk models. Our data were consistentwith those presented in these studies.Functional tests have also been evaluated to screen
asymptomatic diabetics. DIAD (Cardiac Outcomes afterScreening for Asymptomatic Coronary Artery Disease inPatients With Type 2 Diabetes) study [14] was a rando-mised trial that evaluated the impact of ischaemia screen-ing in the prevention of cardiovascular events. Authorsconcluded that smaller ischaemic defects by adenosine-stress radionuclide myocardial perfusion imaging inasymptomatic diabetic patients were related to a lowerevent rate. However, the positive predictive value of hav-ing moderate or large perfusion defects was only 12%, thetotal event rate was low (2.9% over a follow-up 0f 4.8
years: 0.6/year) and there were no significant differencesbetween the screened and unscreened group.Our study population had long diabetes duration and
high prevalence of cardiovascular risk factors such ashypertension and dyslipidemia, and metabolic syndrome.Their cardiovascular risk was very high according to Fra-mingham risk score, used for prediction of fatal andnon-fatal cardiovascular events, and was reduced overtime, due in part to therapeutic improvement performedtaking into account CT results.CTA revealed obstructive CAD in 24.7% of diabetics, a
prevalence similar to that reported in previous studies[1,7]. Coronary atherosclerosis was completely absent in32.9% and this was protective from cardiovascular events,with a negative predictive value of 100%. These resultshighlight the atherosclerotic heterogeneity of asymptom-atic diabetic patients, which was essential to identify andwould not be possible without CT.We found a high event rate (11.8% over 45 ± 13 months,
3.1% per year) in the study population. The addition of CSand CTA data to clinical predictors improved the identifi-cation of patients at risk of cardiovascular events, whomay benefit from early and potentially more aggressivetreatment with statins, antiplatelet agents and revasculari-sation, as well as tight control of glucose levels.However, in order to perform CT scan in all asymp-
tomatic diabetics, radiation has to be cut to the mini-mum. New generation scanners and strategies of dose
Faustino et al. BMC Cardiovascular Disorders 2014, 14:2 Page 9 of 10http://www.biomedcentral.com/1471-2261/14/2
modulation may significantly reduce radiation exposureto less than 1 mSV.
LimitationsWe describe results of a single-center study, with a lim-ited number of enrolled patients. This was due to a lowavailability of CT when the study began, but also to the in-clusion criteria, as this examination is not routinely per-formed in asymptomatic individuals. Indeed, our outpatientdiabetes clinic receives patients at high cardiovascular riskor with very poor metabolic control, most of which couldnot be enrolled due to CAD history, ischemic symptoms orlow GFR. These data may therefore present a selection biasthat may not fit to general asymptomatic diabetic popula-tion. A larger sample from other centers would be neededfor external validation of these results and of the Combinedmodel created.Patients´ treatment did not follow a specific protocol, as
they were treated according to routine clinical practice ofdifferent diabetologists.We observed therapeutic changes immediately after
performing CT, however a control group would be re-quired to evaluate the real impact of CT in cardiovascu-lar events reduction.
ConclusionEvaluating atherosclerosis and obstructive CAD throughthe combination of CS and CTA showed high predictivevalue for cardiovascular events in asymptomatic type-2diabetic patients. Furthermore, the use of these two CTmethods on top of clinical data improved risk stratifica-tion even further, identifying those who can derive themost benefit from intensive prevention measures. Therecognition of atherosclerotic disease in this very hete-rogeneous group of patients led to changes in thetherapeutic strategy. However, the true impact of CTrisk-stratification and the resulting therapeutic changes onlong-term prognosis still needs to be further assessed inrandomized controlled trials.
AbbreviationsCAD: Coronary artery disease; CT: Cardiac computed tomography;CS: Coronary artery calcium score; CTA: Coronary angiography by cardiaccomputed tomography; CVEV: Fatal and non fatal cardiovascular events;GFR: Glomerular filtration rate; ROC curve: Receiver operating characteristiccurve; AUC: Area under receiver operating characteristic curve.
Competing interestsThe authors have no competing interests.
Authors’ contributionsAF: conception and design, acquisition, analysis and interpretation of data,draft of the manuscript; PM: conception and design, acquisition andinterpretation of CT images, analysis and interpretation of data, critical reviewof the manuscript; JS: conception and design, acquisition of data, criticalreview of the manuscript; RP: analysis and interpretation of data, criticalreview of the manuscript; SB: critical review of the manuscript; AFF:acquisition of data; RC: acquisition and interpretation of CT images; SB:acquisition and interpretation of CT images; MC: have given final approval of
the version to be published; ALM: have given final approval of the version tobe published. All authors read and approved the final manuscript.
AcknowledgementsThe authors would like to thank the doctors of the diabetes outpatient clinicfor their contribution to this study.
Author details1Cardiology Department, Coimbra’s Hospital and University Centre – GeneralHospital, Coimbra, Portugal. 2Radiology Department, Coimbra’s Hospital andUniversity Centre – General Hospital, Quinta dos Vales, Martinho do Bispo,Coimbra 3041-801 S, Portugal.
Received: 27 May 2013 Accepted: 31 December 2013Published: 8 January 2014
References1. Scholte AJ, Schuijf JD, Kharagjitsingh AV, Jukema JW, Pundziute G, Van der
Wall EE, Bax JJ: Prevalence of coronary artery disease and plaquemorphology assessed by multi-slice computed tomography coronaryangiography and calcium scoreing in asymptomatic patients with type 2diabetes. Heart 2008, 94:290–295.
2. Haffner SM, Lehto S, Rönnemaa T, Pyörälä K, Laakso M: Mortality fromcoronary heart disease in subjects with type 2 diabetes and innondiabetic subjects with and without prior myocardial infarction.N Engl J Med 1998, 339:229–234.
3. Andreini D, Pontone G, Bartorelli A, Agostoni P, Mushtaq S, Antonioli L, CortinovisS, Canestrari M, Annoni A, Ballerini G, Fiorentini C, Pepi M: Comparison of thediagnostic performance of 64-slice computed tomography coronaryangiography in diabetic and non-diabetic patients with suspectedcoronary artery disease. Cardiovasc Diabetol 2010, 9:80.
4. Loffroy R, Bernard S, Sérusclat A, Boussel L, Bonnefoy E, D'Athis P, Moulin P,Revel D, Douek P: Noninvasive assessment of the prevalence andcharacteristics of coronary atherosclerotic plaques by multidetectorcomputed thomography in asymptomatic type 2 diabetic patients athigh risk of significant coronary artery disease: a preliminary study.Arch Cardiovasc Dis 2009, 102:607–615.
5. Perrone-Filardi P, Achenbach S, Möhlenkamp S, Reiner Z, Sambuceti G,Schuijf JD, Van der Wall E, Kaufmann PA, Knuuti J, Schroeder S, ZellwegerMJ: Cardiac computed tomography and myocardial perfusionscintigraphy for risk stratification in asymptomatic individuals withoutknown cardiovascular disease: a position statement of the workinggroup on nuclear cardiology and cardiac CT of the European society ofcardiology. Eur Heart J 2011, 32:1986–1993.
6. Silva J, Mota P, Coelho A, Catarino R, Leitão-Marques A: Incidence ofsubclinical atheroslcerosis in asymptomatic type-2 diabetic patients: thepotencial of multi-slice computed tomography coronary angiography.Coron Artery Dis 2011, 22:26–31.
7. Rivera JJ, Nasir K, Choi EK, Yoon YE, Chun EJ, Choi SI, Choi DJ, Brancati FL,Blumenthal RS, Chang HJ: Detection of occult coronary artery disease inasymptomatic individuals with diabetes mellitus using non-invasivecardiac angiography. Atherosclerosis 2009, 203:442–448.
8. Romeo F, Leo R, Clementi F, Razzini C, Borzi M, Martuscelli E, Pizzuto F,Chiricolo G, Mehta JL: Multislice computed tomography in anasymptomatic high-risk population. Am J Cardiol 2007, 99:325–328.
9. The BARI Investigators: Influence of diabetes on 5-year mortality andmorbidity in a randomized trial comparing CABG and PTCA in patientswith multivessel disease: the bypass Angioplasty RevascularizationInvestigation (BARI). Circulation 1997, 96:1761–1769.
10. The BARI Investigators: Seven-year outcome in the bypass angioplastyrevascularization investigation (BARY) by treatment and diabetic status.J Am Coll Cardiol 2000, 35:1122–1129.
11. Pignone M, Alberts M, Colwell J, Cushman M, Inzucchi SE, Mukherjee D,Rosenson RS, Williams CD, Wilson PW, Kirkman MS: Aspirin for primaryprevention of cardiovascular events in people with diabetes, a positionstatement of the American diabetes association, a scientific statement ofthe American heart association, and an expert consensus document ofthe American college of cardiology foundation. Circulation 2010,121:2694–2701.
12. Perk J, De Backer G, Gohlke H, Graham I, Reiner Z, Verschuren M, Albus C,Benlian P, Boysen G, Cifkova R, Deaton C, Ebrahim S, Fisher M, Germano G,
Faustino et al. BMC Cardiovascular Disorders 2014, 14:2 Page 10 of 10http://www.biomedcentral.com/1471-2261/14/2
Hobbs R, Hoes A, Karadeniz S, Mezzani A, Prescott E, Ryden L, Scherer M,Syva M, Reimer SO, Vrints C, Wood D, Zamorano JL, Zannad F: Europeanguidelines on cardiovascular disease prevention in clinical practice(version 2012), the fifth joint task force of the European society ofcardiology and other societies on cardiovascular disease prevention inclinical practice. Eur Heart J 2012, 33(13):1635–1701.
13. Elkeles R, Godsland I, Feher M, Rubens MB, Roughton M, Nugara F,Humphries SE, Richmond W, Flather MD: Coronary calcium measurementimproves prediction of cardiovascular events in asymptomatic patientswith type 2 diabetes: the PREDICT study. Eur Heart J 2008, 29:2244–2251.
14. Young LH, Wackers FJ, Chyun DA, Davey JA, Barrett EJ, Taillefer R, Heller GV,Iskandrian AE, Wittlin SD, Filipchuk N, Ratner RE, Inzucchi SE: Cardiacoutcomes after screening for asymptomatic coronary artery disease inpatients with type 2 diabetes, The DIAD study: a randomized controlledtrial. JAMA 2009, 301(15):1547–1555.
15. American Diabetes Association: Diagnosis and classification of diabetesmellitus. Diabetes Care 2004, 27(Suppl 1):s5–s10.
16. Grundy S, Brewer HBJ, Cleeman J, Smith SC, Lenfant C: Definition ofmetabolic syndrome report of the National heart, lung, and bloodInstitute/American heart association conference on scientific issuesrelated to definition. Circulation 2004, 109:433–438.
17. Third report of the National Cholesterol Education Program (NCEP) ExpertPanel on Detection: Evaluation, and treatment of high blood cholesterolin adults (Adult Treatment Panel III) final report. Circulation 2002,106(25):3143–3421.
18. Thygesen K, Alpert JS, White HD: Joint ESC/ACCF/AHA/WHF task force forthe redefinition of myocardial infarction. Universal Definition ofMyocardial Infarction. Eur Heart J 2007, 28:2525–2538.
19. Budoff MJ, Nasir K, McClelland RL, Detrano R, Wong N, Blumenthal RS,Kondos G, Kronmal RA: Coronary calcium predicts events better withabsolute calcium scores than age-sex-race/ethnicity percentiles: MESA(Multi-Ethnic Study of Atheroslcerosis). J Am Coll Cardiol 2009, 53:345–352.
20. Taylor AJ, Bindeman J, Feuerstein I, Cao F, Brazaitis M, O’Malley PG:Coronary calcium independently predicts incident premature coronaryheart disease over measured cardiovascular risk factors: mean three-yearoutcomes in the Prospective Army Coronary Calcium (PACC) project.J Am Coll Cardiol 2005, 46:807–814.
21. Greenland P, LaBree L, Azen SP, Doherty TM, Detrano RC: Coronary arterycalcium score combined with Framingham score for risk prediction inasymptomatic individuals. JAMA 2004, 291:210–215.
22. Ardehali R, Nasir K, Kolandaivelu A, Budoff M, Blumenthal RS: Screeningpatients for subclinical atherosclerosis with non-contrast cardiac CT.Atherosclerosis 2007, 192:235–242.
23. Arad Y, Goodman KJ, Roth M, Newstein D, Guerci AD: Coronary calcification,coronary disease risk factors, C-reactive protein, and atheroscleroticcardiovascular disease events: the St Francis Heart Study. J Am Coll Cardiol2005, 46:158–165.
24. Raggi P, Shaw LJ, Berman DS, Callister TQ: Prognostic value of coronaryartery calcium screening in subjects with and without diabetes. J Am CollCardiol 2004, 43:1663–1669.
25. Anand DV, Lim E, Hopkins D, Corder R, Ahaw LJ, Sharp P, Lipkin D, Lahiri A:Risk stratification in uncomplicated type 2 diabetes: prospectiveevaluation of the combined use of coronary artery calcium imaging andselective myocardial perfusion scintigraphy. Eur Heart J 2006, 27:713–721.
doi:10.1186/1471-2261-14-2Cite this article as: Faustino et al.: Can cardiac computed tomographypredict cardiovascular events in asymptomatic type-2 diabetics?: resultsof a long term follow-up. BMC Cardiovascular Disorders 2014 14:2.
Submit your next manuscript to BioMed Centraland take full advantage of:
• Convenient online submission
• Thorough peer review
• No space constraints or color figure charges
• Immediate publication on acceptance
• Inclusion in PubMed, CAS, Scopus and Google Scholar
• Research which is freely available for redistribution
Submit your manuscript at www.biomedcentral.com/submit
Related Documents


