This document consists of 18 printed pages and 2 blank pages. DC (CW/CGW) 134133 © UCLES 2016 [Turn over Cambridge International Examinations Cambridge Ordinary Level STATISTICS 4040/23 Paper 2 October/November 2016 2 hours 15 minutes Candidates answer on the Question Paper. Additional Materials: Pair of compasses Protractor READ THESE INSTRUCTIONS FIRST Write your Centre number, candidate number and name on all the work you hand in. Write in dark blue or black pen. You may use an HB pencil for any diagrams or graphs. Do not use staples, paper clips, glue or correction fluid. DO NOT WRITE IN ANY BARCODES. Answer all questions in Section A and not more than four questions from Section B. If working is needed for any question it must be shown below that question. The use of an electronic calculator is expected in this paper. At the end of the examination, fasten all your work securely together. The number of marks is given in brackets [ ] at the end of each question or part question. *9067533195*

Welcome message from author
This document is posted to help you gain knowledge. Please leave a comment to let me know what you think about it! Share it to your friends and learn new things together.
Transcript

This document consists of 18 printed pages and 2 blank pages.
DC (CW/CGW) 134133© UCLES 2016 [Turn over
Cambridge International ExaminationsCambridge Ordinary Level
STATISTICS 4040/23Paper 2 October/November 2016 2 hours 15 minutesCandidates answer on the Question Paper.Additional Materials: Pair of compasses Protractor
READ THESE INSTRUCTIONS FIRST
Write your Centre number, candidate number and name on all the work you hand in.Write in dark blue or black pen.You may use an HB pencil for any diagrams or graphs.Do not use staples, paper clips, glue or correction fluid.DO NOT WRITE IN ANY BARCODES.
Answer all questions in Section A and not more than four questions from Section B.If working is needed for any question it must be shown below that question.The use of an electronic calculator is expected in this paper.
At the end of the examination, fasten all your work securely together.The number of marks is given in brackets [ ] at the end of each question or part question.
*9067533195*
2
4040/23/O/N/16© UCLES 2016
Section A [36 marks]
Answer all of the questions 1 to 6
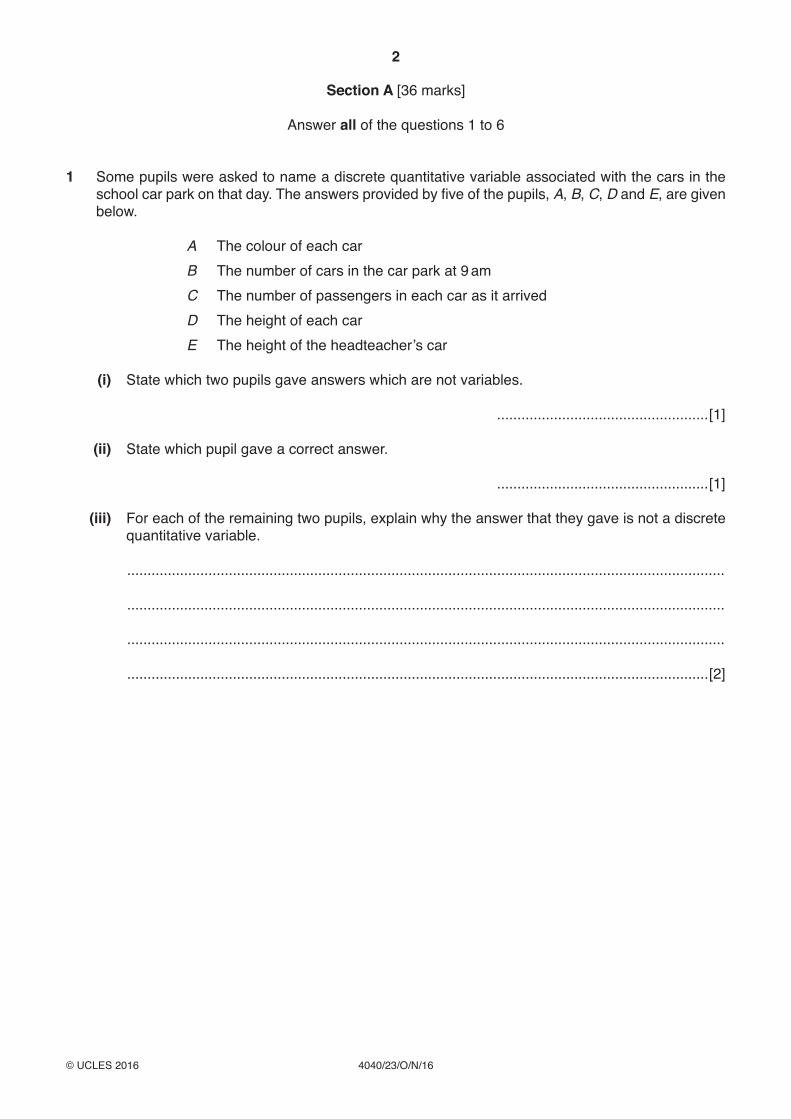
1 Some pupils were asked to name a discrete quantitative variable associated with the cars in the school car park on that day. The answers provided by five of the pupils, A, B, C, D and E, are given below.
A The colour of each car B The number of cars in the car park at 9 am C The number of passengers in each car as it arrived D The height of each car E The height of the headteacher’s car
(i) State which two pupils gave answers which are not variables.
....................................................[1]
(ii) State which pupil gave a correct answer.
....................................................[1]
(iii) For each of the remaining two pupils, explain why the answer that they gave is not a discrete quantitative variable.
...................................................................................................................................................
...................................................................................................................................................
...................................................................................................................................................
...............................................................................................................................................[2]
3
4040/23/O/N/16© UCLES 2016 [Turn over
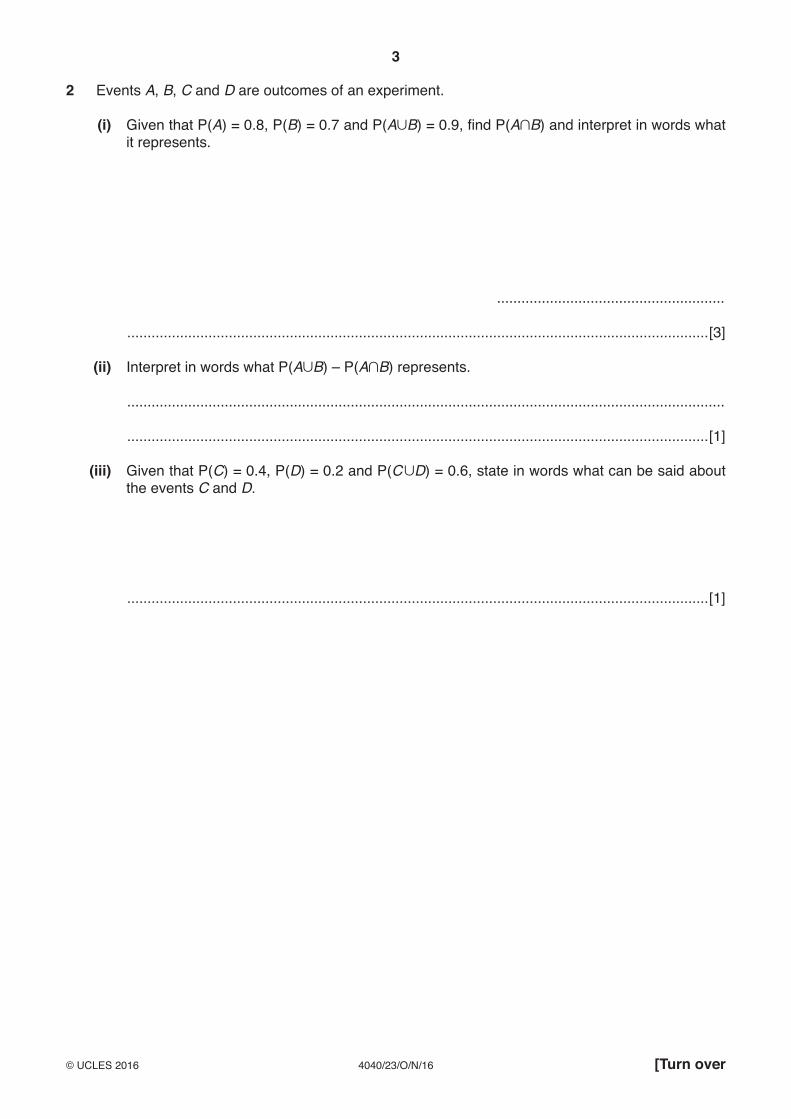
2 Events A, B, C and D are outcomes of an experiment.
(i) Given that P(A) = 0.8, P(B) = 0.7 and P(A,B) = 0.9, find P(A+B) and interpret in words what it represents.
........................................................
...............................................................................................................................................[3]
(ii) Interpret in words what P(A,B) – P(A+B) represents.
...................................................................................................................................................
...............................................................................................................................................[1]
(iii) Given that P(C) = 0.4, P(D) = 0.2 and P(C ,D) = 0.6, state in words what can be said about the events C and D.
...............................................................................................................................................[1]
4
4040/23/O/N/16© UCLES 2016
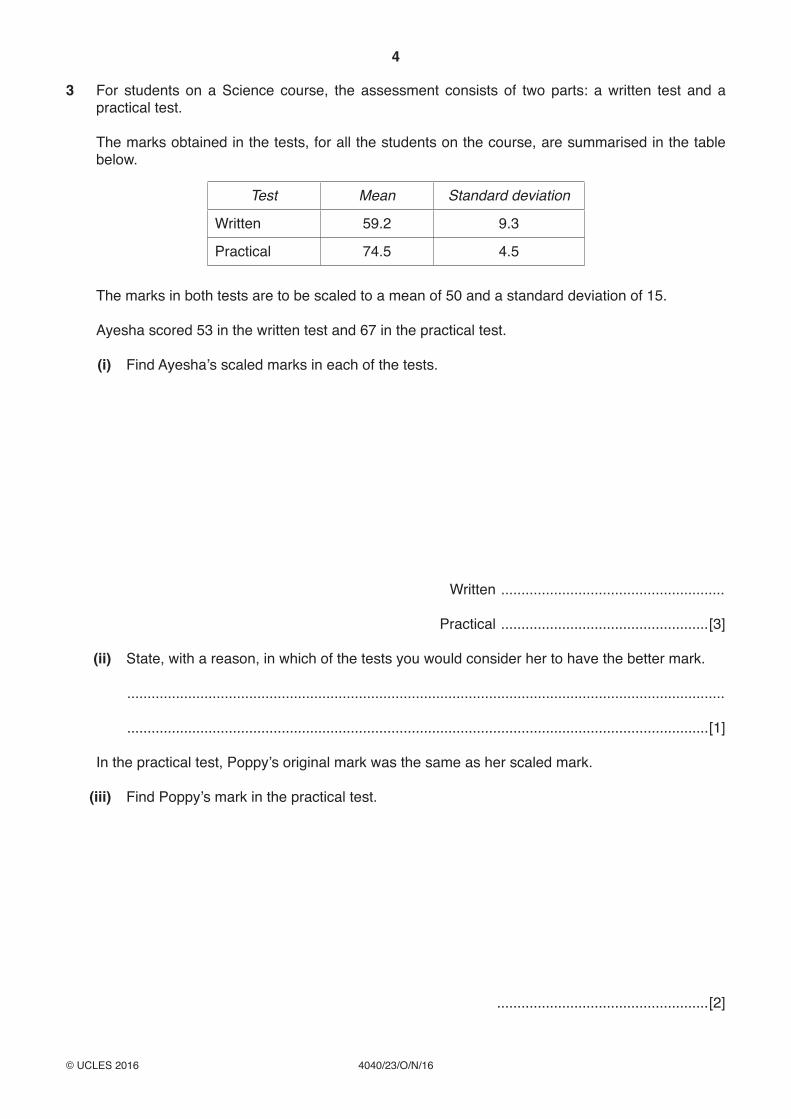
3 For students on a Science course, the assessment consists of two parts: a written test and a practical test.
The marks obtained in the tests, for all the students on the course, are summarised in the table below.
Test Mean Standard deviation
Written 59.2 9.3
Practical 74.5 4.5
The marks in both tests are to be scaled to a mean of 50 and a standard deviation of 15.
Ayesha scored 53 in the written test and 67 in the practical test.
(i) Find Ayesha’s scaled marks in each of the tests.
Written .......................................................
Practical ...................................................[3]
(ii) State, with a reason, in which of the tests you would consider her to have the better mark.
...................................................................................................................................................
...............................................................................................................................................[1]
In the practical test, Poppy’s original mark was the same as her scaled mark.
(iii) Find Poppy’s mark in the practical test.
....................................................[2]
5
4040/23/O/N/16© UCLES 2016 [Turn over
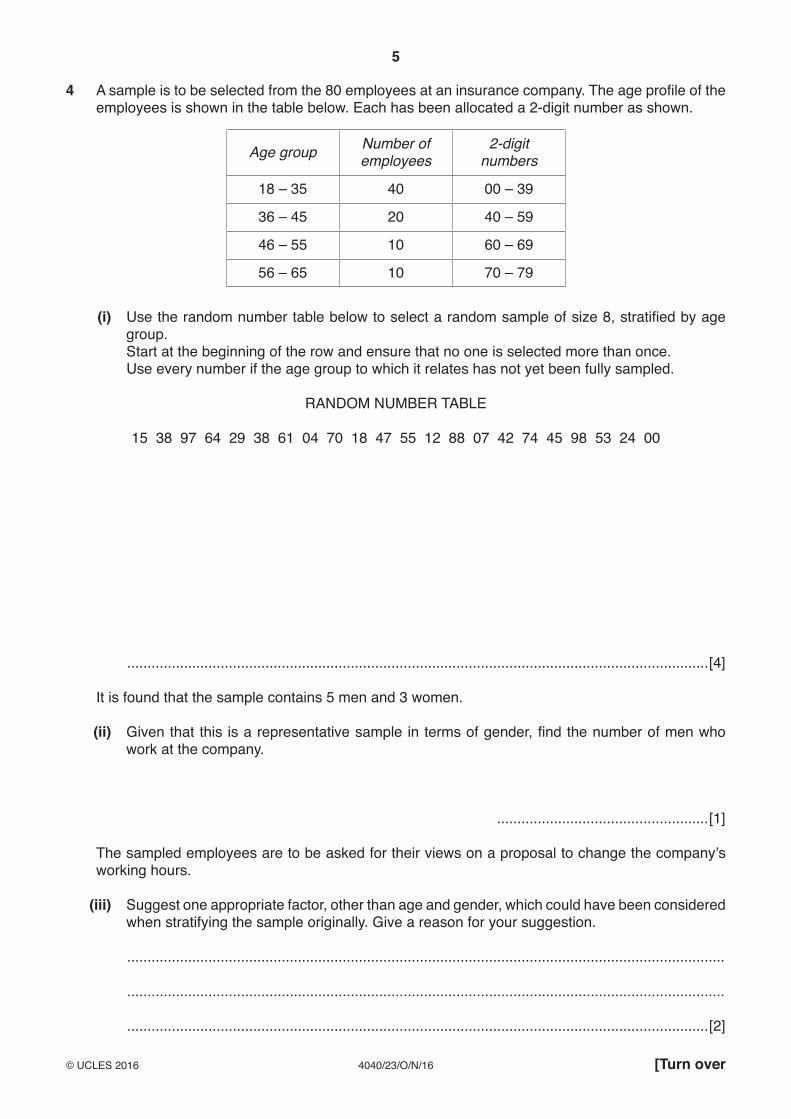
4 A sample is to be selected from the 80 employees at an insurance company. The age profile of the employees is shown in the table below. Each has been allocated a 2-digit number as shown.
Age group Number of employees
2-digit numbers
18 – 35 40 00 – 39
36 – 45 20 40 – 59
46 – 55 10 60 – 69
56 – 65 10 70 – 79
(i) Use the random number table below to select a random sample of size 8, stratified by age group.
Start at the beginning of the row and ensure that no one is selected more than once. Use every number if the age group to which it relates has not yet been fully sampled.
RANDOM NUMBER TABLE
15 38 97 64 29 38 61 04 70 18 47 55 12 88 07 42 74 45 98 53 24 00
...............................................................................................................................................[4]
It is found that the sample contains 5 men and 3 women.
(ii) Given that this is a representative sample in terms of gender, find the number of men who work at the company.
....................................................[1]
The sampled employees are to be asked for their views on a proposal to change the company’s working hours.
(iii) Suggest one appropriate factor, other than age and gender, which could have been considered when stratifying the sample originally. Give a reason for your suggestion.
...................................................................................................................................................
...................................................................................................................................................
...............................................................................................................................................[2]
6
4040/23/O/N/16© UCLES 2016
5 Bashir buys a sandwich for lunch every day from a shop which sells three types of sandwich: chicken, egg, and cheese. Assume that Bashir always chooses one of these sandwiches and all three types are always available.
From past experience he finds that on any one occasion the probability of him choosing chicken is 1/5 and the probability of him choosing egg is 1/3.
(i) Find the probability that on any one occasion he will choose cheese.
....................................................[2]
(ii) Find the probability that he does not choose chicken on each of two consecutive days.
....................................................[3]
(iii) Explain what further assumption you have made in making the calculation in part (ii).
...................................................................................................................................................
...............................................................................................................................................[1]
(iv) Explain, with a reason, whether or not you think this assumption is justified.
...................................................................................................................................................
...............................................................................................................................................[1]
7
4040/23/O/N/16© UCLES 2016 [Turn over
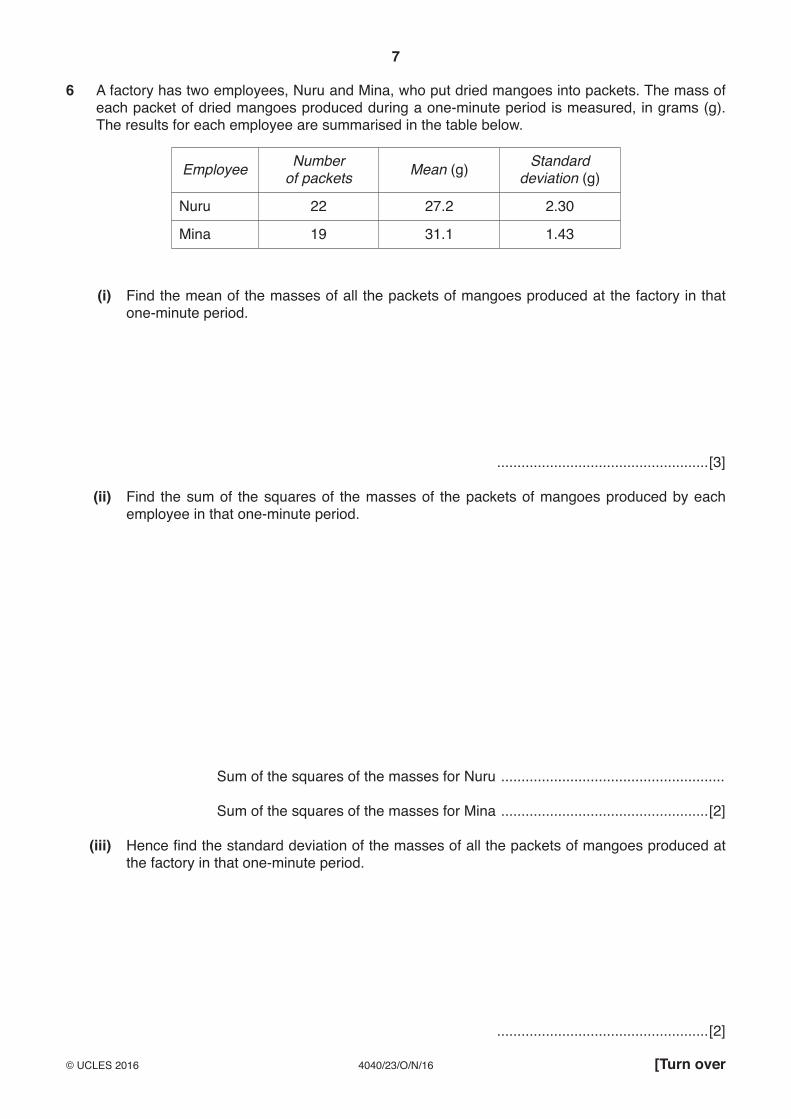
6 A factory has two employees, Nuru and Mina, who put dried mangoes into packets. The mass of each packet of dried mangoes produced during a one-minute period is measured, in grams (g). The results for each employee are summarised in the table below.
Employee Number of packets Mean (g) Standard
deviation (g)
Nuru 22 27.2 2.30
Mina 19 31.1 1.43
(i) Find the mean of the masses of all the packets of mangoes produced at the factory in that one-minute period.
....................................................[3]
(ii) Find the sum of the squares of the masses of the packets of mangoes produced by each employee in that one-minute period.
Sum of the squares of the masses for Nuru .......................................................
Sum of the squares of the masses for Mina ...................................................[2]
(iii) Hence find the standard deviation of the masses of all the packets of mangoes produced at the factory in that one-minute period.
....................................................[2]
8
4040/23/O/N/16© UCLES 2016
Section B [64 marks]
Answer not more than four of the questions 7 to 11.
Each question in this section carries 16 marks.
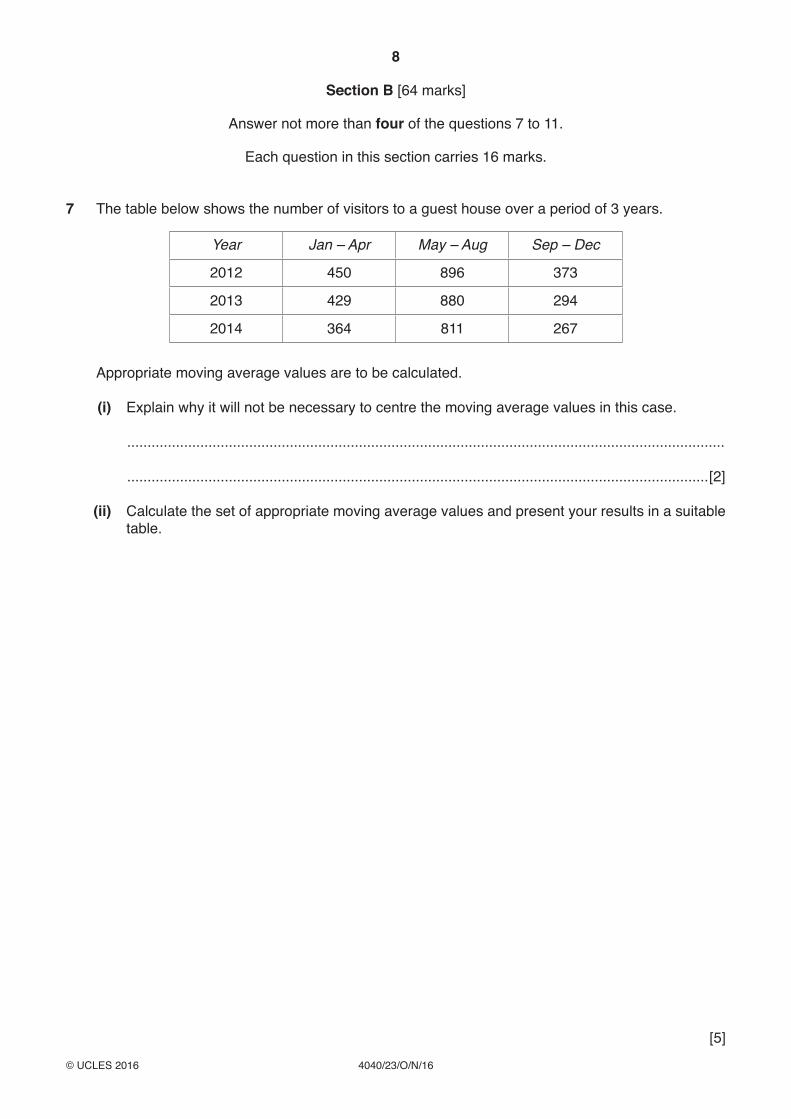
7 The table below shows the number of visitors to a guest house over a period of 3 years.
Year Jan – Apr May – Aug Sep – Dec
2012 450 896 373
2013 429 880 294
2014 364 811 267
Appropriate moving average values are to be calculated.
(i) Explain why it will not be necessary to centre the moving average values in this case.
...................................................................................................................................................
...............................................................................................................................................[2]
(ii) Calculate the set of appropriate moving average values and present your results in a suitable table.
[5]
9
4040/23/O/N/16© UCLES 2016 [Turn over
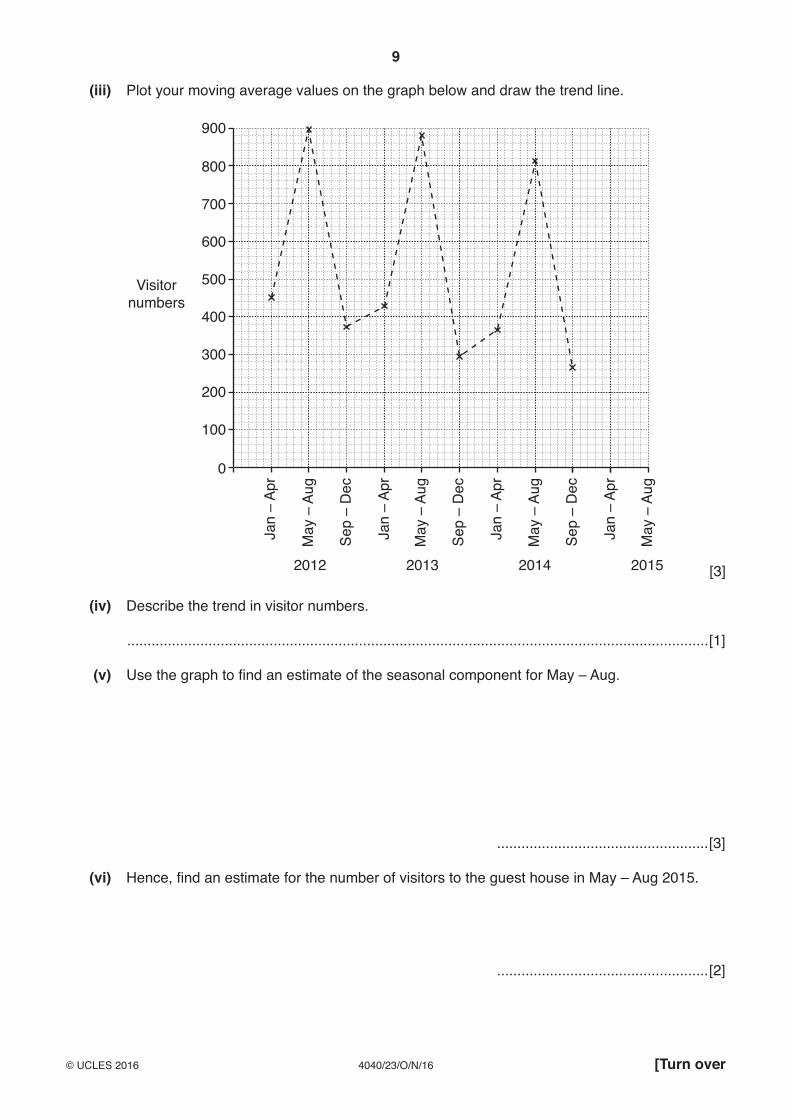
(iii) Plot your moving average values on the graph below and draw the trend line.
800
600
400
Visitornumbers
200
700
500
300
100
900
0
2012 2013 2014 2015
Jan
– Ap
r
May
– A
ug
Sep
– D
ec
Jan
– Ap
r
May
– A
ug
Sep
– D
ec
Jan
– Ap
r
May
– A
ug
Sep
– D
ec
Jan
– Ap
r
May
– A
ug
[3]
(iv) Describe the trend in visitor numbers.
...............................................................................................................................................[1]
(v) Use the graph to find an estimate of the seasonal component for May – Aug.
....................................................[3]
(vi) Hence, find an estimate for the number of visitors to the guest house in May – Aug 2015.
....................................................[2]
10
4040/23/O/N/16© UCLES 2016
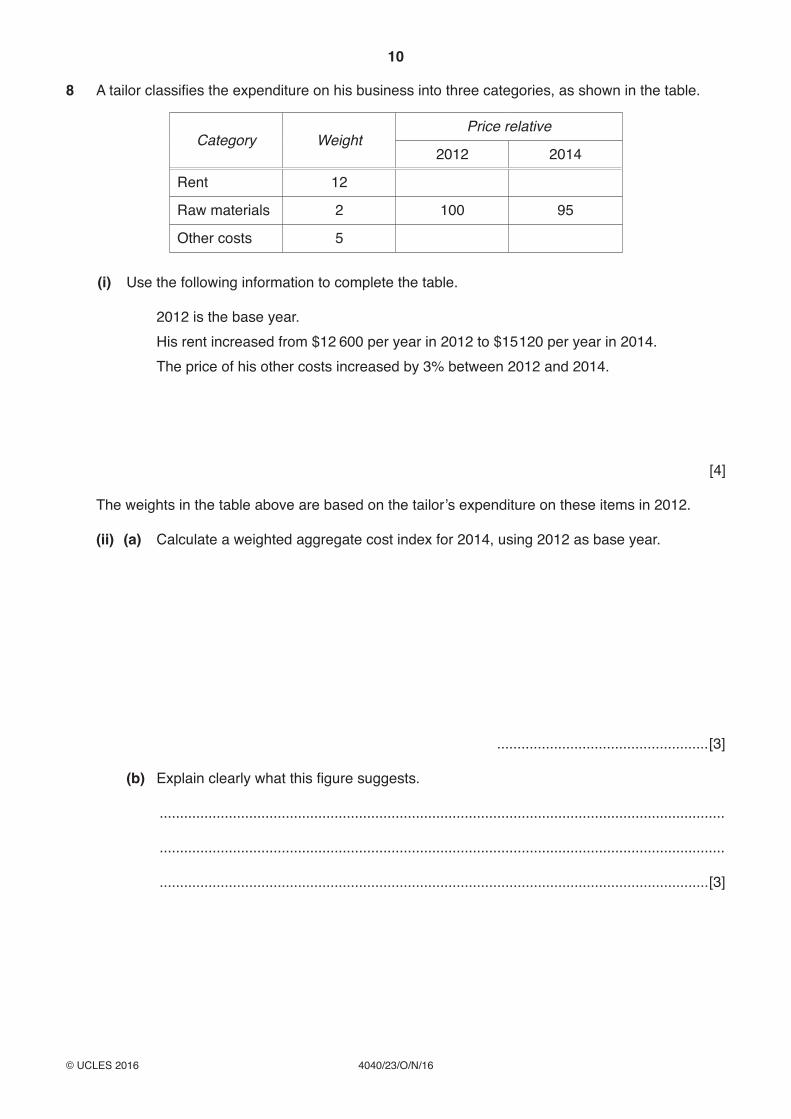
8 A tailor classifies the expenditure on his business into three categories, as shown in the table.
Category WeightPrice relative
2012 2014
Rent 12
Raw materials 2 100 95
Other costs 5
(i) Use the following information to complete the table.
2012 is the base year. His rent increased from $12 600 per year in 2012 to $15 120 per year in 2014. The price of his other costs increased by 3% between 2012 and 2014.
[4]
The weights in the table above are based on the tailor’s expenditure on these items in 2012.
(ii) (a) Calculate a weighted aggregate cost index for 2014, using 2012 as base year.
....................................................[3]
(b) Explain clearly what this figure suggests.
...........................................................................................................................................
...........................................................................................................................................
.......................................................................................................................................[3]
11
4040/23/O/N/16© UCLES 2016 [Turn over
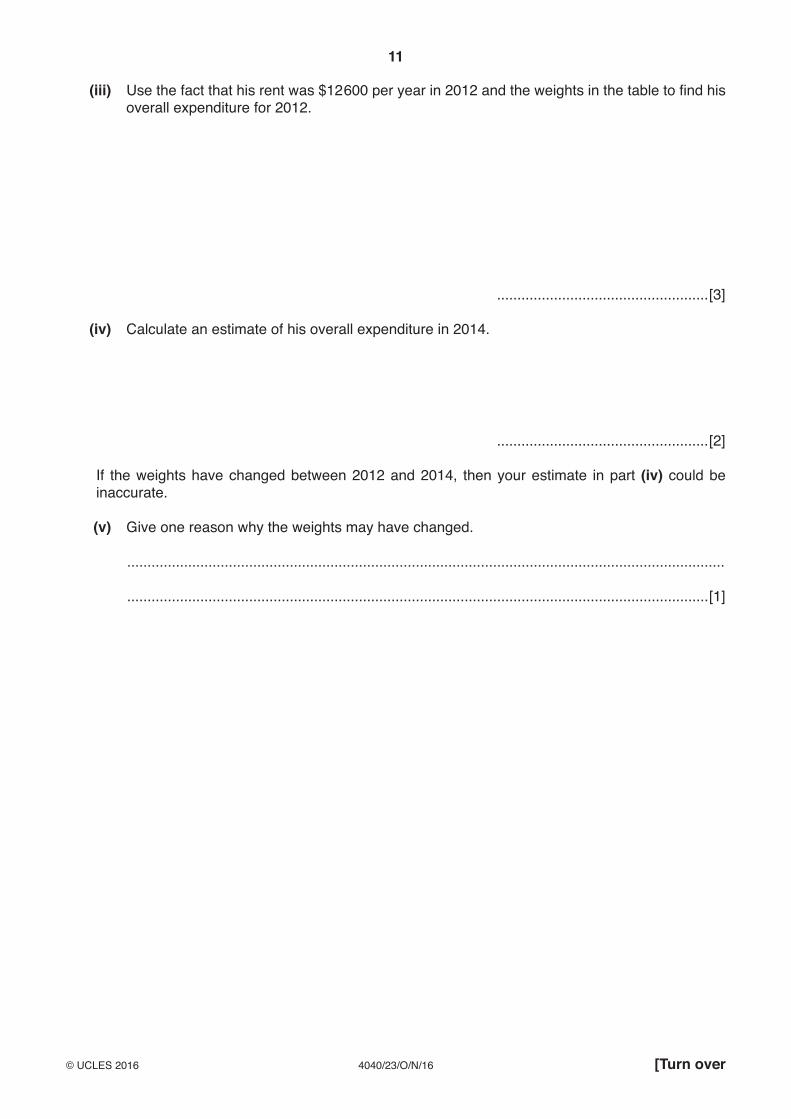
(iii) Use the fact that his rent was $12 600 per year in 2012 and the weights in the table to find his overall expenditure for 2012.
....................................................[3]
(iv) Calculate an estimate of his overall expenditure in 2014.
....................................................[2]
If the weights have changed between 2012 and 2014, then your estimate in part (iv) could be inaccurate.
(v) Give one reason why the weights may have changed.
...................................................................................................................................................
...............................................................................................................................................[1]
12
4040/23/O/N/16© UCLES 2016
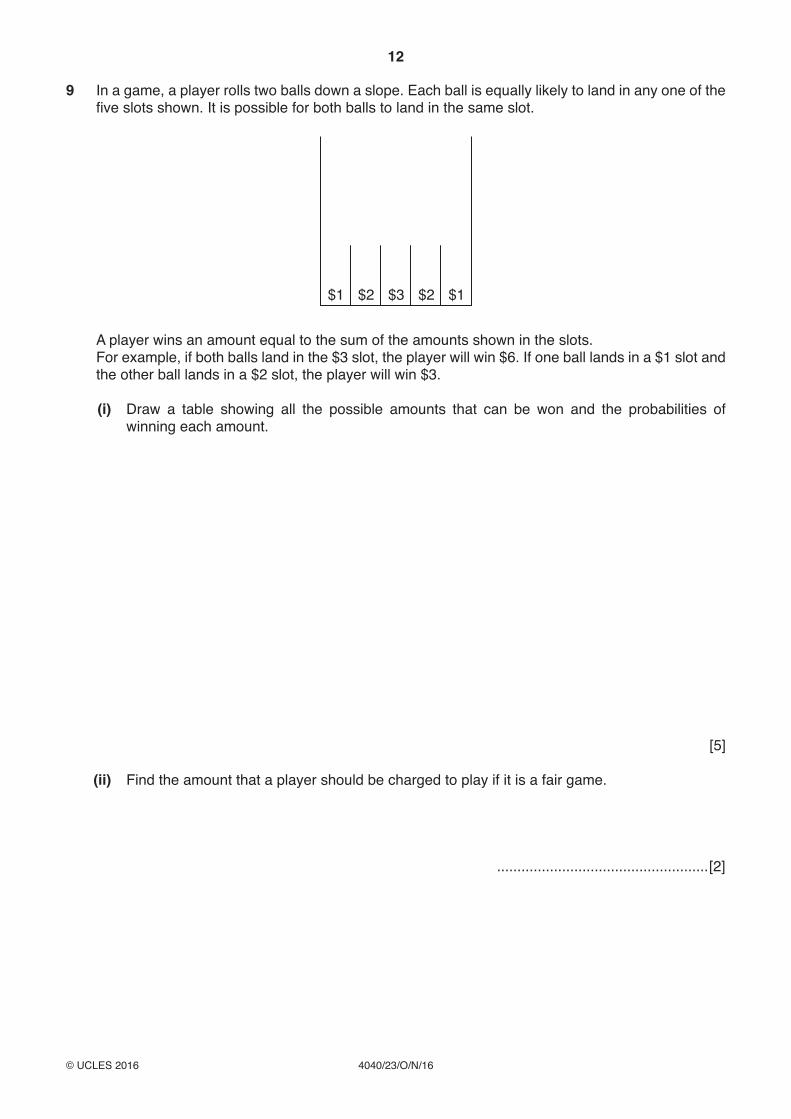
9 In a game, a player rolls two balls down a slope. Each ball is equally likely to land in any one of the five slots shown. It is possible for both balls to land in the same slot.
$1 $2 $3 $2 $1
A player wins an amount equal to the sum of the amounts shown in the slots. For example, if both balls land in the $3 slot, the player will win $6. If one ball lands in a $1 slot and
the other ball lands in a $2 slot, the player will win $3.
(i) Draw a table showing all the possible amounts that can be won and the probabilities of winning each amount.
[5]
(ii) Find the amount that a player should be charged to play if it is a fair game.
....................................................[2]
13
4040/23/O/N/16© UCLES 2016 [Turn over
A player who wins $6 in this game then has the option to play the Gold Bonus game.
In the Gold Bonus game the player selects two beads at random from a bag containing 1 red and 5 green beads. A bead is selected and its colour is noted; it is then returned to the bag and a second bead is selected.
If they select a green bead on both occasions they win an extra $4, otherwise they lose the $6 won.
(iii) Alex has won $6 in the original game. Show, using expectation, whether or not he should play the Gold Bonus game.
[5]
A player who wins $5 in the original game has the option to play the Silver Bonus game.
In the Silver Bonus game the player selects two beads at random, one at a time without replacement, from the bag containing 1 red and 5 green beads.
If they select two green beads they win an extra $x, otherwise they lose the $5 won.
(iv) Sasha has won $5 in the original game. Find, using expectation, the lowest value of x such that Sasha should choose to play the Silver Bonus game.
....................................................[4]

14
4040/23/O/N/16© UCLES 2016
10 The masses, to the nearest gram (g), of a random sample of 100 letters passing through a sorting office are summarised in the table below.
Mass (g) Number of letters
40 – 59 10
60 – 69 25
70 – 79 46
80 – 89 6
90 – 99 5
100 – 149 4
150 – 199 4
(i) State the lower and upper class boundaries of the 60 – 69 class and find its class width.
Lower class boundary ........................................................
Upper class boundary ........................................................
Class width ....................................................[2]
(ii) Find the class which contains the median mass.
....................................................[1]
(iii) Use linear interpolation to calculate an estimate of the median mass of the letters.
....................................................[4]
The estimated mean mass, calculated from the table above, is found to be 77.1 g.
(iv) With reference to the data in the table, explain clearly why you would expect the mean and the median to differ in the way they do.
...................................................................................................................................................
...............................................................................................................................................[2]
15
4040/23/O/N/16© UCLES 2016 [Turn over
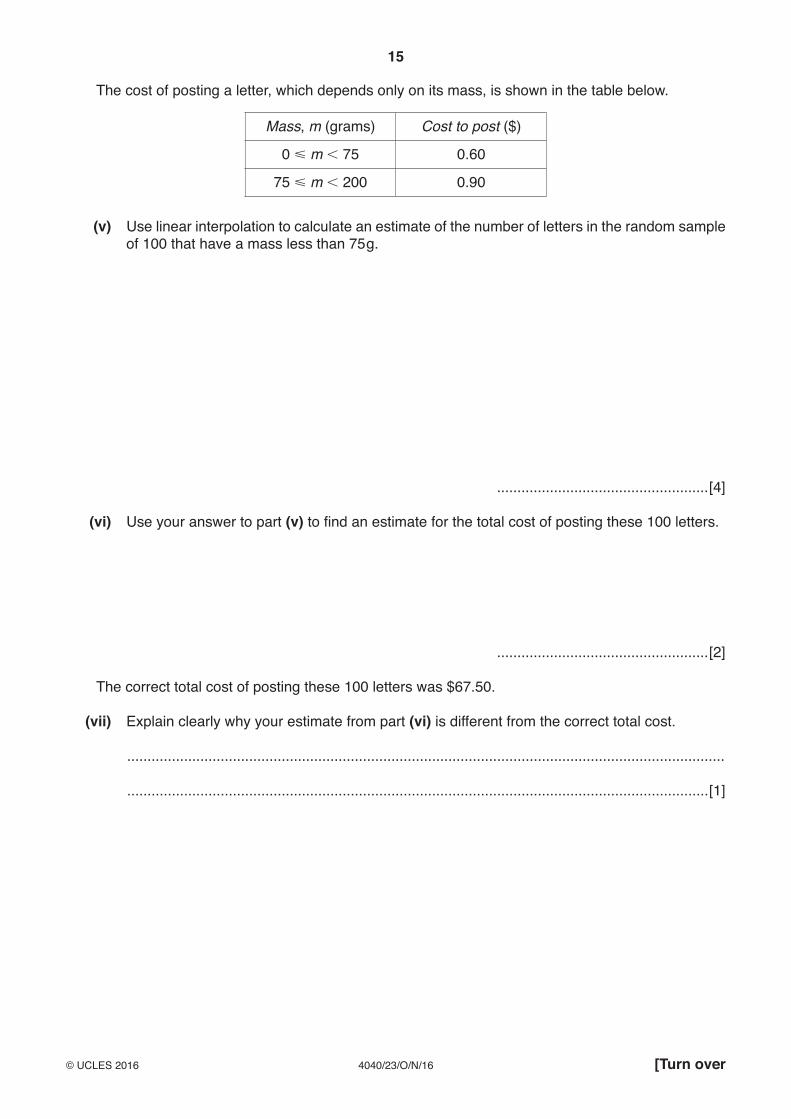
The cost of posting a letter, which depends only on its mass, is shown in the table below.
Mass, m (grams) Cost to post ($)
0 m 75 0.60
75 m 200 0.90
(v) Use linear interpolation to calculate an estimate of the number of letters in the random sample of 100 that have a mass less than 75 g.
....................................................[4]
(vi) Use your answer to part (v) to find an estimate for the total cost of posting these 100 letters.
....................................................[2]
The correct total cost of posting these 100 letters was $67.50.
(vii) Explain clearly why your estimate from part (vi) is different from the correct total cost.
...................................................................................................................................................
...............................................................................................................................................[1]
16
4040/23/O/N/16© UCLES 2016
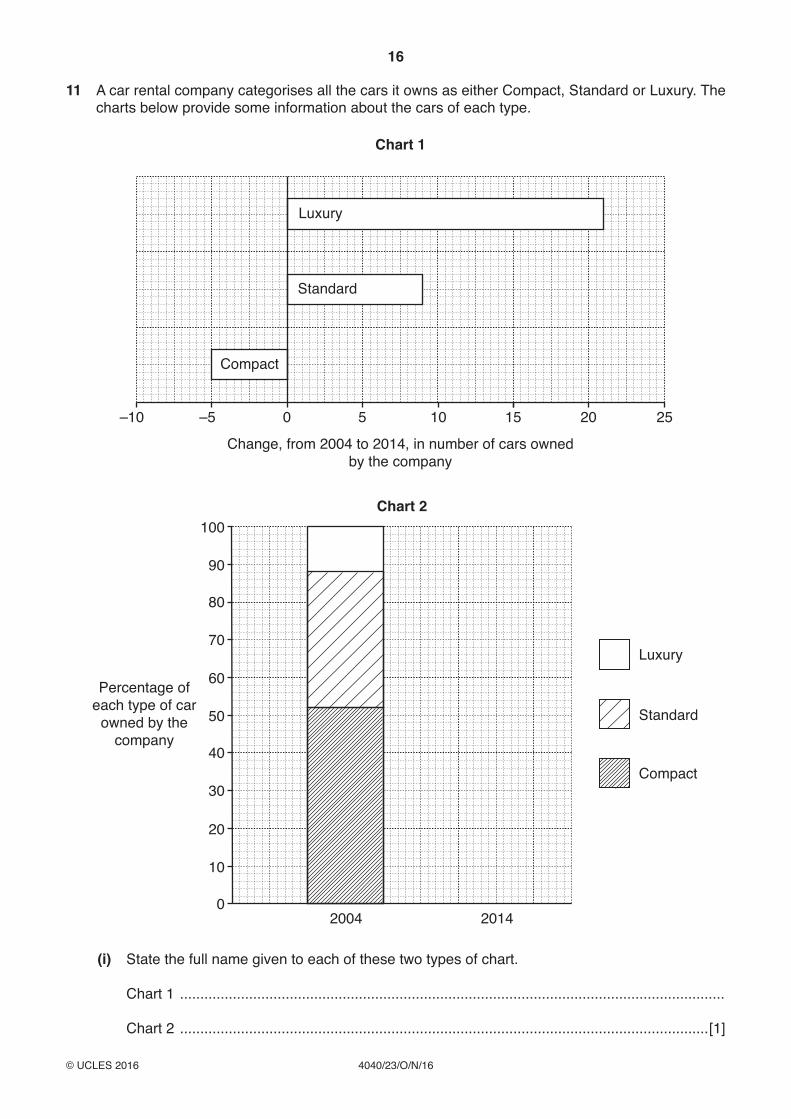
11 A car rental company categorises all the cars it owns as either Compact, Standard or Luxury. The charts below provide some information about the cars of each type.
–10 –5 5 1510 20 250
Change, from 2004 to 2014, in number of cars ownedby the company
Chart 1
Luxury
Standard
Compact
2004
100
Luxury
Standard
Compact
90
80
70
60
50
Percentage ofeach type of car
owned by thecompany
40
30
20
10
02014
Chart 2
(i) State the full name given to each of these two types of chart.
Chart 1 ......................................................................................................................................
Chart 2 ..................................................................................................................................[1]

17
4040/23/O/N/16© UCLES 2016 [Turn over
The company owned a total of 125 cars in 2004.
(ii) Find the number of cars it owned in each of the 3 categories in 2004 and in 2014. Display your results in a 2-way table.
[6]
(iii) Hence, complete Chart 2 for 2014.
[2]
(iv) Use Chart 1 and the completed Chart 2 to make two comments about the company’s ownership of Standard cars.
...................................................................................................................................................
...............................................................................................................................................[2]
[Question 11 continues on the next page]
18
4040/23/O/N/16© UCLES 2016
In 2014, 1/6 of the Compact cars, 1/3 of the Standard cars and 2/3 of the Luxury cars were Automatic and the rest were Manual.
(v) Draw, on the grid below, a dual bar chart to show the number of Automatic and Manual cars for each of the categories Compact, Standard and Luxury in 2014.
[4]
This information could, alternatively, have been displayed using a composite bar chart.
(vi) Give one advantage that a composite bar chart has over a dual bar chart.
...................................................................................................................................................
...............................................................................................................................................[1]

19
4040/23/O/N/16© UCLES 2016
BLANK PAGE

20
4040/23/O/N/16© UCLES 2016
Permission to reproduce items where third-party owned material protected by copyright is included has been sought and cleared where possible. Every reasonable effort has been made by the publisher (UCLES) to trace copyright holders, but if any items requiring clearance have unwittingly been included, the publisher will be pleased to make amends at the earliest possible opportunity.
To avoid the issue of disclosure of answer-related information to candidates, all copyright acknowledgements are reproduced online in the Cambridge International Examinations Copyright Acknowledgements Booklet. This is produced for each series of examinations and is freely available to download at www.cie.org.uk after the live examination series.
Cambridge International Examinations is part of the Cambridge Assessment Group. Cambridge Assessment is the brand name of University of Cambridge Local Examinations Syndicate (UCLES), which is itself a department of the University of Cambridge.
BLANK PAGE
Related Documents