CALLEGUAS CREEK WATERSHED HYDROLOGY STUDY Camarillo Moorpark Simi Valley Thousand Oaks Ventura County Public Works Agency Watershed Protection District March 2003 PRESENT CONDITION

Welcome message from author
This document is posted to help you gain knowledge. Please leave a comment to let me know what you think about it! Share it to your friends and learn new things together.
Transcript
CALLEGUAS CREEK WATERSHEDHYDROLOGY STUDY
Camarillo
Moorpark Simi Valley
Thousand Oaks
Ventura County Public Works AgencyWatershed Protection DistrictMarch 2003
PRESENT CONDITION
CALLEGUAS CREEK WATERSHEDHYDROLOGY STUDY
Ventura County Public Works AgencyWatershed Protection District
March 2003
PRESENT CONDITION
ACKNOWLEDGEMENTS
This report represents the combined effort of a large number of agencies and individualswhose contributions are hereby gratefully acknowledged.
Supervisor Judy MikelsCalleguas Municipal Water DistrictUS Army Corps Of Engineers, Los Angeles DistrictCity of CamarilloCity of MoorparkCity of Simi ValleyCity of Thousand OaksCalleguas Creek Watershed Management Plan Participants
The following members of the Ventura County Watershed Protection District staff havebeen instrumental in the creation of this hydrologic report:
Scott Holder, Robin Jester, Hassan Kasraie, David Laak, Jayme Laber, Olga Ready,Louise Shi, Dolores Taylor, John Trone, Denny Tuan, Sergio Vargas
CALLEGUAS CREEK HYDROLOGY REPORT
TABLE OF CONTENTS
I. INTRODUCTION/HISTORY
A. Introduction 6
B. Historical Models 6
1. Modified Rational Hydrology Method Adoption 6
2. Figure 1 – Vicinity Map 7
3. NWS-Sacremento Model in Real-Time 8
4. COE HEC-1 Model Update 8
5. HSPF Calibration Model 9
II. METHODS AND TECHNIQUES
A Modified Rational Hydrology Model-VCRAT Computer Model 10
C. Model Applications 11
D. Areal Reduction 11
E. User friendly tables 11
F. Figure 6 – AR Curve for Calleguas Mainstem above Conejo Creek 12
G. Figure 7 – AR Curve for Calleguas Mainstem below Conejo Creek 13
H. Figure 8 - AR Curve for Conejo Creek 14
I. Figure 9 - AR Curve for Revolon Slough 15
J. GIS and Calleguas Creek Hydrology Model 16

III. DESCRIPTION OF STUDY AREA
A. Location 17
1. Simi Valley 17
2. Moorpark 17
3. Camarillo 18
4. Thousand Oaks 18
5. Santa Rosa Valley 19
B. Soils Classification 20
C. Land Use 20
D. Climatology 21
E. Runoff Characteristics 21
F. Table 2 – 36 Year Mean Annual Precipitation 22
IV. Study Results 23
A. Calculated and Estimated Peak Flows 23

FINAL
CALLEGUAS CREEK HYDROLOGY REPORT
SECTION I
INTRODUCTION/HISTORY
Calleguas Creek drains an area of approximately 343 square miles, predominantly insouthern Ventura County and outlets into the Pacific Ocean at Mugu Lagoon. The watershedincludes Arroyo Conejo, Conejo Creek, Arroyo Santa Rosa, Arroyo Simi, Arroyo Las Posas,and Calleguas Creek, as well as Revolon Slough and Mugu Lagoon. The Santa SusanaMountains, South Mountain, and Oak Ridge Mountains form the northern boundary of thewatershed. The Simi Hills and Santa Monica Mountains distinguish the southern boundary(See Fig. 1).
HISTORICAL MODELS
The Calleguas Creek Watershed has been modeled several times since the early 1960’s. Thefirst study by Boyle Engineering used the older Soil Conservation Service (SCS) methodwhich was limited by the allowable rainfall intensities. Typically, the maximum intensitywas about 2-inches per hour. Recording raingage records for Ventura County indicatedmuch higher values, which were as high as 5-inches per hour for short duration times.Because valuable background information on each sub-watershed had been calculated whichincluded weighted CN value, 12-hours design precipitation, and aerial reduced rainfall, thereport was used by Ventura County Flood Control District (DISTRICT) staff for ruralwatersheds until 1985.
MODIFIED RATIONAL HYDROLOGY METHOD ADOPTION
Beginning in 1970, when a comparison of DISTRICT flowrates with Los Angeles PublicWorks (LAPW) design flows indicated much lower values at the border between us, theDISTRICT adopted the Modified Rational Method for all Design Hydrology. Hydrologistsfrom LAPW trained DISTRICT hydrologists in the computer model developed by them.Using the newest Soil Survey Report completed by the SCS for Ventura County in 1970, thesoils of Ventura County were carefully divided into seven hydrologic soils with loss ratesvarying from one-quarter of an inch per hour to over two inches per hour in beach sand.Staff, working closely with consultants such as Koebig and Koebig and Toups Corporation(now called Hawks and Associates) jointly developed Master Drainage Plans. Included forthe City of Thousand Oaks were all major and minor tributaries to Arroyo Conejo from theheadwaters in Lang Ranch to the final junction of North Fork Arroyo Conejo at Hill Canyonwhere the channel changes name to Conejo Creek prior to junction with Arroyo Santa Rosa.In Simi Valley the entire watershed was modeled from the headwaters by Rocky Peak toAlamos Canyon junction on the Arroyo Simi downstream of Madera Road. For City of

Sa
nta
Ba
rba
ra C
o.
Pacific Ocean
Los Angeles C
o.
Calleguas CreekWatershed Boundary
SA N TA
CLA RA RIV E R
SA N TA
CLA RA RIV E R
A RROY O SIMI
A RROY O SIMI
DR
Y C
AN
YO
N
DR
Y C
AN
YO
N
CA
LLEG
UAS C
REEK
CA
LLEG
UAS C
REEK
LA NG CREEK
LA NG CREEK
MUGU
DRA
IN
MUGU
DRA
IN
SES
PE CR
E EK
SES
PE CR
E EK
PO
LE
CR
EEK
PO
LE
CR
EEK
BEARD
SL EY
BEARD
SL EY
AR
R
OYO CONEJO
AR
R
OYO CONEJO
MA TILIJA CREEK
MA TILIJA CREEK
CUY
AM
A R
IVER
CUY
AM
A R
IVER
ELLSW
OR
TH B
AR
RA
NCA
ELLSW
OR
TH B
AR
RA
NCA
LOCK WOOD CREEK
LOCK WOOD CREEK
AD
AM
S B
AR
RA
NC
A
AD
AM
S B
AR
RA
NC
A
BOU
LD
ER CR
EEK
BOU
LD
ER CR
EEK
AL AMOS CA N YON
AL AMOS CA N YON
AMAR
GO
SA
CR
EE
K
AMAR
GO
SA
CR
EE
K
FOX
BA
R
RANCA
FOX
BA
R
RANCA
O
LEAR
Y C
RE
EK
O
LEAR
Y C
RE
EK
BEAR
CRE
EK
BEAR
CRE
EK
LAS
LL
A JAS C
ANY ON
LAS
LL
A JAS C
ANY ON
RIC
E RO
AD
DR
AIN
RIC
E RO
AD
DR
AIN
BEA
RT
RA
P C
REE
K
BEA
RT
RA
P C
REE
K
TR
IPA
S CA NYO
N
TR
IPA
S CA NYO
N
H
A PPY CAMP C ANY ON
H
A PPY CAMP C ANY ON
CH
IVO CANY ON
CH
IVO CANY ON
DORIS DRAINDORIS DRAIN
WIN DM
ILL
CA NY ON
WIN DM
ILL
CA NY ON
NORTH F
OR
K LOCKW
OOD CREEK
NORTH F
OR
K LOCKW
OOD CREEK
MA
HA
N B
AR
RA
NC
A
MA
HA
N B
AR
RA
NC
A
HA
LL C
AN
YO
NH
ALL
CA
NY
ON
FA
GA
N C
AN
YO
N
FA
GA
N C
AN
YO
N
L AS P
OS
AS
DR
AIN
L AS P
OS
AS
DR
AIN
STAUFER CREEK
STAUFER CREEK
CAMA RI LLO HILLS DRA IN
CAMA RI LLO HILLS DRA IN
EA ST FORK SEYMOUR C
RE
EK
EA ST FORK SEYMOUR C
RE
EK
HOLSER CANYONHOLSER CANYON
MIL
LIG
AN
BA
RR
AN
CA
MIL
LIG
AN
BA
RR
AN
CA
NORTH FORK A RROY O CON EJONORTH FORK A RROY O CON EJO
BA
RL
OW
BA
RR
AN
CA
BA
RL
OW
BA
RR
AN
CA
J S
TR
EE
T D
RA
INJ
ST
RE
ET
DR
AIN
CLARK BARRANC
A
CLARK BARRANC
A HU
NT
WA
SH
HU
NT
WA
SH
MANUEL C AN YONMANUEL C AN YON
ER
RIN
GE
R D
RA
IN
ER
RIN
GE
R D
RA
IN
ME
IER
CA
NY
ON
ME
IER
CA
NY
ON
BA
SO
LO
DIT
CH
BA
SO
LO
DIT
CH
CO
NEJO
CR
EE
K
CO
NEJO
CR
EE
K
COY OT
E CREEK
COY OT
E CREEK
SANTA ROSA
SANTA ROSA
AL
AMO
S
CAN Y ON
AL
AMO
S
CAN Y ON
VENTURA FW
PA
CI FI C
C O A ST HW
O x n a r dO x n a r dT h o u s a n d O a k sT h o u s a n d O a k s
S i m i V a l l e yS i m i V a l l e y
C a m a r i l l oC a m a r i l l o
S a n B u e n a v e n t u r aS a n B u e n a v e n t u r a
O j a iO j a i
S a n t a P a u l aS a n t a P a u l a
P o r t H u e n e m eP o r t H u e n e m e
F i l l m o r eF i l l m o r e
M o o r p a r kM o o r p a r k
0 73.5 Miles
Calleguas Creek Figure 1Vicinity Map VCFCD Redline Channels
Major Roads
Cities
Calleguas Creek Watershed Boundary

FINAL
Camarillo, their entire Sphere of Influence was included. All of these Master Drainage Plansinclude maps of existing facilities at the time of the study as well as proposed improvementsto the drainage system for each area. DISTRICT engineers and hydrologists modeled manyother areas within the Calleguas Watershed.
NWS-SACRAMENTO MODEL IN REAL-TIME
As a result of damages to Point Mugu Naval Air Station, caused by the Calleguas CreekLevee failure in February 1980, the Navy signed an agreement with the DISTRICT and theNational Weather Service (NWS) to provide flood-warning to the base from both CalleguasCreek and Revolon Slough. The DISTRICT installed rain and streamgages purchased by theNavy and Real-time models using streamgage records from the gage at Camarillo StateHospital (now California State University at Channel Islands) were calibrated by the NWS.These models, with minor calibration, have been running for 20 years with varying resultsdepending on the saturation of the watershed. The wetter the ground, the better theprediction of flood peaks will be when applying the forecast rain. As a result of this earlierin the storm season, the results are not as accurate. Another compounding factor at thebeginning of each water year is that upstream waste water treatment plant effluent keeps thelow flow channel of the stream wet while the surrounding area can be very dry.
In the El Nino year 1983, record peaks were recorded at each of the Calleguas CreekWatershed streamgages. For the twenty years prior to these record-breaking peak discharges,urbanization with accompanying channelization concentrated flows much quicker and withconsiderably more volume of flow.
Another factor affecting the volume of runoff occurred with the availability of better qualitywater imported from northern California. Distributed by the Calleguas Municipal WaterDistrict, widespread use of the better tasting water meant that local wells no longer werepumped. Within a relative short time of average to above average water years, a risingground water problem impacted industry within the Easy Street neighborhood of the City ofSimi Valley, causing concern. The City responded by drilling five de-watering wells torelieve the pressure and discharged into tributary channels. Consequently, the Arroyo Simi,which used to be dry most of the year, now has perennial flow that encourages growth ofplants.
COE HEC-1 MODEL UPDATE
Because of the damages experienced along the Calleguas Creek, DISTRICT staff convincedthe Army Corps of Engineers (COE) to restudy the Hydrology to supercede their earlier workof the 1970’s. In several cases, the future percent imperviousness used in the earlier studyhad been exceeded. The result of that re-study which included evaluation of streamgagerecords and regional skew study was published in 1987. The peak discharges published werethe values used for project design, whether developer funded or government projects.

FINAL
In 1989, Simons-Li, requested Present and Future Design Flowrates for many points alongCalleguas Creek for use in sediment transport study. The 1987 COE study furnished fewerlocations and no hydrographs since the values were impacted by the frequency curves ofstreamgages within the watershed. DISTRICT staff adopted the COE parameters includingthe routing parameters but applied Modified Rational Design Rainfall to aid in hydrographtiming with Master Drainage Plan flows junctioning with the main channel. The results atcommon points of concentration were amazingly close to the adopted COE values. A reportwas never published but copies of the model output and summary sheets were widelydistributed to cities, developers, and flood control designers.
HSPF CALIBRATION MODEL
The DISTRICT, in an effort to improve and expand it’s technical procedures, is exploring theuse of continuous watershed simulation as a tool for fulfilling its flood control, waterresource management, and water quality management obligations. A pilot study to evaluatethe use of the U.S. EPA Hydrologic Simulation Program -FORTRAN (HSPF) (Bicknell etal., 1997; 2001) as a management tool for comprehensive watershed assessment within theclimatic, physiographic, and topographic conditions of Ventura County was initiated in 2001by Aqua Terra Consultants. The objective of the pilot study is to setup, calibrate, and validateHSPF to the Arroyo Simi watershed within the Calleguas Creek basin of Ventura County for‘current/recent’ hydrologic conditions, and then evaluate the use of the information availablefrom the model on flow-duration, flood-peak analysis, flow velocity distributions, bed/bankshear stress calculations, etc. for assessing flood control facilities and streambed/bankprotection efforts. Ultimately, the model may be extended and expanded to assess erosionand flooding issues within the entire Calleguas Creek basin to help evaluate potentialremediation alternatives for Mugu Lagoon.
HSPF is a comprehensive watershed model of hydrology and water quality, that includesmodeling of both land surface and subsurface hydrologic and water quality processes, linkedand closely integrated with corresponding stream and reservoir processes. It is the premiermodel currently available for comprehensive watershed assessments. HSPF has enjoyedwidespread usage and acceptance, since its initial release in 1980, as demonstrated throughhundreds of applications across the U.S. and abroad. HSPF is jointly supported andmaintained by both the U.S. EPA and the USGS, a rare occurrence where two federalagencies agree on support of a single modeling system. In addition, HSPF is the primarywatershed model included in the EPA BASINS modeling system and it has recently beenincorporated into the U.S. Army Corps of Engineers Watershed Modeling System (WMS).This widespread usage and support has helped to ensure the continuing availability andmaintenance of the code for two decades, in spite of varying federal priorities and budgetrestrictions. HSPF is currently being used for watershed studies in Minnesota, WashingtonState, Oregon, Australia, Kentucky, South Carolina, Nevada, and Florida.

FINAL
SECTION II
METHODS AND TECHNIQUES
MODIFIED RATIONAL HYDROLOGY MODEL -VCRAT COMPUTER MODEL
In 1997, it was decided to develop a complete watershed model of the Calleguas, includingRevolon Slough, using the Modified Rational Method. Sub-watersheds were carefullydigitized; while the imperviousness was compared to the latest aerial photos, and routingreaches were measured from Rocky Peak to Mugu Lagoon. Wherever improvements existed,the as-built slope and channel configuration was coded into the model. The majority of thesub-areas are less than 100 acres, but in some rural areas, larger sub-areas seemedappropriate. For each subarea, the input has the following parameters:
• area in acres,• time of concentration in minutes,• percent effective imperviousness,• hydrologic soil type, and• Rainfall zone with storm frequency.
The Ventura County Modified Rational Method (VCRAT) version 2.2 was utilized for thestudy analysis. This method was originally developed by the Los Angeles County FloodControl District (LACFCD) and was adopted by the Ventura County Flood Control District(VCFCD) in 1975 with some modifications to reflect the local runoff conditions. Forexample, the collector street for Ventura County is a 40-feet wide street with eight inch curbswhereas the County of Los Angles uses a 36 feet wide street with wider gutter and 8-inchcurbs. The two methods differ also in that the VCFCD version was based upon a family ofsoil types using loss rates from 0.25-inches per hour to 2-inches per hour; whereas theLACFCD model was based on infiltration tests. A more detailed description of the VCRATmodel is furnished in an excerpt from the 1991 VCFCD Hydrology Manual included inAppendix 1.
The computer program produces a 200-point hydrograph for each sub-area, which it adds tothe next area downstream. In this way it accounts for changes in Times of Concentrationbetween subareas. Channel storage from routing point to routing point also is accounted for,treating each reach as if it were a reservoir. Timing at junctions between two laterals or themain channel and a lateral can be requested to help in doing hydraulic analysis.
In the current hydrology study update, the VCRAT runoff simulation model (with detentionbasins included) was used to determine 100-year peak discharges. The detention basins weredesigned to attenuate the 100-year peak flows to a value that closely matched the pre-development condition or to reduce flows to values that would not exceed the capacity of thedownstream improvements where possible. Computer input and output and calculationresults for Calleguas Creek and its tributaries are included in Appendix 2a and 2b. The

FINAL
computer input and output for Revolon Slough and its tributaries are included in Appendix 3aand 3b.
MODEL APPLICATIONS
The study area is divided into two separate watersheds for modeling purposes. Model 1represents all tributaries to and including Calleguas Creek. Model 2 represents all tributariesto and including Revolon Slough. The latter has complete hydrology for 10-yr, 50-yr and100-yr storms compared to only 100-year for the Calleguas. For the former, actualmultipliers from real stream gage records analysis produced 2, 5, 10, 50, and 500-yearpresent condition flowrates. Table 1 lists every important concentration point to accuratelydetermine cumulative flows along every tributary and main channel. For individual subareaflows, the actual Modified Rational output printouts contained in Appendix 2b and 3b shouldbe used.
Research of available data from previous studies, GIS analysis, and field inspections wereused as the main data sources to determine site parameters, street flow configuration, anddrainage patterns.
AREAL REDUCTION
One of the most important factors in completing such a large-scale model is to account forthe decreased intensity over such a large area. The COE, SCS, and other hydrologic modelershave long recognized the difference between Point Rainfall and Areal Precipitation.Examination of recording rain gage charts for a given storm shows a pattern of shifted highintensity with time to reflect the passage of bands of rain across or up the valley of awatershed for most severe winter storms. In August 1966, the DISTRICT adopted the firstHYDROLOGY MANUAL, which included an aerial reduction curve for Calleguas Creekindicating decrease in rainfall intensity for watershed area. This same curve is contained inthe Ventura County Modified Rational Method computer model. To develop a curve ofreduced design flowrates for larger areas, the computer was instructed to recycle at variouspoints along the main channel and each major tributary. The resulting values of reducedpeak outflow at these recycling points were divided by the unaerial-reduced peak flows toproduce an Aerial Reduction Factor (ARF). Each of these values was plotted along majortributaries as well as along the main channel with area in thousands of acres as the abscissaand the ARF or peak reduction factor as ordinates. See Figures 6 – 9 or ARF curves.
USER FRIENDLY TABLES
To aid the user of this complex model, a matrix of flowrates versus key points is included inTable 1. For any location, the cumulative drainage area is listed, the model ID number andletter, the present condition 100-year flow without aerial reduction, the aerial reduction factorfrom the curve, and the reduced flowrate. In addition, peak flows for other frequencies arelisted. 50-year, 10-year, 5-year and 2-year peaks are from multipliers derived fromstreamgage frequency analysis of annual peaks.

Figure 6
Calleguas Creek Mainstem and Major Tributaries above Confluence with Conejo Creek Flow Reduction Curve
0
0.1
0.2
0.3
0.4
0.5
0.6
0.7
0.8
0.9
1
0
10,000
20,000
30,000
40,000
50,000
60,000
70,000
80,000
90,000
100,000
110,000
Area (Acres)
Flow
Red
uctio
n Fa
ctor
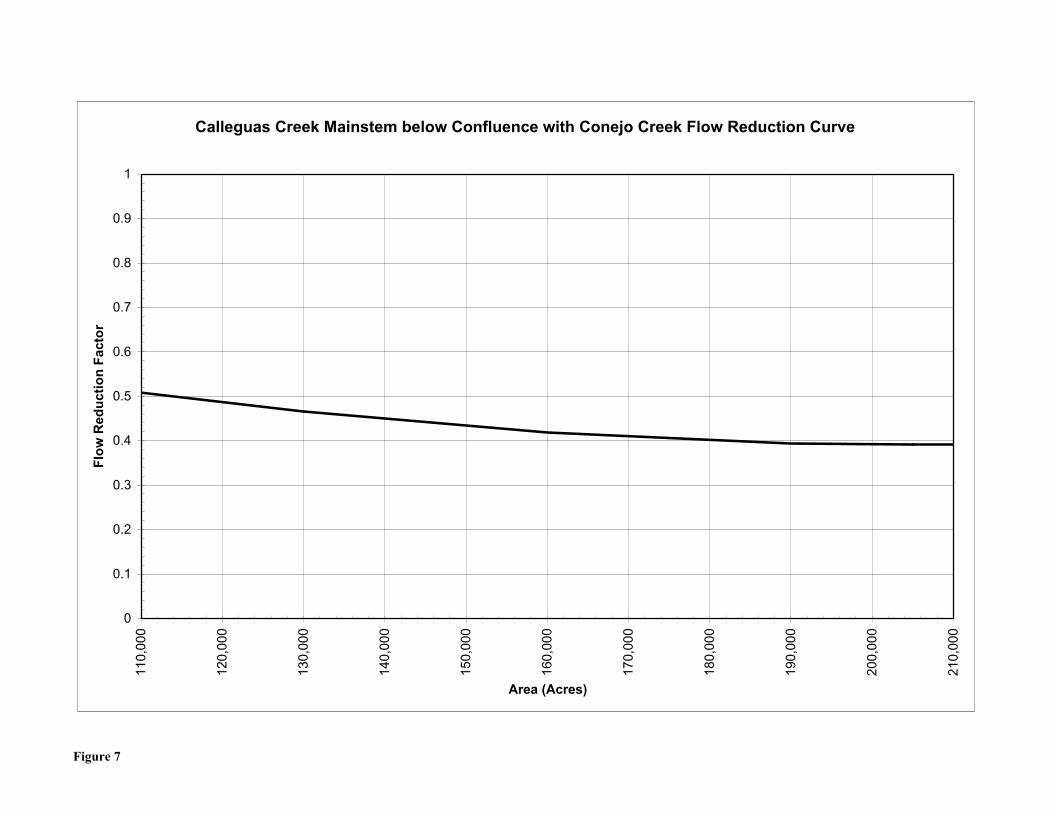
Figure 7
Calleguas Creek Mainstem below Confluence with Conejo Creek Flow Reduction Curve
0
0.1
0.2
0.3
0.4
0.5
0.6
0.7
0.8
0.9
1
110,000
120,000
130,000
140,000
150,000
160,000
170,000
180,000
190,000
200,000
210,000
Area (Acres)
Flow
Red
uctio
n Fa
ctor
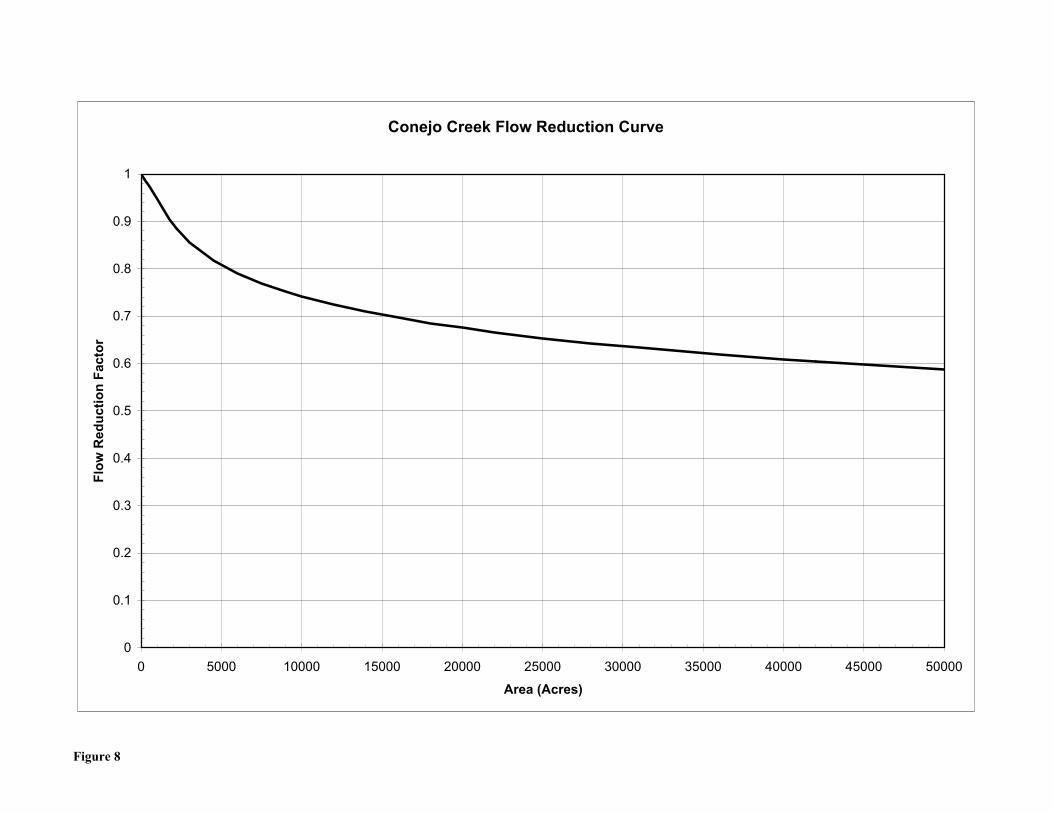
Figure 8
Conejo Creek Flow Reduction Curve
0
0.1
0.2
0.3
0.4
0.5
0.6
0.7
0.8
0.9
1
0 5000 10000 15000 20000 25000 30000 35000 40000 45000 50000
Area (Acres)
Flow
Red
uctio
n Fa
ctor
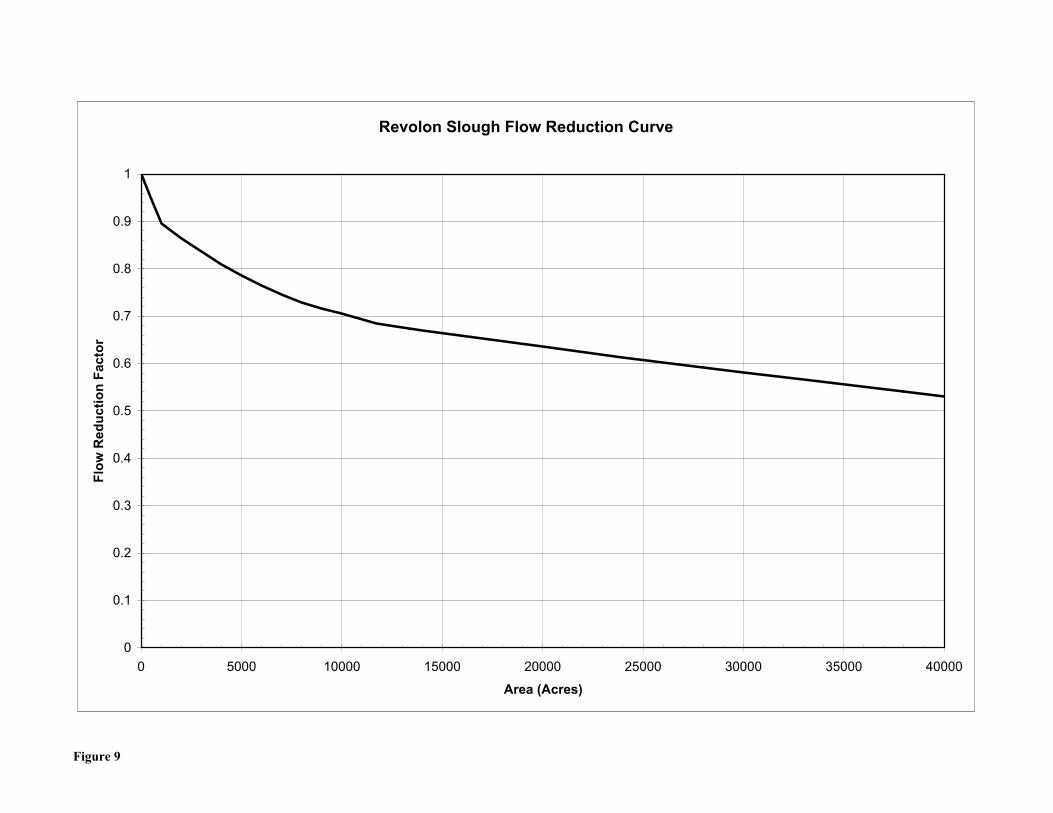
Figure 9
Revolon Slough Flow Reduction Curve
0
0.1
0.2
0.3
0.4
0.5
0.6
0.7
0.8
0.9
1
0 5000 10000 15000 20000 25000 30000 35000 40000
Area (Acres)
Flow
Red
uctio
n Fa
ctor

FINAL
GIS AND THE CALLEGUAS CREEK HYDROLOGY MODEL
The current hydrologic study of the Calleguas Creek Watershed has been significantly aidedby the use of a Geographic Information System (GIS). The County of Ventura and the FloodControl Department have a very sophisticated GIS set up that allows desktop access to awide array of geographic data.
A GIS is mapping software that links information about “where things are” with informationabout “what things are like”. Unlike with a paper map, where "what you see is what youget," a GIS map can combine many layers of information.
For this particular study the GIS layers that were utilized included: Hydrologic soils type, 3-D topography, streams and rivers, Flood Control facilities, aerial photography, parcel lotlines, major hydrologic drainage areas and very detailed subarea boundaries matching orcorrecting those of the VCRAT input model.
GIS helped to accurately and quickly populate the VCRAT hydrologic model inputparameters for each subarea. The April 2000 detailed aerial photography was used todetermine proper percent imperviousness factors, and for locating drainage patterns andcurrent land use.
Topographic contour data was used to calculate accurate slopes of the main flowpaths. Thestreams and rivers layer helped in verifying channel location and routing order while theexisting Flood Control facilities layer was used to verify proper channel type designation andthe physical dimensions of all channels in the study area.
To determine the proper soil type for each subarea, a simple “cookie cutting” process wasused. This resulted in a very accurate percentage of each soil type contained in each subarea.A weighted average was then input into the model.
The parcel lot line layer and street centerline layer were used as guides when adjustingsubarea boundaries that happened to fall on housing tracts or developments.GIS was a perfect tool for this hydrologic study. From instantaneous and extremely accuratesubarea acreage calculations, to quick and easy subarea boundary editing, to presentationquality map production, it proved to be invaluable.
FINAL
SECTION III
DESCRIPTION OF STUDY AREAFor Detailed Aerial Photos of Entire Watershed see Fig.2A-2D
LOCATION
SIMI VALLEY
The City of Simi Valley is located in the southeastern portion of Ventura Countyimmediately adjacent to Los Angeles County. The developed portions of the City of SimiValley are situated primarily on the valley floor with many proposed developments extendingup the alluvial fans coming out of canyons. The valley is defined by the Santa SusannaMountains on the north and east and by the Simi Hills on the south. The Santa SusannaMountains separate the Simi Valley from the Santa Clara River Valley and Towns ofFillmore and Piru to the north. The Simi Hills separate the valley from the city of ThousandOaks to the southwest, and Moorpark Sphere of Influence separates the western limit.
The major drainage course through the valley is the Arroyo Simi. This major channel drainsfrom the extreme limits of the watershed in the east and northeast, then westerly through theLas Posas Valley (as Arroyo Las Posas) to the Oxnard Plain (as Calleguas Creek) and thePacific Ocean.
Tributaries to Arroyo Simi from the Santa Susanna Mountains on the north are, from west toeast, Alamos Canyon, Brea Canyon, North Simi Drain, Dry Canyon, Tapo Canyon, ChivoCanyon and Las Llajas Canyon. Canyons draining the Simi Hills from the south areSycamore Canyon, Bus Canyon, Erringer Road Drain, Runkle Canyon, Meier Canyon andfinally Black Canyon in Santa Susanna area.
MOORPARK
Moorpark Sphere of Influence comprises the drainage area tributary to Arroyo Simi from thejunction with Canyon Number 2 on the east and Walnut-Gabbert Canyon on the west. Itincludes Peach Hill Wash, Castro Williams Drain, Happy Camp Canyon, Strathearn Canyonand other smaller unnamed watersheds.
In the urbanized area of the City of Moorpark, Gabbert and Walnut Canyon contain severalreaches of improved concrete flood control channels that provide some flood protection forthe City of Moorpark. While some reaches and crossings are undersized for today’s modern

FINAL
Design Flowrates, these facilities collect and convey storm runoff to the Arroyo Simi.Currently, a large portion of the Walnut-Gabbert watershed is not developed; however, thereare planning efforts for private development on a significant portion of this area. The channelsystems provide some flood protection benefit through an east to west channel alignment,which results in intercepting the drainage from the mouth of several large tributary canyons.
Existing stormwater detention facilities within Peach Hill Wash and Gabbert Canyon are theprincipal elements in a detention oriented approach for flood control, providing peak flowreduction based on temporary storage of the runoff volume. There are several basin siteshave been selected for detailed evaluation at various locations within the watershed afterperforming feasibility screening of numerous alternatives.
CAMARILLO
The City of Camarillo is situated at the northeastern corner of the Oxnard Plain. Thewatershed of the city expanded on two major drainage courses: Calleguas Creek and RevolonSlough. The study area that drains to Calleguas Creek includes the easterly portion of theCamarillo Hills, south facing slopes of the Las Posas Hills, and Conejo Mountain andcontains slopes ranging from five percent to 30 percent. Somis Drain, Saint John’s Drain,and Lewis Road Drain under DISTRICT jurisdiction all drain to Calleguas Creek. Regularmaintenance is performed on St. John’s Debris Basin east of the St. John Seminary.
The majority of the Camarillo Hills south facing slopes drains to tributaries of CamarilloHills Drain that eventually junctions with Revolon Slough to the west. There are severalnetworks of regional facilities under the jurisdiction of the DISTRICT. Most of these consistof open channels, both lined and unlined, except collector drains in closed conduits. Movingfrom west to east tributaries to Camarillo Hills Drain includes Crestview Drain, EdgemoreDrain, West Camarillo Hills Drain, Mission Drain, and Ponderosa Drain. Coming from theLas Posas Estates area and Spanish Hill's drainage are Ramona Place Drain and Las PosasEstates Drain which is split 60 percent of runoff going to Beardsley Wash and the other 40percent of the flow goes to Camarillo Hills Drain west of the Camarillo Airport. To preventhillside slope erosion entering the improved channels and lowering flow capacity, severaldebris basins are constructed in the upstream canyons. Regular maintenance is done on WestCamarillo Hills West Branch Debris Basin, West Camarillo Hills East Branch Debris Basin,and Edgemore Debris Basin.
THOUSAND OAKS
Thousand Oaks study area is situated primarily within the watershed of the Arroyo Conejo,including Newbury Park, portions of Westlake Village, and nearly the entire city ofThousand Oaks. The developed portions of the city are situated primarily on the ConejoValley floor and on slopes less than 25%.
The major drainage course through the City is the Arroyo Conejo. Major tributaries goingfrom west to east includes South Branch Arroyo Conejo and North Fork Arroyo Conejo.

FINAL
Each of these main tributaries contains large sub-watersheds. Included in South BranchArroyo Conejo is Conejo Mountain Creek, Newbury Park Drain Numbers One and NewburyPark Drain Number Two. The South Branch Arroyo Conejo is a large part of the city, and themany studies on the watershed and its tributaries were done to update the 1990 FEMAhydrology. The DISTRICT requires that all new developments in the watershed provideflood detention to reduce downstream the 100-year flood peaks. The numerous detentionbasins that have been required by the VCFCD resulted in substantially reduced peak flowsand reduction of areas subject to the 100-year flooding. Several detention dams and debrisbasins receive regular maintenance on this important rapidly developing watershed. Theyinclude Arroyo Conejo South Branch West Tributary Debris/Detention Basin, ConejoMountain Creek Upper Debris Basin and Conejo Mountain Creek at BaselineDebris/Detention Basin, and South Branch Arroyo Conejo Debris Basin.
Major Tributaries to North Fork Arroyo Conejo, from west to east are Olsen Channel,Waverly Channel, Castano Channel and Castano Tributary. All of this area upstream is verydeveloped but much of the impact of that urbanization is mitigated when all the improveddrains join to meander through Wildwood Park. Draining directly to Arroyo Conejo areLang Creek, Thousand Oaks North Drain, Erbes Road Drain, and Skeleton Canyon. LangCreek Detention/Debris Dam is under construction and will mitigate the increased flowsfrom Lang Ranch developments.
Not included in Conejo Creek drainage are south and eastern portions of the City includingthe Westlake Village that drain into Los Angeles County via Potrero Creek and SchoolhouseCanyon.
SANTA ROSA VALLEY
The Santa Rosa Valley is located approximately 6 miles east of the City of Camarillo. It islimited on the north by Las Posas Hills; on the south by the Mountclef Ridge; on the east bythe Tierra Rejada Valley upstream of Highway 23 and on the west by the original grant lineof Rancho Calleguas.
The Arroyo Santa Rosa headwaters begins in the Tierra Rejada Valley upstream of Highway23 where the natural channel is called Tierra Rejada Creek. At the mouth of the TierraRejada Valley, the channel is called Arroyo Santa Rosa that traverses in a general east towest direction to its confluence with Conejo Creek. A large tributary coming fromNorwegian Grade and east of Moorpark Road is Arroyo Santa Rosa Tributary that runsparallel to Santa Rosa Road and crosses it twice. Increased flows due to development aresomewhat mitigated by the Santa Rosa Road Debris Basin constructed in 1957 by the SoilConservation Service, however the lack of an adequate improved channel downstream of thebasin results in the generation of a large floodplain. The Tributary junctions to Arroyo SantaRosa downstream of Honey Hill Drive. Steep slopes descending from the hills north andsouth, and moderate prevailing slope from east to west characterize the area. Considerableurbanization has occurred in past ten years of very large single family homes; many withhorses, tennis courts, and swimming pools.

FINAL
SOILS CLASSIFICATION
The characteristics of the soils in the study area are another major factor affecting the rate ofrunoff and subsequent planning of storm drain facilities. The 1970 Soil Conservation ServiceSoil Survey of Ventura Area, California delineated many distinct soil types that werecarefully divided into seven hydrologic soils from a set of maps covering the south half ofVentura County. Based on several soil properties, especially loss rate, the runoff potential iscalculated as a function of applied rainfall intensity minus loss. Since the Design Stormsassume three prior days of wetting with lesser storms followed by a fourth day withmaximum design intensities, the loss rate is considered constant.
Group A (Soil Type 6 and 7): Soils have a high infiltration rate (1.5 to 2.0 inches per hoursrespectively) when thoroughly wetted; chiefly deep, well drained to excessively drainedsand, gravel or both. Rate of water transmission is high; thus, runoff potential is low.Group B (Soil Type 4 and 5): Soils have moderate infiltration rate (0.75 to 1.0 inches perhours respectively) when thoroughly wetted; chiefly soils that are moderately deep to deep,moderately well drained to well drained, and moderately coarse textured. Rate of watertransmission is moderate.
Group C (Soil Type 2 and 3): Soils have slow infiltration rate (0.4 to 0.5 inches per hourrespectively) when thoroughly wetted; chiefly soils that have a layer impeding downwardmovement of water, or moderately fine textured soils that have slow infiltration when dry.Rate of water transmission is low.
Group D (Soil Type 1): Soils have a very low infiltration rate (0.25 inches per hour) whenwetted. They are chiefly clays that have a high shrink-swell potential, soils that have a highpermanent water table, soils that have a claypan clay layer at or near the surface, or soils thatare shallow over nearly impervious material. Rate of transmission is very slow; thus, runoffpotential is very high.
Figures 3A-3D depict the distribution of various soil types within the study area.
LAND USE
Land use is a significant factor in the study since Time of Concentration and PercentEffective Imperviousness are most important parameters for developing a runoff model.“Existing” land use (including recently as-built developments or projects under construction)is considered in this study. (See Figure 4A-4D) For the future land use assumptions themodel will incorporate the following: The specific cities General Plans, previous smallerscale hydrologic studies, Ventura County Land Use GIS coverage from the SouthernCalifornia Association of Governments (1997) and any updates. The Present ConditionModel completed in this report is governed by careful analysis of Year 2000 aerialphotography. However, a Future Condition Model has been hampered by the inability thus
FINAL
far for city planners to agree on a simple set of land uses to which effective imperviousnesscan be applied. Once agreement is reached, a Future Condition Model can be produced inless than one year.
CLIMATOLOGY
The Calleguas Creek watershed is a temperate Mediterranean Climate regime with mildtemperatures with little variation in temperature extremes. For example, wintertimetemperatures in a normal January would show the Average Maximum Temperature withinCalleguas Watershed ranges from the low 60’s to the high 60’s degrees Fahrenheit. ForAverage Minimum Temperature most areas range from the low 40’s inland to the upper 40’snear the coast. Freezing temperatures (below 32 degrees Fahrenheit) usually occurs betweenDecember and February but only for a few hours and mainly in the Eastern part of thewatershed. In summertime there is more variation between the Eastern part of the watershedespecially for Average Maximum Temperature in July. Where the coastal area averageshighs in the low 70’s degrees Fahrenheit, Thousand Oaks and Simi Valley are upper 80’sdegrees Fahrenheit. It is not uncommon for “Santa Ana” wind events to have maximumtemperatures within the watershed in the mid 90’s or higher at any time of year, but mostoften occur during late September through December.
The summers are generally long and dry, with rain seldom occurring in May through August.Quite often if the fall months are wet, the winter following will be drier than normal. Anormal year (Base Period of 1957 to 1992) has 73% of the annual rainfall between Decemberand March. Snowfall is very rare. Mean annual precipitation is between 12 inches on theOxnard Plain near Point Mugu to 21 inches in the higher elevations of Tapo Canyon with aweighted average of 15 inches per year (See Table 2, 36-Year Mean Annual PrecipitationTable). Major winter storms generally originate over the Pacific Ocean as a result of theinteraction between Polar Pacific and Tropical Pacific air masses that move eastward acrossthe basin. These storms often last several days, and are accompanied by heavy precipitation.The other type storms that can cause damage are “Pineapple Connection” storms where acold Winter Upper Level Low pressure center collides with a warm and very wet SubtropicalJet Stream originating out of the Hawaiian Islands area. Both types of storms create aSouthwesterly flow that enhances the orographic effect of rainfall on the watershed.
RUNOFF CHARACTERISTICS
Undeveloped areas of Calleguas Creek Watershed comprise approximately 39 percent of thetotal area where some of the rainfall is intercepted by vegetation and evaporates, and somepercolates into the ground resulting in relatively minor amounts of storm runoff except invery large storms. Other open areas, such as agricultural operations, parks, and golf coursescontain some imperviousness for haul roads, parking lots, and associated buildings butrainfall has a chance to run across the cultivated furrows or grass in the fairway to percolate.The result is low to moderate runoff depending on the intensity of the rainfall. As

Table 2
Oct. Nov. Dec. Jan. Feb. Mar. Apr. May June July Aug. Sept.
3 Camarillo-Springfield Ranch34:12:17
119:04:04 0.30 1.81 1.66 2.68 2.97 2.37 0.77 0.09 0.03 0.01 0.06 0.25 12.98
49 Santa Rosa Valley-Worthington Ranch34:14:54
118:56:25 0.38 1.97 1.81 2.87 2.93 2.54 0.94 0.11 0.02 0.01 0.06 0.26 13.9
128 Thousand Oaks - County Fire Station34:13:06
118:51:56 0.34 2.14 2.01 3.08 3.41 2.87 1.15 0.12 0.03 0.03 0.09 0.23 15.48
141 Moorpark - County Fire Station34:17:14
118:52:52 0.39 1.95 1.88 2.83 2.98 2.83 0.98 0.16 0.03 0.02 0.10 0.24 14.38
154 Simi - County Fire Station34:17:38
118:42:29 0.37 1.92 1.96 2.81 3.18 2.91 1.02 0.16 0.03 0.02 0.14 0.27 14.79
169 Thousand Oaks-Weather Station34:10:44
118:51:01 0.33 2.16 2.10 3.07 3.50 2.88 1.13 0.11 0.03 0.02 0.09 0.22 15.64
187 Susana Knolls-County Fire Station34:15:44
118:40:10 0.36 2.30 2.25 3.22 3.75 3.11 1.29 0.19 0.03 0.01 0.11 0.26 16.87
188 Newbury Park-County Fire Station34:11:10
118:55:45 0.33 1.93 1.97 3.06 3.21 2.87 0.90 0.12 0.02 0.01 0.06 0.22 14.71
189 Somis-Deboni34:17:05
119:04:20 0.37 1.95 2.06 3.15 3.49 2.94 1.04 0.12 0.03 0.01 0.06 0.28 15.5
190 Somis-Bard34:16:58
119:00:25 0.39 1.98 2.05 2.91 3.08 2.81 0.98 0.12 0.02 0.01 0.07 0.24 14.69
191 Moorpark-Downing Ranch34:19:34
118:53:42 0.48 2.33 2.26 3.43 3.68 3.21 1.11 0.18 0.04 0.02 0.11 0.26 17.11
192 Moorpark-Everett34:15:02
118:50:36 0.34 1.85 1.70 2.66 2.85 2.64 0.93 0.13 0.02 0.02 0.09 0.21 13.43
193 Santa Susana34:16:05
118:42:32 0.32 1.69 1.92 2.68 2.98 2.87 0.99 0.14 0.03 0.02 0.13 0.24 13.99
194 Camarillo-Adohr34:12:17
119:00:45 0.30 1.61 1.66 2.53 2.65 2.43 0.80 0.09 0.03 0.01 0.07 0.22 12.39
196 Tapo Canyon34:19:33
118:43:06 0.45 2.42 2.63 3.76 4.15 3.52 1.35 0.20 0.04 0.02 0.14 0.29 18.97
223 Point Mugu-USN34:06:46
119:07:10 0.26 1.59 1.51 2.50 2.82 2.12 0.79 0.08 0.03 0.01 0.07 0.34 12.11
Yearly Average Rainfall (in.) WY 1957-1992
Monthly Average Rainfall (in.) Based on data from WY 1957-1992Rain Gage # Gage Name Lat/Long

FINAL
urbanization occurs, roofs and paved surfaces cover substantial portions of the surface area,significant increases occur in the storm runoff with even small storms. Therefore, as thedensity of development increases the resultant increase in storm runoff creates the need fordrainage facilities to protect the valuable property from harm.
SECTION V
STUDY RESULTS
This report is intended to be used as a baseline condition for all communities within theCalleguas Creek Watershed for planning purposes. The information included in this reportwas derived from a model of present conditions and should not be used for design of futurechannels or improvements. Flowrates can be used to update Flood Insurance Rate Maps, toevaluate the need for detention from impact of new project flows, and to perform deficiencystudies of existing facilities. Since the modified rational computer program computes ahydrograph for each subarea, junction analysis for every lateral drain, and performs storagerouting within each reach, the output reflects a complex model not a simple peak producingcalculation. Input can be modified to evaluate the impact of any channelization, detentionbasin or diversion prior to final design of a project. The second volume of this report will beto produce a design condition hydrology applying proposed future development andproposed improvement projects.
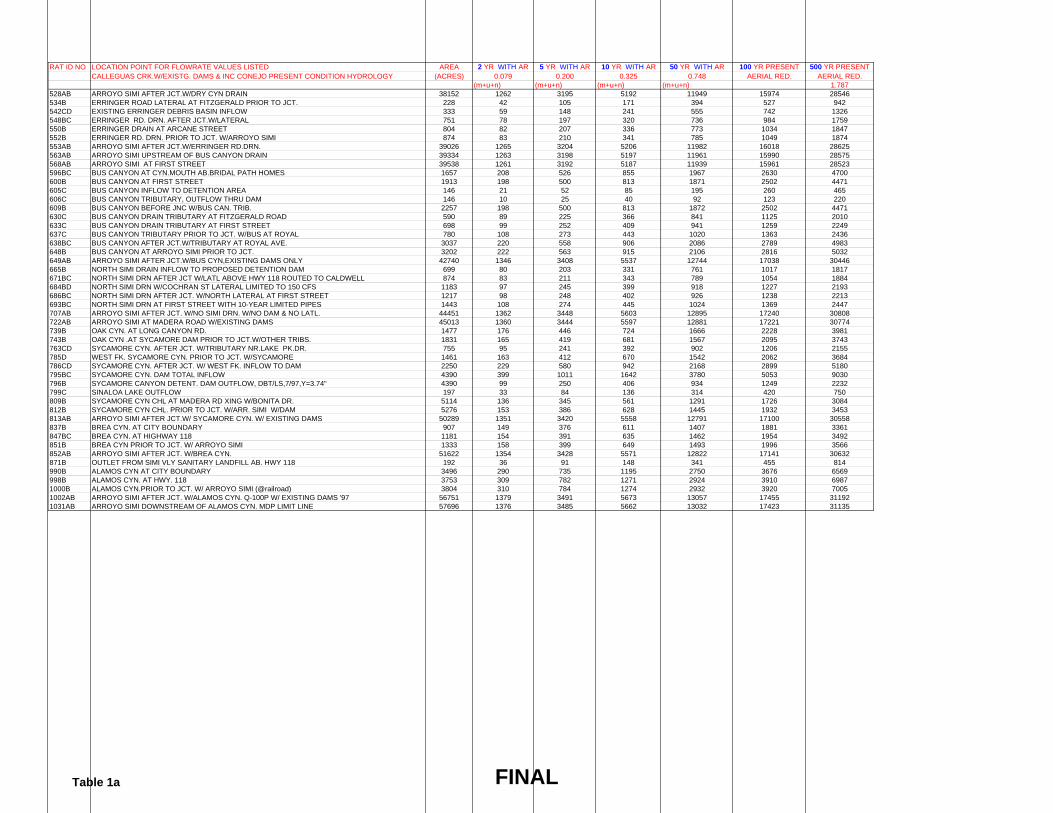
CALCULATED AND ESTIMATED PEAK FLOWS
Peak discharges for the 100-year frequency storm event were determined with the CalleguasCreek Watershed VCRAT model. Calculated peak discharges at specific points forCalleguas Creek and its tributaries are tabulated in Table 1a. Calculated peak discharges atspecific points for Revolon Slough and its tributaries are tabulated in Table 1b. Hydrologymaps are included as Figures 5a – 5d.

RAT ID NO LOCATION POINT FOR FLOWRATE VALUES LISTED AREA 2 YR WITH AR 5 YR WITH AR 10 YR WITH AR 50 YR WITH AR 100 YR PRESENT 500 YR PRESENT CALLEGUAS CRK.W/EXISTG. DAMS & INC CONEJO PRESENT CONDITION HYDROLOGY (ACRES) 0.079 0.200 0.325 0.748 AERIAL RED. 100 yr.AERIAL RED.x
(m+u+n) (m+u+n) (m+u+n) (m+u+n) 1.787
11B ARROYO SIMI AT HWY. 118.(HEADWATERS) 256 56 141 229 527 704 125822A ARROYO SIMI AT KUEHNER DR. 1053 169 427 694 1597 2135 381540AB ARROYO SIMI PRIOR TO JCT. W/ WHITE OAK 1736 243 616 1001 2303 3079 550157B WHITE OAK AT RONALD REAGAN FWY W/ MT. SINAI BASIN 975 74 186 303 697 932 166658B WHITE OAK CHL.PRIOR TO JCT.W/HUMMINGBIRD W/BASIN 1009 74 187 304 699 934 166979C HUMMINGBIRD CREEK DOWNSTREAM OF RONALD REAGAN FWY 1000 158 400 651 1497 2002 357782CD HUMMINGBIRD CREEK AT KUEHNER DR. 1120 170 430 698 1607 2148 383985CD HUMMINGBIRD CREEK AT ALSCOT AVENUE 1236 181 459 745 1716 2294 409987BC WHITE OAK CHL.AFTER JCT.W/HUMMINGBIRD 2319 223 563 916 2107 2817 503588B WHITE OAK PRIOR JCT.W/ARROYO SIMI 2361 222 562 914 2103 2812 502596AB ARROYO SIMI AFTER JCT.W/WHITE OAK CHANNEL W/BASIN AT MT.SINAI 4426 467 1181 1920 4419 5907 10556108AB ARROYO SIMI AT STOW STREET (NEW STREAMGAGE SITE) 5004 506 1281 2081 4790 6404 11443124A ARROYO SIMI PRIOR TO JCT W/STEARNS ST.DRN. 5653 522 1321 2147 4941 6606 11805134B STEARNS ST.DRN.AT HWY 118 432 66 168 272 627 838 1498145B STEARNS ST.DRN.PRIOR JCT W/ARROYO SIMI 920 132 333 542 1247 1667 2978146AB ARROYO SIMI AFTER JCT.W/STEARNS ST. DRN. 6573 584 1479 2403 5530 7393 13211147A ARROYO SIMI UPSTREAM OF LAS LLAJAS CANYON CHANNEL 6636 585 1481 2406 5538 7404 13230159BC LAS LLAJAS DAM INFLOW 4327 363 920 1494 3439 4598 8216160B LAS LLAJAS DAM OUTFLOW Q100 FR VCRAT RUN,6/97,Y=3.97"LS 4327 43 109 176 406 543 970173C CHIVO CYN W/NO DAM PRIOR TO JCT.W/LAS LLAJAS 2528 230 583 947 2180 2915 5208174BC LAS LLAJAS CHL AFTER JCT.W/CHIVO CYN(NO DAM ON CHIVO) 6855 260 658 1069 2460 3289 5877182C MARR DIVERSION PRIOR TO JCT.W/LAS LLAJAS 381 72 181 294 677 905 1618183BC LAS LLAJAS AFTER JCT.W/MARR DIVERSION 7294 280 709 1152 2651 3544 6334192C KADOTA FIG CHL PRIOR TO JCT W/LAS LLAJAS 322 72 181 295 678 907 1620193BC LAS LLAJAS AFTER JCT.W/KADOTA FIG AT ALAMO ST. 7764 304 771 1252 2882 3853 6885194B LAS LLAJAS AT HWY 118 W/DAM ON LAS LLAJAS 7836 304 770 1251 2878 3848 6876196B LAS LLAJAS PRIOR TO JCT.W/ARROYO SIMI (NO DAM ON CHIVO) 7953 310 785 1275 2934 3923 7010197AB ARROYO SIMI AFTER JCT.W/LAS LLAJAS (ONE DAM) NO A.R. 14589 822 2081 3382 7785 10407 18598217A ARROYO SIMI PRIOR TO JCT W/TAPO ST.DRN. 15200 815 2064 3354 7720 10321 18444233BC TAPO ST. DRN.AT LOS ANGELES AVENUE 489 79 201 326 751 1004 1794236AB ARROYO SIMI AFTER JCT.W/TAPO ST. DRN. 15819 822 2080 3380 7780 10401 18586270C MEIER CYN.EAST FK.NR.BRANDIS CAMP 2104 213 538 875 2013 2691 4810294D MEIER CYN.WEST FK.PRIOR JCT.W/EAST FK. 1284 173 438 712 1638 2190 3914296CD MEIER CYN AFTER JCT.EAST & WEST FKS. 3388 346 875 1422 3273 4376 7819303C MEIER CYN PRIOR TO JCT.W/ARROYO SIMI 3744 342 867 1409 3243 4335 7747306AC ARROYO SIMI AFTER JCT.W/MEIER CANYON 19765 1085 2746 4463 10271 13731 24538325A ARROYO SIMI PRIOR TO JCT W/TAPO CYN CHL. 20687 1080 2733 4442 10222 13666 24422343B TRIPAS CYN PRIOR TO JCT.W/TAPO CYN 5556 474 1201 1952 4493 6006 10733347BC TAPO CANYON AFTER JCT.W/ TRIPAS CYN 6888 612 1548 2516 5791 7742 13835355C GILDEBRAND CANYON PRIOR TO JCT.W/TAPO CANYON 3142 299 758 1231 2834 3788 6770356BC TAPO CANYON AFTER JCT.W/GILDEBRAND CYN. 10536 872 2207 3587 8256 11037 19723358B TAPO CYN CHAL. AT TAPO CANYON ROAD (NO DAM) 11356 882 2234 3630 8355 11170 19960359B TAPO CANYON AT CANYON MOUTH W/LS SUBAREAS RUN,6/97,DDT/LS 11425 883 2235 3632 8360 11176 19972390B TAPO CYN AT HWY 118 W/SPLITS OF CAPACITY AT XINGS 12231 544 1378 2239 5153 6888 12310
TAPO CANYON W/ SPLITS AT COCHRAN STREET 12327 239 606 985 2267 3031 5417418B TAPO CYN PRIOR TO JCT W/ARROYO SIMI W/LS SUBAREAS 13182 274 694 1127 2595 3469 6199419AB ARROYO SIMI AFTER JCT W/TAPO CYN CHL 33869 1190 3014 4897 11271 15068 26926423BC RUNKLE CANYON HEADWATERS ABOVE DAM 722 137 347 564 1299 1736 3103424B RUNKLE CANYON DAM INFLOW Q100,AR=0.92,Y=3.6,VVM/DDT/LS,6/97 954 106 269 437 1006 1345 2403437B RUNKLE CANYON AT FITZGERALD ST. 1632 160 405 658 1514 2024 3616440B RUNKLE CANYON PRIOR TO JCT. W/ARROYO SIMI 1782 163 413 671 1544 2065 3690441AB ARROYO SIMI AFTER JCT. W/RUNKLE CANYON 35651 1239 3138 5099 11736 15689 28037452B TAPO HILLS DIVERSION NO.2 INFLOW TO DAM 140 30 75 122 282 377 673453B TAPO HILLS DIVERSION NO. 2 OUTFLOW FROM DAM 140 6 14 23 53 71 127460C TAPO HILLS DIVERSION NO. 1 INFLOW TO DAM 110 23 59 95 220 294 525460C TAPO HILLS DIVERSION NO. 1 OUTFLOW FROM DAM 110 4 11 18 42 56 100466B DITCH ROAD DRAIN PRIOR TO JCT.W/DRY CANYON 385 30 75 122 280 374 669488C DRY CANYON CHANNEL PRIOR TO JCT.W/DITCH RD.DRN. 787 102 257 418 962 1286 2298489BC DRY CANYON CHANNEL AFTER JCT.W/DITCH RD.DRN. 1172 123 312 507 1167 1561 2789500B DRY CANYON CHANNEL AT HWY 118 1476 137 348 565 1300 1738 3105509B DRY CANYON CHANNEL AT RR PRIOR TO JCT W/LATERAL 1786 171 433 704 1621 2167 3872513C DRY CYN.LATERAL PRIOR TO JCT W/DRY CYN AB.RR 213 34 86 140 323 432 772514BC DRY CYN.CHL.AFTER JCT.W/LATERAL DRN.AB.RR 1999 193 488 794 1827 2442 4365519B DRY CANYON AT HEYWOOD STREET 2216 213 538 874 2012 2690 4807520B DRY CYN.CHL.PRIOR TO JCT.W/ARROYO SIMI 2234 212 537 873 2008 2685 4798
Table 1a FINAL
RAT ID NO LOCATION POINT FOR FLOWRATE VALUES LISTED AREA 2 YR WITH AR 5 YR WITH AR 10 YR WITH AR 50 YR WITH AR 100 YR PRESENT 500 YR PRESENT CALLEGUAS CRK.W/EXISTG. DAMS & INC CONEJO PRESENT CONDITION HYDROLOGY (ACRES) 0.079 0.200 0.325 0.748 AERIAL RED. AERIAL RED.
(m+u+n) (m+u+n) (m+u+n) (m+u+n) 1.787528AB ARROYO SIMI AFTER JCT.W/DRY CYN DRAIN 38152 1262 3195 5192 11949 15974 28546534B ERRINGER ROAD LATERAL AT FITZGERALD PRIOR TO JCT. 228 42 105 171 394 527 942542CD EXISTING ERRINGER DEBRIS BASIN INFLOW 333 59 148 241 555 742 1326548BC ERRINGER RD. DRN. AFTER JCT.W/LATERAL 751 78 197 320 736 984 1759550B ERRINGER DRAIN AT ARCANE STREET 804 82 207 336 773 1034 1847552B ERRINGER RD. DRN. PRIOR TO JCT. W/ARROYO SIMI 874 83 210 341 785 1049 1874553AB ARROYO SIMI AFTER JCT.W/ERRINGER RD.DRN. 39026 1265 3204 5206 11982 16018 28625563AB ARROYO SIMI UPSTREAM OF BUS CANYON DRAIN 39334 1263 3198 5197 11961 15990 28575568AB ARROYO SIMI AT FIRST STREET 39538 1261 3192 5187 11939 15961 28523596BC BUS CANYON AT CYN.MOUTH AB.BRIDAL PATH HOMES 1657 208 526 855 1967 2630 4700600B BUS CANYON AT FIRST STREET 1913 198 500 813 1871 2502 4471605C BUS CANYON INFLOW TO DETENTION AREA 146 21 52 85 195 260 465606C BUS CANYON TRIBUTARY, OUTFLOW THRU DAM 146 10 25 40 92 123 220609B BUS CANYON BEFORE JNC W/BUS CAN. TRIB. 2257 198 500 813 1872 2502 4471630C BUS CANYON DRAIN TRIBUTARY AT FITZGERALD ROAD 590 89 225 366 841 1125 2010633C BUS CANYON DRAIN TRIBUTARY AT FIRST STREET 698 99 252 409 941 1259 2249637C BUS CANYON TRIBUTARY PRIOR TO JCT. W/BUS AT ROYAL 780 108 273 443 1020 1363 2436638BC BUS CANYON AFTER JCT.W/TRIBUTARY AT ROYAL AVE. 3037 220 558 906 2086 2789 4983648B BUS CANYON AT ARROYO SIMI PRIOR TO JCT. 3202 222 563 915 2106 2816 5032649AB ARROYO SIMI AFTER JCT.W/BUS CYN,EXISTING DAMS ONLY 42740 1346 3408 5537 12744 17038 30446665B NORTH SIMI DRAIN INFLOW TO PROPOSED DETENTION DAM 699 80 203 331 761 1017 1817671BC NORTH SIMI DRN AFTER JCT W/LATL ABOVE HWY 118 ROUTED TO CALDWELL 874 83 211 343 789 1054 1884684BD NORTH SIMI DRN W/COCHRAN ST LATERAL LIMITED TO 150 CFS 1183 97 245 399 918 1227 2193686BC NORTH SIMI DRN AFTER JCT. W/NORTH LATERAL AT FIRST STREET 1217 98 248 402 926 1238 2213693BC NORTH SIMI DRN AT FIRST STREET WITH 10-YEAR LIMITED PIPES 1443 108 274 445 1024 1369 2447707AB ARROYO SIMI AFTER JCT. W/NO SIMI DRN. W/NO DAM & NO LATL. 44451 1362 3448 5603 12895 17240 30808722AB ARROYO SIMI AT MADERA ROAD W/EXISTING DAMS 45013 1360 3444 5597 12881 17221 30774739B OAK CYN. AT LONG CANYON RD. 1477 176 446 724 1666 2228 3981743B OAK CYN .AT SYCAMORE DAM PRIOR TO JCT.W/OTHER TRIBS. 1831 165 419 681 1567 2095 3743763CD SYCAMORE CYN. AFTER JCT. W/TRIBUTARY NR.LAKE PK.DR. 755 95 241 392 902 1206 2155785D WEST FK. SYCAMORE CYN. PRIOR TO JCT. W/SYCAMORE 1461 163 412 670 1542 2062 3684786CD SYCAMORE CYN. AFTER JCT. W/ WEST FK. INFLOW TO DAM 2250 229 580 942 2168 2899 5180795BC SYCAMORE CYN. DAM TOTAL INFLOW 4390 399 1011 1642 3780 5053 9030796B SYCAMORE CANYON DETENT. DAM OUTFLOW, DBT/LS,7/97,Y=3.74" 4390 99 250 406 934 1249 2232799C SINALOA LAKE OUTFLOW 197 33 84 136 314 420 750809B SYCAMORE CYN CHL AT MADERA RD XING W/BONITA DR. 5114 136 345 561 1291 1726 3084812B SYCAMORE CYN CHL. PRIOR TO JCT. W/ARR. SIMI W/DAM 5276 153 386 628 1445 1932 3453813AB ARROYO SIMI AFTER JCT.W/ SYCAMORE CYN. W/ EXISTING DAMS 50289 1351 3420 5558 12791 17100 30558837B BREA CYN. AT CITY BOUNDARY 907 149 376 611 1407 1881 3361847BC BREA CYN. AT HIGHWAY 118 1181 154 391 635 1462 1954 3492851B BREA CYN PRIOR TO JCT. W/ ARROYO SIMI 1333 158 399 649 1493 1996 3566852AB ARROYO SIMI AFTER JCT. W/BREA CYN. 51622 1354 3428 5571 12822 17141 30632871B OUTLET FROM SIMI VLY SANITARY LANDFILL AB. HWY 118 192 36 91 148 341 455 814990B ALAMOS CYN AT CITY BOUNDARY 3496 290 735 1195 2750 3676 6569998B ALAMOS CYN. AT HWY. 118 3753 309 782 1271 2924 3910 69871000B ALAMOS CYN.PRIOR TO JCT. W/ ARROYO SIMI (@railroad) 3804 310 784 1274 2932 3920 70051002AB ARROYO SIMI AFTER JCT. W/ALAMOS CYN. Q-100P W/ EXISTING DAMS '97 56751 1379 3491 5673 13057 17455 311921031AB ARROYO SIMI DOWNSTREAM OF ALAMOS CYN. MDP LIMIT LINE 57696 1376 3485 5662 13032 17423 31135
Table 1a FINAL

RAT ID NO LOCATION POINT FOR FLOWRATE VALUES LISTED AREA 2 YR WITH AR 5 YR WITH AR 10 YR WITH AR 50 YR WITH AR 100 YR PRESENT 500 YR PRESENT CALLEGUAS CRK.W/EXISTG. DAMS & INC CONEJO PRESENT CONDITION HYDROLOGY (ACRES) 0.107 0.244 0.374 0.775 AERIAL RED. 100 yr.AERIAL RED.x
(m+u+n) (m+u+n) (m+u+n) (m+u+n) 1.653 CANYON NO.2 - EXIST.COND.Q100, W/J',DT/WF/LS 7/97,FN=CYN20797.HI
1071B OIL FIELD CYN PRIOR TO JCT W/ NO. 2 CANYON 964 137 313 479 993 1281 21171086E NUMBER 2 CYN. PRIOR TO JCT. W/ OIL FIELD CYN. 710 123 281 430 891 1150 19011087BE NUMBER 2 CANYON AFTER JCT. W/ OIL FIELD CYN. 1674 237 540 828 1715 2213 36581114D CAMPUS ROAD CYN PRIOR TO JCT. W/ NO. 2 CANYON 877 139 318 487 1009 1302 21521115BD NUMBER 2 CYN. AFTER JCT W/ CAMPUS RD CYN AT CITY BOUNDARY 3050 385 878 1346 2790 3600 59501125BF CANYON NO.2 AT HWY 118 XING PRIOR TO JCT. W/ARR.SIMI 3321 386 880 1349 2796 3607 59631126AB ARROYO SIMI AFTER JCT. W/ NUMBER 2 CYN. 61379 2062 4702 7208 14936 19272 318571128B STRATHEARN CYN TR3963 Q100FW/RAMSEYER PROJ.W/J' DDT/GKC/LS,7/97 42 10 24 37 76 98 1611138B INLET Q AT TERMINUS 16TH CIRCLE & 17TH CIRCLE 440 71 163 249 516 666 11011139B Q @ PRIVATE RECREATION AREA, PARCEL R-3 488 72 163 250 518 669 11051143B Q @ [STL STRS. [STVR; P-2 519 72 163 250 519 670 11071145D INLET Q AT TERMINUS C STREET 26 9 21 32 66 85 1401148E INLET Q AT 7TH CIRCLE 59 15 34 52 109 140 2321161C INLET Q AT PECAN AVENUE 414 63 144 221 457 590 9761163BC STRATHEARN CYN EAST FK.W/PECAN ST.PIPE INCL 1157 150 343 526 1089 1405 23231193D STRATHEARN CANYON PRIOR TO CONFLUENCE WITH 111B 1452 181 413 633 1312 1693 27991194BD STRATHERN CANYON AT TRACT BOUNDARY 2618 292 667 1022 2117 2732 45161197B STRATHEARN CANYON AT ARROYO SIMI, W/ TR.3963 2675 292 666 1021 2116 2730 45131198AB ARROYO SIMI AFTER JCT. W/ STRATHERN CYN. 64050 2152 4907 7521 15585 20110 332421277B HAPPY CAMP CYN.AT REG. PK.UPSTREAM BOUNDARY 3920 349 796 1220 2529 3263 53931301B HAPPY CAMP CYN AT DAM SITE #1A 5389 367 838 1284 2661 3434 56761316CE HAPPY CAMP CYN AT DAM SITE #1B 891 105 239 366 758 978 16161317C NO. FK. HAPPY CAMP CYN PRIOR TO W/ HAPPY CAMP MAIN CHL. 947 102 232 355 735 949 15691318BC HAPPY CAMP CYN. AFTER JCT. W/ NO. FK. HCC 6408 431 982 1505 3118 4024 66511322BE HAPPY CAMP CYN AT DAM SITE #2 6582 434 990 1517 3144 4057 67061329B HAPPY CAMP CYN AT DAM SITE #3 7041 428 977 1497 3103 4003 66181330B HAPPY CAMP CYN. AT CITY LIMIT BOUNDARY 7119 426 971 1489 3085 3981 65811337B HAPPY CAMP CANYON AT HWY 118 7481 432 985 1510 3129 4038 66741343B HAPPY CAMP CYN AT ARROYO SIMI 7589 433 986 1512 3133 4042 66821344AB ARROYO SIMI AFTER JCT. W/HAPPY CAMP CYN. AT VA COLONY 72423 2374 5413 8297 17193 22185 366721350B CASTRO WILLIAMS SPILLWAY WITH ROUTED FLOW FROM WEST, DDT/BJ 62 16 38 58 119 154 2551361B CASTRO WILLIAMS NEAR LOS ANGELES AVE.IN MOORPARK 357 61 140 215 445 574 9491401AC ARROYO SIMI AT NEW LOS ANGELES AVE. NEAR SCIENCE DR. 72906 2374 5413 8297 17193 22184 366701417B CASTRO WILLIAMS SPILLWAY NEAR LOS ANGELES AVE. 928 164 375 574 1190 1536 25391427AB ARROYO SIMI AT SPRING STREET- SITE OF GAGE 801 74000 2373 5412 8295 17190 22180 366641450AB ARROYO SIMI AT LIBERTY BELL RD. (LETA YANCY) 74311 2372 5408 8290 17179 22166 366401463B SHASTA DRAIN PRIOR TO JCT. W/ARR.SIMI 179 24 56 86 177 229 3781464AB ARROYO SIMI AFTER JCT.W/SHASTA DRAIN 74490 2371 5407 8288 17174 22160 366301472AB ARROYO SIMI AT TIERRA REJADA ROAD. 74711 2368 5399 8275 17148 22127 365751490A ARROYO LAS POSAS PRIOR JCT WITH PEACH HILL 74905 2364 5390 8262 17120 22091 365161491B PEACH HILL UPDATE W/AS-BUILT PLANS & DEV.(NEW MAP) DT/BA/89 0 6 14 21 44 57 941501BC PEACH HILL AT UPSTREAM END OF HAWKES FEMA STUDY 276 70 159 244 506 653 10791508D PIPE IN TIERRA REJADA PRIOR TO JCT.W/PEACH HILL 172 43 98 151 312 403 6661511E PEACH HILL TRIBUTARY FRON NO.PRIOR TO JCT.W/MAIN CH. 154 35 81 124 257 331 5471512BE PEACH HILL WASH AFTER JCT.W/NO TRIBUTARY 1989 UPDAT 552 118 268 411 852 1099 18161513BD PEACH HILL WASH AFTER JCT.W/PIPE IN TIERRA REJ. UPDT 724 152 346 531 1100 1420 23471520D EAST BRANCH OF PIPE LATERAL PRIOR TO JCT.W/WEST BRCH. 234 49 113 173 358 462 7641525E WEST BRANCH OF PIPE LATERAL PRIOR TO JCT.W/EAST BRCH. 255 56 127 194 403 520 8591526DE 102 INCH PIPE IN MT.MEADOW PRIOR TO JCT.W/MAIN BRCH. 489 102 232 356 738 952 15731527BD PEACH HILL WASH AFTER JCT.W/102 IN PIPE UPDATE 89 1344 250 571 875 1814 2340 38681530C PEACH HILL TRIBUTARY PRIOR TO JCT.W/MAIN UPDATE 89 37 10 22 34 69 90 1481535BD PEACH HILL WASH-TOTAL INFLOW INTO RETENTION BASIN 1619 228 519 796 1650 2128 35181536B PEACH HILL WASH-OUTFLOW FRM RETENT.BSN.'89,Y=3.9W/125%DBR 1619 159 363 556 1152 1486 24561540B PEACH HILL WASH-RTED.THRU BSN.PRIOR TO JCT.W/HOME ACRES 1664 159 361 554 1148 1482 24491555D HOMEACRES DRN.PRR TO JCT.W/PEACH HILL RTED.THRU BASIN UPD 785 100 229 351 727 938 15501556BD PEACH HILL WASH-AFTER JCT.W/HOMEACRES,INC.BSN.RTE. 89 UPD. 2449 231 526 806 1671 2156 35641557B PEACH HILL WASH-AT ARR. SIMI W/RTED.BSN & HOMEACRES UPD 2527 227 518 795 1647 2125 35121558AB ARROYO LAS POSAS AFTER JT.W/PEACH HILL WASH & HOMEACRES 77432 2421 5521 8463 17537 22629 374051561B WALNUT-GABBERT CYN,ULT.LNDUSE, J&K ZONE RAIN DDT/DKT 5/96 94 24 55 84 175 226 3731566B WALNUT CANYON ROAD 390 88 201 308 638 823 13601567B DOWNSTREAM OF WALNUT CANYON 439 96 220 337 697 900 14881574BC WALNUT CYN JCT.W/WEST LATL.ULTIMATE LANDUSE NO DETN. 709 146 334 512 1060 1368 22611586E MOORPARK DRN. NO. 1 PRIOR TO WALNUT CYN JCT. 27 8 18 28 58 75 1241587DE MOORPARK DRAIN NO. 1 PER '95 MDP W/ULTIMATE CONDITION 144 31 71 109 226 292 4821588BD WALNUT CYN DRN.JCT W/MPK DRN.NO.1 W/ULTIMATE LANDUSE 853 169 385 591 1224 1580 26111589B WALNUT CYN . CHL. AFTER JCT. W/ MPK. DRN. NO. 1 853 168 383 588 1218 1571 2597
Table 1a FINAL

RAT ID NO LOCATION POINT FOR FLOWRATE VALUES LISTED AREA 2 YR WITH AR 5 YR WITH AR 10 YR WITH AR 50 YR WITH AR 100 YR PRESENT 500 YR PRESENT CALLEGUAS CRK.W/EXISTG. DAMS & INC CONEJO PRESENT CONDITION HYDROLOGY (ACRES) 0.107 0.244 0.374 0.775 AERIAL RED. 100 yr.AERIAL RED.x
(m+u+n) (m+u+n) (m+u+n) (m+u+n) 1.6531595BC WALNUT CYN DRN.JCT W/LATL.BEFORE GABBERT RD. ULTIMATE 1048 191 436 669 1385 1788 29551606CE WALNUT TRIBUTARY AT FUTURE FREEWAY XING, ULTIMATE 468 98 223 342 708 914 15101608BC WALNUT CYN. AFTER JCT. W/LATERALS ADJACENT TO GABBERT RD. 1546 198 453 694 1437 1855 30661609B WALNUT CYN. CHL. PRIOR TO JCT. W/ GABBERT CYN. DRN. 1616 199 453 695 1440 1859 30721610B WALNUT CANYON AT HWY 118 PRIOR JCT. ULTIMATE CONDITION 1616 199 453 694 1438 1855 30671621D DRAIN FROM EAST ALONG HWY 118 PRIOR TO JCT. W/WALNUT 173 40 90 138 287 370 6111622BD WALNUT CYN AT HWY 118 AFTER JCT. W/HWY DRAIN FROM EAST 1789 203 464 711 1473 1901 31421640DF EPWORTH DRAIN AT BROADWAY; ULTIMATE LANDUSE 538 79 179 275 569 735 12141655DE EPWORTH DRN AT JCT.W/GABBERT NR.MPK CITY LMTS. ULTIMATE 1177 160 365 560 1161 1498 24761664CD GABBERT CYN AFTER JCT W/MPK.COUNTRY CLUB ESTAT.ULTIMATE 2151 205 467 716 1483 1914 31631669C GABBERT DEBRIS BASIN INFLOW ULTIMATE, NO DETENTION 2441 203 462 709 1468 1894 31321673C GABBERT CYN PRIOR JCT. W/WALNUT CYN, ULTIMATE LAND USE 2571 204 465 712 1476 1905 31491674BC WALNUT-GABBERT AT JCT.ABOVE HWY 118 ULTIMATE LAND USE 4360 394 899 1378 2855 3684 60901678BD GABBERT CYN AT ARROYO SIMI, ULTIMATE, NO RETENTION 4424 395 901 1382 2863 3694 61061679AB ARROYO LAS POSAS AFTER JCT.W/GABBERT CYN NR. HITCH BLVD. 81856 2501 5702 8741 18112 23371 386321683A ARROYO LAS POSAS PRIOR TO GRIMES CANYON Q-100P (@HITCH BLVD.-CS9) 82396 2496 5692 8725 18081 23330 385641700BC SOUTH GRIMES WITH TRIBUTARY 2996 215 491 752 1559 2011 33241705AB ARROYO LAS POSAS WITH SOUTH GRIMES CANYON WASH 86257 2581 5885 9020 18691 24118 398671713AB ARROYO LAS POSAS AFTER JCT. W/HUNT WASH CYN. 87925 2597 5922 9078 18810 24271 401211717A LAS POSAS HILLS PRIOR JUNC. W/ARROYO LAS POSAS 88364 2594 5915 9067 18788 24242 400721744B LONG CANYON PRIOR TO JCT W/ ARROYO LAS POSAS 3240 271 617 946 1960 2529 41811746AB ARROYO LAS POSAS AFTER JCT. W/LONG CYN 91743 2686 6125 9388 19455 25103 414951753B MAHAN BARRANCA AT HWY 118 PRIOR TO JCT.W/ARR. LAS POSAS 1385 103 234 359 745 961 15881755AB ARROYO LAS POSAS AFTER JCT. W/ MAHAN BARR. 93613 2720 6203 9507 19701 25420 420201764B SAND CANYON PRIOR TO JCT W/ ARROYO LAS POSAS 1630 207 471 722 1497 1931 31921766AB ARROYO LAS POSAS AFTER JCT. W/SAND CANYON 95297 2742 6253 9585 19862 25629 42364
VCRAT MODEL-COYOTE & FOX CYNS,PRESENT COND.,DDT/LS,12/97
1799B PUERTA ZUELA PRIOR TO JCT.W/DONLON DRN. 1970 186 423 649 1344 1734 28671804C DONLON DRN. PRIOR TO JCT.W/PUERTA ZUELA 252 34 78 119 247 319 5271805BC PUERTA ZUELA AFTER JCT. W/ DONLON DRAIN 2222 204 465 713 1477 1905 31501828CD COYOTE CYN AT BRADLEY RD CROSSING 1555 201 457 701 1453 1875 30991838C COYOTE CYN PRIOR TO JCT. W/PUERTA ZUELA 2253 194 443 679 1407 1816 30011839BC COYOTE CYN AFTER JCT. W/ PUERTA ZUELA 4475 373 851 1305 2703 3488 57661845B COYOTE CANYON PRIOR CONFLUCENCE WITH FOX CANYON 5015 384 875 1342 2781 3588 59311879CD FOX CANYON AFTER JCT. W/BOONE CYN 2234 262 598 917 1899 2451 40511883C FOX CYN NORTH OF HWY 118 PRIOR TO JCT W/ BERYLWOOD CYN 2484 262 597 915 1896 2446 40441891D BERYLWOOD CYN. AT HWY 118 PRIOR TO JCT W/ FOX CYN. 589 87 199 305 632 816 13481892CD DOWNSTREAM OF FOX CANYON CONFL. W/BERYLWOOD CANYON 3073 285 649 995 2062 2660 43971894C FOX CANYON DEBRIS BASIN 3170 284 648 993 2057 2654 43881897C FOX CANYON PRIOR CONFLUENCE WITH COYOTE CANYON 3279 285 650 996 2064 2663 44011898BC COYOTE CYN AFTER JCT W/ FOX CYN BARRANCA 8294 644 1469 2252 4667 6022 99541899AB ARROYO LAS POSAS W/COYOTE AND FOX CANYONS 104015 2959 6748 10343 21432 27655 457131900A ARROYO LAS POSAS AT SOMIS AFTER JCT.W/FOX & COYOTE 104098 2958 6745 10338 21422 27642 456921944B GROVES PLACE DRAIN AT LEWIS RD. PRIOR TO JCT.W/ARR.LAS POSAS 262 39 88 135 280 362 5981945AB CALLEGUAS CK. AT SEMINARY BEND 105509 2962 6754 10353 21454 27682 457591959B ST. JOHN'S DRAIN PRIOR TO JCT. W/ CALLEGUAS 369 73 167 256 530 684 11301960AB CALLEGUAS CK. AFTER JCT. W/ ST. JOHN'S DRAIN (@UPLAND RD.) 105897 2964 6758 10359 21467 27699 457861981A CALLEGUAS CRK. AT ADOLFO ROAD 106543 2963 6758 10358 21464 27696 457821986D SOMIS DRAIN 82 24 55 85 176 227 3762007D SOMIS DRAIN AT E.LOOP-LAS POSAS RD 292 71 162 248 514 664 10972014BE SOMIS DRAIN DOWN TO SHEPERD DRIVE AND DARA STREET 655 110 252 386 800 1032 17062019BD WEST DRAIN TRIBUTARY WITH SOUTHERN PACIFIC (LEWIS RD.-DURKIN) 745 121 275 422 875 1129 18662023B SOMIS DR. PRIOR TO JCT W/CALLEGUAS CREEK 886 123 280 429 890 1148 18982024AB CALLEGUAS CREEK AFTER JCT.W/SOMIS DRAIN 107447 2972 6778 10390 21529 27780 459202038AD CALLEGUAS CREEK AFTER JCT W/FLYNN ROAD DRAIN (CS5) 107746 2974 6782 10395 21541 27795 459452046AB CALLEGUAS CREEK AT PLEASANT VALLEY ROAD 107941 2980 6796 10417 21587 27854 460432050A CALLEGUAS CREEK BEFORE JCT W/CONEJO CREEK & LEWIS DRAIN 107995 2972 6776 10387 21523 27772 459072051B LEWIS ROAD DRAIN AT DURKIN STREET 36 8 18 27 56 73 1202086AB CALLEGUAS CREEK WITH LEWIS ROAD DRAIN 109256 2960 6749 10345 21436 27659 45721
Table 1a FINAL

RAT ID NO LOCATION POINT FOR FLOWRATE VALUES LISTED AREA 2 YR WITH AR 5 YR WITH AR 10 YR WITH AR 50 YR WITH AR 100 YR PRESENT 500 YR PRESENT CALLEGUAS CRK.W/EXISTG. DAMS & INC CONEJO PRESENT CONDITION HYDROLOGY (ACRES) 0.142 0.287 0.416 0.796 AERIAL RED. 100 yr.AERIAL RED.x
(m+u+n) (m+u+n) (m+u+n) (m+u+n) 1.587 CONEJO CREEK W/T.O. MDP SUBAREAS RENUMBERED
SO.BR & CMT Q100 LG/SV/DH/DT FROM SBR-1-93 NEW FN=SBAC997.HI
2112BC SO.BR.ARR.CON.TRIBUTARY FROM SO.FK.STATE PARK AREA PRR TO JCT. 632 106 214 310 592 744 11812220C SO.BR.ARROYO CONEJO INFLOW TO DETENTION BASIN-TR. 4831 244 122 246 356 682 857 13602246CE SO. BR. ARR. CONEJO TRIB. FROM TR.4831 307 143 290 420 804 1010 16032275C SO.BR.ARR.CON.POTRERO INFLOW TO BASIN AREA 358 168 340 493 944 1186 18822277F SO.BR.ARR.CON. OUTFLOW HYDROGRAPH FROM POTRERO BASIN(AR=0.974,YIELD=6.2") 0 46 93 135 259 325 5162299C SO.BR.ARR.CON.EAST TRIBUTARY PRIOR TO JCT.W/MAIN CHAL. 927 117 237 344 658 827 13132300BC SO.BR.ARR.CON-EAST AND WEST COMBINE 50% YIELD 5.25" & AR 1611 195 393 570 1091 1370 21742301BF SO.BR.ARR.CON.-EAST, WEST AND POTRERO BASIN COMBINED 1611 238 481 697 1334 1676 26602305B SO BR.ARR.CON.ALONG REINO RD.PRIOR TO KIMBER BASIN(64A) 1611 238 480 696 1332 1673 26552332C NEWBURY PK DRN # 3 PRIOR TO JCT.W/SO. BR. ARR. CONEJO 867 314 634 919 1759 2210 35072334BC SO.BR.ARR.CON. PRIOR TO PROPOSED 2000 CFS SPLIT ,W/NO R.F. 2544 519 1048 1519 2907 3652 57962336BF SO. BR. ARR. CON. 2200 CFS SPLIT FLOW AT REINO RD BYPASS 2544 312 631 915 1751 2200 34912340B SO. BR. ARR. CON. BEFORE CONFL. WITH CONEJO MOUNTAIN CR. 2567 334 674 977 1870 2349 37282500CE CON. MT. CK. INPUT HYDROGRAPH BEFORE BYPASS BASIN 1049 318 643 932 1784 2241 35572510C CMC BYPASS LOW FLOW ROUTING W/BYPASS CUTOFF 940 CFS 1537 5 10 14 27 34 542524CD CONEJO MT CK. BYPASS W/LOCAL AREA DOWNSTREAM OF DAM 1657 182 368 534 1022 1284 20372528BC SO.BR.ARR.CON.-INFLOW HYDROGRAPH AT MAURICE ("A") ST. FLOW THROUGH BASIN 4224 507 1024 1484 2840 3568 56622539B SO.BR. ARR. CON. OUTFLOW HYDRO. FROM MAURICE ST. ROUTED TO U/S HWY 101 4224 491 993 1440 2755 3461 54932545B SO.BR. ARR. CON. OUTFLOW HYDROGRAPH AT COHEN'S PROPERTY KIMBER/REINO 4363 497 1005 1457 2788 3503 55592549B SO.BR.ARR.CON. ALONG REINO PRIOR TO BORCHARD INTERSECTION W/DAMS UPS. 4408 498 1006 1458 2791 3506 55642559BC SO.BR.ARR.CON. AT REINO & BORCHARD RD. W/UPSTREAM DAMS AND AREA RED. 4737 571 1153 1672 3199 4019 63782611BC SO. BR.ARR.CON. INFLOW HYDRO. TO EXISTING FLOWAGE EASMT. U/STM. OF HWY101 6529 934 1887 2735 5233 6574 104332612BF SO.BR.ARR.CON.AFTER SPLIT TO CHUTE AT HWY.101 & BORCHARD RD. 6529 639 1292 1872 3582 4500 71422613F SO.BR.ARR.CON. BYPASS BASIN ABOVE HWY. 101 W/ ADJUSTED VOLUME & ROUTING 0 295 595 863 1651 2074 32912615B SO.BR.ARR.CON. AT HWY.101 & BORCHARD RD FLOW INTO CHUTE 6529 639 1292 1872 3582 4500 71422647D SO.BR.ARR. CONEJO. POSSIBLE FUTURE BASIN SITE 523 175 354 512 981 1232 19552689C LATERAL FLOW TO SO. BR. NEAR VENTU PARK ROAD PRIOR TO JCT. W/SO. BR. ARR. CON. 2108 562 1136 1646 3150 3957 62802690BC SO.BR. ARR.CON. AFTER JCT. W/LATERAL BELOW VENTU PARK. RD.W/CHUTE UPSTREAM 8637 1182 2388 3462 6624 8322 132072704B SO.BR. ARR. CON. PRIOR TO CONF W/ARR CONEJO W/DAMS & CHUTE UPSREAM 8637 1182 2388 3462 6624 8322 13207
LANG CK.W/OUT RBF BSN-VCFCD RTG.TO ARR.CON.JCT. DBT 1/99
2764CE LANG CREEK AT WESTLAKE BLVD DEBRIS BSN SITE.YIELD=3.8 2158 403 814 1180 2258 2836 45012768CD LANG CK.W/OUT DETENTION DAM 2245 403 814 1180 2258 2836 45012782CD LANG CREEK AT ERBES W/OUT DETENTION DAM 2875 418 845 1225 2345 2946 46752785C LANG CREEK AT EL MONTE W/OUT DETENTION DAM 3038 421 851 1234 2360 2965 47062791C LANG CREEK UPSTREAM OF HWY 23 W/OUT DETENTION DAM 3260 427 862 1250 2391 3004 47672802CD LANG CREEK AT SPALDING W/OUT DETENTION DAM 3676 460 930 1348 2580 3241 51442804C LANG CREEK DOWN TO COMBES AVE. AND PAIGE LN. 3768 466 942 1366 2614 3284 52112805C LANG CRK DOWNSTREAM OF WILBUR RD. W/OUT DETENT. DAM 3839 474 958 1389 2657 3338 52982807C LANG CRK PRIOR TO JCT. W/ARR.CONEJO W/OUT DETENT. DAM 3892 476 962 1394 2668 3351 53192842D SKELETON CYN. AT CRESTHAVEN CROSSING 1179 293 593 860 1645 2066 32792852D SKELETON CYN. AT HILLCREST W/VCFCD ROUTING 1/99 1594 337 681 986 1887 2371 37632879E LOS ROBLES DRAIN AT HWY. 101 NEAR HAMPSHIRE ROAD XING 129 61 123 178 342 429 6812890E LOS ROBLES DRAIN AT OAK VIEW DRIVE 474 200 403 585 1119 1406 22312891E LOS ROBLES DRN.PRIOR JCT.W/ARR.CON. W/VCFCD RTG. 523 214 432 627 1199 1506 23902895DE ARR.CON.AFTER JCT.W/ROBLES DRN. W/VCFCD ROUTING 2904 623 1260 1826 3494 4389 69662898D ARROYO CONEJO PRIOR TO JCT. W/ ERBES ROAD DRAN. 2954 637 1288 1866 3571 4486 71202907E ERBES RD.DRN.PRIOR JCT.W/ARR.CON. DEV W/VCFCD RTG. 255 97 196 284 543 682 10822908DE ARROYO CONEJO AFTER JCT. W/ ERBES ROAD DRAIN 3209 699 1412 2047 3918 4922 78112927DE ARROYO CONEJO AT HODENCAMP RD. PRIOR TO JCT. W/ T.O. NO. DRAIN 3621 754 1523 2208 4225 5308 84242967E THOUSAND OAKS NO. DRAIN AT LA JOLLA DRIVE 579 217 438 634 1214 1525 24202970E THOUSAND OAKS NO. DRAIN AT HWY. 23 (DOWN TO HOUSTON-GREENWICH) 726 253 511 741 1417 1781 28262972E THOUSAND OAKS NO.DRN.PRIOR JCT.W/ARR.CON. W/VCFCD RTG 805 266 537 779 1490 1872 29702973DE ARROYO CONEJO AFTER JCT. W/ T.O. NO. DRN. W/VCFCD RTG. 5044 1114 2252 3264 6246 7847 124532974D ARROYO CONEJO DOWN TO BOARDWALK AV. 5111 1117 2258 3274 6264 7869 124882976CD ARR.CON.AFTER JCT.W/LANG CRK W/NO DAM UPS. W/VC.RTG. 9003 1459 2948 4274 8177 10273 163032977C ARROYO CONEJO AT MOORPARK RD. W/NO DAM ON LANG CK. 9003 1457 2946 4269 8169 10263 162883019CD ARROYO CONEJO DOWN TO W.THOUSAND OAKS BL. 10188 1589 3211 4654 8905 11188 177553029C ARROYO CONEJO W. OF LYNN RD. PRIOR TO JCT. W/ PARK DRAIN 10488 1592 3218 4664 8925 11212 177933045D PARK DRAIN PRIOR TO JCT. W/ ARROYO CONEJO AT LYNN RD. 742 153 310 450 860 1081 17153046CD ARROYO CONEJO AFTER JCT. W/ PARK DRAIN WEST OF LYNN RD. 11230 1684 3403 4933 9439 11858 188183076D HAIGH ROAD DRAIN AT HWY. 101 201 78 158 229 439 551 8753079C ARROYO CONEJO JUST PRIOR TO JCT.W/SO.BR.ARR.CON.(T.O. MPD #379A) 12311 1731 3499 5071 9704 12191 193473080BC AR.CONEJO AFTER JCT.W/ SO.BR.ARROYO CONEJO (TO MPD #579AB) 20948 2408 4867 7055 13499 16958 269123087C AMGEM DRAIN PRIOR TO JCT. W/ ARROYO CONEJO 124 33 66 95 183 229 3643088BC ARROYO CONEJO AFTER JCT. W/ DRAIN FROM AMGEM DEVELOPMENT 21259 2409 4868 7057 13503 16963 26921
Table 1a FINAL

RAT ID NO LOCATION POINT FOR FLOWRATE VALUES LISTED AREA 2 YR WITH AR 5 YR WITH AR 10 YR WITH AR 50 YR WITH AR 100 YR PRESENT 500 YR PRESENT CALLEGUAS CRK.W/EXISTG. DAMS & INC CONEJO PRESENT CONDITION HYDROLOGY (ACRES) 0.142 0.287 0.416 0.796 AERIAL RED. 100 yr.AERIAL RED.x
(m+u+n) (m+u+n) (m+u+n) (m+u+n) 1.5873167D NO.FK.ARR. CONEJO TRIBUTARY AT HWY. 23 AND AVENIDA DE LOS ARBOLES 120 49 98 142 272 342 5423181D CASTANO CHL.TRIBUTARY PRIOR TO JCT.W/CASTANO CHL. NO. OF LOS ARBOLES 232 89 181 262 501 629 9983188E CASTANO CHL.PRIOR TO JCT.W/CASTANO TRIBUTARY 190 78 157 228 437 548 8703189DE CASTANO CHL. AFTER JCT. W/ CASTANO TRIBUTARY 422 156 315 457 875 1099 17443190D CASTANO CHANNEL PRIOR TO JCT. W/ NO.FK. ARR. CONEJO 505 173 350 508 971 1220 19373204C NO. FK. ARROYO CONEJO WEST OF LYNN ROAD 1754 373 754 1093 2092 2629 41723205C NO. FK. ARROYO CONEJO PRIOR TO JCT. W/ WAVERLY CHANNEL 1813 379 767 1111 2126 2671 42393211DE WAVERLY CHANNEL DOWN TO MOORPARK ROAD 157 63 128 185 354 444 7053221D WAVERLY CHANNEL AT LYNN ROAD 644 196 396 573 1097 1378 21873233D WAVERLY CHANNEL PRIOR TO JCT. W/ NO.FK. ARR. CONEJO 1070 306 619 898 1718 2158 34253234CD NO. FK. ARROYO CONEJO W/WAWERLY CHNL. 2883 638 1290 1870 3579 4496 71353250D OLSEN CHANNEL AT MOORPARK ROAD 251 123 249 360 690 866 13753258D OLSEN CHANNEL WEST OF CAL LUTHERAN COLLEGE AT MEMORIAL PARKWAY 580 193 389 564 1080 1357 21543276D OLSEN CHANNEL AT AVENIDA DE LOS ARBOLES 1400 302 610 884 1692 2126 33733280CD NO. FK. ARR. CONEJO AFTER JCT. W/ OLSEN CHANNEL 4773 884 1786 2588 4953 6222 98743292C NO. FK. ARROYO CONEJO PRIIOR TO JCT W/ ARROYO CONEJO 5312 862 1742 2525 4832 6071 96343293BC CONEJO CREEK AFTER JCT. W/ NO. FK. ARROYO CONEJO 28725 3214 6496 9415 18016 22633 359183300B CONEJO CREEK BEFORE JCT. W/ ARROYO SANTA ROSA (TO MPD #800A) 29033 3205 6478 9390 17968 22573 358233332C SOUTH FORK TIERRA REJADA CK(EVERETT RANCH W/J'RAIN 1196 275 555 805 1540 1934 30693387DE TIERRA REJADA VLY AT U/S FACE OF 23 FREEWAY 1397 258 522 756 1447 1818 28853388D TIERRA REJADA VLY AT D/S FACE OF 23 FREEWAY 1397 258 521 755 1444 1814 28793395CD TIERRA REJADA VLY AT MOORPARK RD(W.OF 23 FREEWAY) 3643 619 1251 1813 3469 4358 69173398CE TIERRA REJADA VLY AT W OF MRPARK RD,W/ MRPARK HIGHLANDS 3719 629 1272 1844 3528 4432 70333424D TIERRA REJADA VLY, SO. CHNL AT SANTA ROSA MOUTH (J'100) 374 63 127 184 352 442 7023428CD TIERRA REJADA VLY AT ARR STA ROSA MOUTH,W/O PC-4,(J'ZN) 4516 667 1348 1953 3737 4695 74513430C ARROYO SANTA ROSA AT CONCRETE ARCH DAM (J'100) 4648 654 1322 1917 3668 4608 73133449CD ARR.STA.ROSA AT E.LAS POSAS RD.JCT.W/PENFIELD&SMITH UPDAT 5329 635 1284 1861 3561 4473 70993452CD ARR.STA.ROSA DWNSTRM.OF LOS POSAS RD (D/S OF FLOOD WALL) 5426 635 1284 1861 3560 4472 70983454C ARR.STA.ROSA @ THE BRIDGE @ SANTA ROSA RD. 5510 603 1218 1765 3378 4243 67343466CD ARR.STA.ROSA AFTER JCT.W/DUVAL RD.DRN,PRIOR TO JCT.W/TRIB. 5945 596 1205 1747 3342 4199 66643473DE STA.ROSA TRIB.AT MOUTH OF McRAE RANCH 344 89 180 261 500 628 9973480DE STA.ROSA TRIB.AT INTERSECTION OF MOORPARK RD & SANTA ROSA RD. 509 122 247 358 685 860 13653503DE STA.ROSA TRIB.AT VISTA ARROYO DR. 1109 189 382 553 1059 1330 21113513DE STA.ROSA TRIB.AT STA.ROSA RD.BELOW DEBRIS DAM,P&S UPDATE 1379 216 436 632 1209 1519 24113535D STA.ROSA TRIB.PRIOR TO JCT.W/ARR.STA.ROSA, P&S UPDATE 2398 325 657 952 1821 2288 36313536CD ARR.STA.ROSA @JCT.W/SAT.ROSA TRIB, PENFIELD &SMITH UPDATE 8343 677 1369 1984 3796 4769 75683568CD ARR.STA.ROSA PRIOR JCT.W/CONJ. CK.W/PENFIELD&SMITH UPDATE 9186 672 1359 1970 3769 4735 75143570BC CONEJO CREEK AFTER JCT. W/ARR.STA.ROSA PRESENT 38437 3299 6667 9664 18492 23231 368673597BC CONEJO CREEK AFTER JCT. W/ BARBARA DRIVE DRAIN 39701 2953 5969 8652 16556 20799 330083621C CAMROSA DRAIN PRIOR TO JCT. W/CONEJO CREEK 409 107 216 314 600 754 11973630BD CONEJO CREEK AT GAGE VC800 41370 3136 6339 9188 17581 22087 350513647C UPLAND RD.DRN.PRIOR TO JCT. W/CONEJO CK. 592 203 409 594 1136 1427 22643648BC CONEJO CREEK AFTER JCT.W/ UPLAND RD. DRN. 42174 3298 6665 9661 18486 23223 368553677D MISSION OAKS DRN. PRIOR TO JCT.W/CONEJO CR. 448 136 274 397 760 955 15153680BD CONEJO CREEK AFTER JCT.W/MISSION OAKS DRN. 43668 3305 6680 9682 18527 23275 369373705DE OAK GROVE CHANNEL PRIOR TO JCT.W/CONEJO CR. 1210 380 768 1113 2129 2675 42453706BD CONEJO CREEK AFTER JCT. W/OAK GROVE CHL. 45092 3283 6635 9618 18403 23120 366913724C EAST CAMARILLO DRN.PRIOR TO JCT. W/ CONEJO CR. 844 205 415 602 1151 1446 22953725BC CONEJO CREEK AFTER JCT.W/ EAST CAMARILLO DRN. 45936 3276 6621 9597 18363 23070 366113727B CONEJO CREEK AT HWY 101 W/SO BR.ARR.CON. BASINS 46018 3264 6597 9563 18298 22987 364813755BC CONEJO CR. AT RIDGE VIEWS ST. (NEXT TO ADOHR LANE) 47517 3263 6595 9560 18292 22980 364693788BC CONEJO CREEK AT HOWARD ROAD 48878 3185 6436 9329 17852 22427 355913800BC CONEJO CREEK AT PANCHO ROAD 49164 3178 6422 9309 17813 22378 355143811BE CONEJO CREEK PRIOR TO JCT.W/CALLEGUAS CK. 49677 3173 6412 9295 17785 22343 354583812AB CALLEGUAS CK. AFTER JCT.W/CONEJO CREEK 158933 5461 11037 15998 30611 38456 610293850AC CALLEGUAS CK. AT CSUCI ACCESS RD.(GAGE 805) (CS3) 159771 5456 11026 15982 30582 38419 60971
Table 1a FINAL
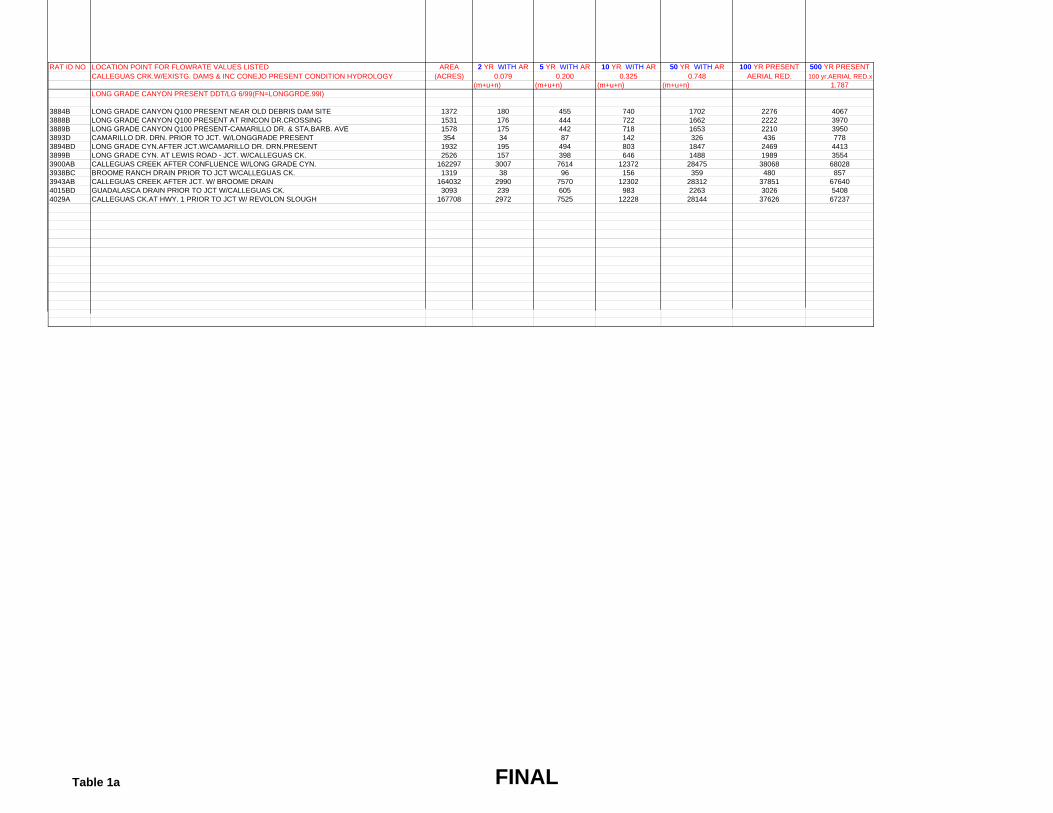
RAT ID NO LOCATION POINT FOR FLOWRATE VALUES LISTED AREA 2 YR WITH AR 5 YR WITH AR 10 YR WITH AR 50 YR WITH AR 100 YR PRESENT 500 YR PRESENT CALLEGUAS CRK.W/EXISTG. DAMS & INC CONEJO PRESENT CONDITION HYDROLOGY (ACRES) 0.079 0.200 0.325 0.748 AERIAL RED. 100 yr.AERIAL RED.x
(m+u+n) (m+u+n) (m+u+n) (m+u+n) 1.787 LONG GRADE CANYON PRESENT DDT/LG 6/99(FN=LONGGRDE.99I)
3884B LONG GRADE CANYON Q100 PRESENT NEAR OLD DEBRIS DAM SITE 1372 180 455 740 1702 2276 40673888B LONG GRADE CANYON Q100 PRESENT AT RINCON DR.CROSSING 1531 176 444 722 1662 2222 39703889B LONG GRADE CANYON Q100 PRESENT-CAMARILLO DR. & STA.BARB. AVE 1578 175 442 718 1653 2210 39503893D CAMARILLO DR. DRN. PRIOR TO JCT. W/LONGGRADE PRESENT 354 34 87 142 326 436 7783894BD LONG GRADE CYN.AFTER JCT.W/CAMARILLO DR. DRN.PRESENT 1932 195 494 803 1847 2469 44133899B LONG GRADE CYN. AT LEWIS ROAD - JCT. W/CALLEGUAS CK. 2526 157 398 646 1488 1989 35543900AB CALLEGUAS CREEK AFTER CONFLUENCE W/LONG GRADE CYN. 162297 3007 7614 12372 28475 38068 680283938BC BROOME RANCH DRAIN PRIOR TO JCT W/CALLEGUAS CK. 1319 38 96 156 359 480 8573943AB CALLEGUAS CREEK AFTER JCT. W/ BROOME DRAIN 164032 2990 7570 12302 28312 37851 676404015BD GUADALASCA DRAIN PRIOR TO JCT W/CALLEGUAS CK. 3093 239 605 983 2263 3026 54084029A CALLEGUAS CK.AT HWY. 1 PRIOR TO JCT W/ REVOLON SLOUGH 167708 2972 7525 12228 28144 37626 67237
Table 1a FINAL

RAT ID NO LOCATION POINT FOR FLOWRATE VALUES LISTED AREA 2 YR WITH AR 5 YR WITH AR 10 YR WITH AR 50 YR WITH AR 100 YR PRESENTREVOLON SL. WATERSHED - CALLEGUAS CK. PRESENT CONDITION HYDROLOGY (ACRES) 0.126 0.254 0.373 0.762 AERIAL RED.
(MXD+URBAN) (MXD+URBAN) (MXD+URBAN) (MXD+URBAN) 5001A REVOLON SLOUGH-CALLEG. MODEL OR/DBT 10/2002 FN=RVLN5000.99I 141 47 95 139 284 3735007A HONDA BARR. WEST FORK AT BERYLWOOD ROAD 817 122 247 362 741 973
5016AB HONDA BARR CONFLUENCE W/BERYLWOOD DITCH (EAST FK) 1428 190 384 563 1150 15115019A HONDA BARR. AT PRICE ROAD CROSSING 1779 191 386 566 1158 15215035C ARROYO COLORADO AT BERYLWOOD ROAD 1185 222 449 659 1347 17685037C ARROYO COLORADO PRIOR TO JCT. W/DITCH FROM PRICE RD 1253 203 410 602 1230 16155042E PRICE ROAD DRAIN AT BERYLWOOD ROAD 345 46 92 135 277 363
5043CE ARROYO COLORADO AFTER JCT.W/ PRICE ROAD DRN. 1598 241 488 716 1464 19225049A HONDA BARR. AFTER CONFLUENCE WITH ARROYO COLORADO 3878 400 809 1186 2424 3183
5057BE AGGEN RD DRN. JCT. W/NATURAL CHANNEL 540 131 265 388 794 10425072BC LOS ANGELES AVE. DRN.W/ AGGEN RD DRN.JCT. 1523 261 528 775 1584 20805079B LOS ANGELES AVE. DITCH PRIOR TO JCT.W/ HONDA BARR 1896 292 590 866 1769 2324
5083AB HONDA BARR. AT CENTER SCHOOL RD.XING 5925 551 1116 1637 3346 43945100DE MILLIGAN BARRANCA AT LA LOMA ROAD XING 1126 160 324 475 971 12765105D MILLIGAN BARRANCA AT LA AVE.(HWY 118)CROSSING 1669 189 382 560 1144 1502
5107AD HONDA BARR.CONFLUENCE W/MILLIGAN BARR. 8006 697 1410 2067 4226 55505111AB BEARDSLEY WASH AT CONFLUENCE WITH LAS POSAS DRN 8195 701 1418 2080 4252 55845119BC LAS POSAS DRN.PRIOR TO JCT.W/BEARDSLEY 180 55 111 163 334 4395121AB BEARDSLEY WASH AFTER JCT. W/ LAS POSAS DRAIN 8634 707 1432 2100 4292 56375145CE DITCH FROM WALNUT AVE PRIOR TO CROSSING LA AVE. 904 170 345 506 1035 13595149C MESA SCHOOL DRAIN PRIOR TO JCT.W/ BEARDSLEY WASH 1138 184 371 545 1113 14625167B RAMONA DBRIS/DETNT. BASIN ROUTED & FATTENED HYDROGRAPH (Qout=130) 254 16 33 48 99 1305174D LAS POSAS DEBRIS/DETENTION BASIN RTED FAT HYDROGRAPH (Qout=62) 168 8 16 23 47 62
5182BC LAS POSAS ESTATES DRN. OVERLAND FLOW @ TR.BNDRY W/RTN.BOX 613 84 170 250 511 6715185D SPANISH HILLS DRN.Q10F INTO LAKE (LOT99) FROM ARACENE CT. 57 23 46 68 139 1825196D SPANISH HILLS DRN-50 AC INTO LAKE LOT 101 50 16 32 46 95 124
5203BD LAS POSAS ESTATES DRN. AFTER JCT.W/TR.4227 MR LAKES 946 135 273 401 819 10755204E TRACT 4948 OUTFLOW HYDRGRPH W/DKT APPRV. BSN 2A RAT 95 3 7 10 20 265205E LAS POSAS EST.DRN-NORTH TRB. INC. BASIN IN TR 4948 PRIOR TO JCT W/CHNL 122 14 29 43 87 115
5206BE LAS POS.EST.DRN, WITHPOST-TR 4227&4948 W/RTN. 1068 136 276 404 826 10855208D TRACT 4948 OUTFLOW HYDROGRAPH W/DKT APPROVED BASIN 36 5 10 15 30 405209D TRIB.TO LAS POSAS EST.DRN,POST TR.4948 W/RTN.PRR.TO JCT W/MAIN 56 13 26 37 76 100
5212BD LAS POSAS ESTATES DRN.,POST TR 4227 &4948 W/RTN 1156 146 295 432 884 11605216BF LAS POSAS ESTATES DRN. W/60% SPLIT TO BEARDSLEY 1279 97 197 289 591 7765219B LAS POSAS ESTATES DIVERSION PRIOR TO JCT W/BEARDSLEY(60%) 1371 94 191 280 572 751
5220AB BEARDSLEY WASH AFTER JCT. W/ LAS POSAS ESTATES DRAIN (60%) 11738 849 1719 2521 5154 67685234CD LA VISTA DRN & UPPER PART OF LA AVE.W/S.CLR 666 127 256 376 768 10085242E LA VISTA DRAIN TRIBUTARY PRIOR TO JCT W/LA VISTA DRN. 361 75 153 224 458 601
5243CE LA VISTA DRN @ LA VISTA RD.AFTER JCT W/ TRIBUTARY 1115 199 403 590 1207 15855262D WRIGHT RD. DRN. W/ DITCH PRIOR TO SANTA CLARA DRN. JCT. 433 97 197 288 589 774
5263CD SANTA CLARA DRAIN AFTER JCT. W/ WRIGHT ROAD DRN. 1787 278 563 826 1688 22175268C SANTA CLARA DRAIN DIVERSION PRIOR TO JCT. W/ BEARDSLEY WASH 2103 275 557 817 1670 2192
5272AC BEARDSLEY WASH AFTER JCT. W/ SANTA CLARA DRN. DIVERSION 13841 1048 2121 3111 6360 83525275AC BEARDSLEY WASH AT CENTRAL AVE. BRIDGE (GAGE SITE) 13919 1049 2123 3113 6364 83575279A BEARDSLEY WASH PRIOR TO JCT. W/ NYELAND DRAIN ABOVE HWY 101 14056 1048 2121 3110 6357 83495284B UPPER NYELAND DRN. NEAR SATICOY COUNTRY CLUB 334 62 126 184 377 495
5293BC UPPER NYELAND OVERFLOW-CLUBHOUSE DR. INTO DITCH 849 127 257 376 769 10105297BD UPPER NYELAND DRN.AT CLUBHOUSE DR. PRIOR TO XING LA AVE. 1111 147 298 437 894 11745299B UPPER NYELAND DRN. PRIOR TO JCT. W/FERRO DITCH 1131 147 297 435 890 11685305D FERRO CANYON CHL. AT LA AVE.PRIOR JCT.W/UPPER NYELAND DRN. 544 102 206 302 617 811
5306BD NYELAND DRAIN AFTER JCT. W/ FERRO CHANNEL BELOW HWY 118 (LA AVE) 1675 227 459 674 1377 18095334BC NYELAND DRAIN AT CENTRAL AVE.W/UPPER NYELAND NOT DIVERTED 2829 286 578 848 1734 22775375C NYELAND DRN.TRIB.(ROSE RD-CENTRAL-101-STA.CLARA) W/BOYER 886 117 236 347 709 931
5376BC NYELAND DRN. AFTER JCT.OF TRIB. W/BOYER PROJ.(AUTO CTR.) 4119 351 711 1043 2132 28005378B NYELAND DRN. @ SANTA CLR & FRIEDRICH W/ BOYER(AUTO CTR.) 4119 350 708 1038 2122 2786
5380BE NYELAND DRN AFTER JCT. W/ NYELAND ACRES SIDE DRN. W/ BOYER 4181 350 709 1040 2125 27915391D LATERAL A AFTER JCT. W/LOCAL AREA 145 36 73 106 217 286
5392BD NYELAND DRN.AFTER JCT W/LATERAL A 4482 352 713 1046 2139 28095400CE NYELAND DRN.TRIB. TO NO.PRIOR TO JCT. W/NYELAND 373 38 77 113 232 3055401BC NYELAND DRN AFTER JCT. W/NORTH LATERALS-INC 477B W/BOYER 4855 377 764 1120 2290 30085406AB NYELAND DRN. JUNCTION W/BEARDSLEY WASH 19003 1255 2541 3726 7618 10003
Table 1b FINAL
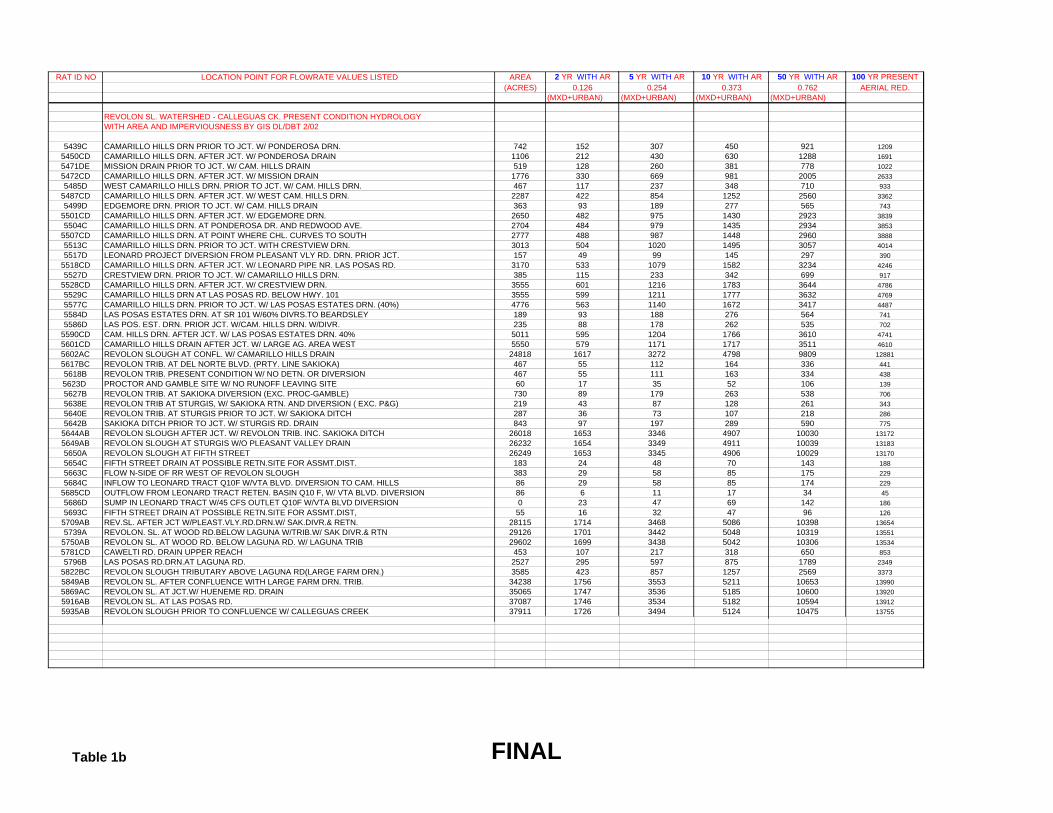
RAT ID NO LOCATION POINT FOR FLOWRATE VALUES LISTED AREA 2 YR WITH AR 5 YR WITH AR 10 YR WITH AR 50 YR WITH AR 100 YR PRESENT(ACRES) 0.126 0.254 0.373 0.762 AERIAL RED.
(MXD+URBAN) (MXD+URBAN) (MXD+URBAN) (MXD+URBAN)REVOLON SL. WATERSHED - CALLEGUAS CK. PRESENT CONDITION HYDROLOGYWITH AREA AND IMPERVIOUSNESS BY GIS DL/DBT 2/02
5439C CAMARILLO HILLS DRN PRIOR TO JCT. W/ PONDEROSA DRN. 742 152 307 450 921 12095450CD CAMARILLO HILLS DRN. AFTER JCT. W/ PONDEROSA DRAIN 1106 212 430 630 1288 16915471DE MISSION DRAIN PRIOR TO JCT. W/ CAM. HILLS DRAIN 519 128 260 381 778 10225472CD CAMARILLO HILLS DRN. AFTER JCT. W/ MISSION DRAIN 1776 330 669 981 2005 26335485D WEST CAMARILLO HILLS DRN. PRIOR TO JCT. W/ CAM. HILLS DRN. 467 117 237 348 710 933
5487CD CAMARILLO HILLS DRN. AFTER JCT. W/ WEST CAM. HILLS DRN. 2287 422 854 1252 2560 33625499D EDGEMORE DRN. PRIOR TO JCT. W/ CAM. HILLS DRAIN 363 93 189 277 565 743
5501CD CAMARILLO HILLS DRN. AFTER JCT. W/ EDGEMORE DRN. 2650 482 975 1430 2923 38395504C CAMARILLO HILLS DRN. AT PONDEROSA DR. AND REDWOOD AVE. 2704 484 979 1435 2934 3853
5507CD CAMARILLO HILLS DRN. AT POINT WHERE CHL. CURVES TO SOUTH 2777 488 987 1448 2960 38885513C CAMARILLO HILLS DRN. PRIOR TO JCT. WITH CRESTVIEW DRN. 3013 504 1020 1495 3057 40145517D LEONARD PROJECT DIVERSION FROM PLEASANT VLY RD. DRN. PRIOR JCT. 157 49 99 145 297 390
5518CD CAMARILLO HILLS DRN. AFTER JCT. W/ LEONARD PIPE NR. LAS POSAS RD. 3170 533 1079 1582 3234 42465527D CRESTVIEW DRN. PRIOR TO JCT. W/ CAMARILLO HILLS DRN. 385 115 233 342 699 917
5528CD CAMARILLO HILLS DRN. AFTER JCT. W/ CRESTVIEW DRN. 3555 601 1216 1783 3644 47865529C CAMARILLO HILLS DRN AT LAS POSAS RD. BELOW HWY. 101 3555 599 1211 1777 3632 47695577C CAMARILLO HILLS DRN. PRIOR TO JCT. W/ LAS POSAS ESTATES DRN. (40%) 4776 563 1140 1672 3417 44875584D LAS POSAS ESTATES DRN. AT SR 101 W/60% DIVRS.TO BEARDSLEY 189 93 188 276 564 7415586D LAS POS. EST. DRN. PRIOR JCT. W/CAM. HILLS DRN. W/DIVR. 235 88 178 262 535 702
5590CD CAM. HILLS DRN. AFTER JCT. W/ LAS POSAS ESTATES DRN. 40% 5011 595 1204 1766 3610 47415601CD CAMARILLO HILLS DRAIN AFTER JCT. W/ LARGE AG. AREA WEST 5550 579 1171 1717 3511 46105602AC REVOLON SLOUGH AT CONFL. W/ CAMARILLO HILLS DRAIN 24818 1617 3272 4798 9809 128815617BC REVOLON TRIB. AT DEL NORTE BLVD. (PRTY. LINE SAKIOKA) 467 55 112 164 336 4415618B REVOLON TRIB. PRESENT CONDITION W/ NO DETN. OR DIVERSION 467 55 111 163 334 4385623D PROCTOR AND GAMBLE SITE W/ NO RUNOFF LEAVING SITE 60 17 35 52 106 1395627B REVOLON TRIB. AT SAKIOKA DIVERSION (EXC. PROC-GAMBLE) 730 89 179 263 538 7065638E REVOLON TRIB AT STURGIS, W/ SAKIOKA RTN. AND DIVERSION ( EXC. P&G) 219 43 87 128 261 3435640E REVOLON TRIB. AT STURGIS PRIOR TO JCT. W/ SAKIOKA DITCH 287 36 73 107 218 2865642B SAKIOKA DITCH PRIOR TO JCT. W/ STURGIS RD. DRAIN 843 97 197 289 590 775
5644AB REVOLON SLOUGH AFTER JCT. W/ REVOLON TRIB. INC. SAKIOKA DITCH 26018 1653 3346 4907 10030 131725649AB REVOLON SLOUGH AT STURGIS W/O PLEASANT VALLEY DRAIN 26232 1654 3349 4911 10039 131835650A REVOLON SLOUGH AT FIFTH STREET 26249 1653 3345 4906 10029 131705654C FIFTH STREET DRAIN AT POSSIBLE RETN.SITE FOR ASSMT.DIST. 183 24 48 70 143 1885663C FLOW N-SIDE OF RR WEST OF REVOLON SLOUGH 383 29 58 85 175 2295684C INFLOW TO LEONARD TRACT Q10F W/VTA BLVD. DIVERSION TO CAM. HILLS 86 29 58 85 174 229
5685CD OUTFLOW FROM LEONARD TRACT RETEN. BASIN Q10 F, W/ VTA BLVD. DIVERSION 86 6 11 17 34 455686D SUMP IN LEONARD TRACT W/45 CFS OUTLET Q10F W/VTA BLVD DIVERSION 0 23 47 69 142 1865693C FIFTH STREET DRAIN AT POSSIBLE RETN.SITE FOR ASSMT.DIST, 55 16 32 47 96 126
5709AB REV.SL. AFTER JCT W/PLEAST.VLY.RD.DRN.W/ SAK.DIVR.& RETN. 28115 1714 3468 5086 10398 136545739A REVOLON. SL. AT WOOD RD.BELOW LAGUNA W/TRIB.W/ SAK DIVR.& RTN 29126 1701 3442 5048 10319 13551
5750AB REVOLON SL. AT WOOD RD. BELOW LAGUNA RD. W/ LAGUNA TRIB 29602 1699 3438 5042 10306 135345781CD CAWELTI RD. DRAIN UPPER REACH 453 107 217 318 650 8535796B LAS POSAS RD.DRN.AT LAGUNA RD. 2527 295 597 875 1789 2349
5822BC REVOLON SLOUGH TRIBUTARY ABOVE LAGUNA RD(LARGE FARM DRN.) 3585 423 857 1257 2569 33735849AB REVOLON SL. AFTER CONFLUENCE WITH LARGE FARM DRN. TRIB. 34238 1756 3553 5211 10653 139905869AC REVOLON SL. AT JCT.W/ HUENEME RD. DRAIN 35065 1747 3536 5185 10600 139205916AB REVOLON SL. AT LAS POSAS RD. 37087 1746 3534 5182 10594 139125935AB REVOLON SLOUGH PRIOR TO CONFLUENCE W/ CALLEGUAS CREEK 37911 1726 3494 5124 10475 13755
Table 1b FINAL

ARROYO SIMI
CALLEG UAS CREEK
LA NG CREEK
MUG
U DR
AIN
BEARDSLEY
AR RO Y O CO N EJO
R EVOLON C H ANNE L
INDU
STRI
AL D
RAIN
SANTA R OSA
LON G C
ANYO
N
ARRO YO LA S P OSA S
LAS LLA JAS C AN YO N
HOND A BARRANCA
T RIPA S CA N YO N
HAPPY CA MP CANY O N
C HIVO
CANYO N
WINDMI LL C
ANYON
OA K CANYON
MAHA
N BA
RRAN
C A
SAND CA NYON
LAS
POSA
S DR
AIN
GUADAL SCA DRAIN
B US CA NYON DR A IN
CAMAR ILLO HILLS DRAIN
C OY OTE CANYON
BR EA CA
NY ON
MILL
I GAN
BA
R RAN
CA
NO RTH S
IMI D RA
IN
L O NG G RADE CA NY ON
G ABB ERT CA
NYON
PUER
TA Z
UELA BA
RRAN CA
HUN T W
AS H
HID DEN V ALL EY WA SH
PEACH HIL L WA SH
ARR O
YO CO
LO
R ADO
LEWIS RO
AD DRAIN
MESA
SCH
OOL T
RI BU T
AR
Y
SC HOOL HOU
SE CA
NYON
MEIER CANY ON
RUSS
ELL C
REEK
S.C . D IVE RSION
OAK GROV E C HA NNEL
NUMBER
2
CANY
ON
LAS
POSA
S ES
TATE
S DR
A IN
NYELAND DRAIN
CAMPUS
ROAD CAN Y
ON
SHEK
ELL
R OA D
DRA
IN
R U NKL E CAN
YON
S YCA
MORE
CANYO
N
MIDDLE RIDG E CANYO N
CRES
TVIEW
DRA
I N
MISS
ION D
RAIN
EAST TR IBU TARY
MA R R DIVERS ION
VAL L EY R OAD WA SH
UPLA ND ROAD D RAIN
TAPO CANYO N TRIBUTARY
HUMM IN
G BI R
D T RIBUTARY
STOCK
TON RO A D D
RAIN
HAMPTO N CANYO N
L OS ROBL ES D RAIN
L AS LLAJ AS TRIBUTAR Y
TRIP
AS C
ANYO
N E
AST L
AT.
WES T FO RK SYCAM ORE CAN YON
POTRERO CREEK
IR ON TR
O UGH C
ANYO
N
ARNEILE DRAIN
S YCAM ORE C
AN Y ON
D RY CAN
YO
N
POT RERO CREEK
A LA M OS C
A NYO
N
ARRO Y O SIMI
GABB
ERT C
ANYON
T A
PO CA NY
ON
TAPO CA NYO N
SCHOO L HOUS
E CA
NYON
TRIP A S CA NY ON
RU N KL E CA NY ON
±Calleguas Creek Watershed BoundaryVCFCD Redline ChannelsMajor RoadsCities
Aerial PhotoMap Index
Figure 2a Figure 2b
Figure 2c Figure 2d
Please see enclosed CD, "Calleguas Creek Watershed Present Condition PDF Maps"Filenames: Aerial-NW.pdf, Aerial-NE.pdf, Aerial-SW.pdf, Aerial-SE.pdf
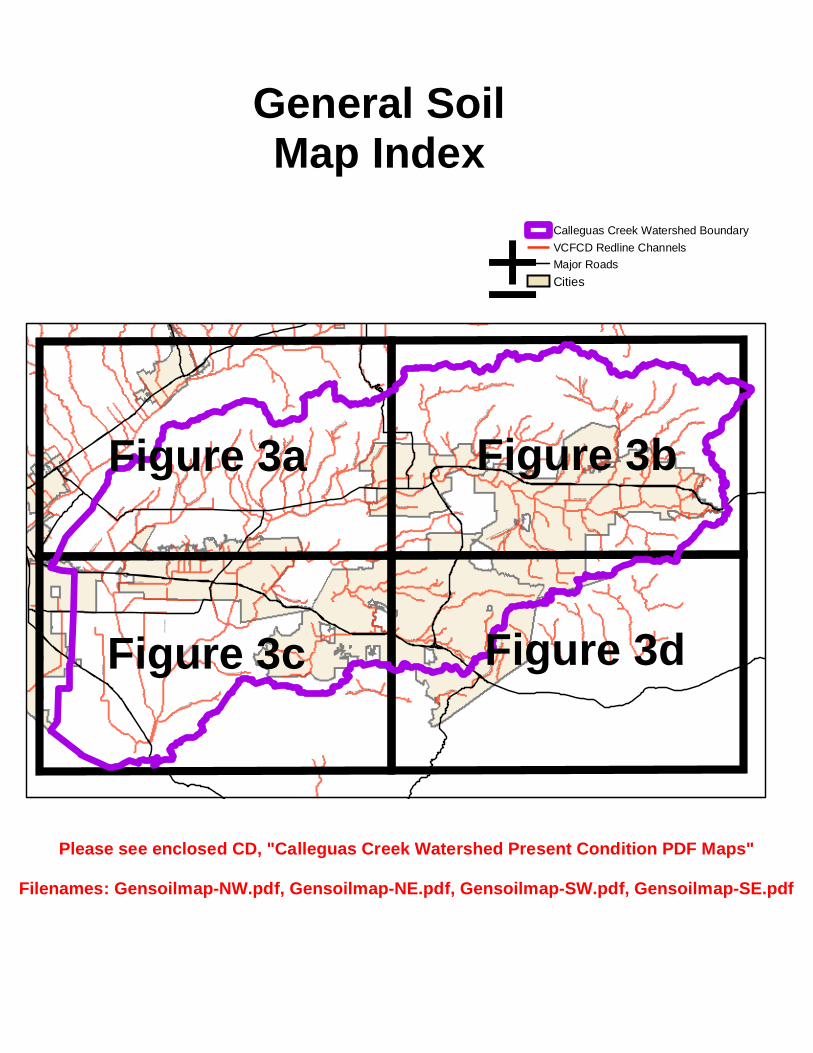
ARROYO SIMI
CALLEG UAS CREEK
LA NG CREEK
MUG
U DR
AIN
BEARDSLEY
AR RO Y O CO N EJO
R EVOLON C H ANNE L
INDU
STRI
AL D
RAIN
SANTA R OSA
LON G C
ANYO
N
ARRO YO LA S P OSA S
LAS LLA JAS C AN YO N
HOND A BARRANCA
T RIPA S CA N YO N
HAPPY CA MP CANY O N
C HIVO
CANYO N
WINDMI LL C
ANYON
OA K CANYON
MAHA
N BA
RRAN
C A
SAND CA NYON
LAS
POSA
S DR
AIN
GUADAL SCA DRAIN
B US CA NYON DR A IN
CAMAR ILLO HILLS DRAIN
C OY OTE CANYON
BR EA CA
NY ON
MILL
I GAN
BA
R RAN
CA
NO RTH S
IMI D RA
IN
L O NG G RADE CA NY ON
G ABB ERT CA
NYON
PUER
TA Z
UELA BA
RRAN CA
HUN T W
AS H
HID DEN V ALL EY WA SH
PEACH HIL L WA SH
ARR O
YO CO
LO
R ADO
LEWIS RO
AD DRAIN
MESA
SCH
OOL T
RI BU T
AR
Y
SC HOOL HOU
SE CA
NYON
MEIER CANY ON
RUSS
ELL C
REEK
S.C . D IVE RSION
OAK GROV E C HA NNEL
NUMBER
2
CANY
ON
LAS
POSA
S ES
TATE
S DR
A IN
NYELAND DRAIN
CAMPUS
ROAD CAN Y
ON
SHEK
ELL
R OA D
DRA
IN
R U NKL E CAN
YON
S YCA
MORE
CANYO
N
MIDDLE RIDG E CANYO N
CRES
TVIEW
DRA
I N
MISS
ION D
RAIN
EAST TR IBU TARY
MA R R DIVERS ION
VAL L EY R OAD WA SH
UPLA ND ROAD D RAIN
TAPO CANYO N TRIBUTARY
HUMM IN
G BI R
D T RIBUTARY
STOCK
TON RO A D D
RAIN
HAMPTO N CANYO N
L OS ROBL ES D RAIN
L AS LLAJ AS TRIBUTAR Y
TRIP
AS C
ANYO
N E
AST L
AT.
WES T FO RK SYCAM ORE CAN YON
POTRERO CREEK
IR ON TR
O UGH C
ANYO
N
ARNEILE DRAIN
S YCAM ORE C
AN Y ON
D RY CAN
YO
N
POT RERO CREEK
A LA M OS C
A NYO
N
ARRO Y O SIMI
GABB
ERT C
ANYON
T A
PO CA NY
ON
TAPO CA NYO N
SCHOO L HOUS
E CA
NYON
TRIP A S CA NY ON
RU N KL E CA NY ON
±Calleguas Creek Watershed BoundaryVCFCD Redline ChannelsMajor RoadsCities
General SoilMap Index
Figure 3a Figure 3b
Figure 3c Figure 3d
Please see enclosed CD, "Calleguas Creek Watershed Present Condition PDF Maps"Filenames: Gensoilmap-NW.pdf, Gensoilmap-NE.pdf, Gensoilmap-SW.pdf, Gensoilmap-SE.pdf

ARROYO SIMI
CALLEG UAS CREEK
LA NG CREEK
MUG
U DR
AIN
BEARDSLEY
AR RO Y O CO N EJO
R EVOLON C H ANNE L
INDU
STRI
AL D
RAIN
SANTA R OSA
LON G C
ANYO
N
ARRO YO LA S P OSA S
LAS LLA JAS C AN YO N
HOND A BARRANCA
T RIPA S CA N YO N
HAPPY CA MP CANY O N
C HIVO
CANYO N
WINDMI LL C
ANYON
OA K CANYON
MAHA
N BA
RRAN
C A
SAND CA NYON
LAS
POSA
S DR
AIN
GUADAL SCA DRAIN
B US CA NYON DR A IN
CAMAR ILLO HILLS DRAIN
C OY OTE CANYON
BR EA CA
NY ON
MILL
I GAN
BA
R RAN
CA
NO RTH S
IMI D RA
IN
L O NG G RADE CA NY ON
G ABB ERT CA
NYON
PUER
TA Z
UELA BA
RRAN CA
HUN T W
AS H
HID DEN V ALL EY WA SH
PEACH HIL L WA SH
ARR O
YO CO
LO
R ADO
LEWIS RO
AD DRAIN
MESA
SCH
OOL T
RI BU T
AR
Y
SC HOOL HOU
SE CA
NYON
MEIER CANY ON
RUSS
ELL C
REEK
S.C . D IVE RSION
OAK GROV E C HA NNEL
NUMBER
2
CANY
ON
LAS
POSA
S ES
TATE
S DR
A IN
NYELAND DRAIN
CAMPUS
ROAD CAN Y
ON
SHEK
ELL
R OA D
DRA
IN
R U NKL E CAN
YON
S YCA
MORE
CANYO
N
MIDDLE RIDG E CANYO N
CRES
TVIEW
DRA
I N
MISS
ION D
RAIN
EAST TR IBU TARY
MA R R DIVERS ION
VAL L EY R OAD WA SH
UPLA ND ROAD D RAIN
TAPO CANYO N TRIBUTARY
HUMM IN
G BI R
D T RIBUTARY
STOCK
TON RO A D D
RAIN
HAMPTO N CANYO N
L OS ROBL ES D RAIN
L AS LLAJ AS TRIBUTAR Y
TRIP
AS C
ANYO
N E
AST L
AT.
WES T FO RK SYCAM ORE CAN YON
POTRERO CREEK
IR ON TR
O UGH C
ANYO
N
ARNEILE DRAIN
S YCAM ORE C
AN Y ON
D RY CAN
YO
N
POT RERO CREEK
A LA M OS C
A NYO
N
ARRO Y O SIMI
GABB
ERT C
ANYON
T A
PO CA NY
ON
TAPO CA NYO N
SCHOO L HOUS
E CA
NYON
TRIP A S CA NY ON
RU N KL E CA NY ON
±Calleguas Creek Watershed BoundaryVCFCD Redline ChannelsMajor RoadsCities
Present Land UseMap Index
Figure 4a Figure 4b
Figure 4c Figure 4d
Please see enclosed CD, "Calleguas Creek Watershed Present Condition PDF Maps"Filenames: landuse-NW.pdf, landuse-NE.pdf, landuse-SW.pdf, landuse-SE.pdf

ARROYO SIMI
CALLEG UAS CREEK
LA NG CREEK
MUG
U DR
AIN
BEARDSLEY
AR RO Y O CO N EJO
R EVOLON C H ANNE L
INDU
STRI
AL D
RAIN
SANTA R OSA
LON G C
ANYO
N
ARRO YO LA S P OSA S
LAS LLA JAS C AN YO N
HOND A BARRANCA
T RIPA S CA N YO N
HAPPY CA MP CANY O N
C HIVO
CANYO N
WINDMI LL C
ANYON
OA K CANYON
MAHA
N BA
RRAN
C A
SAND CA NYON
LAS
POSA
S DR
AIN
GUADAL SCA DRAIN
B US CA NYON DR A IN
CAMAR ILLO HILLS DRAIN
C OY OTE CANYON
BR EA CA
NY ON
MILL
I GAN
BA
R RAN
CA
NO RTH S
IMI D RA
IN
L O NG G RADE CA NY ON
G ABB ERT CA
NYON
PUER
TA Z
UELA BA
RRAN CA
HUN T W
AS H
HID DEN V ALL EY WA SH
PEACH HIL L WA SH
ARR O
YO CO
LO
R ADO
LEWIS RO
AD DRAIN
MESA
SCH
OOL T
RI BU T
AR
Y
SC HOOL HOU
SE CA
NYON
MEIER CANY ON
RUSS
ELL C
REEK
S.C . D IVE RSION
OAK GROV E C HA NNEL
NUMBER
2
CANY
ON
LAS
POSA
S ES
TATE
S DR
A IN
NYELAND DRAIN
CAMPUS
ROAD CAN Y
ON
SHEK
ELL
R OA D
DRA
IN
R U NKL E CAN
YON
S YCA
MORE
CANYO
N
MIDDLE RIDG E CANYO N
CRES
TVIEW
DRA
I N
MISS
ION D
RAIN
EAST TR IBU TARY
MA R R DIVERS ION
VAL L EY R OAD WA SH
UPLA ND ROAD D RAIN
TAPO CANYO N TRIBUTARY
HUMM IN
G BI R
D T RIBUTARY
STOCK
TON RO A D D
RAIN
HAMPTO N CANYO N
L OS ROBL ES D RAIN
L AS LLAJ AS TRIBUTAR Y
TRIP
AS C
ANYO
N E
AST L
AT.
WES T FO RK SYCAM ORE CAN YON
POTRERO CREEK
IR ON TR
O UGH C
ANYO
N
ARNEILE DRAIN
S YCAM ORE C
AN Y ON
D RY CAN
YO
N
POT RERO CREEK
A LA M OS C
A NYO
N
ARRO Y O SIMI
GABB
ERT C
ANYON
T A
PO CA NY
ON
TAPO CA NYO N
SCHOO L HOUS
E CA
NYON
TRIP A S CA NY ON
RU N KL E CA NY ON
±Calleguas Creek Watershed BoundaryVCFCD Redline ChannelsMajor RoadsCities
Hydrology MapMap Index
Figure 5a Figure 5b
Figure 5c Figure 5d
Please see enclosed CD, "Calleguas Creek Watershed Present Condition PDF Maps"Filenames: hydromap-NW.pdf, hydromap-NE.pdf, hydromap-SW.pdf, hydromap-SE.pdf
Related Documents