1 David Rizzardo, PE Chief, Snow Surveys Section Hydrology Branch/Division of Flood Management California Department of Water Resources California’s Water Supply Forecasting DWR & Water Education Foundation: Challenges for Water Operations April 26, 2016 Fresno State University

Welcome message from author
This document is posted to help you gain knowledge. Please leave a comment to let me know what you think about it! Share it to your friends and learn new things together.
Transcript
1
David Rizzardo, PE
Chief, Snow Surveys Section
Hydrology Branch/Division of Flood Management
California Department of Water Resources
California’s Water Supply Forecasting
DWR & Water Education Foundation:
Challenges for Water Operations April 26, 2016
Fresno State University
2
Background on Water Supply Forecasting Products
3
4
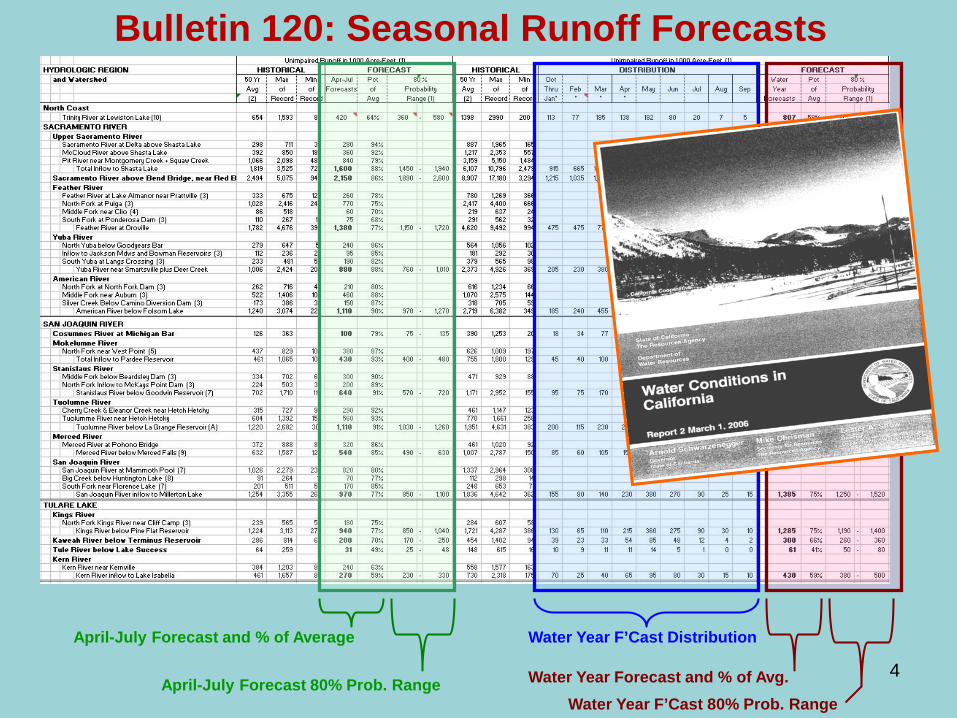
Bulletin 120: Seasonal Runoff Forecasts
April-July Forecast and % of Average
April-July Forecast 80% Prob. Range
Water Year F’Cast Distribution
Water Year Forecast and % of Avg. Water Year F’Cast 80% Prob. Range
5
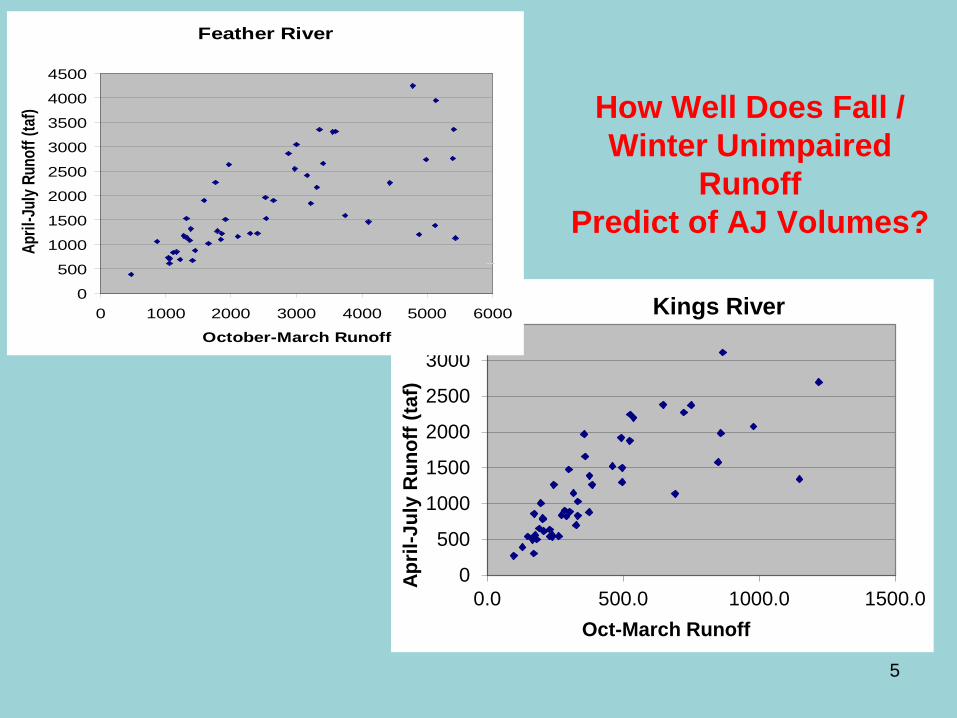
How Well Does Fall / Winter Unimpaired
Runoff Predict of AJ Volumes?
0
500
1000
1500
2000
2500
3000
3500
0.0 500.0 1000.0 1500.0
April
-Jul
y R
unof
f (ta
f)
Oct-March Runoff
Kings River
Feather River
0
500
1000
1500
2000
2500
3000
3500
4000
4500
0 1000 2000 3000 4000 5000 6000
October-March Runoff
April
-Jul
y Run
off (
taf)
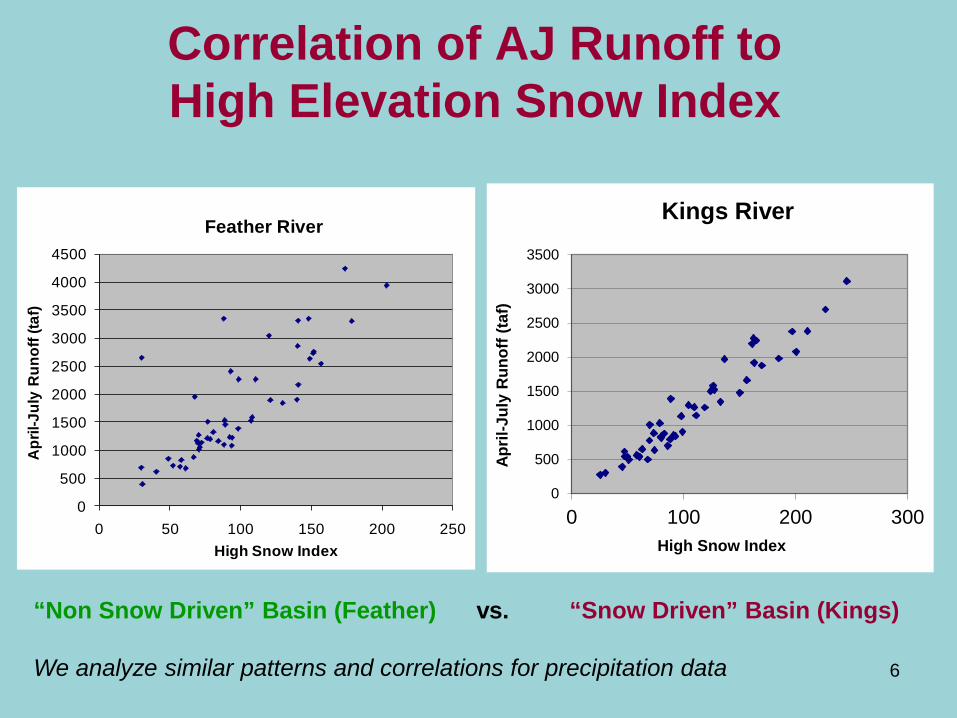
Correlation of AJ Runoff to High Elevation Snow Index
6
0
500
1000
1500
2000
2500
3000
3500
0 100 200 300Ap
ril-J
uly
Run
off (
taf)
High Snow Index
Kings River
0
500
1000
1500
2000
2500
3000
3500
4000
4500
0 50 100 150 200 250
Apr
il-Ju
ly R
unof
f (ta
f)
High Snow Index
Feather River
“Non Snow Driven” Basin (Feather) vs. “Snow Driven” Basin (Kings) We analyze similar patterns and correlations for precipitation data
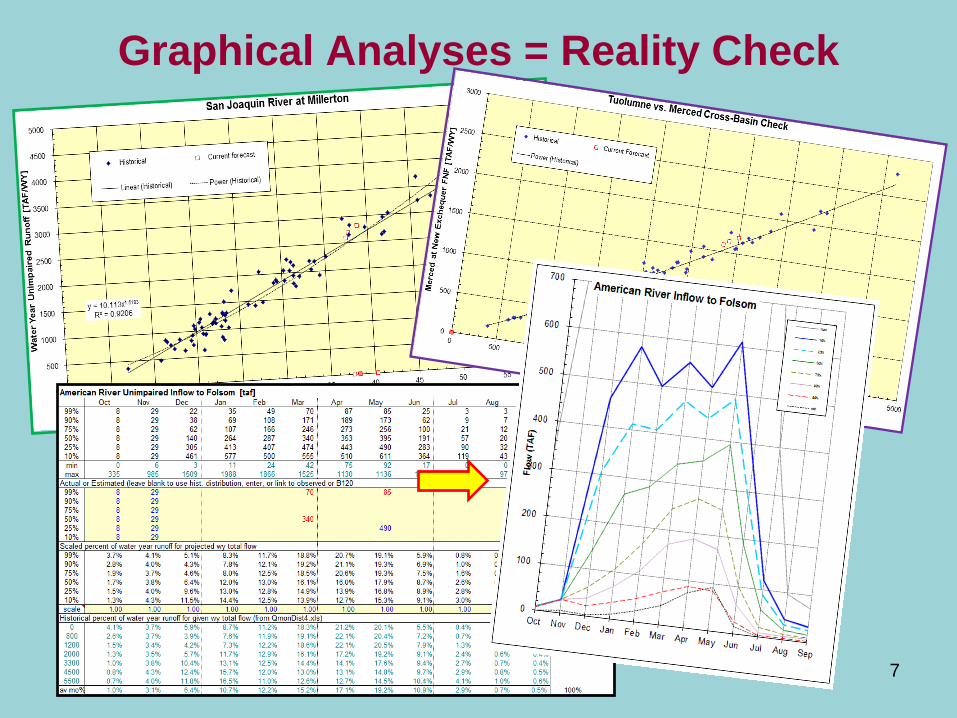
Graphical Analyses = Reality Check
7
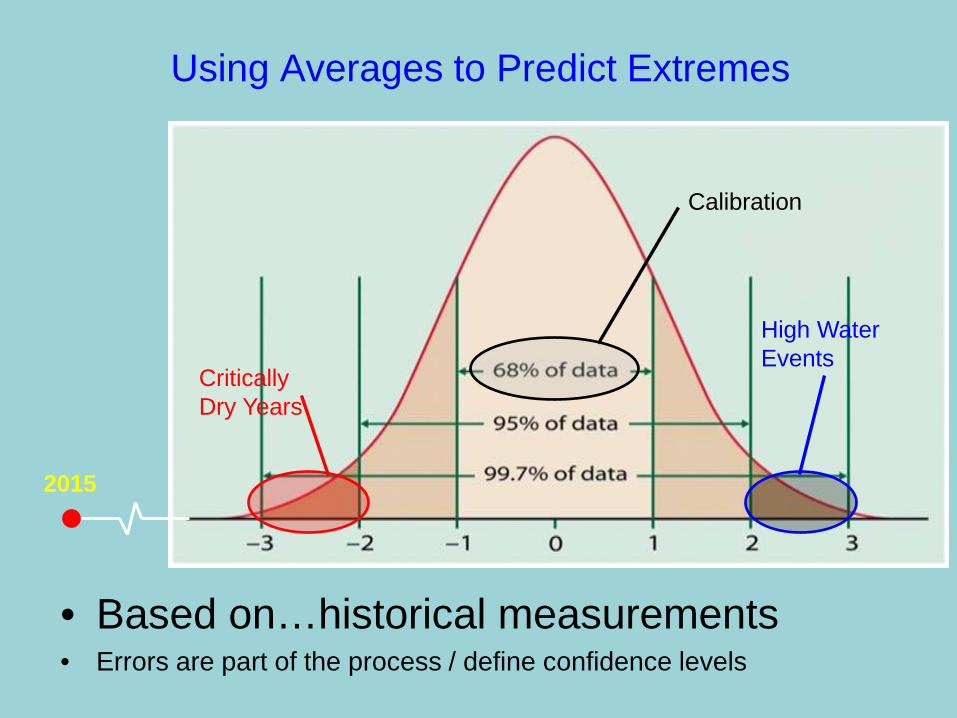
Using Averages to Predict Extremes
Calibration
High Water Events
Critically Dry Years
• Based on…historical measurements • Errors are part of the process / define confidence levels
2015
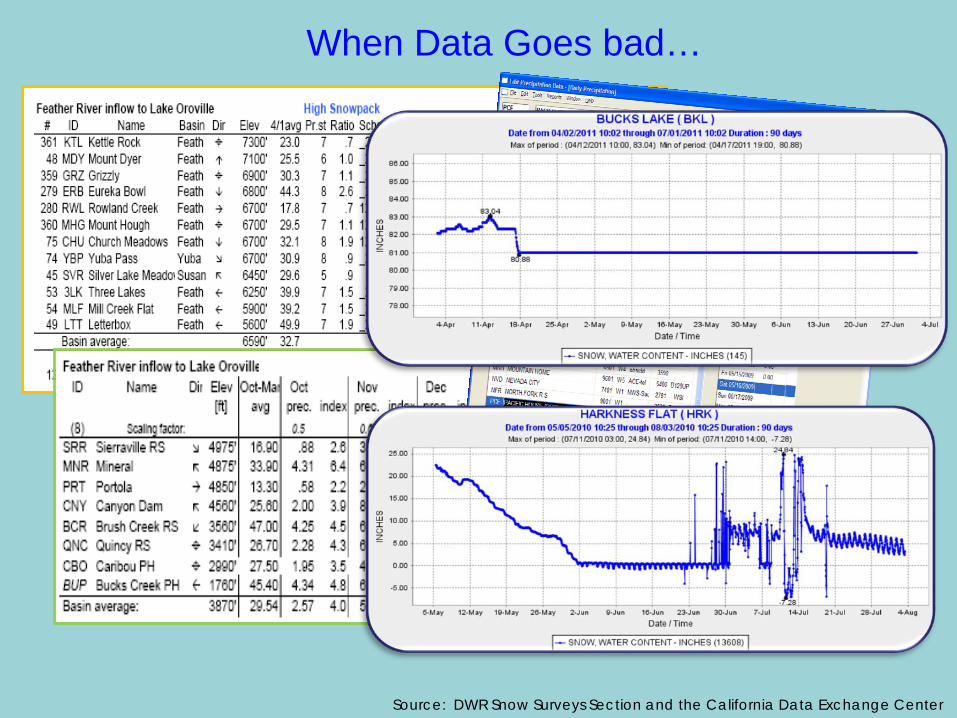
When Data Goes bad…
Source: DWR Snow Surveys Section and the California Data Exchange Center
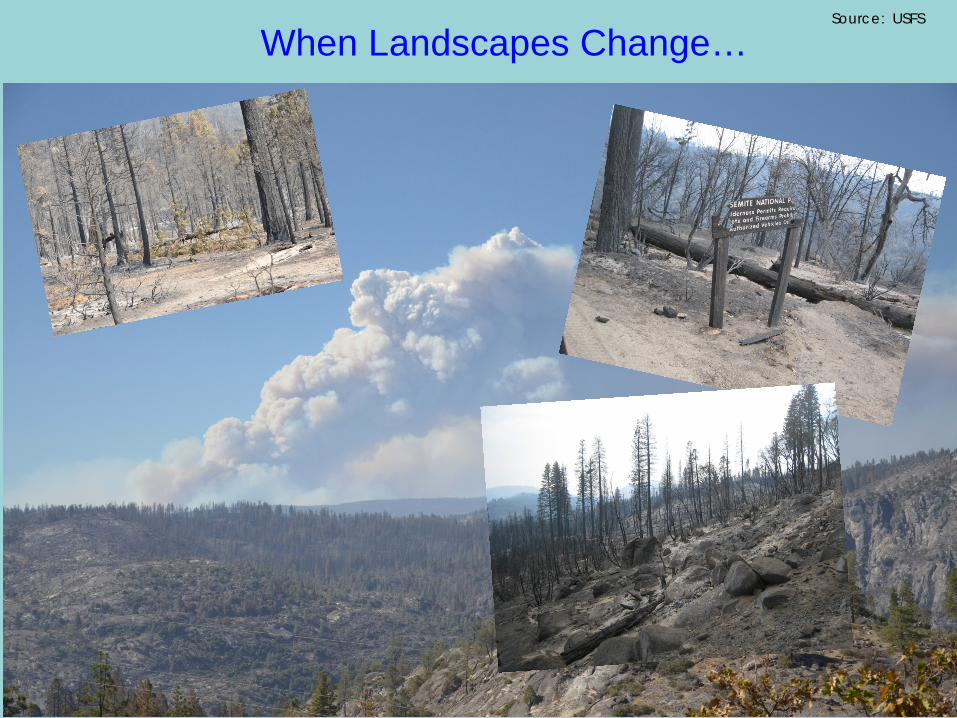
When Landscapes Change… Source: USFS
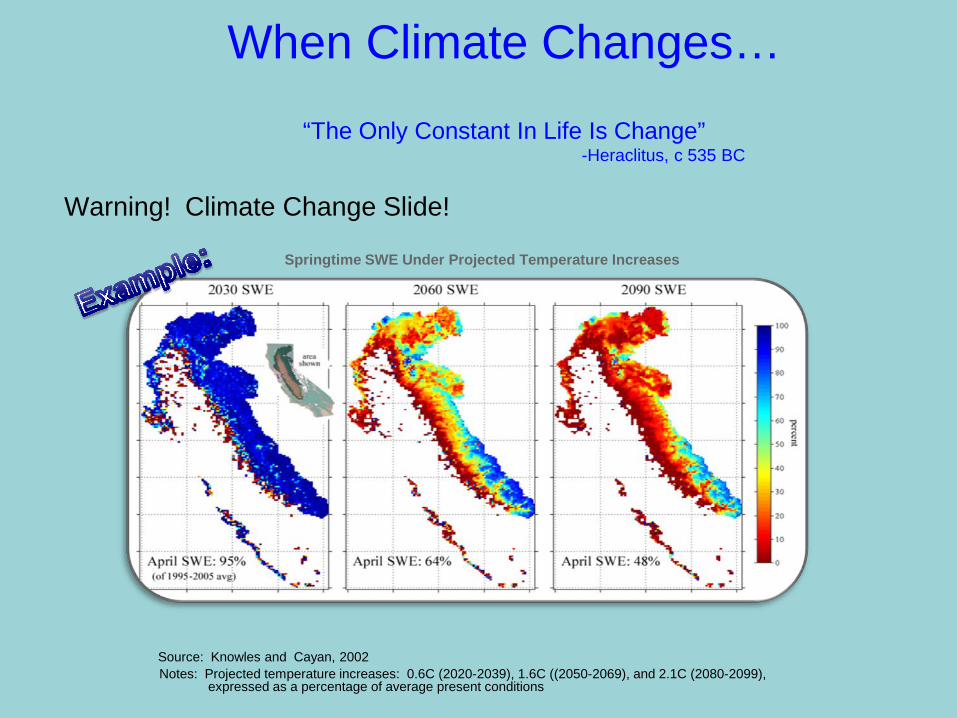
When Climate Changes…
“The Only Constant In Life Is Change” -Heraclitus, c 535 BC
Warning! Climate Change Slide!
Springtime SWE Under Projected Temperature Increases
Source: Knowles and Cayan, 2002 Notes: Projected temperature increases: 0.6C (2020-2039), 1.6C ((2050-2069), and 2.1C (2080-2099),
expressed as a percentage of average present conditions
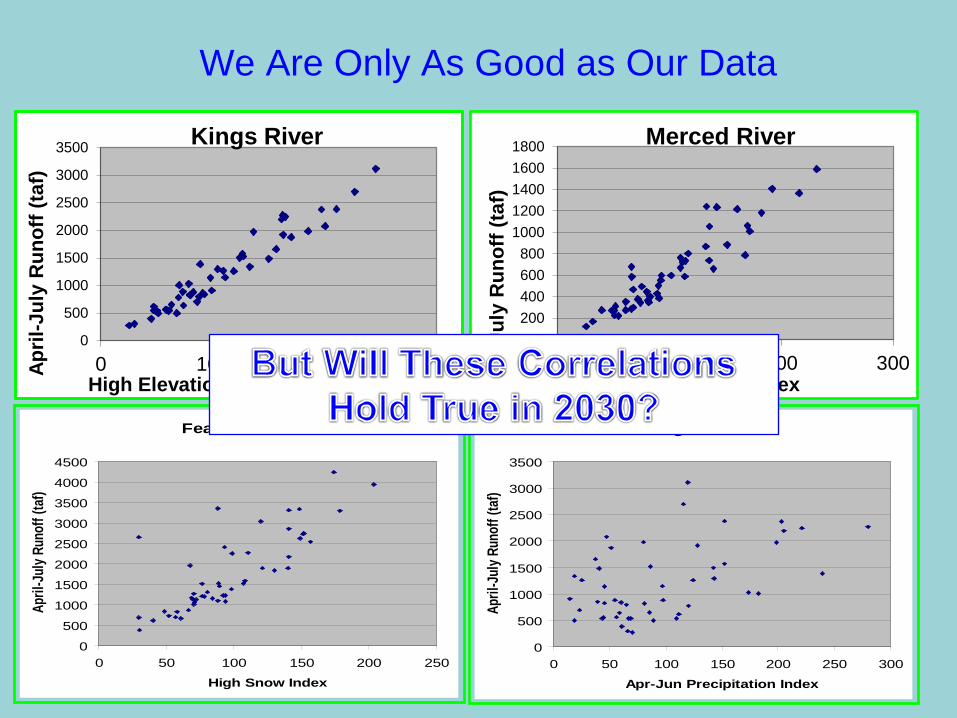
We Are Only As Good as Our Data
0
500
1000
1500
2000
2500
3000
3500
0 100 200 300April
-Jul
y R
unof
f (ta
f)
High Elevation Snow Index
Kings River
0200400600800
10001200140016001800
0 100 200 300
April
-Jul
y R
unof
f (ta
f)
Snow Index
Merced River
Feather River
0
500
1000
1500
2000
2500
3000
3500
4000
4500
0 50 100 150 200 250
High Snow Index
April
-Jul
y Run
off (
taf)
Kings River
0
500
1000
1500
2000
2500
3000
3500
0 50 100 150 200 250 300
Apr-Jun Precipitation Index
April
-Jul
y Run
off (
taf)
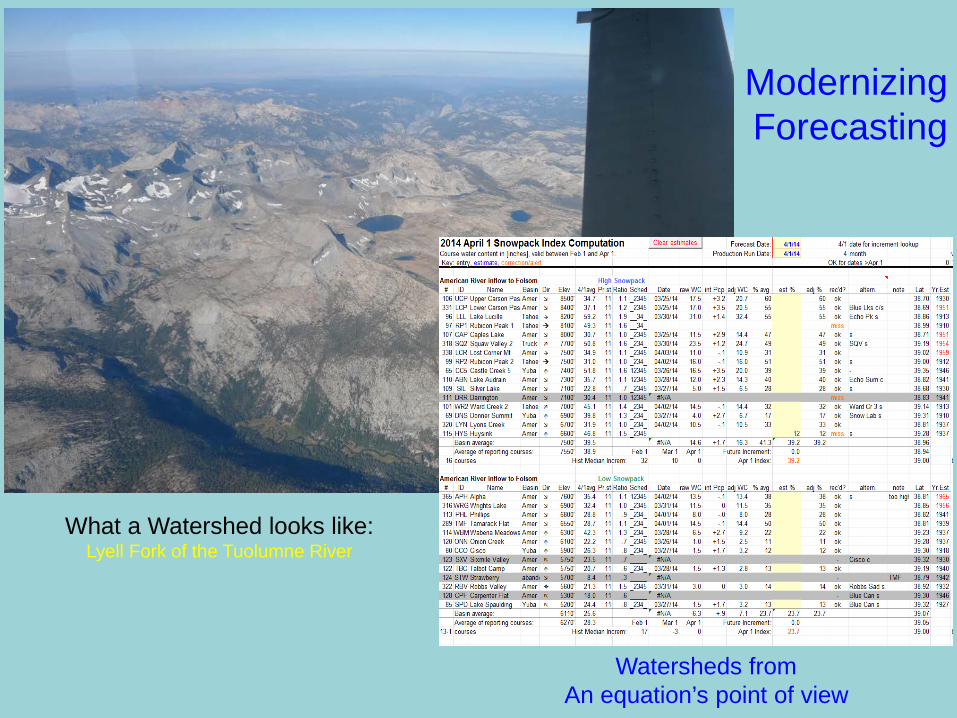
Modernizing Forecasting
What a Watershed looks like: Lyell Fork of the Tuolumne River
Watersheds from An equation’s point of view
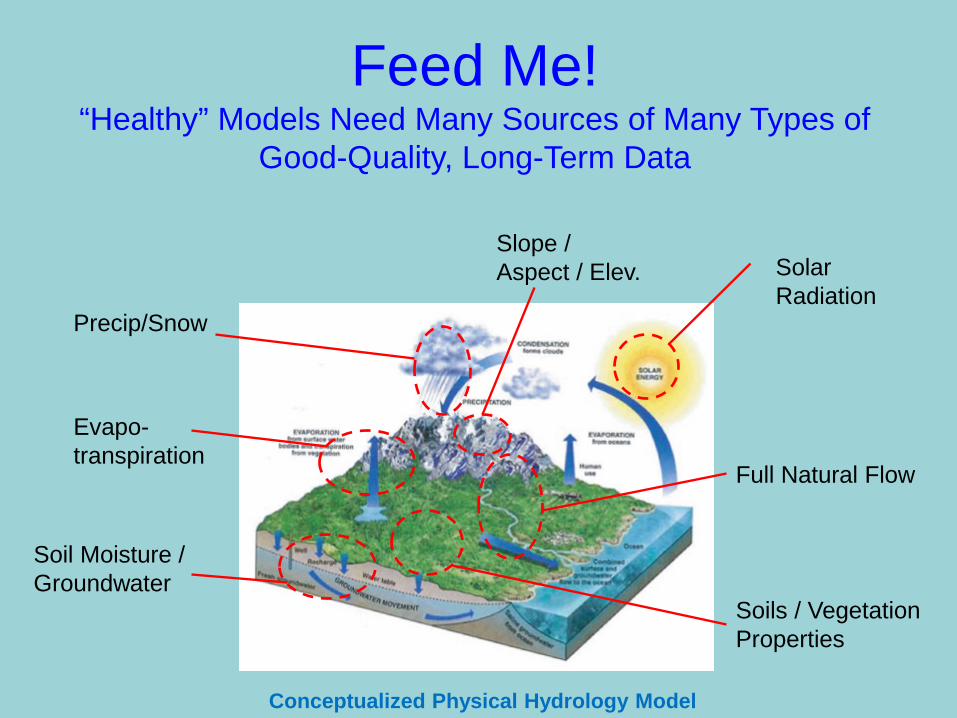
Feed Me! “Healthy” Models Need Many Sources of Many Types of
Good-Quality, Long-Term Data
Conceptualized Physical Hydrology Model
Solar Radiation
Evapo-transpiration
Precip/Snow
Full Natural Flow
Soil Moisture / Groundwater
Slope / Aspect / Elev.
Soils / Vegetation Properties
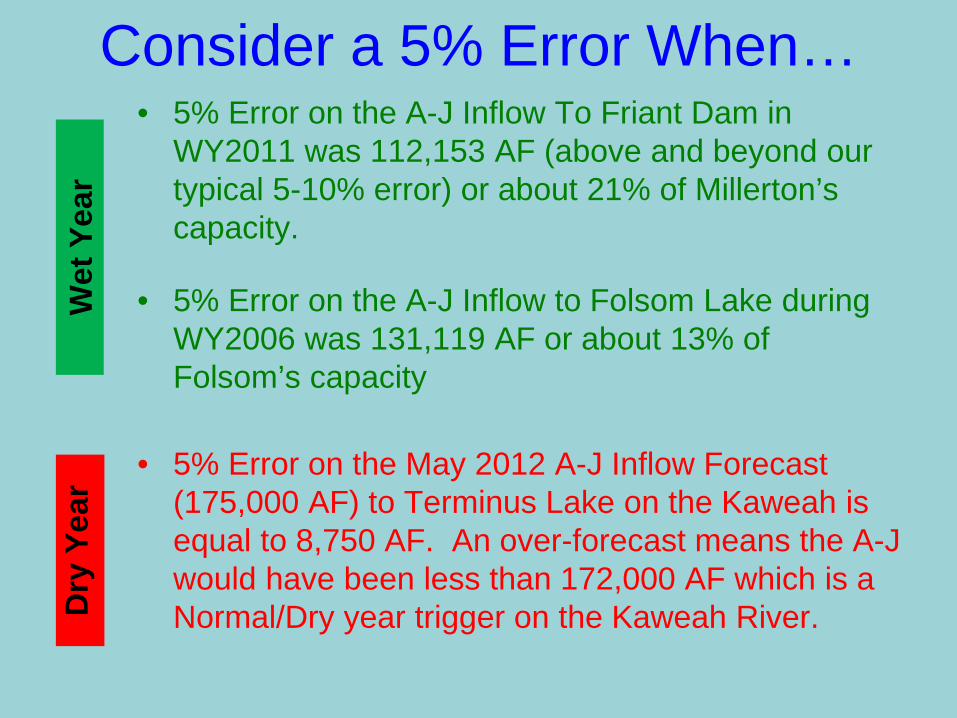
Consider a 5% Error When… W
et Y
ear
Dry
Yea
r • 5% Error on the A-J Inflow To Friant Dam in
WY2011 was 112,153 AF (above and beyond our typical 5-10% error) or about 21% of Millerton’s capacity.
• 5% Error on the A-J Inflow to Folsom Lake during WY2006 was 131,119 AF or about 13% of Folsom’s capacity
• 5% Error on the May 2012 A-J Inflow Forecast (175,000 AF) to Terminus Lake on the Kaweah is equal to 8,750 AF. An over-forecast means the A-J would have been less than 172,000 AF which is a Normal/Dry year trigger on the Kaweah River.
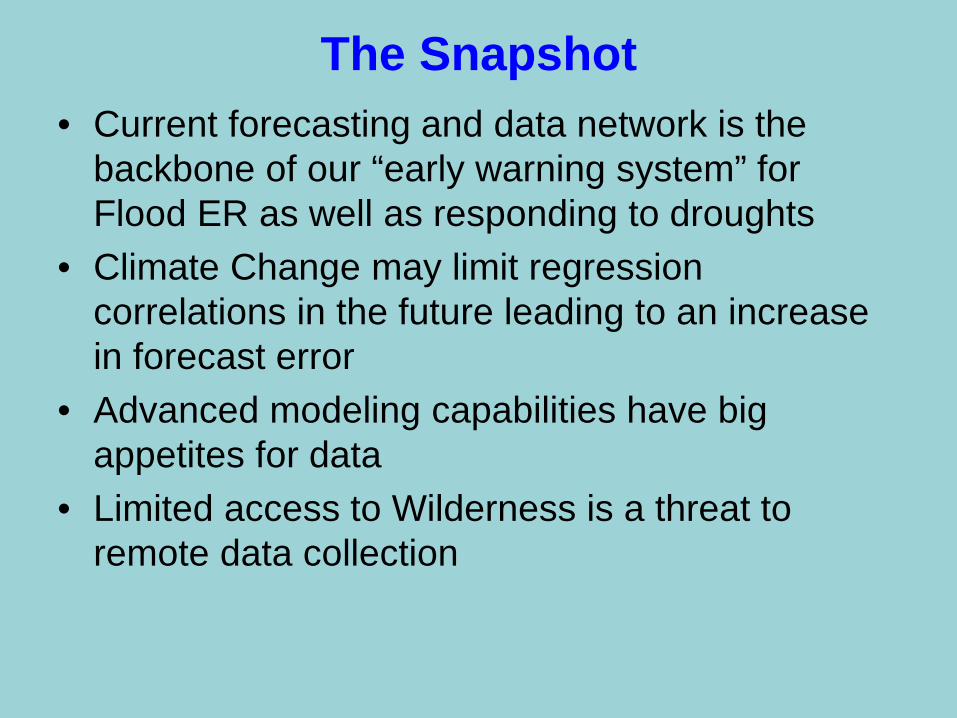
The Snapshot • Current forecasting and data network is the
backbone of our “early warning system” for Flood ER as well as responding to droughts
• Climate Change may limit regression correlations in the future leading to an increase in forecast error
• Advanced modeling capabilities have big appetites for data
• Limited access to Wilderness is a threat to remote data collection
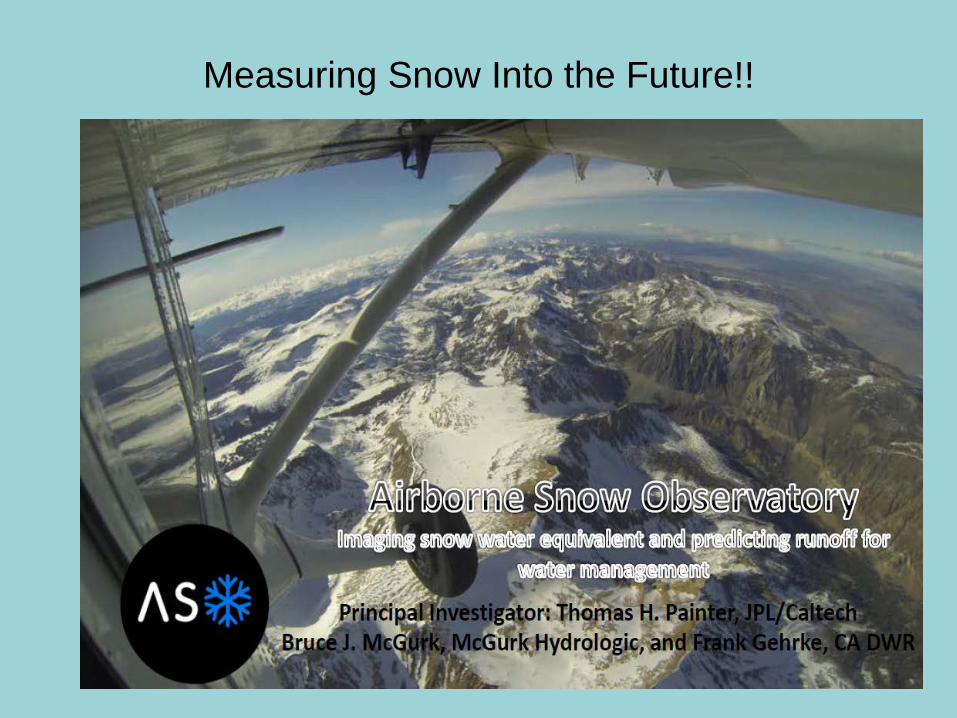
Measuring Snow Into the Future!!
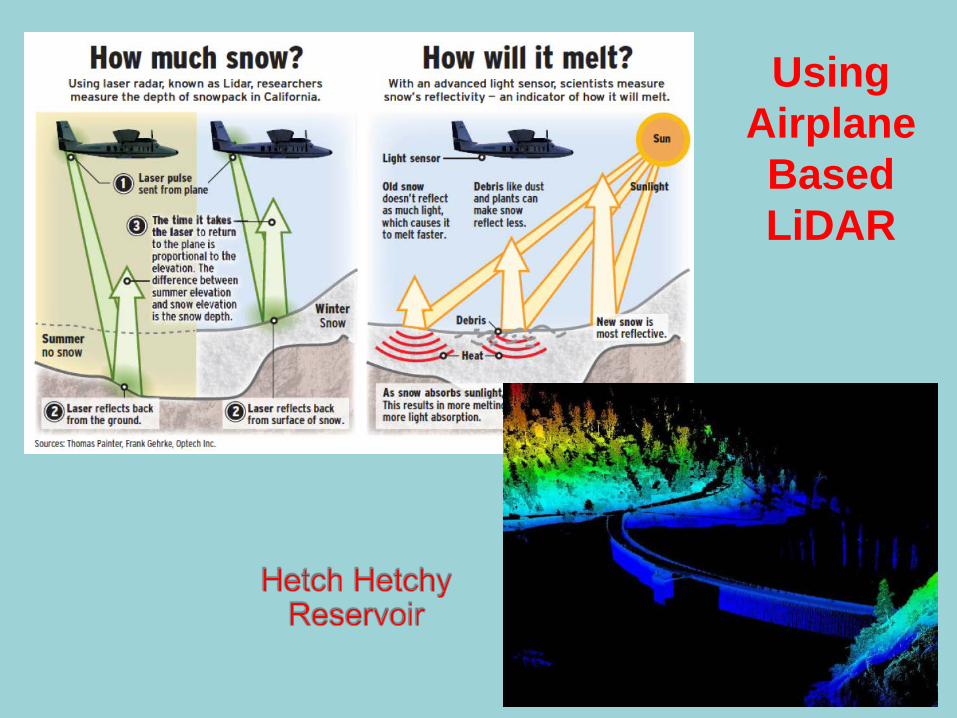
Using Airplane Based LiDAR
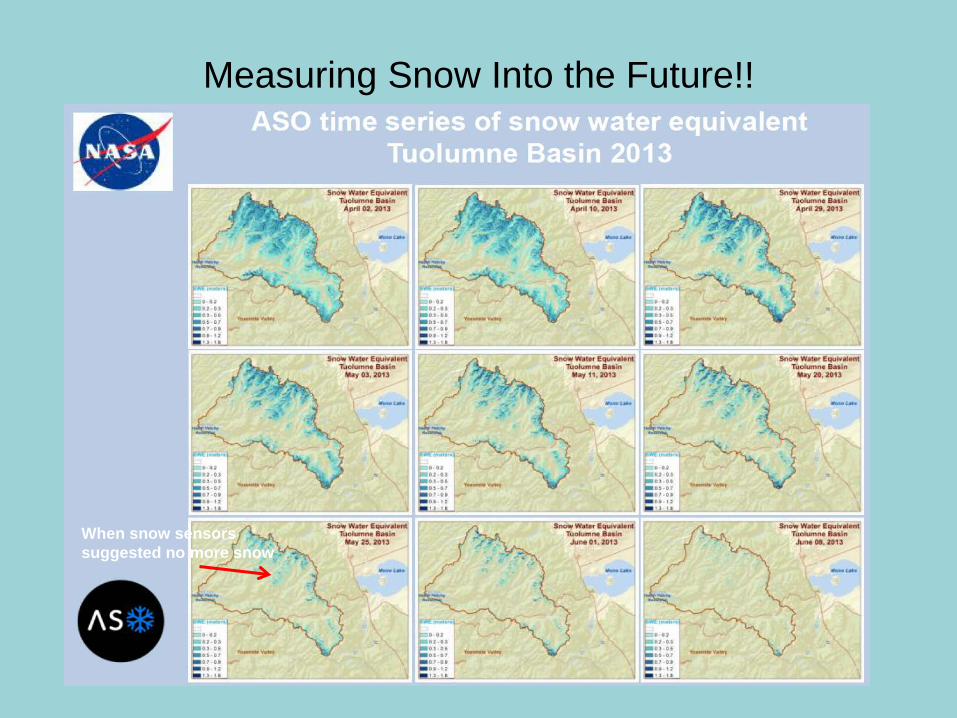
Measuring Snow Into the Future!!
When snow sensors suggested no more snow
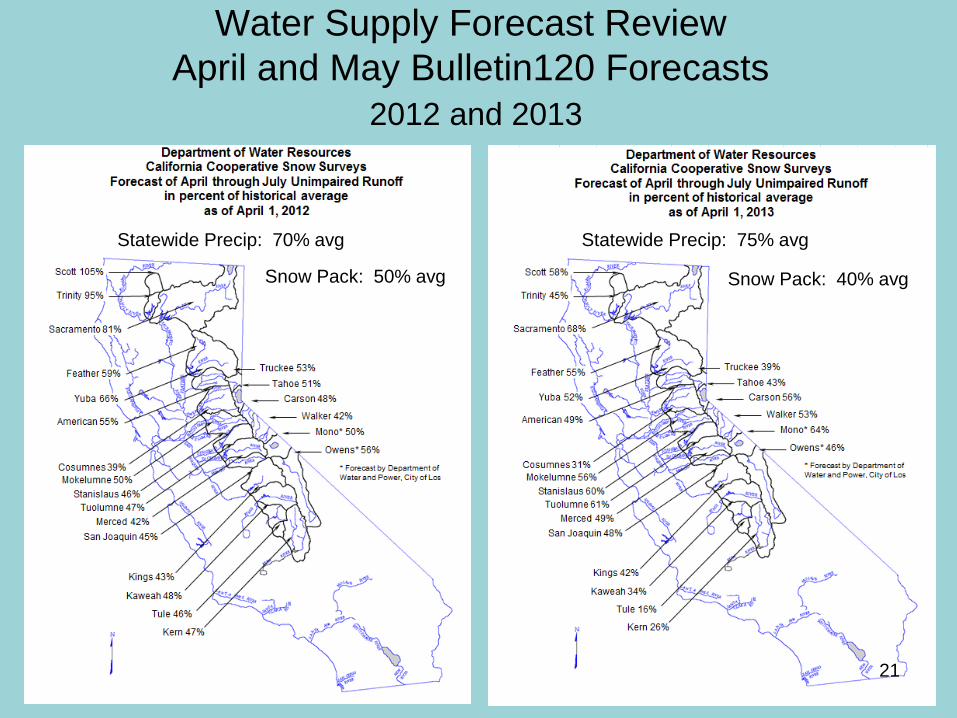
Water Supply Forecast Review April and May Bulletin120 Forecasts
2012 and 2013
21
Statewide Precip: 70% avg Statewide Precip: 75% avg
Snow Pack: 50% avg Snow Pack: 40% avg
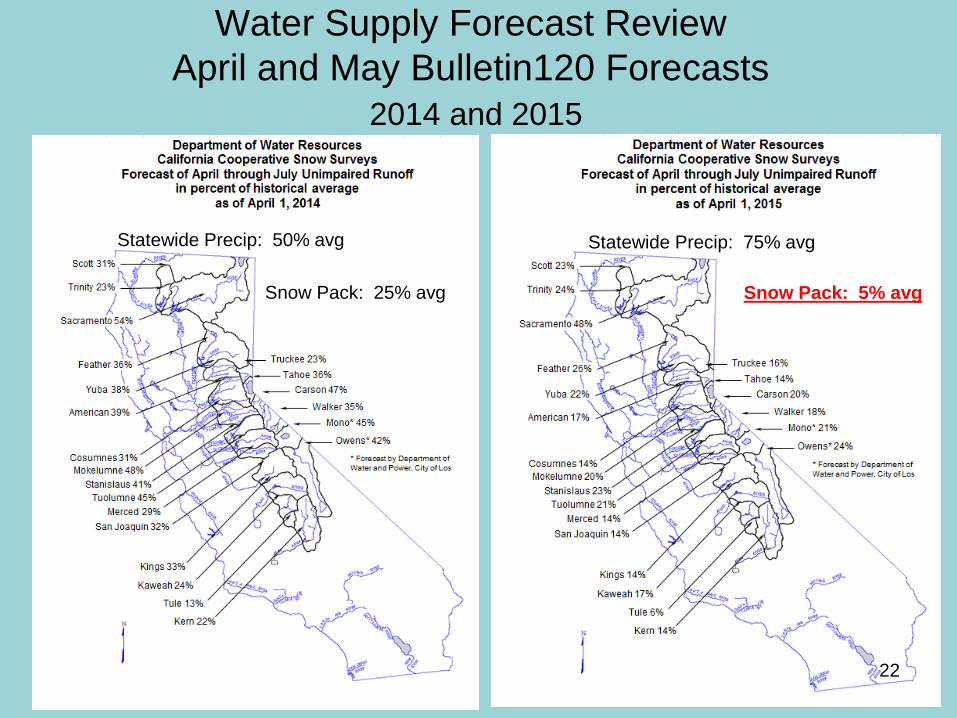
Water Supply Forecast Review April and May Bulletin120 Forecasts
2014 and 2015
22
Statewide Precip: 50% avg Statewide Precip: 75% avg
Snow Pack: 5% avg Snow Pack: 25% avg
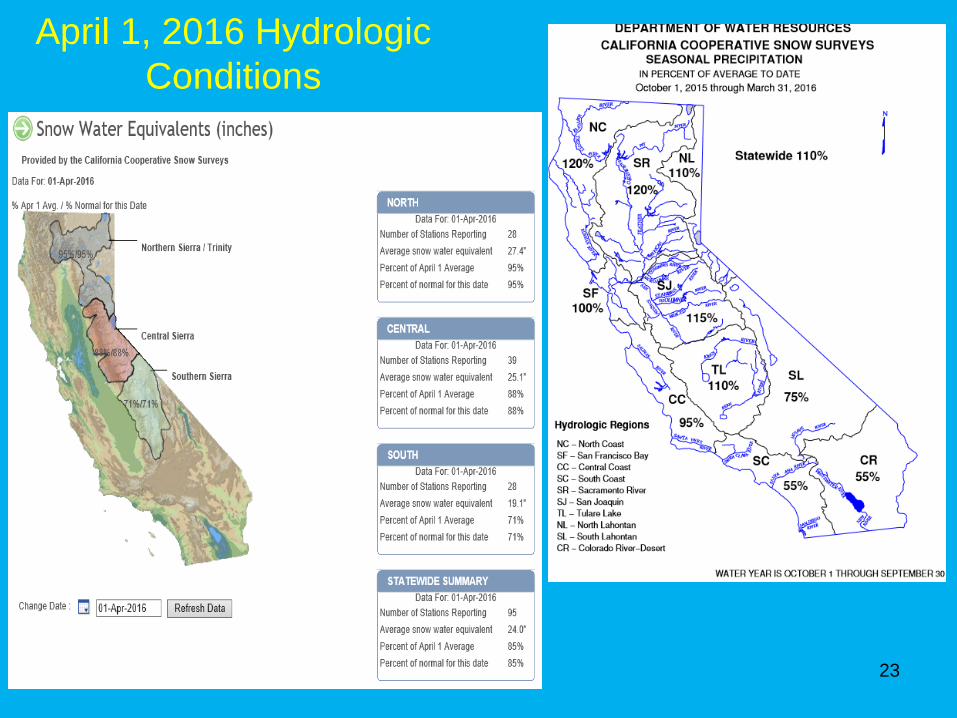
April 1, 2016 Hydrologic
Conditions
23
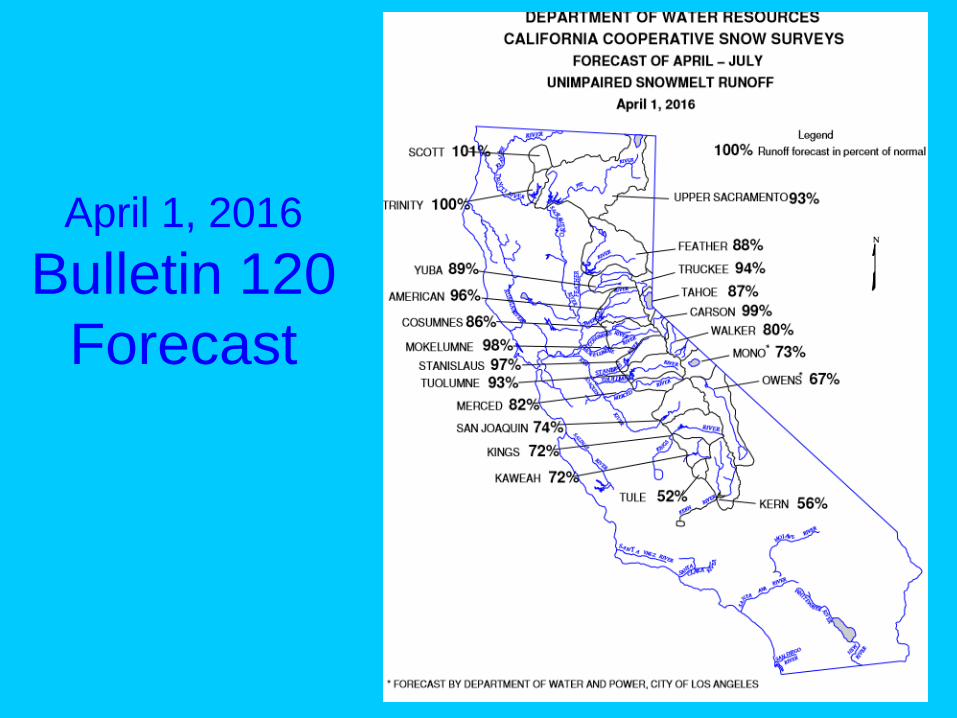
April 1, 2016 Bulletin 120
Forecast
24
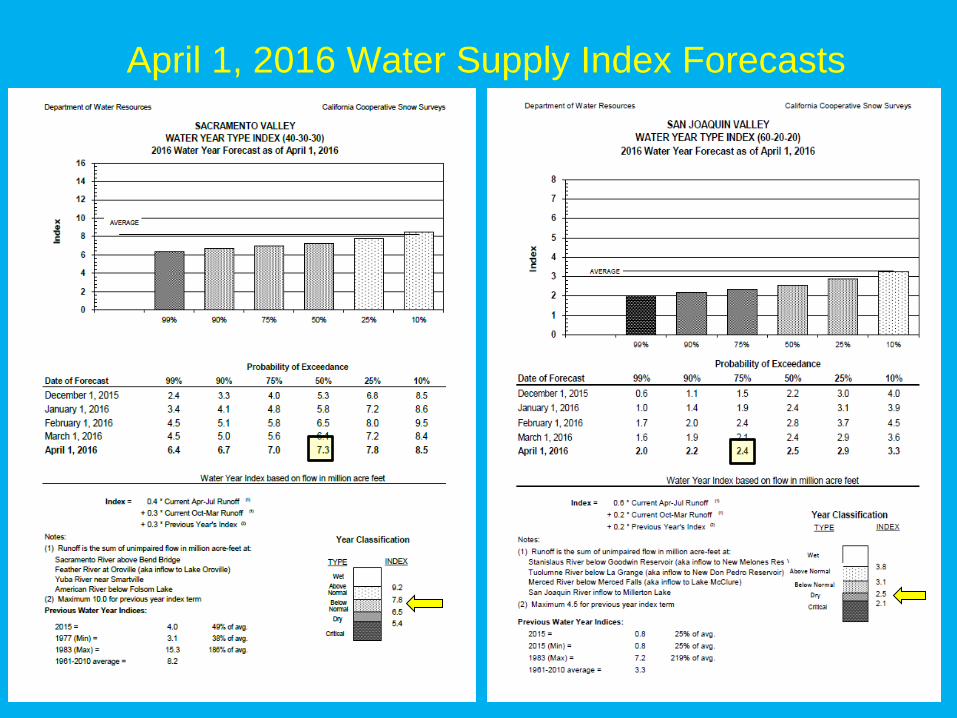
April 1, 2016 Water Supply Index Forecasts
25
26
Questions?
Related Documents