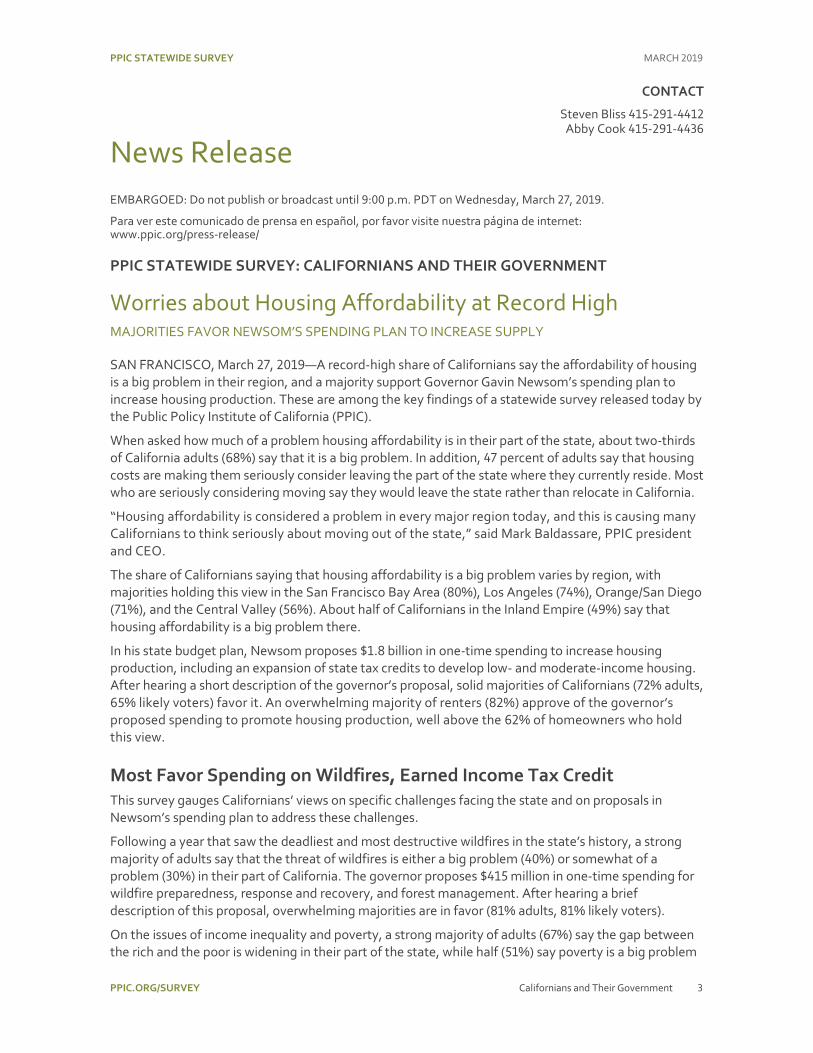
PPIC STATEWIDE SURVEY MARCH 2019 Californians & Their Government Mark Baldassare Dean Bonner Alyssa Dykman Rachel Ward CONTENTS Press Release 3 State Government 6 Federal Government 15 Regional Map 21 Methodology 22 Questionnaire and Results 24 Supported with funding from the James Irvine Foundation and the PPIC Donor Circle

Welcome message from author
This document is posted to help you gain knowledge. Please leave a comment to let me know what you think about it! Share it to your friends and learn new things together.
Transcript
PPIC STATEWIDE SURVEY MARCH 2019
Californians & Their Government Mark Baldassare Dean Bonner Alyssa Dykman Rachel Ward
CONTENTS Press Release 3 State Government 6 Federal Government 15 Regional Map 21 Methodology 22 Questionnaire and Results 24
Supported with funding from the James Irvine Foundation and the PPIC Donor Circle
The PPIC Statewide Survey provides a voice for the public and likely voters— informing policymakers, encouraging discussion, and raising awareness on critical issues of the day.
© 2019 Public Policy Institute of California
The Public Policy Institute of California is dedicated to informing and improving public policy in California through independent, objective, nonpartisan research.
PPIC is a public charity. It does not take or support positions on any ballot measures or on any local, state, or federal legislation, nor does it endorse, support, or oppose any political parties or candidates for public office.
Short sections of text, not to exceed three paragraphs, may be quoted without written permission provided that full attribution is given to the source.
Research publications reflect the views of the authors and do not necessarily reflect the views of our funders or of the staff, officers, advisory councils, or board of directors of the Public Policy Institute of California.
PPIC STATEWIDE SURVEY MARCH 2019
PPIC.ORG/SURVEY Californians and Their Government 3
CONTACT
Steven Bliss 415-291-4412 Abby Cook 415-291-4436
News Release EMBARGOED: Do not publish or broadcast until 9:00 p.m. PDT on Wednesday, March 27, 2019.
Para ver este comunicado de prensa en español, por favor visite nuestra página de internet: www.ppic.org/press-release/
PPIC STATEWIDE SURVEY: CALIFORNIANS AND THEIR GOVERNMENT
Worries about Housing Affordability at Record High MAJORITIES FAVOR NEWSOM’S SPENDING PLAN TO INCREASE SUPPLY
SAN FRANCISCO, March 27, 2019—A record-high share of Californians say the affordability of housing is a big problem in their region, and a majority support Governor Gavin Newsom’s spending plan to increase housing production. These are among the key findings of a statewide survey released today by the Public Policy Institute of California (PPIC).
When asked how much of a problem housing affordability is in their part of the state, about two-thirds of California adults (68%) say that it is a big problem. In addition, 47 percent of adults say that housing costs are making them seriously consider leaving the part of the state where they currently reside. Most who are seriously considering moving say they would leave the state rather than relocate in California.
“Housing affordability is considered a problem in every major region today, and this is causing many Californians to think seriously about moving out of the state,” said Mark Baldassare, PPIC president and CEO.
The share of Californians saying that housing affordability is a big problem varies by region, with majorities holding this view in the San Francisco Bay Area (80%), Los Angeles (74%), Orange/San Diego (71%), and the Central Valley (56%). About half of Californians in the Inland Empire (49%) say that housing affordability is a big problem there.
In his state budget plan, Newsom proposes $1.8 billion in one-time spending to increase housing production, including an expansion of state tax credits to develop low- and moderate-income housing. After hearing a short description of the governor’s proposal, solid majorities of Californians (72% adults, 65% likely voters) favor it. An overwhelming majority of renters (82%) approve of the governor’s proposed spending to promote housing production, well above the 62% of homeowners who hold this view.
Most Favor Spending on Wildfires, Earned Income Tax Credit
This survey gauges Californians’ views on specific challenges facing the state and on proposals in Newsom’s spending plan to address these challenges.
Following a year that saw the deadliest and most destructive wildfires in the state’s history, a strong majority of adults say that the threat of wildfires is either a big problem (40%) or somewhat of a problem (30%) in their part of California. The governor proposes $415 million in one-time spending for wildfire preparedness, response and recovery, and forest management. After hearing a brief description of this proposal, overwhelming majorities are in favor (81% adults, 81% likely voters).
On the issues of income inequality and poverty, a strong majority of adults (67%) say the gap between the rich and the poor is widening in their part of the state, while half (51%) say poverty is a big problem
PPIC STATEWIDE SURVEY MARCH 2019
PPIC.ORG/SURVEY Californians and Their Government 4
in their part of the state. The governor’s budget plan allocates $1 billion to the state’s earned income tax credit (EITC) to expand eligibility and payments for low-income workers, and solid majorities of Californians (73% adults, 65% likely voters) are in favor.
“Californians are giving a green light to the governor’s specific plans to spend the budget surplus, with exceptionally high support going to his response to wildfires,” Baldassare said.
Currently, a record-low share of California adults say the amount that state and local governments spend on public pensions is a big problem (29%) or somewhat of a problem (34%). The governor’s budget proposal to allocate $5.3 billion in additional one-time spending to address unfunded pension liabilities is favored by less than half of Californians (47% adults, 43% of likely voters).
Slim Majorities Support Scaling Back High-Speed Rail, Delta Tunnels
In his first State of the State address, Governor Newsom announced plans to significantly scale back two major infrastructure projects that had been advanced by former governor Jerry Brown: a high-speed rail system connecting Northern and Southern California, and twin tunnels in the Sacramento–San Joaquin Delta that would move water from north to south. Just over half of adults (53%) and under half of likely voters (45%) think Newsom’s proposal to truncate the high-speed rail is a good idea. His plan to build one Delta tunnel rather than two has similar levels of support, with 52 percent of adults and 47 percent of likely voters saying it is a good idea.
“Slim majorities support the governor’s recent proposals to scale back two of the state’s controversial infrastructure projects—high-speed rail and the Delta tunnels,” Baldassare said.
Views on Newsom’s high-speed rail and Delta tunnel plans vary across regions of the state. Residents of the Central Valley, which is the focus of the new high-speed rail plan, are divided on it (46% good idea, 43% bad idea). Elsewhere, support for Newsom’s high-speed rail plan is higher in Los Angeles and the San Francisco Bay Area (58% each) than in Orange/San Diego (50%) and the Inland Empire (43%). Support for the governor’s proposal to build a single Delta tunnel is highest in the San Francisco Bay Area (56% saying it is a good idea) and the Inland Empire (55%), followed by the Central Valley (51%), Los Angeles (49%), and Orange/San Diego (44%).
Majorities Favor Life Imprisonment over the Death Penalty In the wake of Newsom’s decision to place a moratorium on the death penalty in California, our survey tracks if residents’ views have shifted over time. When Californians are asked whether the penalty for first-degree murder should be death or life imprisonment with absolutely no possibility of parole, a record-high 62 percent of adults (58% of likely voters) choose life imprisonment. Just 31 percent of adults (38% of likely voters) favor the death penalty. By contrast, California adults were evenly split in 2000 (47% life imprisonment, 49% death penalty).
Two months into Newsom’s administration, 45 percent of both adults and likely voters approve of how he is handling his job, while 29 percent of adults and 20 percent of likely voters say they have not heard enough or don’t have an opinion. The governor’s approval rating was similar in January (44% adults, 43% likely voters). Today, there is a sharp partisan divide in approval of the governor (65% Democrats, 35% independents, 20% Republicans). The California Legislature’s approval rating is similar to the governor’s, with 46 percent of adults and 42 percent of likely voters approving. This is close to the legislature’s approval rating in January (49% adults, 46% likely voters).
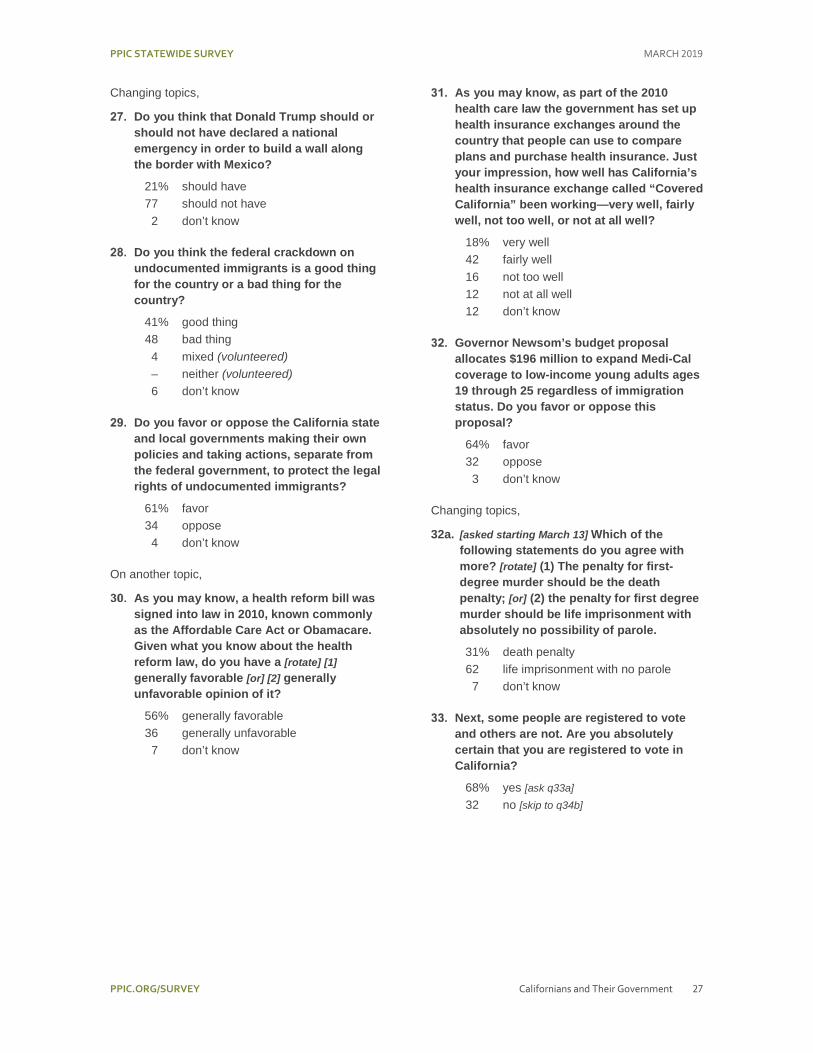
Overwhelming Majorities Oppose President’s Emergency Declaration With views breaking along party lines, an overwhelming share of Californians (77% of adults, 70% of likely voters) oppose President Trump’s declaration of a national emergency to build a wall along the

PPIC STATEWIDE SURVEY MARCH 2019
PPIC.ORG/SURVEY Californians and Their Government 5
border with Mexico. Support for the president’s declaration is much higher among Republicans than Democrats and independents.
At a time when California and the Trump administration are engaged in legal disputes over immigration policy, a majority of Californians (61% adults, 54% likely voters) favor the state and local governments taking action, separate from the federal government, to protect the rights of undocumented immigrants in California. Nearly half of California adults (48%) disagree with the federal crackdown on undocumented immigrants, while slightly fewer (41%) say it is a good thing for the country.
Just 29 percent of adults and 34 percent of likely voters approve of how President Trump is handling his job, similar to views in January and a year ago. An overwhelming majority of Republicans (75%) approve of the president, compared to 27 percent of independents and 7 percent of Democrats.
“President Trump’s calling a national emergency to build a border wall is highly unpopular, yet his partisan-driven approval rating is virtually unchanged in two years,” Baldassare said.
About Half Approve of Feinstein, Harris With the end of the partial government shutdown and Democrats in control of the US House of Representatives, California adults give Congress its highest approval rating (36%) since March 2017; today, 29 percent of likely voters approve of the way Congress is doing its job. When asked about their own representative in the House, more than half of Californians (52% percent adults, 51% likely voters) approve of their House representative’s job performance.
Californians’ approval ratings of their two US senators are similar. Just under half of adults (47%) and likely voters (48%) approve of how Senator Dianne Feinstein is handling her job. Senator Kamala Harris’s rating is 45 percent among adults and 48 percent among likely voters. For both senators, current approval ratings are similar to those of a year ago.
“While Californians are generally disapproving of the US Congress, about half say they approve of their two US senators and their own US House representative,” Baldassare said.
When Californians are asked if they think Senator Harris should run for US president in 2020, 40 percent of adults and 38 percent of likely voters say she should, with Democrats (54%) far more likely to hold this view than independents (35%) or Republicans (17%).
Majorities Disapprove of Federal Tax Overhaul With tax day just around the corner, most Californians (60% adults, 58% likely voters) disapprove of the federal tax overhaul that took effect in 2018. Asked about state and local taxes, solid majorities of Californians (60% adults, 63% likely voters) say that they pay more than they should. This view is held by majorities across income groups.
“As the April 15 tax deadline looms, many Californians are complaining about the state and local tax system and the impacts of recent changes in federal tax laws,” Baldassare said.
Most Approve of Affordable Care Act and Further Medi-Cal Expansion Nine years since passage of federal health care reform—the Affordable Care Act (ACA)—56% of California adults have a favorable view of the law, well above the 45 percent who supported it in May 2018. A record-high (60%) say that Covered California, the online health insurance marketplace created under the ACA, is working very well (18%) or somewhat well (42%).
Governor Newsom’s budget plan proposes to allocate $196 million to expand Medi-Cal coverage to low-income young adults (ages 19 through 25), regardless of immigration status. A solid majority of Californians (64%) favor this proposal.
PPIC STATEWIDE SURVEY MARCH 2019
PPIC.ORG/SURVEY Californians and Their Government 6
State Issues
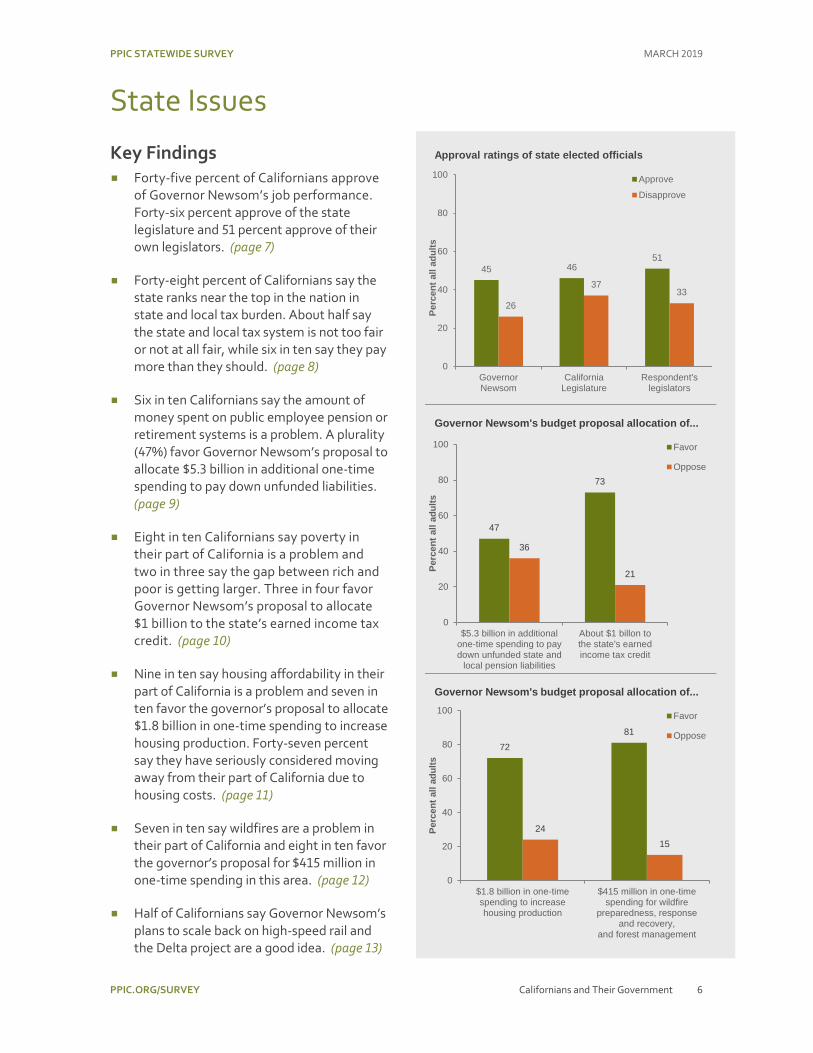
Key Findings Forty-five percent of Californians approve
of Governor Newsom’s job performance. Forty-six percent approve of the state legislature and 51 percent approve of their own legislators. (page 7)
Forty-eight percent of Californians say the state ranks near the top in the nation in state and local tax burden. About half say the state and local tax system is not too fair or not at all fair, while six in ten say they pay more than they should. (page 8)
Six in ten Californians say the amount of money spent on public employee pension or retirement systems is a problem. A plurality (47%) favor Governor Newsom’s proposal to allocate $5.3 billion in additional one-time spending to pay down unfunded liabilities. (page 9)
Eight in ten Californians say poverty in their part of California is a problem and two in three say the gap between rich and poor is getting larger. Three in four favor Governor Newsom’s proposal to allocate $1 billion to the state’s earned income tax credit. (page 10)
Nine in ten say housing affordability in their part of California is a problem and seven in ten favor the governor’s proposal to allocate $1.8 billion in one-time spending to increase housing production. Forty-seven percent say they have seriously considered moving away from their part of California due to housing costs. (page 11)
Seven in ten say wildfires are a problem in their part of California and eight in ten favor the governor’s proposal for $415 million in one-time spending in this area. (page 12)
Half of Californians say Governor Newsom’s plans to scale back on high-speed rail and the Delta project are a good idea. (page 13)
45 4651
26
3733
0
20
40
60
80
100
GovernorNewsom
CaliforniaLegislature
Respondent'slegislators
Perc
ent a
ll ad
ults
ApproveDisapprove
Approval ratings of state elected officials
47
73
36
21
0
20
40
60
80
100
$5.3 billion in additionalone-time spending to paydown unfunded state and
local pension liabilities
About $1 billon tothe state's earnedincome tax credit
Perc
ent a
ll ad
ults
Favor
Oppose
Governor Newsom's budget proposal allocation of...
7281
2415
0
20
40
60
80
100
$1.8 billion in one-timespending to increasehousing production
$415 million in one-timespending for wildfire
preparedness, responseand recovery,
and forest management
Perc
ent a
ll ad
ults
Favor
Oppose
Governor Newsom's budget proposal allocation of...

PPIC STATEWIDE SURVEY MARCH 2019
PPIC.ORG/SURVEY Californians and Their Government 7
Approval of State Elected Officials After two months in office, Governor Newsom has an approval rating of 45 percent among adults and likely voters. The governor’s first approval rating in January was similar (44% adults, 43% likely voters), while about three in ten Californians continue to say they have not heard enough or don’t have an opinion (33% January, 29% today). Today, the approval rating is 65 percent among Democrats, 35 percent among independents, and 20 percent among Republicans. About half of adults in the San Francisco Bay Area and Los Angeles approve of the governor. Half or more of African Americans (52%) and Asian Americans (50%) approve, compared to 47 percent of Latinos and 43 percent of whites.
“Overall, from what you know so far, do you approve or disapprove of the way that Gavin Newsom is handling his job as governor of California?”
Approve Disapprove Have not heard
enough (volunteered)
Don’t know
All adults 45% 26% 16% 13%
Likely voters 45 36 14 6
Party
Democrats 65 12 15 9
Republicans 20 65 12 4
Independents 35 34 20 11
Region
Central Valley 43 29 15 13
Inland Empire 37 28 18 17
Los Angeles 49 21 17 13
Orange/San Diego 39 34 14 13
San Francisco Bay Area 53 21 12 14
In the early days of the 2019–20 session, 46 percent of adults and 42 percent of likely voters approve of the way that the state legislature is handling its job. Approval ratings were similar in January (49% adults, 46% likely voters) and last March (46% adults, 45% likely voters). Today, 65 percent of Democrats say they approve, compared to 38 percent of independents and 15 percent of Republicans. Approval of the legislature is higher in Los Angeles (54%) and the San Francisco Bay Area (50%) than in other regions.
About half of adults (51%) and likely voters (48%) approve of the way that the state legislators representing their state assembly and senate districts are doing their jobs. Similar shares expressed approval of their own state legislators last March (49% adults, 46% likely voters). Today, 67 percent of Democrats, 49 percent of independents, and 26 percent of Republicans approve of their own legislators. San Francisco Bay Area residents (58%) are more likely than those living in other regions to approve of their own legislators.
“Overall, do you approve or disapprove of …?”
All adults
Party Likely voters Dem Rep Ind
the way that the California Legislature is handling its job
Approve 46% 65% 15% 38% 42%
Disapprove 37 20 75 46 45
Don't know 17 15 10 16 13
the job that the state legislators representing your assembly and senate districts are doing at this time
Approve 51 67 26 49 48
Disapprove 33 20 62 38 40
Don't know 17 13 11 13 12
PPIC STATEWIDE SURVEY MARCH 2019
PPIC.ORG/SURVEY Californians and Their Government 8
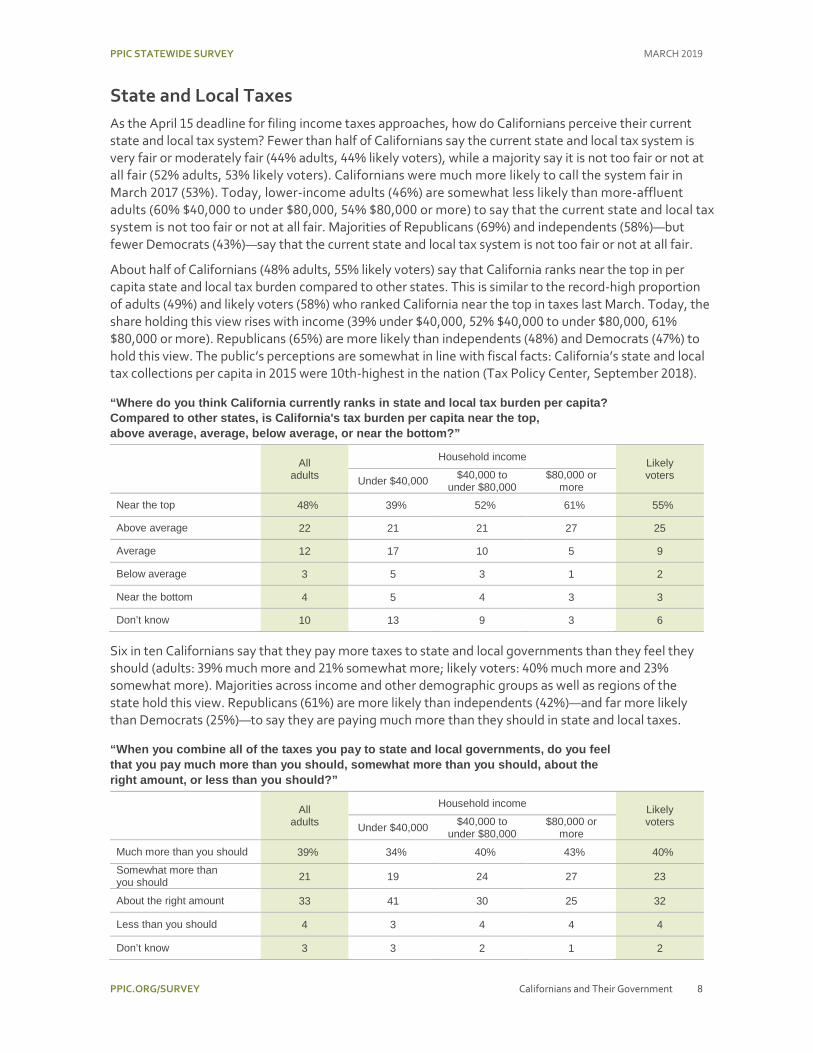
State and Local Taxes As the April 15 deadline for filing income taxes approaches, how do Californians perceive their current state and local tax system? Fewer than half of Californians say the current state and local tax system is very fair or moderately fair (44% adults, 44% likely voters), while a majority say it is not too fair or not at all fair (52% adults, 53% likely voters). Californians were much more likely to call the system fair in March 2017 (53%). Today, lower-income adults (46%) are somewhat less likely than more-affluent adults (60% $40,000 to under $80,000, 54% $80,000 or more) to say that the current state and local tax system is not too fair or not at all fair. Majorities of Republicans (69%) and independents (58%)—but fewer Democrats (43%)—say that the current state and local tax system is not too fair or not at all fair.
About half of Californians (48% adults, 55% likely voters) say that California ranks near the top in per capita state and local tax burden compared to other states. This is similar to the record-high proportion of adults (49%) and likely voters (58%) who ranked California near the top in taxes last March. Today, the share holding this view rises with income (39% under $40,000, 52% $40,000 to under $80,000, 61% $80,000 or more). Republicans (65%) are more likely than independents (48%) and Democrats (47%) to hold this view. The public’s perceptions are somewhat in line with fiscal facts: California’s state and local tax collections per capita in 2015 were 10th-highest in the nation (Tax Policy Center, September 2018).
“Where do you think California currently ranks in state and local tax burden per capita? Compared to other states, is California's tax burden per capita near the top, above average, average, below average, or near the bottom?”
All adults
Household income Likely voters Under $40,000 $40,000 to
under $80,000 $80,000 or
more Near the top 48% 39% 52% 61% 55%
Above average 22 21 21 27 25
Average 12 17 10 5 9
Below average 3 5 3 1 2
Near the bottom 4 5 4 3 3
Don’t know 10 13 9 3 6
Six in ten Californians say that they pay more taxes to state and local governments than they feel they should (adults: 39% much more and 21% somewhat more; likely voters: 40% much more and 23% somewhat more). Majorities across income and other demographic groups as well as regions of the state hold this view. Republicans (61%) are more likely than independents (42%)—and far more likely than Democrats (25%)—to say they are paying much more than they should in state and local taxes.
“When you combine all of the taxes you pay to state and local governments, do you feel that you pay much more than you should, somewhat more than you should, about the right amount, or less than you should?”
All adults
Household income Likely voters Under $40,000 $40,000 to
under $80,000 $80,000 or
more Much more than you should 39% 34% 40% 43% 40% Somewhat more than you should 21 19 24 27 23
About the right amount 33 41 30 25 32
Less than you should 4 3 4 4 4
Don’t know 3 3 2 1 2
PPIC STATEWIDE SURVEY MARCH 2019
PPIC.ORG/SURVEY Californians and Their Government 9
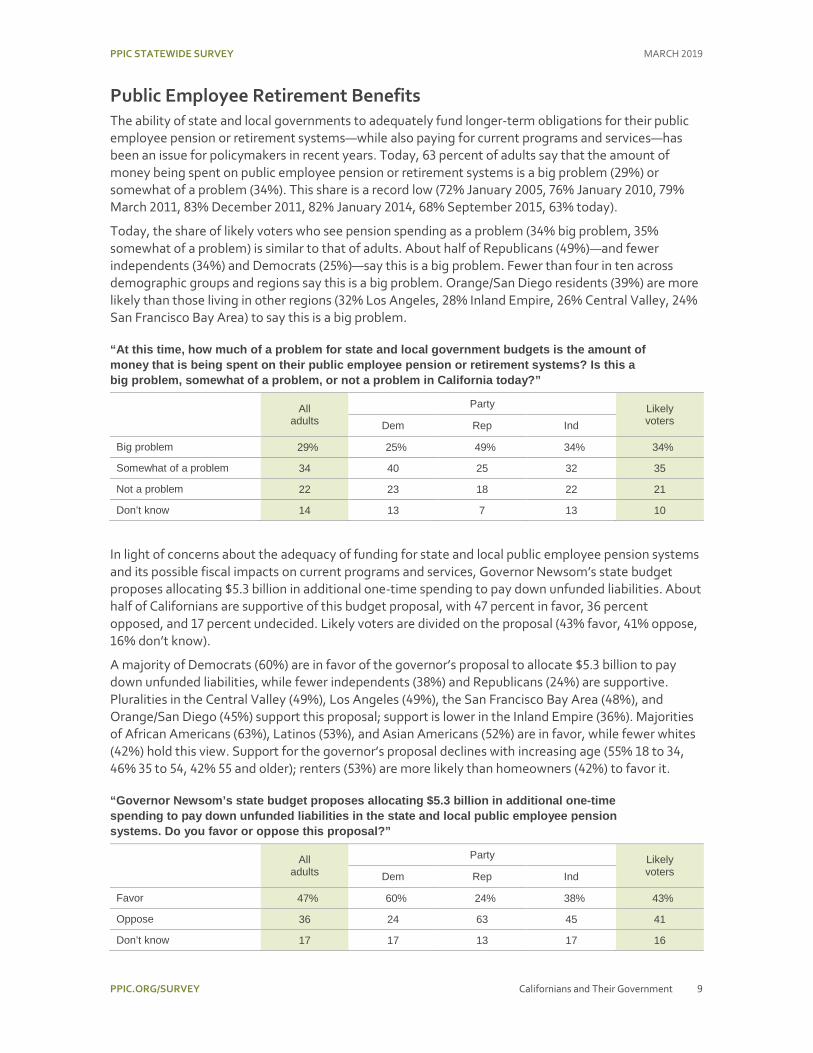
Public Employee Retirement Benefits The ability of state and local governments to adequately fund longer-term obligations for their public employee pension or retirement systems—while also paying for current programs and services—has been an issue for policymakers in recent years. Today, 63 percent of adults say that the amount of money being spent on public employee pension or retirement systems is a big problem (29%) or somewhat of a problem (34%). This share is a record low (72% January 2005, 76% January 2010, 79% March 2011, 83% December 2011, 82% January 2014, 68% September 2015, 63% today).
Today, the share of likely voters who see pension spending as a problem (34% big problem, 35% somewhat of a problem) is similar to that of adults. About half of Republicans (49%)—and fewer independents (34%) and Democrats (25%)—say this is a big problem. Fewer than four in ten across demographic groups and regions say this is a big problem. Orange/San Diego residents (39%) are more likely than those living in other regions (32% Los Angeles, 28% Inland Empire, 26% Central Valley, 24% San Francisco Bay Area) to say this is a big problem.
“At this time, how much of a problem for state and local government budgets is the amount of money that is being spent on their public employee pension or retirement systems? Is this a big problem, somewhat of a problem, or not a problem in California today?”
All adults
Party Likely voters Dem Rep Ind
Big problem 29% 25% 49% 34% 34%
Somewhat of a problem 34 40 25 32 35
Not a problem 22 23 18 22 21
Don’t know 14 13 7 13 10
In light of concerns about the adequacy of funding for state and local public employee pension systems and its possible fiscal impacts on current programs and services, Governor Newsom’s state budget proposes allocating $5.3 billion in additional one-time spending to pay down unfunded liabilities. About half of Californians are supportive of this budget proposal, with 47 percent in favor, 36 percent opposed, and 17 percent undecided. Likely voters are divided on the proposal (43% favor, 41% oppose, 16% don’t know).
A majority of Democrats (60%) are in favor of the governor’s proposal to allocate $5.3 billion to pay down unfunded liabilities, while fewer independents (38%) and Republicans (24%) are supportive. Pluralities in the Central Valley (49%), Los Angeles (49%), the San Francisco Bay Area (48%), and Orange/San Diego (45%) support this proposal; support is lower in the Inland Empire (36%). Majorities of African Americans (63%), Latinos (53%), and Asian Americans (52%) are in favor, while fewer whites (42%) hold this view. Support for the governor’s proposal declines with increasing age (55% 18 to 34, 46% 35 to 54, 42% 55 and older); renters (53%) are more likely than homeowners (42%) to favor it.
“Governor Newsom’s state budget proposes allocating $5.3 billion in additional one-time spending to pay down unfunded liabilities in the state and local public employee pension systems. Do you favor or oppose this proposal?”
All adults
Party Likely voters Dem Rep Ind
Favor 47% 60% 24% 38% 43%
Oppose 36 24 63 45 41
Don’t know 17 17 13 17 16

PPIC STATEWIDE SURVEY MARCH 2019
PPIC.ORG/SURVEY Californians and Their Government 10
Poverty and Income Inequality Two in three adults (67%) and seven in ten likely voters (72%) think the gap between the rich and the poor is getting larger in their part of California. Similar shares of Californians held this view in our May 2017 survey (61% adults, 66% likely voters). Today, more than half across regions say the gap between the rich and the poor is getting larger where they live (59% Inland Empire, 64% Central Valley, 65% Orange/San Diego, 70% San Francisco Bay Area, 72% Los Angeles). Across parties, majorities of Democrats (81%), independents (75%), and Republicans (56%) hold this view. Similar shares across age and income groups as well as among homeowners and renters say the gap is getting larger where they live. Women (74%) are much more likely than men (59%) to hold this view, as are those with at least some college (72%) compared to those who have not attended college (59%).
About 7.4 million Californians (19.4%) were living in poverty in 2016, according to the California Poverty Measure, a joint research effort by PPIC and the Stanford Center on Poverty and Inequality. When asked about poverty in their part of California, eight in ten Californians say it is a big problem (51%) or somewhat of a problem (32%). Nearly nine in ten likely voters say poverty is a problem (50% big, 37% somewhat). Californians were less likely to say it was a big problem in May 2017 (39% adults, 40% likely voters). Across regions, more than four in ten say poverty is a big problem, with residents of Los Angeles (59%) the most likely to hold this view. Across parties, Democrats (57%) and independents (55%) are much more likely than Republicans (42%) to say poverty is a big problem where they live. African Americans (67%) are more likely than Latinos (54%), whites (49%), and Asian Americans (44%) to hold this view. Women (58%) are much more likely than men (44%) to say poverty is a big problem where they live and the shares holding this view decline with rising income.
“How much of a problem is poverty in your part of California? Is it a big problem, somewhat of a problem, or not much of a problem?”
All adults
Region Likely voters Central
Valley Inland Empire
Los Angeles
Orange/ San Diego
San Francisco Bay Area
Big problem 51% 53% 53% 59% 44% 45% 50%
Somewhat of a problem 32 35 30 27 34 35 37
Not a problem 16 11 15 13 22 20 12
Don’t know 1 1 3 1 – 1 1 In his 2019–20 budget, Governor Newsom proposes allocating about $1 billion to the state’s earned income tax credit to expand eligibility and payments for low-income working individuals and families. After hearing a brief description of this proposal, 73 percent of adults and 65 percent of likely voters favor it. Los Angeles and San Francisco Bay Area residents (75% each) are the most likely to favor this proposal. Democrats (89%) are more than twice as likely as Republicans (40%) to be in favor, while 65 percent of independents hold this view. At least two in three across racial/ethnic groups are in favor. Support declines with rising age, income, and education levels. Those who favor the governor’s proposal are more likely than those who oppose it to say poverty is a big problem (54% to 44%).
“Governor Newsom’s budget proposal allocates about $1 billion to the state’s earned income tax credit to expand eligibility and payments for low-income working individuals and families. Do you favor or oppose this proposal?”
All adults
Region Likely voters Central
Valley Inland Empire
Los Angeles
Orange/ San Diego
San Francisco Bay Area
Favor 73% 71% 73% 75% 67% 75% 65%
Oppose 21 25 23 17 26 18 28
Don’t know 6 5 4 8 7 7 7
PPIC STATEWIDE SURVEY MARCH 2019
PPIC.ORG/SURVEY Californians and Their Government 11
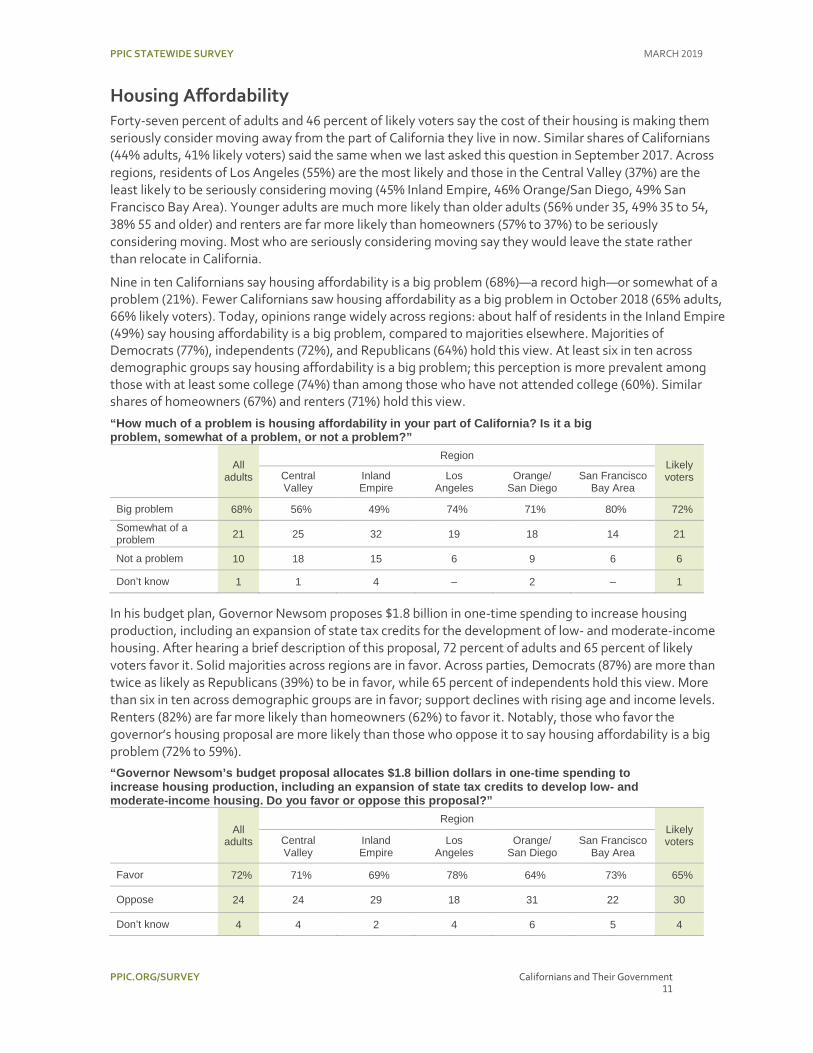
Housing Affordability Forty-seven percent of adults and 46 percent of likely voters say the cost of their housing is making them seriously consider moving away from the part of California they live in now. Similar shares of Californians (44% adults, 41% likely voters) said the same when we last asked this question in September 2017. Across regions, residents of Los Angeles (55%) are the most likely and those in the Central Valley (37%) are the least likely to be seriously considering moving (45% Inland Empire, 46% Orange/San Diego, 49% San Francisco Bay Area). Younger adults are much more likely than older adults (56% under 35, 49% 35 to 54, 38% 55 and older) and renters are far more likely than homeowners (57% to 37%) to be seriously considering moving. Most who are seriously considering moving say they would leave the state rather than relocate in California.
Nine in ten Californians say housing affordability is a big problem (68%)—a record high—or somewhat of a problem (21%). Fewer Californians saw housing affordability as a big problem in October 2018 (65% adults, 66% likely voters). Today, opinions range widely across regions: about half of residents in the Inland Empire (49%) say housing affordability is a big problem, compared to majorities elsewhere. Majorities of Democrats (77%), independents (72%), and Republicans (64%) hold this view. At least six in ten across demographic groups say housing affordability is a big problem; this perception is more prevalent among those with at least some college (74%) than among those who have not attended college (60%). Similar shares of homeowners (67%) and renters (71%) hold this view.
“How much of a problem is housing affordability in your part of California? Is it a big problem, somewhat of a problem, or not a problem?”
All adults
Region Likely voters Central
Valley Inland Empire
Los Angeles
Orange/ San Diego
San Francisco Bay Area
Big problem 68% 56% 49% 74% 71% 80% 72%
Somewhat of a problem 21 25 32 19 18 14 21
Not a problem 10 18 15 6 9 6 6
Don’t know 1 1 4 – 2 – 1
In his budget plan, Governor Newsom proposes $1.8 billion in one-time spending to increase housing production, including an expansion of state tax credits for the development of low- and moderate-income housing. After hearing a brief description of this proposal, 72 percent of adults and 65 percent of likely voters favor it. Solid majorities across regions are in favor. Across parties, Democrats (87%) are more than twice as likely as Republicans (39%) to be in favor, while 65 percent of independents hold this view. More than six in ten across demographic groups are in favor; support declines with rising age and income levels. Renters (82%) are far more likely than homeowners (62%) to favor it. Notably, those who favor the governor’s housing proposal are more likely than those who oppose it to say housing affordability is a big problem (72% to 59%).
“Governor Newsom’s budget proposal allocates $1.8 billion dollars in one-time spending to increase housing production, including an expansion of state tax credits to develop low- and moderate-income housing. Do you favor or oppose this proposal?”
All adults
Region Likely voters Central
Valley Inland Empire
Los Angeles
Orange/ San Diego
San Francisco Bay Area
Favor 72% 71% 69% 78% 64% 73% 65%
Oppose 24 24 29 18 31 22 30
Don’t know 4 4 2 4 6 5 4

PPIC STATEWIDE SURVEY MARCH 2019
PPIC.ORG/SURVEY Californians and Their Government 12
Wildfire Threats Last year, California’s wildfires were the most destructive and deadliest in the state’s history. With the state facing the prospect of a year-round wildfire season, seven in ten Californians say that the threat of wildfires is a big problem (40% adults, 46% likely voters) or somewhat of a problem (30% adults, 29% likely voters) in their part of California. Across regions, residents in Orange/San Diego (47%) are the most likely to view this as a big problem, followed by those in the Inland Empire (39%), the San Francisco Bay Area (39%), the Central Valley (38%), and Los Angeles (36%). Across parties, more than four in ten say the threat of wildfires is a big problem (47% Republicans, 44% Democrats, 42% independents). Across racial/ethnic groups, whites (47%) are more likely than Latinos (36%), African Americans (33%), and Asian Americans (31%) to hold this view. Older Californians (41% 35 to 54, 47% 55 and older) are more likely than younger Californians (32% 18 to 34) to say the threat of wildfires in their part of California is a big problem. College graduates (46%) are more likely than those without a college degree (37%) to see the threat as a big problem; homeowners (46%) are much more likely than renters (34%) to hold this view.
“How much of a problem is the threat of wildfires in your part of California? Is it a big problem, somewhat of a problem, or not a problem?”
All adults
Region Likely voters Central
Valley Inland Empire
Los Angeles
Orange/ San Diego
San Francisco Bay Area
Big problem 40% 38% 39% 36% 47% 39% 46%
Somewhat of a problem 30 28 33 27 34 33 29
Not a problem 29 33 28 36 19 27 25
Don’t know – – – 1 – – 1
After we completed interviews for this survey, Governor Newsom proclaimed a state of emergency on wildfires to protect the state’s most vulnerable communities. His budget plan in January proposed $415 million in one-time spending for wildfire preparedness, response, and recovery and for forest management. After being read a brief description of this proposal, eight in ten Californians are in favor (81% adults, 81% likely voters). Across regions, more than two in three are in favor of the proposal, with San Francisco Bay Area residents (89%) the most likely to hold this view. Across parties, majorities of Democrats (92%), independents (79%), and Republicans (62%) are in favor of the governor’s wildfire proposal. About eight in ten across demographic groups are in favor. Renters (86%) are somewhat more likely than homeowners (78%) to be supportive. Among those who are in favor of the governor’s wildfire proposal, 41% say the threat of wildfires is a big problem in their part of California.
“Governor Newsom’s budget proposal allocates $415 million in one-time spending for wildfire preparedness, response, and recovery and forest management. Do you favor or oppose this proposal?”
All adults
Region Likely voters Central
Valley Inland Empire
Los Angeles
Orange/ San Diego
San Francisco Bay Area
Favor 81% 84% 68% 79% 79% 89% 81%
Oppose 15 14 24 16 16 9 16
Don’t know 4 2 8 5 6 2 3
PPIC STATEWIDE SURVEY MARCH 2019
PPIC.ORG/SURVEY Californians and Their Government 13
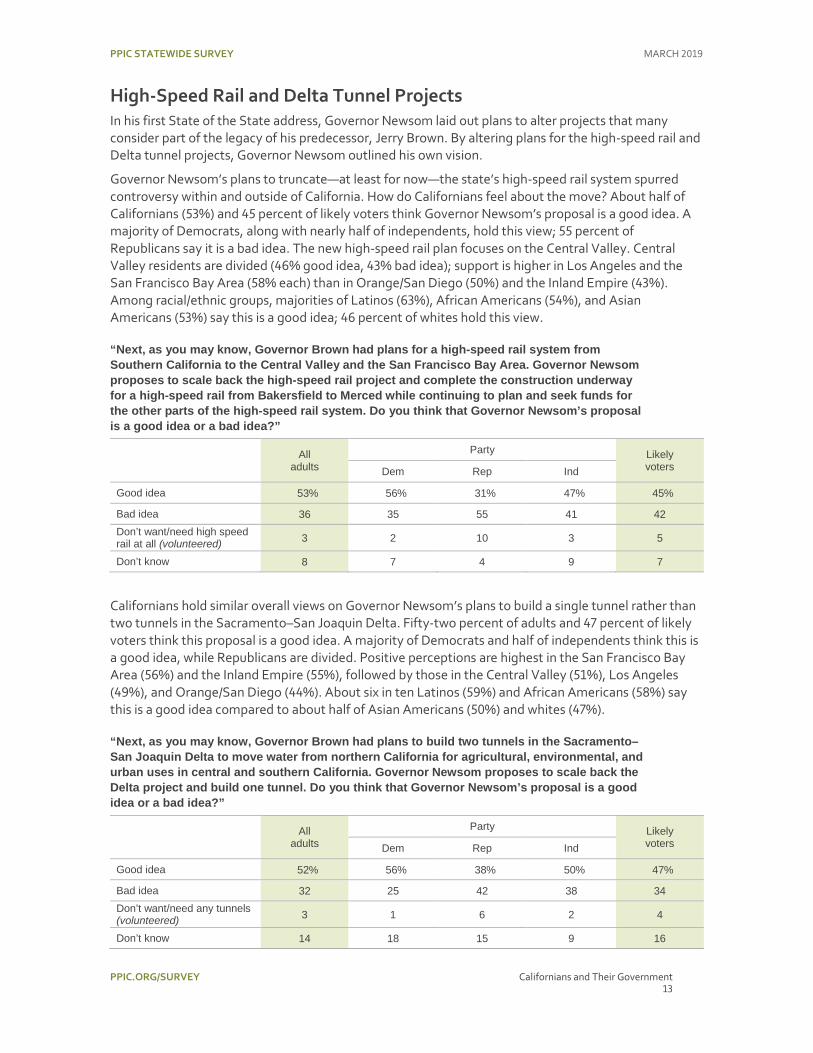
High-Speed Rail and Delta Tunnel Projects In his first State of the State address, Governor Newsom laid out plans to alter projects that many consider part of the legacy of his predecessor, Jerry Brown. By altering plans for the high-speed rail and Delta tunnel projects, Governor Newsom outlined his own vision.
Governor Newsom’s plans to truncate—at least for now—the state’s high-speed rail system spurred controversy within and outside of California. How do Californians feel about the move? About half of Californians (53%) and 45 percent of likely voters think Governor Newsom’s proposal is a good idea. A majority of Democrats, along with nearly half of independents, hold this view; 55 percent of Republicans say it is a bad idea. The new high-speed rail plan focuses on the Central Valley. Central Valley residents are divided (46% good idea, 43% bad idea); support is higher in Los Angeles and the San Francisco Bay Area (58% each) than in Orange/San Diego (50%) and the Inland Empire (43%). Among racial/ethnic groups, majorities of Latinos (63%), African Americans (54%), and Asian Americans (53%) say this is a good idea; 46 percent of whites hold this view.
“Next, as you may know, Governor Brown had plans for a high-speed rail system from Southern California to the Central Valley and the San Francisco Bay Area. Governor Newsom proposes to scale back the high-speed rail project and complete the construction underway for a high-speed rail from Bakersfield to Merced while continuing to plan and seek funds for the other parts of the high-speed rail system. Do you think that Governor Newsom’s proposal is a good idea or a bad idea?”
All adults
Party Likely voters Dem Rep Ind
Good idea 53% 56% 31% 47% 45%
Bad idea 36 35 55 41 42 Don’t want/need high speed rail at all (volunteered) 3 2 10 3 5
Don’t know 8 7 4 9 7
Californians hold similar overall views on Governor Newsom’s plans to build a single tunnel rather than two tunnels in the Sacramento–San Joaquin Delta. Fifty-two percent of adults and 47 percent of likely voters think this proposal is a good idea. A majority of Democrats and half of independents think this is a good idea, while Republicans are divided. Positive perceptions are highest in the San Francisco Bay Area (56%) and the Inland Empire (55%), followed by those in the Central Valley (51%), Los Angeles (49%), and Orange/San Diego (44%). About six in ten Latinos (59%) and African Americans (58%) say this is a good idea compared to about half of Asian Americans (50%) and whites (47%).
“Next, as you may know, Governor Brown had plans to build two tunnels in the Sacramento–San Joaquin Delta to move water from northern California for agricultural, environmental, and urban uses in central and southern California. Governor Newsom proposes to scale back the Delta project and build one tunnel. Do you think that Governor Newsom’s proposal is a good idea or a bad idea?”
All adults
Party Likely voters Dem Rep Ind
Good idea 52% 56% 38% 50% 47%
Bad idea 32 25 42 38 34 Don’t want/need any tunnels (volunteered) 3 1 6 2 4
Don’t know 14 18 15 9 16

PPIC STATEWIDE SURVEY MARCH 2019
PPIC.ORG/SURVEY Californians and Their Government 14
Death Penalty versus Life Imprisonment On March 13, Governor Newsom signed an order putting an executive moratorium on the death penalty for the 737 people on death row in California. Given that we were just three days into our interviewing period for this survey, we decided to add our tracking question on the penalty for first-degree murder. This allows us to see how the opinions of Californians have changed over time.
A record-high 62 percent of Californians prefer life imprisonment with absolutely no possibility of parole as the penalty for first-degree murder; 31 percent of Californians say the death penalty should be imposed. Most Democrats (76%) prefer life imprisonment, while most Republicans (64%) prefer the death penalty. Independents are 20 points more likely to choose life imprisonment over the death penalty (56% to 36%). Majorities across regions and demographic groups think the penalty for first-degree murder should be life imprisonment.
“Which of the following statements do you agree with more? The penalty for first-degree murder should be the death penalty or the penalty for first degree murder should be life imprisonment with absolutely no possibility of parole.”
All adults
Party Likely voters Dem Rep Ind
Death penalty 31% 21% 64% 36% 38%
Life imprisonment 62 76 32 56 58
Don’t know 7 3 4 8 3
47
53 54 5562
49
38 39 3831
0
20
40
60
80
100
2000
2004
2008
2012
2016
2019
Perc
ent a
ll ad
ults
Preferred penalty for first-degree murderLife imprisonmentDeath penalty

PPIC STATEWIDE SURVEY MARCH 2019
PPIC.ORG/SURVEY Californians and Their Government 15
National Issues
Key Findings Three in ten Californians approve of
President Donald Trump. While 36 percent approve of the US Congress, 52 percent approve of their own representative in Congress. (page 16)
Forty-seven percent of Californians approve of Senator Dianne Feinstein. Forty-five percent approve of Senator Kamala Harris, while four in ten think she should run for president in 2020. (page 17)
Three in ten Californians approve of the federal tax law passed in 2017 that went into effect in 2018. A plurality (41%) say the tax law has not had much of an effect on them and their family, while 38 percent say its effect has been mostly negative and 14 percent say it has been mostly positive. (page 18)
About three in four Californians—with partisans deeply divided—think President Trump should not have declared a national emergency in order to build a border wall. Six in ten Californians favor state and local governments making their own policies to protect the legal rights of undocumented immigrants in California. About half of Californians—with partisans divided—say the federal crackdown on undocumented immigrants has been a bad thing for the country. (page 19)
A majority of Californians have a favorable view of the Affordable Care Act and say that Covered California, California’s health insurance exchange, has been working well. Sixty-four percent of Californians—with partisans deeply divided—favor the governor’s budget proposal to allocate $196 million to expand Medi-Cal coverage to young adults ages 19 through 25 regardless of immigration status. (page 20)
2936
52
67
56
31
0
20
40
60
80
100
PresidentTrump
USCongress
Respondent's representative
Perc
ent a
ll ad
ults
Approve
Disapprove
Approval ratings of federal elected officials
77
94
33
74
0
20
40
60
80
100
All adults Dem Rep Ind
Perc
ent
Opposition to President Trump declaringa national emergency
64
80
19
57
32
18
78
40
0
20
40
60
80
100
All adults Dem Rep Ind
Perc
ent
Favor
Oppose
Budget proposal to expand Medi-Cal toyoung adults regardless of immigration status
PPIC STATEWIDE SURVEY MARCH 2019
PPIC.ORG/SURVEY Californians and Their Government 16
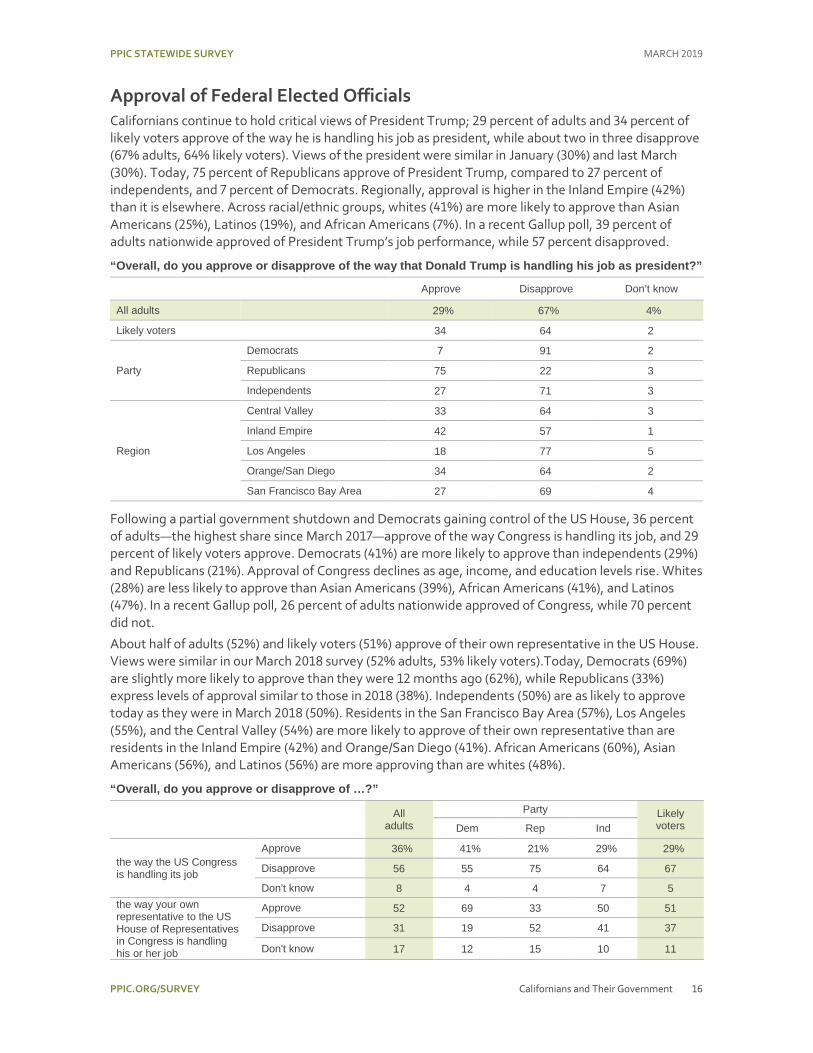
Approval of Federal Elected Officials Californians continue to hold critical views of President Trump; 29 percent of adults and 34 percent of likely voters approve of the way he is handling his job as president, while about two in three disapprove (67% adults, 64% likely voters). Views of the president were similar in January (30%) and last March (30%). Today, 75 percent of Republicans approve of President Trump, compared to 27 percent of independents, and 7 percent of Democrats. Regionally, approval is higher in the Inland Empire (42%) than it is elsewhere. Across racial/ethnic groups, whites (41%) are more likely to approve than Asian Americans (25%), Latinos (19%), and African Americans (7%). In a recent Gallup poll, 39 percent of adults nationwide approved of President Trump’s job performance, while 57 percent disapproved.
“Overall, do you approve or disapprove of the way that Donald Trump is handling his job as president?”
Approve Disapprove Don’t know
All adults 29% 67% 4%
Likely voters 34 64 2
Party
Democrats 7 91 2
Republicans 75 22 3
Independents 27 71 3
Region
Central Valley 33 64 3
Inland Empire 42 57 1
Los Angeles 18 77 5
Orange/San Diego 34 64 2
San Francisco Bay Area 27 69 4 Following a partial government shutdown and Democrats gaining control of the US House, 36 percent of adults—the highest share since March 2017—approve of the way Congress is handling its job, and 29 percent of likely voters approve. Democrats (41%) are more likely to approve than independents (29%) and Republicans (21%). Approval of Congress declines as age, income, and education levels rise. Whites (28%) are less likely to approve than Asian Americans (39%), African Americans (41%), and Latinos (47%). In a recent Gallup poll, 26 percent of adults nationwide approved of Congress, while 70 percent did not.
About half of adults (52%) and likely voters (51%) approve of their own representative in the US House. Views were similar in our March 2018 survey (52% adults, 53% likely voters).Today, Democrats (69%) are slightly more likely to approve than they were 12 months ago (62%), while Republicans (33%) express levels of approval similar to those in 2018 (38%). Independents (50%) are as likely to approve today as they were in March 2018 (50%). Residents in the San Francisco Bay Area (57%), Los Angeles (55%), and the Central Valley (54%) are more likely to approve of their own representative than are residents in the Inland Empire (42%) and Orange/San Diego (41%). African Americans (60%), Asian Americans (56%), and Latinos (56%) are more approving than are whites (48%).
“Overall, do you approve or disapprove of …?”
All adults
Party Likely voters Dem Rep Ind
the way the US Congress is handling its job
Approve 36% 41% 21% 29% 29%
Disapprove 56 55 75 64 67
Don't know 8 4 4 7 5 the way your own representative to the US House of Representatives in Congress is handling his or her job
Approve 52 69 33 50 51
Disapprove 31 19 52 41 37
Don't know 17 12 15 10 11

PPIC STATEWIDE SURVEY MARCH 2019
PPIC.ORG/SURVEY Californians and Their Government 17
Approval of US Senators After winning reelection in 2018, Dianne Feinstein today has approval from 47 percent of adults and 48 percent of likely voters. Approval was similar among adults in March 2018, but has declined by 6 points among likely voters (45% adults, likely voters 54%). Today, a majority of Democrats (66%) approve, compared to fewer independents (40%) and Republicans (23%). Regionally, approval is highest in the Central Valley (51%) and Los Angeles (50%); her approval increased by 13 points in the Central Valley since last March. Approval is highest among African Americans (63%), those with incomes under $40,000 (53%), those age 55 and older (52%), and women (50%).
“Overall, do you approve or disapprove of the way that Dianne Feinstein is handling her job as US senator?”
Approve Disapprove Don’t know
All adults 47% 36% 17%
Likely voters 48 45 7
Party
Democrats 66 24 10
Republicans 23 70 7
Independents 40 43 17
Region
Central Valley 51 34 15
Inland Empire 39 46 15
Los Angeles 50 30 20
Orange/San Diego 41 47 12
San Francisco Bay Area 47 28 25
Forty-five percent of adults and 48 percent of likely voters approve of Kamala Harris’s job performance as US senator, similar to her approval in March 2018 (41% adults, 45% likely voters). A strong majority of Democrats (71%) approve, while most Republicans (67%) disapprove; a plurality of independents (41%) approve. Regionally, approval is highest in the San Francisco Bay Area (52%) and Los Angeles (48%), while 28 percent of adults in the Central Valley and 26 percent in the Inland Empire are unsure how to rate her performance. African Americans (65%) are much more likely to approve of Harris than Asian Americans (49%), whites (44%), or Latinos (43%)—as are women (50%) compared to men (39%). “Overall, do you approve or disapprove of the way that Kamala Harris is handling her job as US senator?”
Approve Disapprove Don’t know
All adults 45% 32% 23%
Likely voters 48 38 14
Party
Democrats 71 16 13
Republicans 17 67 16
Independents 41 38 21
Region
Central Valley 39 33 28
Inland Empire 36 37 26
Los Angeles 48 29 23
Orange/San Diego 40 42 18
San Francisco Bay Area 52 24 23
Thinking ahead to the 2020 election, 40 percent of adults and 38 percent of likely voters say that Kamala Harris should run for president, while 45 percent of adults and 52 percent of likely voters say she should not run. A majority of Democrats (54%) think she should run, while 17 percent of Republicans and 35 percent of independents feel the same. A majority of African Americans (56%) think Harris should run for president, compared to fewer Latinos (45%), Asian Americans (36%), and whites (36%).
PPIC STATEWIDE SURVEY MARCH 2019
PPIC.ORG/SURVEY Californians and Their Government 18
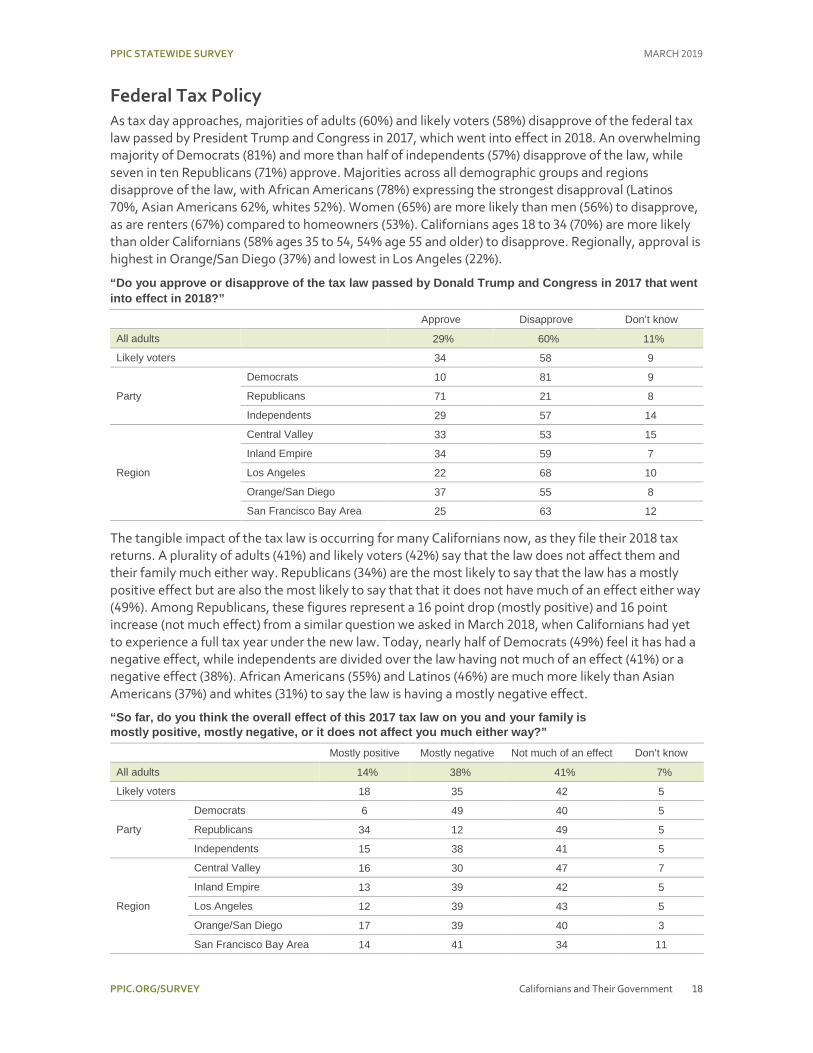
Federal Tax Policy As tax day approaches, majorities of adults (60%) and likely voters (58%) disapprove of the federal tax law passed by President Trump and Congress in 2017, which went into effect in 2018. An overwhelming majority of Democrats (81%) and more than half of independents (57%) disapprove of the law, while seven in ten Republicans (71%) approve. Majorities across all demographic groups and regions disapprove of the law, with African Americans (78%) expressing the strongest disapproval (Latinos 70%, Asian Americans 62%, whites 52%). Women (65%) are more likely than men (56%) to disapprove, as are renters (67%) compared to homeowners (53%). Californians ages 18 to 34 (70%) are more likely than older Californians (58% ages 35 to 54, 54% age 55 and older) to disapprove. Regionally, approval is highest in Orange/San Diego (37%) and lowest in Los Angeles (22%).
“Do you approve or disapprove of the tax law passed by Donald Trump and Congress in 2017 that went into effect in 2018?”
Approve Disapprove Don’t know
All adults 29% 60% 11%
Likely voters 34 58 9
Party
Democrats 10 81 9
Republicans 71 21 8
Independents 29 57 14
Region
Central Valley 33 53 15
Inland Empire 34 59 7
Los Angeles 22 68 10
Orange/San Diego 37 55 8
San Francisco Bay Area 25 63 12
The tangible impact of the tax law is occurring for many Californians now, as they file their 2018 tax returns. A plurality of adults (41%) and likely voters (42%) say that the law does not affect them and their family much either way. Republicans (34%) are the most likely to say that the law has a mostly positive effect but are also the most likely to say that that it does not have much of an effect either way (49%). Among Republicans, these figures represent a 16 point drop (mostly positive) and 16 point increase (not much effect) from a similar question we asked in March 2018, when Californians had yet to experience a full tax year under the new law. Today, nearly half of Democrats (49%) feel it has had a negative effect, while independents are divided over the law having not much of an effect (41%) or a negative effect (38%). African Americans (55%) and Latinos (46%) are much more likely than Asian Americans (37%) and whites (31%) to say the law is having a mostly negative effect.
“So far, do you think the overall effect of this 2017 tax law on you and your family is mostly positive, mostly negative, or it does not affect you much either way?”
Mostly positive Mostly negative Not much of an effect Don’t know
All adults 14% 38% 41% 7%
Likely voters 18 35 42 5
Party
Democrats 6 49 40 5
Republicans 34 12 49 5
Independents 15 38 41 5
Region
Central Valley 16 30 47 7
Inland Empire 13 39 42 5
Los Angeles 12 39 43 5
Orange/San Diego 17 39 40 3
San Francisco Bay Area 14 41 34 11

PPIC STATEWIDE SURVEY MARCH 2019
PPIC.ORG/SURVEY Californians and Their Government 19
Immigration Policy President Trump declared a national emergency on February 15 in order to build a wall along the border with Mexico. A month later, Congress passed a resolution to terminate this declaration, and the president vetoed this resolution the following day. An overwhelming share of Californians (77%) and likely voters (70%) think that President Trump should not have declared a national emergency. Support for the president’s declaration is much higher among Republicans (66%) than Democrats (5%) and independents (23%). One in three—or fewer—across regions and demographic groups say that he should have declared a national emergency.
California has sparred legally with President Trump over immigration policy over the last two years, and a majority consistently say that they favor the state and local governments making their own policies and taking actions, separate from the federal government, to protect the legal rights of undocumented immigrants in the state. Today, a majority of Californians (61%) and likely voters (54%) favor separate state action, with most Democrats and more than half of independents in favor and nearly eight in ten Republicans opposed. Except for residents of Orange/San Diego and those age 55 and older (49% each), a majority of Californians across regions and demographic groups are in favor of independent state and local action. Last March, a similar 61 percent of adults were in favor.
“Do you favor or oppose the California state and local governments making their own policies and taking actions, separate from the federal government, to protect the legal rights of undocumented immigrants in California?”
All adults
Party Race/Ethnicity
Dem Rep Ind African Americans
Asian Americans Latinos Whites
Favor 61% 78% 18% 55% 61% 61% 77% 52%
Oppose 34 18 78 41 32 32 19 44
Don't know 4 4 3 4 7 7 4 4
A plurality of Californians (48%) say the federal crackdown on undocumented immigrants is a bad thing for the country, while 41 percent say it is a good thing. Findings were similar last March (39% good thing, 51% bad thing). Democrats and Republicans offer contrasting views, while about half of independents say it is a bad thing. Across regions, just over half in Los Angeles (52%) and the San Francisco Bay Area (56%) say it is a bad thing, while residents in the Central Valley (47% good thing, 41% bad thing) and Orange/San Diego (50% good thing, 42% bad thing) offer more positive assessments. Inland Empire residents are divided (42% good thing, 43% bad thing). Majorities of African Americans, Asian Americans, and Latinos say it is a bad thing, while half of whites say it is a good thing. Californians ages 18 to 34 (62%) are much more likely than older residents (44% ages 35 to 54, 38% age 55 and older) to say it is a bad thing. Findings are similar across education and income groups. Women are somewhat more likely than men to say it is a bad thing (52% to 43%).
“Do you think the federal crackdown on undocumented immigrants is a good thing for the country or a bad thing for the country?”
All adults
Party Race/Ethnicity
Dem Rep Ind African Americans
Asian Americans Latinos Whites
Good thing 41% 21% 79% 42% 35% 38% 31% 49%
Bad thing 48 68 15 48 55 55 51 44
Mixed/neither (volunteered) 4 4 2 6 3 1 6 5
Don't know 6 6 3 5 6 6 12 2
PPIC STATEWIDE SURVEY MARCH 2019
PPIC.ORG/SURVEY Californians and Their Government 20
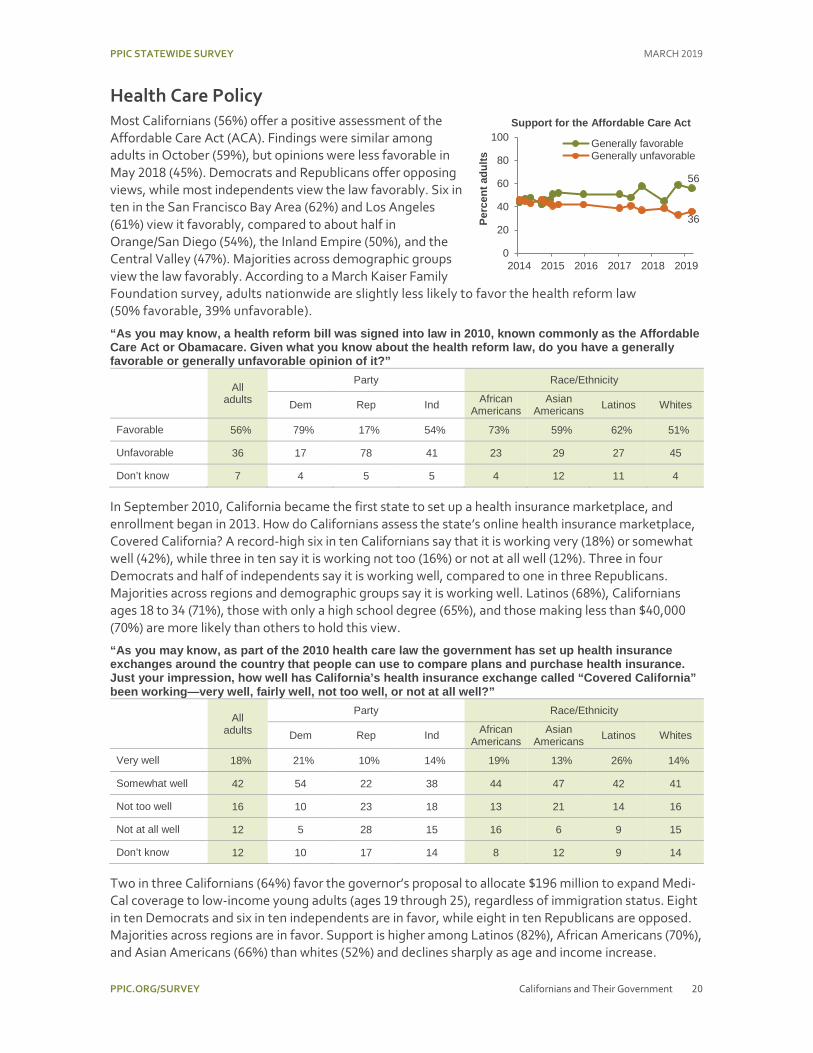
Health Care Policy Most Californians (56%) offer a positive assessment of the Affordable Care Act (ACA). Findings were similar among adults in October (59%), but opinions were less favorable in May 2018 (45%). Democrats and Republicans offer opposing views, while most independents view the law favorably. Six in ten in the San Francisco Bay Area (62%) and Los Angeles (61%) view it favorably, compared to about half in Orange/San Diego (54%), the Inland Empire (50%), and the Central Valley (47%). Majorities across demographic groups view the law favorably. According to a March Kaiser Family Foundation survey, adults nationwide are slightly less likely to favor the health reform law (50% favorable, 39% unfavorable).
“As you may know, a health reform bill was signed into law in 2010, known commonly as the Affordable Care Act or Obamacare. Given what you know about the health reform law, do you have a generally favorable or generally unfavorable opinion of it?”
All adults
Party Race/Ethnicity
Dem Rep Ind African Americans
Asian Americans Latinos Whites
Favorable 56% 79% 17% 54% 73% 59% 62% 51%
Unfavorable 36 17 78 41 23 29 27 45
Don’t know 7 4 5 5 4 12 11 4
In September 2010, California became the first state to set up a health insurance marketplace, and enrollment began in 2013. How do Californians assess the state’s online health insurance marketplace, Covered California? A record-high six in ten Californians say that it is working very (18%) or somewhat well (42%), while three in ten say it is working not too (16%) or not at all well (12%). Three in four Democrats and half of independents say it is working well, compared to one in three Republicans. Majorities across regions and demographic groups say it is working well. Latinos (68%), Californians ages 18 to 34 (71%), those with only a high school degree (65%), and those making less than $40,000 (70%) are more likely than others to hold this view.
“As you may know, as part of the 2010 health care law the government has set up health insurance exchanges around the country that people can use to compare plans and purchase health insurance. Just your impression, how well has California’s health insurance exchange called “Covered California” been working—very well, fairly well, not too well, or not at all well?”
All adults
Party Race/Ethnicity
Dem Rep Ind African Americans
Asian Americans Latinos Whites
Very well 18% 21% 10% 14% 19% 13% 26% 14%
Somewhat well 42 54 22 38 44 47 42 41
Not too well 16 10 23 18 13 21 14 16
Not at all well 12 5 28 15 16 6 9 15
Don’t know 12 10 17 14 8 12 9 14
Two in three Californians (64%) favor the governor’s proposal to allocate $196 million to expand Medi-Cal coverage to low-income young adults (ages 19 through 25), regardless of immigration status. Eight in ten Democrats and six in ten independents are in favor, while eight in ten Republicans are opposed. Majorities across regions are in favor. Support is higher among Latinos (82%), African Americans (70%), and Asian Americans (66%) than whites (52%) and declines sharply as age and income increase.
56
36
0
20
40
60
80
100
2014 2015 2016 2017 2018 2019
Perc
ent a
dults
Generally favorableGenerally unfavorable
Support for the Affordable Care Act

PPIC STATEWIDE SURVEY MARCH 2019
PPIC.ORG/SURVEY Californians and Their Government 21
Regional Map
PPIC STATEWIDE SURVEY MARCH 2019
PPIC.ORG/SURVEY Californians and Their Government 22
Methodology The PPIC Statewide Survey is directed by Mark Baldassare, president and CEO and survey director at the Public Policy Institute of California, with assistance from associate survey director Dean Bonner, project manager for this survey, and survey research associates Alyssa Dykman and Rachel Ward. The Californians and Their Government series is supported with funding from the James Irvine Foundation and the PPIC Donor Circle. The PPIC Statewide Survey invites input, comments, and suggestions from policy and public opinion experts and from its own advisory committee, but survey methods, questions, and content are determined solely by PPIC’s survey team.
Findings in this report are based on a survey of 1,706 California adult residents, including 1,195 interviewed on cell phones and 511 interviewed on landline telephones. Interviews took an average of 18 minutes to complete. Interviewing took place on weekend days and weekday nights from March 10–19, 2019.
Cell phone interviews were conducted using a computer-generated random sample of cell phone numbers. All cell phone numbers with California area codes were eligible for selection. Once a cell phone user was reached, it was verified that this person was age 18 or older, a resident of California, and in a safe place to continue the survey (e.g., not driving). Cell phone respondents were offered a small reimbursement to help defray the cost of the call. Cell phone interviews were conducted with adults who have cell phone service only and with those who have both cell phone and landline service in the household.
Landline interviews were conducted using a computer-generated random sample of telephone numbers that ensured that both listed and unlisted numbers were called. All landline telephone exchanges in California were eligible for selection. Once a household was reached, an adult respondent (age 18 or older) was randomly chosen for interviewing using the “last birthday method” to avoid biases in age and gender.
For both cell phones and landlines, telephone numbers were called as many as eight times. When no contact with an individual was made, calls to a number were limited to six. Also, to increase our ability to interview Asian American adults, we made up to three additional calls to phone numbers estimated by Survey Sampling International as likely to be associated with Asian American individuals.
Live landline and cell phone interviews were conducted by Abt Associates in English and Spanish, according to respondents’ preferences. Accent on Languages, Inc., translated new survey questions into Spanish, with assistance from Renatta DeFever.
Abt Associates uses the US Census Bureau’s 2013–2017 American Community Survey’s (ACS) Public Use Microdata Series for California (with regional coding information from the University of Minnesota’s Integrated Public Use Microdata Series for California) to compare certain demographic characteristics of the survey sample—region, age, gender, race/ethnicity, and education—with the characteristics of California’s adult population. The survey sample was closely comparable to the ACS figures. To estimate landline and cell phone service in California, Abt Associates used 2016 state-level estimates released by the National Center for Health Statistics—which used data from the National Health Interview Survey (NHIS) and the ACS. The estimates for California were then compared against landline and cell phone service reported in this survey. We also used voter registration data from the California Secretary of State to compare the party registration of registered voters in our sample to party registration statewide. The landline and cell phone samples were then integrated using a frame integration weight, while sample balancing adjusted for differences across regional, age, gender, race/ethnicity, education, telephone service, and party registration groups.

PPIC STATEWIDE SURVEY MARCH 2019
PPIC.ORG/SURVEY Californians and Their Government 23
The sampling error, taking design effects from weighting into consideration, is ±3.4 percent at the 95 percent confidence level for the total unweighted sample of 1,706 adults. This means that 95 times out of 100, the results will be within 3.4 percentage points of what they would be if all adults in California were interviewed. The sampling error for unweighted subgroups is larger: for the 1,139 adults asked question 32a (regarding the penalty for first degree murder) from March 13 to 19, the sampling error is ±4.1 percent; for the 1,415 registered voters, the sampling error is ±3.7 percent; for the 1,112 likely voters, it is ±4.3 percent. Sampling error is only one type of error to which surveys are subject. Results may also be affected by factors such as question wording, question order, and survey timing.
We present results for five geographic regions, accounting for approximately 90 percent of the state population. “Central Valley” includes Butte, Colusa, El Dorado, Fresno, Glenn, Kern, Kings, Madera, Merced, Placer, Sacramento, San Joaquin, Shasta, Stanislaus, Sutter, Tehama, Tulare, Yolo, and Yuba Counties. “San Francisco Bay Area” includes Alameda, Contra Costa, Marin, Napa, San Francisco, San Mateo, Santa Clara, Solano, and Sonoma Counties. “Los Angeles” refers to Los Angeles County, “Inland Empire” refers to Riverside and San Bernardino Counties, and “Orange/San Diego” refers to Orange and San Diego Counties. Residents of other geographic areas are included in the results reported for all adults, registered voters, and likely voters, but sample sizes for these less populous areas are not large enough to report separately.
We present results for non-Hispanic whites, who account for 42 percent of the state’s adult population, and also for Latinos, who account for 35 percent of the state’s adult population and constitute one of the fastest-growing voter groups. We also present results for non-Hispanic Asian Americans, who make up about 15 percent of the state’s adult population, and non-Hispanic African Americans, who comprise about 6 percent. Results for other racial/ethnic groups—such as Native Americans—are included in the results reported for all adults, registered voters, and likely voters, but sample sizes are not large enough for separate analysis. Results for African American and Asian American likely voters are combined with those of other racial/ethnic groups because sample sizes for African American and Asian American likely voters are too small for separate analysis. We compare the opinions of those who report they are registered Democrats, registered Republicans, and decline-to-state or independent voters; the results for those who say they are registered to vote in other parties are not large enough for separate analysis. We also analyze the responses of likely voters—so designated per their responses to survey questions about voter registration, previous election participation, intentions to vote this year, attention to election news, and current interest in politics.
The percentages presented in the report tables and in the questionnaire may not add to 100 due to rounding.
We compare current PPIC Statewide Survey results to those in our earlier surveys and to those in national surveys by Gallup and Kaiser Family Foundation. Additional details about our methodology can be found at www.ppic.org/wp-content/uploads/SurveyMethodology.pdf and are available upon request through [email protected].
PPIC STATEWIDE SURVEY MARCH 2019
PPIC.ORG/SURVEY Californians and Their Government 24
Questionnaire and Results CALIFORNIANS AND THEIR GOVERNMENT
March 10–19, 2019 1,706 California Adult Residents: English, Spanish
MARGIN OF ERROR ±3.4% AT 95% CONFIDENCE LEVEL FOR TOTAL SAMPLE PERCENTAGES MAY NOT ADD TO 100 DUE TO ROUNDING
Overall, from what you know so far, do you approve or disapprove of the way that Gavin Newsom is handling his job as governor of California?
45% approve 26 disapprove 16 have not heard enough to have an
opinion (volunteered) 13 don’t know
Overall, do you approve or disapprove of the way that the California Legislature is handling its job?
46% approve 37 disapprove 17 don’t know
Overall, do you approve or disapprove of the job that the state legislators representing your assembly and senate districts are doing at this time?
51% approve 33 disapprove 17 don’t know
Next,
Overall, how fair do you think our present state and local tax system is—would you say it is very fair, moderately fair, not too fair, or not at all fair?
7% very fair 37 moderately fair 25 not too fair 27 not at all fair 3 don’t know
When you combine all of the taxes you pay to state and local governments, do you feel that you pay much more than you should, somewhat more than you should, about the right amount, or less than you should?
39% much more 21 somewhat more 33 about the right amount 4 less than you should 3 don’t know
Where do you think California currently ranks in state and local tax burden per capita? Compared to other states, is California's tax burden per capita near the top, above average, average, below average, or near the bottom?
48% near the top 22 above average 12 average 3 below average 4 near the bottom 10 don’t know
On another topic,
At this time, how much of a problem for state and local government budgets is the amount of money that is being spent on their public employee pension or retirement systems? Is this a big problem, somewhat of a problem, or not a problem in California today?
29% big problem 34 somewhat of a problem 22 not a problem 14 don’t know

PPIC STATEWIDE SURVEY MARCH 2019
PPIC.ORG/SURVEY Californians and Their Government 25
Governor Newsom’s state budget proposes allocating $5.3 billion in additional one-time spending to pay down unfunded liabilities in the state and local public employee pension systems. Do you favor or oppose this proposal?
47% favor 36 oppose 17 don’t know
Changing topics,
How much of a problem is poverty in your part of California? Is it a big problem, somewhat of a problem, or not much of a problem?
51% big problem 32 somewhat of a problem 16 not a problem 1 don’t know
Do you think the gap between the rich and the poor in your part of California is getting larger, getting smaller, or has it stayed the same?
67% getting larger 5 getting smaller 26 stayed the same 3 don’t know
Governor Newsom’s budget proposal allocates about $1 billion to the state’s earned income tax credit to expand eligibility and payments for low-income working individuals and families. Do you favor or oppose this proposal?
73% favor 21 oppose 6 don’t know
On another topic,
How much of a problem is housing affordability in your part of California? Is it a big problem, somewhat of a problem, or not a problem?
68% big problem 21 somewhat of a problem 10 not a problem 1 don’t know
Does the cost of your housing make you and your family seriously consider moving away from the part of California you live in now, or not? (if yes, ask: “Does it make you consider moving elsewhere in California, or outside of the state?”)
47% yes 9 yes, elsewhere in California 35 yes, outside the state 3 yes, other 52 no – don’t know
Governor Newsom’s budget proposal allocates $1.8 billion in one-time spending to increase housing production, including an expansion of state tax credits to develop low- and moderate- income housing. Do you favor or oppose this proposal?
72% favor 24 oppose 4 don’t know
Changing topics,
How much of a problem is the threat of wildfires in your part of California? Is it a big problem, somewhat of a problem, or not a problem?
40% big problem 30 somewhat of a problem 29 not a problem – don’t know
Governor Newsom’s budget proposal allocates $415 million in one-time spending for wildfire preparedness, response, and recovery and forest management. Do you favor or oppose this proposal?
81% favor 15 oppose 4 don’t know
PPIC STATEWIDE SURVEY MARCH 2019
PPIC.ORG/SURVEY Californians and Their Government 26
Next, as you may know, Governor Brown had plans for a high-speed rail system from Southern California to the Central Valley and the San Francisco Bay Area. Governor Newsom proposes to scale back the high-speed rail project and complete the construction underway for a high-speed rail from Bakersfield to Merced while continuing to plan and seek funds for the other parts of the high-speed rail system. Do you think that Governor Newsom’s proposal is a good idea or a bad idea?
53% good idea 36 bad idea 3 don’t want/need high speed rail at all
(volunteered) 8 don’t know
Next, as you may know, Governor Brown had plans to build two tunnels in the Sacramento-San Joaquin Delta to move water from northern California for agricultural, environmental, and urban uses in central and southern California. Governor Newsom proposes to scale back the Delta project and build one tunnel. Do you think that Governor Newsom’s proposal is a good idea or a bad idea?
52% good idea 32 bad idea 3 don’t want/need any tunnels
(volunteered) 14 don’t know
Changing topics,
Overall, do you approve or disapprove of the way that Donald Trump is handling his job as president?
29% approve 67 disapprove 4 don’t know
[rotate questions 20 and 21, keeping question 22 after question 21]
Overall, do you approve or disapprove of the way that Dianne Feinstein is handling her job as US senator?
47% approve 36 disapprove 17 don’t know
Overall, do you approve or disapprove of the way that Kamala Harris is handling her job as US senator?
45% approve 32 disapprove 23 don’t know
Do you think Kamala Harris should run for US President in 2020, or not?
40% should run 45 should not run 15 don’t know
Overall, do you approve or disapprove of the way the US Congress is handling its job?
36% approve 56 disapprove 8 don’t know
Overall, do you approve or disapprove of the way your own representative to the US House of Representatives in Congress is handling his or her job?
52% approve 31 disapprove 17 don’t know
On another topic,
Do you approve or disapprove of the tax law passed by Donald Trump and Congress in 2017 that went into effect in 2018?
29% approve 60 disapprove 11 don’t know
So far, do you think the overall effect of this 2017 tax law on you and your family is mostly positive, mostly negative, or it does not affect you much either way?
14% mostly positive 38 mostly negative 41 not much of an effect 7 don’t know
PPIC STATEWIDE SURVEY MARCH 2019
PPIC.ORG/SURVEY Californians and Their Government 27
Changing topics,
Do you think that Donald Trump should or should not have declared a national emergency in order to build a wall along the border with Mexico?
21% should have 77 should not have 2 don’t know
Do you think the federal crackdown on undocumented immigrants is a good thing for the country or a bad thing for the country?
41% good thing 48 bad thing 4 mixed (volunteered) – neither (volunteered) 6 don’t know
Do you favor or oppose the California state and local governments making their own policies and taking actions, separate from the federal government, to protect the legal rights of undocumented immigrants?
61% favor 34 oppose 4 don’t know
On another topic,
As you may know, a health reform bill was signed into law in 2010, known commonly as the Affordable Care Act or Obamacare. Given what you know about the health reform law, do you have a [rotate] [1] generally favorable [or] [2] generally unfavorable opinion of it?
56% generally favorable 36 generally unfavorable 7 don’t know
As you may know, as part of the 2010 health care law the government has set up health insurance exchanges around the country that people can use to compare plans and purchase health insurance. Just your impression, how well has California’s health insurance exchange called “Covered California” been working—very well, fairly well, not too well, or not at all well?
18% very well 42 fairly well 16 not too well 12 not at all well 12 don’t know
Governor Newsom’s budget proposal allocates $196 million to expand Medi-Cal coverage to low-income young adults ages 19 through 25 regardless of immigration status. Do you favor or oppose this proposal?
64% favor 32 oppose 3 don’t know
Changing topics,
32a. [asked starting March 13] Which of the following statements do you agree with more? [rotate] (1) The penalty for first-degree murder should be the death penalty; [or] (2) the penalty for first degree murder should be life imprisonment with absolutely no possibility of parole.
31% death penalty 62 life imprisonment with no parole 7 don’t know
Next, some people are registered to vote and others are not. Are you absolutely certain that you are registered to vote in California?
68% yes [ask q33a] 32 no [skip to q34b]

PPIC STATEWIDE SURVEY MARCH 2019
PPIC.ORG/SURVEY Californians and Their Government 28
33a. Are you registered as a Democrat, a Republican, another party, or are you registered as a decline-to-state or independent voter?
43% Democrat [ask q34] 24 Republican [skip to q34a] 3 another party (specify) [skip to q35] 30 independent [skip to q34b]
Would you call yourself a strong Democrat or not a very strong Democrat?
60% strong 39 not very strong 1 don’t know
[skip to q35]
34a. Would you call yourself a strong Republican or not a very strong Republican?
56% strong 42 not very strong 2 don’t know
[skip to q35]
34b. Do you think of yourself as closer to the Republican Party or Democratic Party?
19% Republican Party 46 Democratic Party 26 neither (volunteered) 9 don’t know
Next, would you consider yourself to be politically:
[read list, rotate order top to bottom]
16% very liberal 19 somewhat liberal 31 middle-of-the-road 21 somewhat conservative 9 very conservative 3 don’t know
Generally speaking, how much interest would you say you have in politics—a great deal, a fair amount, only a little, or none?
26% great deal 35 fair amount 30 only a little 8 none 1 don’t know
[d1-d15 demographic questions]
PPIC STATEWIDE SURVEY ADVISORY COMMITTEE
Ruben Barrales Senior Vice President, External Relations Wells Fargo
Angela Glover Blackwell Founder in Residence PolicyLink
Mollyann Brodie Senior Vice President Henry J. Kaiser Family Foundation
Bruce E. Cain Director Bill Lane Center for the American West Stanford University
Jon Cohen Chief Research Officer SurveyMonkey
Joshua J. Dyck Co-Director Center for Public Opinion University of Massachusetts, Lowell
Lisa García Bedolla Director Institute of Governmental Studies University of California, Berkeley
Russell Hancock President and CEO Joint Venture Silicon Valley
Sherry Bebitch Jeffe Professor Sol Price School of Public Policy University of Southern California
Robert Lapsley President California Business Roundtable
Carol S. Larson President and CEO The David and Lucile Packard Foundation
Donna Lucas Chief Executive Officer Lucas Public Affairs
Sonja Petek Fiscal and Policy Analyst California Legislative Analyst’s Office
Lisa Pitney Vice President of Government Relations The Walt Disney Company
Robert K. Ross, MD President and CEO The California Endowment
Most Reverend Jaime Soto Bishop of Sacramento Roman Catholic Diocese of Sacramento
Carol Whiteside Principal California Strategies
The PPIC Statewide Survey Advisory Committee is a diverse group of experts who provide advice on survey issues. However, survey methods, questions, content, and timing are determined solely by PPIC.
PPIC BOARD OF DIRECTORS
Steven A. Merksamer, Chair Senior Partner Nielsen Merksamer Parrinello Gross & Leoni LLP
Mark Baldassare President and CEO Public Policy Institute of California
Ruben Barrales Senior Vice President, External Relations Wells Fargo
María Blanco Executive Director University of California Immigrant Legal Services Center
Louise Henry Bryson Chair Emerita, Board of Trustees J. Paul Getty Trust
A. Marisa Chun Partner McDermott Will & Emery LLP
Chet Hewitt President and CEO Sierra Health Foundation
Phil Isenberg Former Chair Delta Stewardship Council
Donna Lucas Chief Executive Officer Lucas Public Affairs
Mas Masumoto Author and Farmer
Leon E. Panetta Chairman The Panetta Institute for Public Policy
Gerald L. Parsky Chairman Aurora Capital Group
Kim Polese Chairman ClearStreet, Inc.
Gaddi H. Vasquez Retired Senior Vice President, Government Affairs Edison International Southern California Edison

Public Policy Institute of California 500 Washington Street, Suite 600 San Francisco, CA 94111 T: 415.291.4400 F: 415.291.4401
PPIC.ORG
PPIC Sacramento Center Senator Office Building 1121 L Street, Suite 801 Sacramento, CA 95814 T: 916.440.1120 F: 916.440.1121
Related Documents